
The Effect of Adding V and Nb Microalloy Elements on the Bake Hardening Properties of ULC Steel before and after Annealing


Abstract
:1. Introduction
2. Materials and Methods
2.1. Casting and Homogenization
2.2. Hot/Cold Rolling
2.3. Annealing
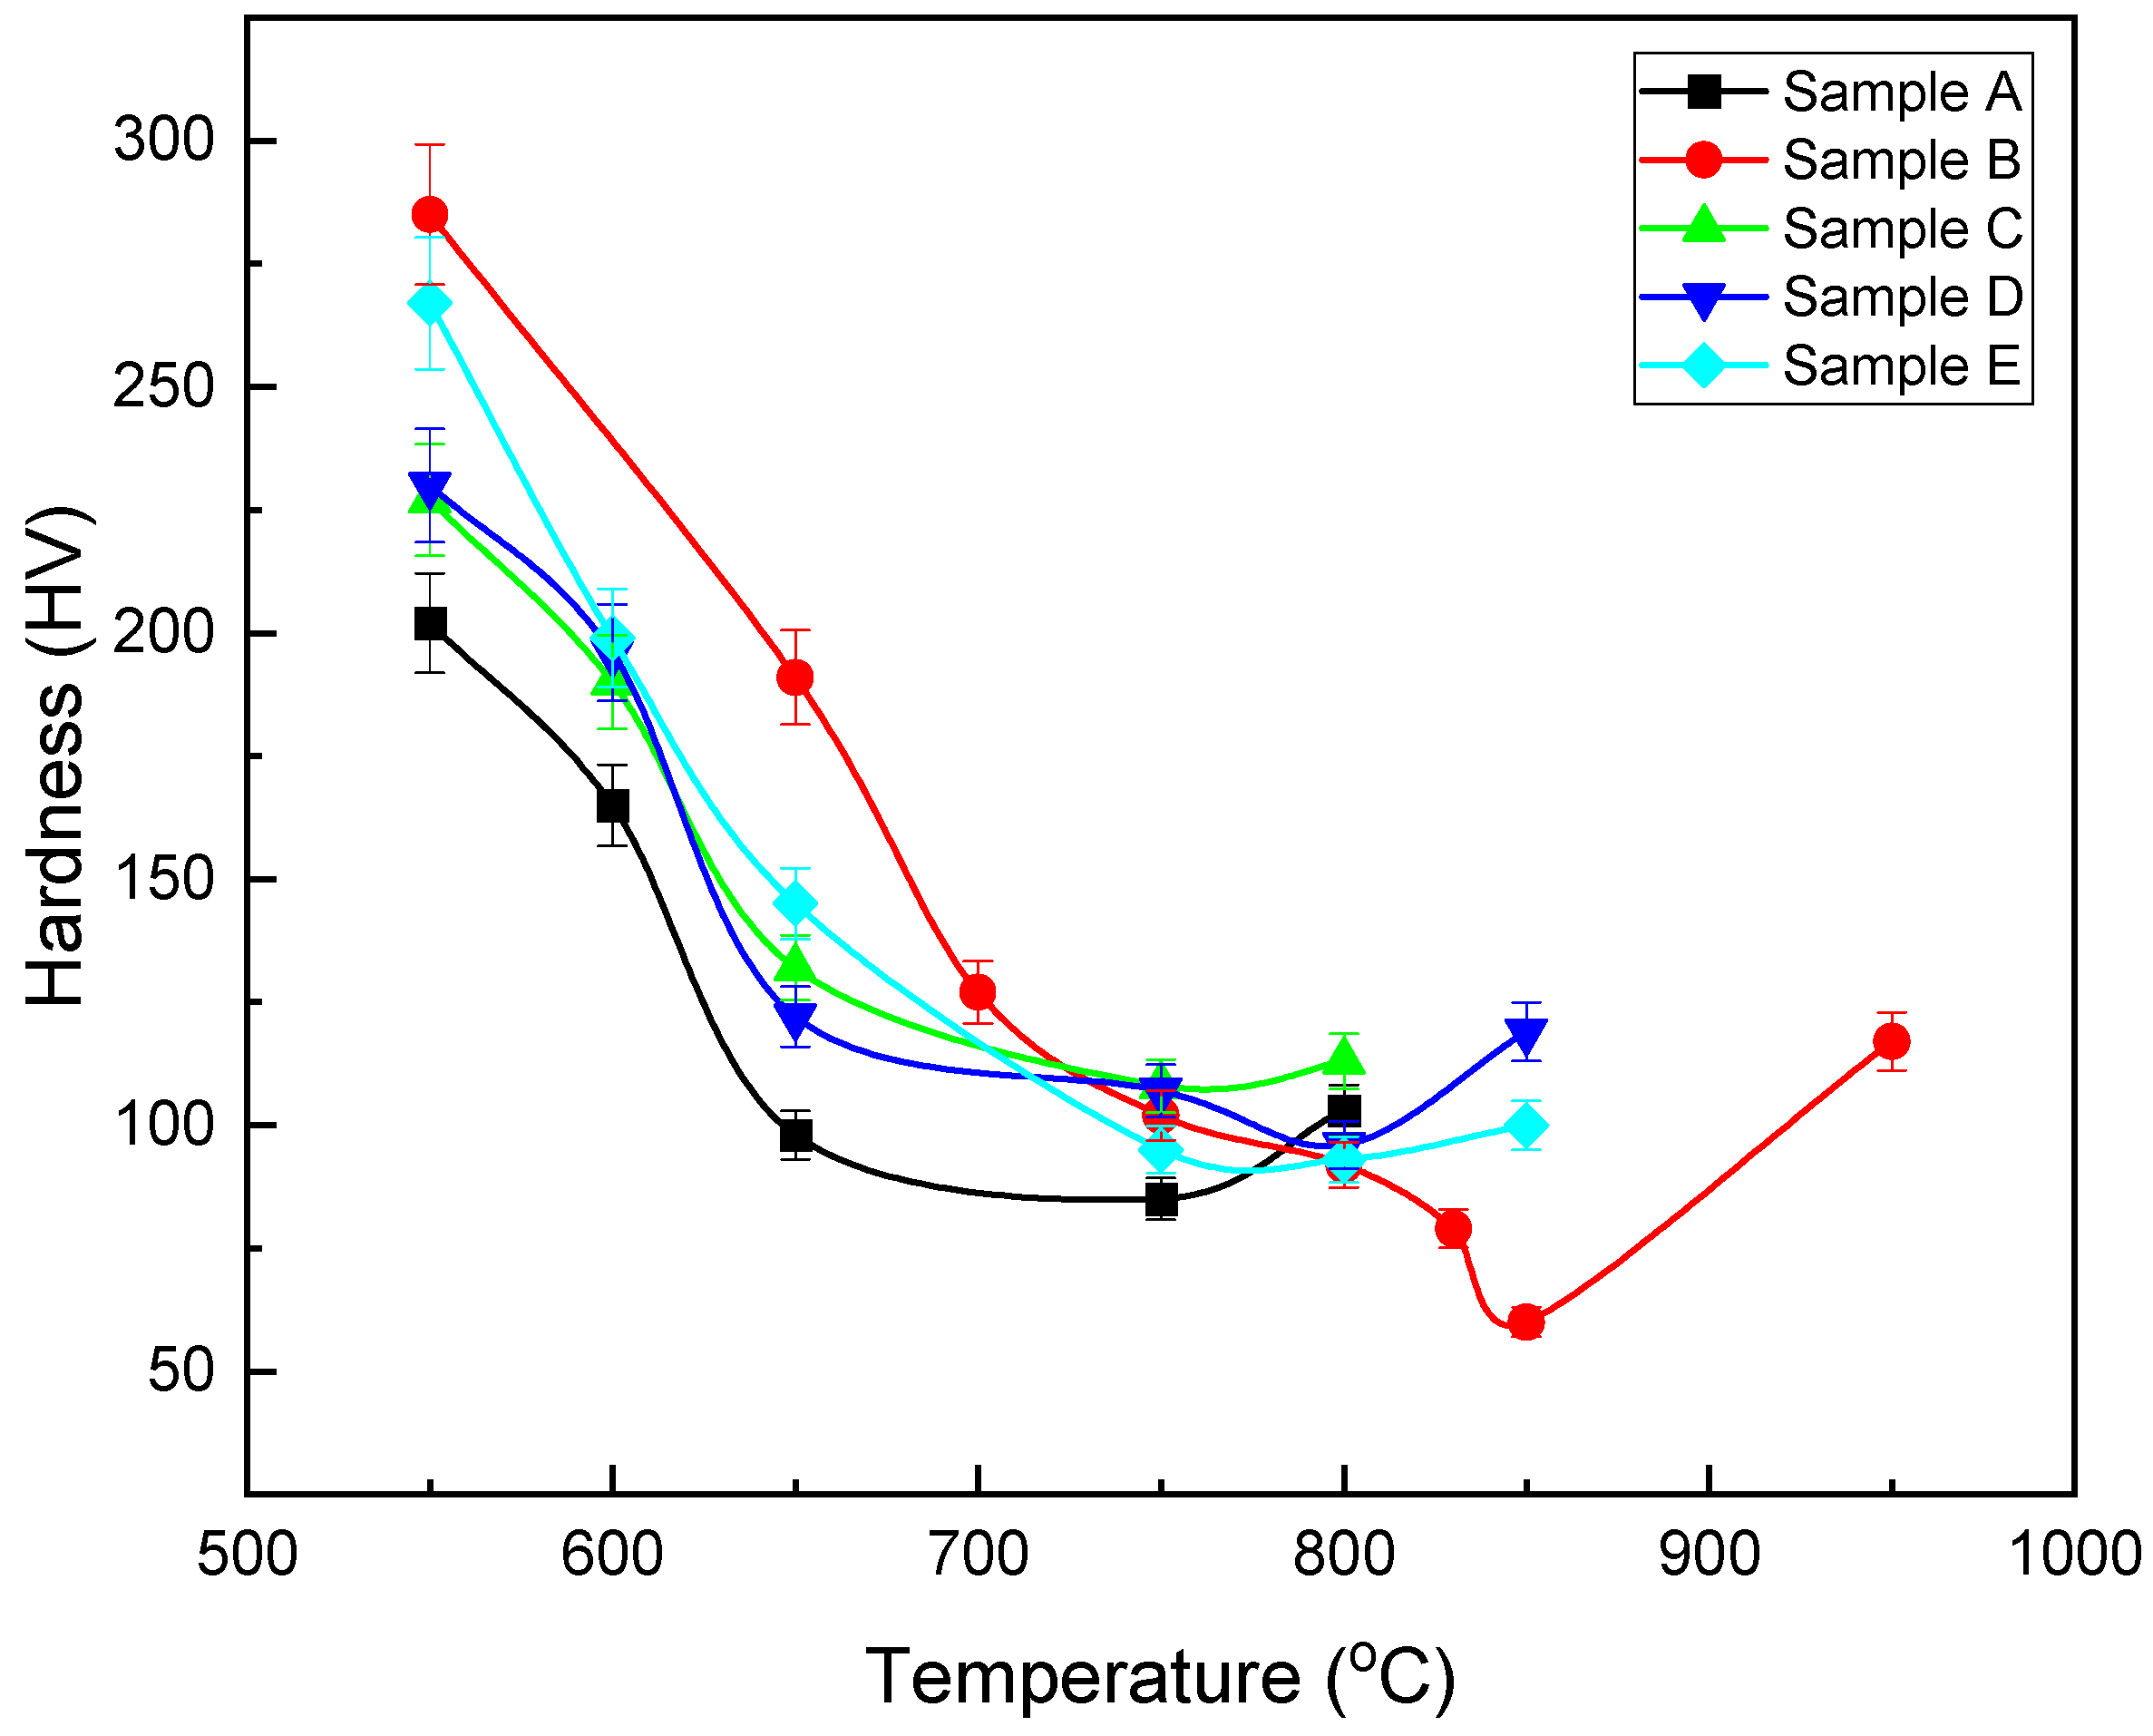
2.4. Hardness
2.5. Tensile
2.6. Bake Hardening
2.7. Characterizations
3. Results and Discussion
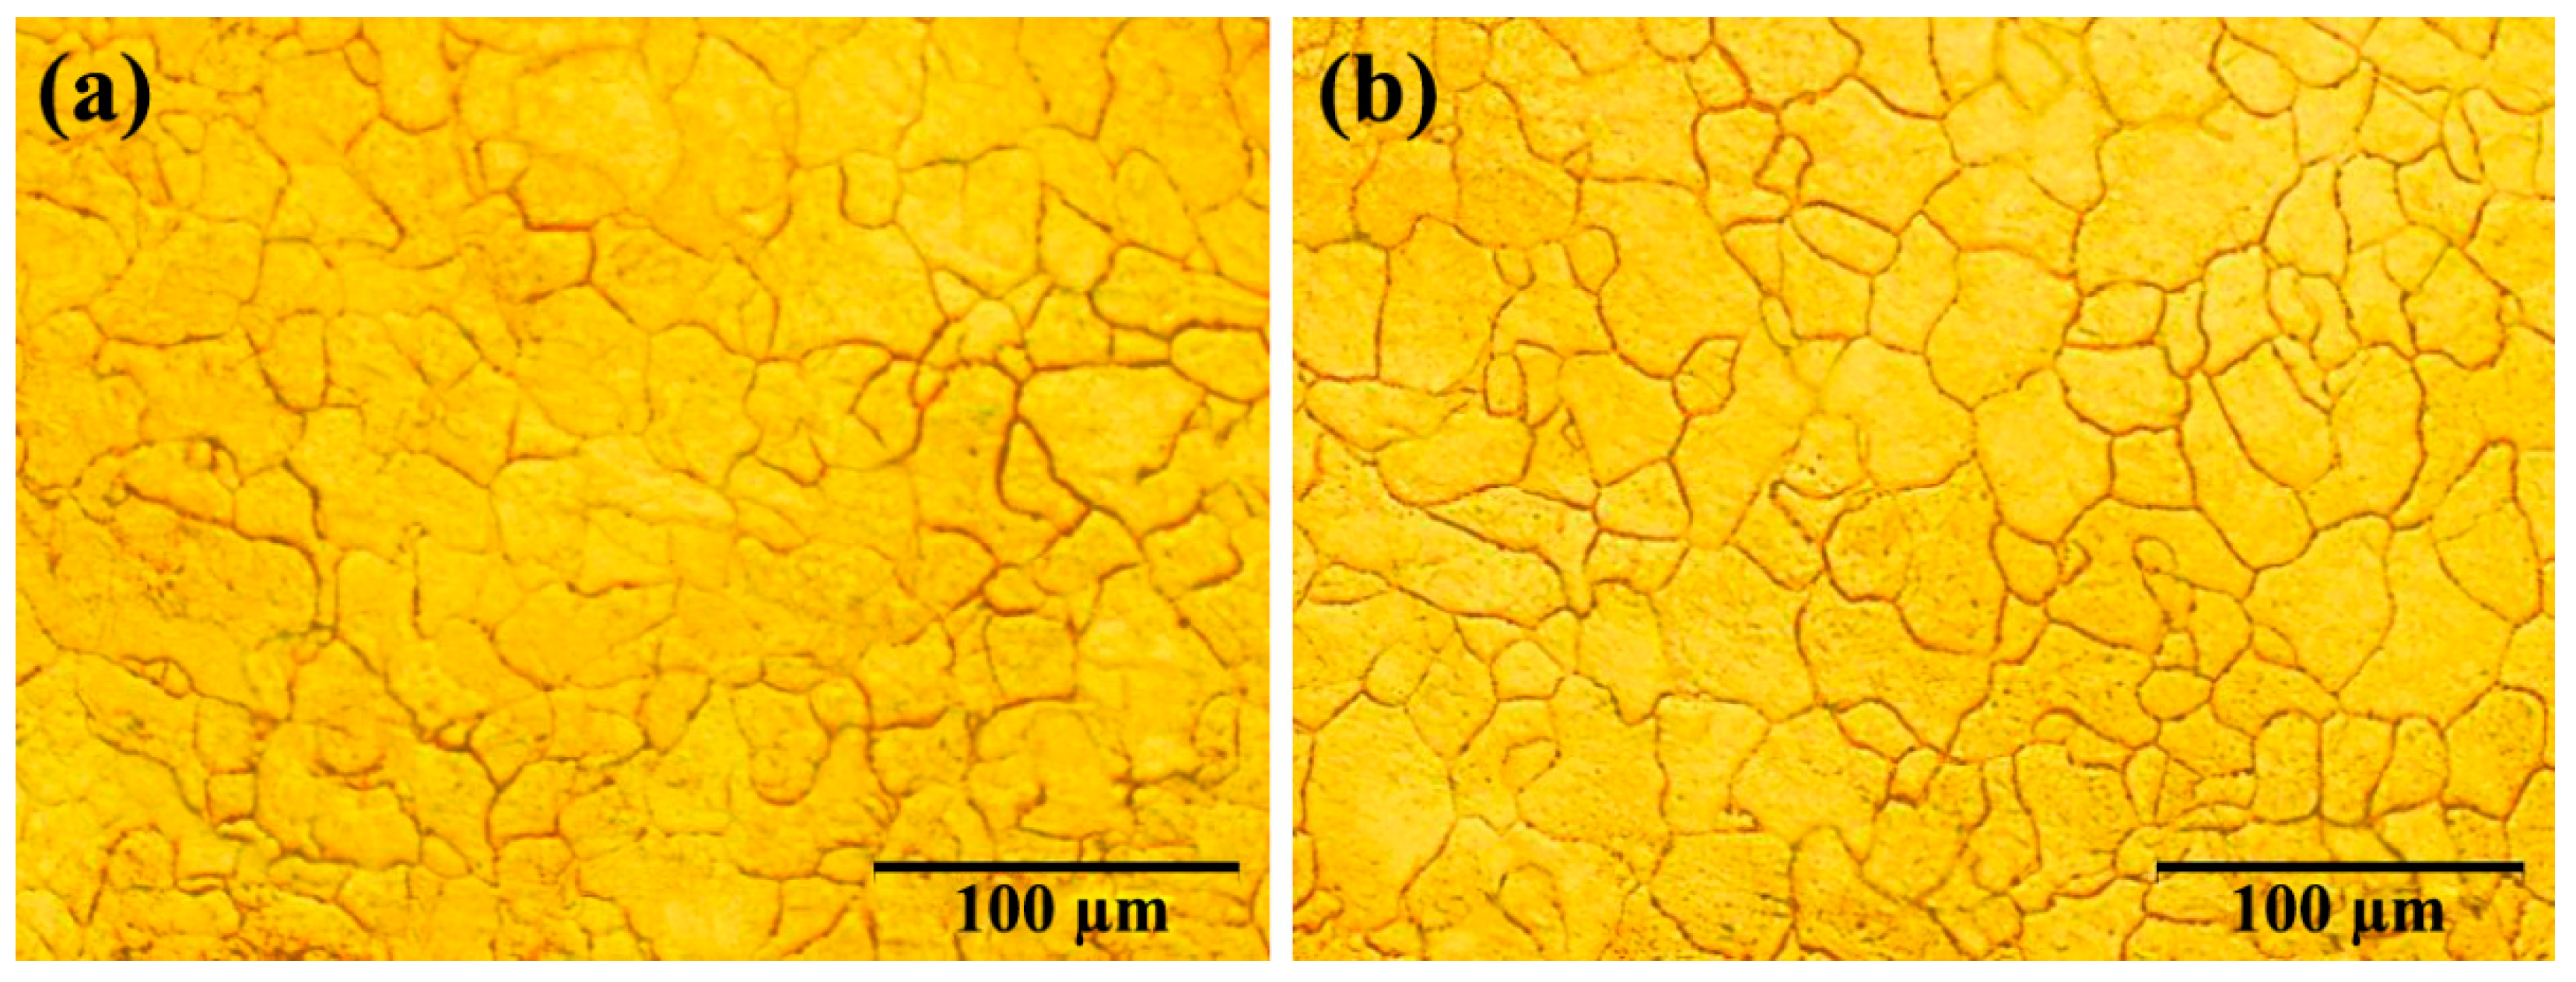
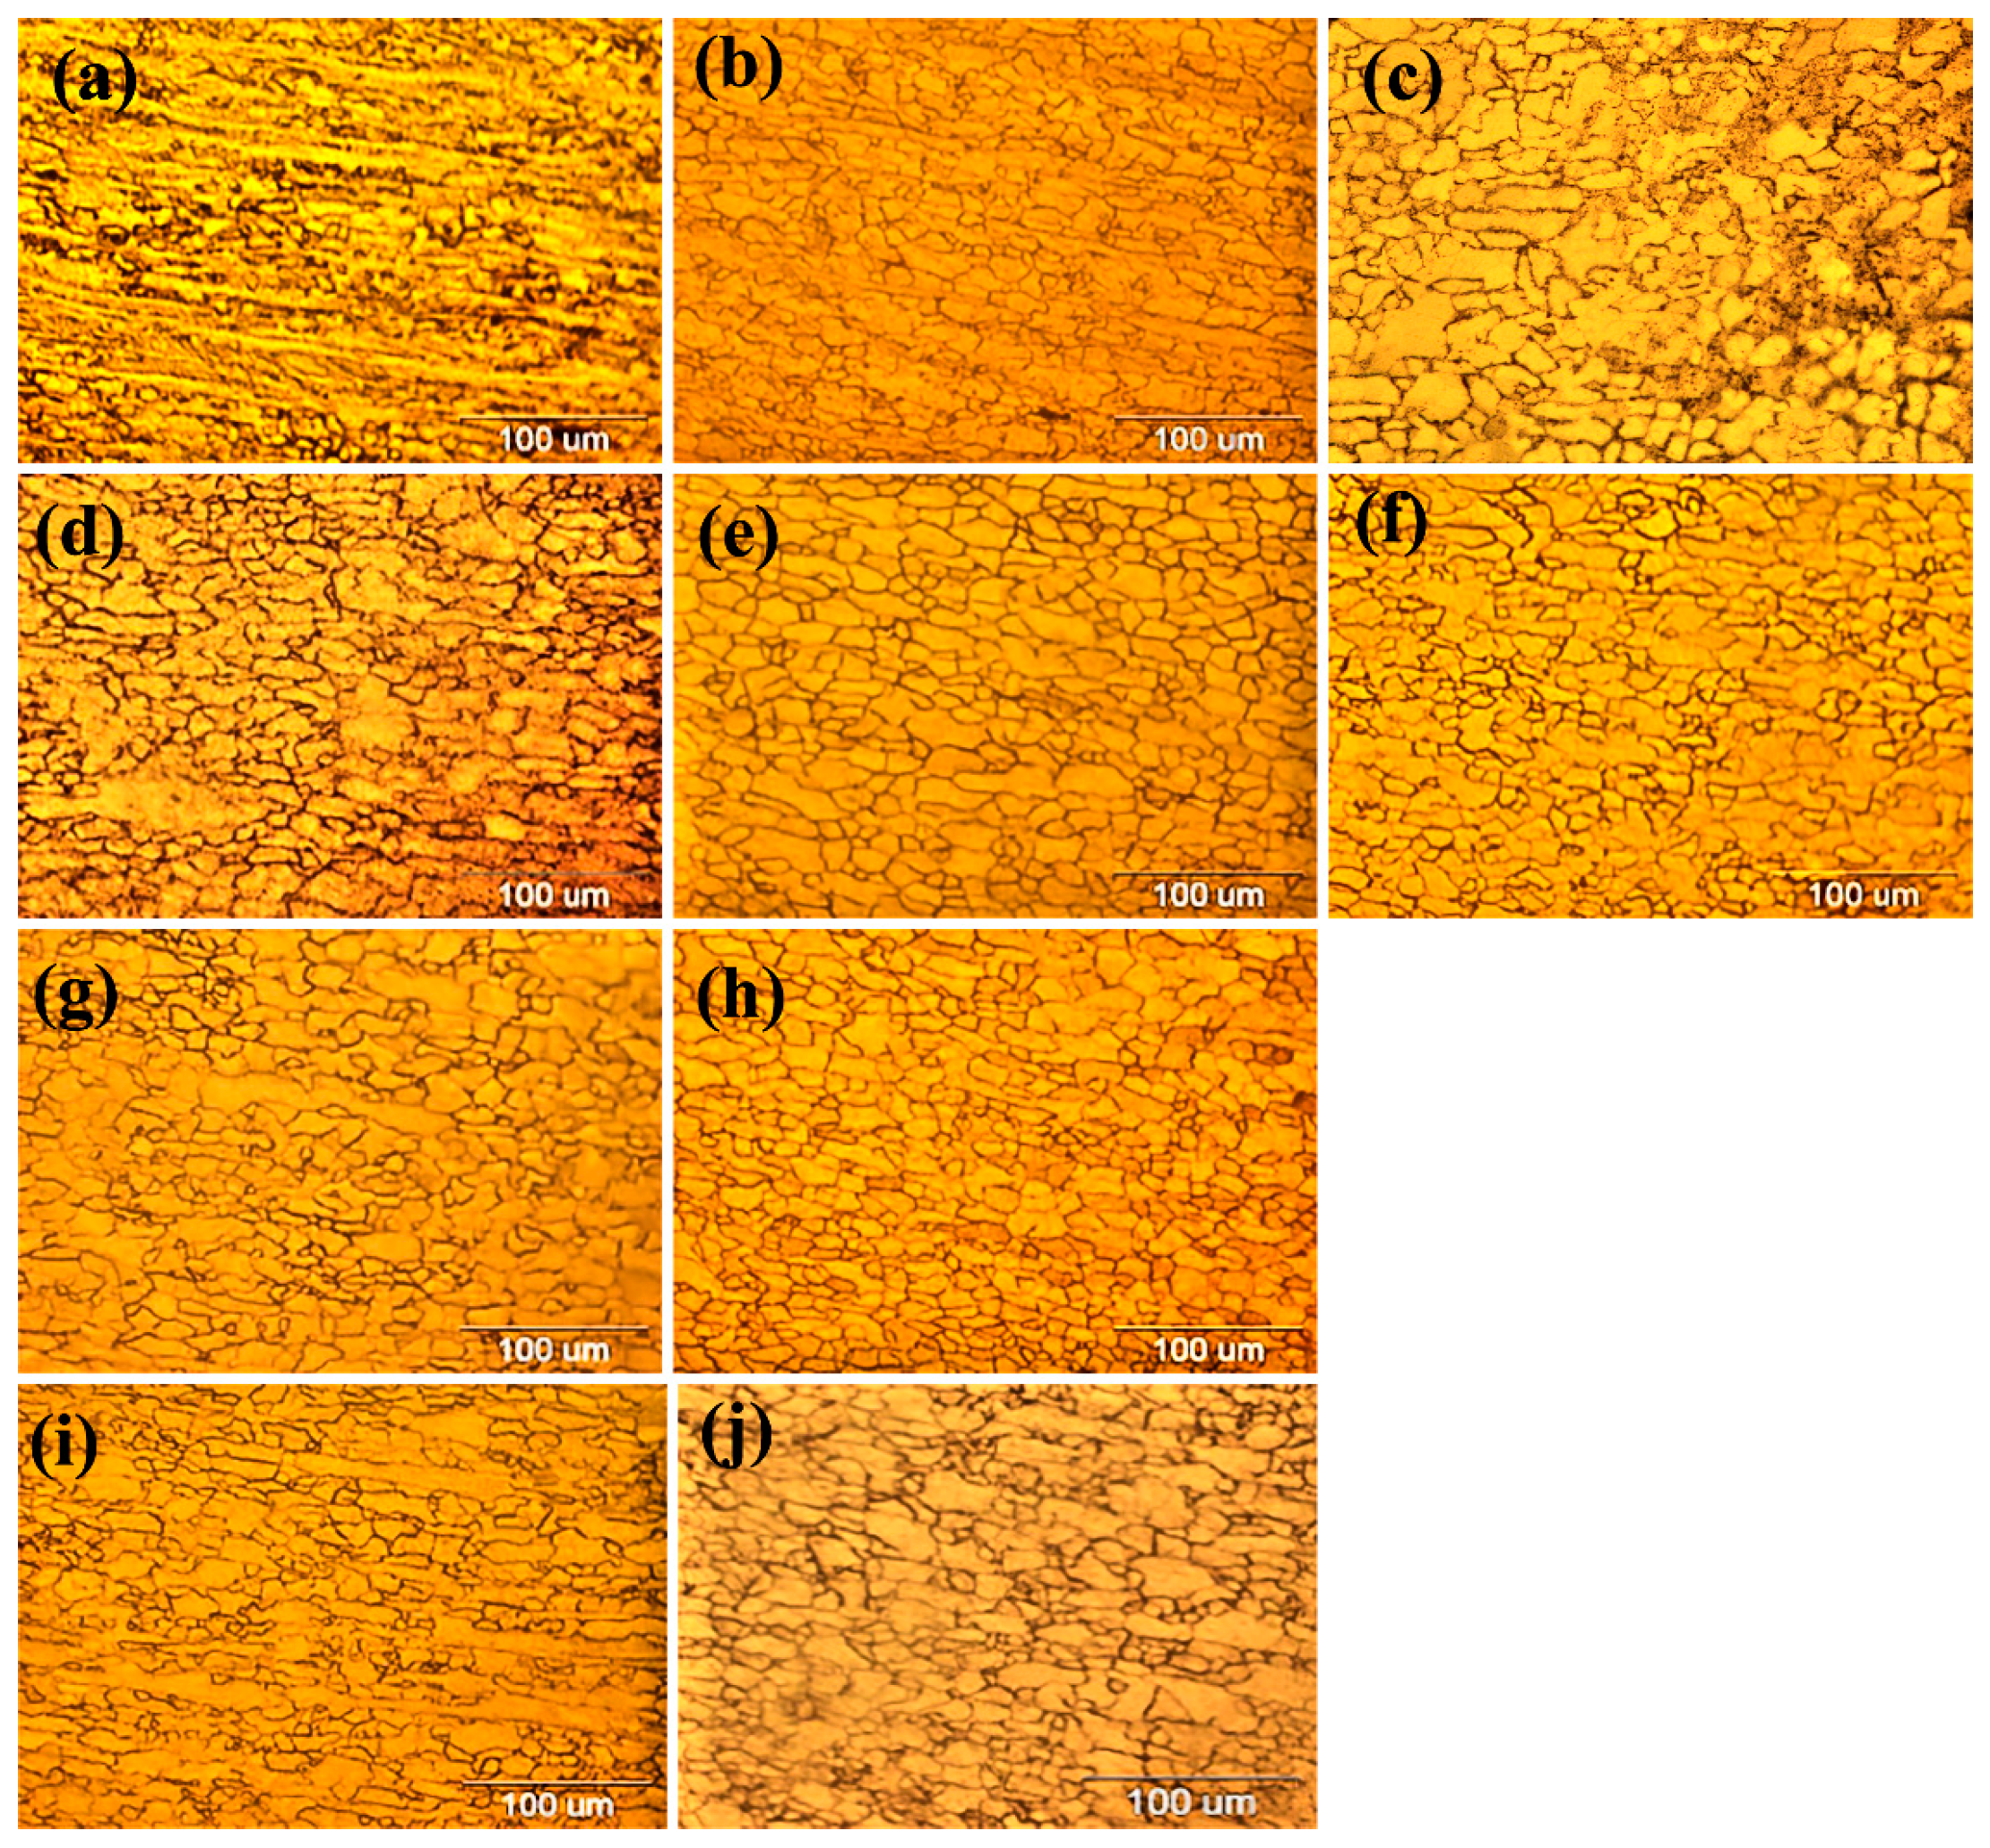
3.1. Microstructure of Samples after Hot Rolling
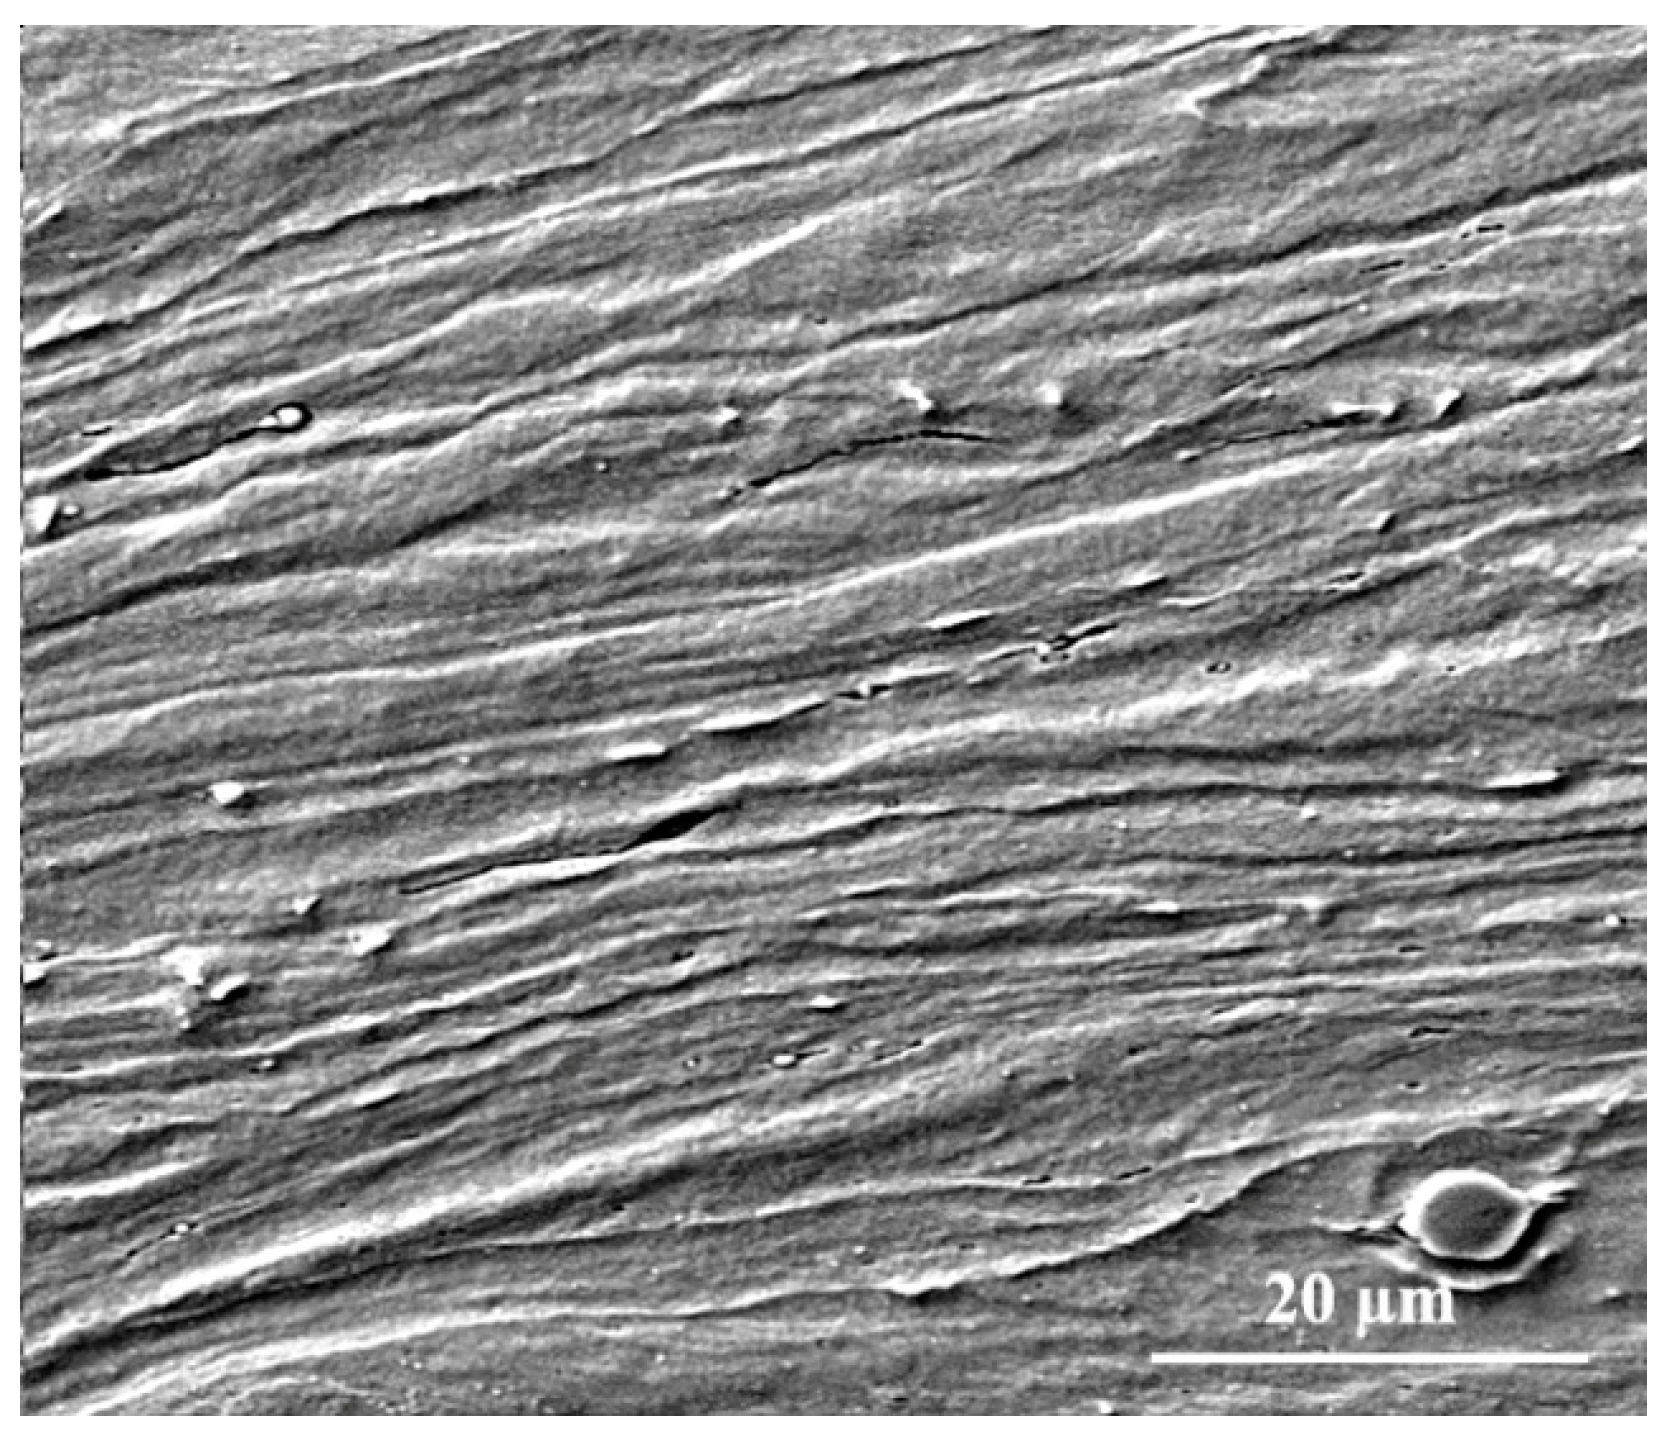
3.2. Microstructure of Samples after Cold Rolling
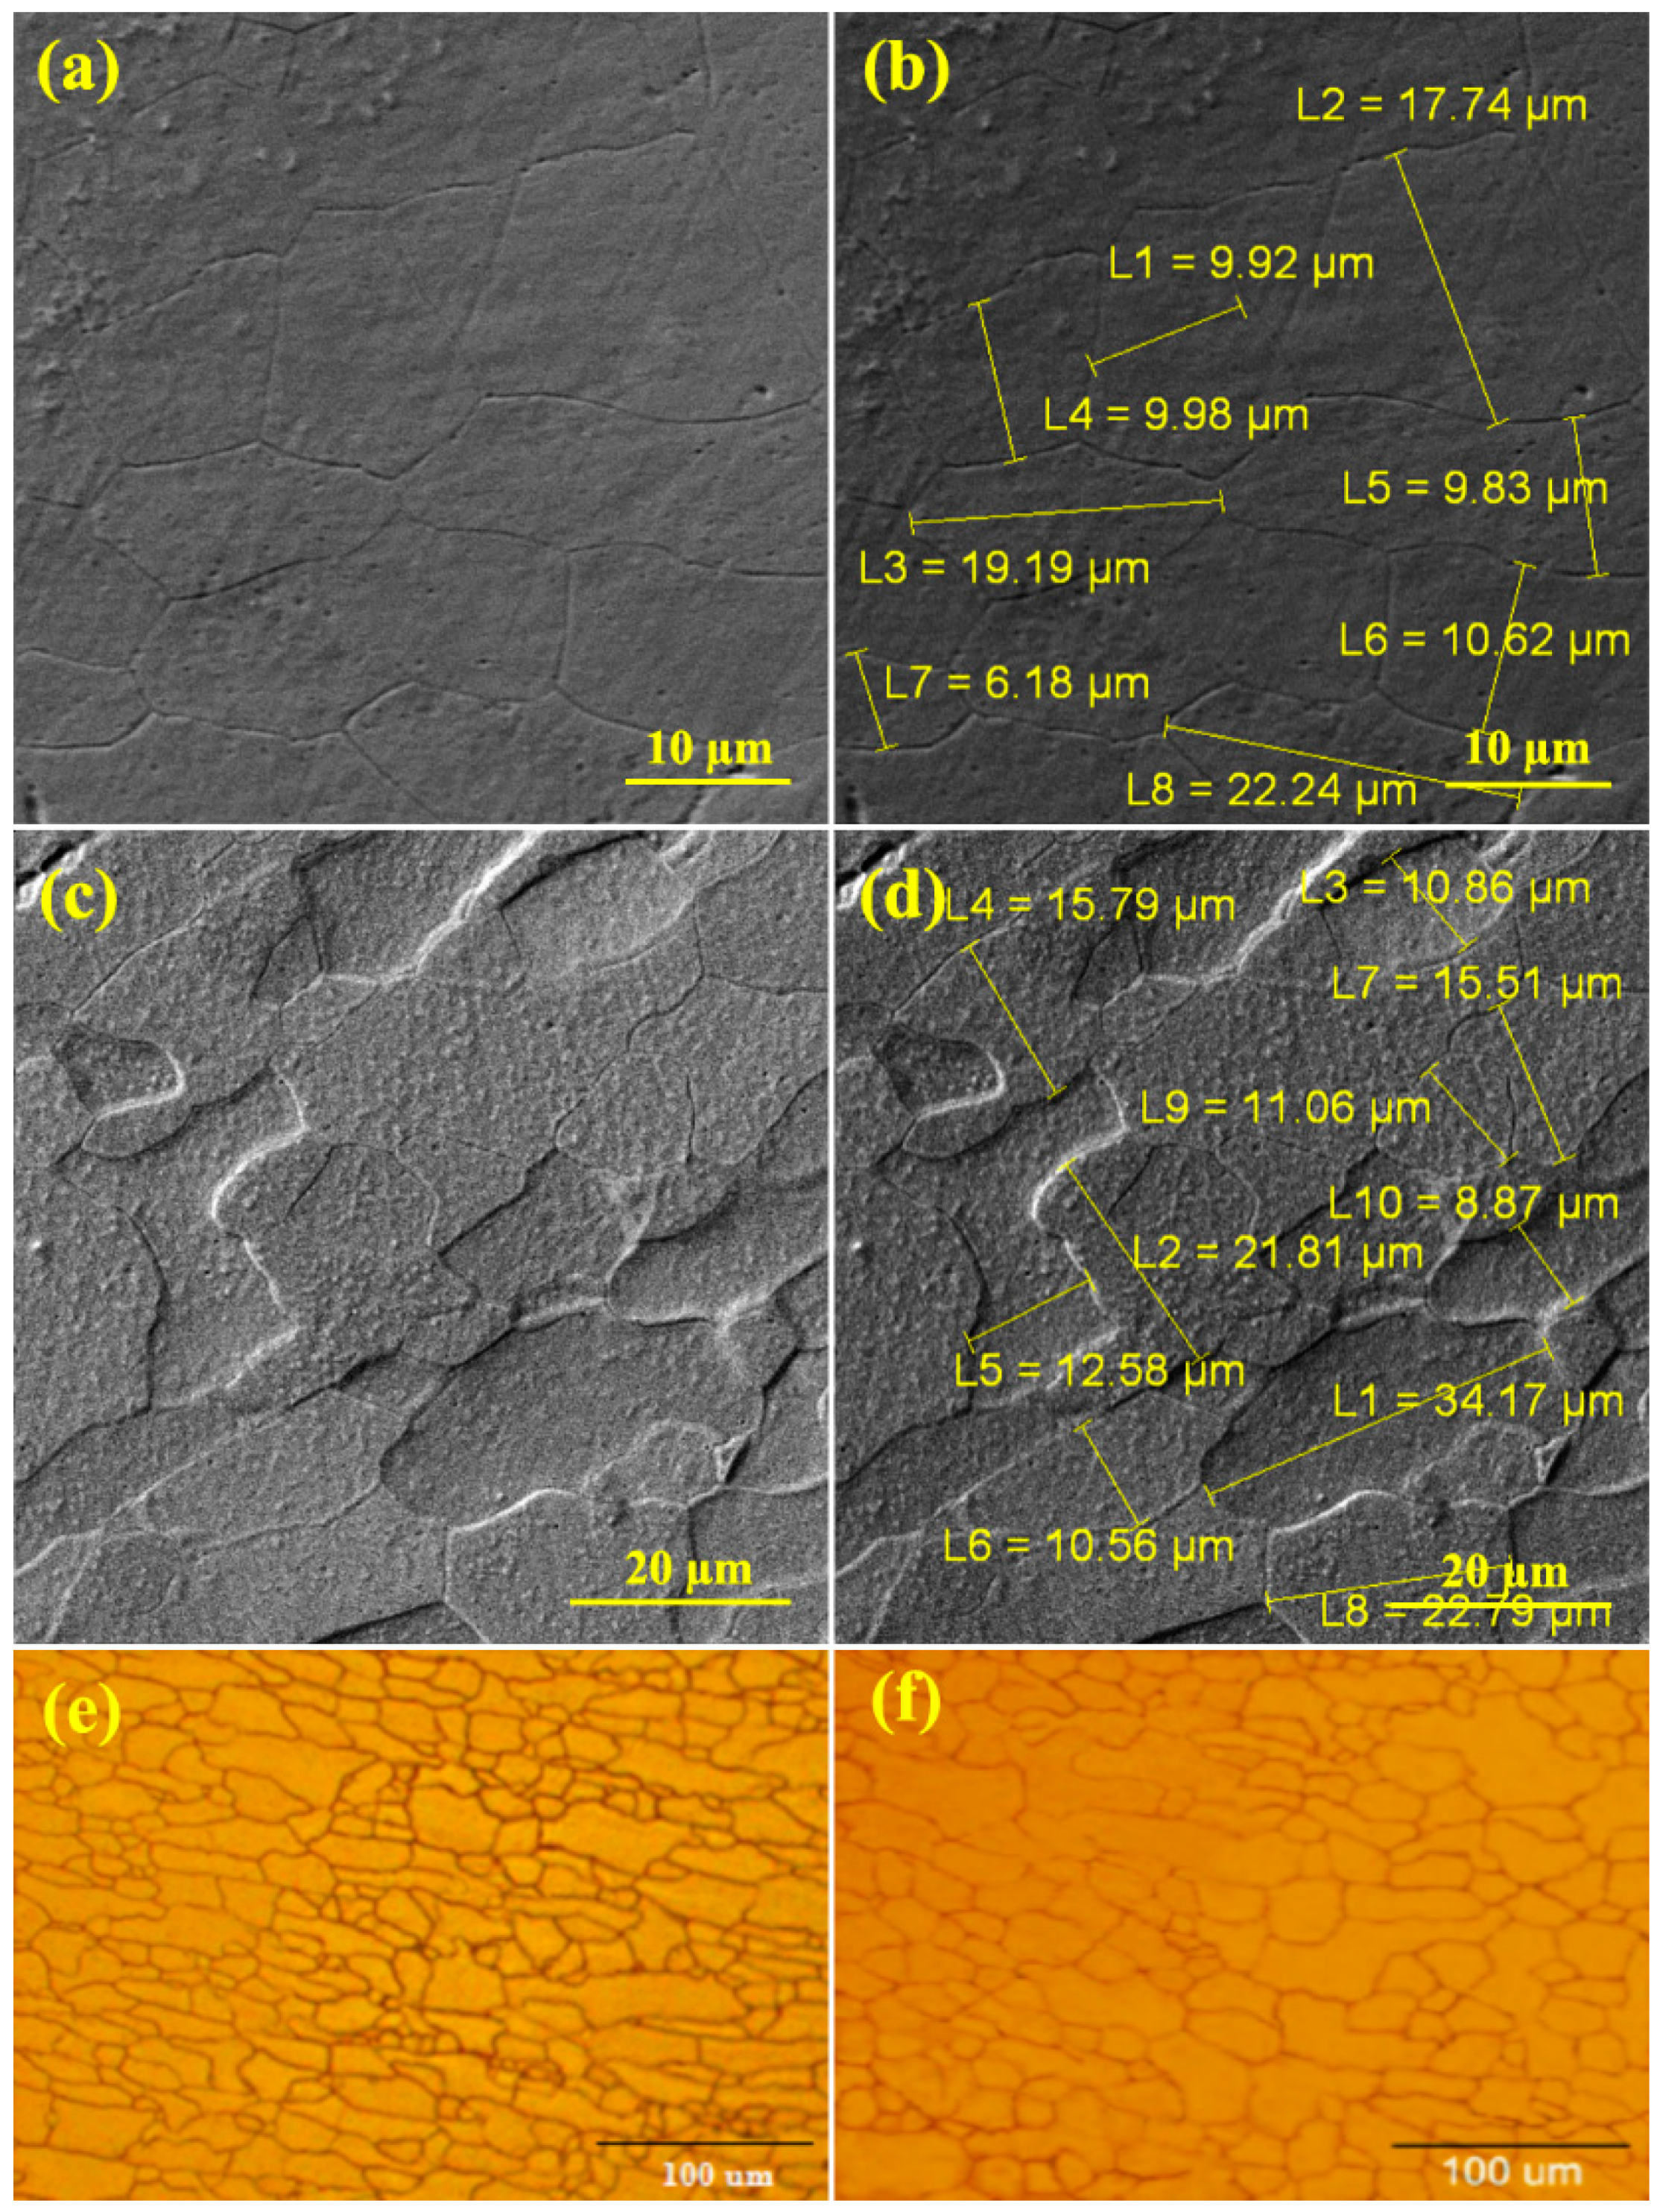
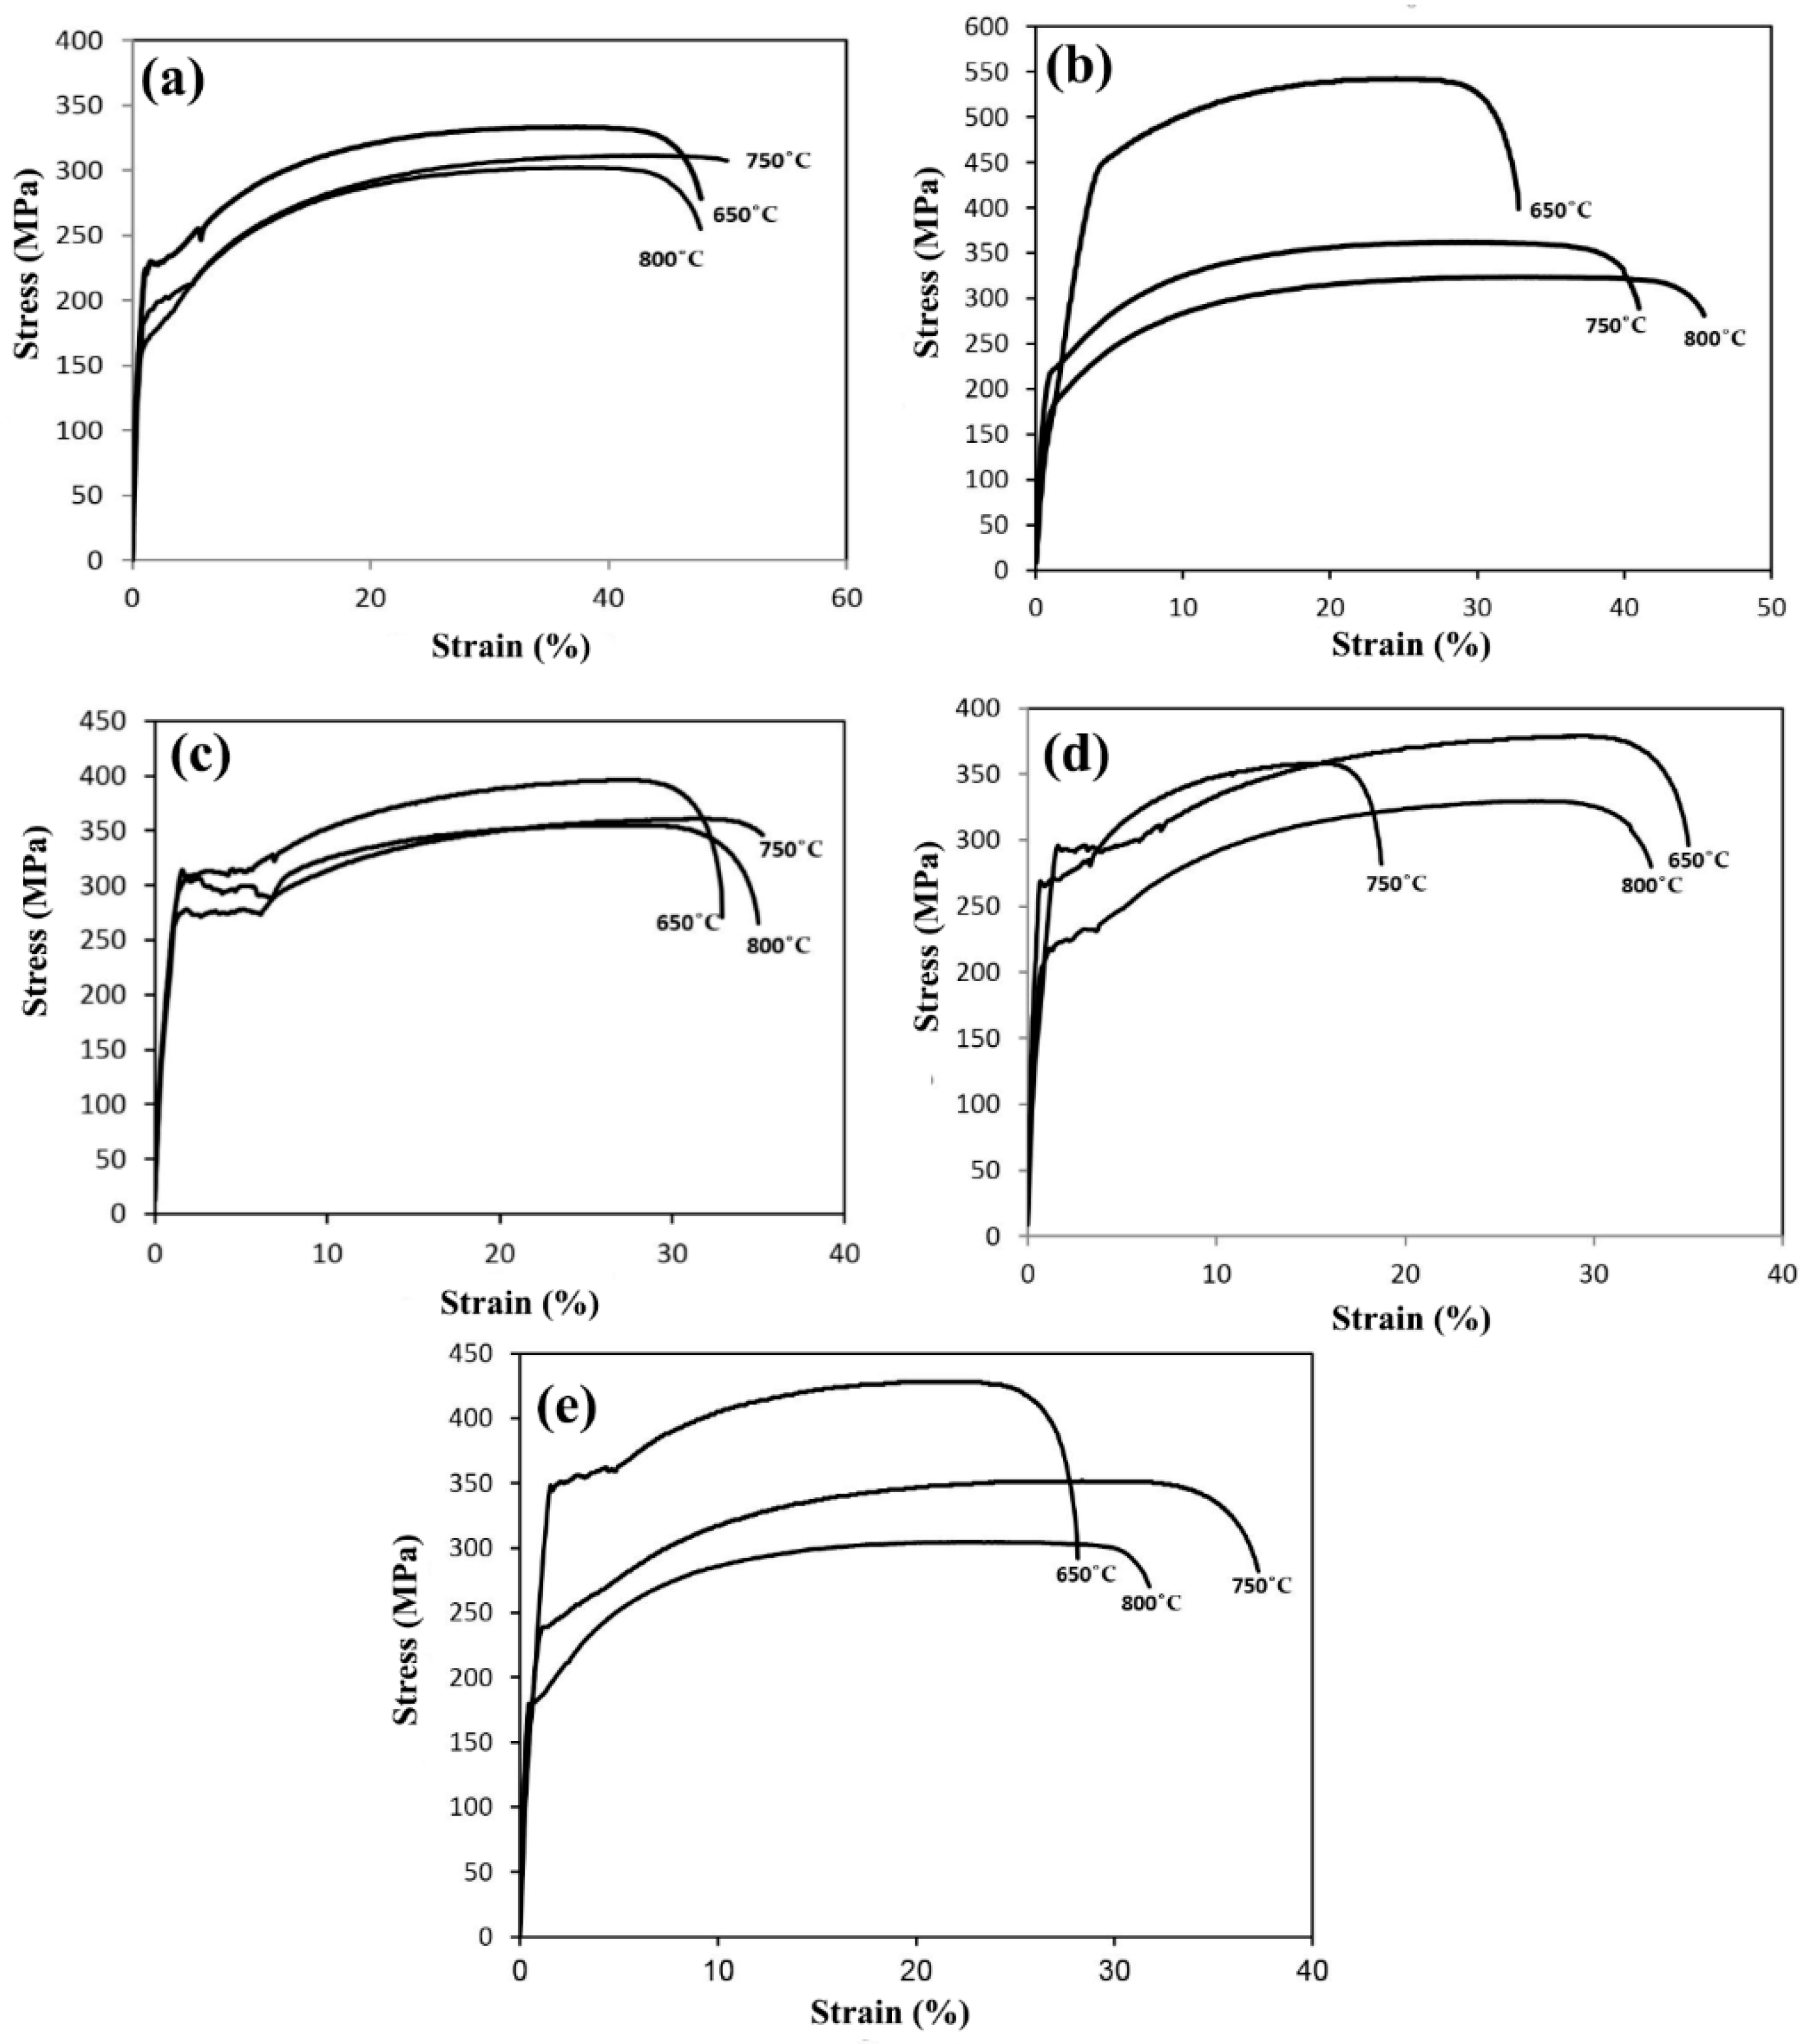
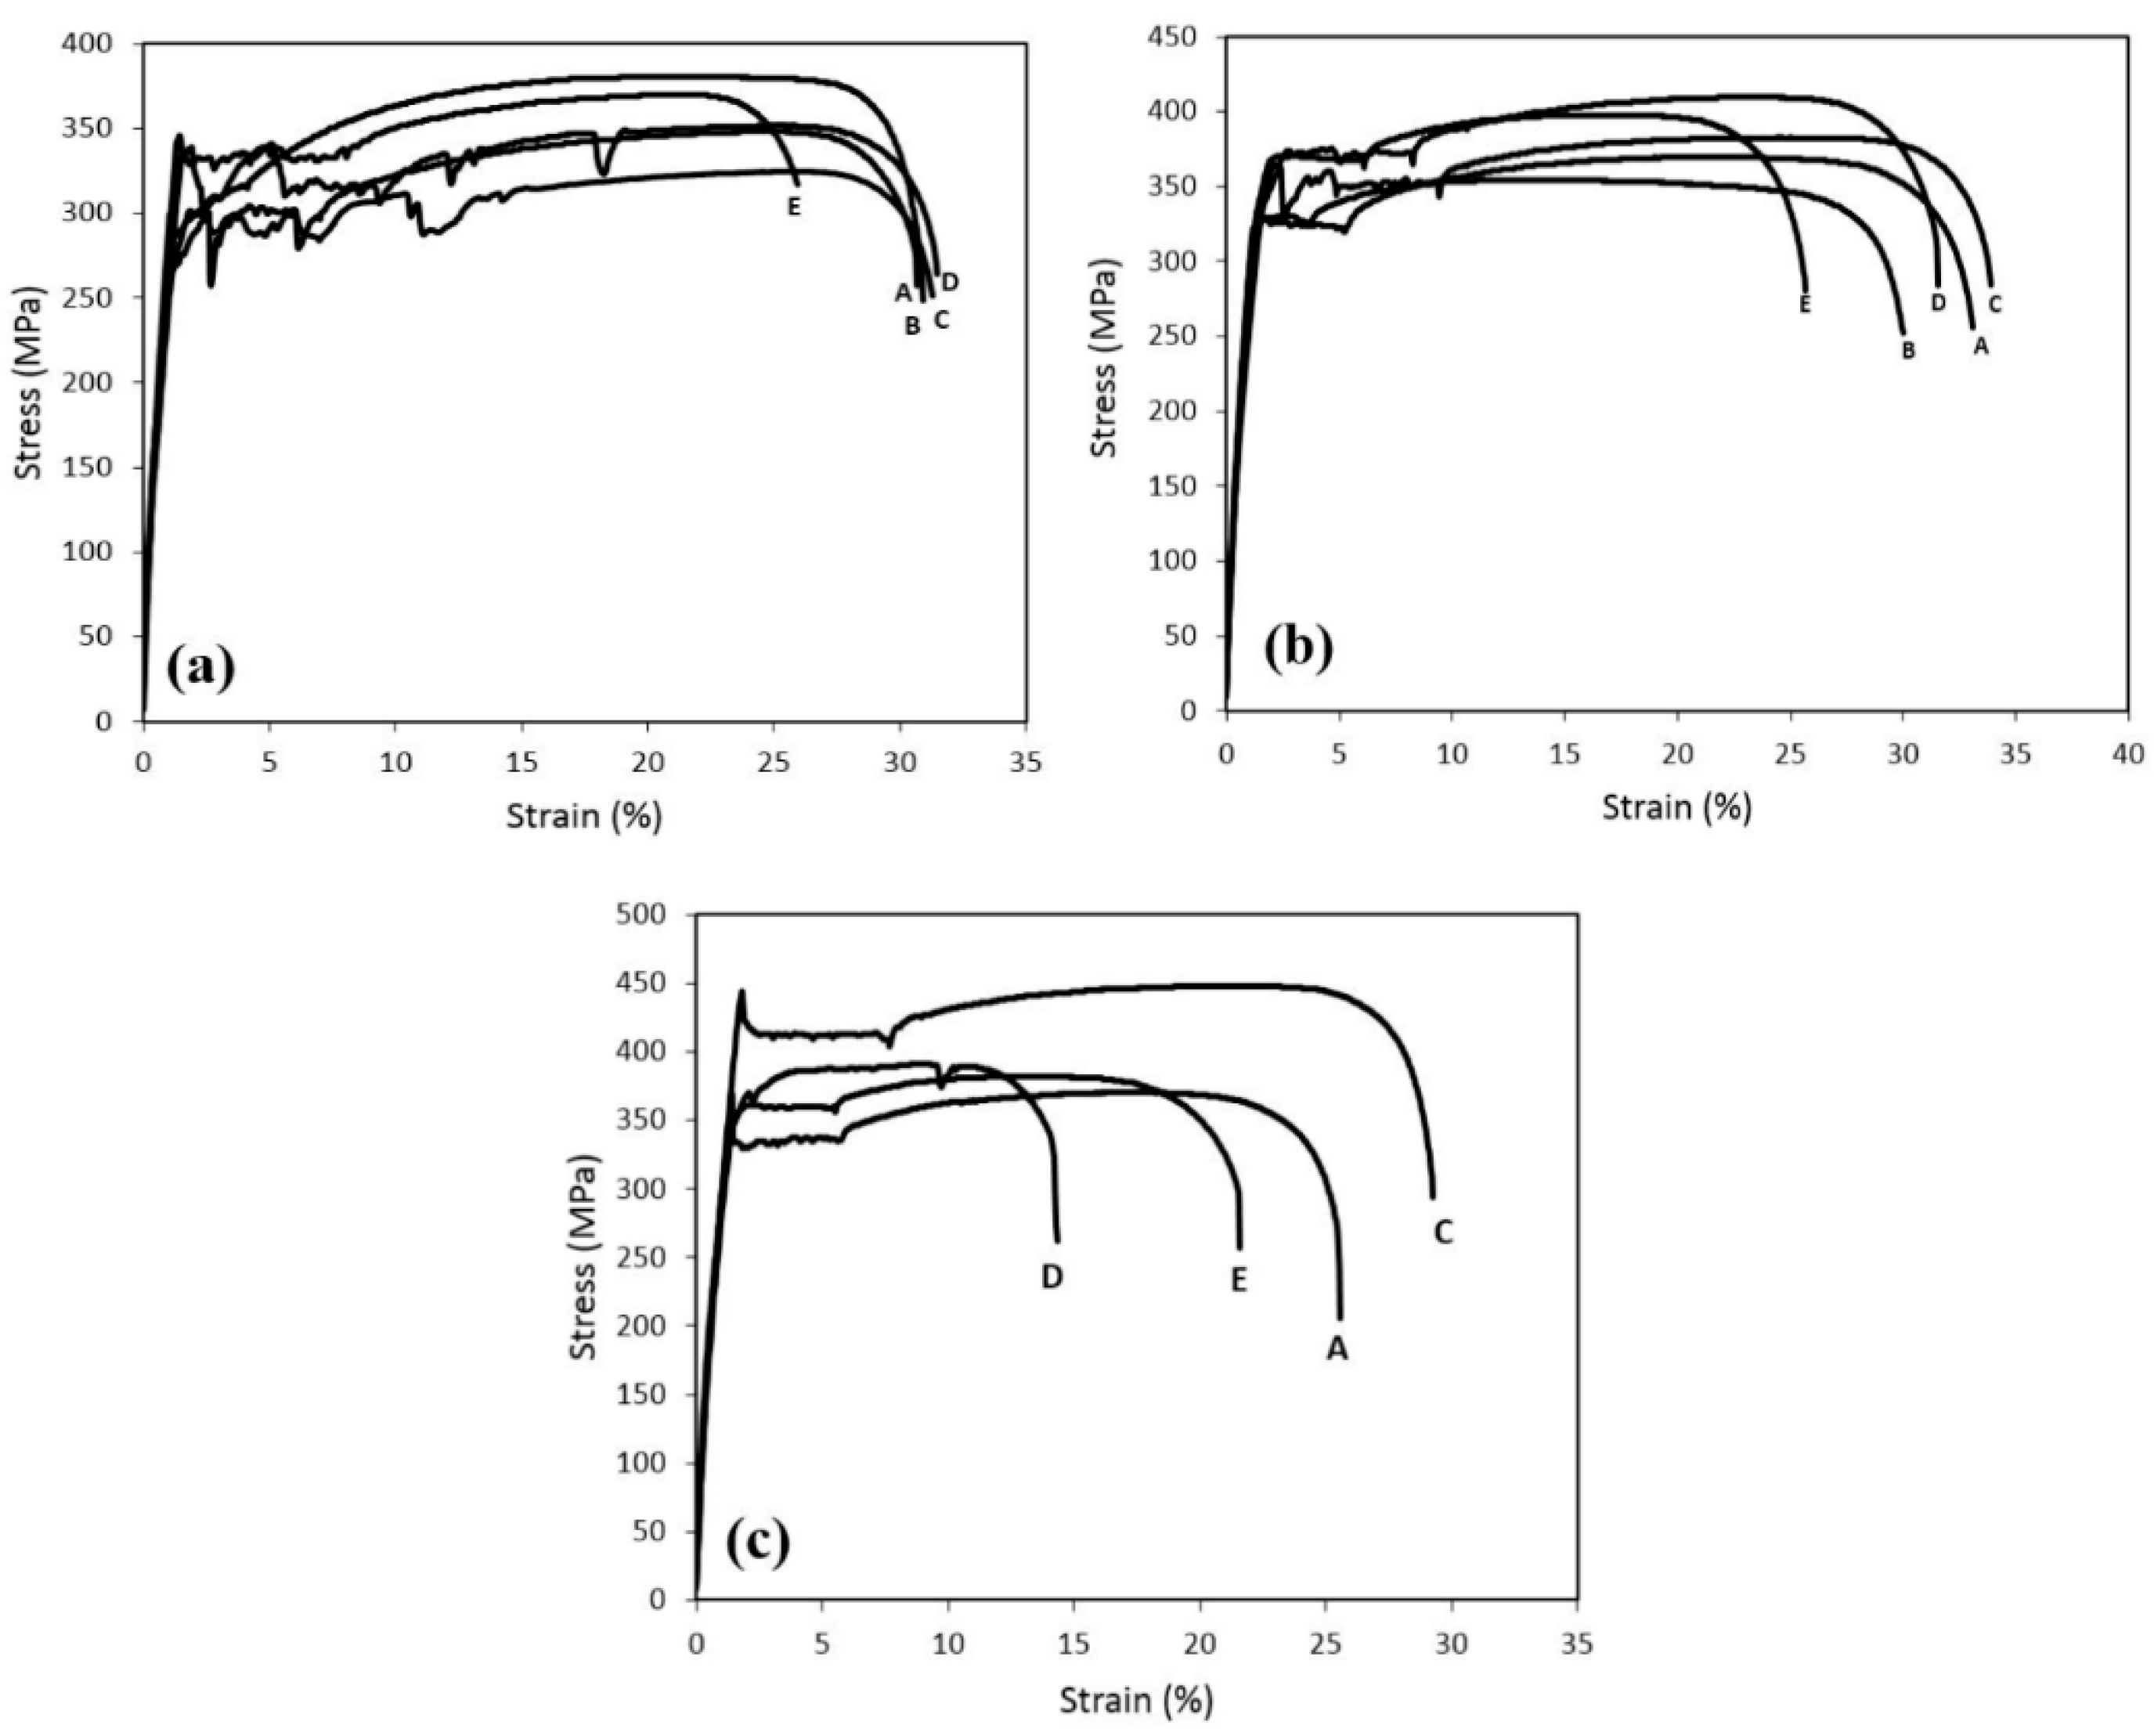
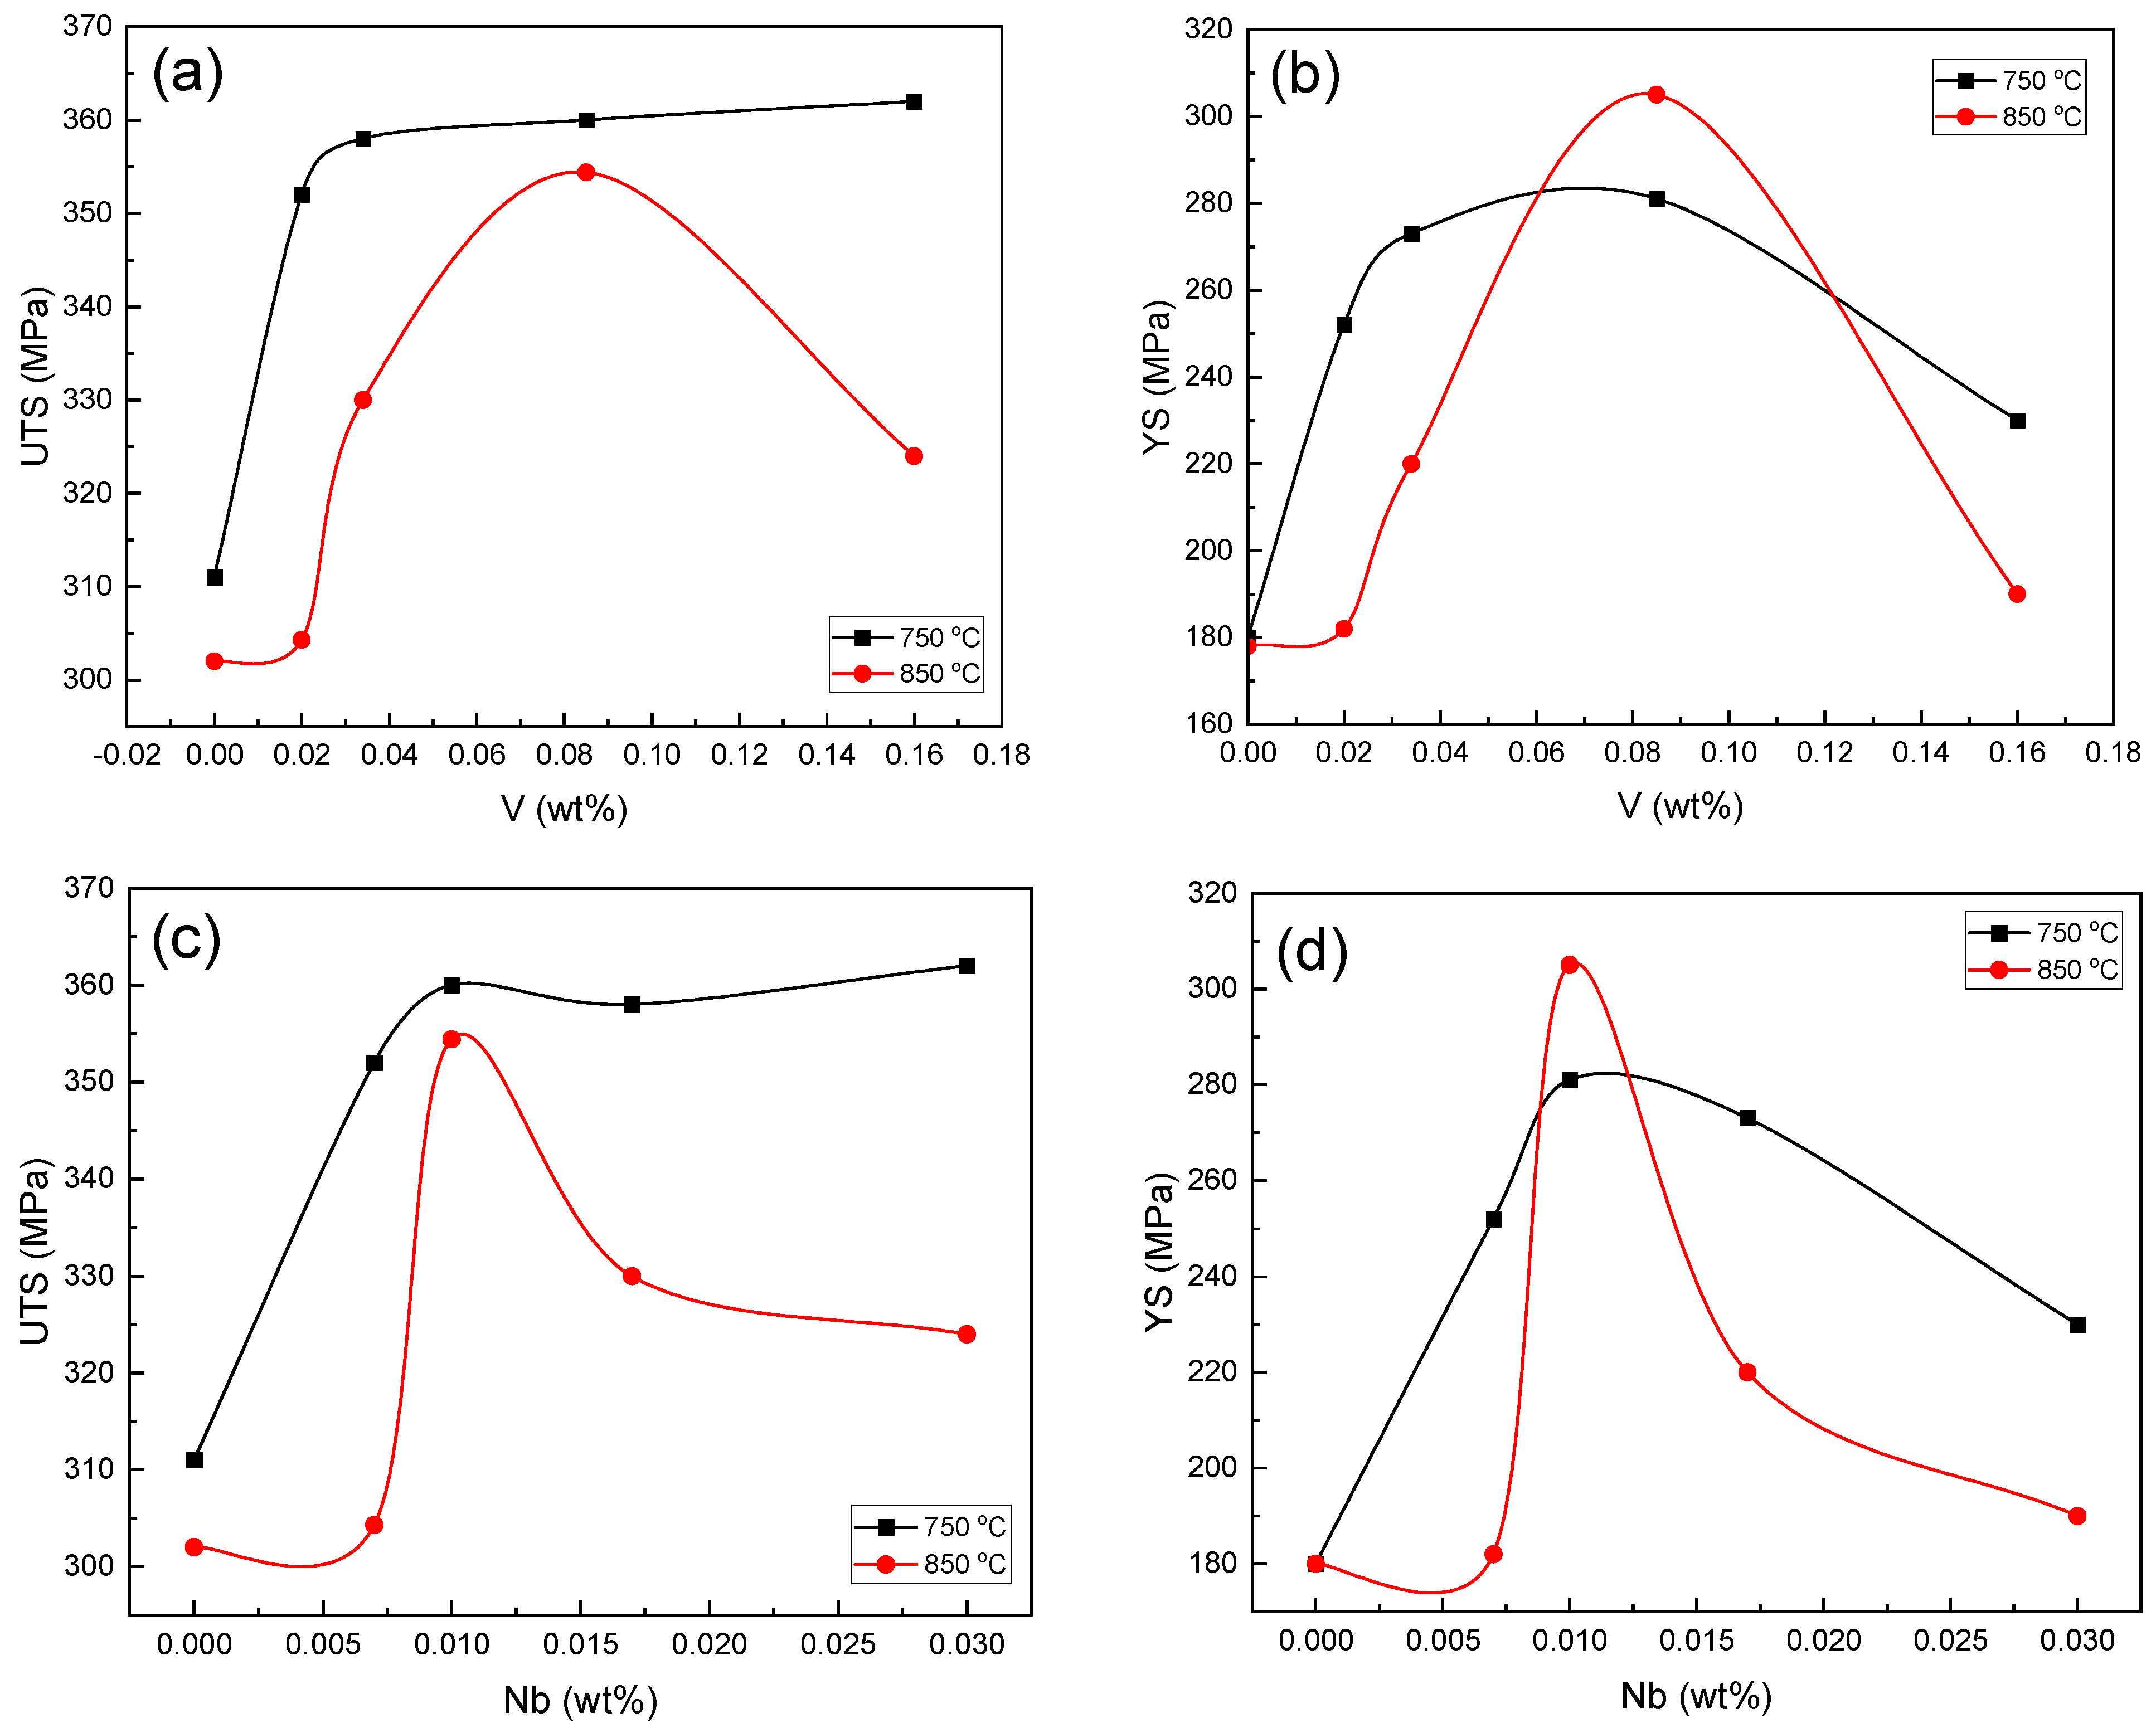
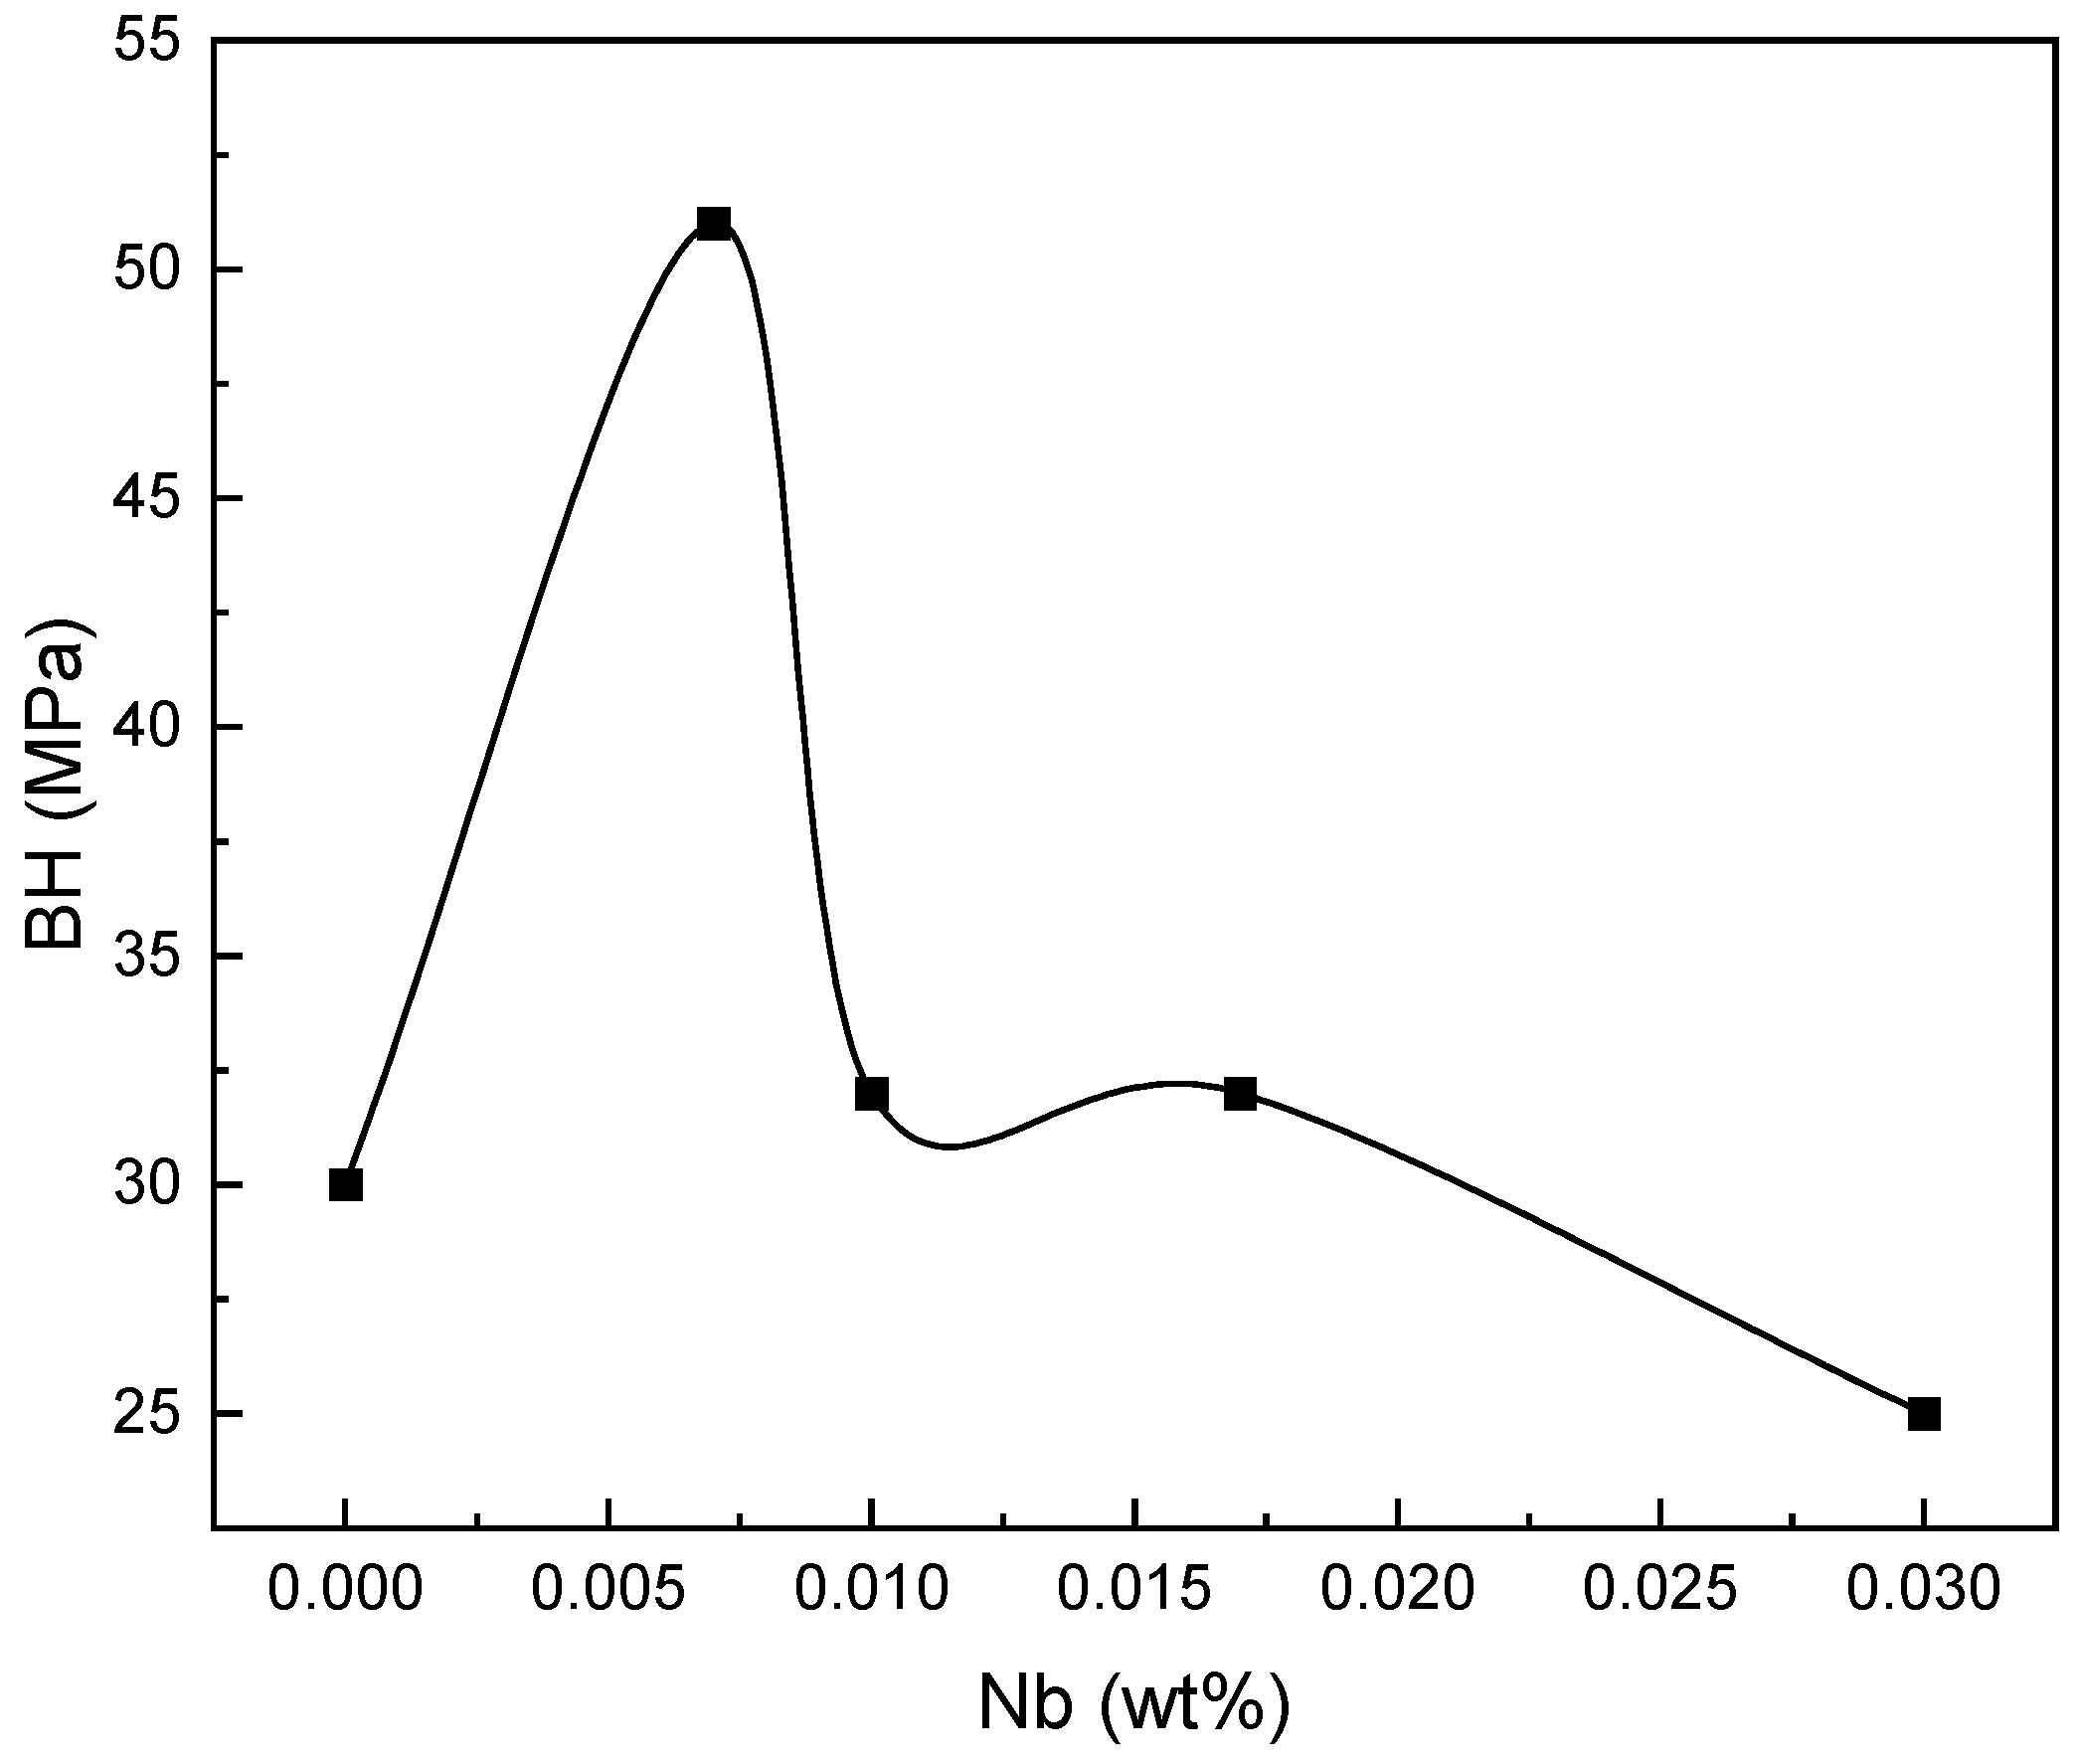
3.3. Microstructure and Mechanical Properties
4. Conclusions
- The steel produced with 0.004% carbon and various compounds of niobium and vanadium increased the yield stress due to the BH process.
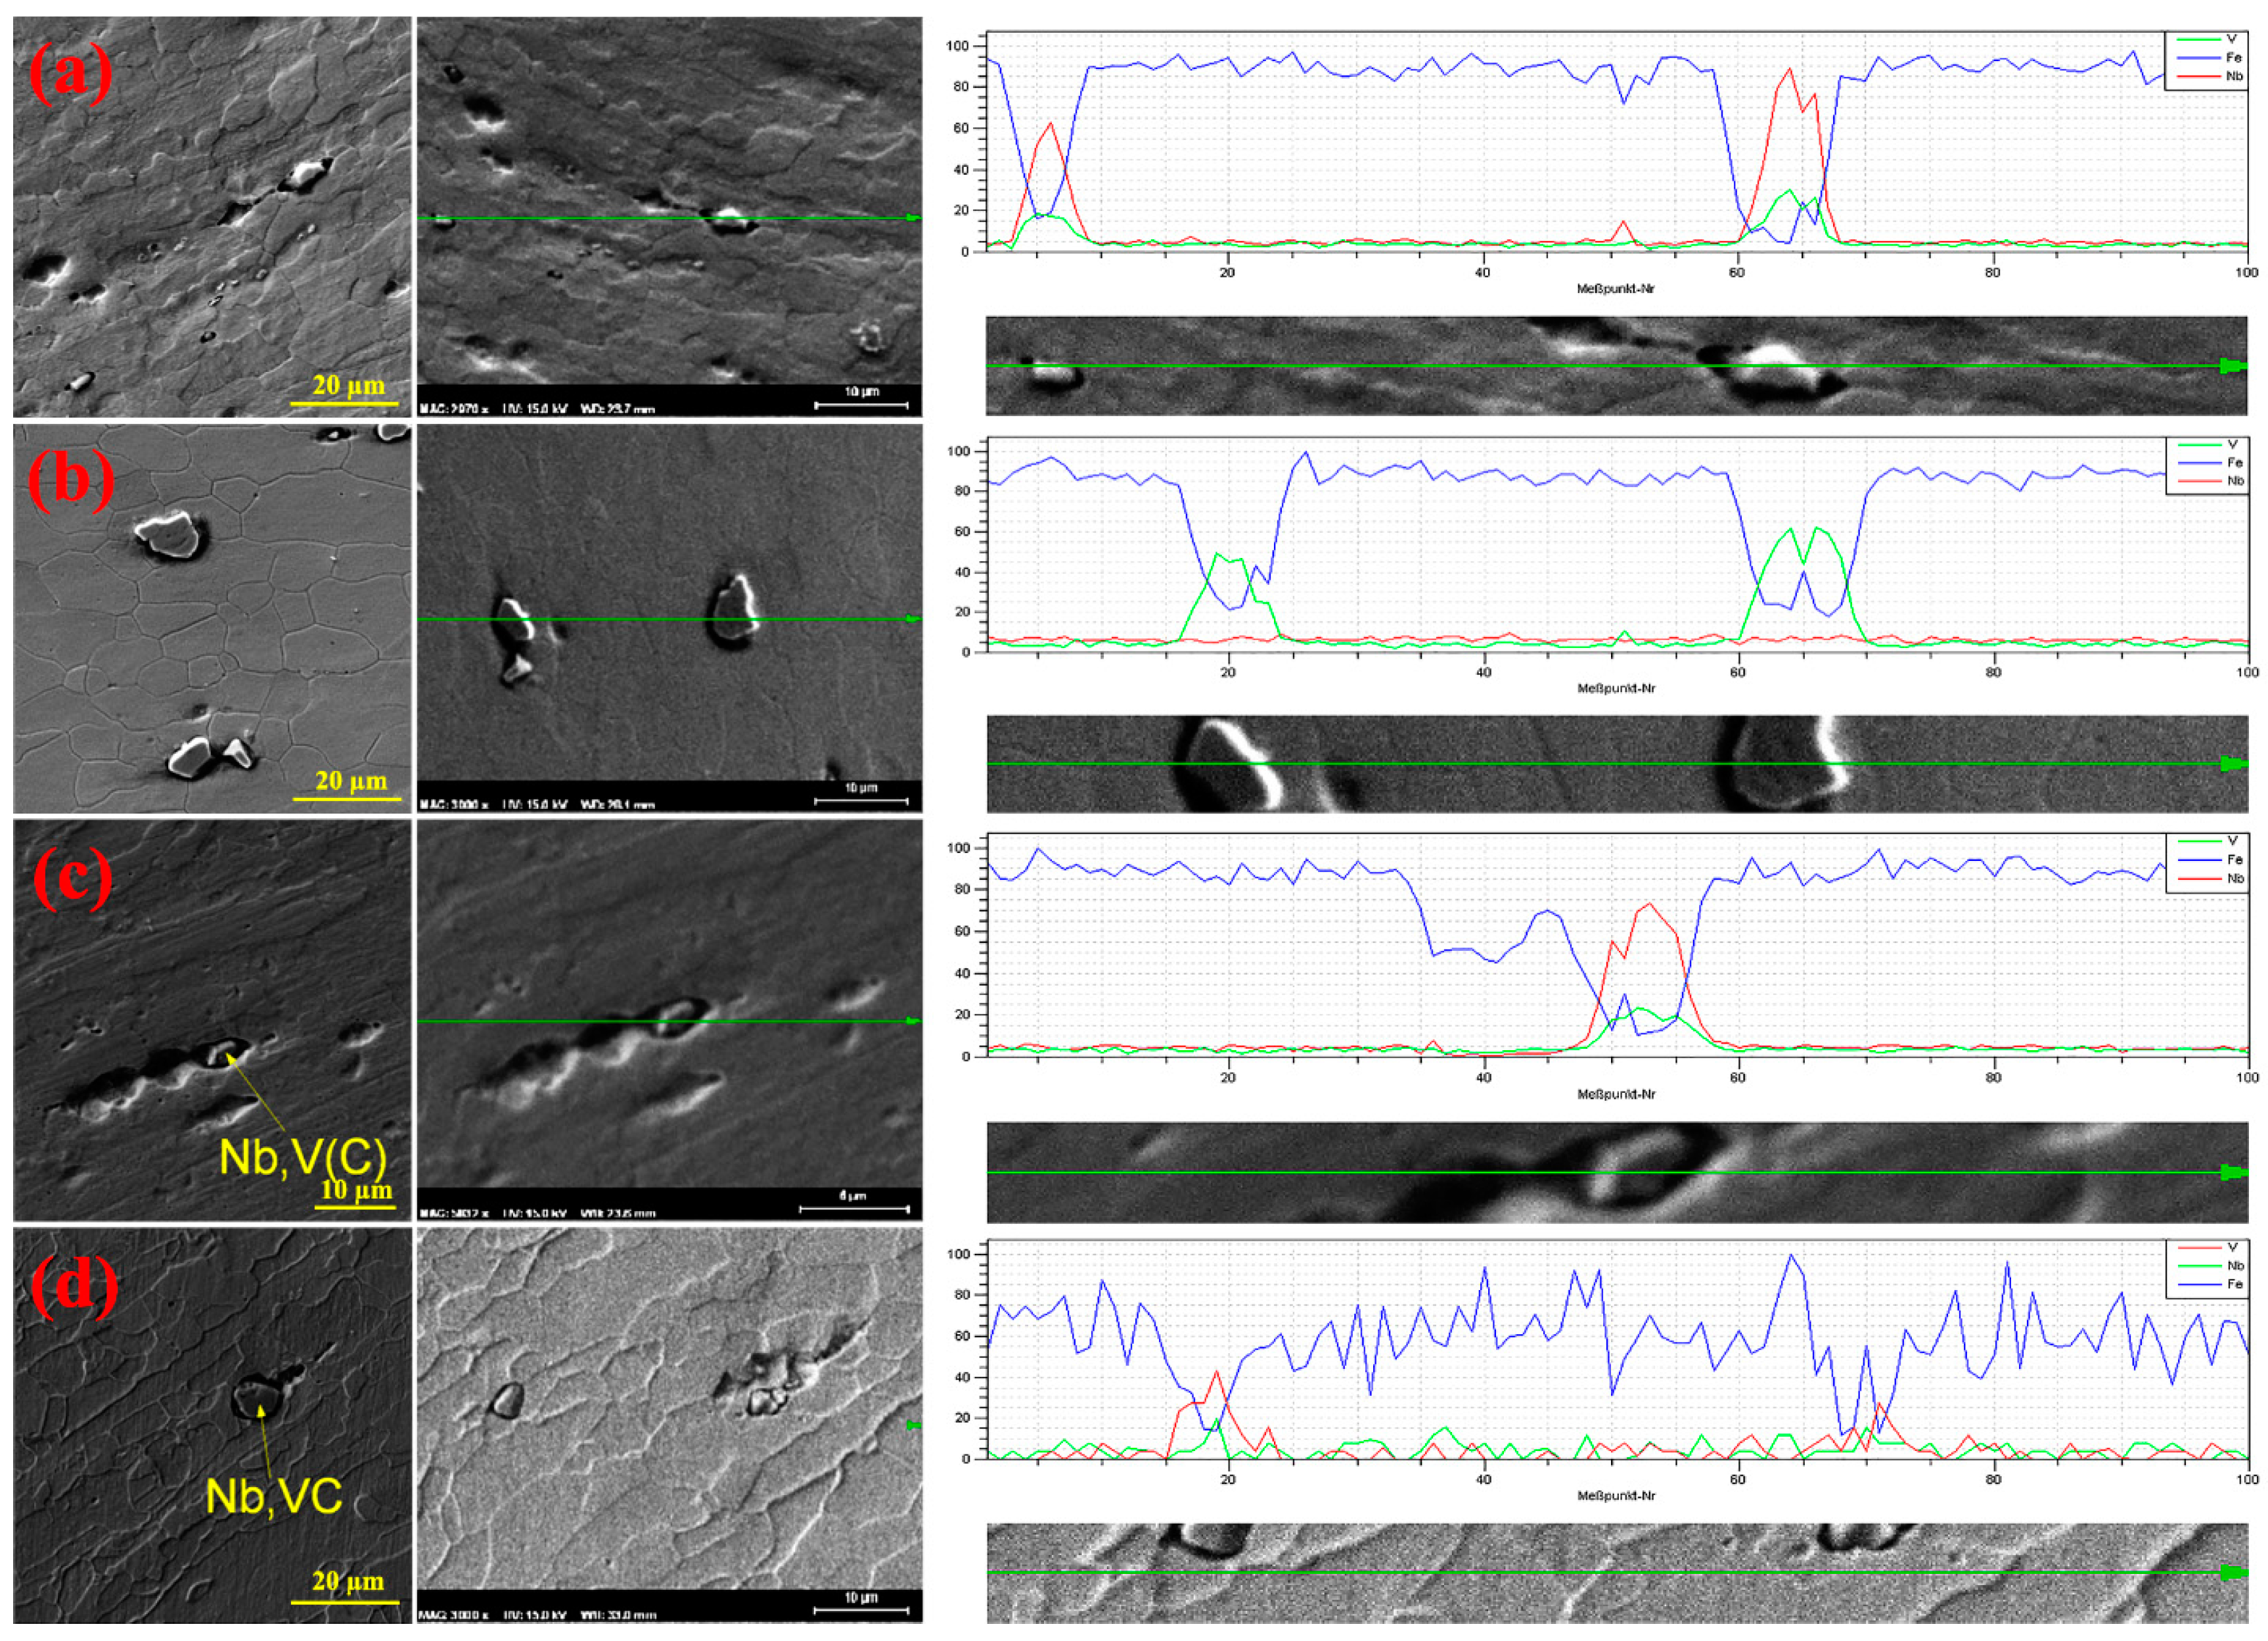
- By examining the microstructure of the samples using SEM, coarse carbides have been observed in the microstructure. By studying and examining these deposits, it was concluded that they are primary carbides that are not completely dissolved in the steel during the homogenization stage. Considering that the homogenization temperature is almost the same as the dissolution temperature of Nb carbides, the duration of the process should be considered longer to complete the homogenization operation.
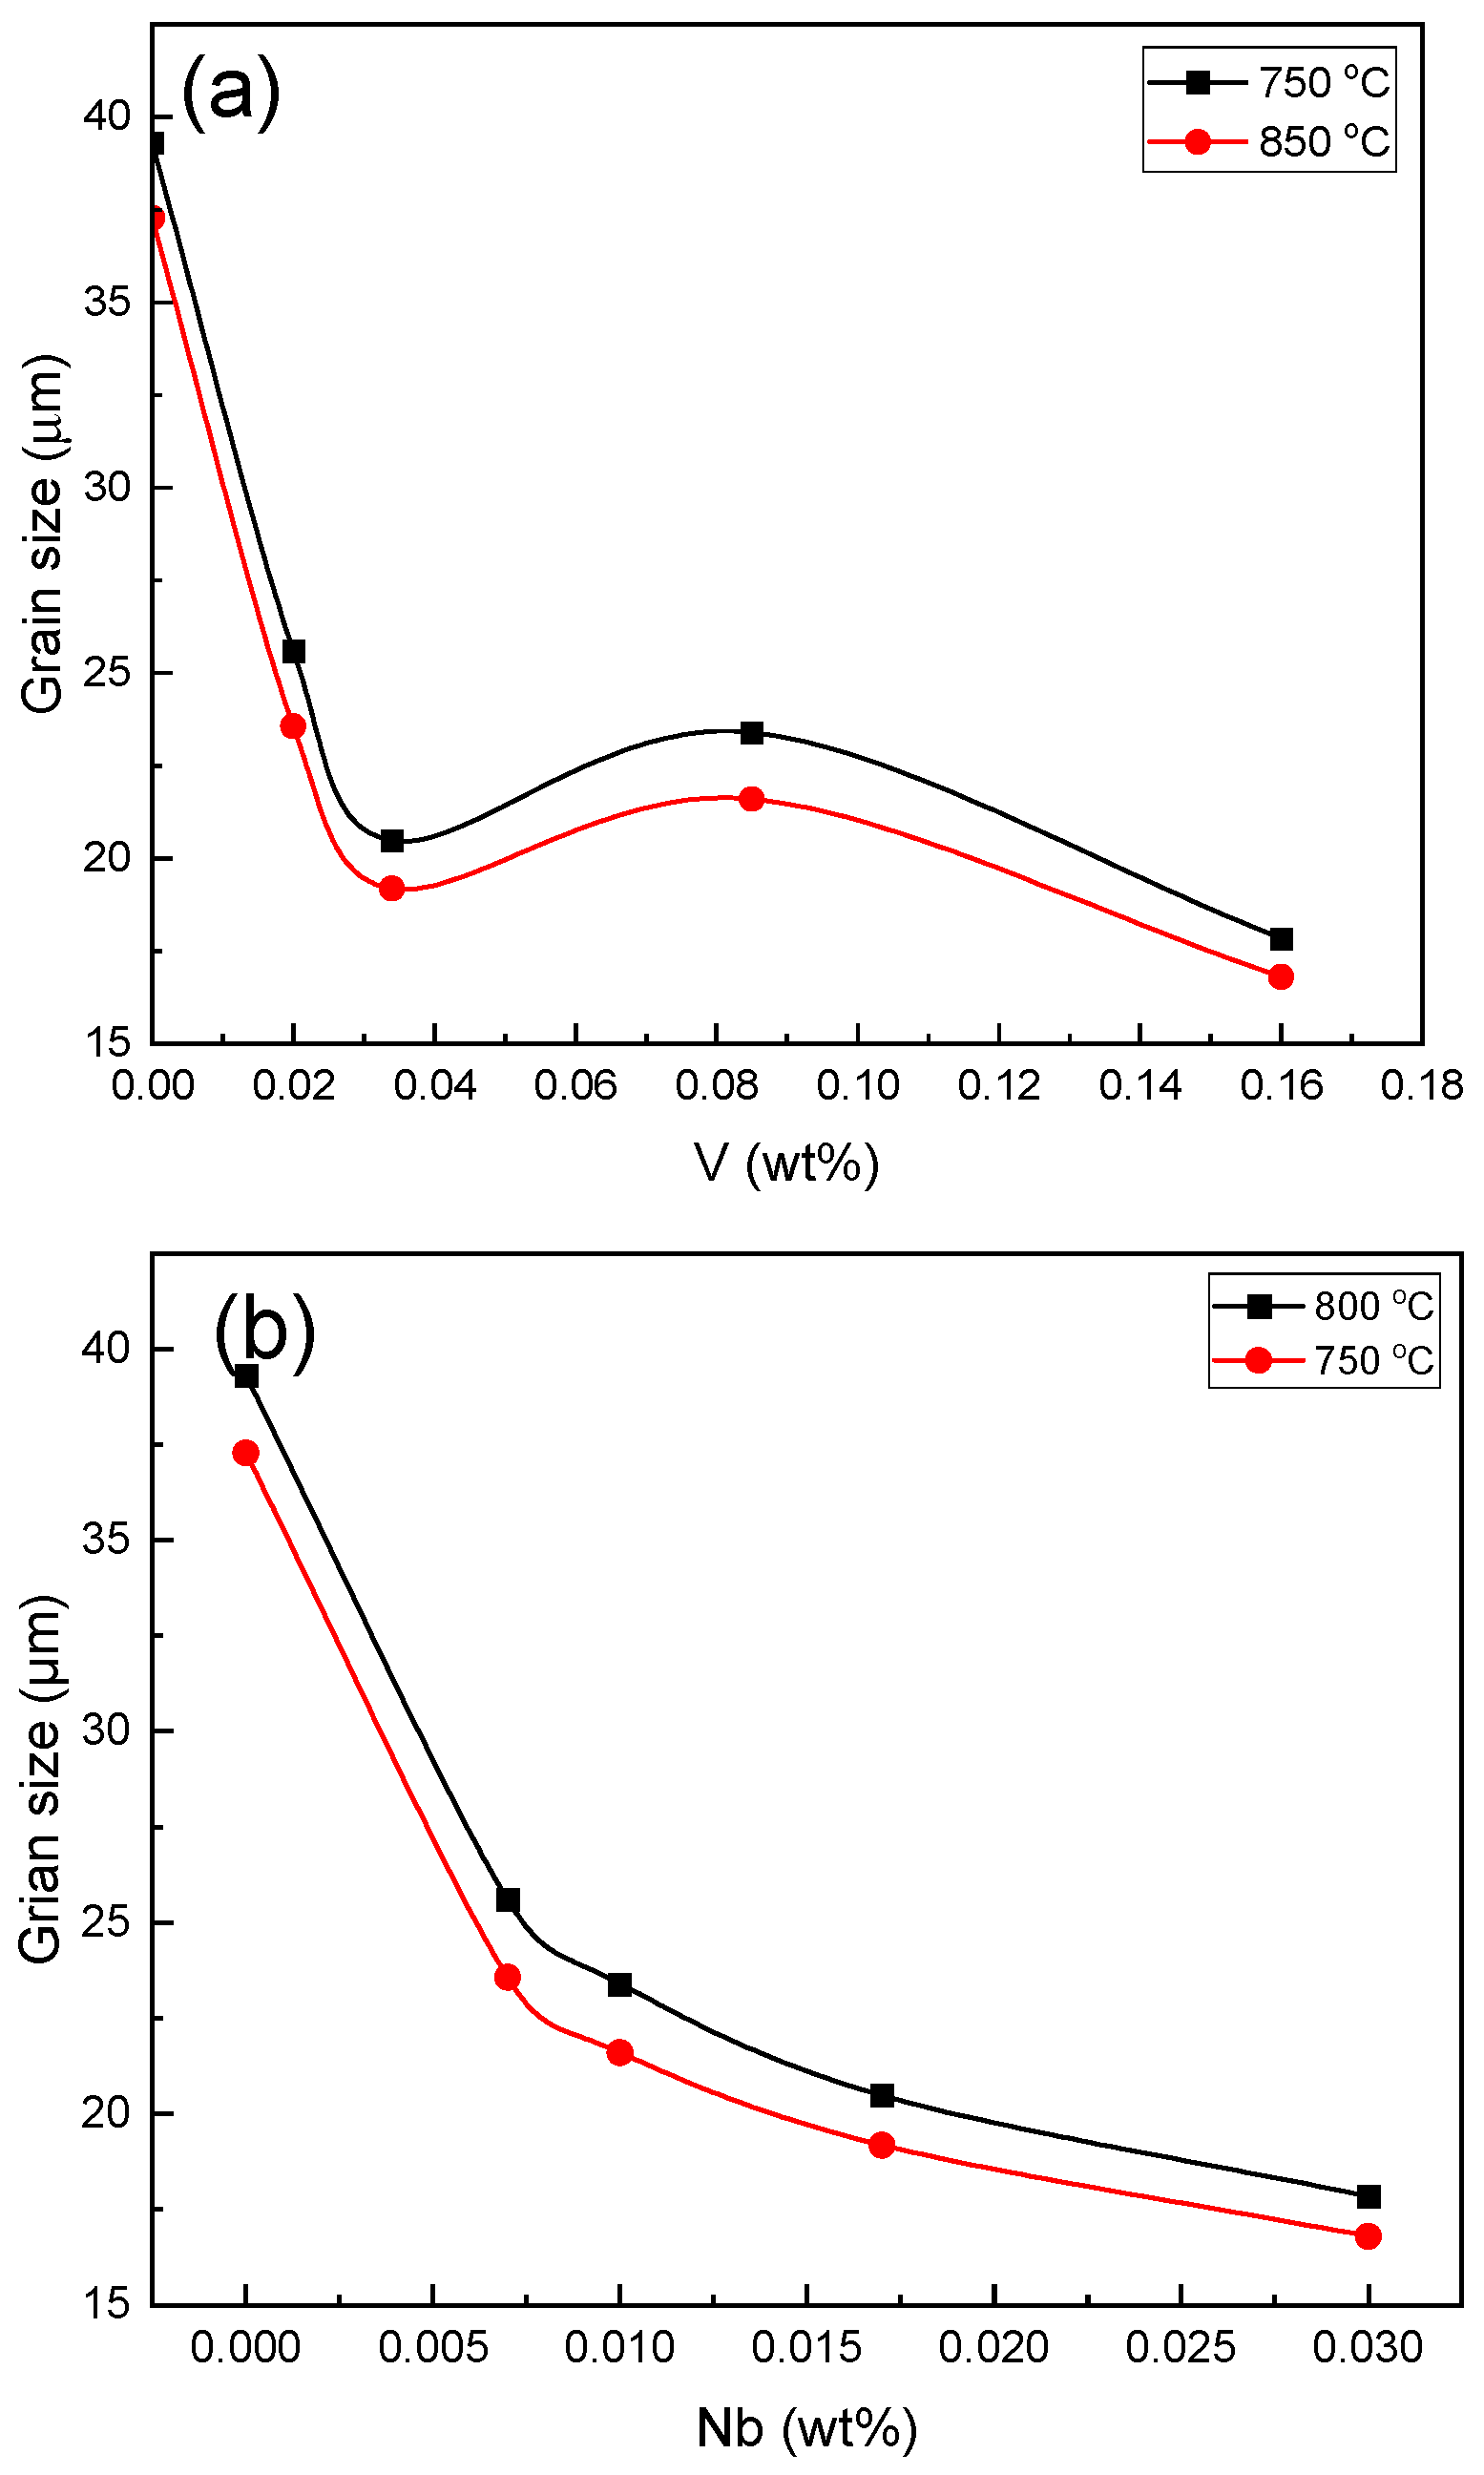
- Using the vanadium microalloying element instead of the titanium microalloying element is valuable because the precipitates created at a lower temperature are dissolved, and the amount of dissolved carbon in the system is increased. As a result, the annealing process is performed at a lower temperature.
- The ratio of Nb/C is important for the hardening properties, and the lower this ratio is, the more dissolved the carbon in the system is, and the hardening properties are increased.
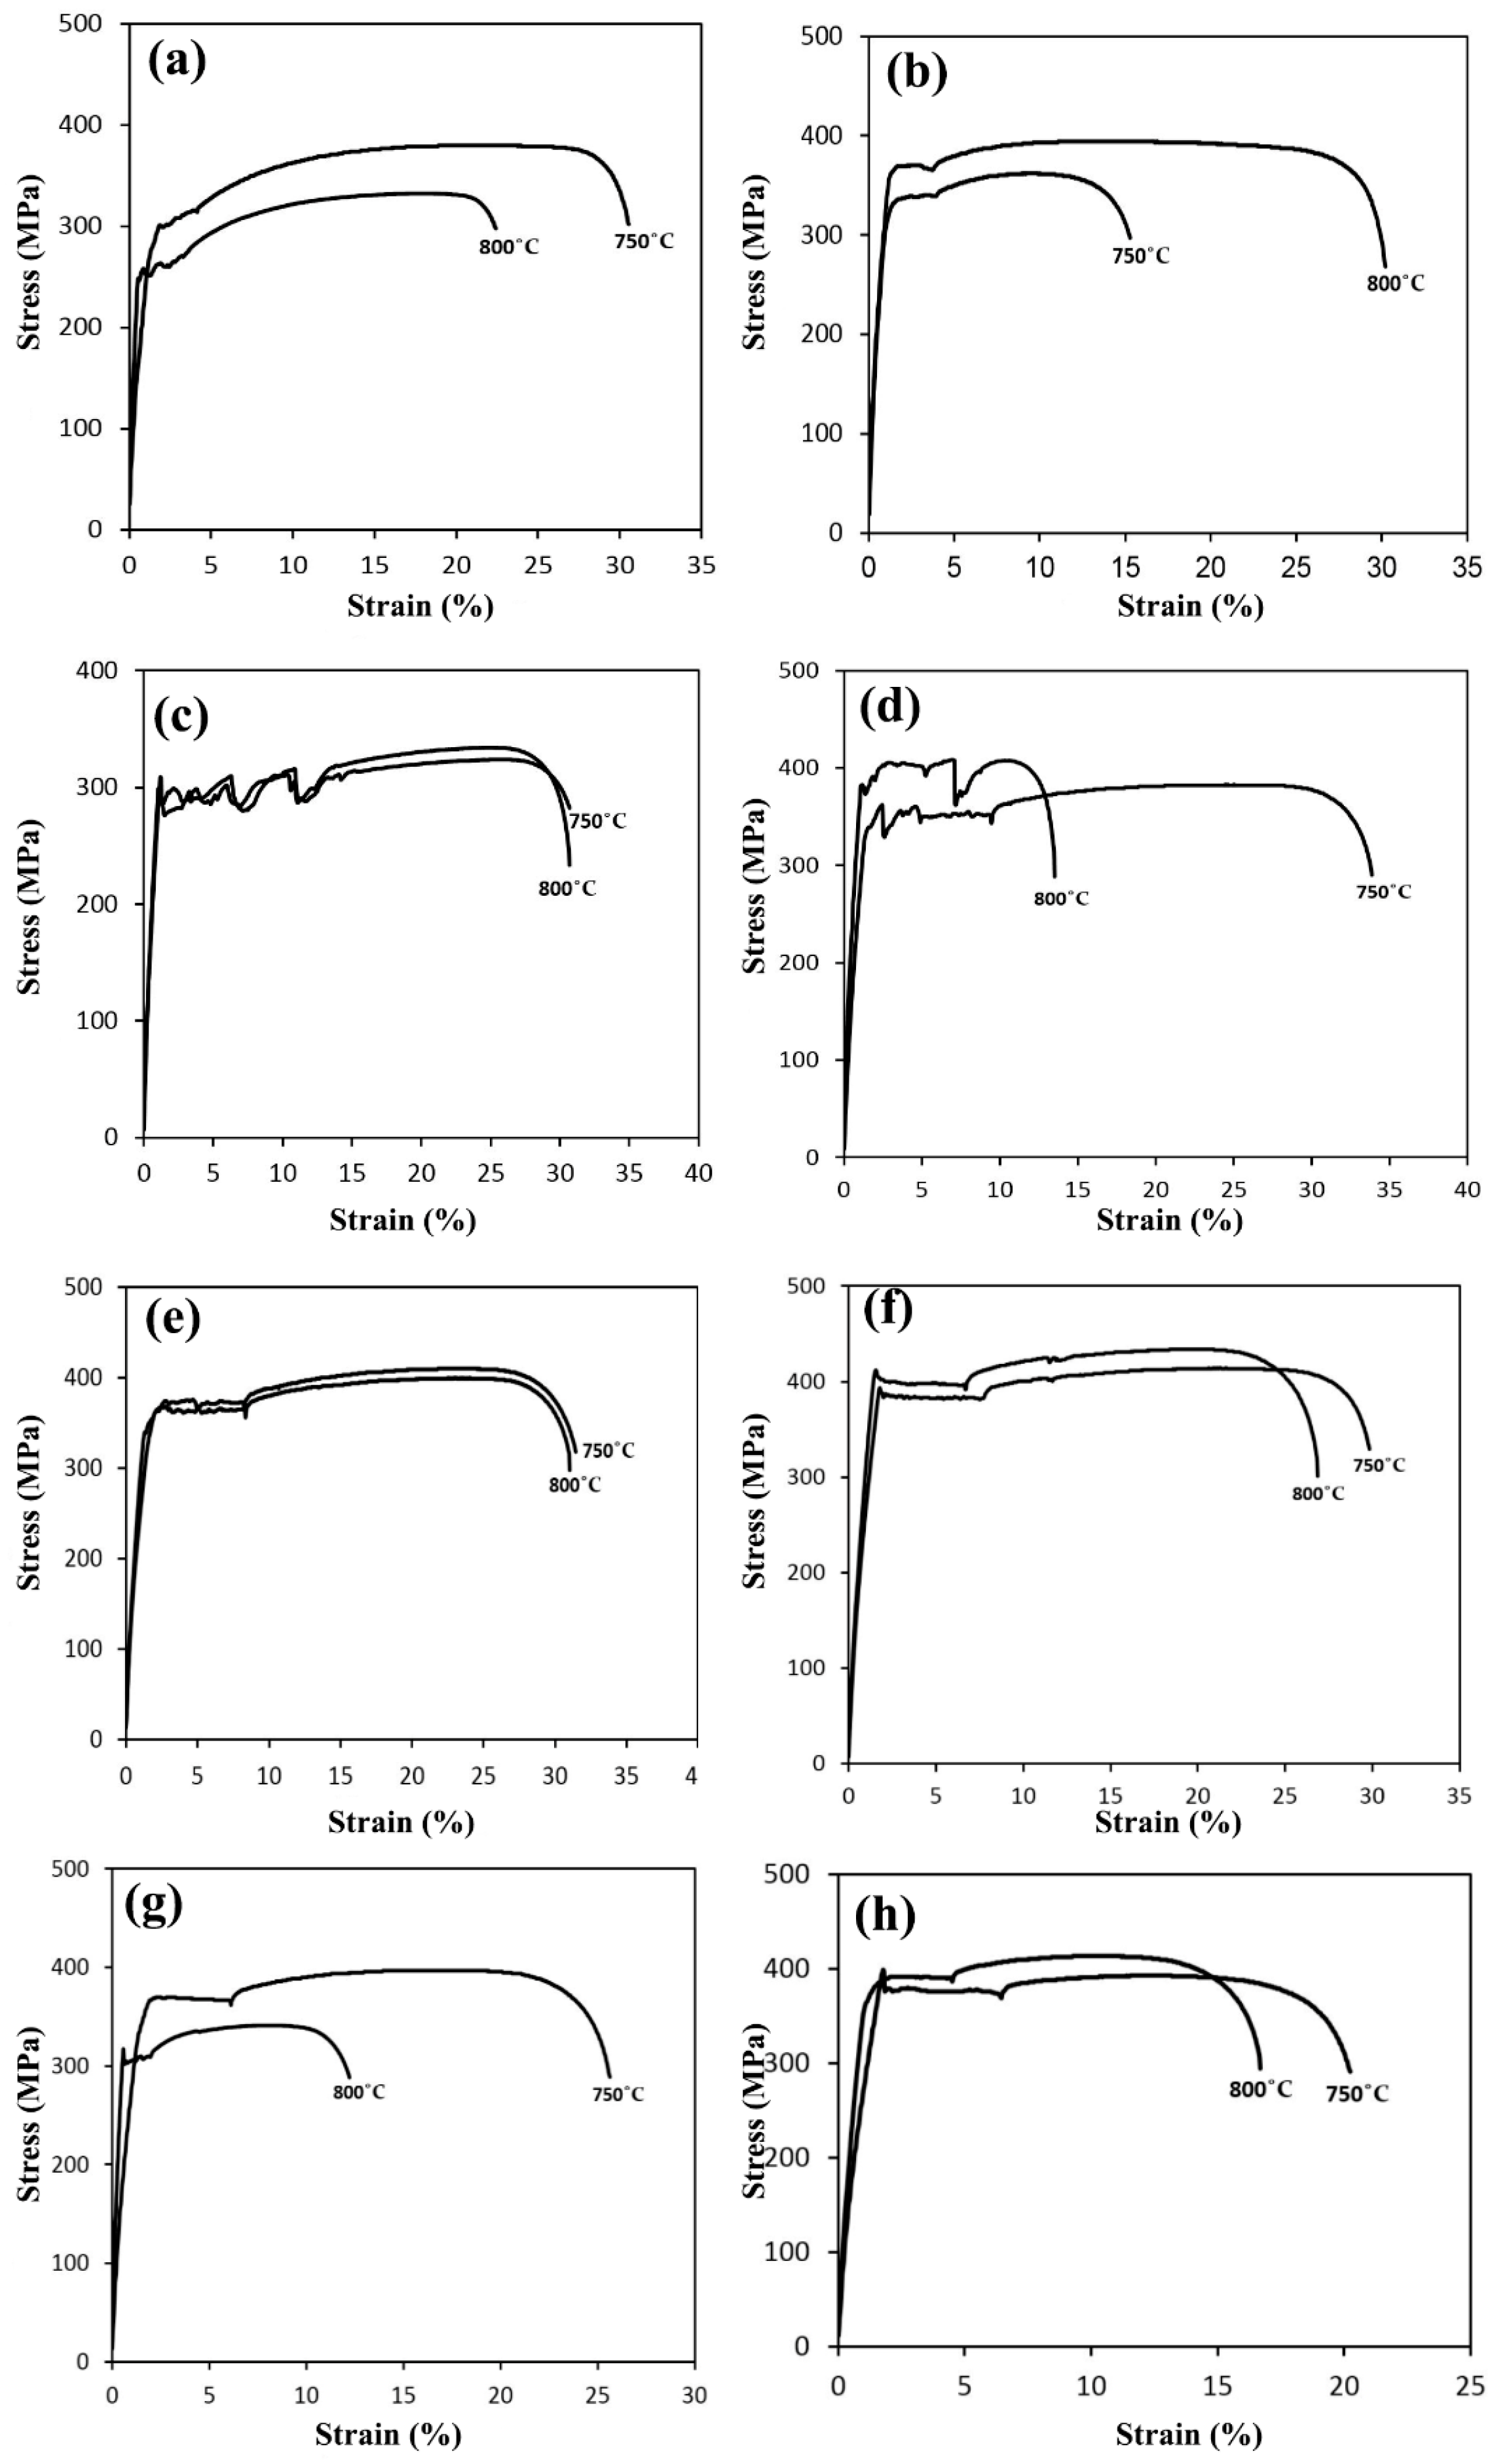
- Increasing the recrystallization annealing temperature from 750 to 800 °C, in addition to increasing the grain size, increased the amount of dissolved carbon atoms, and as a result, the amount of BH increased.
- According to the study of the microstructure and grain size of sample B, it is observed that sample B has the smallest grain size. Considering that sample B has the highest amount of Nb, this proves the effect of Nb on grain size.
- The general conclusion is that the amount of BH obtained by the steel samples investigated in this research that contained Nb and V microalloy elements was higher than that of the titanium element. In addition, it should be kept in mind that the carbon content of the steels investigated in this research was about 0.004% ultra-low carbon steels, while the steels investigated by most researchers are low-carbon steels.
Author Contributions
Funding
Institutional Review Board Statement
Informed Consent Statement
Data Availability Statement
Conflicts of Interest
References
- Yu, H.; Yan, Y.; Zhang, C.; Qiao, L. Novel bake hardening mechanism for bainite-strengthened complex phase steel. J. Mater. Sci. Technol. 2023, 143, 117–128. [Google Scholar] [CrossRef]
- Cho, W.; Jeong, B.-S.; Shin, E.; Park, S.; Jung, J.; Na, H.; Kim, S.-I.; Han, H.N. Bake hardening and uniaxial tensile behavior in a low carbon steel accompanying inhomogeneous plastic yielding. Mater. Sci. Eng. A 2022, 856, 144004. [Google Scholar] [CrossRef]
- Lazuardi, D.R.; Kim, S.-J.; Kim, H.; Kang, J.-H. Bake hardening of 7Mn–3Al-0.2C steel: Influence of intercritical annealing temperature. Mater. Sci. Eng. A 2022, 841. [Google Scholar] [CrossRef]
- Mousavi, S.F.; Sharifi, H.; Tayebi, M.; Hamawandi, B.; Behnamian, Y. Thermal cycles behavior and microstructure of AZ31/SiC composite prepared by stir casting. Sci. Rep. 2022, 12, 15191. [Google Scholar] [CrossRef]
- Narayanasamy, R.; Parthasarathi, N.L.; Ravindran, R.; Narayanan, C.S. Strain limit of extra galvannealed Interstitial-Free and bake hardened steel sheets under different stress conditions. J. Iron Steel Res. Int. 2008, 15, 56–60. [Google Scholar] [CrossRef]
- Soleimani, M.; Mirzadeh, H.; Dehghanian, C. Effects of tempering on the mechanical and corrosion properties of dual phase steel. Mater. Today Commun. 2019, 22, 100745. [Google Scholar] [CrossRef]
- Liu, S.; Wang, Y.; Yarigarravesh, M.; Tayyebi, M.; Tayebi, M. Evaluation of whisker alignment and anisotropic mechanical properties of ZK60 alloy reinforced with SiCw during KOBO extrusion method. J. Manuf. Process. 2022, 84, 344–356. [Google Scholar] [CrossRef]
- Wang, Y.-Y.; Jia, C.; Tayebi, M.; Hamawandi, B. Microstructural Evolution during Accelerated Tensile Creep Test of ZK60/SiCp Composite after KoBo Extrusion. Materials 2022, 15, 6428. [Google Scholar] [CrossRef]
- Kheradmand, A.B.; Tayebi, M.; Akbari, M.M.; Abbasian, A. Effect of quench-controlled precipitation hardening on microstructure and mechanical properties of Al-Zn-Mg-Cu-Zr alloys contain of Sc micro-alloying. J. Alloys Compd. 2022, 902, 163748. [Google Scholar] [CrossRef]
- Roy, K.; Rezaeian, H.; Fang, Z.; Raftery, G.M.; Lim, J.B. Experimental and numerical study of a novel cold-formed steel T-Stub connection subjected to tension force. J. Constr. Steel Res. 2022, 197, 107466. [Google Scholar] [CrossRef]
- Koohdar, H.; Roshanzadeh, F.; Jafarian, H.R. Correlation between microstructure and shape memory properties in an Fe-9.5Ni-6.5Mn dual phase steel developed by intercritical annealing and subsequent ageing. J. Mater. Res. Technol. 2022, 21, 4537–4547. [Google Scholar] [CrossRef]
- Shiraiwa, T.; Briffod, F.; Enoki, M.; Yamazaki, K. Inverse analysis of the relationship between three-dimensional microstructures and tensile properties of dual-phase steels. Mater. Today Commun. 2022, 33, 104958. [Google Scholar] [CrossRef]
- Sas, J.; Kvačkaj, T.; Milkovič, O.; Zemko, M. Influence of Hot Plastic Deformation in γ and (γ + α) Area on the Structure and Mechanical Properties of High-Strength Low-Alloy (HSLA) Steel. Materials 2016, 9, 971. [Google Scholar] [CrossRef] [PubMed] [Green Version]
- Mohrbacher, H. Reverse metallurgical engineering towards sustainable manufacturing of vehicles using Nb and Mo alloyed high performance steels. Adv. Manuf. 2013, 1, 28–41. [Google Scholar] [CrossRef] [Green Version]
- Haensch, W.; Klinkenberg, C. Low carbon niobium alloyed high strength steel for automotive hot strip. Ironmak. Steelmak. 2005, 32, 342–346. [Google Scholar] [CrossRef]
- Kvackaj, T. The review of steel and steel products flat-rolled production. Metal.-Sisak Zagreb 2000, 39, 185–189. [Google Scholar]
- Kvackaj, T.; Bidulská, J.; Bidulský, R. Overview of HSS Steel Grades Development and Study of Reheating Condition Effects on Austenite Grain Size Changes. Materials 2021, 14, 1988. [Google Scholar] [CrossRef] [PubMed]
- Kvackaj, T.; Mamuzic, I. Development of bake hardening effect by plastic deformation and annealing conditions. Metalurgija 2006, 45, 51–55. [Google Scholar]
- Wu, H.; Guo, H.; Hu, B.; Enomoto, M.; Shang, C. Ultra-high strength attributed to retardation of recrystallization during intercritical annealing in cold-rolled (V,Nb) microalloyed 5Mn steel. Mater. Sci. Eng. A 2020, 794, 139789. [Google Scholar] [CrossRef]
- Jung, J.-G.; Park, J.-S.; Kim, J.; Lee, Y.-K. Carbide precipitation kinetics in austenite of a Nb–Ti–V microalloyed steel. Mater. Sci. Eng. A 2011, 528, 5529–5535. [Google Scholar] [CrossRef]
- Zhu, Q.; Chen, J.; Gou, G.; Chen, H.; Li, P. Ameliorated longitudinal critically refracted—Attenuation velocity method for welding residual stress measurement. J. Mater. Process. Technol. 2017, 246, 267–275. [Google Scholar] [CrossRef]
- Liang, L.; Xu, M.; Chen, Y.; Zhang, T.; Tong, W.; Liu, H.; Wang, H.; Li, H. Effect of welding thermal treatment on the microstructure and mechanical properties of nickel-based superalloy fabricated by selective laser melting. Mater. Sci. Eng. A 2021, 819, 141507. [Google Scholar] [CrossRef]
- Dutta, B.; Valdes, E.; Sellars, C. Mechanism and kinetics of strain induced precipitation of Nb(C,N) in austenite. Acta Met. Et Mater. 1992, 40, 653–662. [Google Scholar] [CrossRef]
- Okaguchi, S.; Hashimoto, T. Computer Model for Prediction of Carbonitride Precipitation during Hot Working in Nb-Ti Bearing HSLA Steels. ISIJ Int. 1992, 32, 283–290. [Google Scholar] [CrossRef] [Green Version]
- Hansen, S.S.; Sande, J.V.; Cohen, M. Niobium carbonitride precipitation and austenite recrystallization in hot-rolled microalloyed steels. Met. Mater. Trans. A 1980, 11, 387–402. [Google Scholar] [CrossRef]
- Kwon, O.; DeArdo, A. Interactions between recrystallization and precipitation in hot-deformed microalloyed steels. Acta Met. Et Mater. 1991, 39, 529–538. [Google Scholar] [CrossRef]
- Long, X.; Guo, Y.; Su, Y.; Siow, K.S.; Chen, C. Unveiling the damage evolution of SAC305 during fatigue by entropy generation. Int. J. Mech. Sci. 2023, 244, 108087. [Google Scholar] [CrossRef]
- Yuhua, C.; Yuqing, M.; Weiwei, L.; Peng, H. Investigation of welding crack in micro laser welded NiTiNb shape memory alloy and Ti6Al4V alloy dissimilar metals joints. Opt. Laser Technol. 2017, 91, 197–202. [Google Scholar] [CrossRef]
- Xia, Y.; Shi, M.; Zhang, C.; Wang, C.; Sang, X.; Liu, R.; Zhao, P.; An, G.; Fang, H. Analysis of flexural failure mechanism of ultraviolet cured-in-place-pipe materials for buried pipelines rehabilitation based on curing temperature monitoring. Eng. Fail. Anal. 2022, 142, 106763. [Google Scholar] [CrossRef]
- Zhang, Z.; Sun, X.; Wang, Z.; Li, Z.; Yong, Q.; Wang, G. Carbide precipitation in austenite of Nb–Mo-bearing low-carbon steel during stress relaxation. Mater. Lett. 2015, 159, 249–252. [Google Scholar] [CrossRef]
- Baker, L.J.; Parker, J.D.; Daniel, S.R. Mechanism of bake hardening in ultralow carbon steel containing niobium and titanium additions. Mater. Sci. Technol. 2002, 18, 541–547. [Google Scholar] [CrossRef]
- He, B. On the Factors Governing Austenite Stability: Intrinsic versus Extrinsic. Materials 2020, 13, 3440. [Google Scholar] [CrossRef] [PubMed]
- Wang, C.; Cao, W.; Shi, J.; Huang, C.; Dong, H. Deformation microstructures and strengthening mechanisms of an ultrafine grained duplex medium-Mn steel. Mater. Sci. Eng. A 2012, 562, 89–95. [Google Scholar] [CrossRef]
- Van Dijk, N.H.; Butt, A.M.; Zhao, L.; Sietsma, J.; Offerman, S.E.; Wright, J.P.; Van Der Zwaag, S. Thermal stability of retained austenite in TRIP steels studied by synchrotron X-ray diffraction during cooling. Acta Mater. 2005, 53, 5439–5447. [Google Scholar] [CrossRef]
- Jimenez-Melero, E.; van Dijk, N.H.; Zhao, L.; Sietsma, J.; Offerman, S.E.; Wright, J.P.; van der Zwaag, S. Characterization of individual retained austenite grains and their stability in low-alloyed TRIP steels. Acta Mater. 2007, 55, 6713–6723. [Google Scholar] [CrossRef]
- Wang, J.; Van Der Zwaag, S. Stabilization mechanisms of retained austenite in transformation-induced plasticity steel. Met. Mater. Trans. A 2001, 32, 1527–1539. [Google Scholar] [CrossRef]
- Liu, P.; Zhu, B.; Wang, Y.; Zhang, Y. Coupled Model for Carbon Partitioning from Martensite into Austenite During the Quenching Process in Fe-C Steels. Met. Mater. Trans. A 2016, 47, 4325–4333. [Google Scholar] [CrossRef]
- Yuan, X.-H.; Zheng, S.-J.; Yang, M.-S.; Zhao, K.-Y. Carbide precipitation and microstructure refinement of Cr-Co-Mo-Ni bearing steel during hot deformation. J. Central South Univ. 2015, 22, 3265–3274. [Google Scholar] [CrossRef]
- Bi, N.; Liang, J.; Wang, X.; Kang, T.; Han, F. Microstructure evolution and yield strength improvement of a low carbon medium manganese steel experienced intercritical annealing, pre-straining and tempering. Mater. Charact. 2022, 194, 112439. [Google Scholar] [CrossRef]
- Krupic, V.; Gladman, T.; Mitchell, P. Vanadium in Interstitial Free Steels. In Proceedings of the 39th Mechanical Working and Steel Processing Conference, Indianapolis, IN, USA, 19–22 October 1997; pp. 37–48. [Google Scholar]
- Dehghani, K.; Shafiei, A. Predicting the bake hardenability of steels using neural network modeling. Mater. Lett. 2008, 62, 173–178. [Google Scholar] [CrossRef]
- Storozheva, L.M.; Escher, K.; Bode, R.; Hulka, K.; Burko, D.A. Effect of Niobium and Coiling and Annealing Temperatures on the Microstructure, Mechanical Properties, and Bake Hardening of Ultralow-Carbon Steels for the Automotive Industry. Met. Sci. Heat Treat. 2002, 44, 102–107. [Google Scholar] [CrossRef]
- Satoh, S.; Okada, S.; Kato, T. Development of bake hardening high strength cold-rolled sheet steels for automobile exposed panels. Kawasaki Steel Tech. Rep. 1992, 27, 31–38. [Google Scholar]

| Sample | Chemical Composition (wt%) | ||||||||||
|---|---|---|---|---|---|---|---|---|---|---|---|
| C | Si | Mn | P | S | Mo | Cu | V | Nb | Cr | Fe | |
| A | 0.004 | 0.02 | 0.14 | 0.011 | 0.017 | 0.01 | 0.01 | - | - | 0.001 | Bal. |
| B | 0.004 | 0.02 | 0.14 | 0.011 | 0.016 | 0.01 | 0.01 | 0.16 | 0.031 | 0.003 | Bal. |
| C | 0.004 | 0.018 | 0.14 | 0.011 | 0.015 | 0.01 | 0.01 | 0.085 | 0.01 | 0.003 | Bal. |
| D | 0.004 | 0.01 | 0.1 | 0.011 | 0.015 | 0.01 | 0.01 | 0.034 | 0.017 | 0.003 | Bal. |
| E | 0.004 | 0.01 | 0.1 | 0.011 | 0.015 | 0.01 | 0.01 | 0.02 | 0.007 | 0.003 | Bal. |
| Sample | Hardness (HV30) | Yield Stress (MPa) | UTS (MPa) | Elongation (%) | |
|---|---|---|---|---|---|
| Hot-rolled | B | 155 | 240 | 370 | 47.6 |
| E | 122 | 220 | 234 | 67.6 | |
| Cold-rolled | A | 242 | 190 | 818 | 2.24 |
| B | 298 | 205 | 944 | 3.28 | |
| C | 277 | 202 | 852 | 3.12 | |
| D | 257 | 200 | 846 | 3 | |
| E | 277 | 203 | 855 | 2.8 | |
| Sample | Annealing Temperature (°C) | YS (Mpa) | UTS (Mpa) | Elongation (%) | Grain Size (µm) |
|---|---|---|---|---|---|
| A | 650 | 230 | 333 | 43.68 | 23.9 |
| 750 | 180 | 311 | 45.44 | 37.28 | |
| 800 | 178 | 302 | 47 | 39.3 | |
| B | 650 | 415 | 543 | 18.04 | 16.38 |
| 750 | 230 | 362 | 41.36 | 16.88 | |
| 800 | 178 | 302 | 44.8 | 17.84 | |
| C | 650 | 315 | 395 | 33.6 | 18.8 |
| 750 | 281 | 360 | 36 | 21.6 | |
| 800 | 305 | 354.4 | 36 | 23.4 | |
| D | 650 | 295 | 378 | 35.48 | 17.58 |
| 750 | 273 | 358 | 38.12 | 19.18 | |
| 800 | 220 | 330 | 41.6 | 20.48 | |
| E | 650 | 352 | 428 | 28.12 | 16.93 |
| 750 | 252 | 352 | 36.88 | 23.57 | |
| 800 | 182 | 304.3 | 49.72 | 25.6 |
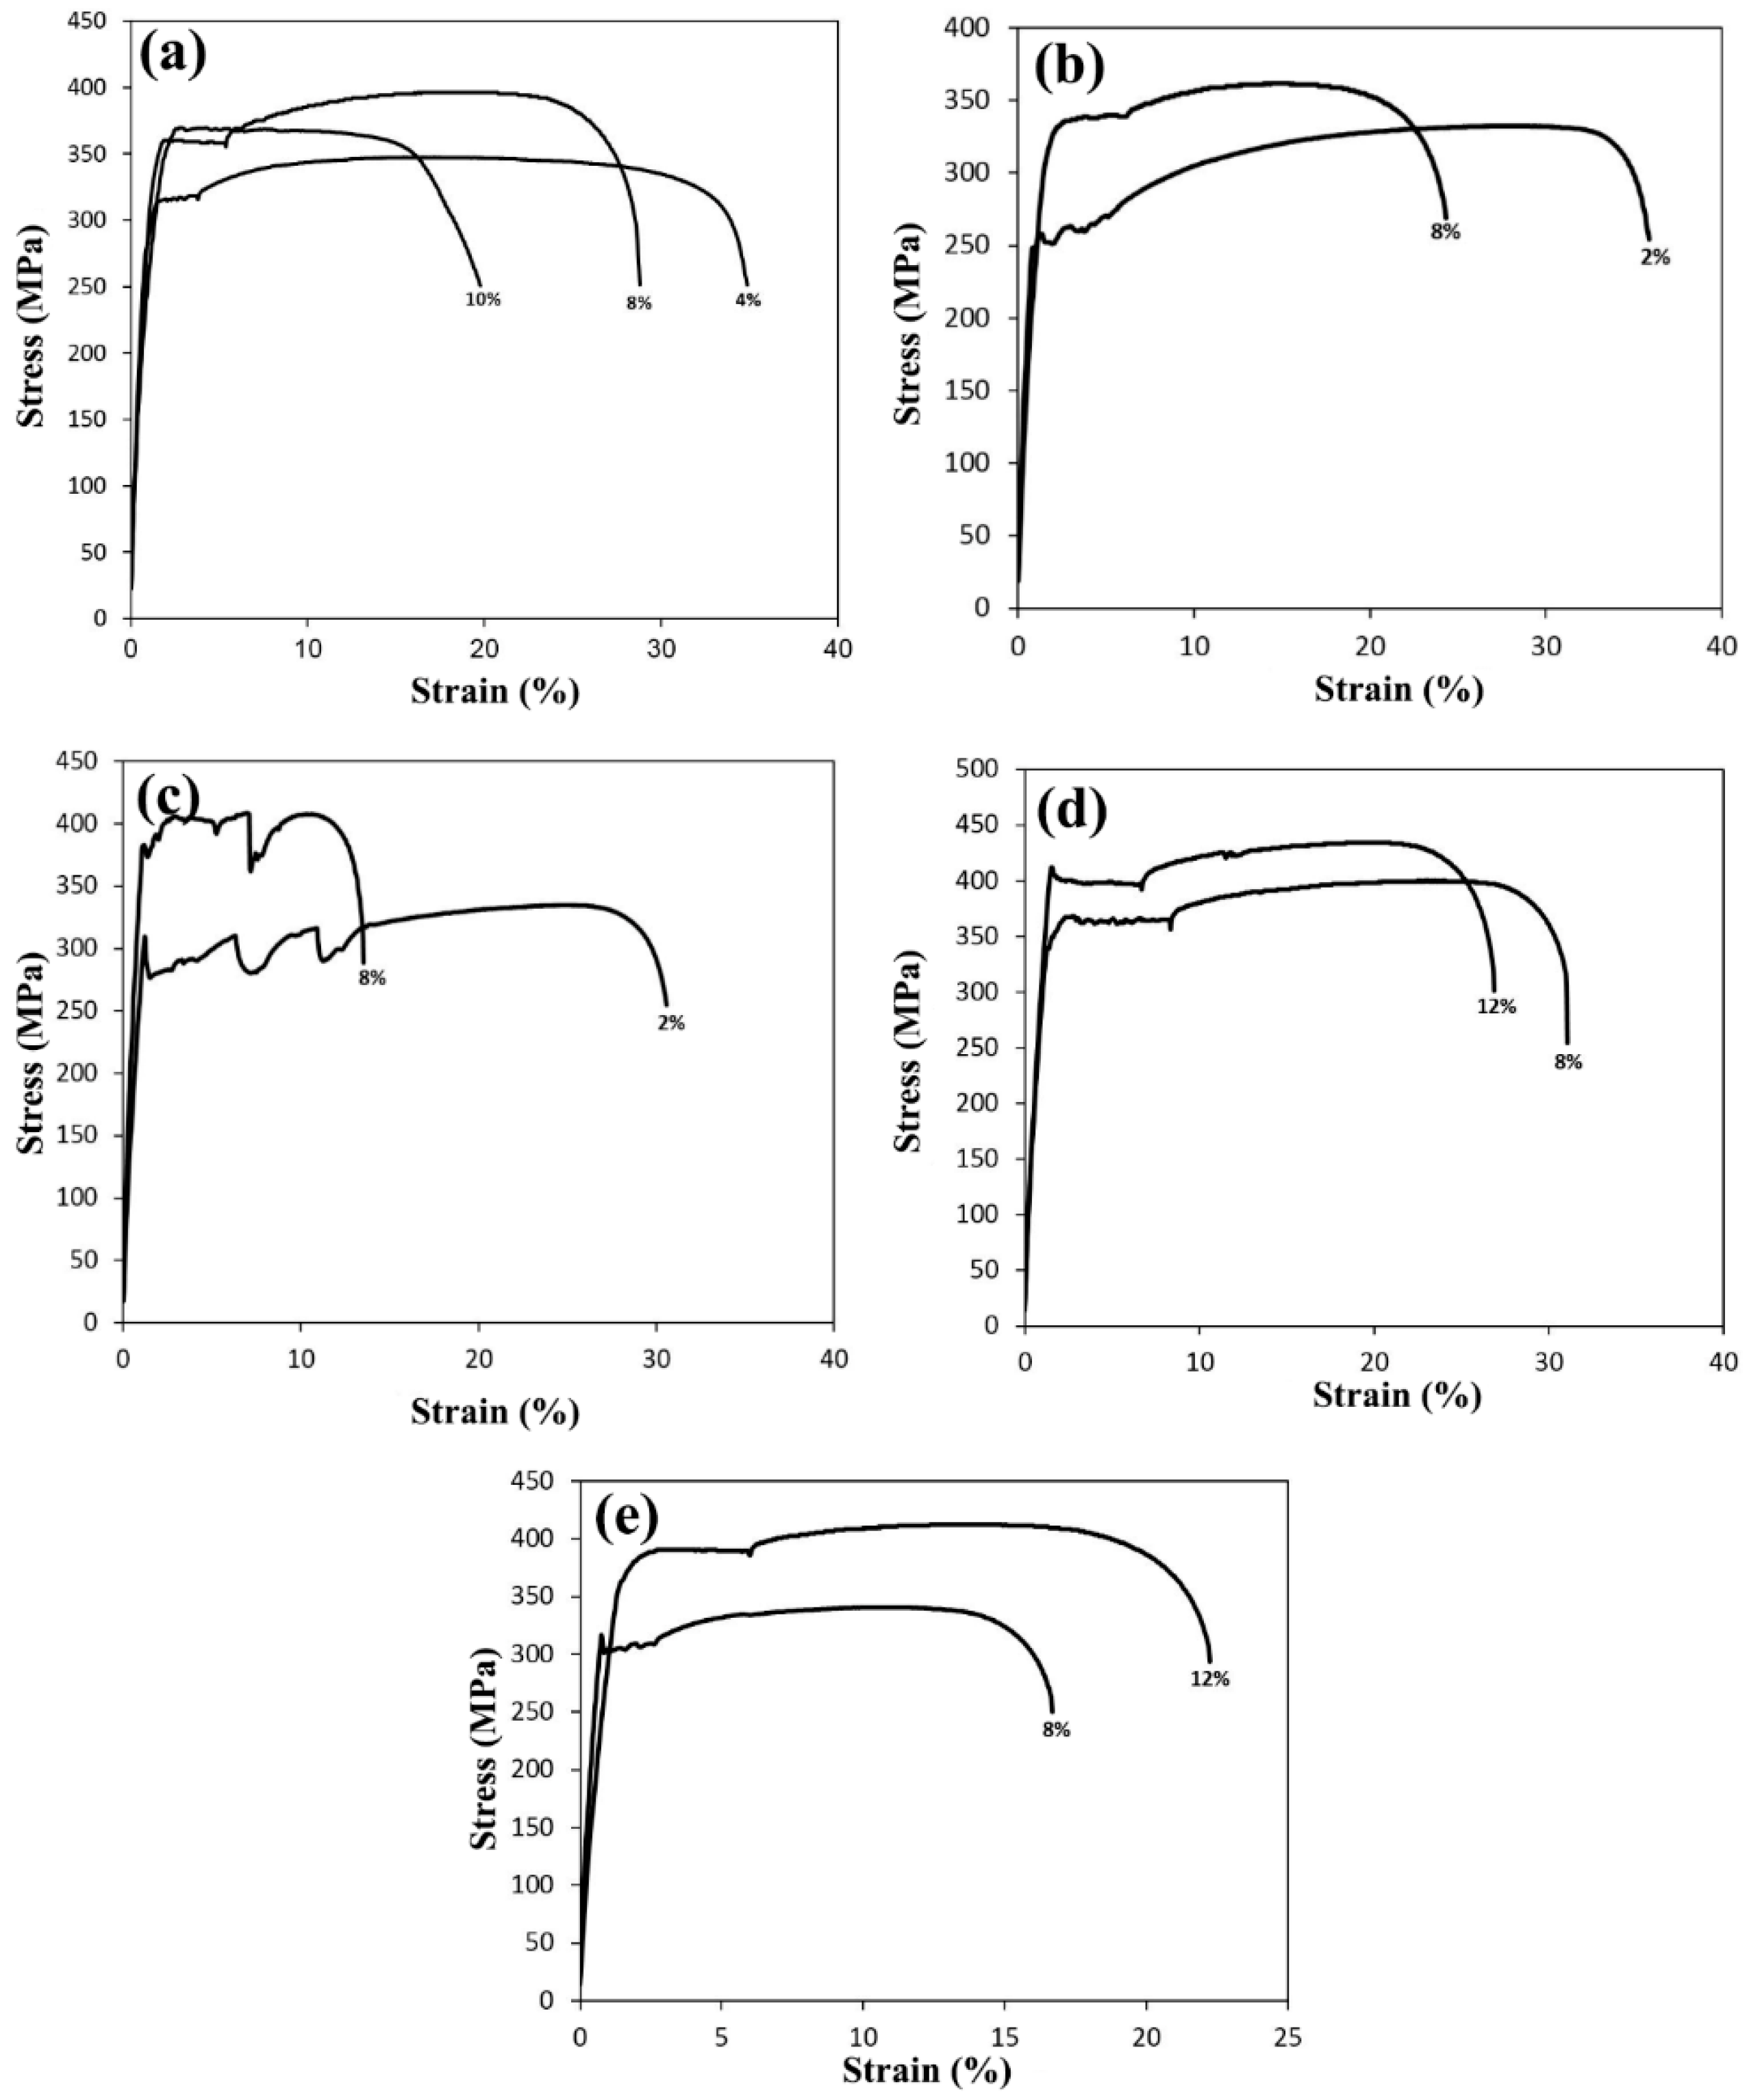
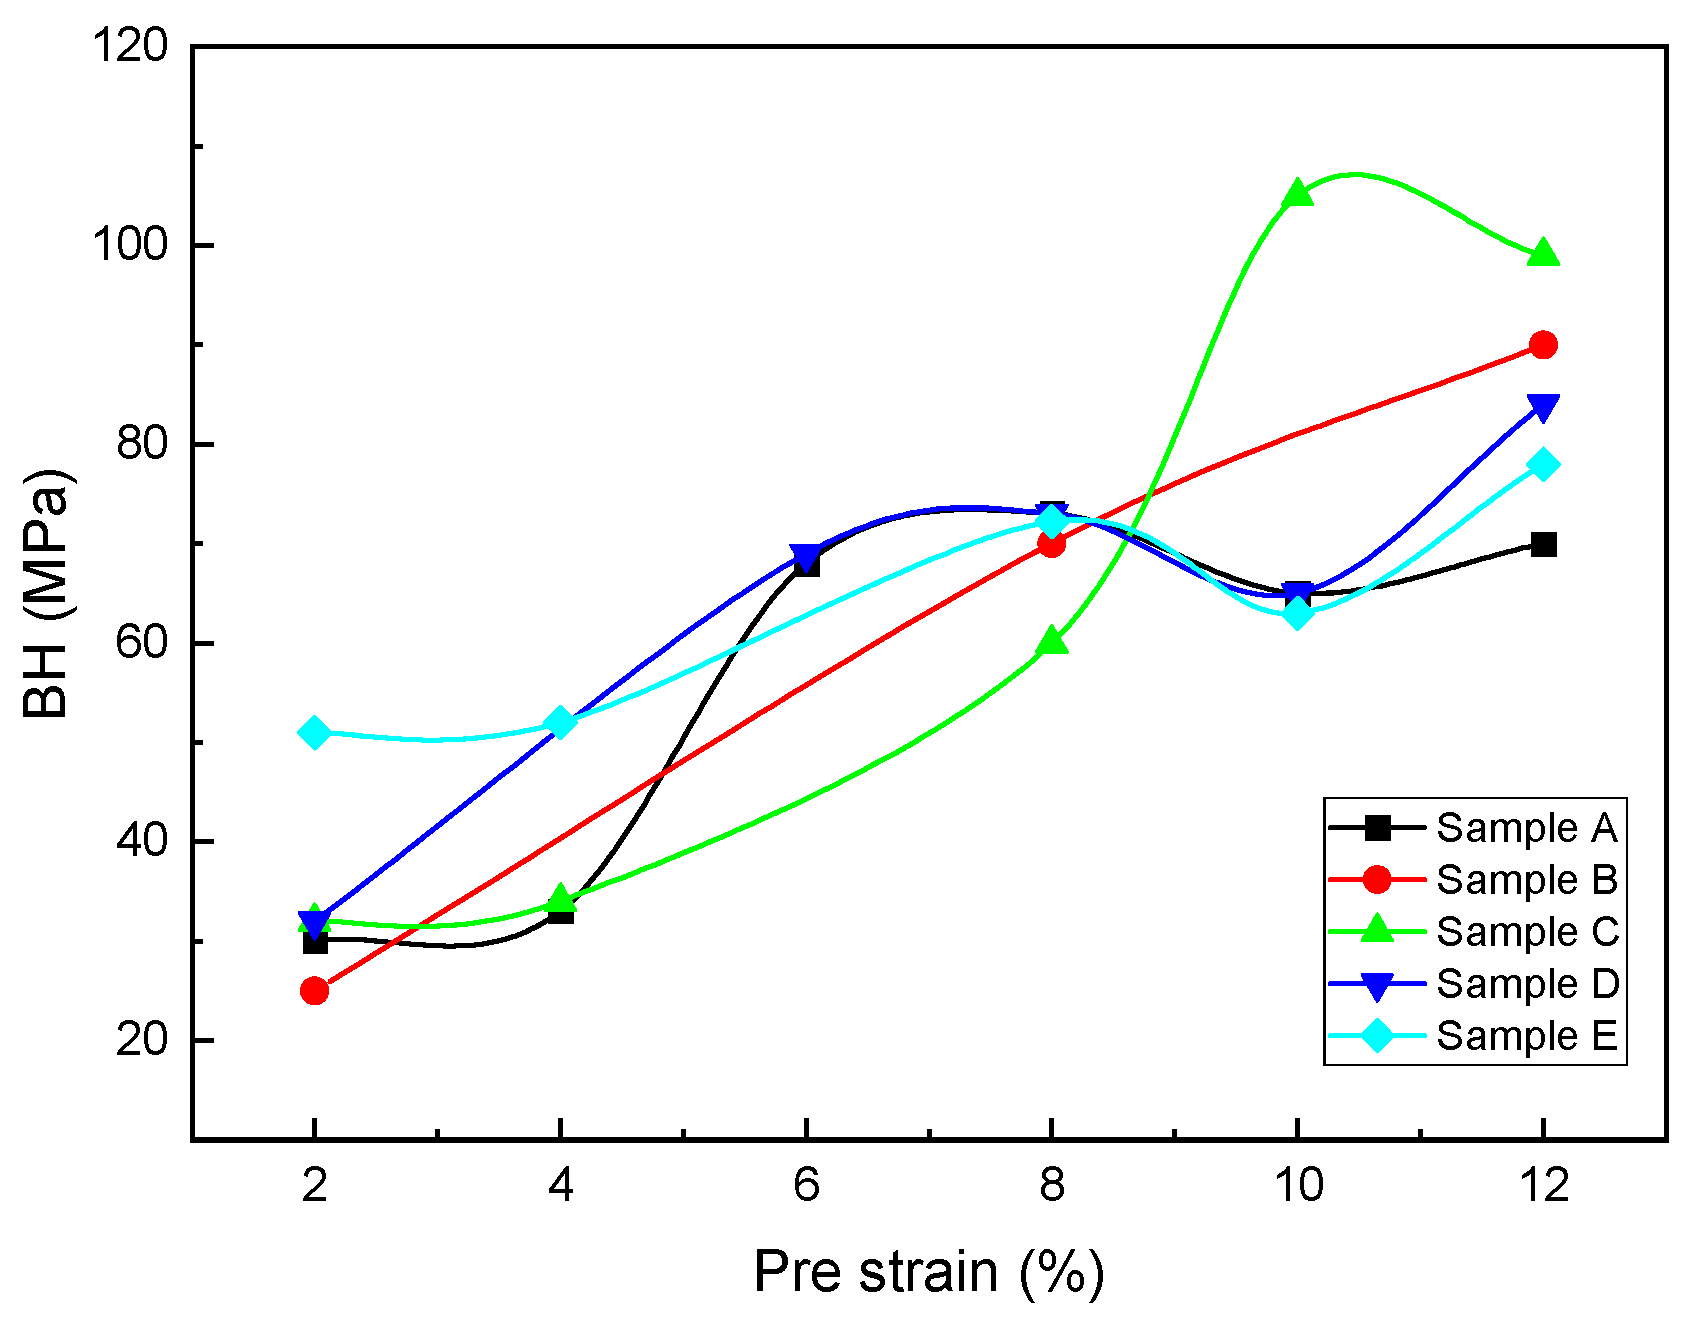
| Sample | Pre-Strain | Flow Stress (Mpa) | YS (Mpa) | UTS (Mpa) | Elongation (%) | Uniform Strain (%) | Lüders Strain (%) | BH (Mpa) |
|---|---|---|---|---|---|---|---|---|
| A | 4 | 278 | 315 | 347.7 | 33.32 | 17.24 | 2.5 | 37 |
| 10 | 312 | 368 | 369.9 | 14.36 | 4.17 | 1.74 | 56 | |
| 12 | 272 | 358 | 396 | 26.6 | 17.8 | 2.8 | 86 | |
| B | 2 | 200 | 251 | 332.2 | 34.8 | 27.5 | 2.6 | 51 |
| 8 | 281 | 338 | 361.7 | 17.84 | 12 | 2.4 | 57 | |
| C | 2 | 245 | 276 | 334.3 | 30.68 | 24.5 | 12 | 31 |
| 8 | 299 | 374 | 408.7 | 16.72 | 13 | 7 | 75 | |
| D | 8 | 281 | 365 | 399.8 | 30.16 | 22.4 | 5.6 | 84 |
| 12 | 296 | 400 | 434.2 | 25 | 19.5 | 5.4 | 104 | |
| E | 8 | 251 | 301 | 340.9 | 24 | 16.5 | 2.8 | 50 |
| 12 | 309 | 390 | 413.1 | 23.28 | 14.4 | 3.3 | 81 |
Disclaimer/Publisher’s Note: The statements, opinions and data contained in all publications are solely those of the individual author(s) and contributor(s) and not of MDPI and/or the editor(s). MDPI and/or the editor(s) disclaim responsibility for any injury to people or property resulting from any ideas, methods, instructions or products referred to in the content. |
© 2023 by the authors. Licensee MDPI, Basel, Switzerland. This article is an open access article distributed under the terms and conditions of the Creative Commons Attribution (CC BY) license (https://creativecommons.org/licenses/by/4.0/).
Share and Cite
Ghanaei, A.; Edris, H.; Monajati, H.; Hamawandi, B. The Effect of Adding V and Nb Microalloy Elements on the Bake Hardening Properties of ULC Steel before and after Annealing. Materials 2023, 16, 1716. https://doi.org/10.3390/ma16041716
Ghanaei A, Edris H, Monajati H, Hamawandi B. The Effect of Adding V and Nb Microalloy Elements on the Bake Hardening Properties of ULC Steel before and after Annealing. Materials. 2023; 16(4):1716. https://doi.org/10.3390/ma16041716
Chicago/Turabian StyleGhanaei, Afshin, Hossein Edris, Hossein Monajati, and Bejan Hamawandi. 2023. "The Effect of Adding V and Nb Microalloy Elements on the Bake Hardening Properties of ULC Steel before and after Annealing" Materials 16, no. 4: 1716. https://doi.org/10.3390/ma16041716