Abstract
As a new type of pre-reinforcement material for tunnel faces, glass fiber-reinforced polymer (GFRP) bolts can effectively and safely improve the stability of tunnel faces in soft surrounding rocks and speed up excavation. Therefore, in this paper, systematic research is carried out on the bond strength of GFRP bolts in tunnel faces and their relative pre-reinforcement parameters. Firstly, the effects of rebar diameter, anchorage length, and mortar strength on the bonding properties of GFRP bars were studied by indoor pull-out tests. The bond strength–slip curves under different working conditions were obtained, and the curves showed that the ultimate bond strength between GFRP bars and mortar was negatively correlated with the diameter of GFRP bars but positively correlated with the strength of the mortar. In addition, the increase in anchorage length led to a reduction in bonding strength. Secondly, inverse analysis was used to analyse the mechanical parameters of the bond performance of the anchor bars by the finite difference software FLAC3D, and the results indicated that 1/5 of the compressive strength of the GFRP bar grouting body can be taken as the ultimate bond strength to calculate the cohesive strength of the grout. Additionally, the formula of GFRP bar grouting body stiffness was revised. Finally, based on the results of laboratory tests and the inverse analysis, the numerical simulation analysis results showed that the optimal reinforcement configuration for a shallow buried tunnel face surrounded by weak rock is to use GFRP bars with a length of 17 m arranged in the center circle of the tunnel face with a reasonable reinforcement density of 1.0 bolt/m2. The calculation formula of the stiffness and cohesion strength of the GFRP bar grouting body and the reinforcement scheme proposed in this paper can provide a reference for the construction of shallowly buried rock tunnels in soft surrounding rock.
1. Introduction
Excavating a tunnel in soft surrounding rocks can easily loosen the core zone ahead of the tunnel face. The tunnel face would be deformed inward due to being subject to the pressure load arising from the overlaying soil and rocks and become unstable or even collapse. Therefore, it is critical to control the deformation of the surrounding soil and rocks during the excavation procedure. As verified by existing studies, the use of bolts as a reinforcement for the core soil and rocks could effectively control this deformation [1,2], which has given rise to the pre-reinforcement technology of tunnel face bolts.
In engineering projects, steel bars are not a preferred material for tunnel face bolts due to their high shear strength, resistance to cutting, and heavy weight. Conversely, GFRP is an ideal substitution for this purpose because of its light weight, high tensile strength, and easy-to-cut property. A number of researchers have carried out relevant studies on the anchorage performance and reinforcement parameters of GFRP bolts as a part of pre-reinforcement technology in tunnel engineering.
The bonding behavior is paramount to characterizing the mechanical property of GFRP bolts. Xue et al. [3] conducted a series of pull-out tests in different environments, indicating that the new type of GFRP bolts was slightly lower than steel bolts in bond behavior. Shi et al. [4,5] concluded that the proportion coefficient of bond strength between steel bolts and GFRP bolts is 1.2–1.5 by performing several pull-out tests in concrete specimens. The experimental tests by Zhang et al. [6] revealed the influence of bond length, bolt diameter, thread pitch, thread depth, sandblasting amount and concrete strength on the bond behavior of GFRP bolts and concrete. Nguyen et al. [7] indicated that the bond strength between a fiber and concrete matrix depends not only on the properties of the slurry but also on the shape and surface of the fiber. Bai et al. [8] carried out a full-scale pull-out test to investigate the bond and anchorage performance between GFRP anti-floating bolts and a concrete base plate. It was demonstrated that the working effect of GFRP bolts with concrete was superior to steel bolts. Shakiba et al. [9] found that the strength of concrete affects the failure modes during the pull-out test of the anchorage specimen. The failure of high-strength concrete is due to the shedding of the surface of GFRP bars, while the failure of low-strength concrete is due to the crushing of concrete. Kuang et al. [10] found that the ultimate bearing capacity and the average bond strength of the first interface of GFRP anchor bars are 25 kN, 9.4% higher than those of steel anchors, respectively, but the average bond strength of the second interface of steel anchors is slightly higher than that of GFRP anchor bars. Kim et al. [11] found that the appropriate water-to-cement ratio can improve the bond strength between GFRP bars and concrete. When the water-to-cement ratio is constant, the increase in concrete strength results in the increase in bond strength between concrete and GFRP bars. Ho et al. [12] adopted a numerical simulation method to analyze the influence of confining conditions on the mechanical properties and failure mechanism of bolt-mortar interfaces. Sjolander et al. [13] studied both the reinforcement and bond performance of GFRP bolts by varying the bending fracture energy and interactive fracture energy in the interfaces between shotcrete and the stratum. Yokota et al. [14] adopted laboratory shear tests and discontinuous deformation analysis to study the mechanical properties of the interface between rock bolts and the bond materials. By using the Kelvin solution, Wang et al. [15] proposed a new method to describe the mechanical property of the grouting GFRP bolts subject to the interaction of prestress and dynamic load.
In addition to the bonding behavior of GFRP bolts, a large number of studies have also focused on the application of pre-reinforcement technology in tunnel engineering. Chen et al. [16,17] studied the effect of tunnel face GFRP bolts on the stratum deformation caused by excavation by using a finite element simulation and found that the tunnel face GFRP bolts could effectively strengthen the core soil ahead of the tunnel face and thus control the stratum deformation caused by tunnel excavation. Chen et al. [18] studied the reinforcement effects of grouting, small pipes, front bolts, and other combination measures on the tunnel face. The results suggested that the front bolts outperformed the small pipes in the deformation control of the tunnel face. Li et al. [19,20] studied the influence of GFRP bolts’ reinforcement length, density, scope, and axial stiffness on the stability of a soft tunnel face based on theoretical analysis and numerical simulations. Zhang et al. [21] found that the safety factor of a tunnel face is positively correlated with the friction angle, cohesion, bolt length, and the number of bolts. However, if the bolt length and the bolt density exceed the optimal values, the safety level would not be greatly improved; on the contrary, it would increase the construction cost. Zhang et al. [22] proposed that bolt support can reduce both the support pressure of the tunnel face and the stress release degree of the surrounding rock and thus further reduce the failure zone range. Based on finite difference analysis, Kitchah et al. [23] found that the tunnel face bolts outperformed an umbrella arch in reducing the settlement of the tunnel crown, and using GFRP bolts to reinforce the advance core could reduce the deformation in the ground mass, including extrusion and settlement. Anagnostou et al. [24] compared both theoretical and numerical simulation results regarding the bond strength and proposed a design nomogram with the uniform arrangement of bolts in a homogeneous ground, constant or alterable bond strength, and various degrees of tunnel face stability in different erection sequences. Perazzelli et al. [25] suggested a new method to reinforce the tunnel face with bolts. This novel configuration method could be used for tunnel face bolts in any reinforcement spacing, length, and erection sequence in different environmental settings (e.g., rich water leakage environments, cohesive-frictional soils, soft surrounding rocks). Sun et al. [26] built up a mechanical mode of surrounding rocks for sea bottom tunnels by taking into account the combined influence of stratum reinforcement and leakage effects. The sensitivities of reinforcement parameters were studied on tunnel surrounding rocks. Xu et al. [27] proposed the scheme of adding prefabricated corrugated steel plates to the supporting structure. Prefabricated corrugated steel plates can effectively ensure the stability of the tunnel face and surrounding rock, reduce its convergence deformation, and ensure the safety of subway tunnel construction through numerical simulations and field verifications. Wang et al. [28] proposed a 3D rotational silo-torus stability model for the face analysis of circular tunnel faces constructed under cohesive-frictional soils. Centrifugal tests and numerical simulations showed that the model can accurately capture the failure modes of the roadway working face. Chen et al. [29] analyzed the potential influencing factors for the stability of tunnel faces based on the limit analysis technique. The analysis results indicated that the tunnel face bolts could significantly improve the stability of surrounding rocks.
The existing research mainly focuses on pull-out tests to study the bond behavior between steel/GFRP bolts and concrete. It should be noted that GFRP bolts and steel bolts greatly differ in bonding performance. Additionally, in tunnel construction, the cement mortar used in the bolt grout segments does not contain coarse aggregates. Considering the fact that the mechanical behavior of bolt grout (i.e., cement mortar) is generally different from that of concrete, the bonding performance between cement mortar and GFRP bolts should be further examined. Additionally, regarding the application of pre-reinforcement technology (e.g., the tunnel face GFRP bolts) in tunnel engineering, currently available studies mainly employed simulation-based methods, in which the bonding parameters are evaluated for the steel bolts instead of GFRP bolts. As mentioned previously, this may lead to significant discrepancies in the bond performance, entailing the need for a systematic investigation regarding the material parameters of GFRP bolts.
In this study, the effects of rebar diameter, anchorage length, and mortar strength on the bonding properties of GFRP bars were studied based on the pull-out tests of GFRP bars. Then, the bond pull-out tests of GFRP bars were simulated by the finite difference software FLAC3D 7.0. An inverse analysis was subsequently performed in order to reasonably quantify the mechanical parameters of GFPR bars with the mortar grouting body. Finally, the effects of length, reinforcement density, and range of GFRP reinforcement on the face of a shallowly buried tunnel in a soft stratum were studied by FLAC3D.
2. Experimental Program
2.1. Test Design
The literature [4] pointed out that the main factors influencing the bolt bond behavior include mortar strength and anchorage length. To study these factors, the test adopted GFRP bolts in diameters of 22 mm, 25 mm, and 28 mm in different lengths and cement mortar in strength grades of M15, M20, and M25 (M15 denotes that the mortar’s average comprehensive strength is 15 MPa). The test conditions are shown in Table 1.

Table 1.
GFRP pull-out test conditions.
2.2. Material and Specimen Parameters
2.2.1. GFRP Parameters
Before the bond pull-out test on GFRP, 6 specimens of bolts in each diameter were taken for the reinforcement pull-out test to obtain the basic mechanical parameters of the reinforcement bolts, summarized in Table 2.
Table 2.
Mechanical parameters of GFRP in different diameters.
2.2.2. Mortar Mix Proportions
All mortar samples in the test consisted of medium-grained sand, ordinary Portland cement, and polycarboxylic water reducer. For the mortar mix proportions in different strength grades, see Table 3.
Table 3.
Mortar mix proportions in different strength grades.
2.2.3. Specimen Parameters
The test shape of the specimen was cuboid, with four different sizes: 0.3 m × 0.3 m × 0.5 m, 0.3 m × 0.3 m × 1 m, 0.3 m × 0.3 m × 1.5 m, and 0.3 m × 0.3 m × 2 m. For each size, three samples were produced for each dimension following the ‘Standards for Test Method for Concrete Structures’ [30], as shown in Figure 1. In addition, the steel casing was set at the free end of the bar in order to avoid the bar being clipped during the loading process.
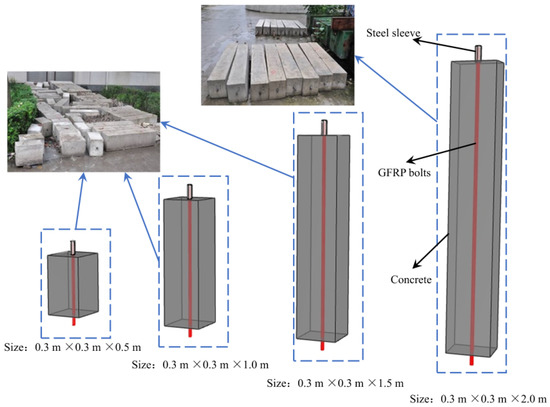
Figure 1.
Specimen appearance.
2.3. Loading and Measurement
A hollow jack was used for one-way, stepwise loading until the failure of the reinforcement bolts, with each loading step at about 0.2 MPa. In the test process, the bolt pull-out displacement at each loading step was measured and recorded, as illustrated in Figure 2.
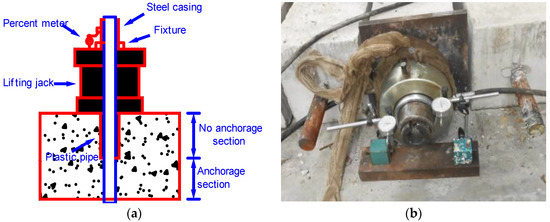
Figure 2.
Hydraulic loading system. (a) Loading system diagram. (b) Specimen loading.
3. Experimental Results and Discussion
The test results are shown in Table 4.
Table 4.
Results of Bond and Pull-out Test on GFRP Bolts.
The bond strength is calculated according to the following equation [3]:
where F is the pull-out resistance, l is the anchorage length, and d is the bolt’s diameter.
3.1. Analysis of the Influence of the Bolt Diameters on GFRP Bond Behavior
Specimens with anchorage lengths of 0.5 m were selected for analysis. The ultimate bond strength of bolts with different diameters is shown in Figure 3. The bond strengths of GFRP bolts with diameters of 22 mm, 25 mm, and 28 mm are 3.21 MPa, 2.80 MPa, and 2.69 MPa, respectively, when the mortar strength is M15. The bond strengths of GFRP bolts with diameters of 22 mm, 25 mm, and 28 mm are 5.19 MPa, 4.75 MPa, and 4.71 MPa, respectively, when the mortar strength is M20. Regarding the M28 mortar, the bond strength of GFRP bolts with diameters of 22 mm, 25 mm, and 28 mm are 6.28 MPa, 5.97 MPa, and 5.35 MPa, respectively. It can be seen from the results that with the increase in bolt diameter, the ultimate bond strength decreases. That is because the relative bond area between the bolt and mortar decreases (Equation (2)) when the bolt diameter increases, thus leading to a decrease in the bond strength.
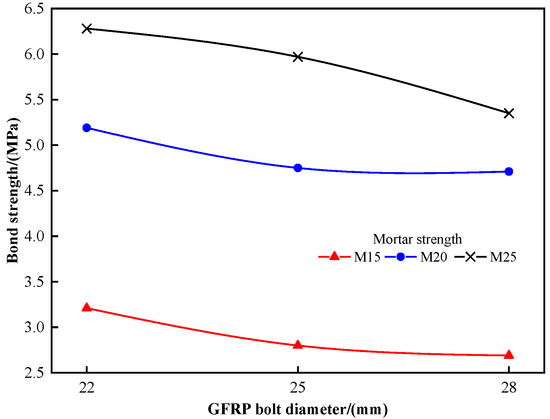
Figure 3.
Relationship between bond strength and reinforcement diameter.
3.2. Influence of Mortar Strength on GFRP Bond Behavior
The test results of specimens with anchorage lengths of 0.5 m and GFRP bolt diameters of 22 mm are adopted for analysis. The bond strength-sliding curves in different mortar strengths are shown in Figure 4, which indicates that the ultimate bond strength increases along with the increase in the mortar strength upon failure. That is because, in the pull-out process, the bond strength is mainly supported by the chemical adhesive strength in the interface between the bolt and mortar. Once the mortar strength increases, the chemical adhesive strength between the bolt and mortar increases, and so does the bond strength.
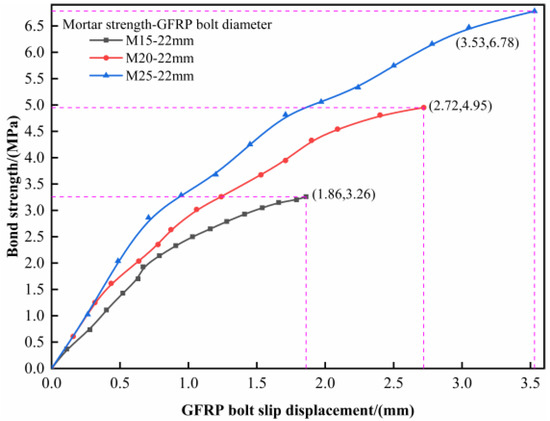
Figure 4.
Relationship between bond strength and mortar strength.
3.3. Influence Analysis of Anchorage Length on GFRP Bond Behavior
Figure 5 shows the bond behavior of the M20 mortar. With the increase in anchorage length, the bond strength was reduced in a nonlinear manner. This is because the bond strength is not uniformly distributed along the steel bar shaft but concentrated in the front end [31,32]. When the anchorage length is relatively short, the bond strength tends to be uniformly distributed. With the increase in the length, the bond strength between the GFRP bolt and anchorage body becomes nonlinearly distributed, thus leading to the insufficiency of the bond strength.
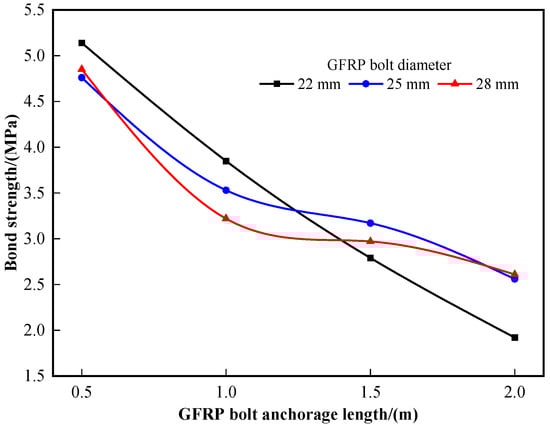
Figure 5.
Relationship between anchorage length and bond strength.
3.4. Analysis of Failure Modes of Specimens
There are three failure modes of specimens after loading: GFRP bolts pulling out, GFRP bolts breaking, and mortar splitting. The failure modes and their proportions are shown in Figure 6 and Figure 7.
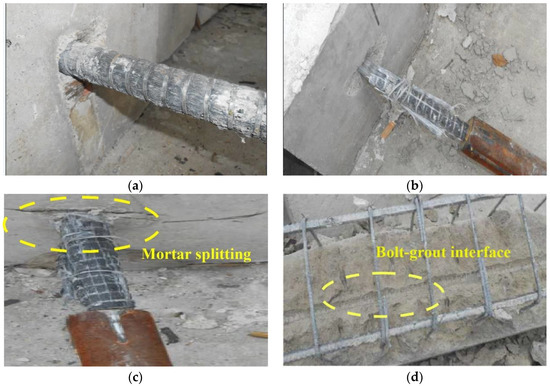
Figure 6.
Failure modes of specimens. (a) GFRP bolt pulling out. (b) GFRP bolt breaking. (c) Mortar splitting. (d) Bolt-grout interface.
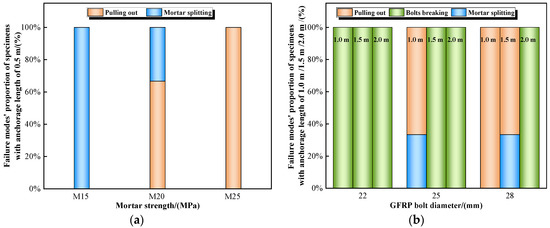
Figure 7.
Proportion of specimens’ failure modes. (a) Anchorage length = 0.5 m. (b) Anchorage length = 1.0 m, 1.5 m, 2.0 m.
In the process of pulling out, a relatively larger radial stress occurs on the ribbed GFRP bolts. If the specimen strength and mortar thickness are not adequate, mortar split failure can occur, and the bond behavior of GFRP bolts is yet to give a full play. Therefore, in real engineering, it is important to reasonably select the mortar strength and anchorage length to avoid split failure.
4. Parameter Analysis of the GFRP Bolt Bond Behavior Based on FLAC3D
In FLAC3D, it is common to set up grouting body parameters for cable elements so as to reflect the bond behavior between the steel bars and mortar. However, GFRP bolts and steel bars differ from each other essentially, and so do their bond behaviors. During the actual construction period, grade M20 mortar with an anchorage length of 0.5 m is often adopted for the grouting body of tunnel face bolts because of its safety and cost. Therefore, based on the results from the laboratory tests on specimens with anchorage lengths of 0.5 m, this paper adopts FLAC3D to simulate the bond behavior and conducts inverse analysis to propose the parameters of the GFRP bolt bond behavior that are suitable in FLAC3D.
4.1. Numerical Model for the Pull-Out Test
The numerical model for the pull-out test is shown in Figure 8. The mortar specimen was simulated using a solid element with dimensions of 0.3 m × 0.3 m × 0.6 m. The Mohr–Coulomb model was employed as the constitutive model, and the normal constraints were put at the free end of the reinforcement bolts. The GFRP bolt was simulated in a cable element with an anchorage length of 0.5 m, and the ideal elastic–plastic model was adopted.
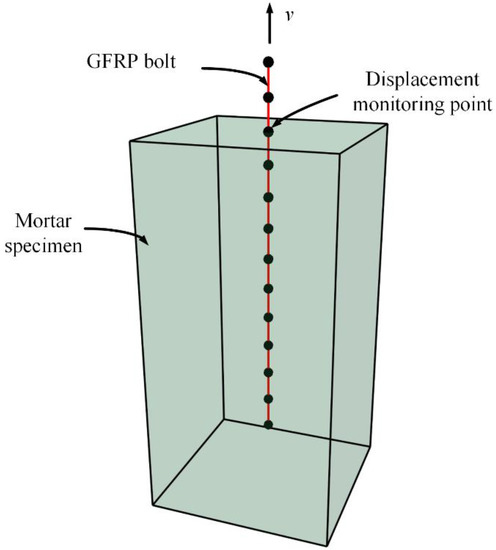
Figure 8.
Numerical model of pull-out test on GFRP bolts.
As shown in Figure 8, one end of the GFRP bar was pulled out with speed V until the connection between the bolt and the mortar specimen was broken [33]. Monitoring points were set on the contact surface between GFRP bars and mortar specimens to record the displacement changes of anchors during the drawing process. Finally, the bond strength of the bolt was calculated by writing the fish function to obtain the bond strength versus the slip displacement curve.
In FLAC3D, the bond strength between reinforcement bolts and mortar is mainly related to the four parameters of grout perimeter, grout frictional angle, grout stiffness in unit length, and grout cohesion in unit length, among which the grout perimeter is ascertained by the actual borehole diameter, D. Here, the borehole diameter D is taken as 60 mm as per engineering practices, and as the literature [34] points out when the confining pressure on the specimen is 0, the influence of the grout frictional angle on the bolt pull-out behavior is negligible, so this case is not discussed here.
Therefore, the inverse analysis mainly focuses on the grout stiffness kg in unit length and the grout cohesion cg in unit length to ensure that the simulation results of the bond strength–slip relationship resulting from numerical calculations are as close as possible to those from the laboratory test.
Assuming that no failure occurs in the interface between the grout and surrounding rocks, and reinforcement bolts are bonded tightly in the mortar, the grout cohesion of ordinary steel bolts can be calculated as per the following equation [33]:
where d is the reinforcement bolt diameter; is the ultimate bond strength, which is usually obtained by a pull-out test and can also be taken as 0.5 times the grout’s compressive strength when there is a lack of pull-out test data.
For ordinary steel bolts, assuming that the slippage and the pull-out resistance are in a linear relationship, the grout stiffness can be inferred by elastic mechanics and calculated as follows [33]:
where G is the grout’s shear modulus, d is the reinforcement bolt’s diameter, and t is the grout’s thickness.
Meanwhile, in FLAC3D, due to the influence of the relative shear displacement between the host-domain grid points and the borehole surface, it is a common practice in the calculation of grout stiffness to multiply Formula (4) by the reduction factor (see Equation (5)). For ordinary steel bolts, the reduction factor is often taken as 0.1 [33].
4.2. Inverse Analysis on cg, the Grout’s Cohesion in Unit Length
The grout cohesion is denoted as cg1 when takes the ultimate value in the bond strength test and as cg2 when takes the value of 0.5 times the mortar’s compressive strength. The values of grout cohesion under different conditions are summarized in Table 5, which indicates that cg2 is always greater than cg1, and the average specific value is 2.4.
Table 5.
Calculated values of grout cohesion under different conditions.
Based on the pull-out test results, the M20 mortar specimen was selected for this study. The grout stiffness remains unchanged in the process of the simulation. cg1 is multiplied by different reduction factors to study the influence of grout cohesion on the values of simulated extreme bond strength of reinforcement bolts. The simulation parameters are given in Table 6, and the simulation results are shown in Figure 9.
Table 6.
Grout parameters for mortar specimen M20.
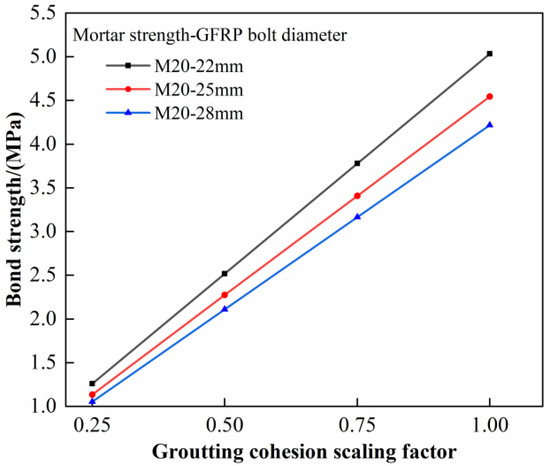
Figure 9.
Relationship between computed ultimate bond strength and grout cohesion.
The inverse analysis indicated that the ultimate bond strength of the specimen increased with an increase in the grout cohesion. When the grout cohesion is taken as cg1, the ultimate bond strength corresponds with the test values. Additionally, from Figure 9, it can be seen that the ratio of different grout cohesions equals the ratio of the corresponding ultimate bond strength, i.e.,:
Equation (6) shows that if cg2 is taken as the grout cohesion, the ultimate bond strength of GFRP bolts in the numerical simulation is amplified by an average ratio of 2.4. Therefore, to ensure the simulation result is close to the real data, cg2 shall be divided by 2.4; in other words, in case of insufficiency of test data, the ultimate bond strength of reinforcement bolts shall be taken as 1/5 of the grout’s compressive strength.
4.3. Inverse Analysis of the Grout’s Stiffness
To obtain reasonable values of grout stiffness for GFRP bolts, the grout cohesion remained unchanged in the numerical simulation, and the bond strength–slippage curve in different grout stiffness was obtained by way of changing the reduction factors in Equation (5). The actual reduction factors can be determined by comparing them with the experimental data. The simulation results are shown in Figure 10. The results show that the analysis results are in good agreement with the test results when the reduction factor is within the range of
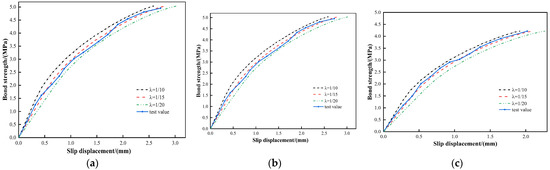
Figure 10.
Inverse analysis results of the grout stiffness. (a) M20-22. (b) M20-25. (c) M20-28.
5. Numerical Analyses on Pre-Reinforcement Technology of Tunnel Face Bolts
Based on the research into the bonding behavior of GFRP bolts in the previous sections, a case study based on the Chenggong tunnel in Kunming, China, is investigated to study the systematic influence of the reinforcement parameters, including reinforcement length, reinforcement density and reinforcement range, on the structural behavior of a shallowly buried tunnel.
5.1. Establishment of Numerical Model
The numerical model is shown in Figure 11. Considering the boundary effects [35,36], the model is 74 m long, 50 m high and 60 m wide. The upper surface of the model is taken to the ground without any constraints. The four lateral faces are fixed by roller supports, while the bottom face is fixed by pinned supports. Except for the surrounding rock, which adopts the Mohr–Coulomb model as its constitutive mode, the other elements adopt the isotropic elastic model as their constitutive model. The parameters of the surrounding rock and initial support are shown in Table 7.
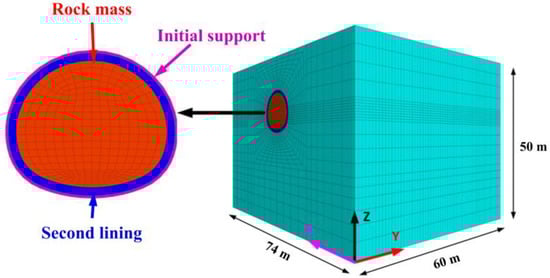
Figure 11.
Numerical analysis of model.
Table 7.
Parameters of surrounding rock and initial support.
5.2. GFRP Bolts’ Reinforcement Length
- (1)
- Failure mode analysis of shallow tunnel face in soft surrounding rock
Figure 12a shows a failure model of a shallow tunnel face in soft surrounding rock established by Davis [37], where CD is the tunnel face, the right-angle trapezoid ABCE and the isosceles triangle ECD are the disturbed surrounding rock, C is the buried depth of the tunnel, H is the tunnel’s height, is the minimum horizontal stress required for the stability of tunnel face, , and .
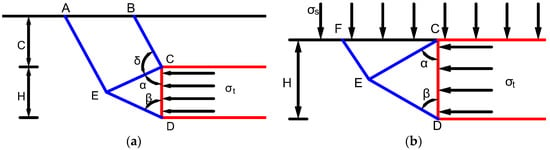
Figure 12.
Failure model of shallow tunnel face in soft surrounding rock. (a) Failure mode diagram. (b) Simplified failure mode diagram.
As the face bolts are only arranged in the range of the tunnel face, this paper simplifies the model in Figure 12a. The overlaying soil is simplified as a uniform load acting on the top of the tunnel face, and only the stability of surrounding rock within the height of the tunnel face is studied. The simplified model is shown in Figure 12b, and model parameters are the same as those in Figure 12a.
- (2)
- Analysis of reinforcement length based on theoretical values
To make the reinforcement effective, the tunnel face bolts should pass through the fracture surface (line FED in Figure 12b) and enter a certain depth of stable surrounding rock. Based on the analysis, combined with the actual situation of the Chenggong Tunnel, the theoretical method is used to study the tunnel face bolts’ reinforcement length. The tunnel height H =12 m, and the depth to which the tunnel is buried is C =10 m. The maximum depth of the fracture surface is obtained as follows:
It should be noted that there is no relevant specification to explain the length parameters of a bolt-reinforced tunnel face in tunnel engineering. Considering the similarity between the tunnel face support and the foundation pit support, the anchorage length of the bolt is determined to be not less than 1.5 m according to the ‘Technical Specification for Retaining and Protection of Building Foundation Excavations’ [38]. Therefore, the minimum theoretical reinforcement length in the tunnel vault is taken as follows:
Considering the safety of the tunnel, the face bolts’ length distributed along the tunnel height is uniformly taken as 17.0 m.
- (3)
- Analysis of reinforcement length based on numerical simulation
The extrusion displacement of the target face while tunneling (y = 20 m) is shown in Figure 13. We can conclude that the farther the tunnel face is away from the target face, the smaller the extrusion displacement of the target face is. When the tunnel excavation is about 16 m away from the target face, the extrusion displacement of the target face is less than 1/10 of the maximum extrusion displacement. Therefore, it can be considered that when the tunnel face is 16 m away from the target face or more, the surrounding rock behind the target face can be considered undisturbed.
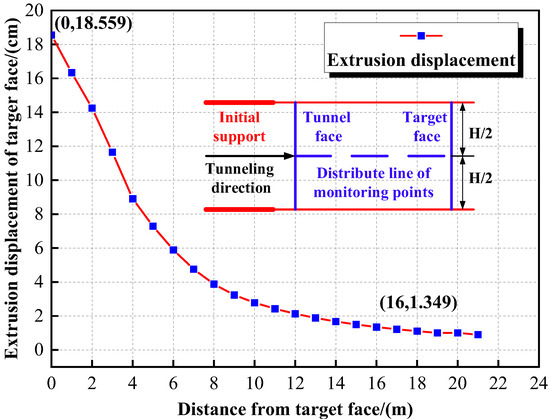
Figure 13.
Extrusion displacement of the target face.
Figure 14 shows the distribution of the plastic zones of the surrounding rock after excavation without any supports. It indicates that the maximum distribution depth of the plastic zone in the tunneling direction is 17 m (the mesh size of the tunneling direction is 1 m per grid).
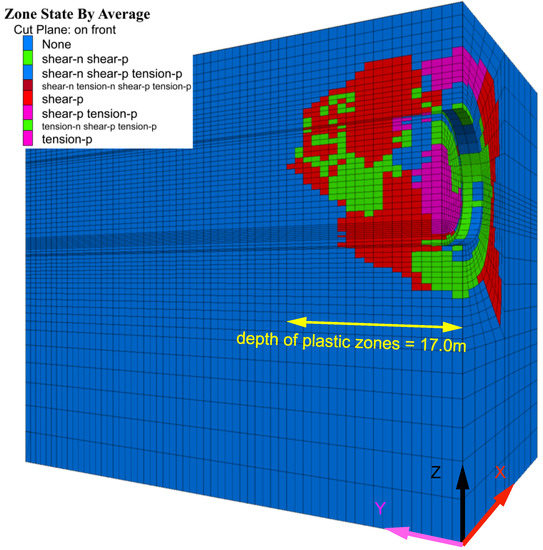
Figure 14.
Distribution of plastic zones without support.
The reinforcement length of the tunnel face bolts should not only meet the specification requirements but also meet the requirements of the depth of the plastic zones and undisturbed surrounding rock. Therefore, based on the theoretical analysis and numerical calculation results, the reinforcement length of the tunnel face bolts is taken as 17 m.
5.3. GFRP Bolts’ Reinforcement Density
To prevent the extrusion failure of the tunnel face, the horizontal support stress provided by the tunnel face bolts should not be less than. Referring to existing studies [39,40,41], the number of tunnel face bolts required to maintain the stability of the tunnel face is calculated based on the minimum support stress of the tunnel face. Additionally, the reinforcement effectiveness under different face bolt numbers is discussed by numerical simulation to optimize the number of face bolts.
- (1)
- Analysis of the face bolts’ number based on theoretical analysis
The calculation model of is shown in Figure 11b and is calculated as follows [42,43]:
where the tunnel depth C = 10 m, the tunnel face height H = 12 m, the volumetric weight kN/m3, and the undrained shear strength kPa. Thus, kPa.
The anchoring capacity of the tunnel face bolts is mainly dependent on the minimum value between the tensile strength of the reinforcement and the bond strength of the bolt–grout interface. Therefore, the number of tunnel face bolts shall be calculated according to Equation (10).
where is the horizontal support stress of the tunnel face, n is the number of face bolts, A is the cross-area of a single GFRP bar, and is the lateral area of a single GFRP bar. Other calculation parameters are given in Table 8.
Table 8.
Calculation parameters of GFPR face bolts.
For a single bolt, the pull-out force and the shear force provided by the grout can be obtained by Equation (11):
Thereby, from Equation (12), we can obtain:
As the tunnel face bolt technology is a kind of temporary pre-reinforcement support, its factor of safety is taken as 1.4 based on the provisions of Technical Specification for Retaining and Protection of Building Foundations Excavations [37].
- (2)
- Analysis of face bolts’ number based on numerical simulation
Based on the theoretical number of tunnel face bolts, the effectiveness of reinforcement under five operating conditions, such as 77, 90, 112, 150, and 187 face bolts, is discussed to determine the optimized number of face bolts. The calculation model and bolt parameters are the same as above. Calculation results are shown in Figure 15 and Table 9.
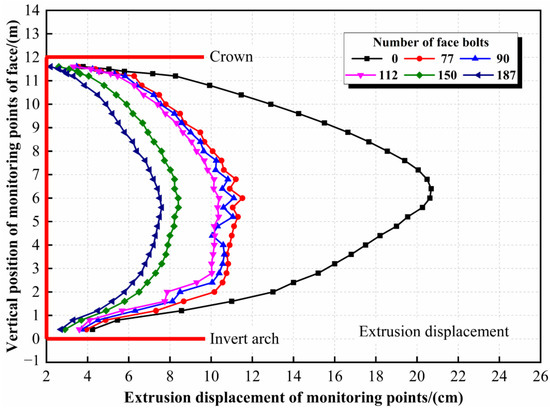
Figure 15.
Extrusion displacement of target face under different conditions.
Table 9.
Maximum displacement and reinforcement effectiveness of tunnel face.
The results indicate that the reinforcement effectiveness is proportional to the number of tunnel face bolts. When the number of bolts is less than 150, there is no obvious difference in reinforcement effectiveness under different working conditions. Additionally, when the bolt number reaches 150, the reinforcement effectiveness is significantly improved. However, when the bolt number continues to increase to 187, the reinforcement effectiveness does not improve significantly. Therefore, considering the safety and cost, the number of bolts should be 150; that is, the reinforcement density is 1.0 bolt/m2.
5.4. GFRP Bolts’ Reinforcement Range
As shown in Figure 16, in the full-face excavation process of the tunnel, the maximum extrusion deformation occurs in the lower middle part of the face. In engineering practice, full-section reinforcement is generally adopted to ensure construction safety. Although the reinforcement effectiveness is ideal, the cost-effectiveness is poor. Therefore, a reinforcement measure that can ensure construction safety and cost shall be determined.
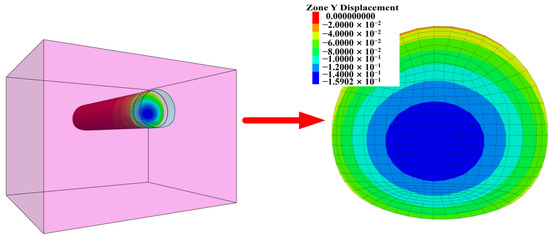
Figure 16.
Extrusion displacement contour of tunnel face.
Reinforcement effectiveness under three kinds of reinforcement range, i.e., upper reinforcement (Figure 17a), lower reinforcement (Figure 17b), and central round reinforcement (Figure 17c), were studied through numerical simulations.
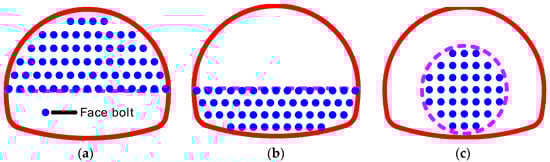
Figure 17.
Different reinforcement range. (a) Upper reinforcement. (b) Lower reinforcement. (c) Central round reinforcement.
The reinforcement density and reinforcement area in three working conditions are assumed to be equal, which are half of the tunnel face area and 1.0 bolt/m2, respectively. The calculation model and bolt parameters are the same as above.
Figure 18 shows reinforcement effectiveness under three working conditions, and the maximum extrusion displacements of the target face are also indicated in the figure. Both the upper reinforcement and the lower reinforcement can only control the extrusion displacement of the reinforced area, and the maximum extrusion displacement reduction rate is 14.0% and 40.8%, respectively; the reinforcements’ effectiveness on the unreinforced area is insignificant. The central round reinforcement has a good inhibition effect on the whole tunnel face, and the maximum extrusion displacement reduction rate is about 51.6%. In addition, the extrusion displacement curve form of the central round reinforcement is consistent with that of the full-face reinforcement. Considering the safety and cost, the central round reinforcement represents the optimized reinforcement range.
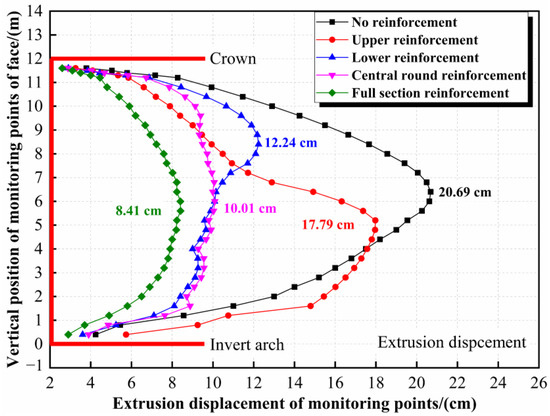
Figure 18.
Extrusion displacement of target face under different reinforcement ranges.
6. Conclusions
The effects of rebar diameter, anchorage length, and mortar strength on the bonding properties of GFRP bars were studied based on the indoor bond pull-out tests of GFRP bars. Then, the bond pull-out tests of GFRP bars were simulated by the finite difference software FLAC3D, and the inverse analysis of related anchorage parameters in numerical calculations was carried out. We also presented formulas for calculating the stiffness and cohesive strength of the GFRP bar grouting body. Based on the results of inversion analysis, the optimal reinforcement length, the reasonable reinforcement density, and the reasonable reinforcement range of the GFRP bar anchors were analytically determined in the shallow soft surrounding rock. The main conclusions include the following:
- (1)
- Laboratory test results show that when the anchorage length is constant, the ultimate bond strength between GFRP bolts and mortar is negatively correlated with bolt diameter and positively correlated with mortar strength, and when the bolt diameter and mortar strength are constant, the bond strength is in a nonlinear downtrend with the increase in the anchorage length.
- (2)
- Split failures occur in all M15 mortar specimens when the anchorage length is 0.5 m. As a result, that grade mortar shall be avoided as the grouting body during real construction. In addition, by analyzing the proportion of failure modes of specimens, it is concluded that in engineering practice, the strength of the mortar used as grouting material shall be greater than M20. When M20 mortar is used as grouting material, the minimum anchorage length of GFRP bolts with diameters of 22 mm, 25 mm, and 28 mm are 1.0 m, 1.5 m, and 2.0 m, respectively.
- (2)
- Based on the ultimate bond strength of GFRP bars and mortar obtained from laboratory tests, the mechanical parameters of GFRP bars and the mortar grouting body are obtained by inverse analysis. Among them, the cohesive strength of the grouting body can be calculated by 1/5 of the compressive strength of the grouting body as the ultimate bond strength. The stiffness of the grouting body can be obtained by multiplying the stiffness formula of the grouting body of the reinforced bolt-concrete pull-out model with the reduction factor, and the range of the reduction factor is
- (4)
- A failure model of a shallow tunnel face in a soft stratum is established to determine the reasonable reinforcement length by simplifying the tunnel face failure model proposed by Davis. Considering the construction safety and cost, the optimum reinforcement length is taken as 17 m, the reasonable reinforcement density is 1.0 bolt/m2, and the GFRP bolts are anchored in the range of the central round.
Author Contributions
Conceptualization, H.L. and J.F.; Data curation, H.L.; Formal analysis, Z.Z.; Funding acquisition, H.L. and X.Z.; Investigation, X.Z. and Z.Z.; Methodology, H.L. and J.F.; Resources, X.Z.; Software, J.F.; Supervision, L.L. and Z.Z.; Visualization B.C. and J.F.; Writing—original draft H.L. and J.F.; Writing—review & editing L.L. and B.C. All authors have read and agreed to the published version of the manuscript.
Funding
Financial support for this research is provided by the National Natural Science Foundation of China (Grant No. 51608450) and the Natural Science Foundation of Sichuan, China (Grant No. 2022NSFSC0443).
Institutional Review Board Statement
Not applicable.
Informed Consent Statement
Not applicable.
Data Availability Statement
Not applicable.
Conflicts of Interest
The authors declare no conflict of interest.
References
- Lunardi, P. Design and Construction of Tunnels: Analysis of Controlled Deformations in Rock and Soils (ADECO-RS); Springer Science & Business Media: Milano, Italy, 2008; ISBN 978-3-540-73875-6. [Google Scholar]
- Sjölander, A.; Hellgren, R.; Malm, R.; Ansell, A. Verification of Failure Mechanisms and Design Philosophy for a Bolt-Anchored and Fibre-Reinforced Shotcrete Lining. Eng. Fail. Anal. 2020, 116, 104741. [Google Scholar] [CrossRef]
- Xue, W.; Liu, H.; Wang, X. Studies on bond properties of new type FRP bars. J. Build. Struct. 2004, 25, 104–109+123. [Google Scholar] [CrossRef]
- Shi, X.; Zhang, Z.; Li, Z.; Li, H. Research on pull-out test of bonding strength between GFRP bars and concrete. Railw. Eng. 2010, 133–136. [Google Scholar] [CrossRef]
- Shi, X.; Zhang, Z.; Li, H. Experimental study of pre-reinforcement technology for weak surrounding rock of tunnel. Chin. J. Rock Mech. Eng. 2011, 30, 1803–1809. [Google Scholar]
- Zhang, W.; Meng, S.; Shen, F.; Jin, S.; Xin, R. Study on bonding performance between GFRP threaded bolts and cement concrete. Guangdong Archit. Civ. Eng. 2018, 25, 56–59. [Google Scholar] [CrossRef]
- Nguyen, N.T.; Bui, T.-T.; Bui, Q.-B. Fiber Reinforced Concrete for Slabs without Steel Rebar Reinforcement: Assessing the Feasibility for 3D-Printed Individual Houses. Case Stud. Constr. Mater. 2022, 16, e00950. [Google Scholar] [CrossRef]
- Bai, X.; Kuang, Z.; Zhang, M.; Wang, Y.; Liu, J.; Yan, N. Experimental investigation for the bonding and anchoring property of the full-thread GFRP anti-floating anchor in concrete floor. Mater. Rep. 2019, 33, 3035–3042. [Google Scholar] [CrossRef]
- Shakiba, M.; Hosseini, S.M.; Bazli, M.; Mortazavi, S.M.R.; Ghobeishavi, M.A. Enhancement of the Bond Behaviour between Sand Coated GFRP Bar and Normal Concrete Using Innovative Composite Anchor Heads. Mater. Struct. 2022, 55, 236. [Google Scholar] [CrossRef]
- Kuang, Z.; Zhang, M.; Bai, X. Load-Bearing Characteristics of Fibreglass Uplift Anchors in Weathered Rock. Proc. Inst. Civ. Eng. -Geotech. Eng. 2020, 173, 49–57. [Google Scholar] [CrossRef]
- Kim, J.; Jeong, S.; Kim, H.; Kim, Y.; Park, S. Bond Strength Properties of GFRP and CFRP according to Concrete Strength. Appl. Sci. 2022, 12, 10611. [Google Scholar] [CrossRef]
- Ho, D.-A.; Bost, M.; Rajot, J.-P. Numerical Study of the Bolt-Grout Interface for Fully Grouted Rockbolt under Different Confining Conditions. Int. J. Rock Mech. Min. Sci. 2019, 119, 168–179. [Google Scholar] [CrossRef]
- Sjölander, A.; Ansell, A. Numerical Simulations of Restrained Shrinkage Cracking in Glass Fibre Reinforced Shotcrete Slabs. Adv. Civ. Eng. 2017, 2017, e8987626. [Google Scholar] [CrossRef]
- Yokota, Y.; Zhao, Z.; Nie, W.; Date, K.; Iwano, K.; Okada, Y. Experimental and Numerical Study on the Interface Behaviour between the Rock Bolt and Bond Material. Rock Mech. Rock Eng. 2019, 52, 869–879. [Google Scholar] [CrossRef]
- Wang, W.; Song, Q.; Xu, C.; Gong, H. Mechanical Behaviour of Fully Grouted GFRP Rock Bolts under the Joint Action of Pre-Tension Load and Blast Dynamic Load. Tunn. Undergr. Space Technol. 2018, 73, 82–91. [Google Scholar] [CrossRef]
- Chen, T.; Mei, Z.; Li, C. Application research of full section pre reinforcement technology with glass fiber anchor in tunnel. Mod. Tunn. Technol. 2008, 45, 226–231. [Google Scholar] [CrossRef]
- Chen, T.; Mei, Z. Three-dimensional numerical simulation for full-face pre-reinforcing by free-cutting bolts in tunneling. Mod. Tunn. Technol. 2008, 45, 22–27. [Google Scholar] [CrossRef]
- Chen, W.; Wang, M.; Zhang, L.; Wei, L.; He, Y. Influence of pre-reinforcement measures on excavation stability of tunnelling. Chin. J. Rock Mech. Eng. 2009, 28, 1640–1645. [Google Scholar] [CrossRef]
- Li, B.; Qi, T.; Wu, Z.; Tang, J. Method for determination of reinforcement parameters of fiber glass anchor bar for tunnel face. J. China Railw. Soc. 2012, 34, 115–121. [Google Scholar] [CrossRef]
- Li, B.; Hong, Y.; Gao, B.; Qi, T.Y.; Wang, Z.Z.; Zhou, J.M. Numerical Parametric Study on Stability and Deformation of Tunnel Face Reinforced with Face Bolts. Tunn. Undergr. Space Technol. 2015, 47, 73–80. [Google Scholar] [CrossRef]
- Zhang, X.; Wang, M.; Wang, Z.; Li, J.; Tong, J.; Liu, D. A Limit Equilibrium Model for the Reinforced Face Stability Analysis of a Shallow Tunnel in Cohesive-Frictional Soils. Tunn. Undergr. Space Technol. 2020, 105, 103562. [Google Scholar] [CrossRef]
- Zhang, X.; Wang, M.; Lyu, C.; Tong, J.; Yu, L.; Liu, D. Experimental and Numerical Study on Tunnel Faces Reinforced by Horizontal Bolts in Sandy Ground. Tunn. Undergr. Space Technol. 2022, 123, 104412. [Google Scholar] [CrossRef]
- Kitchah, F.; Benmebarek, S. Finite Difference Analysis of an Advance Core Pre-Reinforcement System for Toulon’s South Tube. J. Rock Mech. Geotech. Eng. 2016, 8, 703–713. [Google Scholar] [CrossRef]
- Anagnostou, G.; Perazzelli, P. Analysis Method and Design Charts for Bolt Reinforcement of the Tunnel Face in Cohesive-Frictional Soils. Tunn. Undergr. Space Technol. 2015, 47, 162–181. [Google Scholar] [CrossRef]
- Perazzelli, P.; Cimbali, G.; Anagnostou, G. Stability under Seepage Flow Conditions of a Tunnel Face Reinforced by Bolts. Procedia Eng. 2017, 191, 215–224. [Google Scholar] [CrossRef]
- Sun, Z.; Zhang, D.; Fang, Q. Determination Method of Reasonable Reinforcement Parameters for Subsea Tunnels Considering Ground Reinforcement and Seepage Effect. Appl. Sci. 2019, 9, 3607. [Google Scholar] [CrossRef]
- Xu, P.; Wei, Y.; Yang, Y.; Zhou, X. Application of Fabricated Corrugated Steel Plate in Subway Tunnel Supporting Structure. Case Stud. Constr. Mater. 2022, 17, e01323. [Google Scholar] [CrossRef]
- Wang, C.; Hou, J.; Chen, Y.-M.; Ye, X.-W.; Chu, W.-J. A 3D Rotational Silo-Torus Model for Face Stability Analysis of Circular Tunnels. Case Stud. Constr. Mater. 2023, 18, e01736. [Google Scholar] [CrossRef]
- Chen, Z.; He, P.; Yan, D.M. Upper-Bound Limit Analysis of Tunnel Face Stability under Advanced Support. Rock Soil Mech. 2019, 40, 2154–2162. [Google Scholar] [CrossRef]
- GB/T 50152-2012; Standard for Test Method of Concrete Structures; Ministry of Housing and Urban-Rural Development of the People’s Republic of China. China Architecture & Building Press: Beijing, China, 2012.
- Barley, A.D. Theory and Practice of the Single Bore Multiple Anchor System. In Proceedings of the International Symposium on Anchors in Theory and Practice, Saltzburg, Austria, 9–10 October 1995; pp. 9–10. [Google Scholar]
- Barley, A.D. The Single Bore Multiple Anchor System. In Ground Anchorages and Anchored Structures, Proceedings of the International Conference Organized by the Institution of Civil Engineers, London, UK, 20–21 March 1997; Thomas Telford Publishing: London, UK, 1997; pp. 65–75. [Google Scholar]
- Itasca Consulting Group Inc. FLAC3D Version 6.0 Users’ Manual; Itasca Consulting Group Inc.: Minneapolis, MN, USA, 2019. [Google Scholar]
- Jiang, W.; Xu, G.; Ma, C. Numerical simulation on pull-tests of a cable by FLAC3D. J. Harbin Inst. Technol. 2008, 29, 50–54. [Google Scholar]
- Wang, J.; Zhang, Y.; Zhe, S.; Zhang, T. The reasonable selection of finite element model of tunnel excavation. North China Earthq. Sci. 2016, 35–39. [Google Scholar] [CrossRef]
- Liu, B.; Han, Y. Principles, Examples and Application Guide of FLAC; China Communications Press: Beijing, China, 2005. [Google Scholar]
- Davis, E.H.; Gunn, M.J.; Mair, R.J.; Seneviratine, H.N. The Stability of Shallow Tunnels and Underground Openings in Cohesive Material. Géotechnique 1980, 30, 397–416. [Google Scholar] [CrossRef]
- Ministry of Housing and Urban Rural Development of the People’s Republic of China. JGJ 120-2012 Technical Specification for Retaining and Protection of Building Foundation Excavations; China Architecture & Building Press: Beijing, China, 2012. [Google Scholar]
- Zhang, S. Study on anchoring ability of full-grouted bolts. Min. Metall. 2003, 12, 17–20. [Google Scholar] [CrossRef]
- Yao, X.; Li, N.; Chen, Y. Theoretical solution for shear stresses on interface of fully grouted bolt in tunnels. Chin. J. Rock Mech. Eng. 2005, 24, 2272–2276. [Google Scholar] [CrossRef]
- Jiang, W.; Xu, G.; Ma, C. The application of fast lagrangian method to the numerical simulation of anchor bolt pull-out tests. China Railw. Sci. 2008, 29, 50–54. [Google Scholar] [CrossRef]
- Zhang, Z.; Li, H.; Yang, H.; Wang, B. Failure Modes and Face Instability of Shallow Tunnels under Soft Grounds. Int. J. Damage Mech. 2019, 28, 566–589. [Google Scholar] [CrossRef]
- Li, H. Research on Deformation Mechanism and Support Mechanical Behavior of Shallow Large Span Expansive Soil Tunnel. Ph.D. Thesis, Southwest Jiaotong Uniersity, Chengdu, China, 2014. [Google Scholar]


Disclaimer/Publisher’s Note: The statements, opinions and data contained in all publications are solely those of the individual author(s) and contributor(s) and not of MDPI and/or the editor(s). MDPI and/or the editor(s) disclaim responsibility for any injury to people or property resulting from any ideas, methods, instructions or products referred to in the content. |
© 2023 by the authors. Licensee MDPI, Basel, Switzerland. This article is an open access article distributed under the terms and conditions of the Creative Commons Attribution (CC BY) license (https://creativecommons.org/licenses/by/4.0/).