Article

Recycling of Contaminated Marine Sediment and Industrial By-Products through Combined Stabilization/Solidification and Granulation Treatment

1
Department of Civil, Environmental, Land, Building Engineering and Chemistry (DICATECh), Polytechnic University of Bari, Via E. Orabona n. 4, 70125 Bari, Italy
2
Department of Engineering and INSTM Research Unit, University of Naples “Parthenope”, Centro Direzionale, Isola C4, 80143 Naples, Italy
3
Department of Civil and Environmental Engineering, The Hong Kong Polytechnic University, Hung Hom, Kowloon, Hong Kong, China
*
Author to whom correspondence should be addressed.
Materials 2023, 16(6), 2399; https://doi.org/10.3390/ma16062399
Submission received: 2 January 2023 / Revised: 26 February 2023 / Accepted: 14 March 2023 / Published: 17 March 2023

Abstract

:
Stabilization/solidification (S/S) is becoming increasingly important, as it allows the remediation of contaminated sediments and their recovery into materials for civil engineering. This research proposes a cement-free cold granulation process for manufactured low-cost aggregates from marine sediments contaminated with organic compounds and metals. After the chemo-physical characterization of the study materials, two mix designs were prepared in a rotary plate granulator by adding two industrial by-products as geopolymer precursors, coal fly ash (CFA) and Blast Furnace Slag (BFS), but also alkaline activation solutions, water, and a fluidizer. The results indicated that sediments treated with mix 1 (i.e., with a higher percentage of water and fluidifier) represent the optimal solution in terms of metal leachability. The metal leachability was strictly influenced by aggregates’ porosity, density, and microstructure. The technical performance (such as the aggregate impact value > 30%) suggested the use of granules as lightweight aggregates for pavement construction. The results indicated that cold granulation represents a sustainable solution to recycling contaminated marine sediments, CFA, and BFS into lightweight artificial aggregates.

1. Introduction

Anthropogenic activities involve the production of several hazardous pollutants which may pose a serious concern to the ecosystem. For example, marine-sediment-bound pollutants can enter aquatic food chains and have adverse effects on ecosystems and human health [1].
Several remediation technologies have been developed to clean up marine sediments contaminated by organic and inorganic pollution, including both ex situ and in situ options [2].
Among the ex-situ remediation techniques, stabilization/solidification (S/S) has captured extensive interest not only for being reliable and cost-efficient [3], but also because it represents a key technology for producing new engineering materials by treatment and reuse of dredged contaminated sediments [4]. S/S involves the addition of binders and additives to a contaminated material in order to immobilize pollutants, but also to improve its mechanical behavior [5,6]. The treated sediment can be recycled in road construction [7], cemented mortars [8], fill material and blocks [4], and raw materials for brick production [9], or at least disposed in sanitary landfills for unhazardous waste. In fact, dredged materials are often classified as waste and disposed of in costly and environmentally risky ways.
Recently, a new environmental sediment S/S approach that utilizes industrial/agricultural by-products received particular attention [10,11]. In a broad view of “green remediation”, this simultaneously addresses the problem of contaminated sediments while supporting material recycling and mitigation of environmental impacts (e.g., carbon footprint and landfill disposal) [12]. Wang et al. [13] investigated the efficacy of wood waste biochar as a green admixture in S/S. The biochar addition allowed the immobilization of toxic elements and organic contaminants present in the sediment, which became suitable for recycling as a fill material and in paving blocks. Shubbar et al. [14] developed a low-carbon binder from the ternary blending of cement, ground granulated blast furnace slag, and high-calcium fly ash. This increased the mechanical strengths of the treated sediment thanks to the high glassy silica and alumina content [11].
However, applying S/S treatments does not allow obtaining a ready-to-use product in civil applications. In this regard, granulation processes represent viable options for obtaining a significant particle size enlargement using a rotary drum or similar device [15]. Recently, only a few studies have focused on coupling the two techniques to obtain aggregates from the treatment of waste materials such as contaminated sediment and soil [16], municipal solid waste and incinerator bottom ashes [17], and automotive shredder residues [18]. According to the final purpose, granulation processes can manufacture artificial aggregates. Ren et al. [19] defined granulation as any process of consolidating solid particles in a size range of 1–500 μm into aggregates of larger sizes, ranging from 2 mm to 10 mm. The result consists of granules whose characteristics depend on the chosen formulation and the design process adopted (i.e., type of granulator, operating parameters, etc.).
Several authors studied the granulation process with traditional binders (e.g., Portland cement) to produce artificial aggregates [20]. This process has economic and environmental advantages by requiring less energy (process carried out at room temperature) than energy-intensive industrial alternatives, such as polymerization [21]. Only recently, binders with reduced CO2 content, such as geopolymers and alkali-activated materials, have been proposed for S/S processes [22,23,24]. These alternatives have gained increasing interest from researchers due to promising results in terms of physical, mechanical, and durability properties [25]. Geopolymers represent a class of amorphous aluminosilicate binder materials produced by the reaction of an aluminosilicate source with a concentrated aqueous solution of an alkali metal silicate or hydroxide. Geopolymer materials can provide performances comparable to that obtained with traditional cement, but with a significant reduction in greenhouse gas emissions and good fire and acid resistance [26,27,28].
The literature shows how the environmental applications of the granulation process with geopolymers still need to be explored, despite their high potential, especially in the case of stabilization/solidification of hazardous waste [29,30]. In this context, this study aimed to contribute to the research of sustainable S/S treatments by exploring the feasibility of cement-free granulation for the recycling of organically and inorganically contaminated marine sediments. In particular, to provide scientific insights into waste recycling, this study aimed at transforming contaminated materials into a chemically and physically stable material, suitable for engineering applications, via a cold granulation process based on low-cost geopolymers.
For this reason, compositional and microstructural analyses were conducted to characterize the contaminated materials and treatment reagents: coal fly ash (CFA) and Blast Furnace Slag (BFS). Moreover, the environmental and technical aspects of the recycled aggregates were evaluated by leaching, physical-mechanical tests, and microstructural analysis.
The novelty of the study lies in the application of alkaline reagents and industrial waste (i.e., CFA and BFS) as a S/S technique to producing low-cost aggregates from contaminated marine sediments. Additionally, the experimental investigation was characterized by the absence of pre-treatment of the sampled sediments and by the use of a rotary plate granulator plant that is suitable for scaling up the results.

2. Materials and Methods

2.1. Framework of the Experimentation

The investigation aimed to obtain environmental-friendly recycled aggregates through stabilization technology by a cold granulation process. The study involved the following four main phases: (i) chemical characterization of ten samples of marine sediments and realization of three composite samples; (ii) characterization of the study’s materials (i.e., fly ash and composite marine sediments); (iii) S/S testing by granulation; (iv) evaluation of the chemical-physical characteristics of the final products (Figure 1). First, an environmental characterization of the sediments was necessary to prepare the composite samples under study. Next, composite marine sediments and geopolymer precursors were characterized by grain size analysis (GSA), thermogravimetric analysis (TGA), X-ray diffraction mineralogical analysis, and scanning electron microscopy (SEM) observations. Finally, after 28 days of maturation, leaching tests and physical characterization analyses were performed on the granulated materials.
The study presented in this article is part of a project promoted by the “Special Commissioner for urgent measures of reclamation, environmental improvements and redevelopment of Taranto” (appointed by the Italian government), which is aimed at the selection of sustainable strategies for the remediation of the Mar Piccolo, which is considered one of the most polluted marine ecosystems in Europe [31].

2.2. Contaminated Marine Sediments

Contaminated marine sediments were sampled from the first basin of the Mar Piccolo of Taranto (Southern Italy, Figure 1). A team of expert scuba divers carried out the sampling campaign in the first 50 cm of the seafloor [32]. These sediments are mainly silty clays of very high plasticity and activity, and their liquidity index is on average larger than one [33]. As also discussed by Vitone et al. [34], X-ray diffractometry of them shows the widespread presence of phyllosilicates (such as interstratified illite/smectite, chlorite/smectite, kaolinite, and chlorite); minor constituents are quartz, feldspars, and carbonates (calcite and dolomite, and aragonite is present in trace amounts).
Until characterization, each sample was stored at +4 °C to avoid alteration of the sediment’s physical-chemical properties. For this purpose, the standard protocols of ISPRA (the Italian Institute for the Environmental Protection and Research) were used. The concentrations of metals were obtained by ICP-OES measurements (inductively coupled plasma-optical emission spectrometry) in accordance with the EPA method 200.8. For the determination of the organic contaminants, a gas chromatograph–mass spectrometer (GC-MS) and the EPA method 8275A were used. The representative samples for the subsequent S/S tests were created by mixing homogeneous sediments in terms of levels and types of contamination, as shown in Figure 1.

2.3. Geopolymers Precursors and Activator Solutions

Coal fly ash (CFA)—named EFA-Füller HP—from the BauMineral power plant (Heyden, Germany) was used as a geopolymer precursor. It is a fine-grained pozzolanic binder that consists mainly of SiO2 and Al2O3 according to the DIN EN 450 (the content of reactive SiO2 is at least 25% by mass). Instead, Blast Furnace Slag (BFS) from Italcementi (Bari, Italy) was used to accelerate the setting process. The BFS is high in iron oxide (25.5%), calcium oxide (17.5%), and alumina (8.9%) [35]. CFA and BFS were employed as residues from industrial plants operating in Italy. Moreover, two activating solutions, prepared with sodium silicate (Na2SiO3 with initial silica modulus ratio of 2.0) from Prochin Italia Srl (Napoli, Italy) and sodium hydroxide (15 M NaOH) (Sigma-Aldrich, Milano, Italy), were used. These strong molar solutions were chosen to improve the degree of polymerization [36].

2.4. Composition and Microstructural Analysis

A particle-size analysis was performed using the laser diffractor Mastersizer 3000 by Malvern Panalytical Ltd. (Malvern, UK) (particle size range: 0.01 µm ÷ 3500 µm) with the Hydro EV wet sample dispersion unit.
A mineralogical characterization of the samples was performed using the X-ray diffraction (XRD) instrument Miniflex 600 (Rigaku Corporation, Tokyo, Japan) equipped with a diffracted beam monochromator set for Cu-Kα radiation (λ = 1.5418 Å). The 2θ scan range was 5 ÷ 80° with a step size of 0.02° and a scanning speed equal to 2θ/s. The mineralogical phase recognition was performed using Rigaku PDXL2 software (Rigaku Corporation, Tokyo, Japan) and the PDF4+ database (International Centre for Diffraction Data, Tokyo, Japan).
TGA was conducted using the TGA/DSC 2 (Mettler Toledo, Columbus, OH, USA), which is a combined device capable of measuring sample mass change and heat flow simultaneously. Each sample was tested within a temperature range of 25 ÷ 1000 °C with a heating rate of 10 °C/min.
The microstructures of the raw materials and final products were studied by means of SEM investigations. The morphological analysis was carried out using a ProX microscope (Phenom, Kondapur, India) equipped with the EDS (Energy Dispersive Spectroscopy) microprobe and the ProSuite software for elemental analysis evaluation.

2.5. S/S Testing and Granule Characterization

Composite sediment samples were air-dried till reaching the optimal water content (maximum moisture content 20%). The S/S mixtures were prepared using different types and contents of geopolymer precursors based on industrial wastes (Table 1). The mixture designs were chosen according to the results of the RILEM technical committee TC 247-DTA [37]. In particular, the mixtures were designed to achieve suitable chemo-physical characteristics for reuse via a low water/binder ratio (0.2 ÷ 1.6). Indeed, as the marine sediments from Mar Piccolo were highly contaminated, a strong molar solution of sodium hydroxide (15 M) was used as geopolymer precursors activator [36].
The experimentation involved the use of a rotary plate granulator able to simulate a granulation process for aggregate production. The granulation tests allowed the optimization of the mixtures in terms of: (i) percentage of non-granulated powder (<5%); (ii) granulation starting time (4 ÷ 5 min); (iii) target granule size (4 ÷ 18 mm) according to the European Standard EN 13055’s [38] specifications. In this regard, only the mix design with a geopolymer precursors/sediment ratio of 0.88 was considered adequate and was optimized to investigate the influence of water content (Table 1). The weight ratio CFA:BFS:sediment was 6:1:8 for all the specimens. Moreover, the mixtures differed both in the sodium silicate dose (Na2SiO5 on 100 g of precursor), which was 26.9 for the former and 31.3 for the latter, and in the sodium hydroxide dose (NaOH on 100 g of precursor)—2.7 and 4.9, respectively.
The curing phase was conducted at room temperature and 100% humidity for 28 days. The treated materials underwent the leaching test at the end of the curing process [39]. A 40 g portion was sampled and transferred to a polyethylene bottle. Demineralized water was added with a solid–liquid ratio of 1:10 by weight, and the bottles were kept in rotation at 10 rpm for 24 h using an overhead mixer. After 24 h, the leachate was filtered to remove suspended solids and chemically characterized according to appropriate standard methods [40]. The heavy metals’ concentrations were determined by using ICP-OES.
The morphology of the granules was studied by means of SEM images, acquired with the method described in Section 2.4. In addition, after the curing time, the granules were analyzed to investigate their physical properties. The determination of apparent density, porosity, and water absorption capacity (WAC) was carried out according to the UNI 11060 [41]. In particular, WAC at atmospheric pressure was determined using the following relation (Equation (1)):
WAC = 100 × (msat − mdry)/mdry
where msat is the water-saturated mass in air and mdry is the dry mass, after drying in the oven at 60 °C. Tests were conducted in triplicate.
The samples were also tested to determine the aggregate impact value (AIV) to assess their suitability in concrete. The experiment was performed according to the British Standard 812 [42], which gives a relative measure of the resistance of an aggregate to sudden shock or impact. The AIV is a measure of the resistance gradually applied as a compressive load. First, the aggregates were washed and dried at a constant temperature in the range of 105 to 110 °C, and then the samples were cooled down to room temperature. After that, the aggregates were weighed, placed into the cylinder, and then transferred to the cup where they were compacted using the tamping rod. The hammer was released to fall freely on the aggregates. The sediment samples were subjected to 15 blows. They were removed from the cup and sieved through a 2.36 mm sieve. The particles passing through the 2.36 mm sieve were weighed to detect weight loss. The experiment was repeated for all the mixtures prepared.

3. Results

3.1. Contaminated-Marine-Sediment Characterization

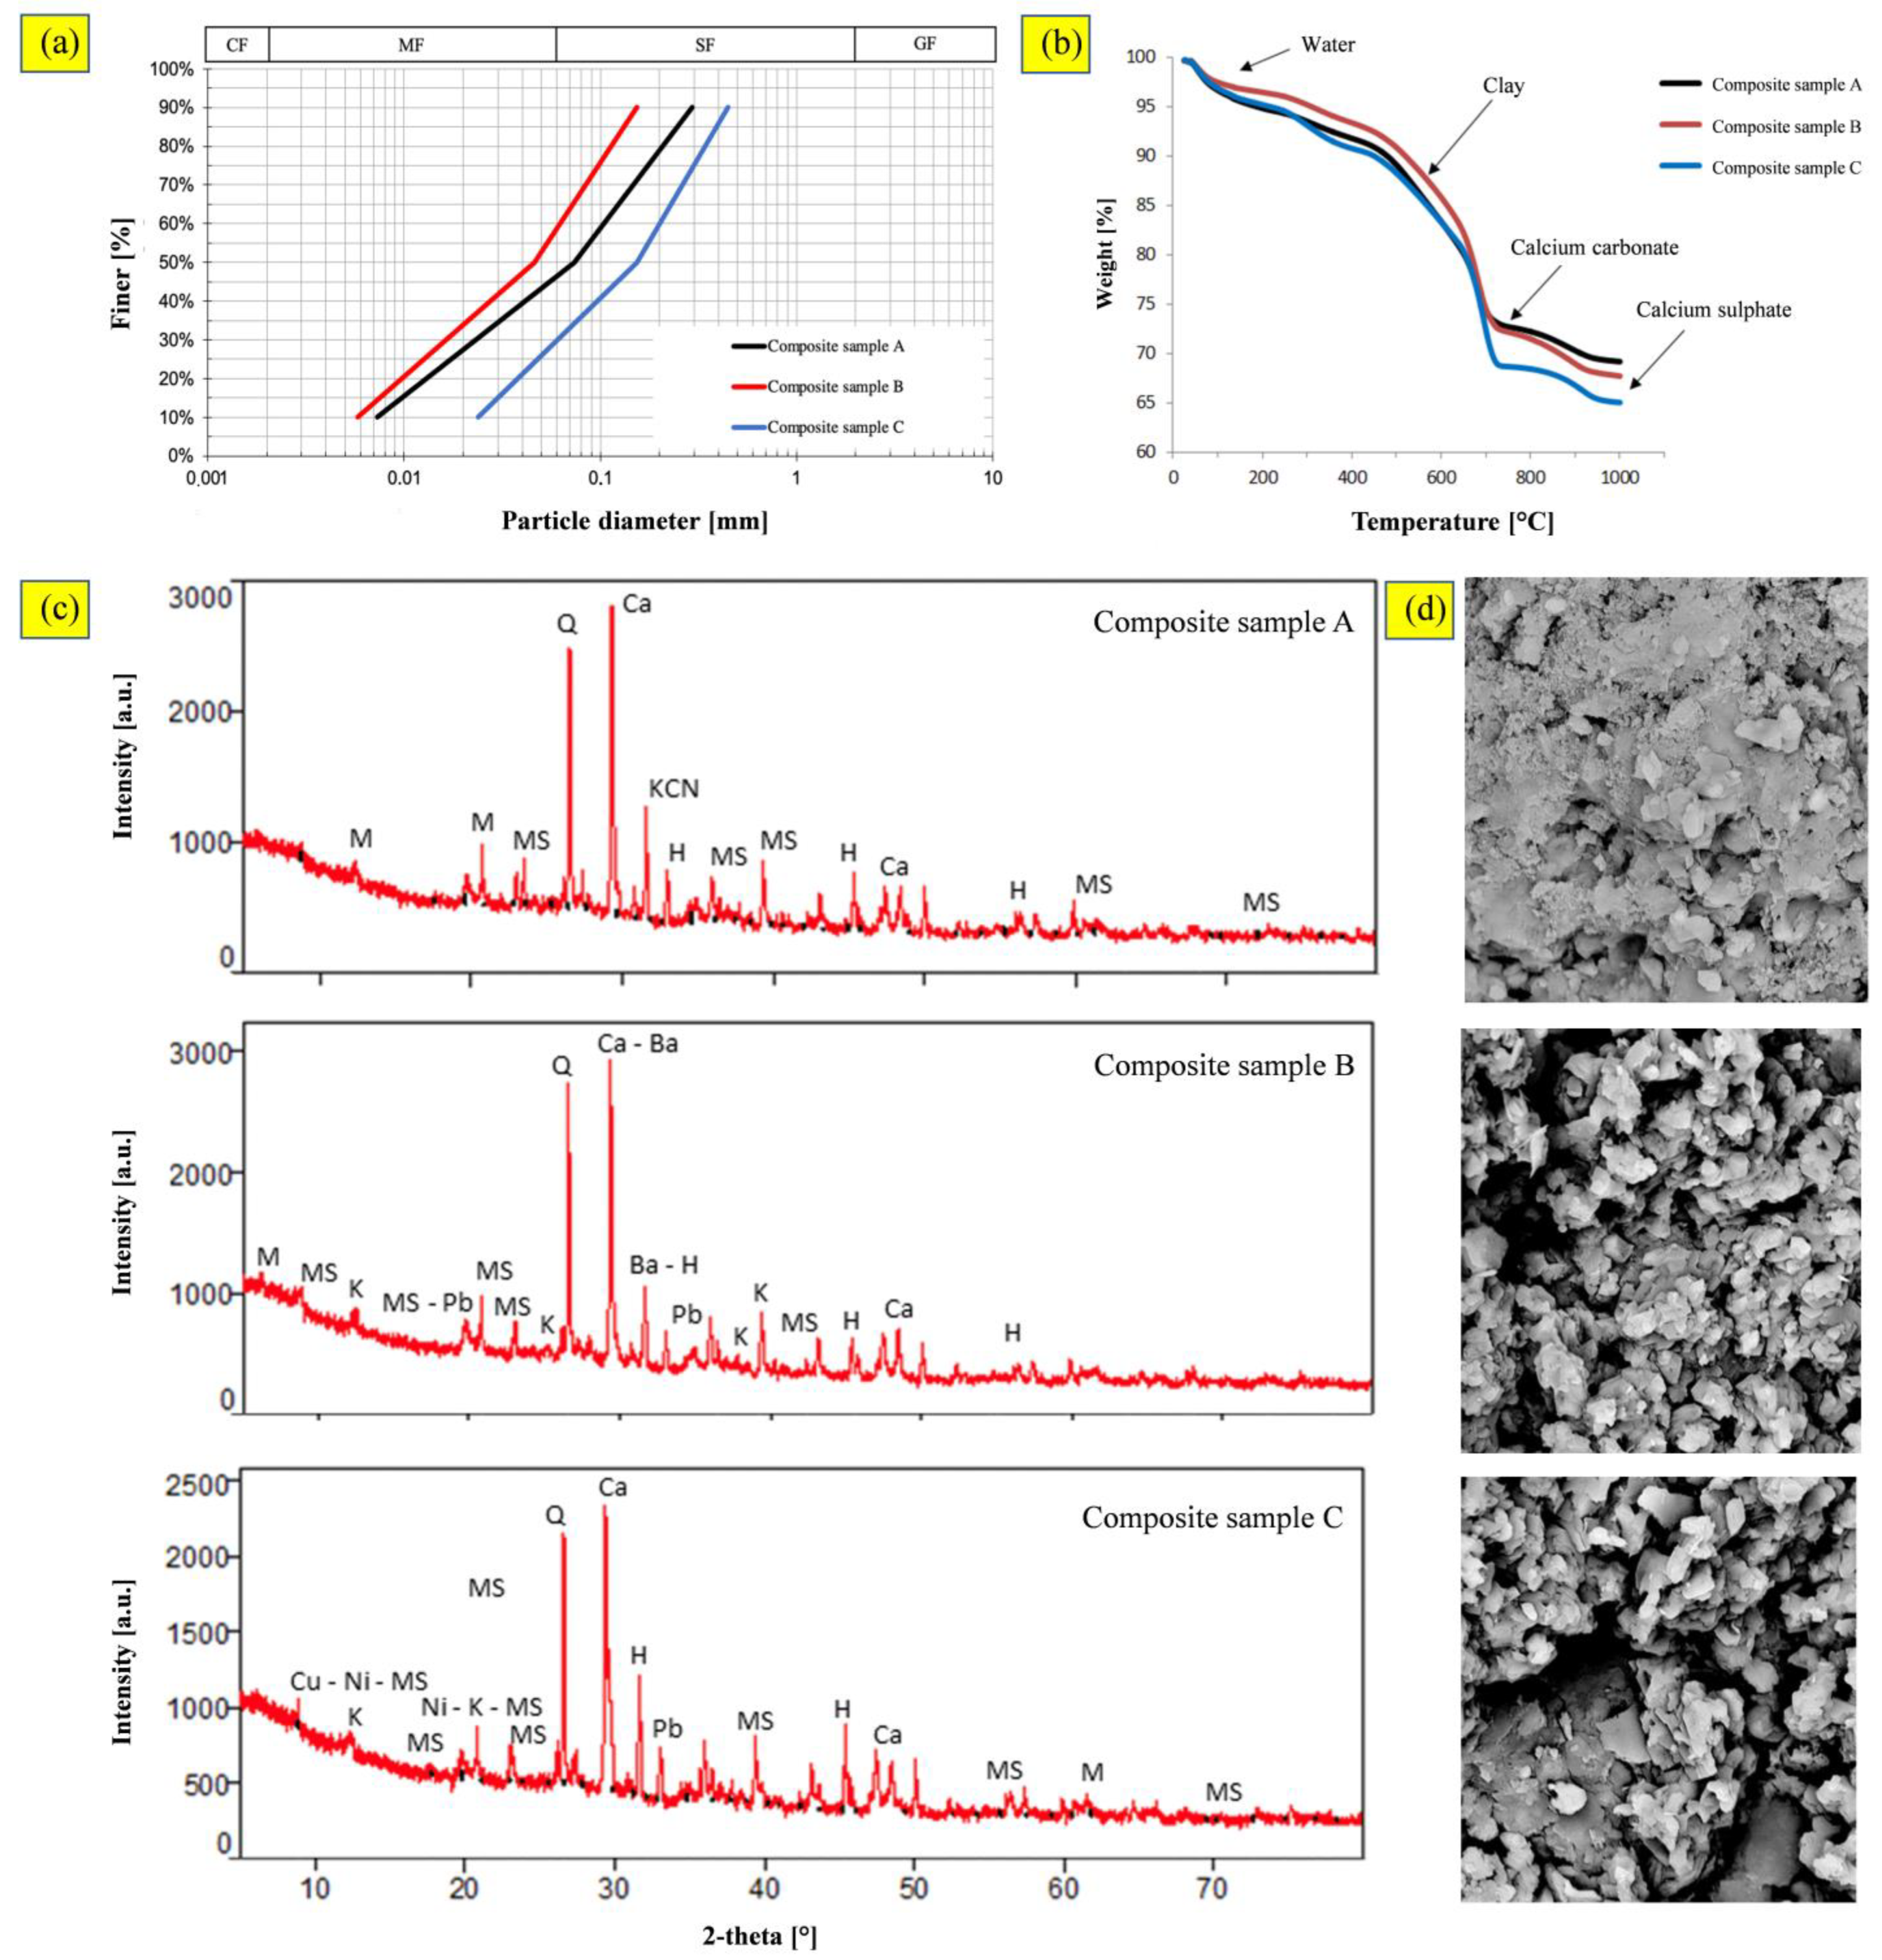
The particle-size characterization of the sediment samples revealed fine-grained soils, in which the fine fraction (<0.063 mm) varied between 35.16% (SP4) and 91.76% (SP9), the sand fraction (2 ÷ 0.063 mm) ranged from 4.28% of the SP9 sample to 44.16% of the SP4 sample, and the gravel fraction (>2 mm) was between 3.96% (SP9) and 31.76% (SP12). Contaminant concentrations (Table 2) were compared with the corresponding limits set by site-specific regulations [43].
Regarding inorganic contamination, copper (Cu), lead (Pb), mercury (Hg), and zinc (Zn) exceeded the corresponding limit values in all the samples analyzed. Arsenic (As) concentrations were higher than the threshold limit values in the samples SP4, SP6, and SP7. Instead, cadmium (Cd) concentration exceeded the regulation limit in the samples SP4 and SP14. SP4, SP6, SP7, and SP17 samples were characterized by concentrations of polycyclic aromatic hydrocarbons (PAHs) higher than the limit values (11,652, 6552, 5810, and 4515 µg/kg, respectively). The cumulative polychlorinated biphenyls (PCBs) concentration exceeded the threshold limits in all samples. The maximum values were found in the SP6 and SP7 (22,253 and 19,283 µg/kg, respectively).
The representative samples for the subsequent S/S tests were prepared by mixing the sediments with similar characteristics in terms of level and type of contamination. The most contaminated sediments were found in the samples SP4, SP6, SP7, and SP17, so they were used to produce the composite sample named “A”. The other sediment samples were used for other two composite samples named “B” (SP3, SP9, and SP11) and “C” (SP12, SP14, and SP16) with lower levels of contamination than “A”. The results of the composite samples’ characterizations are reported in Table 3.
According to the particle size distribution (Figure 2a), the samples were classified as sand with silt (Dv50 = 74 µm), silt with sand (Dv50 = 46 µm), and silty sand (Dv50 = 154 µm) for composite samples A, B, and C, respectively.
It is pointed out that the particle size of the untreated material has a key role in the granulation process. Solids with variable dimensions gave dense granules because smaller particles can fill the pores between larger particles. Furthermore, impeller speed, granulation time, and the amount and viscosity of the liquid binder may each have a significant effect on the granulation process [44].
The TGA showed a similar trend for all the composite samples (Figure 2b). The weight losses (30 ÷ 35%) were mainly due to water (hygroscopic and capillary) and decomposition of the organic matter. Four stages were found in the degradation process of this sediment, mainly occurring at the temperature ranges of 50–200 °C, 200–500 °C, 500–700 °C, and 700–1000 °C. The first stage corresponds to the chemically bound water and natural organic matter [45]. In the second stage, the weight loss might be associated with decomposition of clays and oxidation of organic matter—low-molecular-weight hydrocarbons are released and burned [46]. The third stage is mainly due to the combustion of different and more recalcitrant classes of organic matter. In the last stage, most carbonate-associated inorganic compounds were completely degraded; the loss at about 900 °C was presumably due to the thermal decomposition of calcium sulphate [47]. Sample C followed a slightly different pattern at temperatures around 700–1000 °C, and had greater weight loss than samples A and B.
The presence of clay minerals was confirmed by the XRD analysis (Figure 2c). The diffractograms showed a mixture of main crystalline phases corresponding to the diffraction patterns of quartz, calcine, halite, and clay minerals (i.e., a mixture of montmorillonite, kaolinite-montmorillonite, montmorillonite-chlorite, kaolinite, and muscovite). Sulphates, phosphates, and heavy metals were identified as minority phases. Moreover, hematite was significantly present, dragged mainly by the wind from the iron ores heaps of the near steel factory [48].
Morphological analyses, performed on the sediments after drying, revealed a more homogeneous and compact aspect of sample A (Figure 2d). Instead, the SEM images highlighted a very similar structure for the composite samples B and C, and an irregular morphology of the constituent particles was evident.

3.2. Characterization of Geopolymers’ Precursors

3.2.1. Coal Fly Ash

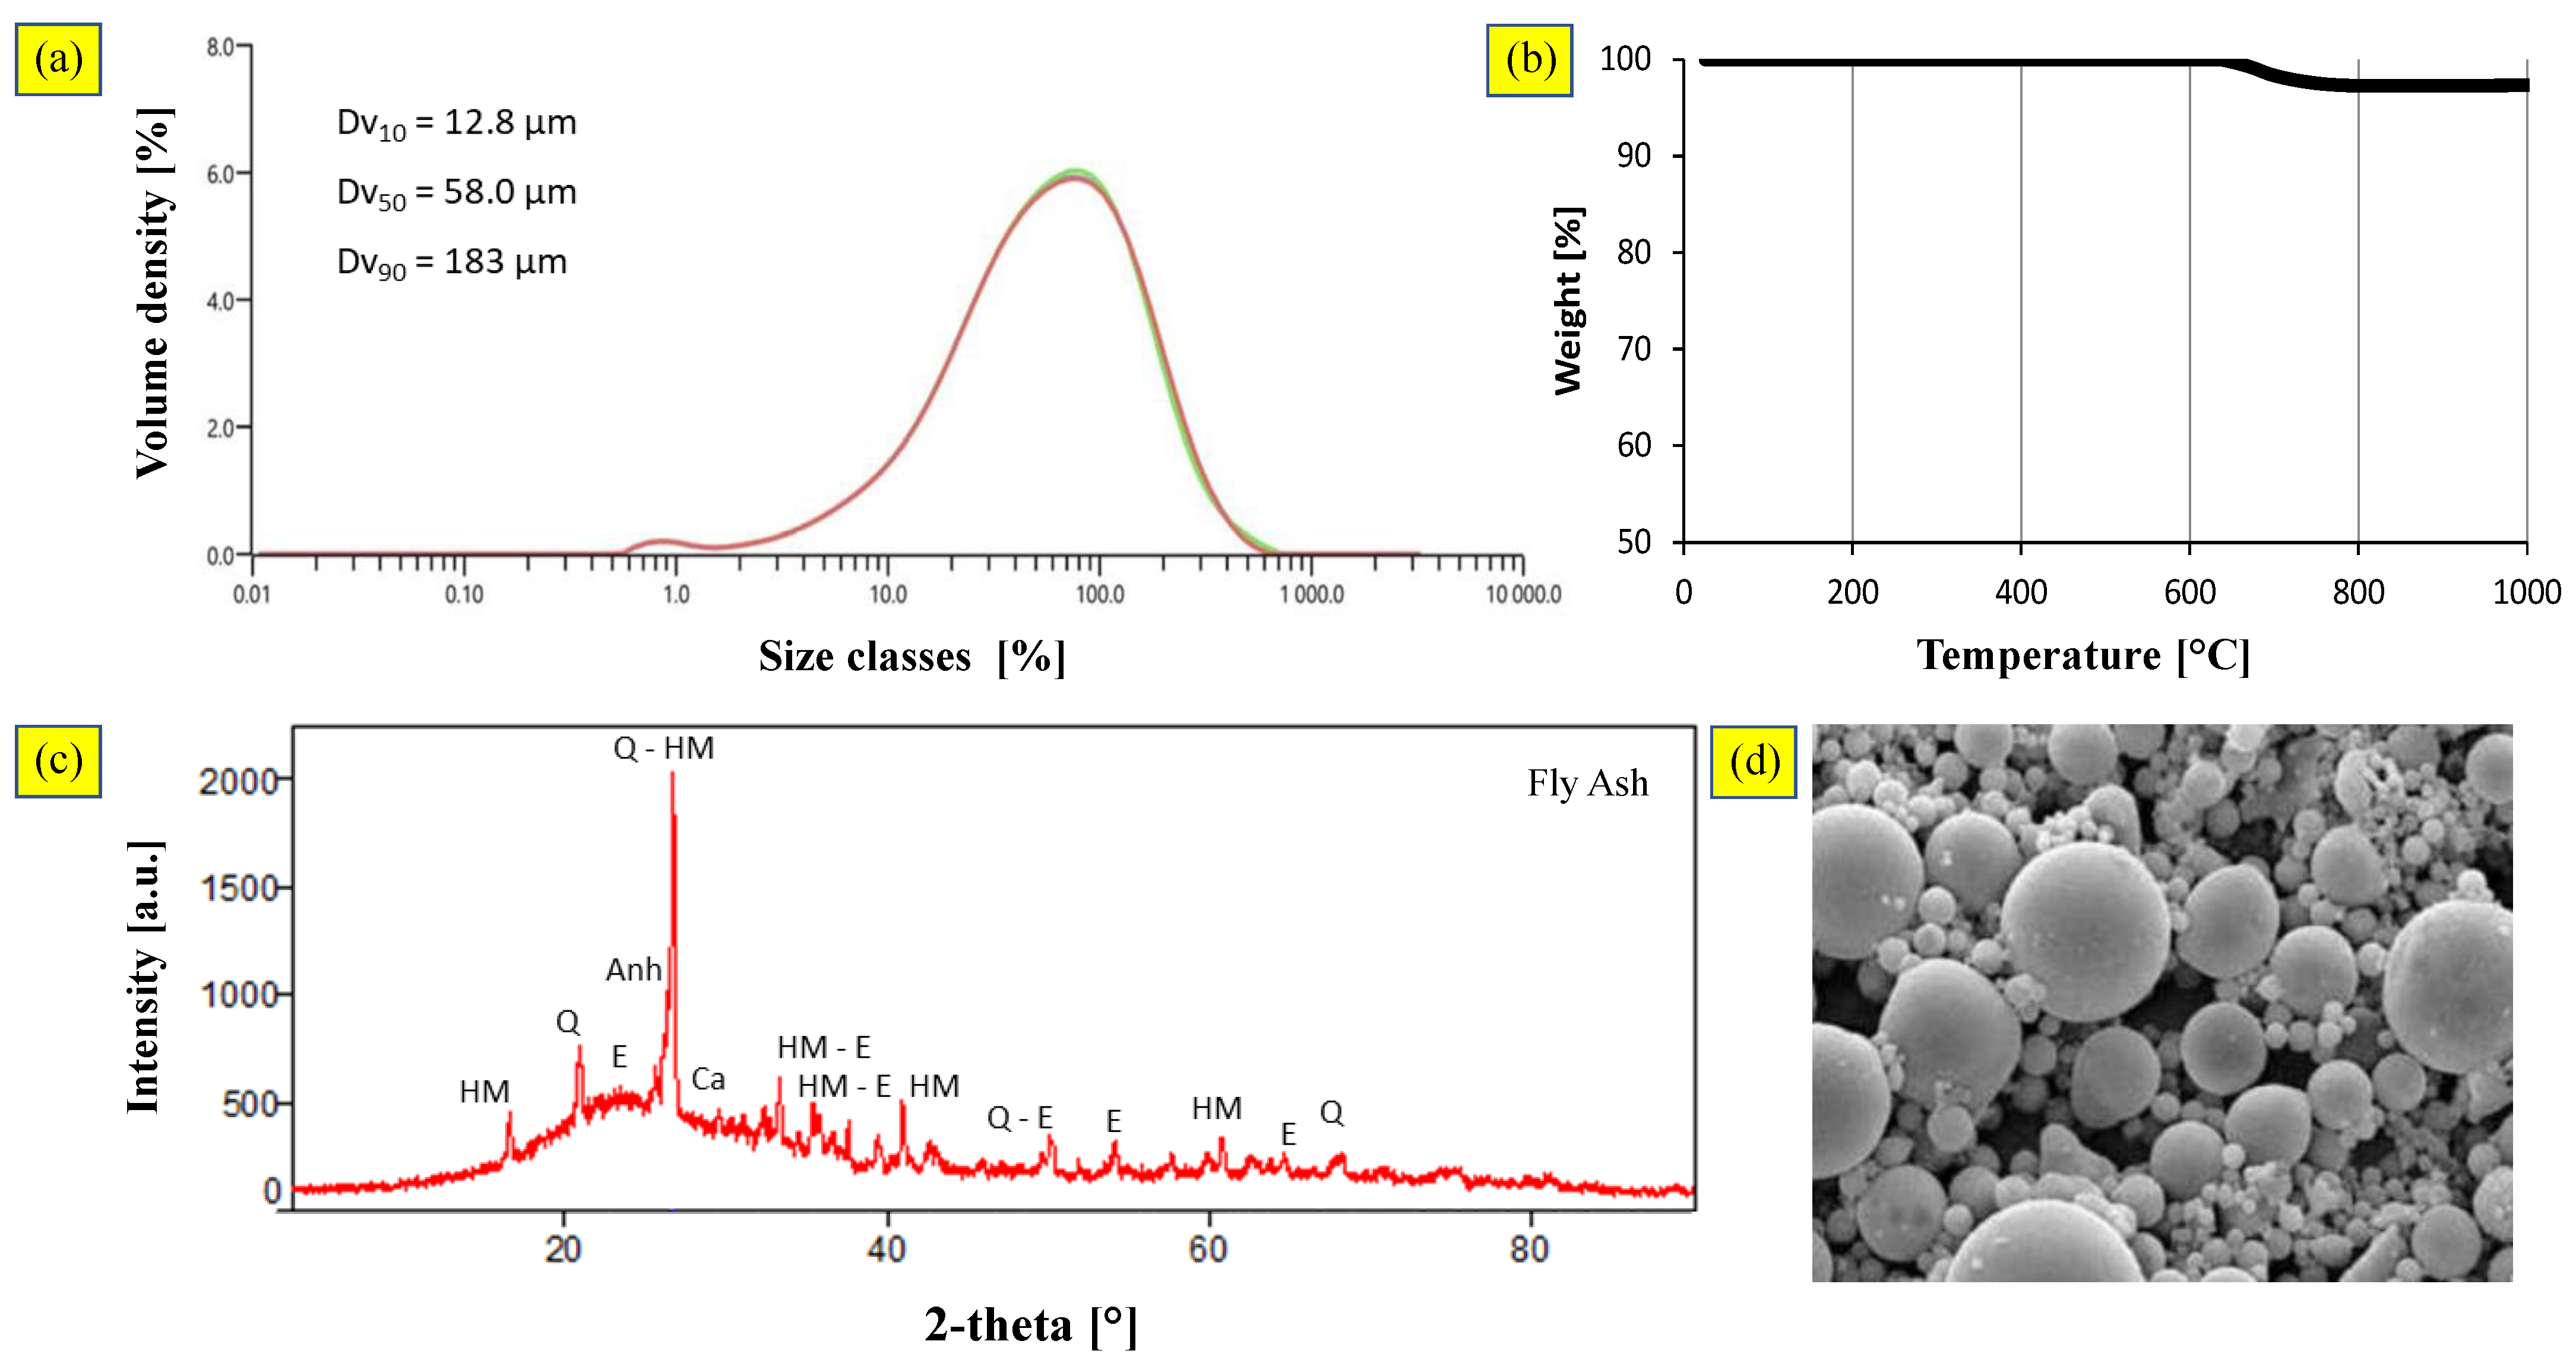
The particle size of CFA ranged between 12.8 and 183 μm (Figure 3a), implying high combustion efficiency [49]. From the particle distribution, it was possible to determine the sizes of the 10%, 50%, and 90% (by volume) of the smallest particles, denoted Dv10, Dv50, and Dv90, respectively. The span, which is calculated as (Dv90 − Dv10)/Dv50, was 2.93, and showed the usability of the ashes; a uniform particle size distribution would favor a layering mechanism of smaller particles onto the surfaces of larger ones in the granulation phase, leading to an uneven growth process [50].
The thermogravimetric analysis results highlighted that the weight loss started at 650 °C and was completed at 800 °C. The overall weight loss was <5%, which can be attributed to removing the unburnt (Figure 3b). The mineralogical characterization (Figure 3c) showed the presence of quartz (SiO2), mullite (Al6Si2O13), and hematite (Fe2O3). Anhydrite (CaSO4) and calcite (CaCO3) were detected as minority phases, likely resulting from the abatement treatments of pollutants in the gas. SEM images (Figure 3d) showed the typical spherical morphology of fly ash particles, caused by the high-temperature melting and solidification processes during transport in the flue gas.

3.2.2. Blast Furnace Slag

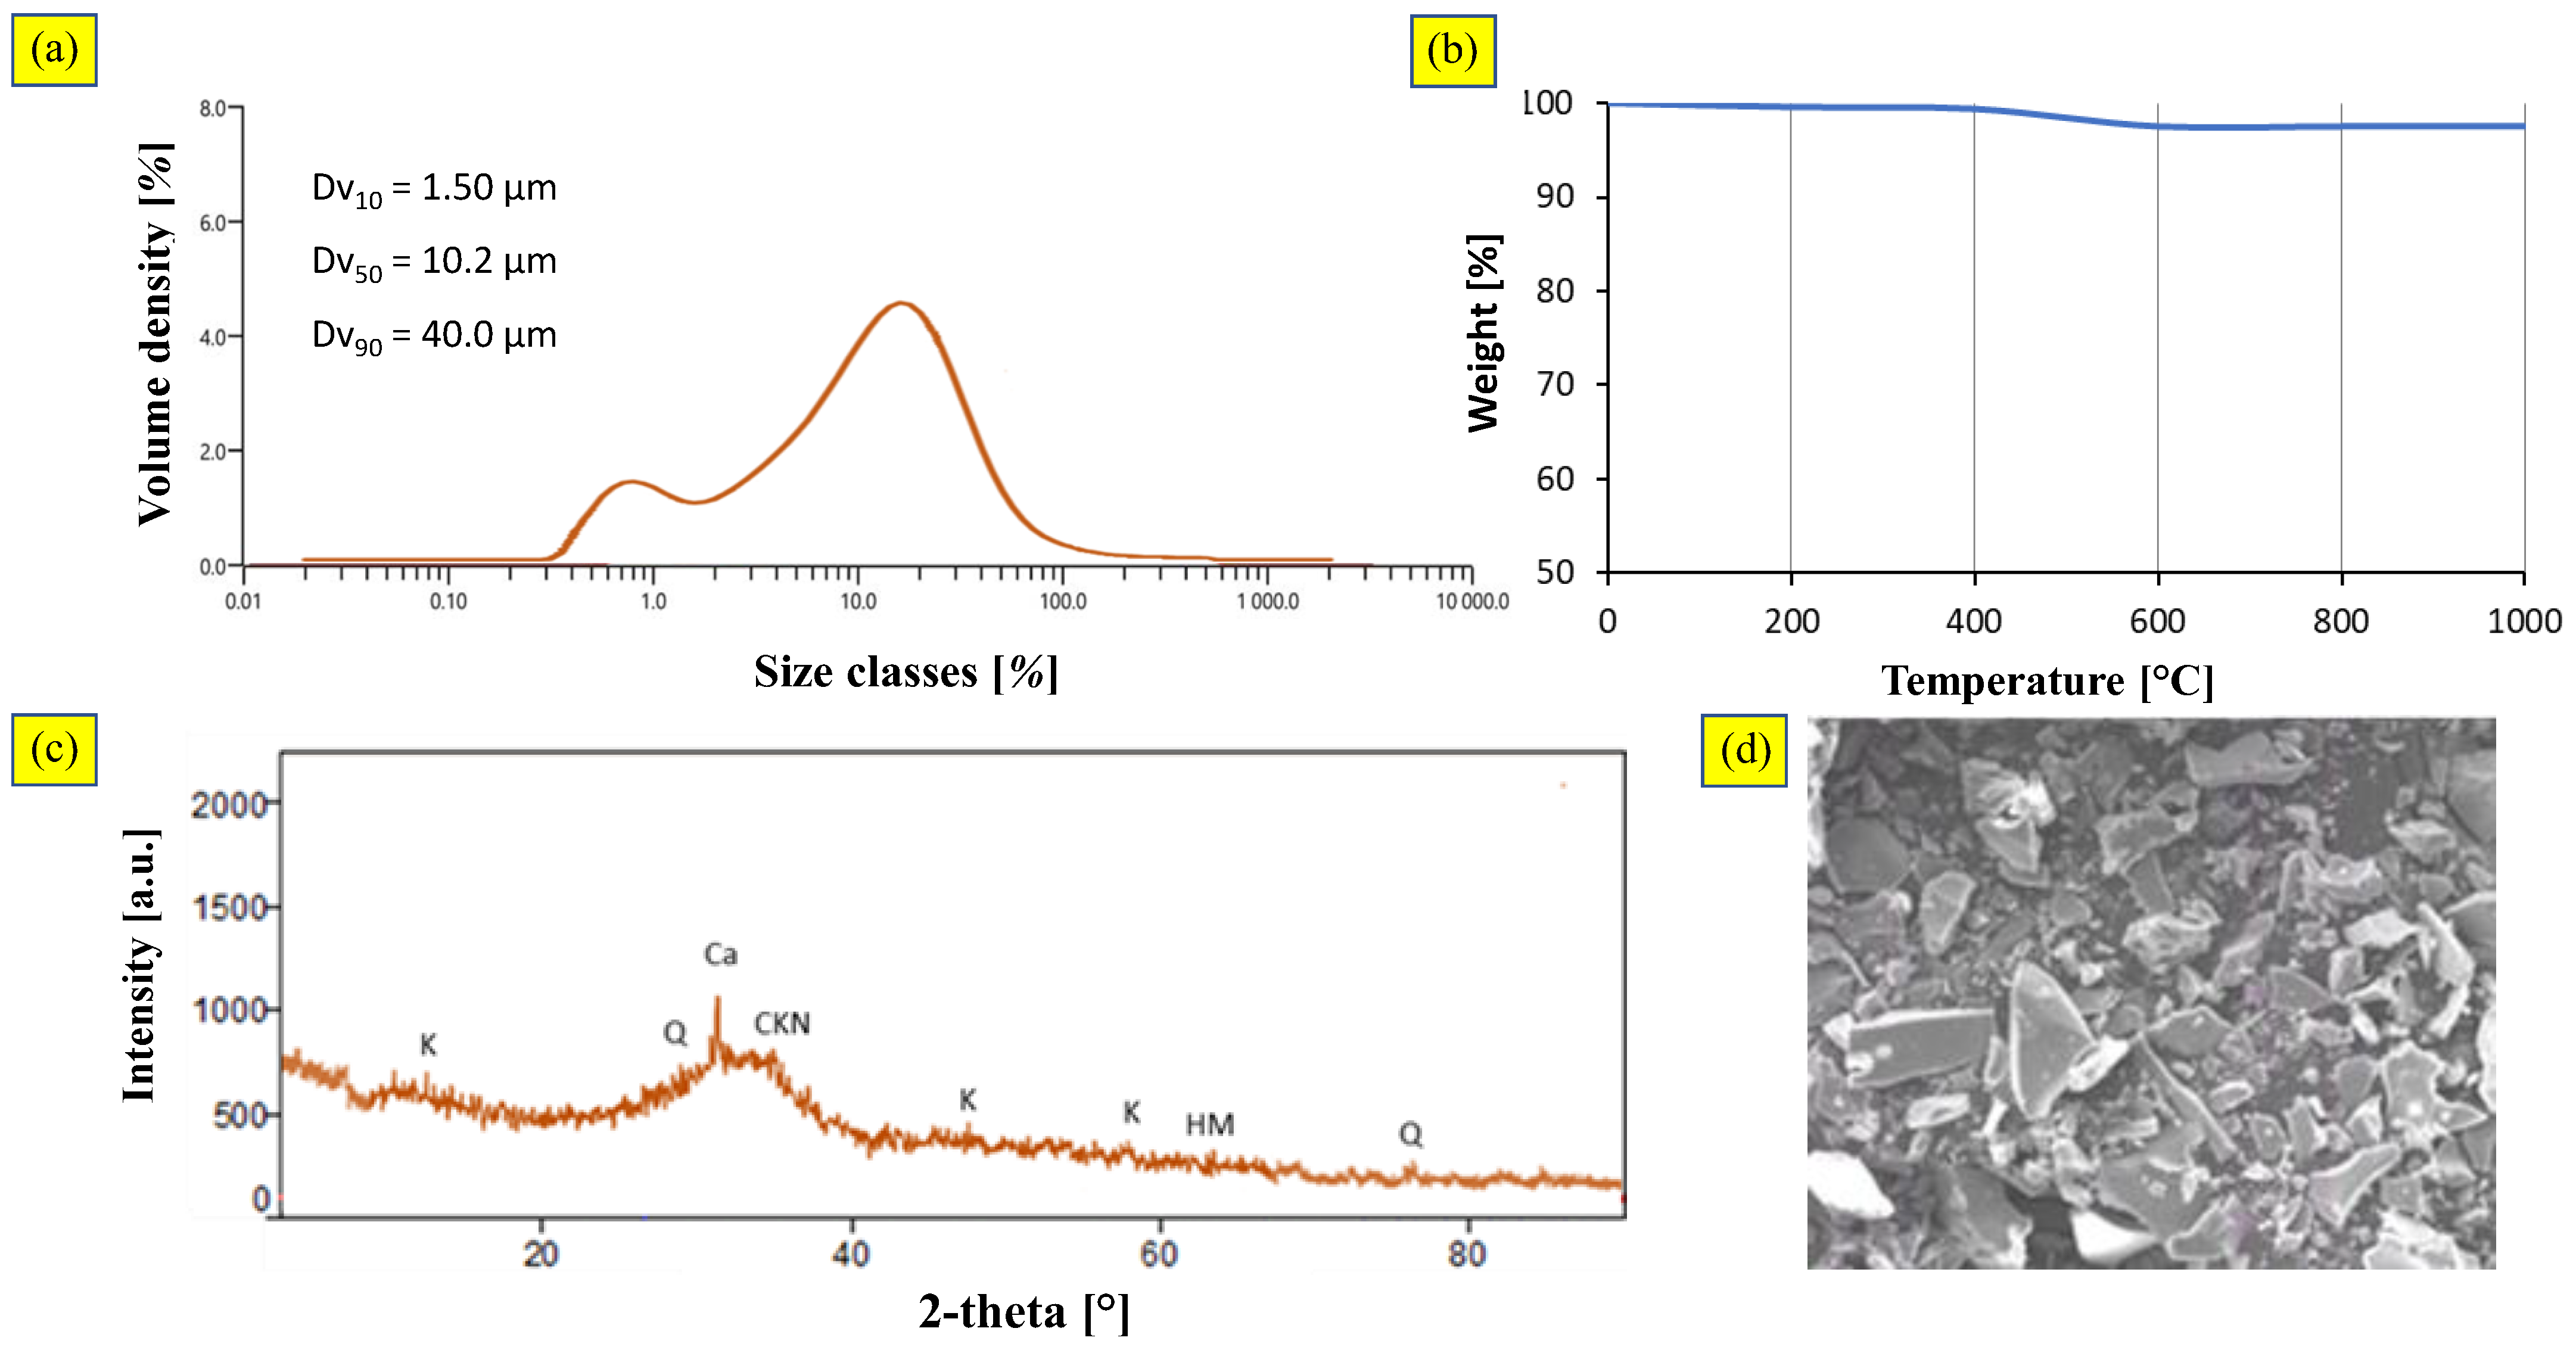
Figure 4a shows the particle size distribution curve of BFS, which was measured with the laser-diffraction technique. From the particle-size distribution, a mean equivalent spherical particle diameter of 18 µm (Dv50) was observed. In addition, 10% fell within the range of 0.3–10 µm (Dv10), and 90% of particles were less than 40 µm in diameter (Dv90). The fineness of BFS is a very important parameter because increased fineness results in better strength development, but in practice, fineness is limited by economic and performance considerations and factors such as setting times and shrinkage [51]. A span of 2.14 was about the same value determined for CFA, showing the compatibility of raw materials for the granulation process [52].
Gradual weight reduction (<3%) in the temperature range 450–600 °C was observed due to the water still present in the sample (Figure 4b). At higher temperatures (above 500 °C), chemical bonds were broken, and the moisture was released and evaporated from the samples. After moisture evaporation, no further mass losses were noticed.
The diffraction pattern (Figure 4c) showed the dominant presence of calcite (CaO) and quartz (SiO2). A calcite peak was detected, related to the presence of limestone as a fluxing agent in the parent reactor. The mineralogical characterization indicated that glassy phases (i.e., amorphous structure) predominated.
Figure 4d illustrates the SEM micrographs for raw BFS. Due to the instant cooling of the liquid slag, the particles were irregular, angular, and glassy in appearance.

3.3. S/S Performance and Granule Characterization

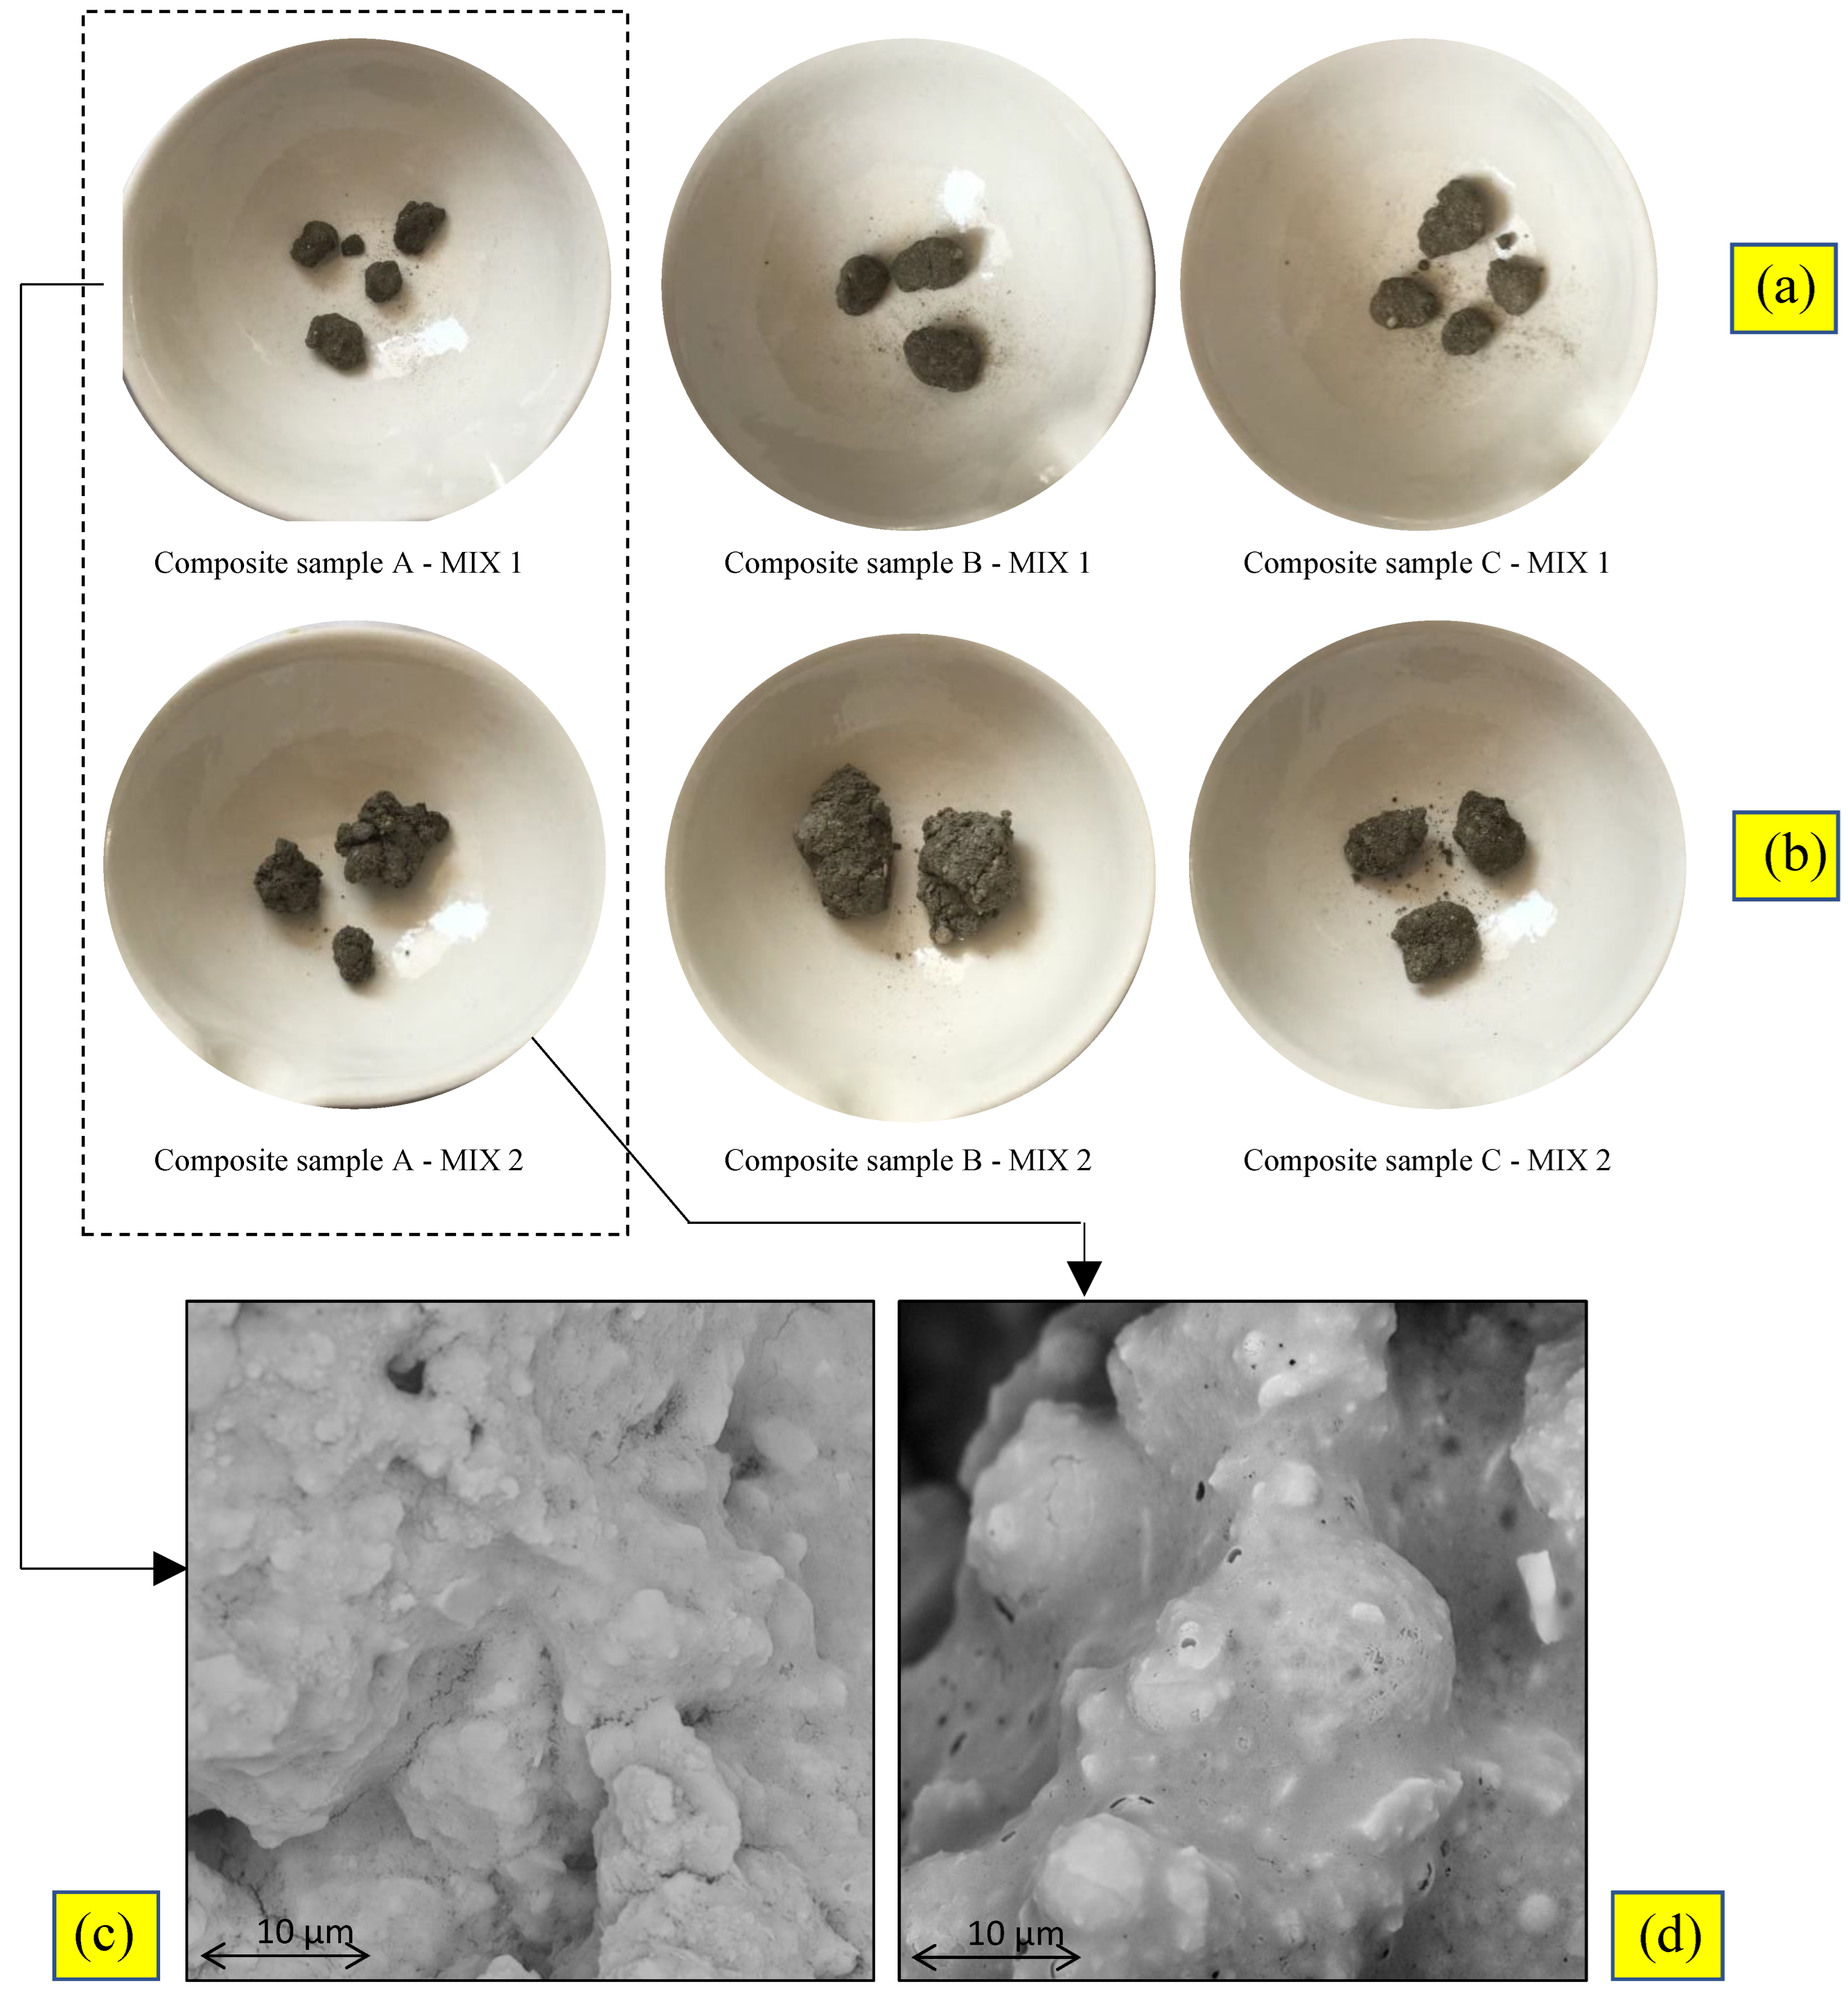
Table 4 and Figure 5 show the results of the granulation process: metal concentrations detected in the leached fluid and morphological analysis, respectively.
The first consideration emerging from the analysis of the results was the total absence of organic contaminants in the leachates. However, these contaminants may have a detrimental effect on the properties of treated materials, slowing down the hydration process of binders [29]. Indeed, the leaching tests on the treated composite sample A showed As and Cu release values higher than the limits imposed by the Italian Decree on waste recycling [53]. This implied potential disposal in non-hazardous waste landfills.
Concerning As (Table 4), the release pattern varied with the sediment type: for sample A, the concentrations exceeded the limit values (50 mg/L) for both mix designs; instead, B and C samples showed the lowest concentrations. Similar behavior was found for Cu concentrations. The concentrations of Hg and Pb always resulted in being lower than the instrumental limit of detection (LOD), equal to 0.005 and 0.02 mg/L, respectively. The pattern of Zn release varied both with the sediment sample and mix design: the leachate concentration varied between 75 µg/L (mix 2, composite sediment sample C) and 20 µg/L (mix 1, composite sediment samples B). However, Zn concentrations were below the limit value (3 mg/L).
According to the limits indicated in EN 13055 standard [38], all treated sediments can be classified as lightweight aggregates. Particularly, dry density values appeared lower than 2000 kg/m3 (Table 4). It is possible to observe that, going from A to C samples, an increase in density occurred. These changes brought a reduction in both porosity and water absorption capacity. The porosity varied between 3.32% (1_C) and 11.86 (2_A); instead, the WAC ranged from 1.64% of the 1_C sample to 6.56% of the 2_A sample. These parameters seemed to decrease as the activator solutions/geopolymer precursors ratio decreased.
The results of the aggregate impact value (AIV) test are reported in Table 4. Composite samples A, B, and C of mixture 1 exhibited values of 31.43%, 34.21%, and 33.56%, respectively; whereas the values measured for the threes samples of mixture 2 were 32.75%, 34.46%, and 31.83%, respectively. The aggregate impact value, when tested according to the requirements of BS 812-2, shall not exceed 45% for structural concrete; instead, aggregates for concrete wearing surfaces should have an aggregate impact value not greater than 30%. For this reason, it should be noted that the examined sediment aggregates are not suitable as concrete aggregates, but they should be employed for pavement construction.
In agreement with previous works [54], the size of the aggregates increased with water content. However, for all mixtures, the size of the aggregates ranged between 4 and 18 mm, according to EN 13055 [38].
The obtained granules were observed in the SEM in order to define their morphological characteristics. SEM images revealed that the geopolymers binders created a matrix composed mainly of amorphous phases that embedded sediment particles (Figure 5c,d).
Sample A_2 presented unreacted fly ash particles in the mix [55]. This observation demonstrates an incomplete hydration development during the granulation process, which can be associated with lower mechanical results (i.e., AIV). Even if the FA:BFS ratio was kept constant in all the mixtures, activator solutions’ different reactivities influenced the final geo-composites’ microstructure. Further, the addition of a fluidifier to improve the workability formed a more homogeneous microstructure.
The physical characterization confirmed the influence of the microstructure of the aggregates. Regarding mix design 1, the treatment of composite sample A produced granules characterized by a lower density (1800 kg/m3), higher porosity (9.17%), and higher WAC (5.05%). For the other two composite samples, the porosity ranged from 4.27% (1_B) to 3.32% (1_C), and similarly, the water absorption ranged from 1.64% (1_C) to 2.27% (1_B) (Table 4). A similar trend was found for mixture 2. This behavior was presumably due to the presence of organic contaminants that inhibited the stabilization/solidification process [56].

4. Discussion

The leaching tests indicated that the concentrations of As in the aggregates from composite sample A were of significant concern (respectively, 158 ± 6 mg/L and 175 ± 18 mg/L for mixtures A_1 and A_2). These values exceeded the acceptance criteria for recycling (>50 mg/L). Instead, the metal leachability of all aggregates from composite samples B and C complied with the acceptance criteria.
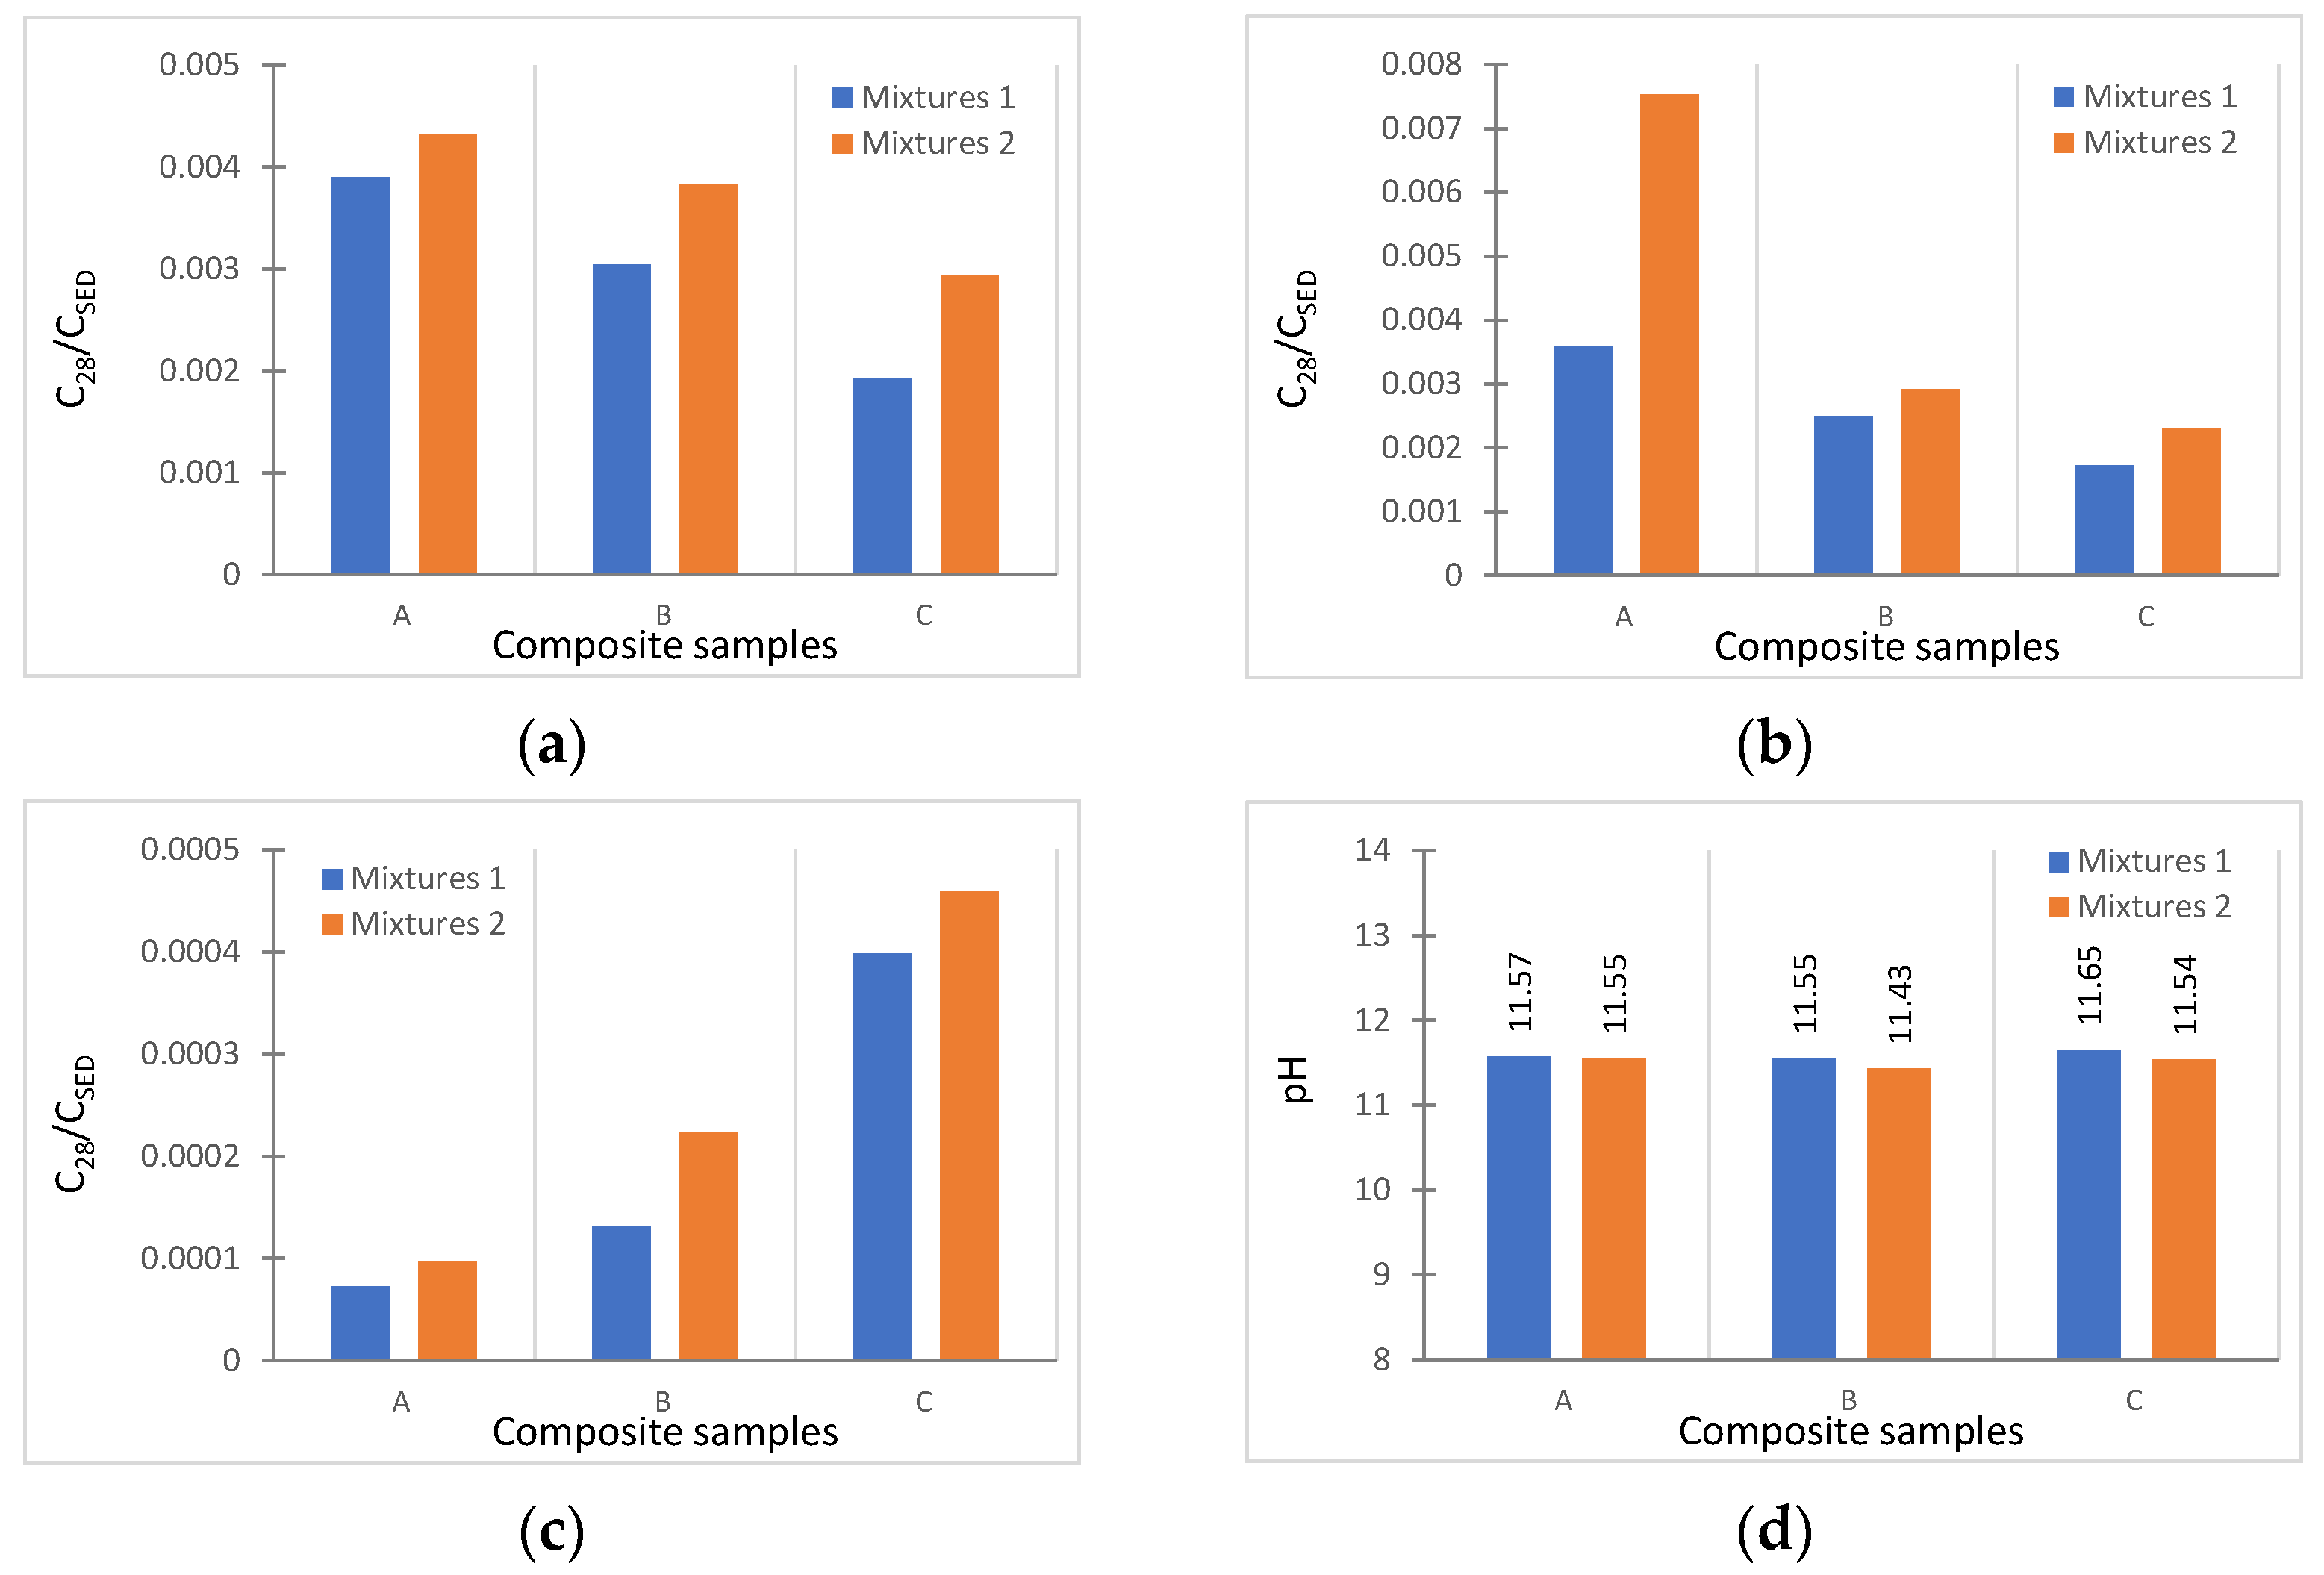
It was possible to calculate the rate of leaching for metals as a ratio of the content of an element in eluate after 28 days (C28 in mg/L) to its total content in the untreated sediment (CSED in mg/kg) (Figure 6). This coefficient provides information about both the amount and rate of leaching of a given element from the treated sediment [32]. The data revealed the highest amounts of As, Cu, and Zn were released from sediments treated with mix design 2. It could be noted that with the increase in the content of activator solutions (from 10.8% of mix 1 to 13.3% of mix 2) and the reduction in mixing water (from 11.5% of mix 1 to 9.1% of mix 2, including the fluidifiers), the leaching behavior of the mixture worsened. This confirms what the literature reported [57]; in fact, the increase in sodium hydroxide in the activating solution and the decrease in mixing water produced more porous granules, and therefore, it tended to release more contaminants.
According to the literature [31,58], the pH is one of the main factors influencing the mobility of metals. In this case, the percentage of geopolymer precursors used in the mixtures led to more alkaline values of pH, varying between 11.65 (C_1) and 11.43 (B_2); this appeared significantly dependent on the CaO and MgO mineral contents present in the FA and BFS [59]. Immobilization of heavy metals in a high-pH condition has been reported elsewhere [60,61]. In addition, As were found to be more mobile in the basic environment [62,63].
On the other hand, in this case, the leaching rate of the samples was not only affected by the difference in pH (Figure 6d). The porosity of aggregates, which is dependent on the spaces between coarser fractions, can favor chemical reduction, and therefore, element leaching [54]. In line with this, with regard to As and Cu, Figure 6 shows higher leachability rates for the most porous samples: A (9.17 to 11.86, respectively, for mixes 1 and 2) and B (4.27 to 7.06, respectively, for mixes 1 and 2). In addition, mix 2 (samples A, B, C) showed more metal release overall than mix 1, in line with the corresponding porosity values (Table 4). Consequently, the high mobility of metals from mixture 2 can be ascribed to the physical characteristics of the granules (i.e., density and porosity). As said above, the granules obtained with mixture 2 were characterized by greater porosity.
To reduce the metal leaching from geopolymers, it is also possible to include additives limiting the capillary porosity of the structure, such as titanium nanoxide [64]. Additionally, several studies confirmed improvements in geopolymer properties by hydrothermal treatment [65,66]. Further physical tests (e.g., specific gravity and crushing strength test) could be conducted on the lightweight artificial aggregates in order to assess additional applications in the construction sector (such as coarse aggregate in concrete mixtures) [67,68].

5. Conclusions

This research explored the feasibility of recycling contaminated marine sediment and various industrial wastes as resources for producing new materials for civil engineering via stabilization/solidification. Out of several mix designs considered, only the mixtures with a weight ratio for CFA:BFS:sediment = 6:1:8 were deemed adequate and tested. While the granules from composite sediment samples B and C had leaching test values compatible with the production of lightweight artificial aggregates, treated sample A (i.e., with the most contaminated sediment) was destined for landfill disposal for non-hazardous waste. While the granules from composite sediment samples B and C had leaching test values compatible with the production of lightweight artificial aggregates, the granules from sample A (i.e., with the most contaminated sediment) were destined for landfill disposal for non-hazardous waste. The results showed that the metals’ leachability was strictly influenced by sample porosity. Regarding the physical characteristics of granules, the observed values of density, WAC, and AIV were such that the granules can be classified as lightweight aggregates for pavement construction. It can be concluded that the water content influenced the micro-structure of the geopolymer: the smaller the water/binder ratio is, the more unreacted components there are, the more porous the structure is, and the higher the leachability is.
Cement-free S/S by granulation of alkaline reagents demonstrated to be a reliable technique for recycling industrial waste. Future experiments should aim at producing and characterizing low-cost aggregates starting from the results obtained from this investigation.

Author Contributions

F.T.: data curation, formal analysis, investigation, writing—original draft, writing—review and editing; F.C.: formal analysis, resources, visualization, writing—review and editing; S.D.G.: investigation, methodology, resources, writing—original draft, validation, writing—review and editing; I.F.: investigation, writing—review and editing; C.F.: formal analysis, resources, visualization, writing—review and editing; C.L.: data curation, formal analysis, visualization, writing—original draft, writing—review and editing; A.P.: investigation, methodology, writing—review and editing; R.C.: conceptualization, supervision, writing—review and editing; M.N.: conceptualization, funding acquisition, project administration, resources, supervision, writing—review and editing. All authors have read and agreed to the published version of the manuscript.

Funding

This research received no external funding.

Data Availability Statement

The data presented in this study are available on request from the corresponding author.

Acknowledgments

The authors appreciate the financial support for this study from the Special Commissioner of the Italian Government for urgent measures of remediation and environmental requalification of Taranto area (South Italy).

Conflicts of Interest

The authors declare no conflict of interest.

References

  1. Todaro, F.; Barjoveanu, G.; De Gisi, S.; Teodosiu, C.; Notarnicola, M. Sustainability assessment of reactive capping alternatives for the remediation of contaminated marine sediments. J. Clean. Prod. 2021, 286, 124946. [Google Scholar] [CrossRef]
  2. Abdel-shafy, H.I.; Mansour, M.S.M. A review on polycyclic aromatic hydrocarbons: Source, environmental impact, effect on human health and remediation. Egypt. J. Pet. 2016, 25, 107–123. [Google Scholar] [CrossRef] [Green Version]
  3. Kujlu, R.; Moslemzadeh, M.; Rahimi, S.; Aghayani, E.; Ghanbari, F.; Mahdavianpour, M. Selecting the best stabilization/solidification method for the treatment of oil-contaminated soils using simple and applied best-worst multi-criteria decision-making method. Environ. Pollut. 2020, 263, 114447. [Google Scholar] [CrossRef] [PubMed]
  4. Wang, L.; Kwok, J.S.H.; Tsang, D.C.W.; Poon, C. Mixture design and treatment methods for recycling contaminated sediment. J. Hazard. Mater. 2015, 283, 623–632. [Google Scholar] [CrossRef]
  5. Coppola, L.; Bellezze, T.; Belli, A.; Bignozzi, M.C.; Bolzoni, F.; Brenna, A.; Yang, F. Binders alternative to Portland cement and waste management for sustainable construction Part 2. J. Appl. Biomater. Funct. Mater. 2018, 16, 207–221. [Google Scholar]
  6. Petrella, A.; Spasiano, D.; Rizzi, V.; Cosma, P.; Race, M.; De Vietro, N. Lead ion sorption by perlite and reuse of the exhausted material in the construction field. Appl. Sci. 2018, 8, 1882. [Google Scholar] [CrossRef] [Green Version]
  7. Wang, D.; Abriak, N.E.; Zentar, R. Strength and deformation properties of Dunkirk marine sediments solidified with cement, lime and fly ash. Eng. Geol. 2013, 166, 90–99. [Google Scholar] [CrossRef]
  8. Couvidat, J.; Benzaazoua, M.; Chatain, V.; Bouamrane, A.; Bouzahzah, H. Feasibility of the reuse of total and processed contaminated marine sediments as fine aggregates in cemented mortars. Construct. Build. Mater. 2016, 112, 892–902. [Google Scholar] [CrossRef] [Green Version]
  9. Messina, F.; Ferone, C.; Molino, A.; Roviello, G.; Colangelo, F.; Molino, B.; Cioffi, R. Synergistic recycling of calcined clayey sediments and water potabilization sludge as geopolymer precursors: Upscaling from binders to precast paving cement-free bricks. Constr. Build. Mater. 2017, 133, 14–26. [Google Scholar] [CrossRef]
  10. Rizzi, V.; D’Agostino, F.; Gubitosa, J.; Fini, P.; Petrella, A.; Agostiano, A.; Semeraro, P.; Cosma, P. An alternative use of olive pomace as a wide-ranging bioremediation strategy to adsorb and recover disperse orange and disperse red industrial dyes from wastewater. Separations 2017, 4, 29. [Google Scholar] [CrossRef] [Green Version]
  11. Tsang, D.C.; Olds, W.E.; Weber, P.A.; Yip, A.C. Soil stabilization using AMD sludge, compost and lignite: TCLP leachability and continuous acid leaching. Chemosphere 2013, 93, 2839–2847. [Google Scholar] [CrossRef]
  12. De Gisi, S.; Todaro, F.; Mesto, E.; Schingaro, E.; Notarnicola, M. Recycling contaminated marine sediments as filling materials by pilot scale stabilization/solidification with lime, organoclay and activated carbon. J. Clean. Prod. 2020, 269, 122416. [Google Scholar] [CrossRef]
  13. Wang, L.; Chen, L.; Tsang, D.C.; Kua, H.W.; Yang, J.; Ok, Y.S.; Ding, S.; Hou, D.; Poon, C.S. The roles of biochar as green admixture for sediment-based construction products. Cement. Concrete. Comp. 2019, 104, 103348. [Google Scholar] [CrossRef]
  14. Shubbar, A.A.; Jafer, H.; Dulaimi, A.; Hashim, K.; Atherton, W.; Sadique, M. The development of a low carbon binder produced from the ternary blending of cement, ground granulated blast furnace slag and high calcium fly ash: An experimental and statistical approach. Constr. Build. Mater. 2018, 187, 1051–1060. [Google Scholar] [CrossRef]
  15. Capobianco, O.; Costa, G.; Baciocchi, R. Assessment of the operating windows of a combined solidification/stabilization and granulation treatment applied to industrial soil in the context of brownfield regeneration. WIT Trans. Eco. Environ. 2014, 181, 577–588. [Google Scholar]
  16. Nakhaei, A.; Marandi, S.M.; Kermani, S.S.; Bagheripour, M.H. Dynamic properties of granular soils mixed with granulated rubber. Soil Dyn. Earthq. 2012, 43, 124–132. [Google Scholar] [CrossRef]
  17. Cioffi, R.; Colangelo, F.; Montagnaro, F.; Santoro, L. Manufacture of artificial aggregate using MSWI bottom ash. J. Waste Manag. 2011, 31, 281–288. [Google Scholar] [CrossRef]
  18. Di Palma, L.; Medici, F.; Vilardi, G. Artificial aggregate from non metallic automotive shredder residue. Chem. Eng. Trans. 2015, 43, 1723–1728. [Google Scholar]
  19. Ren, P.; Ling, T.C.; Mo, K.H. Recent Advances in Artificial Aggregate Production. J. Clean. Prod. 2020, 291, 125215. [Google Scholar] [CrossRef]
  20. Vasugi, V.; Ramamurthy, K. Identification of design parameters influencing manufacture and properties of cold-bonded pond ash aggregate. Mater. Design 2014, 54, 264–278. [Google Scholar] [CrossRef]
  21. Kang, X.; Bate, B.; Chen, R.P.; Yang, W.; Wang, F. Physicochemical and mechanical properties of polymer-amended kaolinite and fly ash–kaolinite mixtures. J. Mater. Civ. Eng. 2019, 31, 04019064. [Google Scholar] [CrossRef]
  22. Lirer, S.; Liguori, B.; Capasso, I.; Flora, A.; Caputo, D. Mechanical and chemical properties of composite materials made of dredged sediments in a fly-ash based geopolymer. J. Environ. Manage 2017, 191, 1–7. [Google Scholar] [CrossRef] [PubMed]
  23. Reddy, V.A.; Solanki, C.H.; Kumar, S.; Reddy, K.R.; Du, Y.J. New ternary blend limestone calcined clay cement for solidification/stabilization of zinc contaminated soil. Chemosphere 2019, 235, 308–315. [Google Scholar] [CrossRef] [PubMed]
  24. Roviello, G.; Menna, C.; Tarallo, O.; Ricciotti, L.; Ferone, C.; Colangelo, F.; Cioffi, R. Preparation, structure and properties of hybrid materials based on geopolymers and polysiloxanes. Mater. Design 2015, 87, 82–94. [Google Scholar] [CrossRef]
  25. Molino, B.; De Vincenzo, A.; Ferone, C.; Messina, F.; Colangelo, F.; Cioffi, R. Recycling of clay sediments for geopolymer binder production. A new perspective for reservoir management in the framework of Italian legislation: The Occhito reservoir case study. Materials 2014, 7, 5603–5616. [Google Scholar] [CrossRef]
  26. El-Eswed, B.I.; Yousef, R.I.; Alshaaer, M.; Hamadneh, I.; Al-Gharabli, S.I.; Khalili, F. Stabilization/solidification of heavy metals in kaolin/zeolite based geopolymers. Int. J. Miner. Process. 2015, 137, 34–42. [Google Scholar] [CrossRef]
  27. Jin, M.; Zheng, Z.; Sun, Y.; Chen, L.; Jin, Z. Resistance of metakaolin-MSWI fly ash based geopolymer to acid and alkaline environments. J. Non-Cryst. Solids 2016, 450, 116–122. [Google Scholar] [CrossRef]
  28. Colangelo, F.; Farina, I.; Travaglioni, M.; Salzano, C.; Cioffi, R.; Petrillo, A. Innovative Materials in Italy for Eco-Friendly and Sustainable Buildings. Materials 2021, 14, 2048. [Google Scholar] [CrossRef]
  29. Almadani, M.; Razak, R.A.; Abdullah, M.M.A.B.; Mohamed, R. Geopolymer-Based Artificial Aggregates: A Review on Methods of Producing, Properties, and Improving Techniques. Materials 2022, 15, 5516. [Google Scholar] [CrossRef]
  30. Takaluoma, E.; Samarina, T. Granulation techniques of geopolymers and alkali-activated materials. In Alkali-Activated Materials in Environmental Technology Applications; Woodhead Publishing: Sawston, UK, 2022; pp. 97–111. [Google Scholar]
  31. Todaro, F.; De Gisi, S.; Notarnicola, M. Sustainable remediation technologies for contaminated marine sediments: Preliminary results of an experimental investigation. Environ. Eng. Manag. J. 2018, 17, 2465–2471. [Google Scholar] [CrossRef]
  32. Todaro, F.; De Gisi, S.; Notarnicola, M. Contaminated marine sediment stabilization/solidification treatment with cement/lime: Leaching behaviour investigation. Environ. Sci. Pollut. Res. Int. 2020, 27, 21407–21415. [Google Scholar] [CrossRef]
  33. Cotecchia, F.; Vitone, C.; Sollecito, F.; Mali, M.; Miccoli, D.; Petti, R.; Milella, D.; Ruggieri, G.; Bottiglieri, O.; Corbelli, V.; et al. A geo-chemo-mechanical study of a highly polluted marine system (Taranto, Italy) for the enhancement of the conceptual site model. Sci. Rep. 2021, 11, 4017. [Google Scholar] [CrossRef]
  34. Vitone, C.; Federico, A.; Puzrin, A.M.; Ploetze, M.; Carrassi, E.; Todaro, F. On the geotechnical characterisation of the polluted submarine sediments from Taranto. Environ. Sci. Pollut. Res. 2016, 23, 12535–12553. [Google Scholar] [CrossRef]
  35. Petrillo, A.; Colangelo, F.; Farina, I.; Travaglioni, M.; Salzano, C.; Cioffi, R. Multi-criteria analysis for Life Cycle Assessment and Life Cycle Costing of lightweight artificial aggregates from industrial waste by double-step cold bonding palletization. J. Clean. Prod. 2022, 351, 131395. [Google Scholar] [CrossRef]
  36. Perumal, P.; Hasnain, A.; Luukkonen, T.; Kinnunen, P.; Illikainen, M. Role of Surfactants on the Synthesis of Impure Kaolin-Based Alkali-Activated, Low-Temperature Porous Ceramics. Open Ceram. 2021, 6, 10009. [Google Scholar] [CrossRef]
  37. Provis, J.L.; Arbi, K.; Bernal, S.A.; Bondar, D.; Buchwald, A.; Castel, A.; Chithiraputhiran, S.; Cyr, M.; Dehghan, A.; Dombrowski-Daube, K.; et al. RILEM TC 247-DTA round robin test: Mix design and reproducibility of compressive strength of alkali-activated concretes. Mater. Struct. 2019, 52, 1–13. [Google Scholar] [CrossRef]
  38. EN 13055; Lightweight Aggregates. iTeh: Toronto, ON, Canada, 2016.
  39. EN 12457-2; Characterisation of Waste—Leaching—Compliance Test for Leaching of Granular Waste Materials and Sludges. iTeh: Toronto, ON, Canada, 2002.
  40. EPA. EPA Method 200.8: Determination of Trace Elements in Waters and Wastes by Inductively Coupled Plasma—Mass Spectrometry; EPA: Washington, DC, USA, 1994. [Google Scholar]
  41. UNI 11060; Cultural Heritage—Natural and Artificial Stones. European Committee for Standardization: Brussels, Belgium, 2003.
  42. BS 812; Methods for Sampling and Testing of Mineral Aggregates Sands and Filters. British Standard Institution: London, UK, 1960.
  43. ICRAM. Values of Intervention for Sediments of Areas Strongly Anthropized with Reference to the Site of Reclamation of National Interest in Taranto; Central Institute for Scientific and Technological Research applied to the Sea: Rome, Italy, 2004. (In Italian) [Google Scholar]
  44. Abora, K.; Beleña, I.; Bernal, S.A.; Dunster, A.; Nixon, P.A.; Provis, J.L.; Tagnit-Hamou, A.; Winnefeld, F. Durability and testing–Chemical matrix degradation processes. In Alkali Activated Materials; Springer: Dordrecht, The Netherlands, 2014; pp. 177–221. [Google Scholar]
  45. Gaál, F.; Szöllősy, I.; Arnold, M.; Paulik, F. Determination of the organic matter, metal carbonate and mobile water in soils simultaneous TG, DTG, DTA and EGA techniques. J. Therm. Anal. Calorim. 1994, 42, 1007–1016. [Google Scholar] [CrossRef]
  46. Oudghiri, F.; García-Morales, J.L.; Rodríguez-Barroso, M.R. Evaluation of Sediments Decontamination by Chelating Agents using Thermogravimetric Analysis. Int. J. Environ. Res. 2015, 9, 657–662. [Google Scholar]
  47. Bensharada, M.; Telford, R.; Stern, B.; Gaffney, V. Loss on ignition vs. thermogravimetric analysis: A comparative study to determine organic matter and carbonate content in sediments. J. Paleolimnol. 2021, 67, 191–197. [Google Scholar] [CrossRef]
  48. Labianca, C.; De Gisi, S.; Todaro, F.; Notarnicola, M. DPSIR model applied to the remediation of contaminated sites. A case study: Mar Piccolo of Taranto. Appl. Sci. 2020, 10, 5080. [Google Scholar] [CrossRef]
  49. Sarkar, A.; Rano, R.; Mishra, K.K.; Sinha, I.N. Particle size distribution profile of some Indian fly ash—A comparative study to assess their possible uses. Fuel Process. Technol. 2005, 86, 1221–1238. [Google Scholar] [CrossRef]
  50. Wang, Z.; Cao, J.; Li, W.; Wang, Y.; Luo, G.; Qiao, Y.; Zhang, Y.; Xu, B. Using a material database and data fusion method to accelerate the process model development of high shear wet granulation. Sci. Rep. 2021, 11, 16514. [Google Scholar] [CrossRef] [PubMed]
  51. Siddique, R.; Cachim, P. Waste and Supplementary Cementitious Materials in Concrete; Woodhead Publishing: Sawston, UK, 2018. [Google Scholar]
  52. FAO. Italian Ministerial Decree Identification of not-hazardous waste subjected to simplified recovery procedures. Ital. Off. J. 1988, 16, 88. (In Italian) [Google Scholar]
  53. Colangelo, F.; Messina, F.; Di Palma, L.; Cioffi, R. Recycling of non-metallic automotive shredder residues and coal fly-ash in cold-bonded aggregates for sustainable concrete. Compos. B Eng. 2017, 116, 46–52. [Google Scholar] [CrossRef]
  54. Hattaf, R.; Benchikhi, M.; Azzouzi, A.; El Ouatib, R.; Gomina, M.; Samdi, A.; Moussa, R. Preparation of Cement Clinker from Geopolymer-Based Wastes. Materials 2021, 14, 6534. [Google Scholar] [CrossRef]
  55. Pan, Y.; Rossabi, J.; Pan, C.; Xie, X. Stabilization/solidification characteristics of organic clay contaminated by lead when using cement. J. Hazard. Mater. 2019, 362, 132–139. [Google Scholar] [CrossRef]
  56. Shi, C.; Fernández-Jiménez, A. Stabilization/solidification of hazardous and radioactive wastes with alkali-activated cements. J. Hazard. Mater. 2006, 137, 1656–1663. [Google Scholar] [CrossRef]
  57. Kogbara, R.B.; Al-Tabbaa, A.; Yi, Y.; Stegemann, J.A. pH-dependent leaching behaviour and other performance properties of cement-treated mixed contaminated soil. J. Environ. Sci. 2012, 24, 1630–1638. [Google Scholar] [CrossRef]
  58. Komonweeraket, K.; Cetin, B.; Aydilek, A.H.; Benson, C.H.; Edil, T.B. Effects of pH on the leaching mechanisms of elements from fly ash mixed soils. Fuel 2015, 140, 788–802. [Google Scholar] [CrossRef]
  59. De Gisi, S.; Romaniello, L.; Dalessandro, M.; Todaro, F.; Notarnicola, M. Recovery of iron rich residues from integrated steel making process by hydrated lime/molasses pressurised cold agglomeration. J. Clean. Prod. 2019, 233, 830–840. [Google Scholar] [CrossRef]
  60. Arfania, H.; Asadzadeh, F. Mobility of heavy metals after spiking in relation to sediment and metal properties: Leaching column study. J. Soils Sediment 2015, 15, 2311–2322. [Google Scholar] [CrossRef]
  61. Tigue, A.A.S.; Malenab, R.A.J.; Dungca, J.R.; Yu, D.E.C.; Promentilla, M.A.B. Chemical Stability and Leaching Behavior of One-Part Geopolymer from Soil and Coal Fly Ash Mixtures. Minerals 2018, 8, 411. [Google Scholar] [CrossRef] [Green Version]
  62. Zhang, J.; Provis, J.L.; Feng, D.; van Deventer, J.S.J. Geopolymers for immobilization of Cr6+, Cd2+, and Pb2+. J. Hazard. Mater. 2008, 157, 587–598. [Google Scholar] [CrossRef]
  63. Xu, H.; Gong, W.; Syltebo, L.; Izzo, K.; Lutze, W.; Pegg, I.L. Effect of blast furnace slag grades on fly ash based geopolymer waste forms. Fuel 2014, 133, 332–340. [Google Scholar] [CrossRef]
  64. Łach, M.; Korniejenko, K.; Walter, J.; Stefańska, A.; Mikuła, J. Decreasing of Leaching and Improvement of Geopolymer Properties by Addition of Aluminum Calcium Cements and Titanium Oxide. Materials 2020, 13, 495. [Google Scholar] [CrossRef] [Green Version]
  65. Łach, M.; Hebdowska-Krupa, M.; Komar, N. Strength and leachability of geopolymers with the addition of municipal solid waste ashes. IOP Conf. Ser. Mater. Sci. Eng. 2019, 706, 012010. [Google Scholar] [CrossRef]
  66. Li, Y.-Y.; Zhang, T.-T.; Jia, S.B.; Liu, J.; Quan, X.-H.; Zheng, W. Mechanical properties and leaching characteristics of geopolymer-solidified/stabilized lead-contaminated soil. Adv. Civ. Eng. 2019, 2019, 6015769. [Google Scholar] [CrossRef] [Green Version]
  67. Gesoğlu, M.; Güneyisi, E.; Alzeebaree, R.; Mermerdaş, K. Effect of silica fume and steel fiber on the mechanical properties of the concretes produced with cold bonded fly ash aggregates. Constr. Build. Mater. 2013, 40, 982–990. [Google Scholar] [CrossRef]
  68. Güneyisi, E.; Gesoğlu, M.; Mohamadameen, A.; Alzeebaree, R.; Algın, Z.; Mermerdaş, K. Enhancement of shrinkage behavior of lightweight aggregate concretes by shrinkage reducing admixture and fiber reinforcement. Constr. Build. Mater. 2018, 54, 91–98. [Google Scholar] [CrossRef]
Figure 1. Overview of the experimental framework.
Materials 16 02399 g001
Figure 2. Sediments: (a) particle size distribution; (b) TGA curves; (c) XRD spectra; (d) SEM images (scale 10,000:1).
Materials 16 02399 g002
Figure 3. Coal fly ash: (a) particle size distribution; (b) TGA curves; (c) X-ray diffraction pattern; (d) SEM image (scale 1000:1).
Materials 16 02399 g003
Figure 4. Blast Furnace Slag: (a) particle size distribution; (b) TGA curves; (c) X-ray diffraction pattern; (d) SEM image (scale 1000:1).
Materials 16 02399 g004
Figure 5. Granules performed by the S/S treatments with mixtures 1 (a) and 2 (b); SEM images of sample A treated by mixtures 1 (c) and 2 (d).
Materials 16 02399 g005
Figure 6. Rates of leaching of metals (C28/CSED) for As (a), Cu (b), and Zn (c); and pH trend (d).
Materials 16 02399 g006
Table 1. Mixture design for S/S treatment (values in dry weight %).
MixActivator SolutionsGeopolymer PrecursorsWaterFluidifierSediment
Na2SiO5NaOHH2OCFABFS
19.81.02.031.25.27.22.041.6
211.41.82.631.25.25.21.041.6
Note: Na2SiO3 = sodium silicate; NaOH = sodium hydroxide; H2O = water component in activator solutions; CFA = coal fly ash; BFS = Blast Furnace Slag.
Table 2. Chemo-physical and particle-size characterizations of natural sediment samples.
UnitNatural SampleLimit Value
SP3SP4SP6SP7SP9SP11SP12SP14SP16SP17
Chemo-Physical parameters
pHu. pH9.18.99.19.29.29.28.98.89.19.3-
EhmV−109.5−100.9−106.5−115.8−114.6−117.8−98.2−100.9−116.9−122.7-
MC%50.8352.050.620.251.853.858.465.151.854.2-
OM%19.9023.419.420.217.118.812.923.718.517.5-
Ash%29.2724.630.059.631.127.428.711.229.728.3-
GF%4.8020.6812.8713.693.967.4131.7618.4314.397.47-
SF%12.2044.1614.8727.724.2815.6121.9733.3712.2314.76-
PF%83.0035.1672.2658.5991.7676.9846.2748.2073.3877.76-
Inorganic contaminants
Asmg/kg11.631.748.465.29.213.313.419.011.818.320.0
Bemg/kg0.70.81.21.01.01.10.60.90.71.5-
Cdmg/kg0.42.50.91.00.50.50.51.30.40.61.00
Crmg/kg54.581.880.878.075.271.643.365.357.176.7160.0
Comg/kg6.58.49.911.18.57.004.97.15.57.9-
Cumg/kg53.5172.1121.2131.958.464.662.9117.855.380.245.0
Pbmg/kg102.5314.6241.3392.050.294.057.9106.774.8126.750.0
Hgmg/kg4.28.114.324.01.23.51.52.52.65.90.80
Nimg/kg31.940.650.157.248.937.526.844.230.441.8100.0
Vmg/kg56.764.0105.875.073.677.162.0103.259.984.4-
Znmg/kg146.3541.5430.8464.2116.2193.8206.9423.8159.0222.7110.0
Organic contaminants
ΣPAHµg/kg215911,6526552581012639227143172190245154000
ΣPCBµg/kg277316322,25319,2832331794607234516603184190
Note: measurements exceeding the limit value are in bold.
Table 3. Chemo-physical and particle-size characterizations of composite samples.
UnitComposite Sample (Average ± St. Dev)Limit Value
ABC
Chemo-Physical parameters
pHpH unit9.1 ± 0.59.1 ± 0.39.0 ± 0.4-
EhmV−111.5 ± 2.9−114.0 ± 2.2−105.3 ± 2.6-
MC%44.2 ± 0.529.4 ± 0.858.4 ± 0.9-
OM%20.3 ± 0.518.4 ± 0.818.2 ± 0.9-
Ash%35.5 ± 0.542.2 ± 0.823.4 ± 0.9-
GF%13.7 ± 1.55.4 ± 1.521.5 ± 1.5-
SF%25.4 ± 1.510.7 ± 1.522.5 ± 1.5-
PF%60.9 ± 1.583.9 ± 1.556.0 ± 1.5-
Inorganic contaminants
Asmg/kg40.5 ± 0.511.5 ± 0.415.0 ± 0.320.0
Bemg/kg1.0 ± 0.10.9 ± 0.10.7 ± 0.1-
Camg/kg1.2 ± 0.10.5 ± 0.10.7 ± 0.11.00
Crmg/kg79.2 ± 2.465.1 ± 1.654.3 ± 0.9160.0
Comg/kg9.3 ± 0.57.3 ± 0.15.8 ± 0.4-
Cumg/kg127.4 ± 4.658.9 ± 1.678.7 ± 2.945.0
Pbmg/kg268.7 ± 1.882.4 ± 1.179.8 ± 1.450.0
Hgmg/kg13.0 ± 0.23.0 ± 0.52.2 ± 0.60.80
Nimg/kg47.4 ± 1.339.4 ± 1.733.8 ± 1.8100.0
Vmg/kg82.3 ± 1.869.1 ± 1.975.1 ± 1.5-
Znmg/kg664.8 ± 1.6152.1 ± 1.1263.2 ± 1.8110.0
Organic contaminants
ΣPAHsµg/kg7130 ± 701450 ± 651930 ± 834000
ΣPCBsµg/kg11,950 ± 551135 ± 401535 ± 45190
Note: measurements exceeding the limit value are in bold.
Table 4. Twenty-eight-day performances of aggregates.
Leaching Characteristics of Granules
MixSampleParameterAs
(µg/L)
Cu
(µg/L)
Hg
(µg/L)
Pb
(µg/L)
Zn
(µg/L)
1ALeachate concentration158 ± 6554 ± 26<LOD<LOD30 ± 1
Environmental goals (a)
BLeachate concentration35 ± 14147 ± 19< LOD<LOD20 ± 1
Environmental goals (a)
CLeachate concentration29 ± 1136 ± 10<LOD<LOD65 ± 1
Environmental goals (a)
2ALeachate concentration175 ± 18957 ± 29<LOD<LOD40 ± 1
Environmental goals (a)
BLeachate concentration44 ± 2172 ± 20<LOD<LOD34 ± 1
Environmental goals (a)
CLeachate concentration44 ± 2181 ± 10<LOD<LOD75 ± 1
Environmental goals (a)
Physical Characteristics of Granules
MixSampleParameterDensity
(kg/m3)
Porosity
(%)
WAC
(%)
AIV
(%)
1ATest results1800 ± 539.17 ± 0.305.05 ± 0.0532.75 ± 0.12
Technical goals (b)
BTest results1830 ± 554.27 ± 0.152.27 ± 0.0234.46 ± 0.13
Technical goals (b)
CTest results1840 ± 553.32 ± 0.101.64 ± 0.0134.83 ± 0.12
Technical goals (b)
2ATest results1810 ± 5311.86 ± 0.356.56 ± 0.0531.43 ± 0.12
Technical goals (b)
BTest results1837 ± 557.06 ± 0.203.85 ± 0.0333.21 ± 0.13
Technical goals (b)
CTest results1852 ± 564.44 ± 0.152.40 ± 0.0233.56 ± 0.12
Technical goals (b)
Note: (a) Environmental goals: positive (✓) and negative (✗) if metal concentrations are, respectively, lower and higher than law limits [45]; LODs are about 0.0005 and 0.02 mg/L for Hg and Pb, respectively. (b) Technical goals: positive (✓) and negative (✗) if test results are, respectively, lower and higher than the European Standard for lightweight aggregates [31].
Disclaimer/Publisher’s Note: The statements, opinions and data contained in all publications are solely those of the individual author(s) and contributor(s) and not of MDPI and/or the editor(s). MDPI and/or the editor(s) disclaim responsibility for any injury to people or property resulting from any ideas, methods, instructions or products referred to in the content.