
An Internal Real-Time Microscopic Diagnosis of a Proton Battery Stack during Charging and Discharging


Abstract
:1. Introduction
2. Design and Process of Flexible Seven-in-One Microsensor
- (a)
- First, the PI film was cleaned with acetone and organic methanol solutions, respectively, followed by deionized water to rinse the substrate surface with chemical solvents;
- (b)
- AZP 4620 was spin-coated on PI film to define the pattern;
- (c)
- Use an electron beam evaporation machine to evaporate Ti as the adhesion layer of the Au and PI films to increase the adhesion of the Au and PI films. Evaporate Ti with a thickness of 150 Å at a rate of 0.1 Å/s as the adhesion layer, and then evaporate 1500 Å-thick Au.
- (d)
- Spin-coat LTC 9320 on the flexible seven-in-one microsensor to complete the protective layer.
- (e)
- Spin-coat LTC 9305 on the humidity sensor to complete the dielectric layer.
- (f)
- Evaporate 150 Å-thick Cr and 1500 Å-thick Au sequentially at a rate of 0.1 Å/s, and then spin-coat AZP 4620 on the micro pressure sensor to complete the upper electrode of the micro pressure sensor.
- (g)
- Spin-coat AZP 4620 on the micro hydrogen sensor, and then use an electron beam evaporation machine to vapor-deposit SnO2 to a thickness of 150 Å and Pt to a thickness of 25 Å at a rate of 0.05 Å/s as the catalyst for the micro hydrogen sensor. For the material, the fabrication of the micro hydrogen sensor is complete.
- (h)
- Spin-coat AZP 4620 on the micro oxygen sensor, and then use an electron beam evaporation machine to vapor-deposit Zn to a thickness of 25 Å as a catalyst for the micro oxygen sensor on the substrate to complete the fabrication of the micro oxygen sensor.
3. Internal Real-Time Microscopic Diagnosis of Proton Battery Stack during Charging
3.1. Proton Battery Stack Charge Experiment
3.2. Internal Current Measurement during Proton Battery Stack Charging
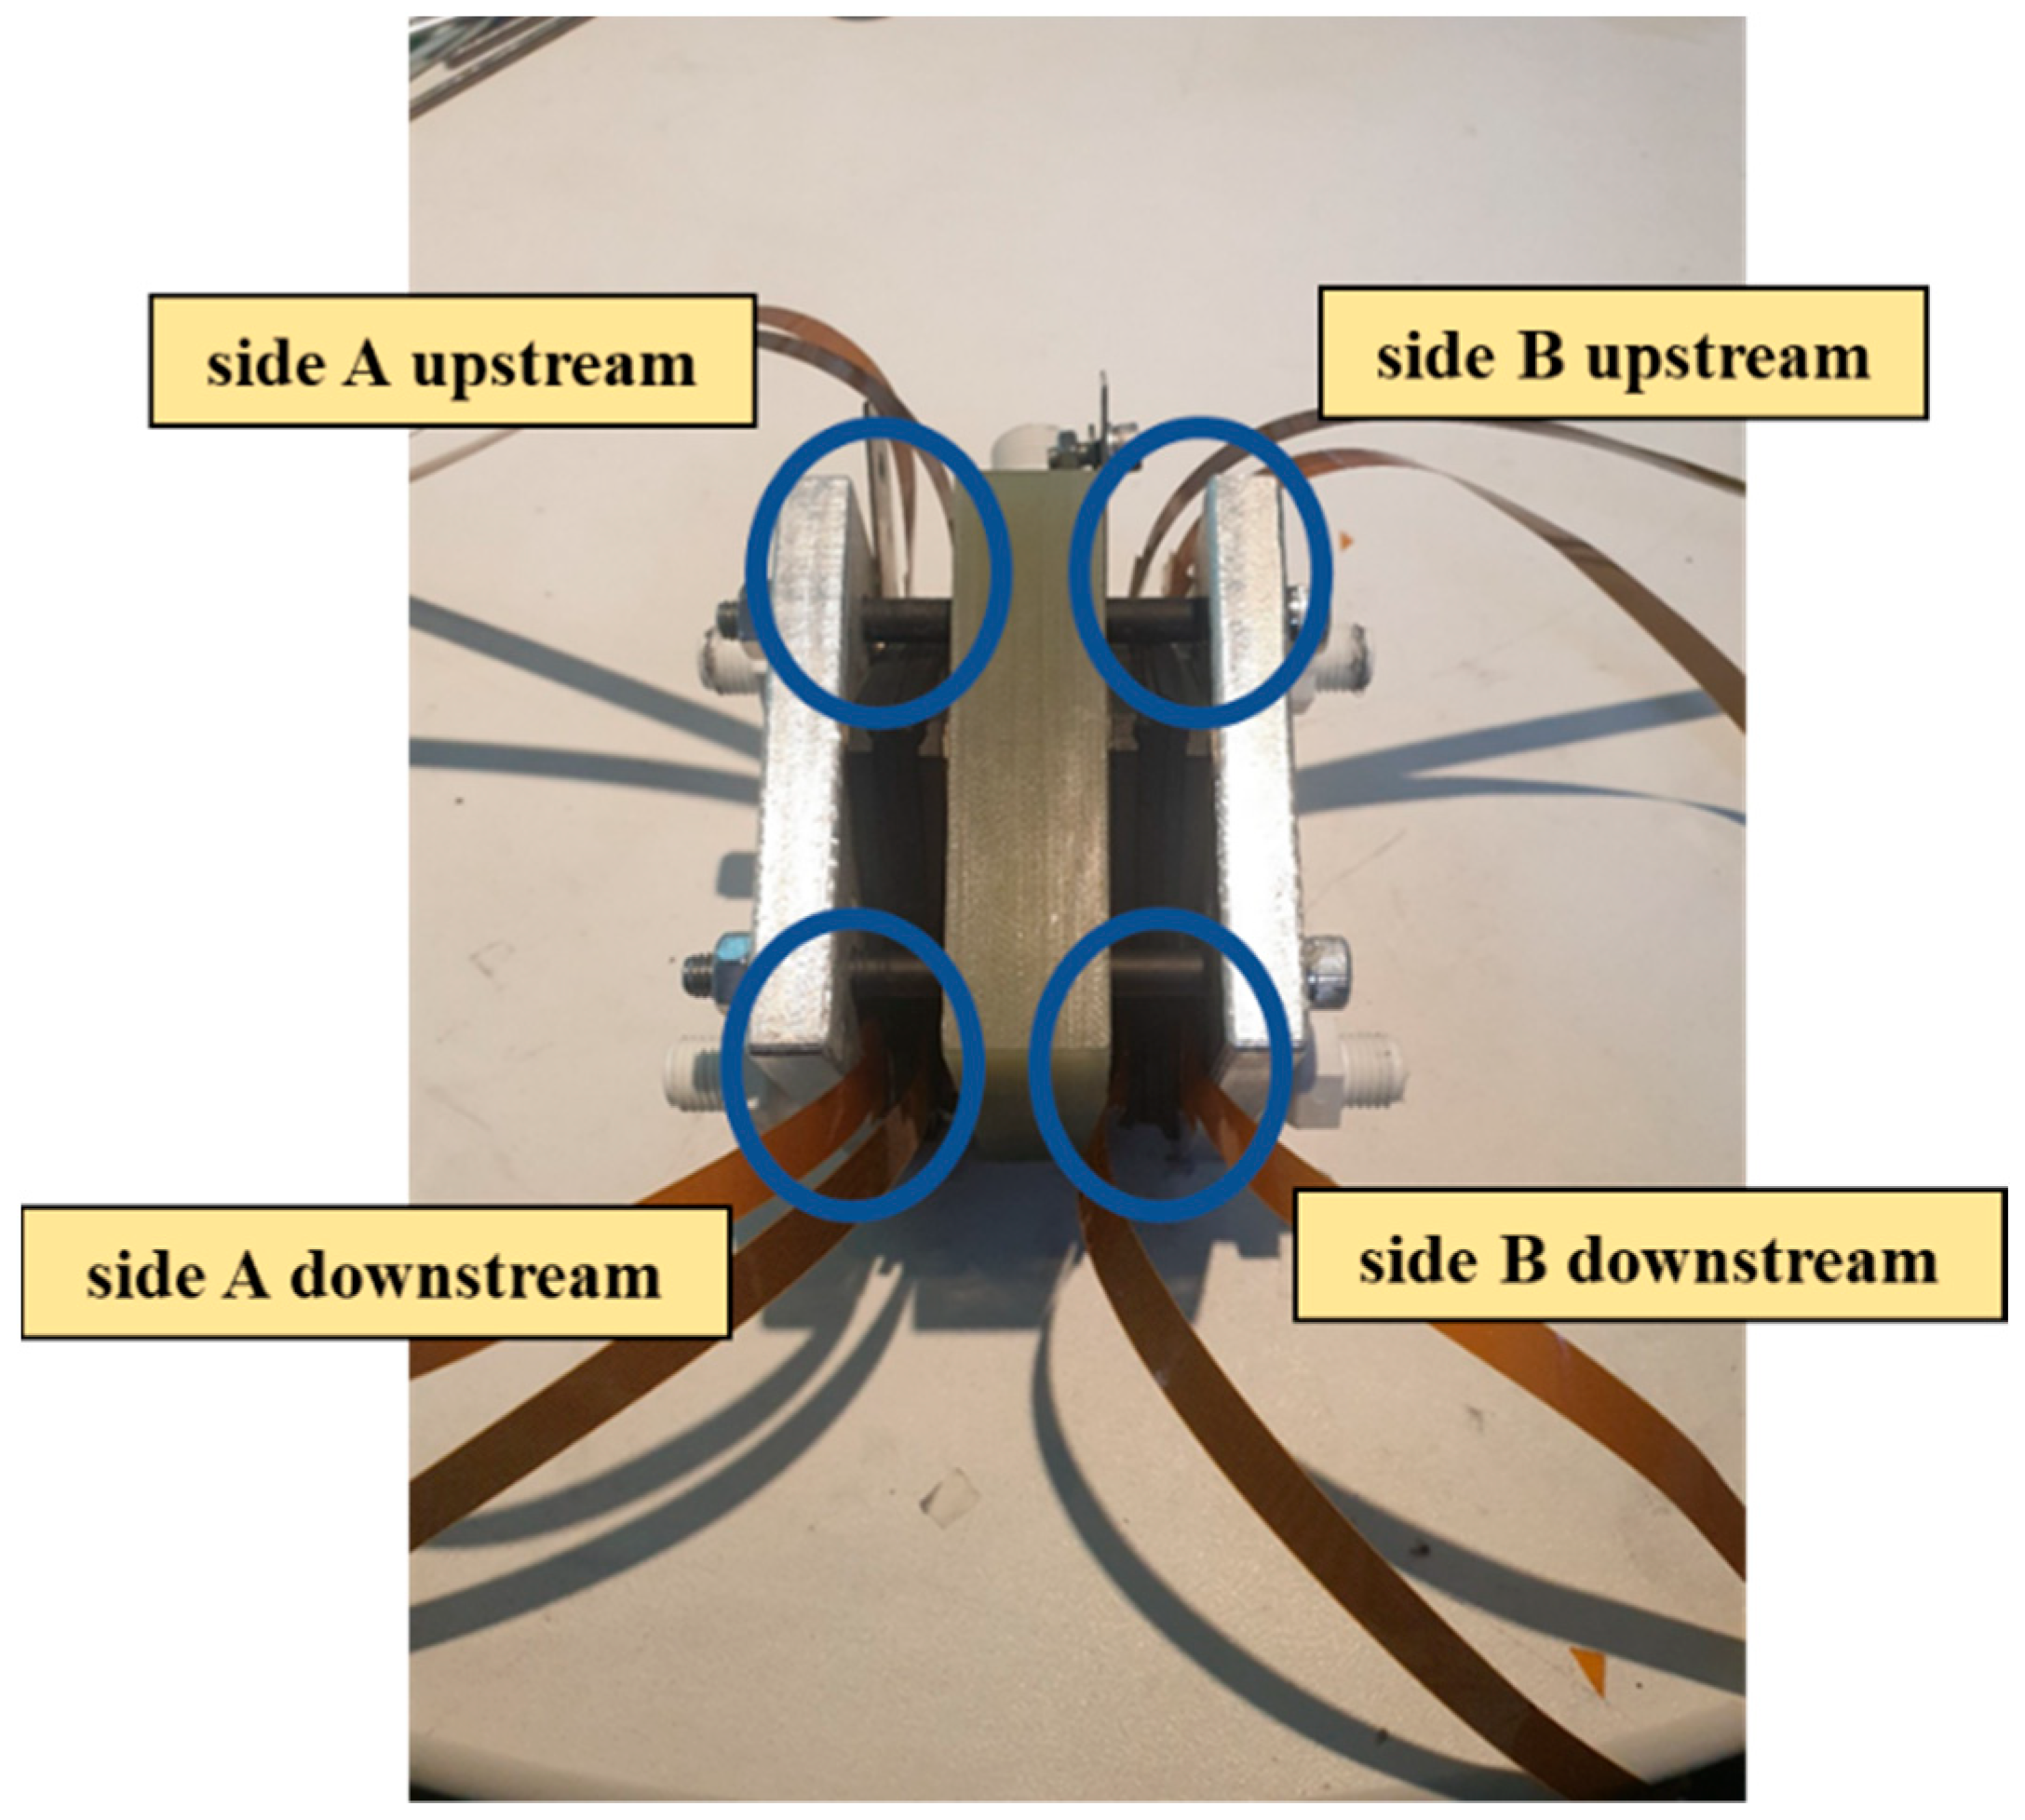
3.3. Internal Flow Measurement of the Proton Battery Stack
3.4. Internal Humidity Measurement during Proton Battery Stack Charging
3.5. Internal Oxygen Sensing during Proton Battery Stack Charging
4. Internal Real-Time Microscopic Diagnosis of Proton Battery Stack during Discharging
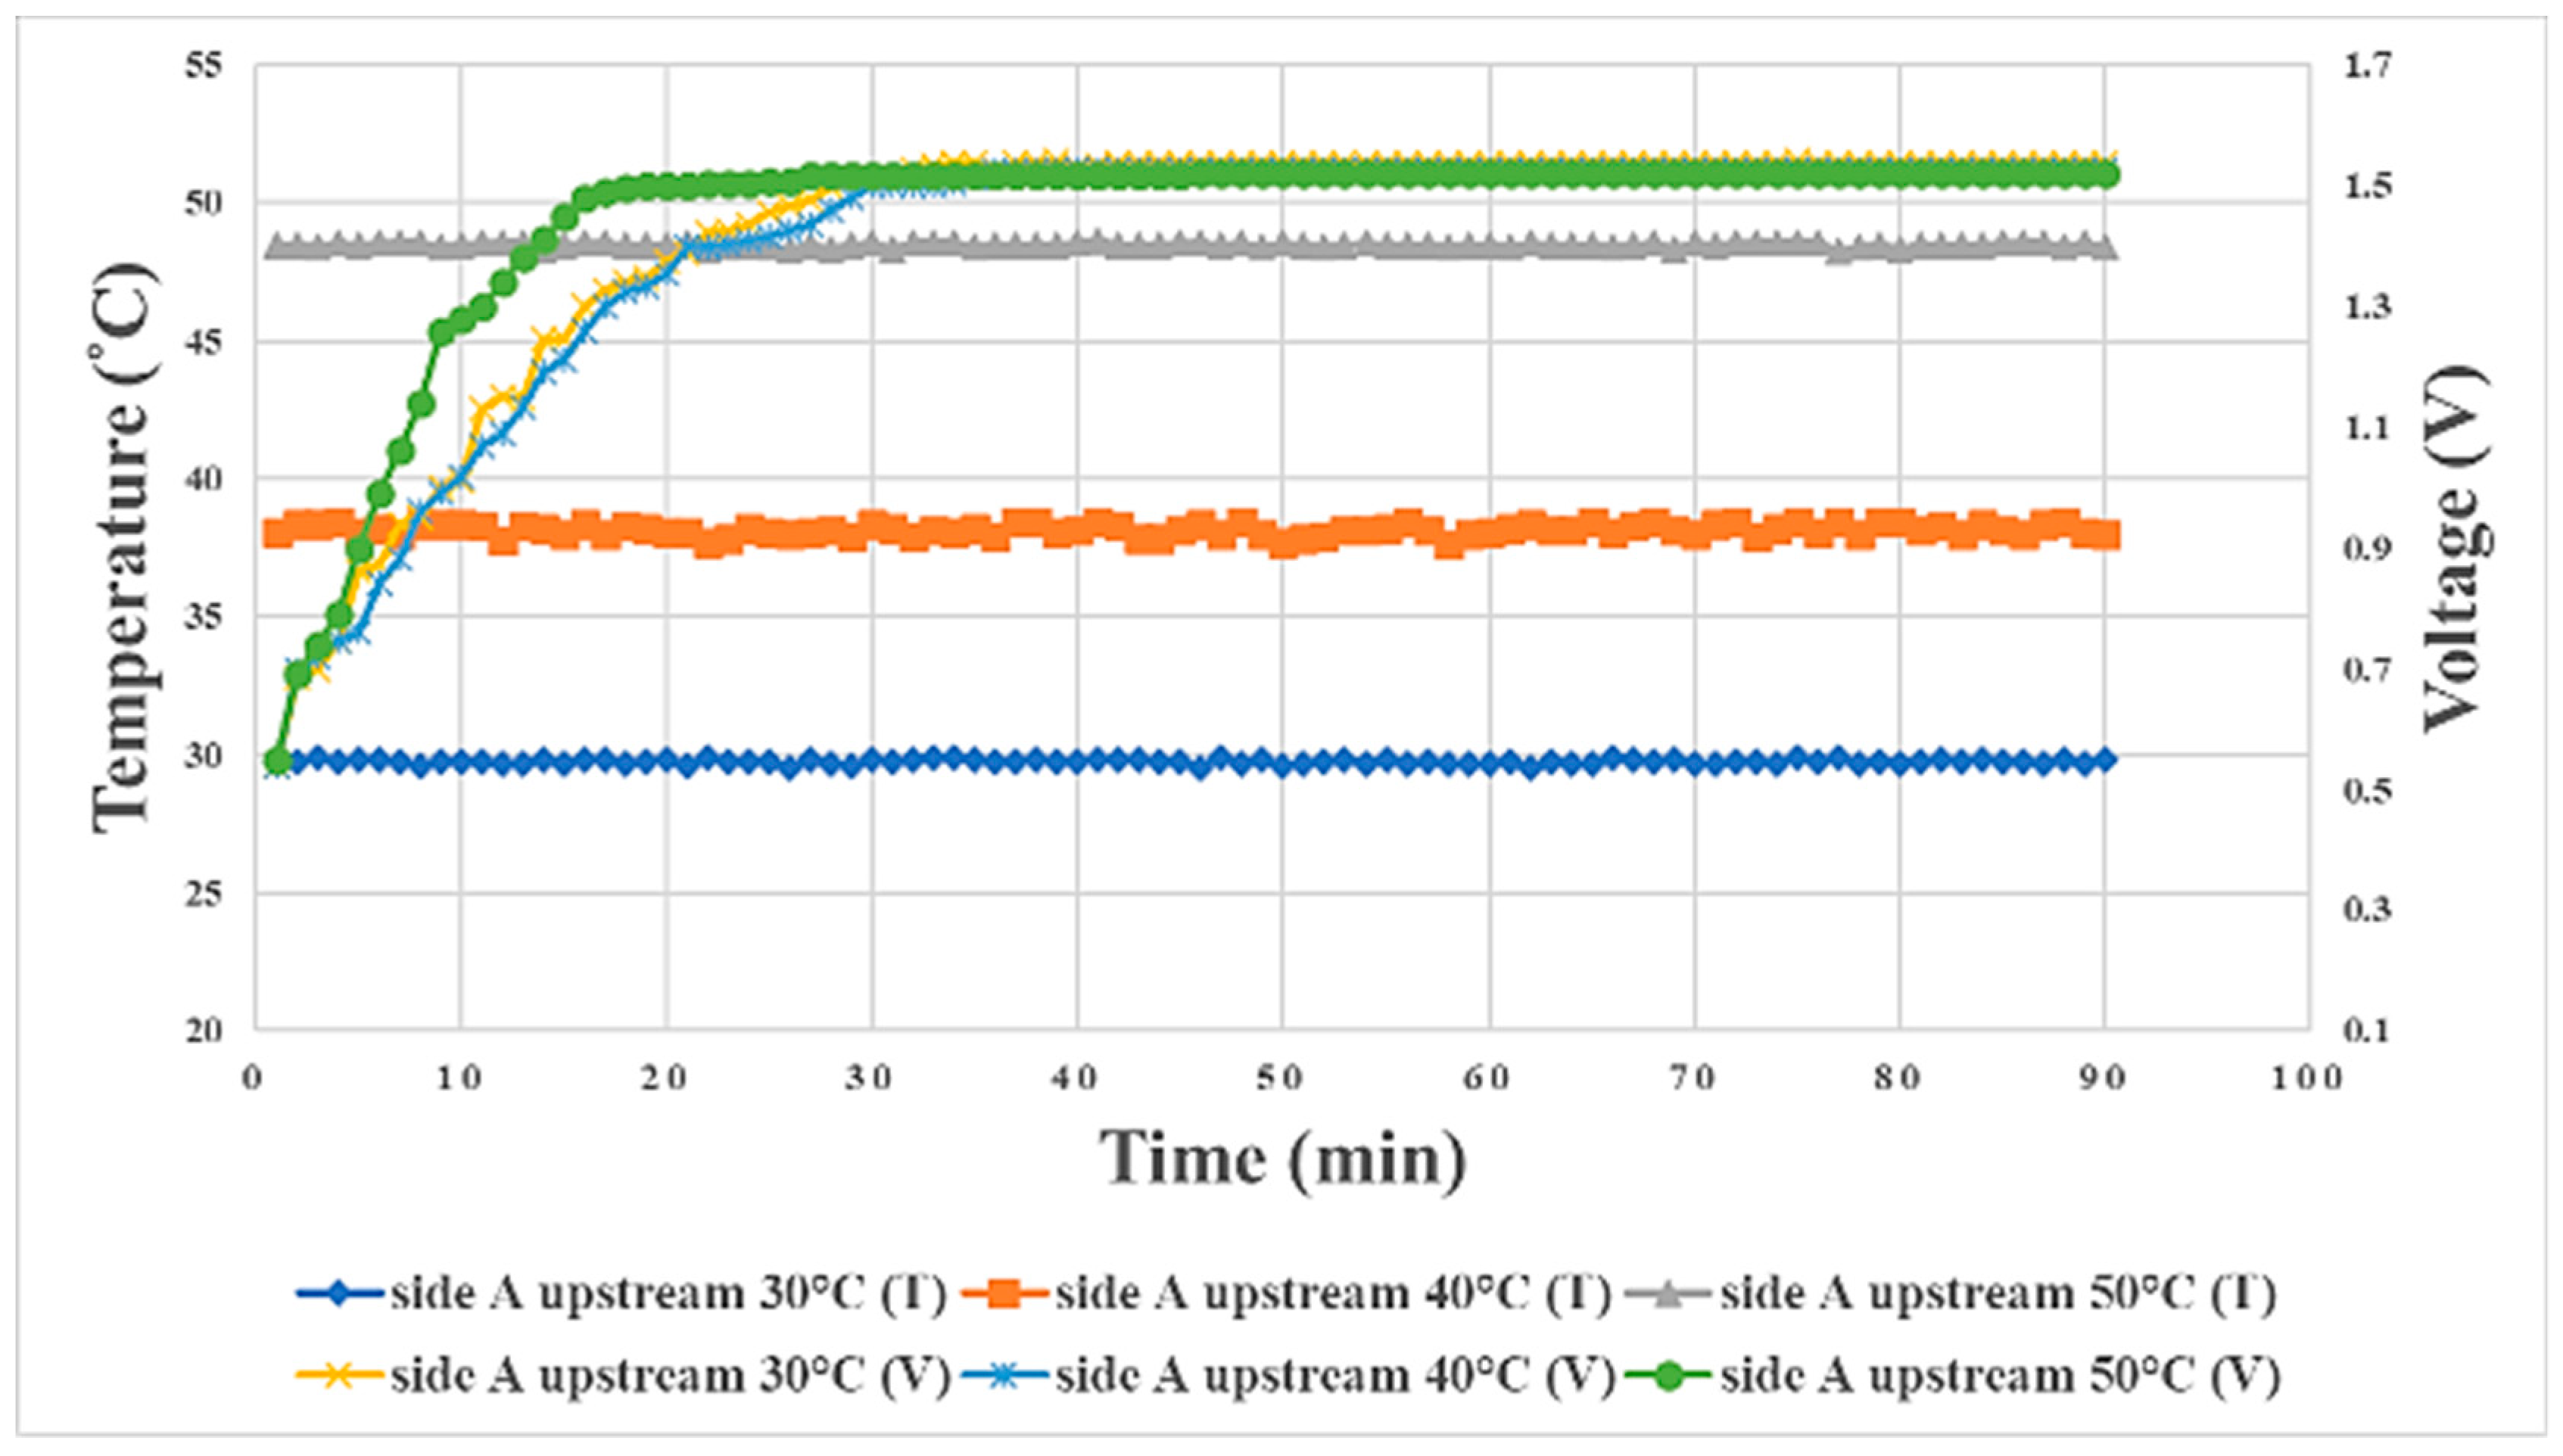
4.1. Proton Battery Stack Discharge Performance
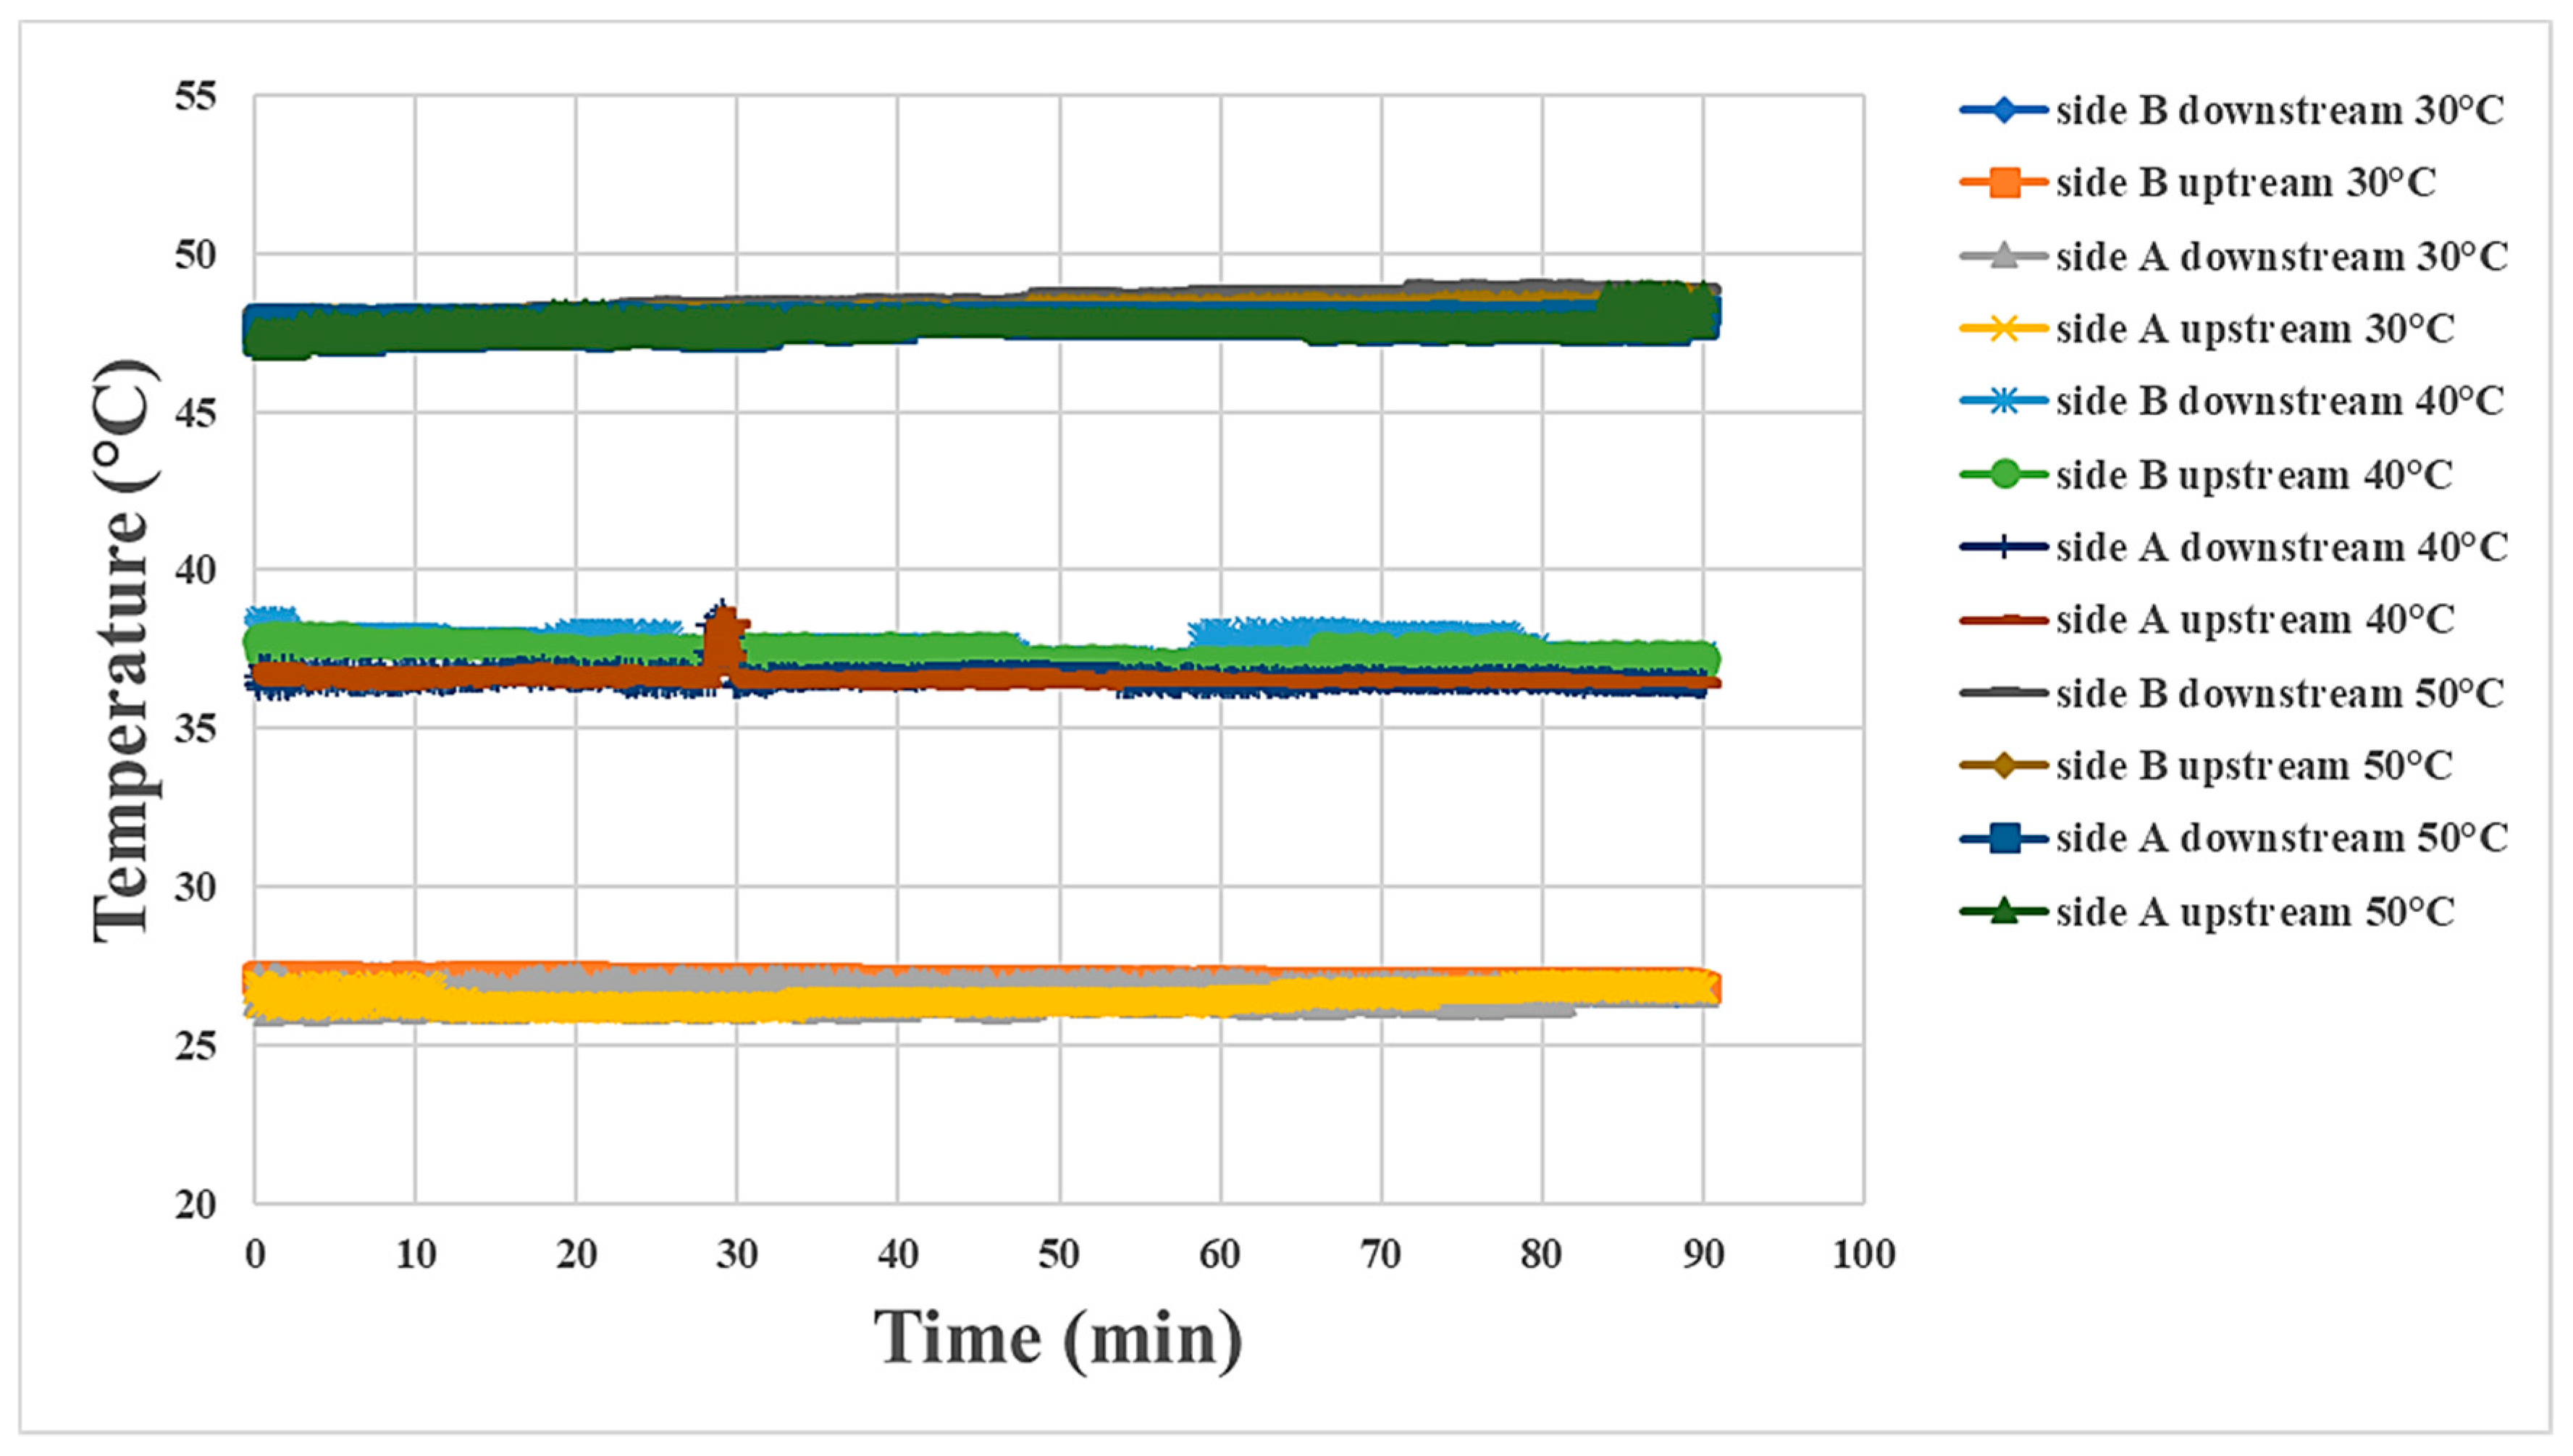
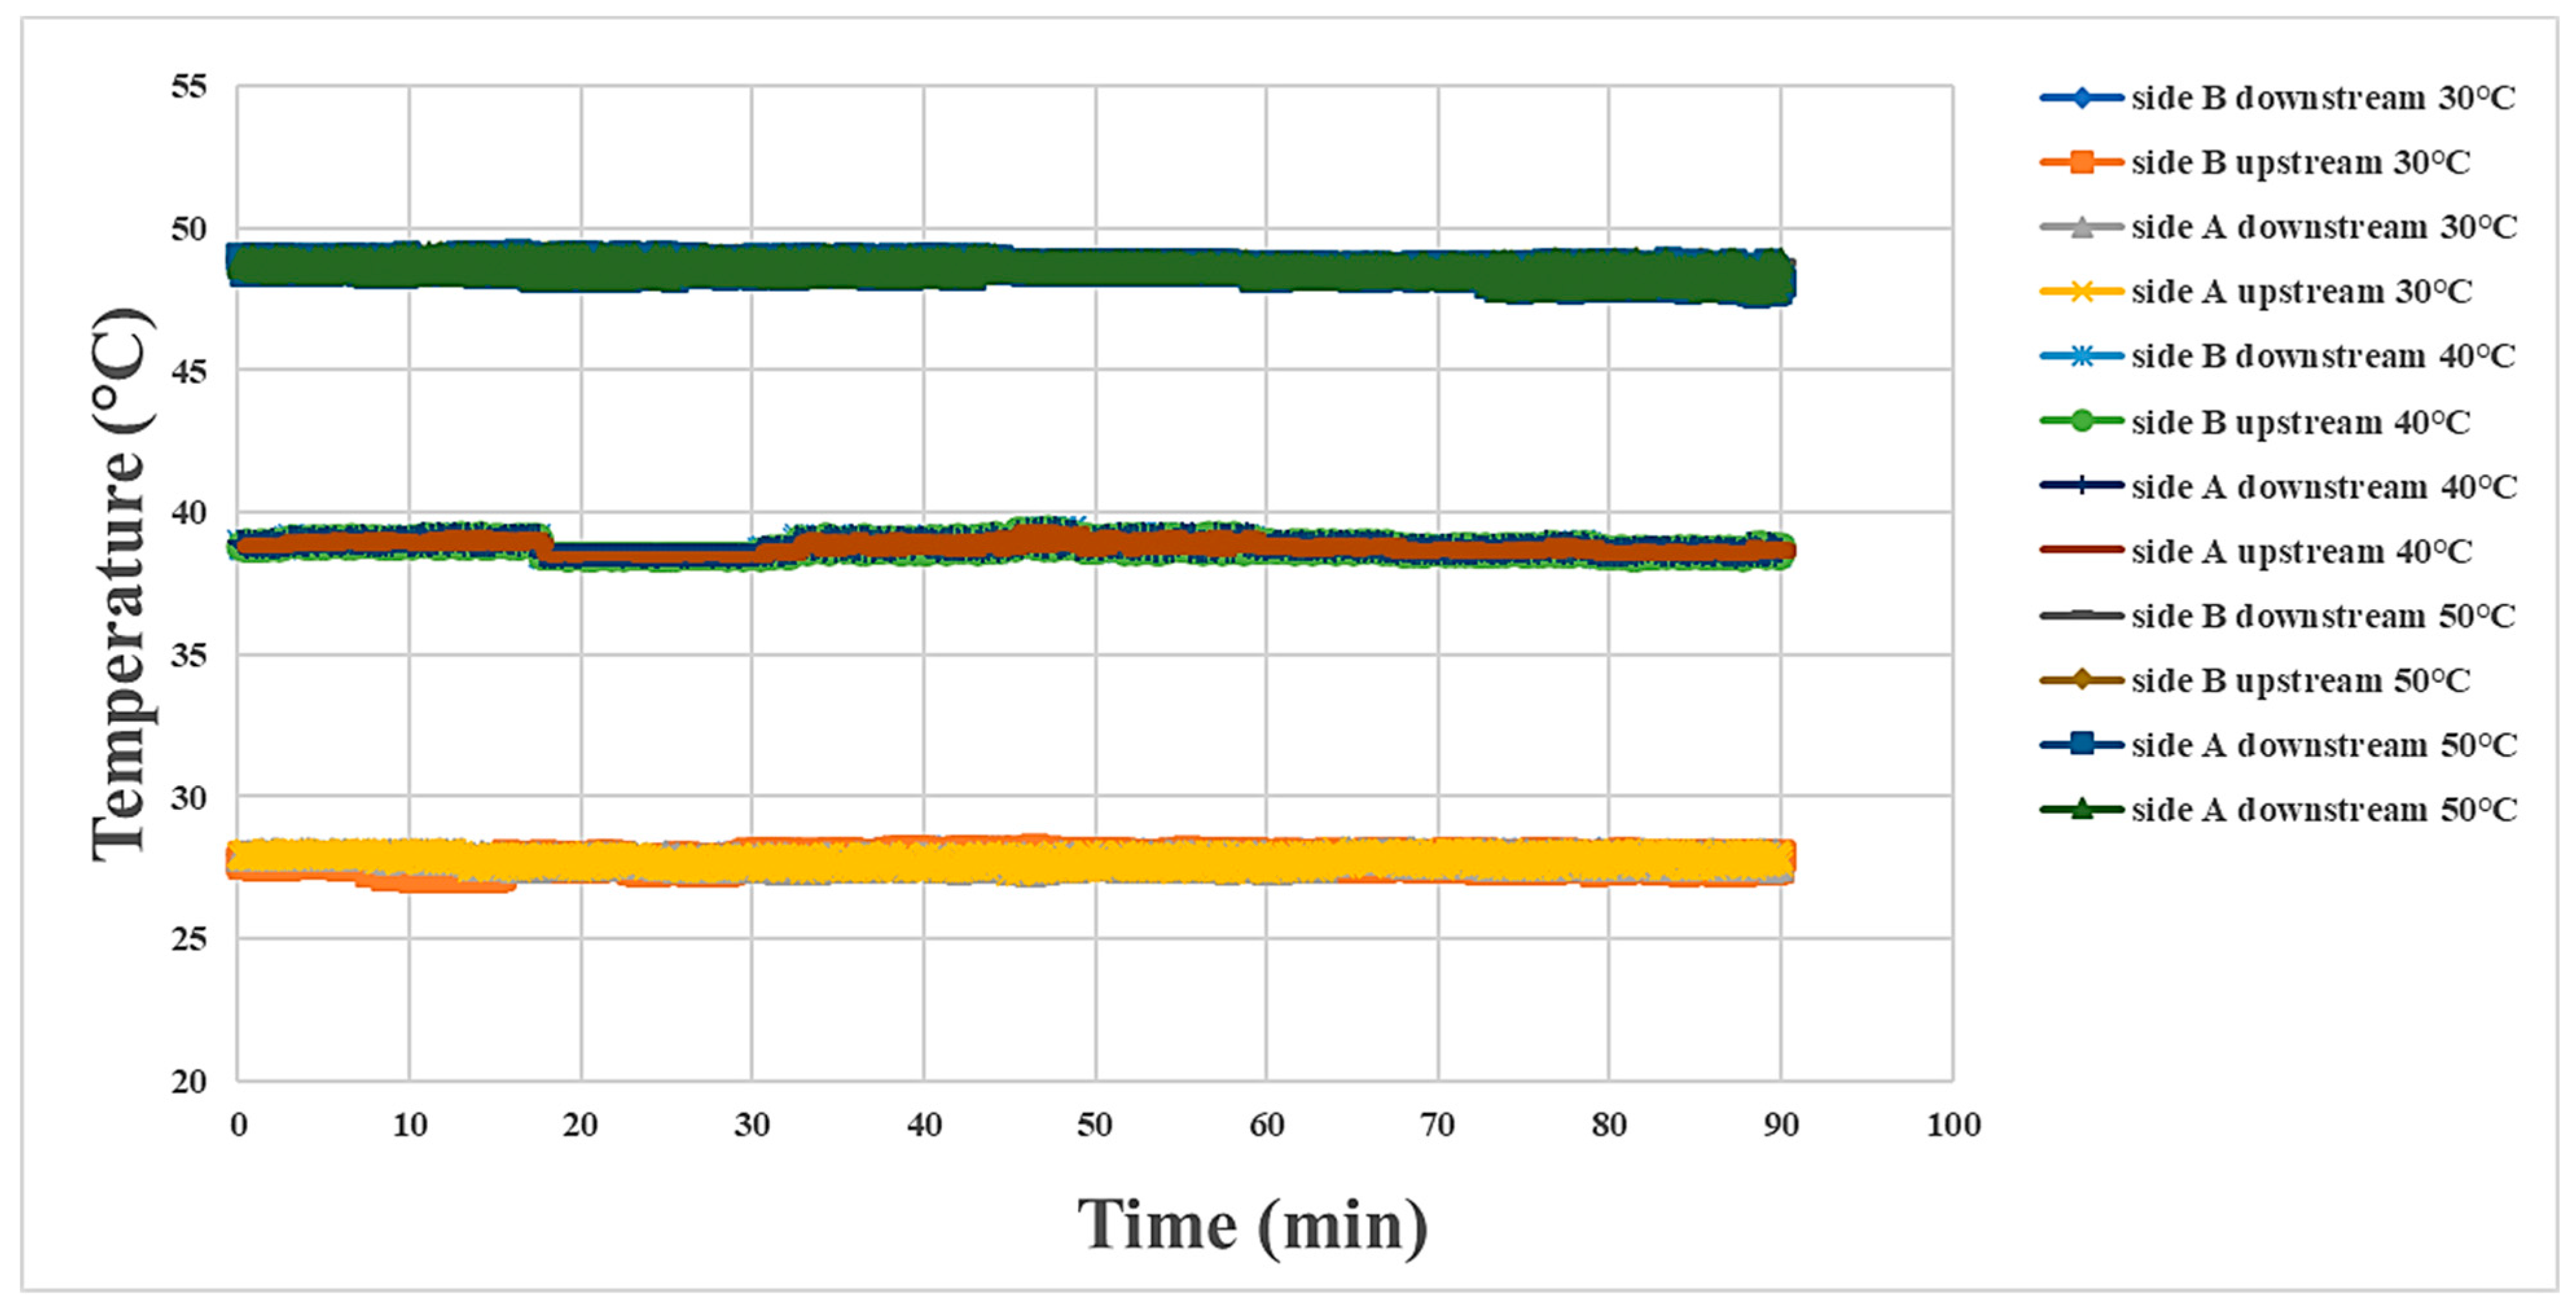
4.2. Internal Temperature Measurement during Proton Battery Stack Discharging
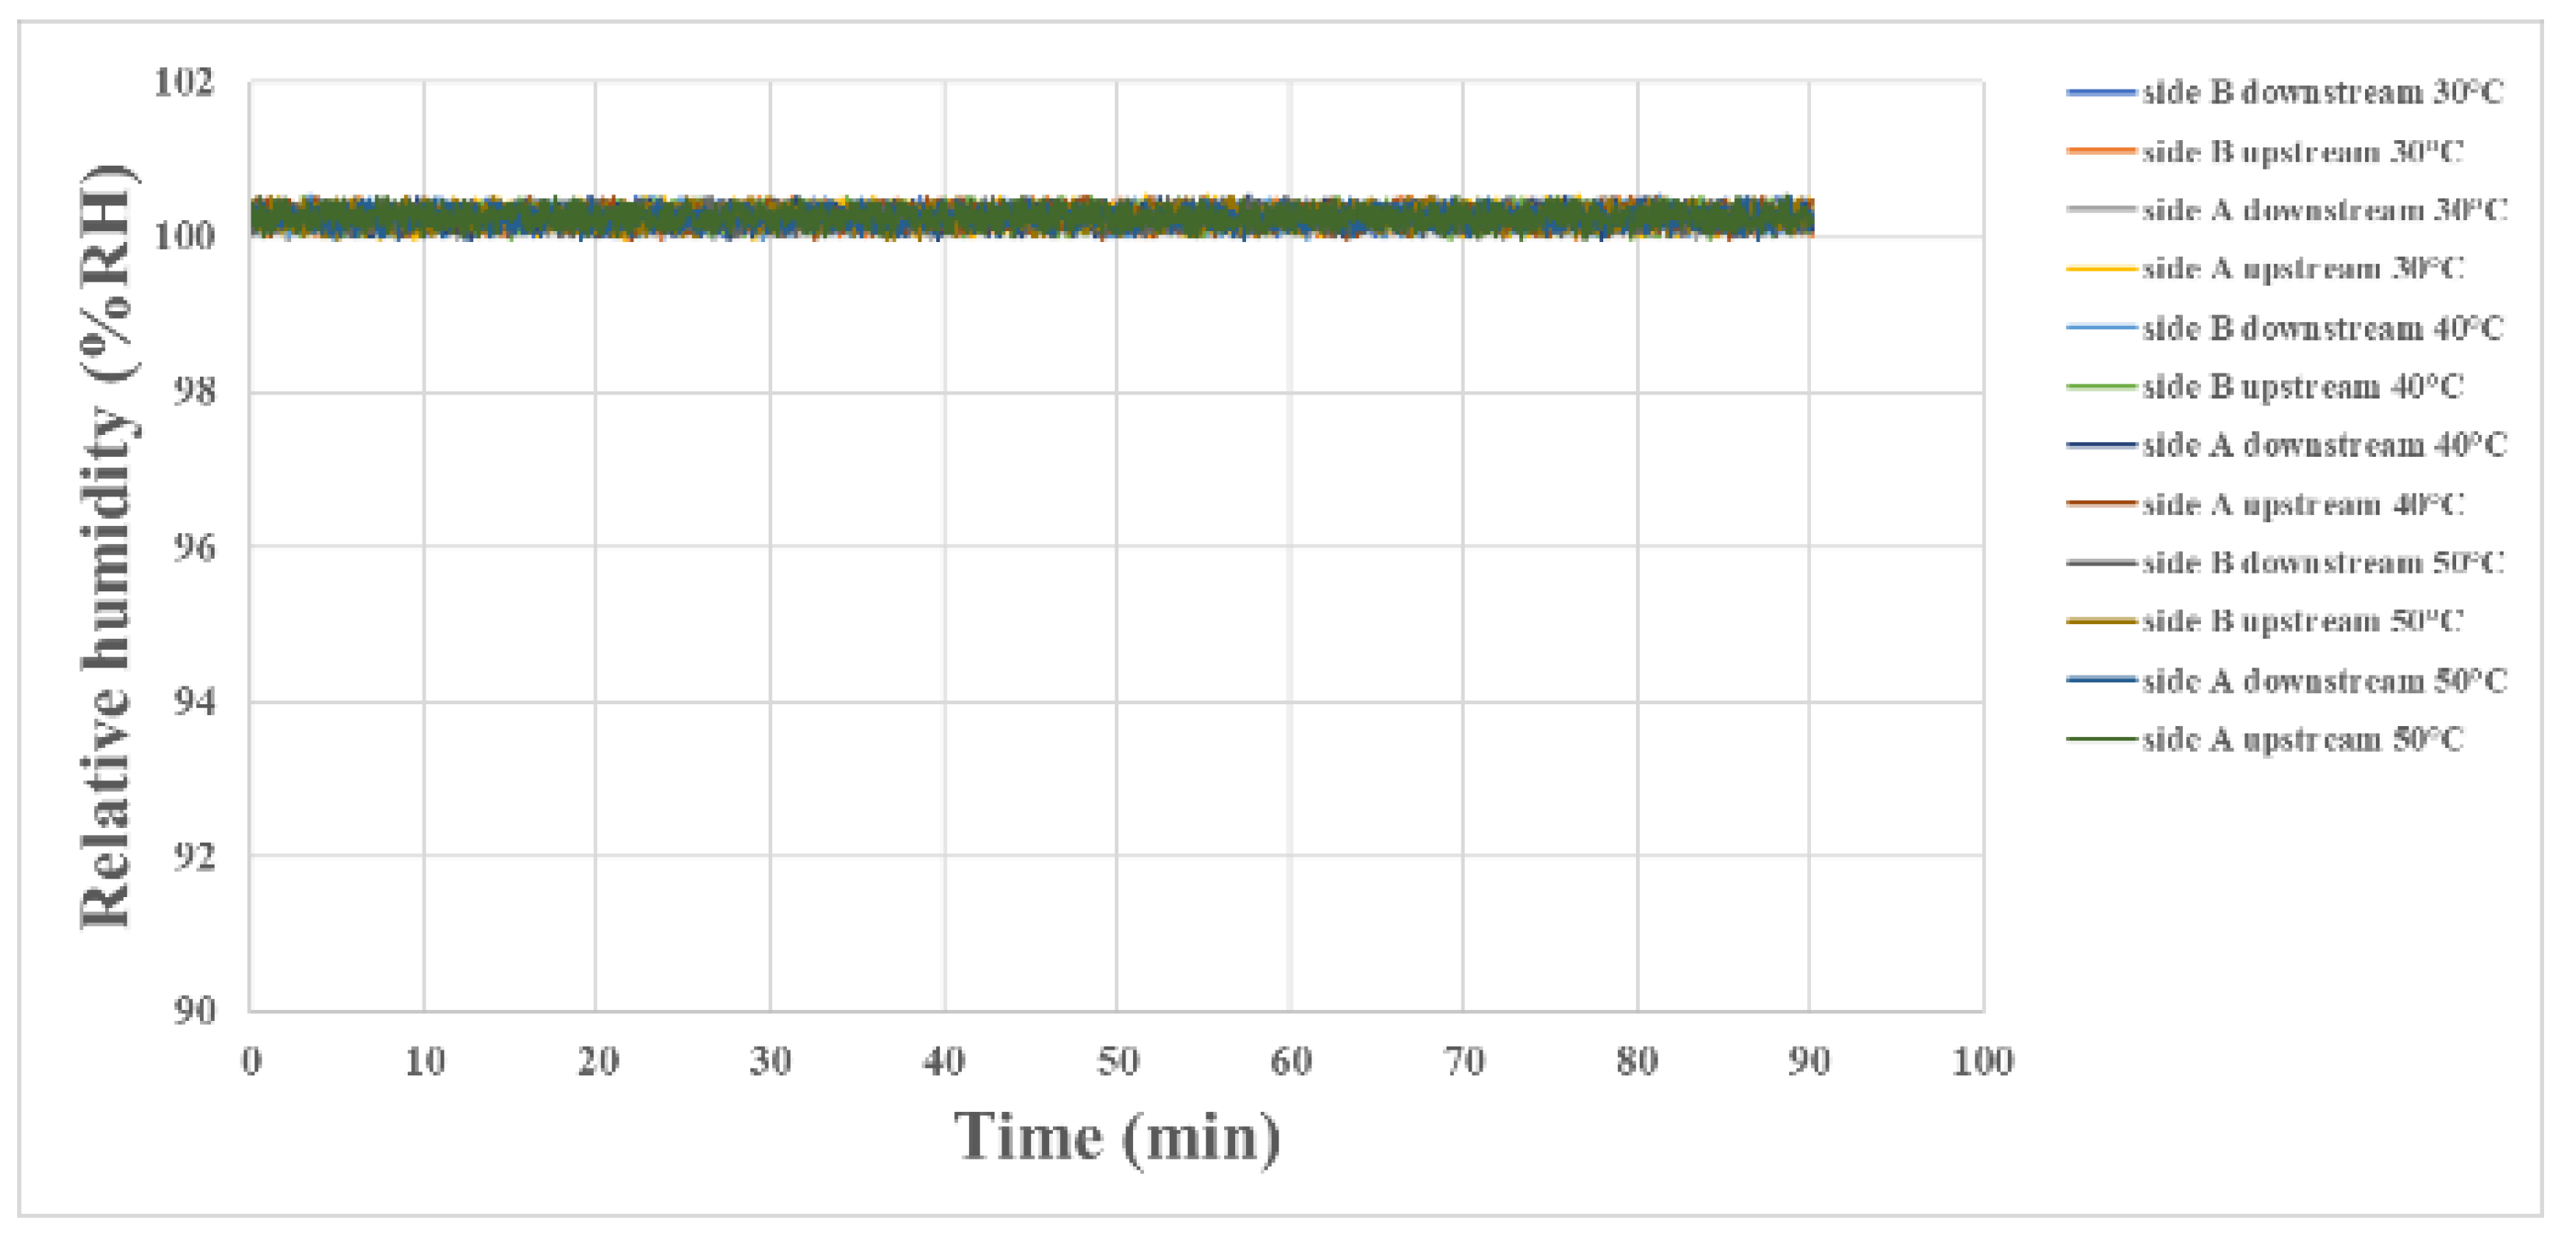
4.3. Internal Humidity Measurement during Proton Battery Stack Discharging
4.4. Internal Flow Measurement during Proton Battery Stack Discharging
5. Relationship between Internal Physical Quantities of Proton Battery Stack during Charging/Discharging and Temperature
6. Conclusions
Author Contributions
Funding
Institutional Review Board Statement
Informed Consent Statement
Data Availability Statement
Acknowledgments
Conflicts of Interest
References
- Green Hydrogen Market Research Report: Information by Technology; Taiwan Hydrogen & Fuel Cell Partnership: Chunan, Taiwan, 2021.
- Su, Z.; Chen, J.; Stansby, J.; Jia, C.; Zhao, T.; Tang, J.; Fang, Y.; Rawal, A.; Ho, J.; Zhao, C. Hydrogen-Bond Disrupting Electrolytes for Fast and Stable Proton Batteries. Nano Micro Small 2022, 18, 2201449–2201459. [Google Scholar] [CrossRef] [PubMed]
- Andrews, J.; Niya, S.R.; Ojha, R. Electrochemical hydrogen storage in porous carbons with acidic electrolytes: Uncovering the potential. Curr. Opin. Electrochem. 2022, 31, 100850–100854. [Google Scholar] [CrossRef]
- Zhu, Z.; Wang, W.; Yin, Y.; Meng, Y.; Liu, Z.; Jiang, T.; Peng, Q.; Sun, J.; Chen, W. An Ultrafast and Ultra-Low-Temperature Hydrogen Gas–Proton Battery. J. Am. Chem. Soc. 2021, 143, 20302–20308. [Google Scholar] [CrossRef] [PubMed]
- Santos, F.M.; Barbosa, P.C.; Pereira, R.F.; Silva, M.M.; Gonçalves, H.M.; Nunes, S.C.; Figueiredo, F.L.; Valente, A.J.; Bermudez, V.D.Z. Proton conducting electrolytes composed of chondroitin sulfate polysaccharide and citric acid. Eur. Polym. J. 2019, 124, 109453. [Google Scholar] [CrossRef]
- Ning, F.; Bai, C.; Qin, J.; Song, Y.; Zhang, T.; Chen, J.; Wei, J.; Lu, G.; Wang, H.; Li, Y.; et al. Great improvement in the performance and lifetime of a fuel cell using a highly dense, well-ordered, and cone-shaped Nafion array. J. Mater. Chem. A 2020, 8, 5489–5502. [Google Scholar] [CrossRef]
- Fang, Z.; Wang, J.; Wu, H.; Li, Q.; Fan, S.; Wang, J. Progress and challenges of flexible lithium ion batteries. J. Power Source 2020, 454, 227932–227948. [Google Scholar] [CrossRef]
- Jothi, M.A.; Vanitha, D.; Sundaramahalingam, K.; Nallamuthu, N. Utilisation of corn starch in production of ‘eco friendly’ polymer electrolytes for proton battery applications. Int. J. Hydrogen Energy 2022, 47, 28763–28772. [Google Scholar] [CrossRef]
- Wu, X.; Hong, J.J.; Shin, W.; Ma, L.; Liu, T.; Bi, X.; Yuan, Y.; Qi, Y.; Surta, T.W.; Huang, W.; et al. Diffusion-free Grotthuss topochemistry for high-rate and long-life proton batteries. Nat. Energy 2019, 4, 123–130. [Google Scholar] [CrossRef]
- Jiang, H.; Shin, W.; Ma, L.; Hong, J.J.; Wei, Z.; Liu, Y.; Zhang, S.; Wu, X.; Xu, Y.; Guo, Q.; et al. A high-rate aqueous proton battery delivering power below −78 °C via an unfrozen phosphoric acid. Adv. Energy Mater. 2020, 10, 138529–138540. [Google Scholar] [CrossRef]
- Wu, X.; Qiu, S.; Xu, Y.; Ma, L.; Bi, X.; Yuan, Y.; Wu, T.; Yassar, R.S.; Lu, J.; Ji, X. Hydrous nickel–iron turnbull’s blue as a high-rate and low-temperature proton electrode. ACS Appl. Mater. Inter. 2020, 12, 9201–9208. [Google Scholar] [CrossRef] [PubMed]
- Dong, X.; Li, Z.; Luo, D.; Huang, K.; Dou, H.; Zhang, X. Pre-protonated vanadium hexacyanoferrate for high energy-power and anti-freezing proton batteries. Adv. Funct. Mater. 2023, 31, 132549–132558. [Google Scholar] [CrossRef]
- Xu, Y.; Wu, X.; Ji, X. The Renaissance of Proton Batteries. Small Struct. 2021, 2, 2000113. [Google Scholar] [CrossRef]
- Sun, T.; Du, H.; Zheng, S.; Shi, J.; Tao, Z. High power and energy density aqueous proton battery operated at −90 °C. Adv. Funct. Mater. 2021, 31, 2010127–2010134. [Google Scholar] [CrossRef]
- Zhao, B.; Lu, X.; Wang, Q.; Yang, J.; Zhao, J.; Zhou, H. Enhancing the ionic conductivity in a composite polymer electrolyte with ceramic nanoparticles anchored to charged polymer brushes. Chin. Chem. Lett. 2020, 31, 831–835. [Google Scholar] [CrossRef]
- Chao, D.; Ye, C.; Xie, F.; Zhou, W.; Zhang, Q.; Gu, Q.; Davey, K.; Gu, L.; Qiao, S. Atomic Engineering Catalyzed MnO 2 Electrolysis Kinetics for a Hybrid Aqueous Battery with High Power and Energy Density. Adv. Mater. 2020, 32, 38469–38481. [Google Scholar] [CrossRef] [PubMed]
- Liang, G.; Mo, F.; Ji, X.; Zhi, C. Non-metallic charge carriers for aqueous batteries. Nat. Rev. Mater. 2021, 6, 109–123. [Google Scholar] [CrossRef]
- Strietzel, C.; Sterby, M.; Huang, H.; Strømme, M.; Emanuelsson, R.; Sjödin, M. An aqueous conducting redox-polymer-based proton battery that can withstand rapid constant-voltage charging and sub-zero temperatures. Angewandte 2020, 59, 9631–9638. [Google Scholar] [CrossRef] [PubMed]
- Li, D.; Qi, R.; Li, T.; Zhang, L.-Z. Durability analysis and degradation mechanism for an electrolytic air dehumidifier based on PEM. Int. J. Hydrogen Energy 2020, 45, 3971–3985. [Google Scholar] [CrossRef]
- Lee, C.-Y.; Chen, C.-H.; Chien, Y.-H.; Huang, Z.-Y. A Proton Battery Stack Real-Time Monitor with a Flexible Six-in-One Microsensor. Membranes 2022, 12, 779. [Google Scholar] [CrossRef] [PubMed]


| Sensor | Sensing Area |
|---|---|
| Micro voltage sensor | 300 μm × 300 μm |
| Micro current sensor | 300 μm × 300 μm |
| Micro temperature sensor | 390 μm × 390 μm |
| Micro flow sensor | 390 μm × 390 μm |
| Micro humidity sensor | 390 μm × 390 μm |
| Micro hydrogen sensor | 390 μm × 390 μm |
| Micro oxygen sensor | 390 μm × 390 μm |
| Temperature | 30 °C | 40 °C | 50 °C |
|---|---|---|---|
| Initial voltage on side A | 0.1 V | 0.1 V | 0.1 V |
| Final voltage on side A | 1.52 V | 1.56 V | 1.53 V |
| Initial voltage on side B | 0.1 V | 0.1 V | 0.1 V |
| Final voltage on side B | 1.51 V | 1.53 V | 1.51 V |
| Temperature | 30 °C | 40 °C | 50 °C |
|---|---|---|---|
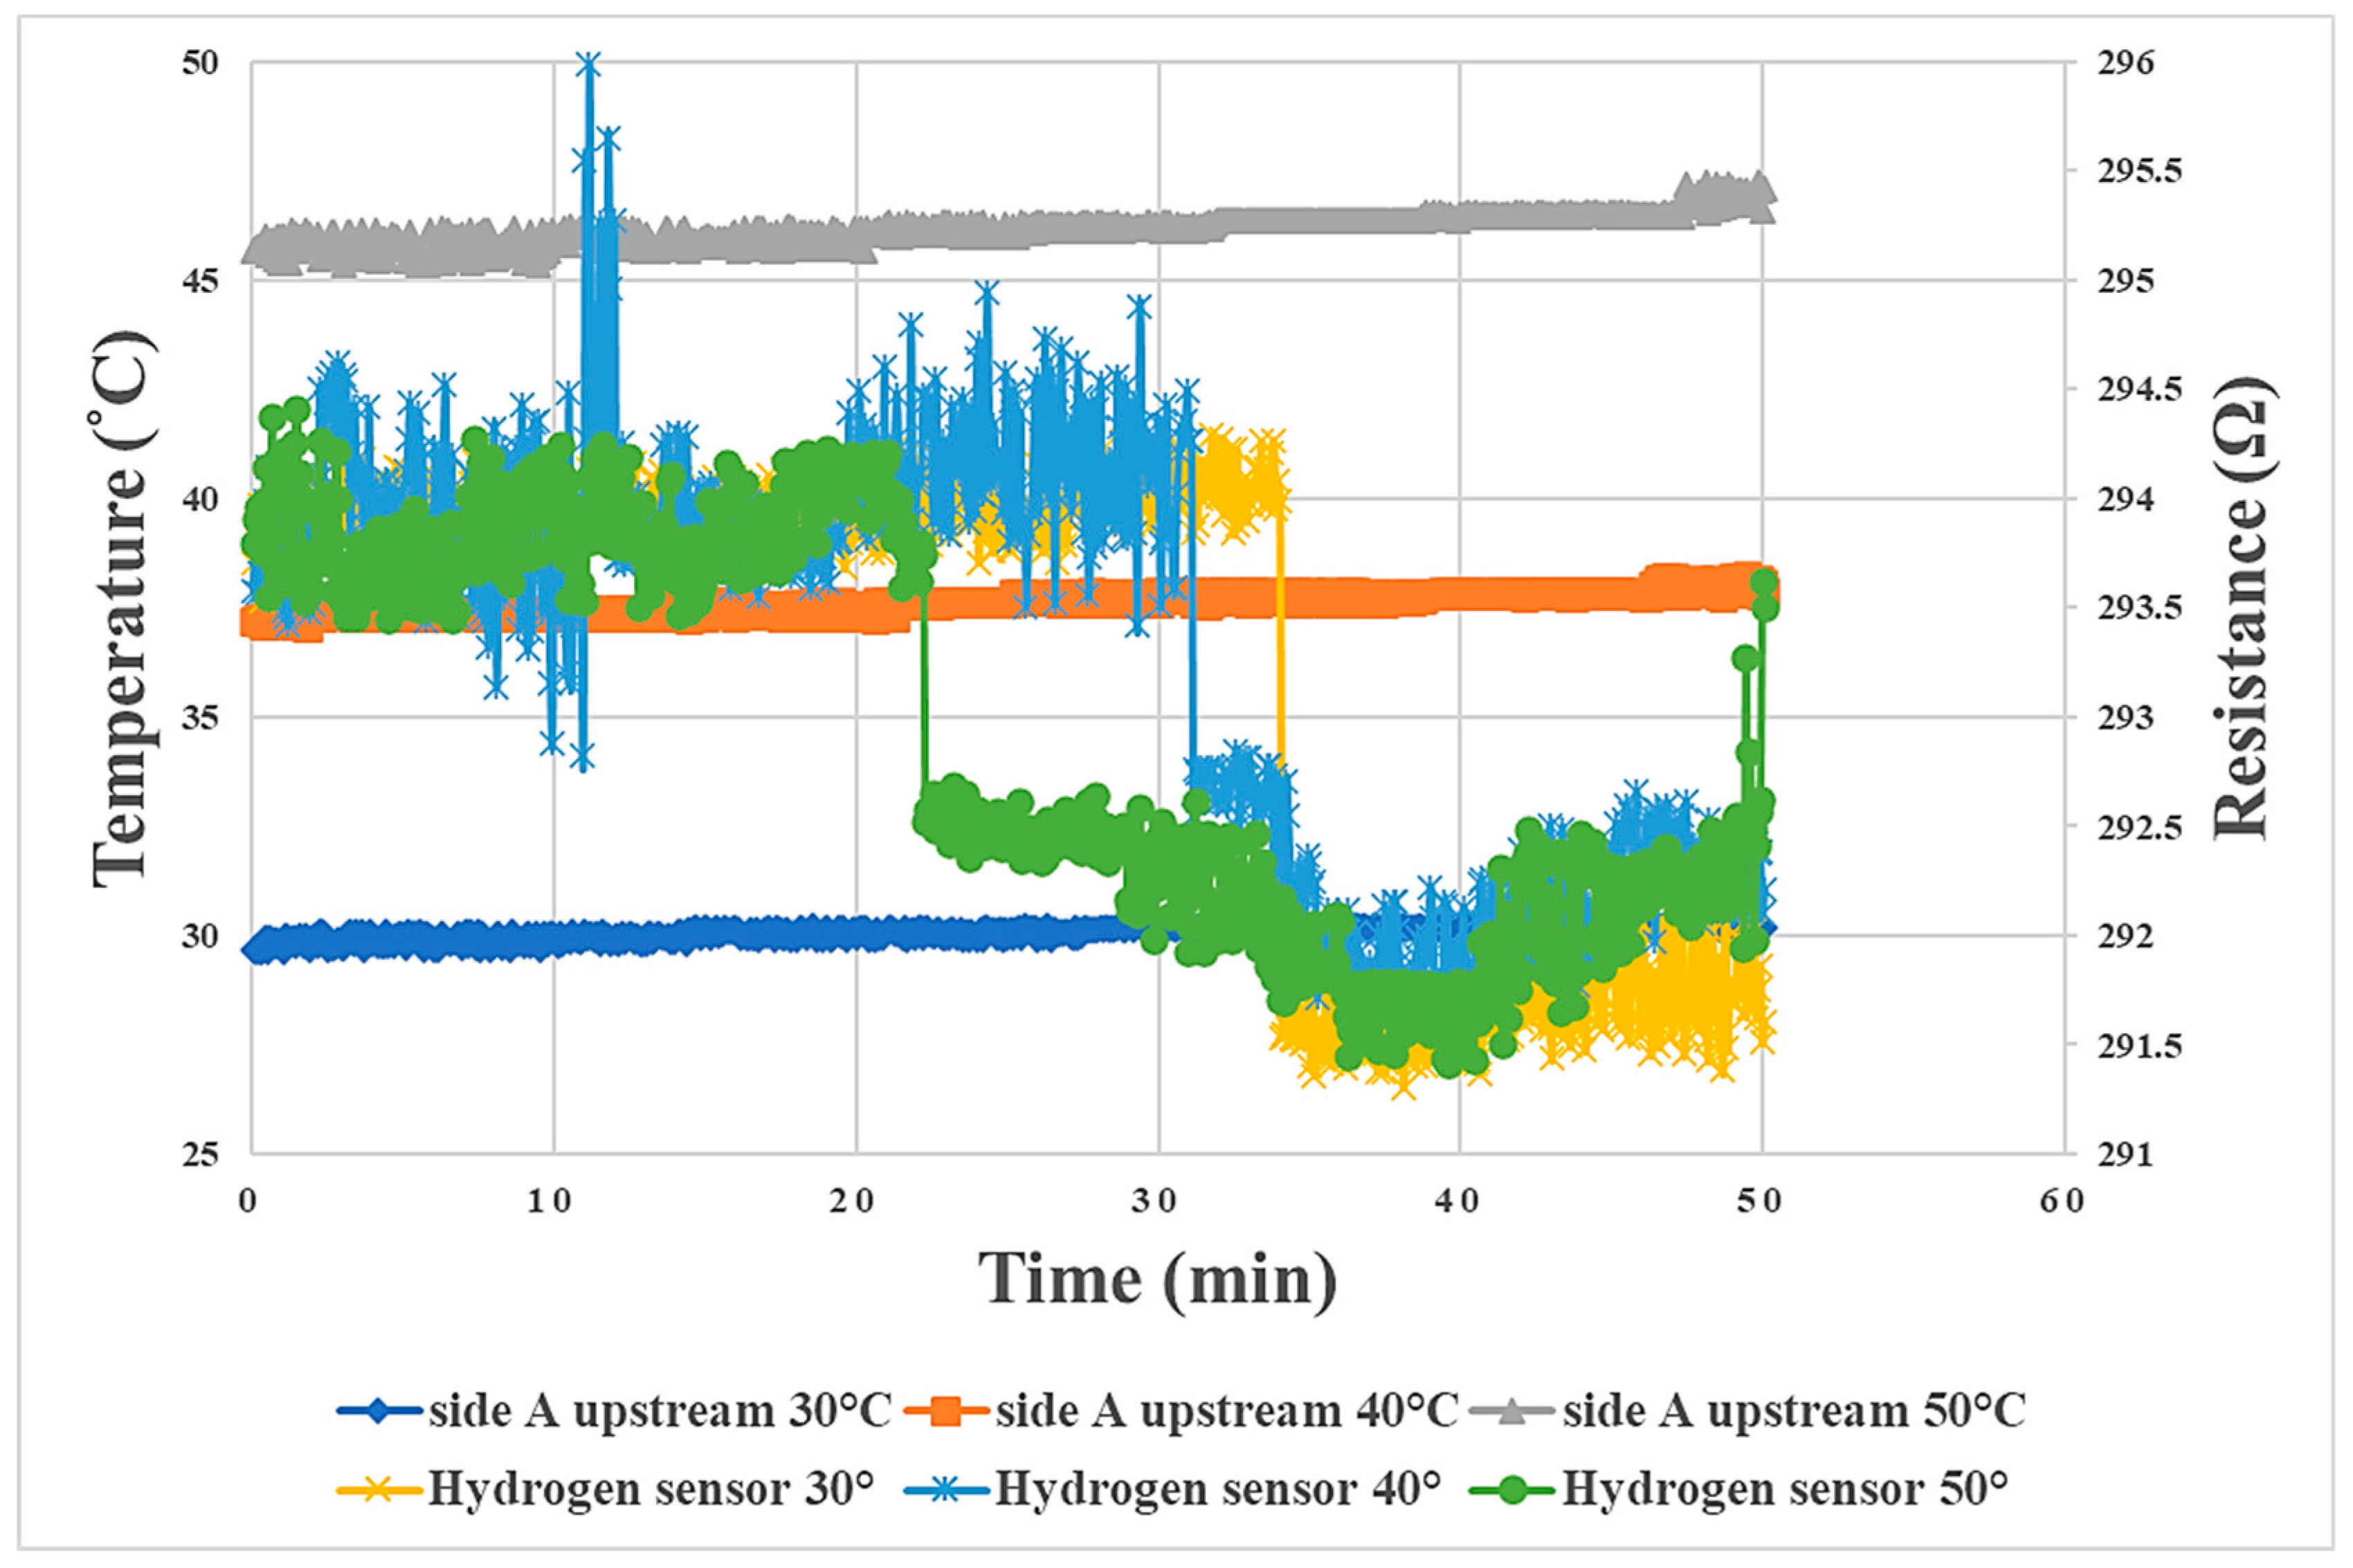
| Hydrogen uptake | 0.551 wt% | 0.549 wt% | 0.434 wt% |
| Hydrogen discharge | 0.212 wt% | 0.325 wt% | 0.154 wt% |
| 15 min | 30 min | 45 min | 60 min | 75 min | 90 min | |
|---|---|---|---|---|---|---|
| side B downstream 30 °C | 91.17% RH | 91.24% RH | 90.64% RH | 90.65% RH | 91.04% RH | 91.62% RH |
| side B upstream 30 °C | 90.51% RH | 90.50% RH | 91.52% RH | 91.26% RH | 90.54% RH | 90.95% RH |
| side A downstream 30 °C | 90.21% RH | 90.19% RH | 91.11% RH | 90.38% RH | 90.62% RH | 91.21% RH |
| side A upstream 30 °C | 91.65% RH | 90.11% RH | 90.52% RH | 90.07% RH | 91.08% RH | 90.66% RH |
| side B downstream 40 °C | 89.27% RH | 89.99% RH | 89.75% RH | 89.13% RH | 90.60% RH | 90.42% RH |
| side B upstream 40 °C | 89.57% RH | 89.95% RH | 90.42% RH | 89.65% RH | 90.32% RH | 90.35% RH |
| side A downstream 40 °C | 90.26% RH | 90.37% RH | 90.39% RH | 90.48% RH | 90.07% RH | 89.93% RH |
| side A upstream 40 °C | 90.03% RH | 90.05% RH | 90.27% RH | 90.46% RH | 90.38% RH | 89.80% RH |
| side B downstream 50 °C | 89.46% RH | 88.98% RH | 88.30% RH | 89.18% RH | 88.69% RH | 88.91% RH |
| side B upstream 50 °C | 89.55% RH | 89.38% RH | 88.63% RH | 88.72% RH | 89.04% RH | 89.39% RH |
| side A downstream 50 °C | 88.38% RH | 89.12% RH | 88.52% RH | 88.68% RH | 88.67% RH | 88.47% RH |
| side A upstream 50 °C | 88.35% RH | 88.31% RH | 88.39% RH | 89.66% RH | 88.50% RH | 89.78% RH |
| 15 min | 30 min | 45 min | 60 min | 75 min | 90 min | |
|---|---|---|---|---|---|---|
| side A upstream 30 °C | 466.19 mL/min | 465.21 mL/min | 464.87 mL/min | 465.73 mL/min | 464.66 mL/min | 463.74 mL/min |
| side B upstream 30 °C | 459.78 mL/min | 461.70 mL/min | 462.68 mL/min | 463.35 mL/min | 462.69 mL/min | 460.75 mL/min |
| side A downstream 30 °C | 457.60 mL/min | 458.95 mL/min | 458.95 mL/min | 458.48 mL/min | 457.26 mL/min | 457.20 mL/min |
| side B downstream 30 °C | 457.88 mL/min | 456.45 mL/min | 457.55 mL/min | 456.81 mL/min | 453.97 mL/min | 453.74 mL/min |
| side A upstream 40 °C | 465.64 mL/min | 468.13 mL/min | 466.30 mL/min | 464.45 mL/min | 466.17 mL/min | 464.86 mL/min |
| side B upstream 40 °C | 461.82 mL/min | 461.32 mL/min | 461.90 mL/min | 463.73 mL/min | 462.52 mL/min | 460.23 mL/min |
| side A downstream 40 °C | 456.47 mL/min | 456.44 mL/min | 456.25 mL/min | 456.04 mL/min | 454.42 mL/min | 458.48 mL/min |
| side B downstream 40 °C | 457.44 mL/min | 454.27 mL/min | 455.26 mL/min | 456.29 mL/min | 455.69 mL/min | 455.82 mL/min |
| side A upstream 50 °C | 465.14 mL/min | 468.29 mL/min | 468.90 mL/min | 469.18 mL/min | 469.21 mL/min | 466.38 mL/min |
| side B upstream 50 °C | 462.33 mL/min | 462.32 mL/min | 462.28 mL/min | 459.89 mL/min | 463.33 mL/min | 461.20 mL/min |
| side A downstream 50 °C | 457.15 mL/min | 454.79 mL/min | 456.30 mL/min | 453.68 mL/min | 457.58 mL/min | 457.86 mL/min |
| side B downstream 50 °C | 455.67 mL/min | 458.35 mL/min | 459.11 mL/min | 453.67 mL/min | 456.70 mL/min | 455.88 mL/min |
Disclaimer/Publisher’s Note: The statements, opinions and data contained in all publications are solely those of the individual author(s) and contributor(s) and not of MDPI and/or the editor(s). MDPI and/or the editor(s) disclaim responsibility for any injury to people or property resulting from any ideas, methods, instructions or products referred to in the content. |
© 2023 by the authors. Licensee MDPI, Basel, Switzerland. This article is an open access article distributed under the terms and conditions of the Creative Commons Attribution (CC BY) license (https://creativecommons.org/licenses/by/4.0/).
Share and Cite
Lee, C.-Y.; Chen, C.-H.; Yang, C.-Y.; Chen, W.-T. An Internal Real-Time Microscopic Diagnosis of a Proton Battery Stack during Charging and Discharging. Materials 2023, 16, 3507. https://doi.org/10.3390/ma16093507
Lee C-Y, Chen C-H, Yang C-Y, Chen W-T. An Internal Real-Time Microscopic Diagnosis of a Proton Battery Stack during Charging and Discharging. Materials. 2023; 16(9):3507. https://doi.org/10.3390/ma16093507
Chicago/Turabian StyleLee, Chi-Yuan, Chia-Hung Chen, Chin-Yuan Yang, and Wan-Ting Chen. 2023. "An Internal Real-Time Microscopic Diagnosis of a Proton Battery Stack during Charging and Discharging" Materials 16, no. 9: 3507. https://doi.org/10.3390/ma16093507
APA StyleLee, C.-Y., Chen, C.-H., Yang, C.-Y., & Chen, W.-T. (2023). An Internal Real-Time Microscopic Diagnosis of a Proton Battery Stack during Charging and Discharging. Materials, 16(9), 3507. https://doi.org/10.3390/ma16093507