1. Introduction
Numerous mathematical rheological models are used to describe the mechanical properties of viscoelastic materials [
1,
2,
3]. The Maxwell and Kelvin–Voight models are, probably, the best-known rheological models. However, deeper insight into the complex behavior of viscoelastic materials is provided by the relaxation spectrum [
2,
4,
5]. The relaxation spectrum is vital for constitutive models and for insight into the properties of a material, since, from the relaxation spectrum, other material functions used to describe rheological properties can be uniquely determined [
4,
6,
7]. It is commonly used to describe, analyze, compare, and improve the mechanical properties of polymers [
4,
8,
9], concrete [
10], asphalt [
11], rubber [
12], wood [
13], glass [
14], dough [
15], polymeric textile materials [
16], geophysics [
17] and biological materials [
18]. The spectrum is not directly measurable; therefore, it must be recovered from oscillatory shear or stress relaxation data [
2,
5]. A number of different methods and algorithms have been proposed during the last five decades for the recovery of the relaxation spectrum of a viscoelastic material from oscillatory shear data. These works, using different models, approaches and computational techniques, have included contributions by Baumgaertel and Winter [
19], Honerkamp and Weese [
20], Malkin [
21], Malkin et al. [
22], Stadler and Bailly [
23], Davis and Goulding [
24], Davis et al. [
25] and Cho [
26]. These studies, but also many others, have created new directions of research on discrete and continuous relaxation spectra identification based on dynamic moduli data, and have been conducted ever since [
8,
11,
27].
However, a classical way of studying viscoelasticity is also the stress relaxation test, where time-dependent shear stress is studied for the step increase in strain [
1,
2,
3,
28]. For some materials, for example, highly hydrated biological plants, the stress relaxation test is much easier to perform and is more suitable than dynamic oscillatory shear tests [
3,
29]. There are only a few papers that deal with spectrum determination from time measurements of the relaxation modulus. Additionally, some of them only address specific materials. The first works came from the turn of the 1940s and 1950s. Alfrey and Doty [
30] proposed a simple differential model, being, in fact, the first-order Post–Widder formula [
31] for the inverse Laplace transform; for details, see the newer edition [
32]. Ter Harr [
33] approximated the spectrum of relaxation frequencies by the modulus multiplied by time inverse of the relaxation frequency, which can be thought as the Post–Widder inversion formula of the zero order. After many years, Bažant and Yunping [
34] and Goangseup and Bažant [
35] introduced a two-stage approach of approximating the stress (or retardation) data via multiple differentiable models of the relaxation modulus (creep compliance) and, next, by applying the Post–Widder formula to designate the related relaxation (retardation) spectrum model. The effectiveness of this approach depends, among other aspects, on the function applied to approximate the relaxation modulus. In [
34], a logarithmic–exponential model of the relaxation modulus is proposed, for which the authors state the third-order Post–Widder approximation to be satisfactory.
The relaxation spectrum modeling based on the known pairs of Laplace transforms was initiated by Macey [
36], who described the relaxation modulus of viscoelastic ceramic material by the modified Bessel function of the second kind and zero order, which corresponds to the exponential–hyperbolic model of the spectrum. To describe the mechanical properties of polyisobutylene, Sips [
37] introduced a simple relaxation spectrum model given by the difference of two exponential functions and a related logarithmic model of the modulus. This model was augmented to consider a long-term modulus by Yamamoto [
38] and applied to test the rheological properties of the plant cell wall.
Both the algorithms based on the Post–Widder formula and those using the pairs of Laplace transforms assumed rather narrow classes of models. Thus, the scope of their effective applicability is limited to similar, not much wider classes of ‘real’ relaxation characteristics. A wider range of applicability has been offered by the models based on the expansion of an unknown spectrum into a series of basis functions (or polynomials) forming a complete basis in a function space, for example, in the space of real-valued square-integrable functions. Stankiewicz [
39] and Stankiewicz and Gołacki [
18] derived algorithms of the optimal regularized identification of relaxation and retardation spectra in the classes of models generated by different special functions, where various rules were applied for the choice of regularization parameters.
However, articles [
18,
39] were based on such a definition of the relaxation spectrum, according to which, the modulus was directly given by the Laplace integral of the spectrum. This spectrum definition is not often used in the literature. Therefore, computationally efficient algorithms to determine the relaxation spectrum applied to time measurements of the relaxation modulus are still desirable. Recently, for the dominant definition of the relaxation spectrum in the literature, a class of algorithms for relaxation spectrum recovery, which combines the technique of an expansion of a function into a series in an orthonormal basis with the least-squares regularized identification, has been derived by Stankiewicz [
40]. Legendre, Laguerre, Chebyshev and Hermite functions were used as the basis functions for the spectrum model. In [
40], the problem of determining the spectrum of relaxation frequencies was considered. The complementary problem of determining the spectrum of relaxation times based on the stress relaxation data is both analytically and numerically more difficult than the determination of the spectrum of relaxation frequencies, because the relaxation time occurs in the denominator of the exponential function in the spectrum definitional formula. This very task is the subject of this article. Previous studies [
18,
39,
40] have suggested that by selecting an appropriate time-scale factor, a better fit of the model to the measurement data can be obtained.
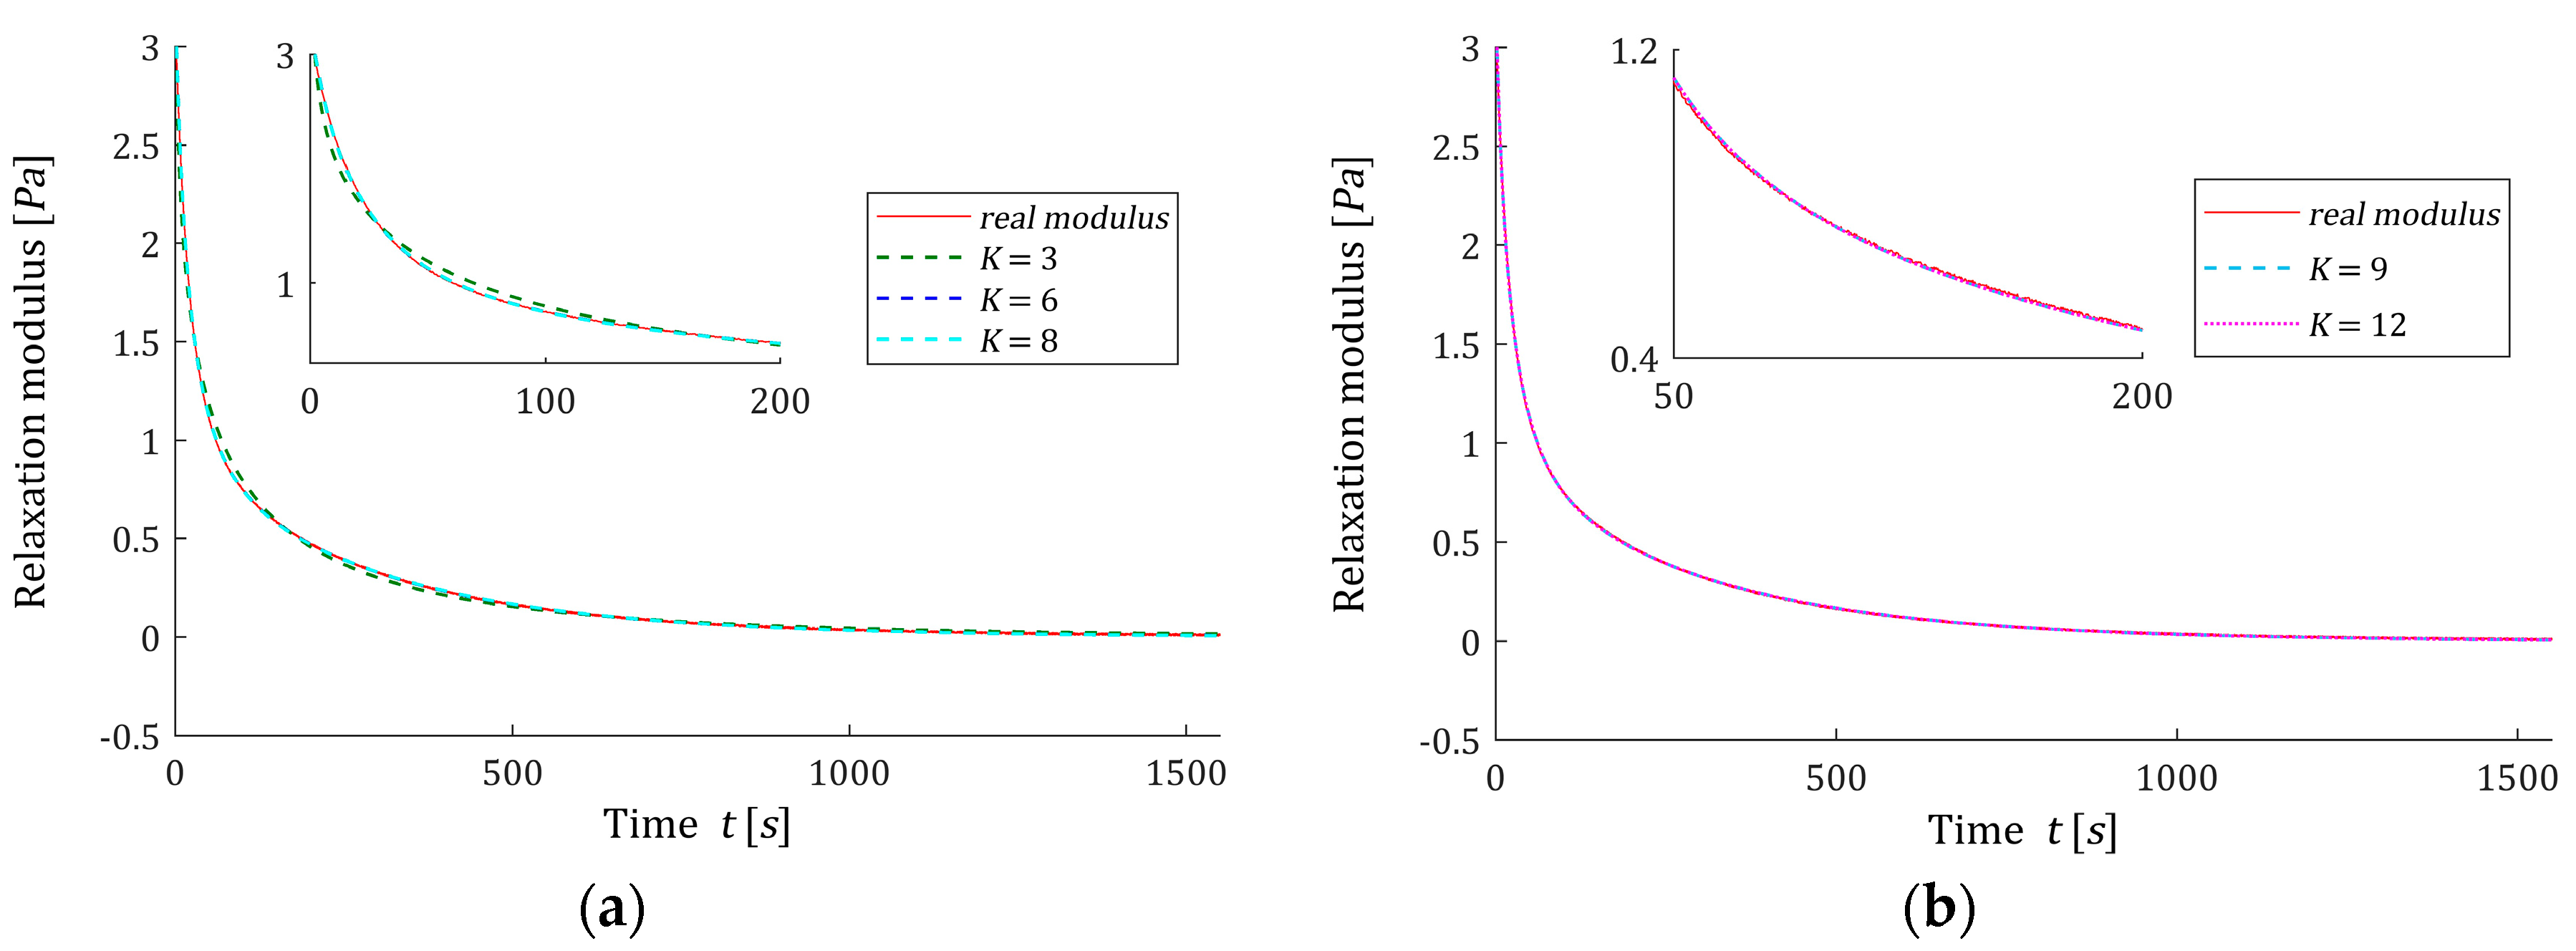
The objective of the present paper was to develop a model and an identification algorithm for the determination of the continuous relaxation time spectrum based on discrete-time measurements of the relaxation modulus, which, taking into account the ill-posedness of the original problem of the spectrum recovery and the idea of the optimal selection of the time-scale factor, will provide: (a) good approximation of the relaxation spectrum and modulus also due to the best choice of the time-scale factor; (b) smoothness of the spectrum fluctuations, even for noise-corrupted measurements; (c) noise robustness; (d) applicability to a wide range of viscoelastic materials; (e) ease of the implementation of the model and identification algorithm in available computing packages. The idea of the optimal choice of time-scale factor is used here for the first time in the context of relaxation spectrum identification. The goal of this work was the synthesis of the respective model and identification scheme and the analysis of their properties. A further purpose was the numerical verification of the model and algorithm for double-mode Gauss-like distribution used to describe the viscoelastic properties of various materials, in particular different polymers, wood and glass.
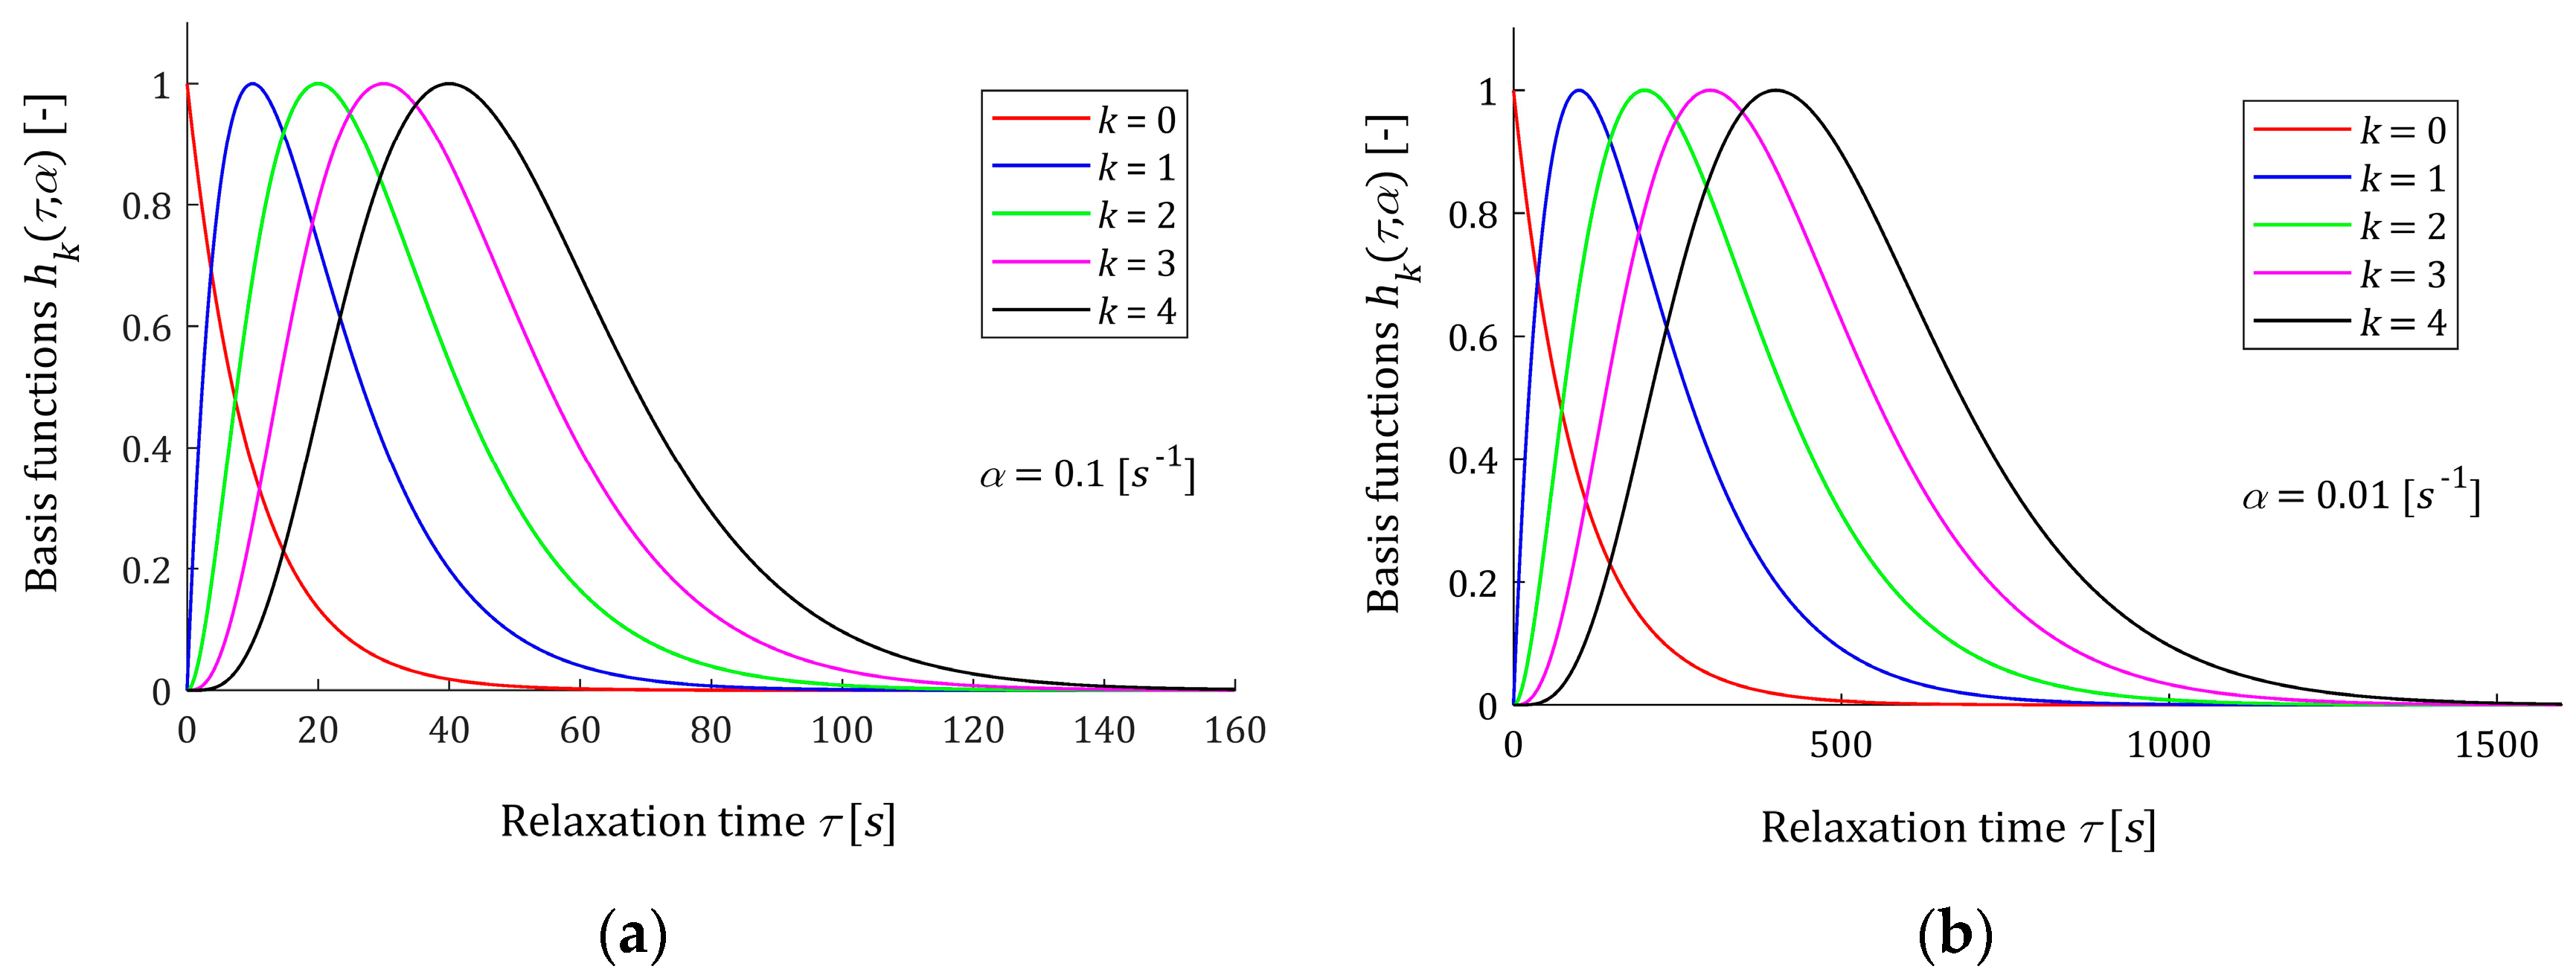
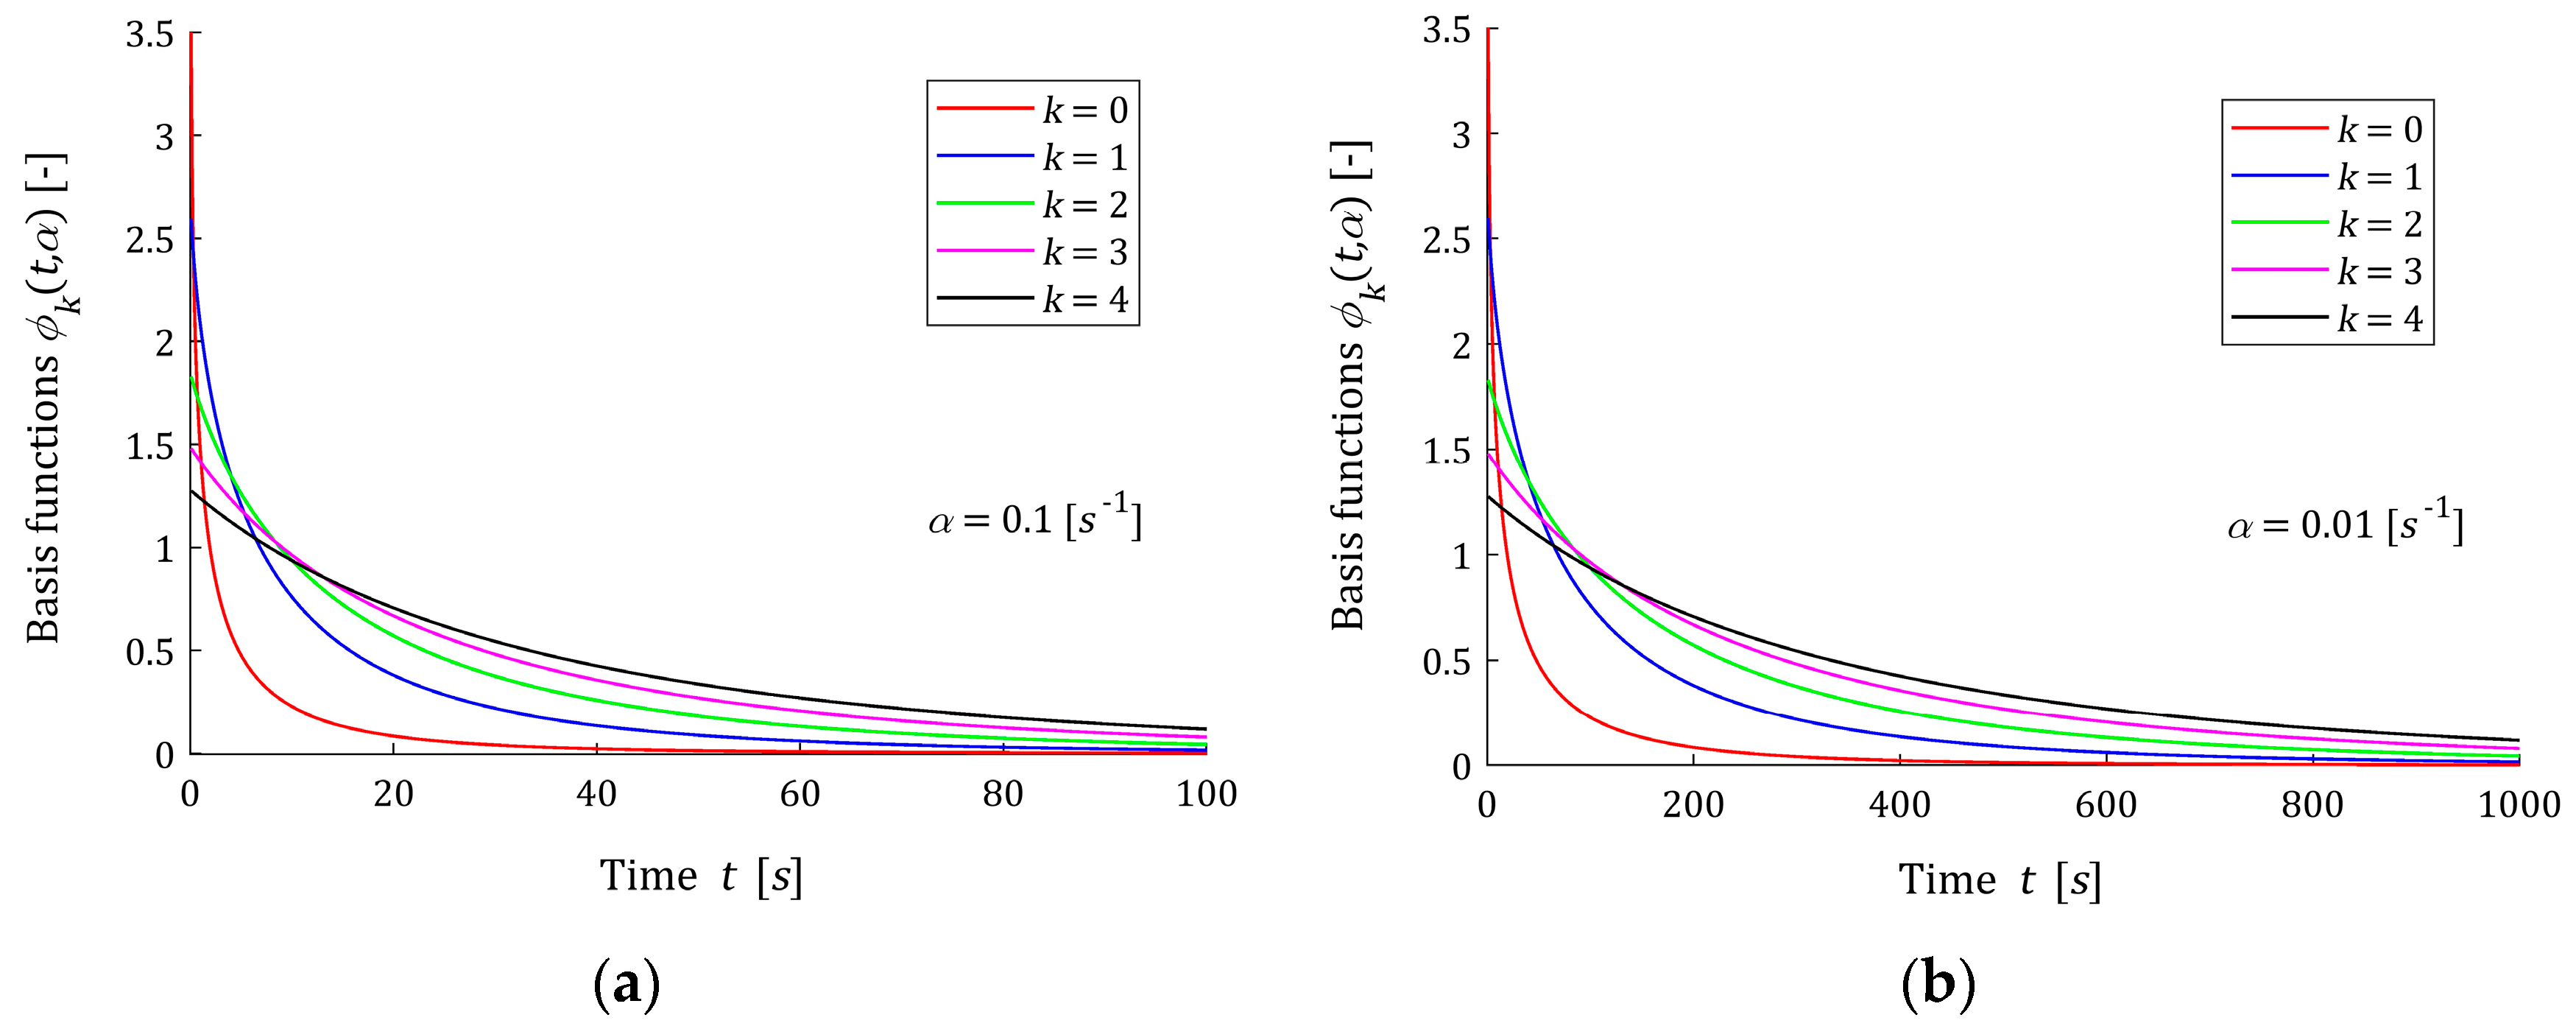
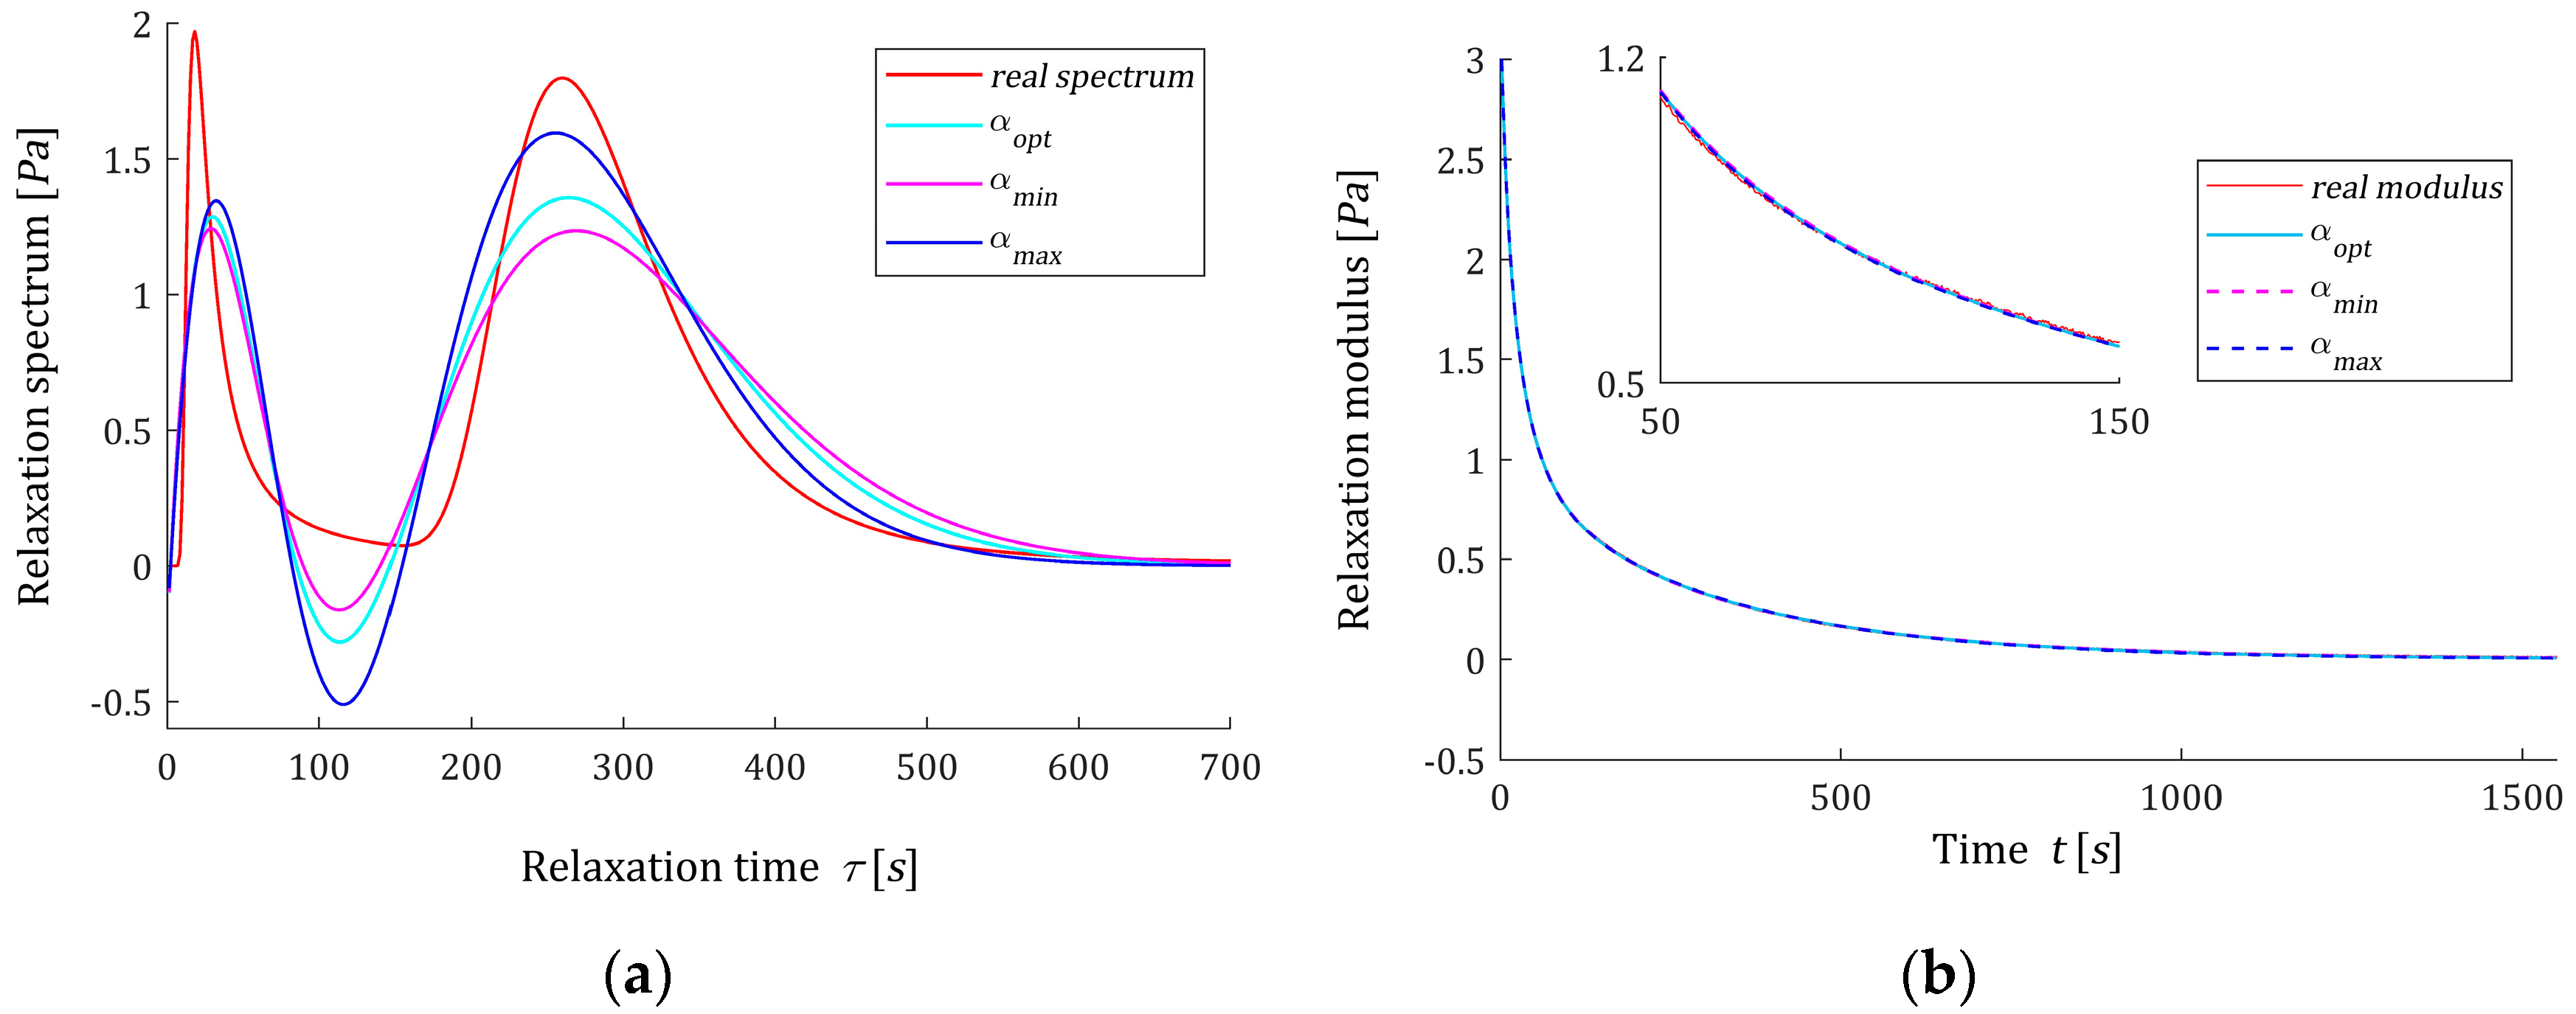
A new hierarchical algorithm of noise robust approximation of the continuous spectrum of relaxation times by finite series of power–exponential basis functions is proposed. The components of the relaxation modulus model are given by compact analytical formulas described by the product of power of time and the modified Bessel function of the second kind. The main properties of the basis functions of relaxation spectrum and modulus models have been studied; positive definiteness, upper bounds, monotonicity and asymptotic properties have been examined. Ranges of applicability for different time-scale factors are determined. Since the problem of relaxation spectrum identification is an ill-posed inverse problem, the regularized least-squares identification technique is applied combined with generalized cross-validation to guarantee the stability of the scheme. The quadratic identification index refers to the measured relaxation modulus. The task of determining the best “regularized” model is solved at the lower level of the identification scheme. The appropriate choice of the time-scale factor on the upper level of the scheme ensures the best fit of the relaxation modulus to experimental data.
The optimality conditions are derived both for the identification problem solved at the lower level and the task of the optimal choice of the time-scale factor at the upper level of the scheme. It is proved that the smoothness of the vector of the optimal model parameters implies smoothness of the fluctuations of the relaxation spectrum model. A direct formula and upper and lower bounds for the square integral norm of the smoothed spectrum model are derived. The accuracy of the spectrum model for noisy measurements of the relaxation modulus is studied, and the linear convergence to the model that we would obtain for the noise-free measurements is proved.
To design a numerical algorithm based on the scheme, the computations should be arranged hierarchically in a two-level scheme, i.e., for each iteration of the minimization procedure at the upper level, the whole numerical procedure must be realized for the lower-level task. The complete computational procedure for determining the best model is described. The singular value decomposition technique is applied to simplify the algebraic computations. The identification scheme can be easily implemented in available computing environments. The numerical studies, especially the strong smoothing of the relaxation spectrum models in the example of a double-mode Gauss-like spectrum, with a simultaneous very good fit to the experimental data of the relaxation modulus models, suggests the need to explore the applicability of the regularized weighted least-squares [
41] in the lower-level identification task. This will be the subject of further work.
In
Appendix A, the proofs and derivations of some mathematical formulas are given. Some tables have been moved to
Appendix B to increase the clarity of the article.
4. Conclusions
In this paper, a new robust hierarchical algorithm for the identification of the relaxation time spectrum, which combines the technique of an expansion of a function into a series of basis functions with the least-squares regularized identification and the optimal choice of the time-scale factor, has been derived. The task of determining the best ‘regularized’ model was solved at the lower level, while the optimal time-scale factor was selected on the upper level of the identification scheme. The continuous spectrum of relaxation times was approximated by finite series of power–exponential basis functions, while the components of the relaxation modulus model were proven to be described by the product of power of time and the modified Bessel function of the second kind. In the present paper, the problem of the optimal choice of the time-scale factor to ensure the best fit of the model to experimental data has been formulated and solved for the first time in the context of the relaxation spectrum identification.
The necessary optimality conditions both for the optimal regularized least-squares identification task and the problem of the optimal selection of the time-scale factor were derived in the form of nonlinear algebraic equations. The main properties of the basis functions of the relaxation spectrum and modulus models, their positive definiteness, convenient upper bounds, monotonicity, asymptotic properties and wide range of applicability for different time-scale factors indicated the possibility of using the proposed model and identification algorithm to determine the spectrum of a wide class of viscoelastic materials.
The overly strong smoothing of the relaxation spectrum models in the example, with a very good fit to the experimental data of the relaxation modulus models, indicates the need to modify the quality index in the lower level identification task. An introduction of a weight matrix in the second component of the objective function or a direct application of regularized weighted least-squares should be investigated. Another solution is the selection of such a spectrum model which guarantees the assumed level of smoothing and optimal adjustment to the relaxation modulus measurement data. These approaches will be the subject of further work.
The presented scheme of the relaxation spectrum identification can be easily modified for retardation spectrum recovery from creep compliance measurements obtained in the standard creep test.


