
Mechanism of Potassium Release from Feldspar by Mechanical Activation in Presence of Additives at Ordinary Temperatures


Abstract
:1. Introduction
2. Materials and Methods
2.1. Raw Materials
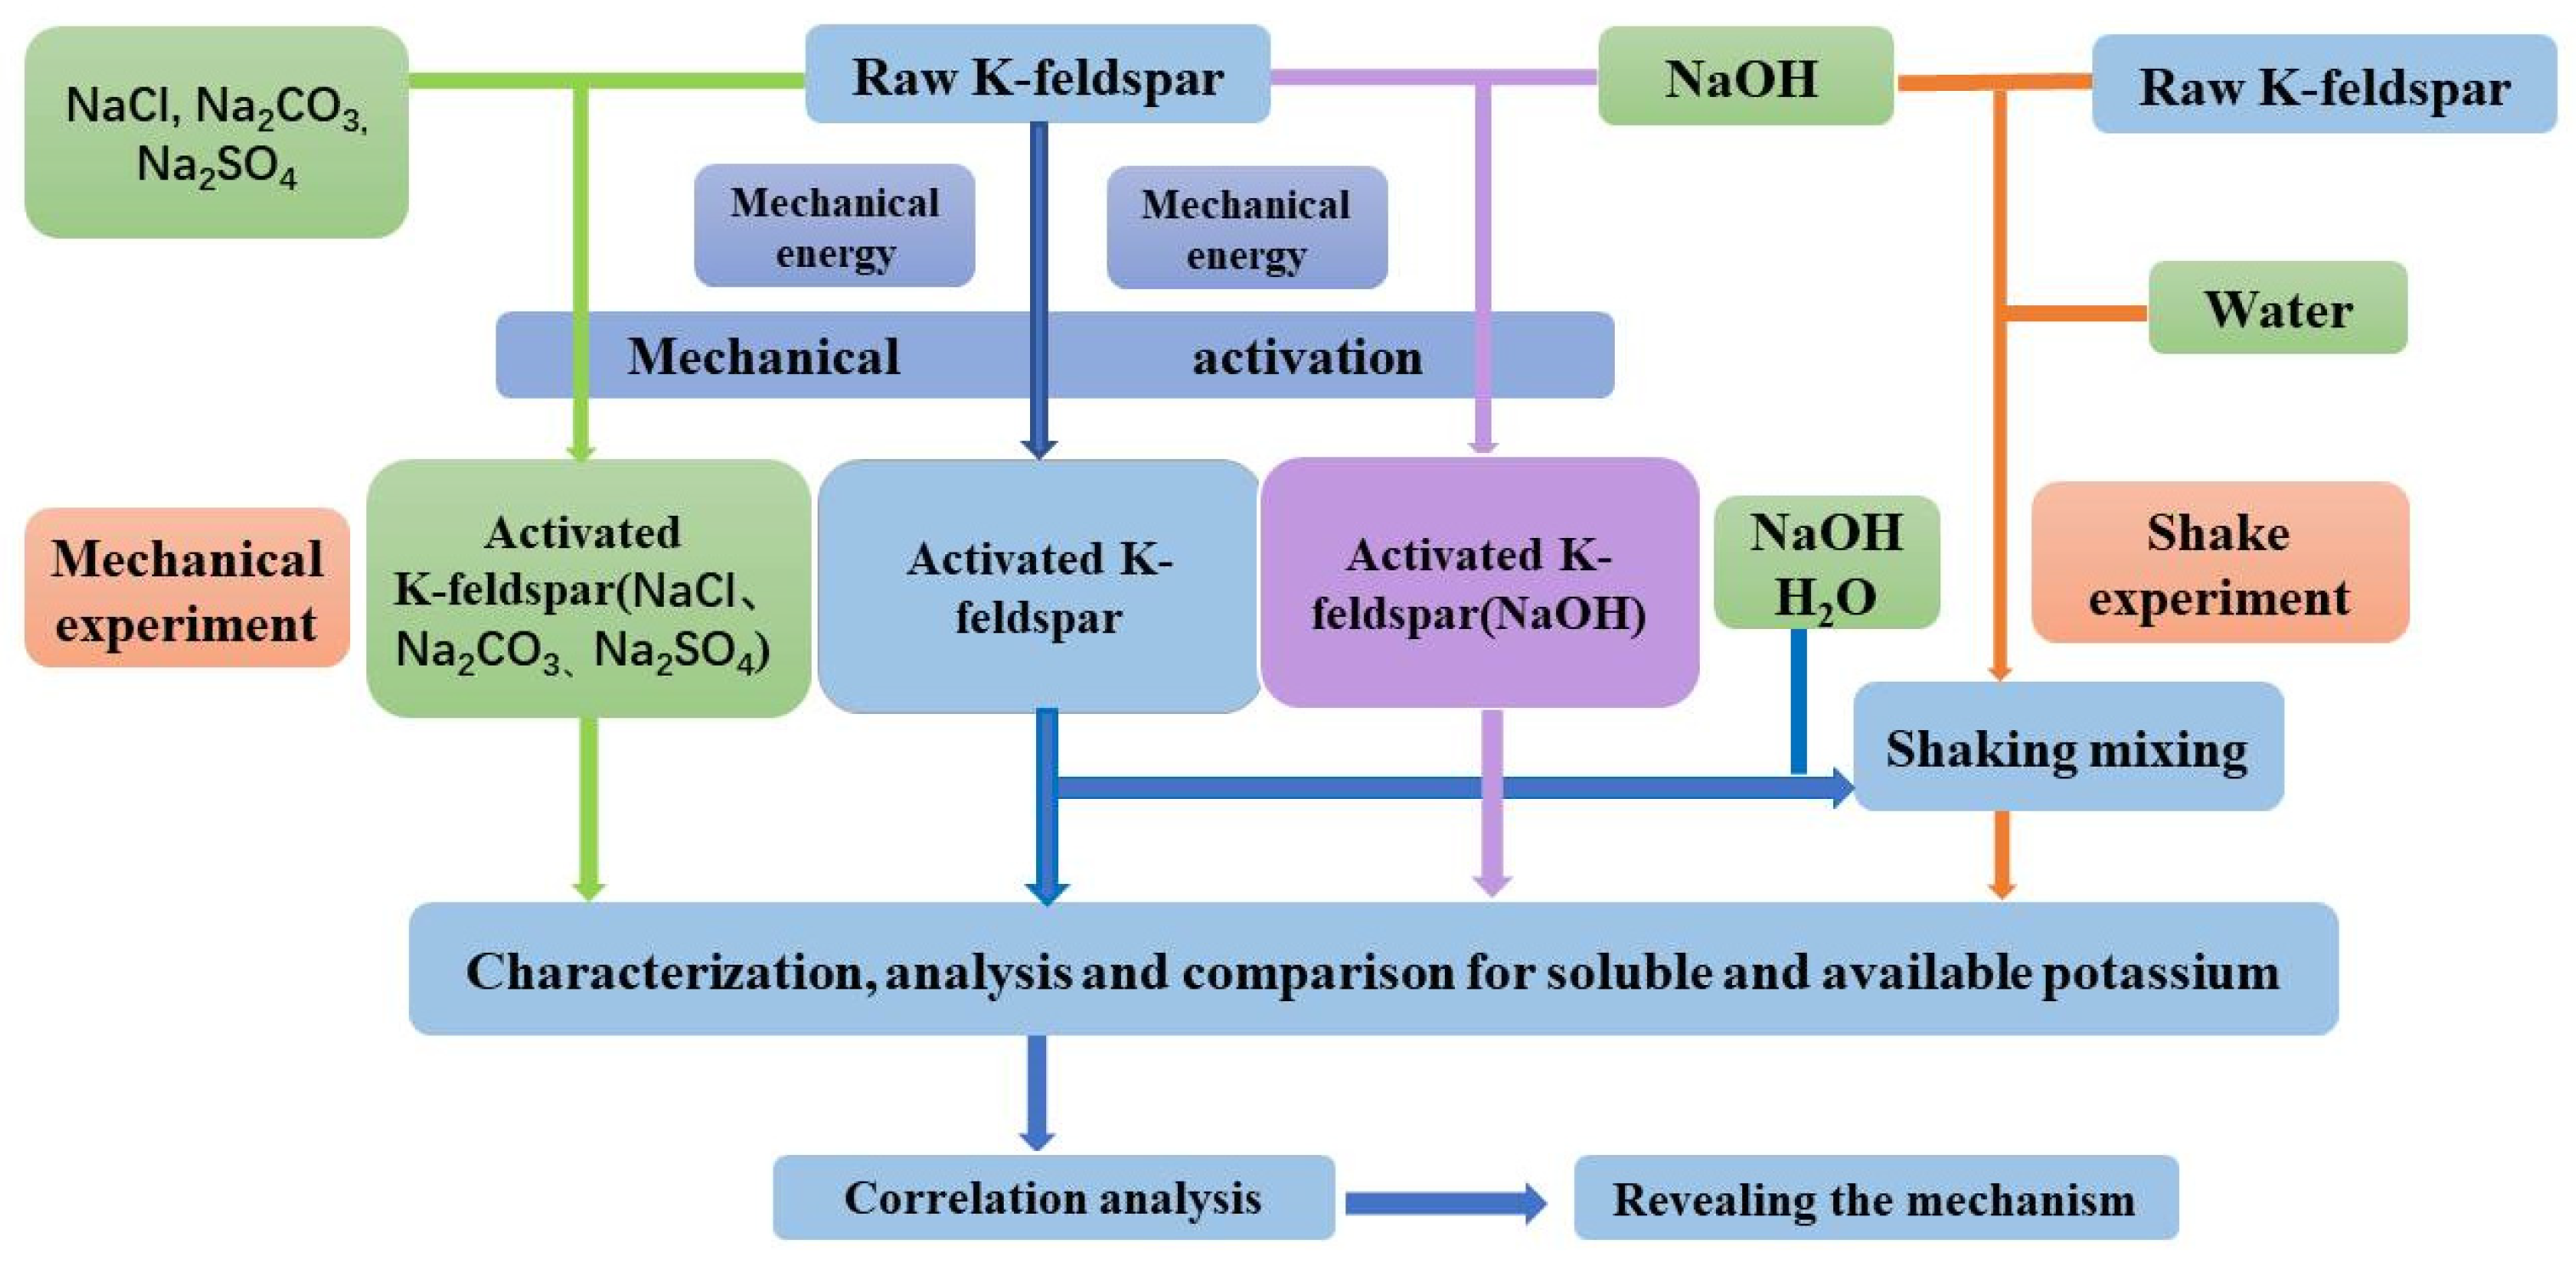
2.2. Methods
2.3. Characterization
3. Results
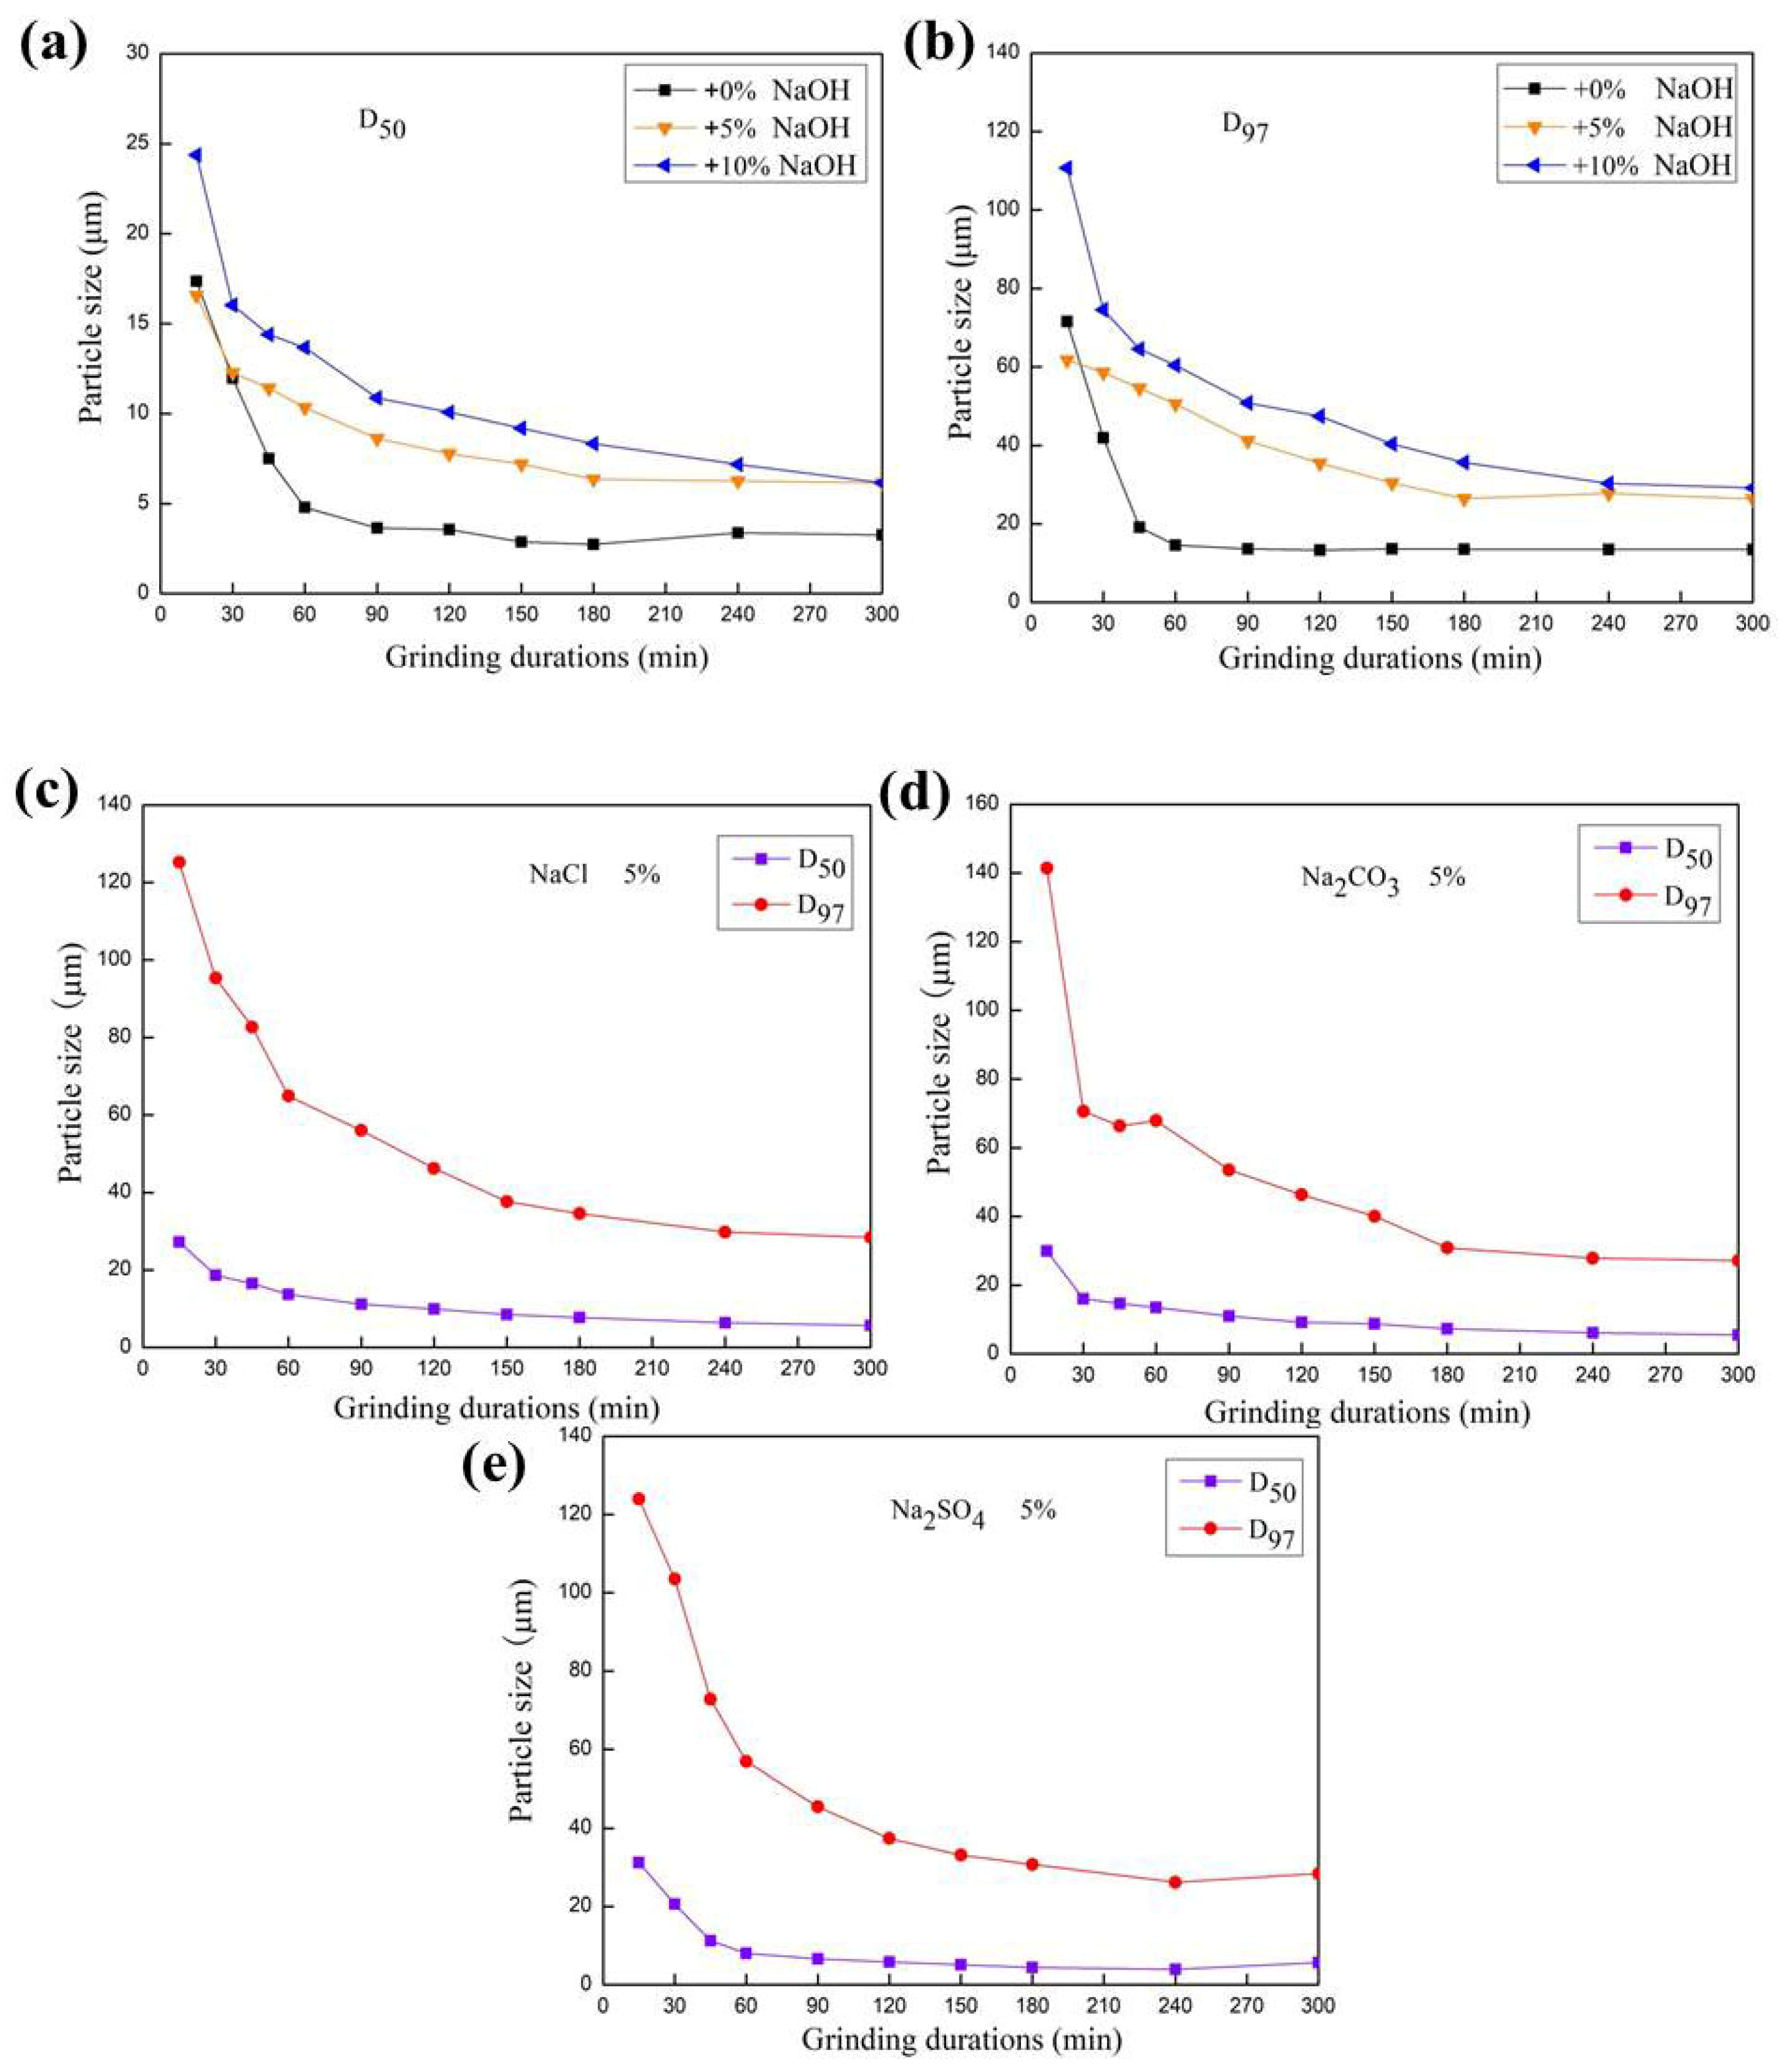
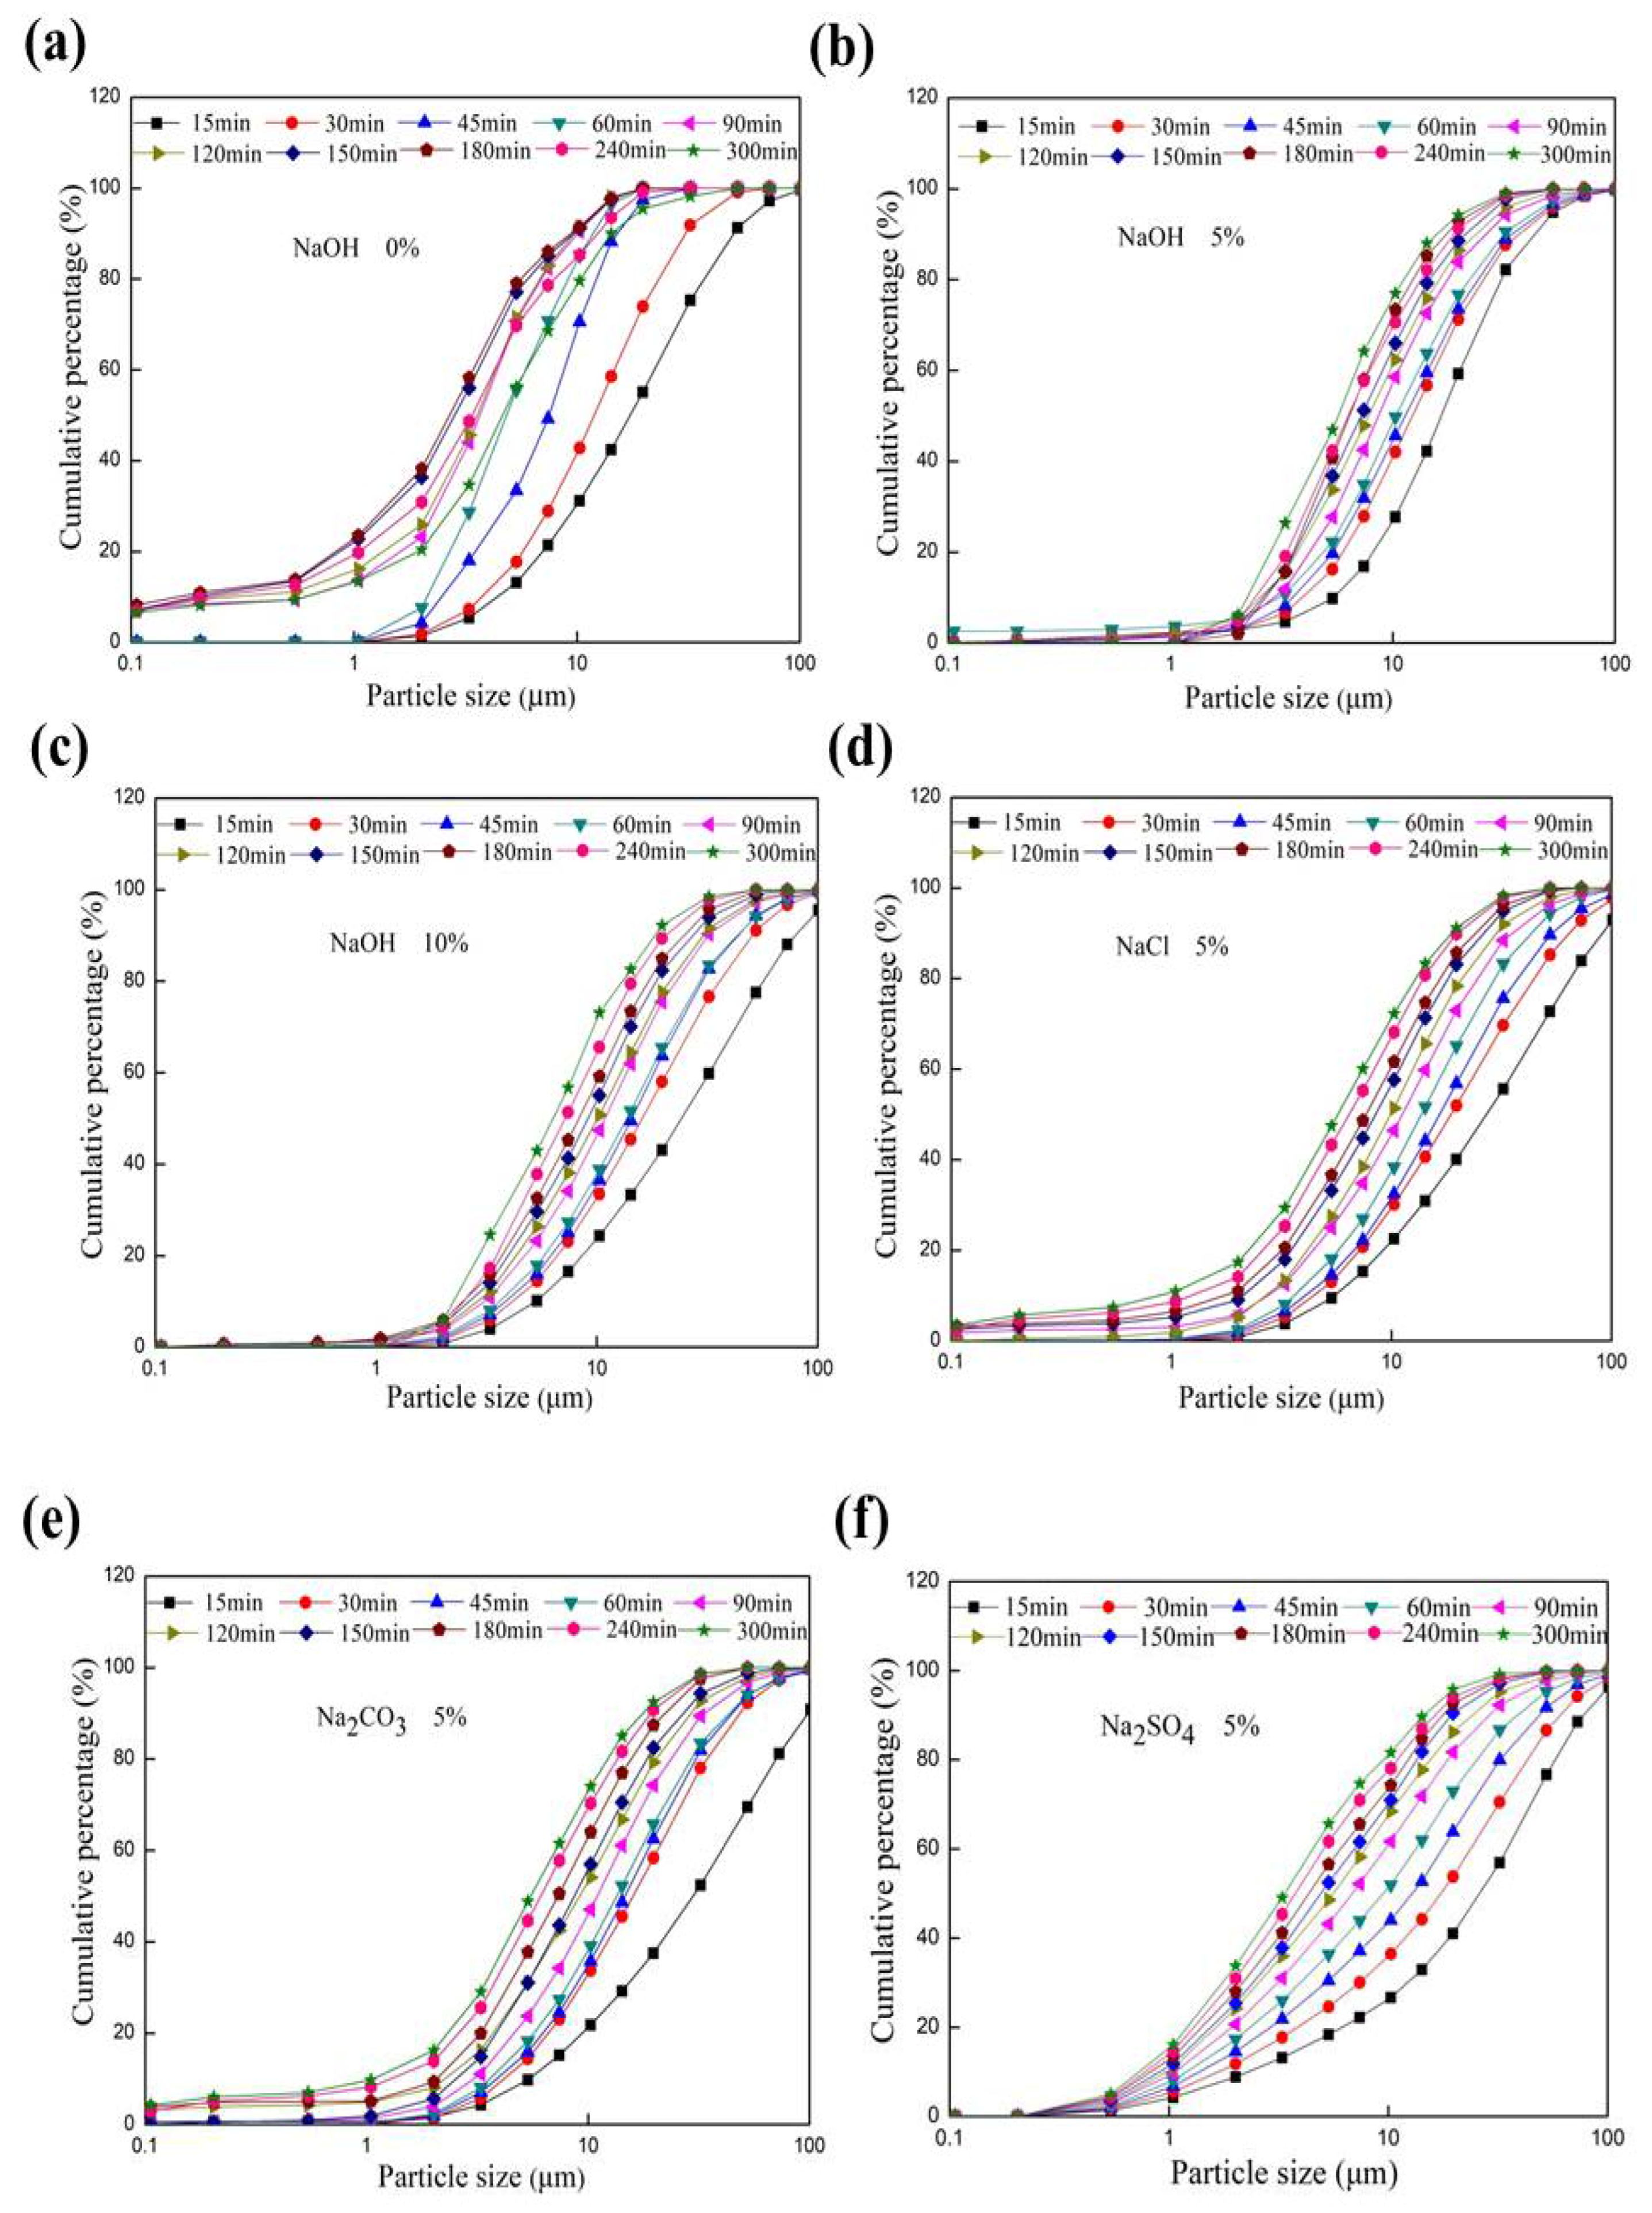
3.1. Change in Particle Size Distribution of Feldspar Subjected to Mechanical Grinding
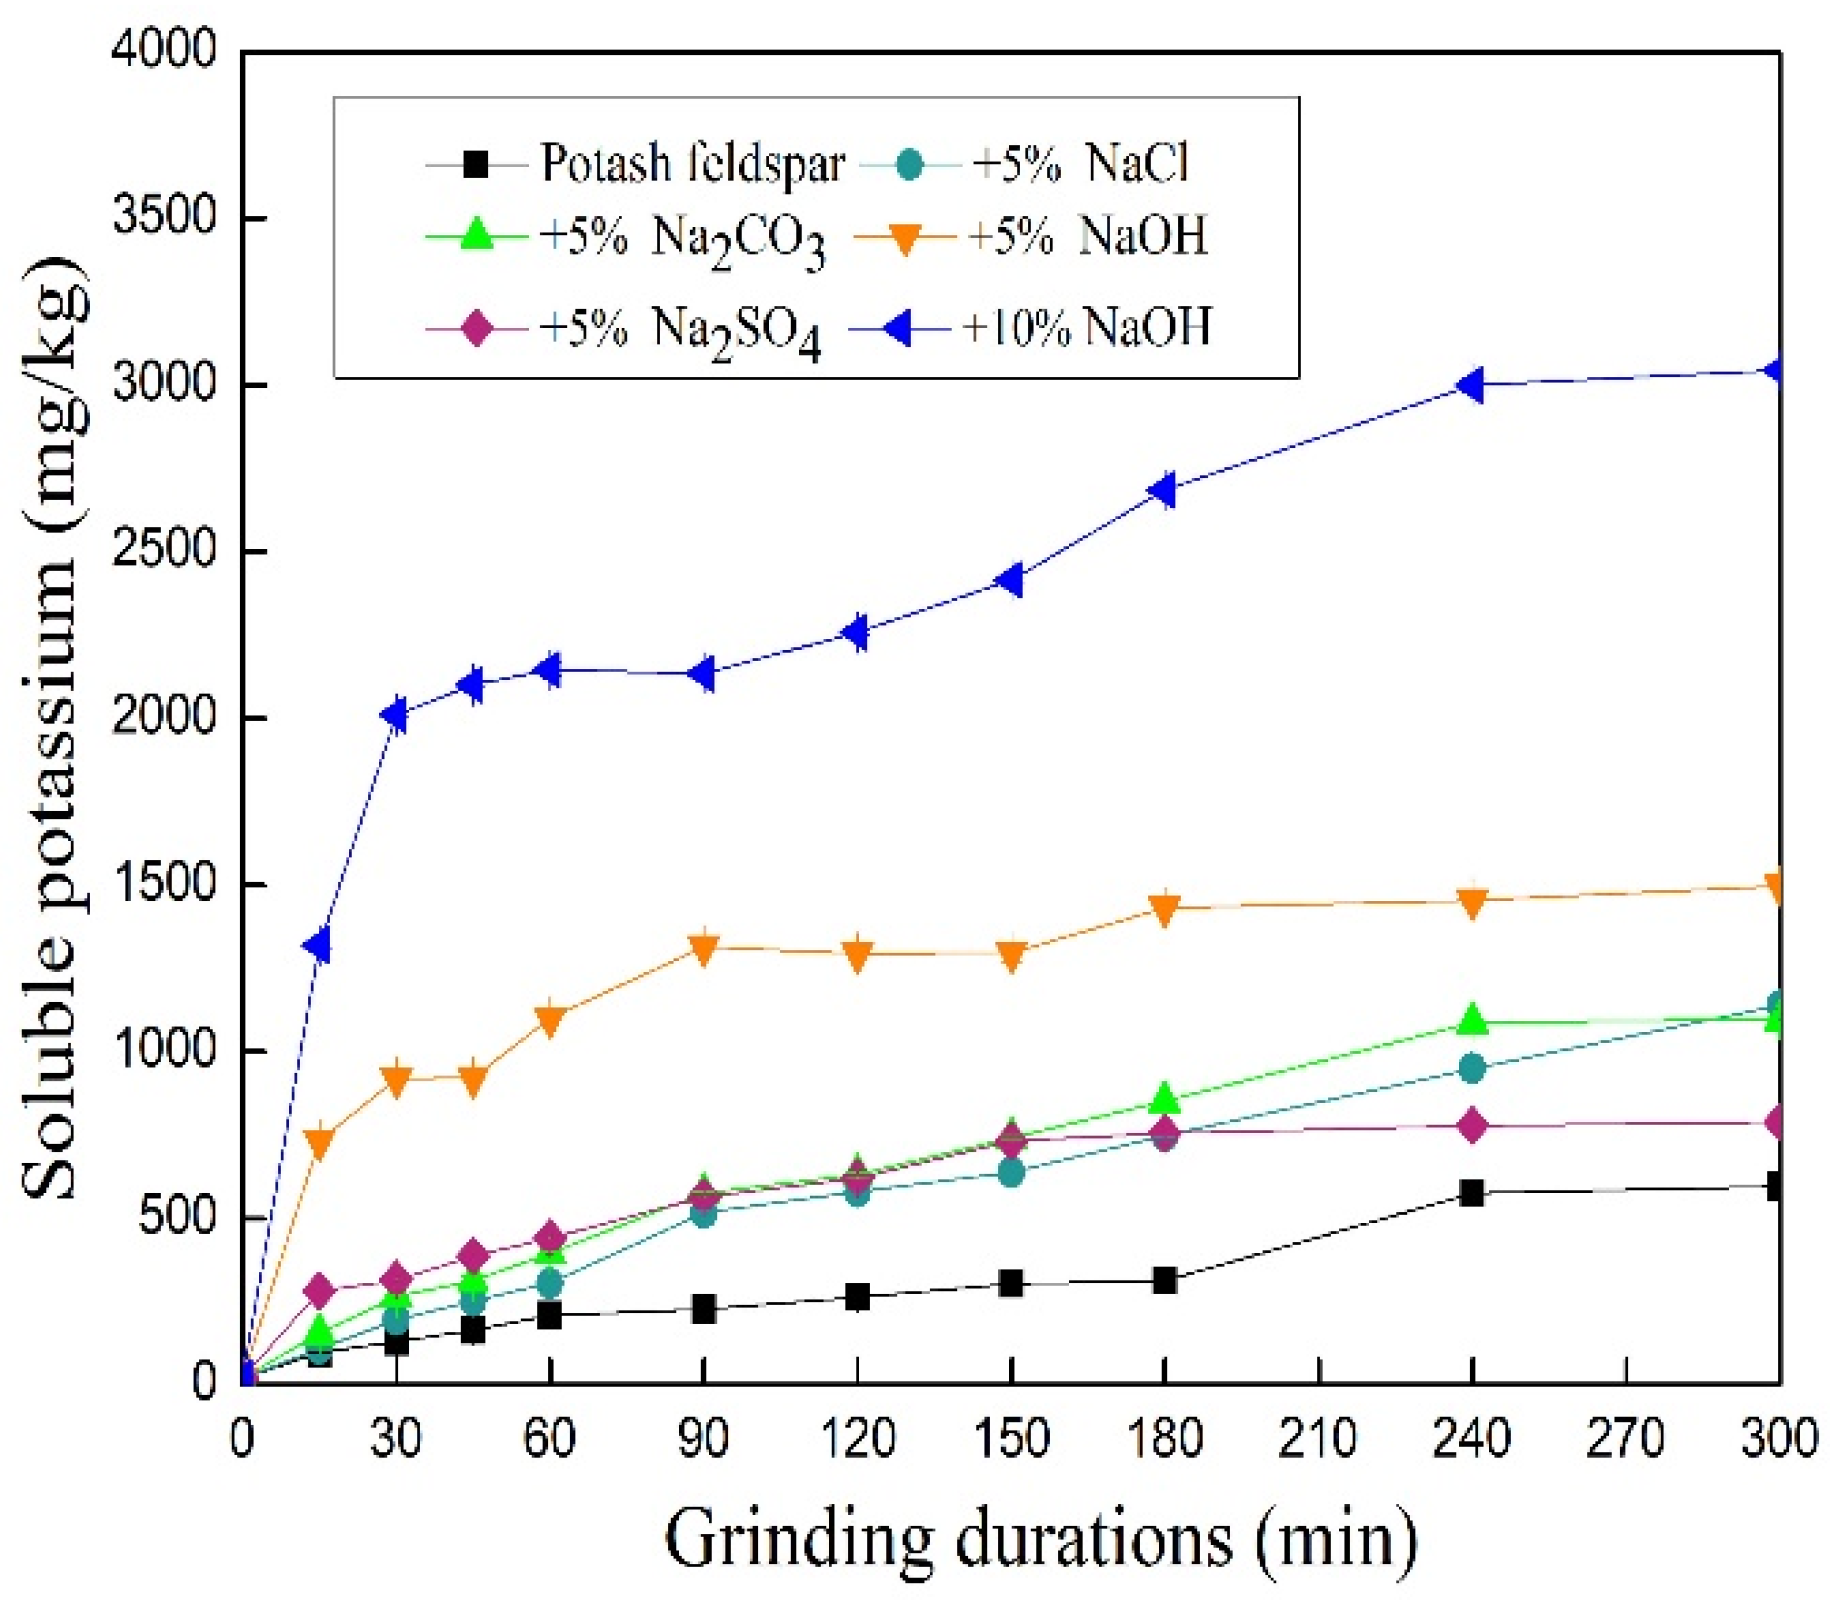
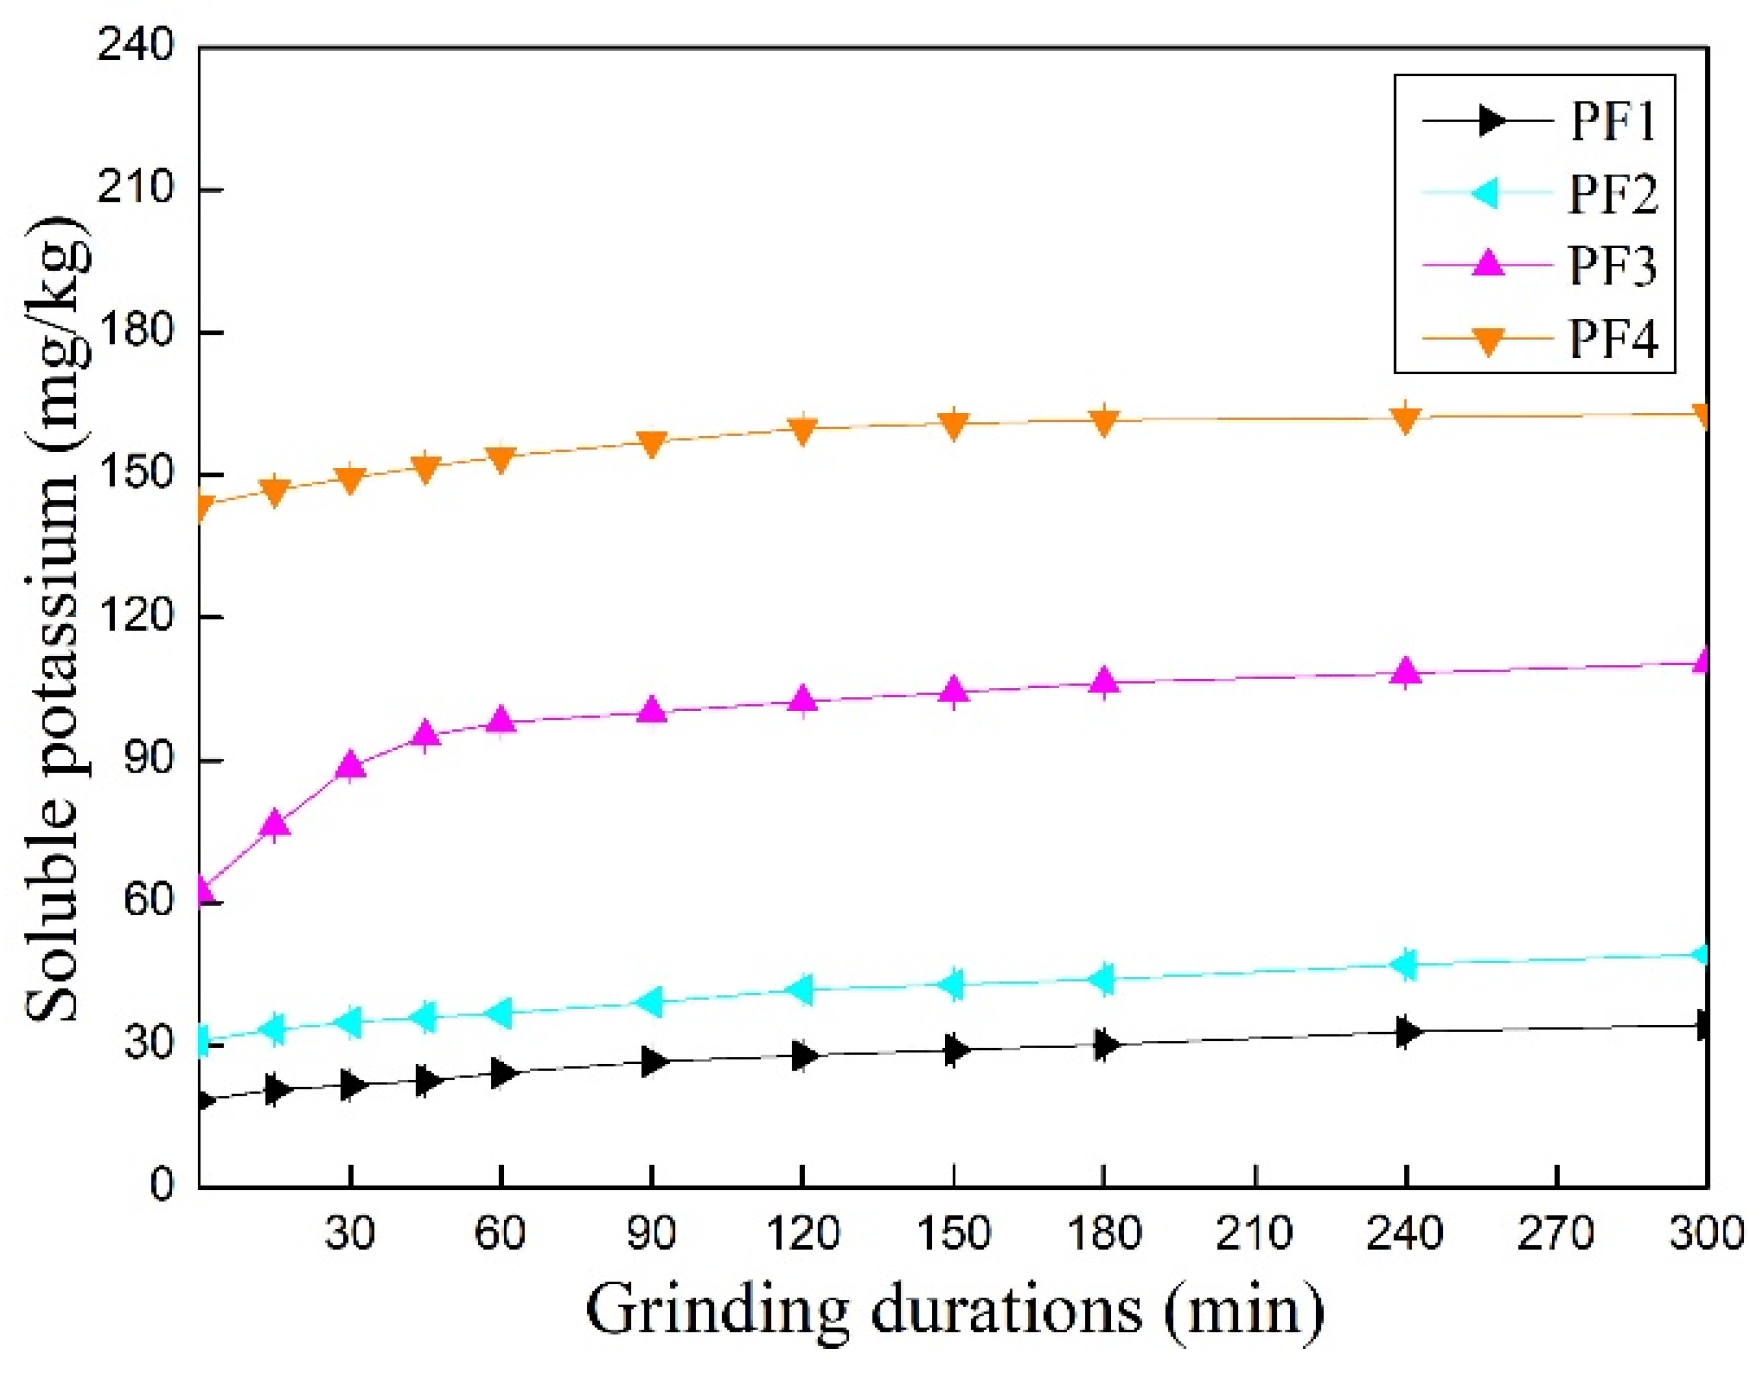
3.2. Influence of Additives on Water-Soluble Potassium Contents of Mechanically Ground Feldspar Powder
3.3. Dissolution of Potassium Feldspar in Water and Sodium Hydroxide Solution
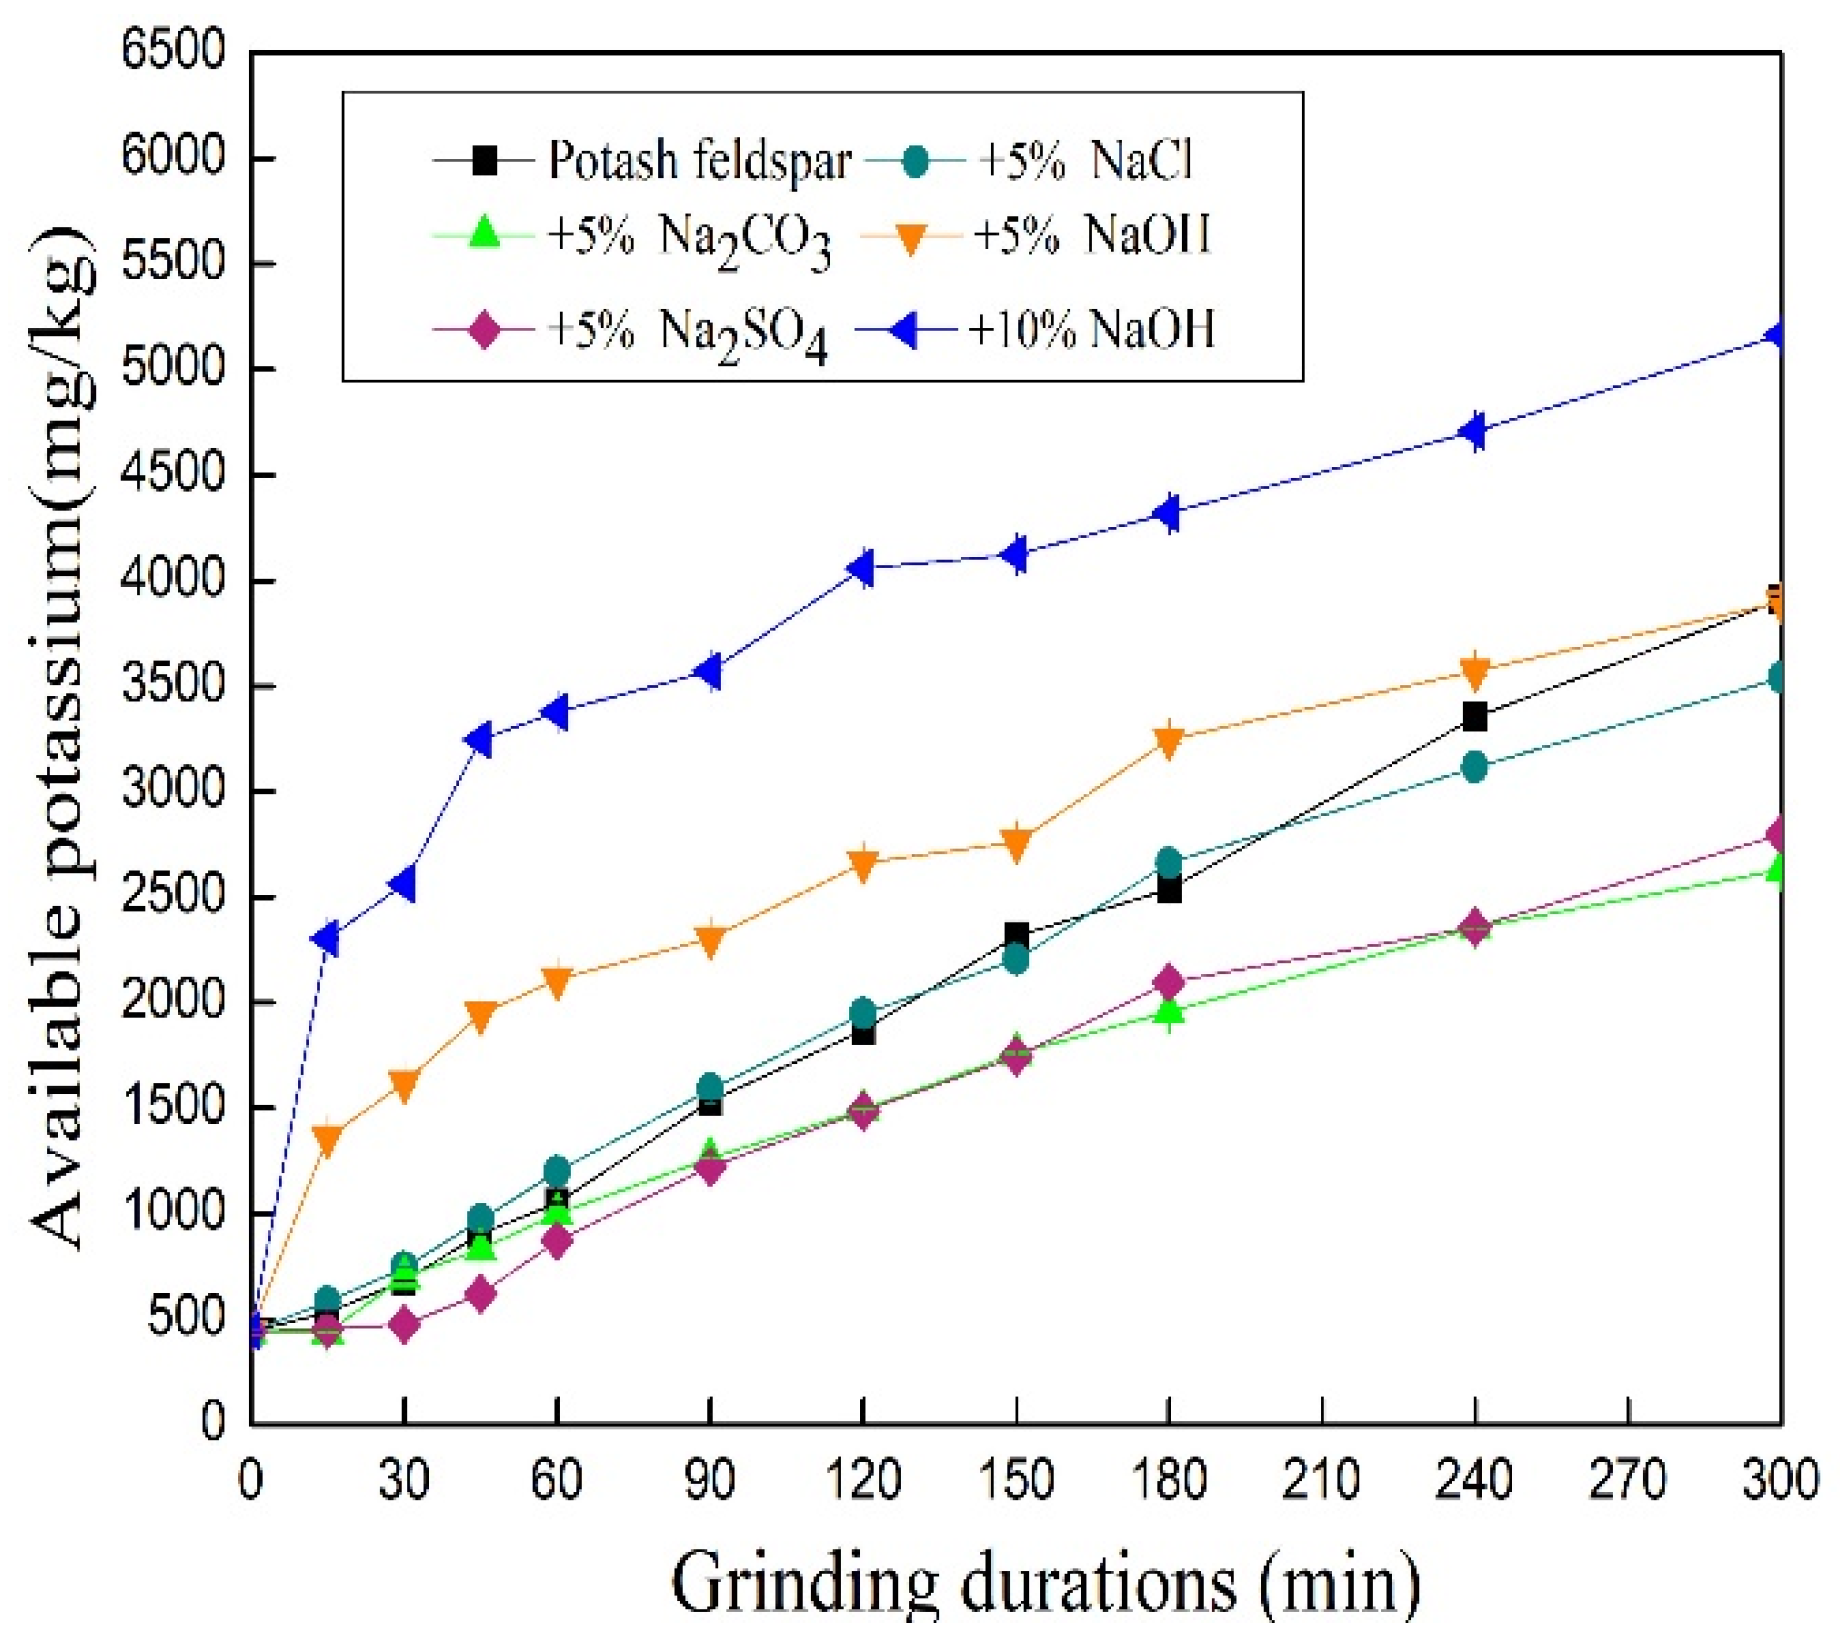
3.4. Effect of Additives on Available Potassium Content in Mechanically Ground Feldspar
3.5. Changes in Specific Surface Area of Feldspar Powder during Grinding
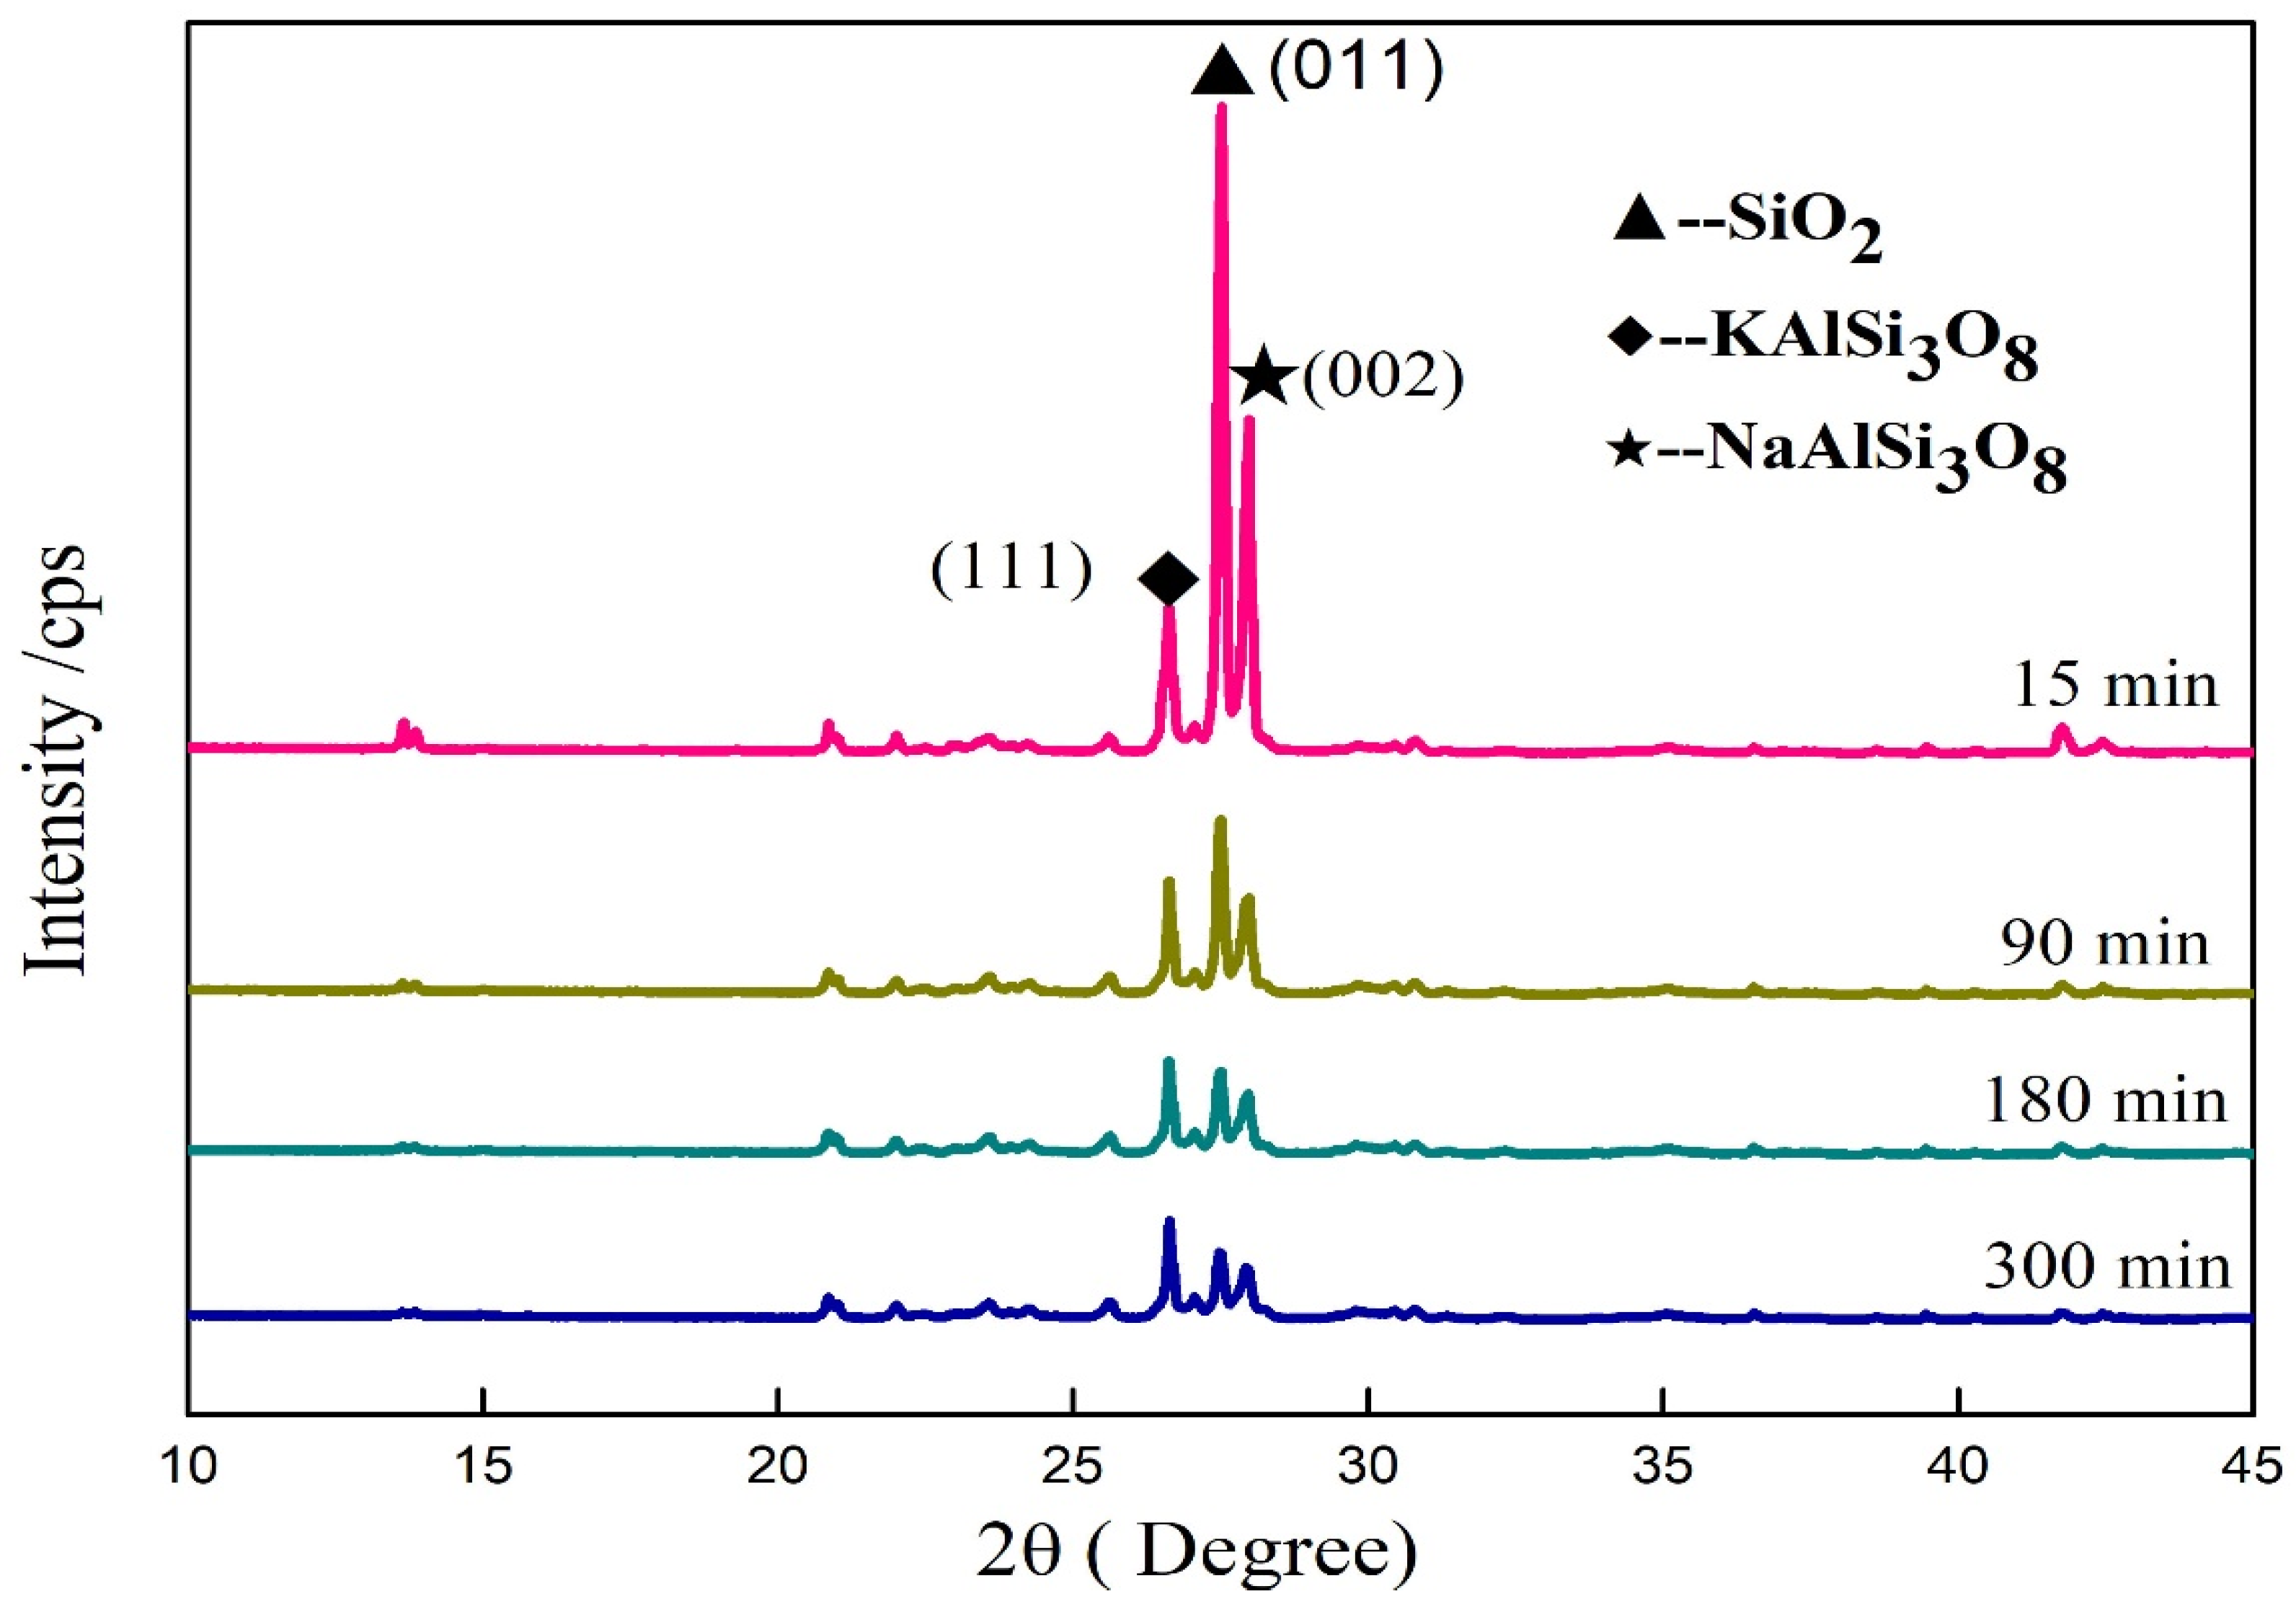
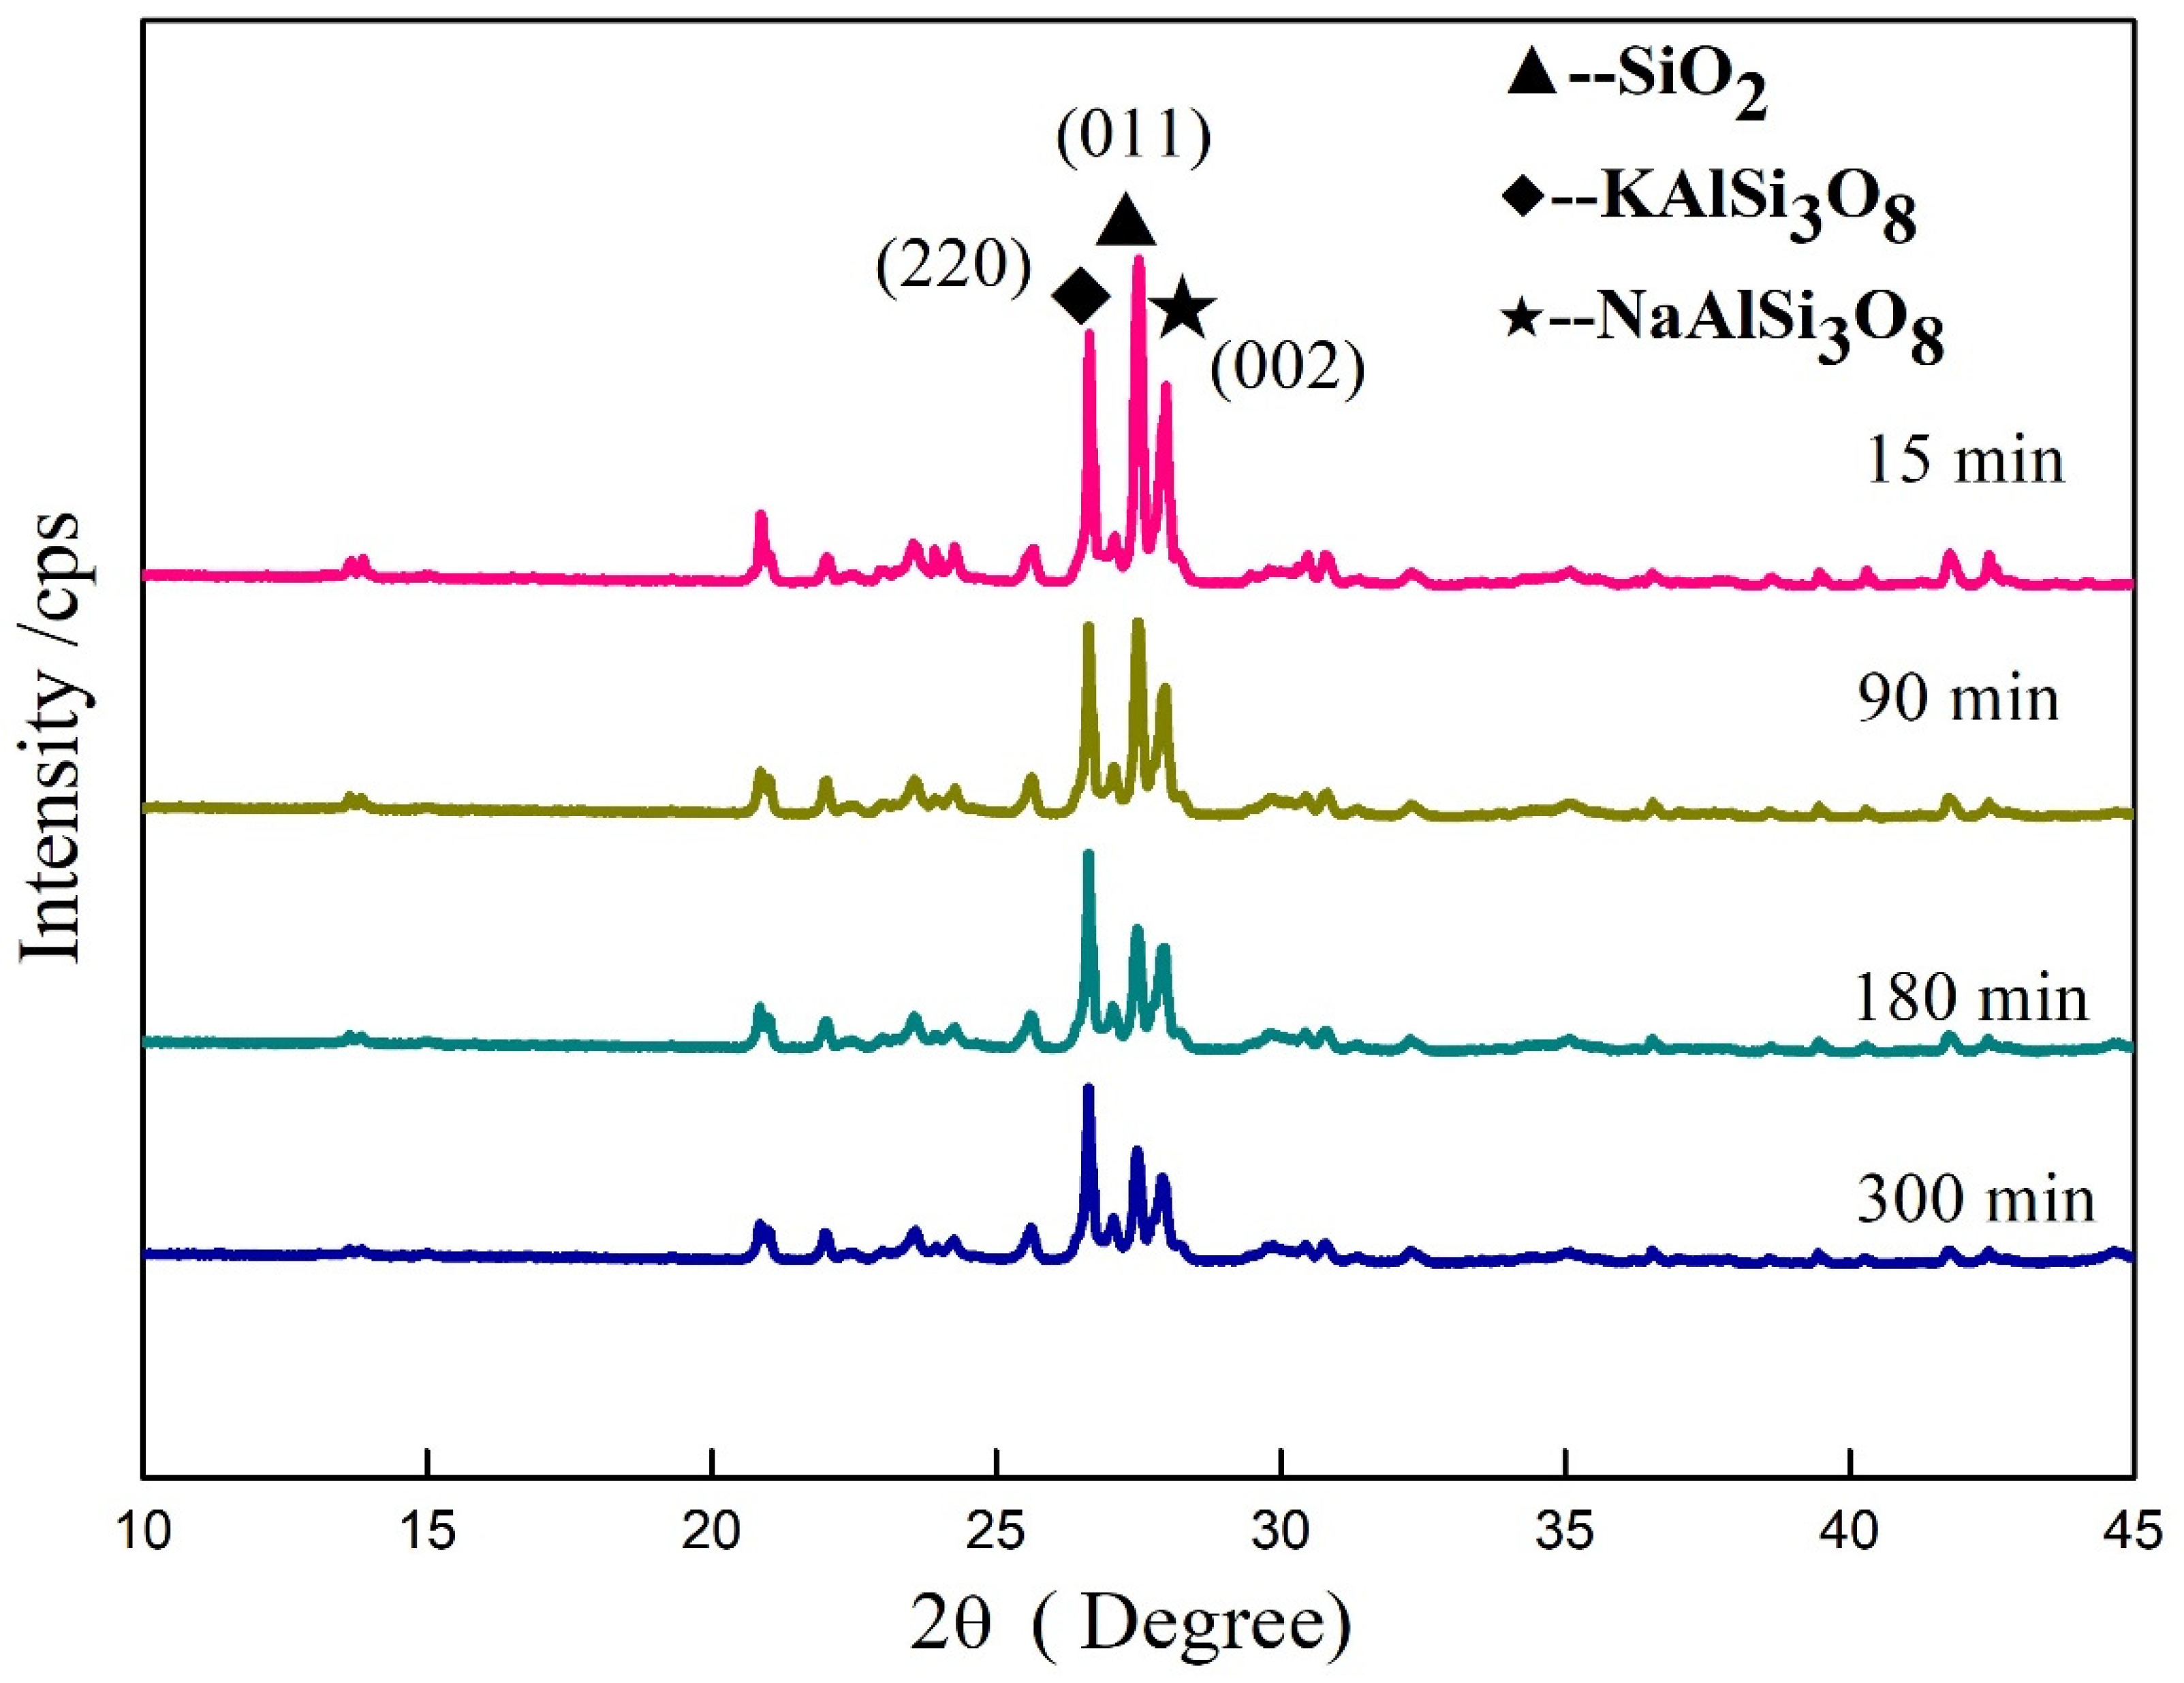
3.6. Influence of Mechanical Grinding on Crystal Structure of Minerals in Potassium Feldspar
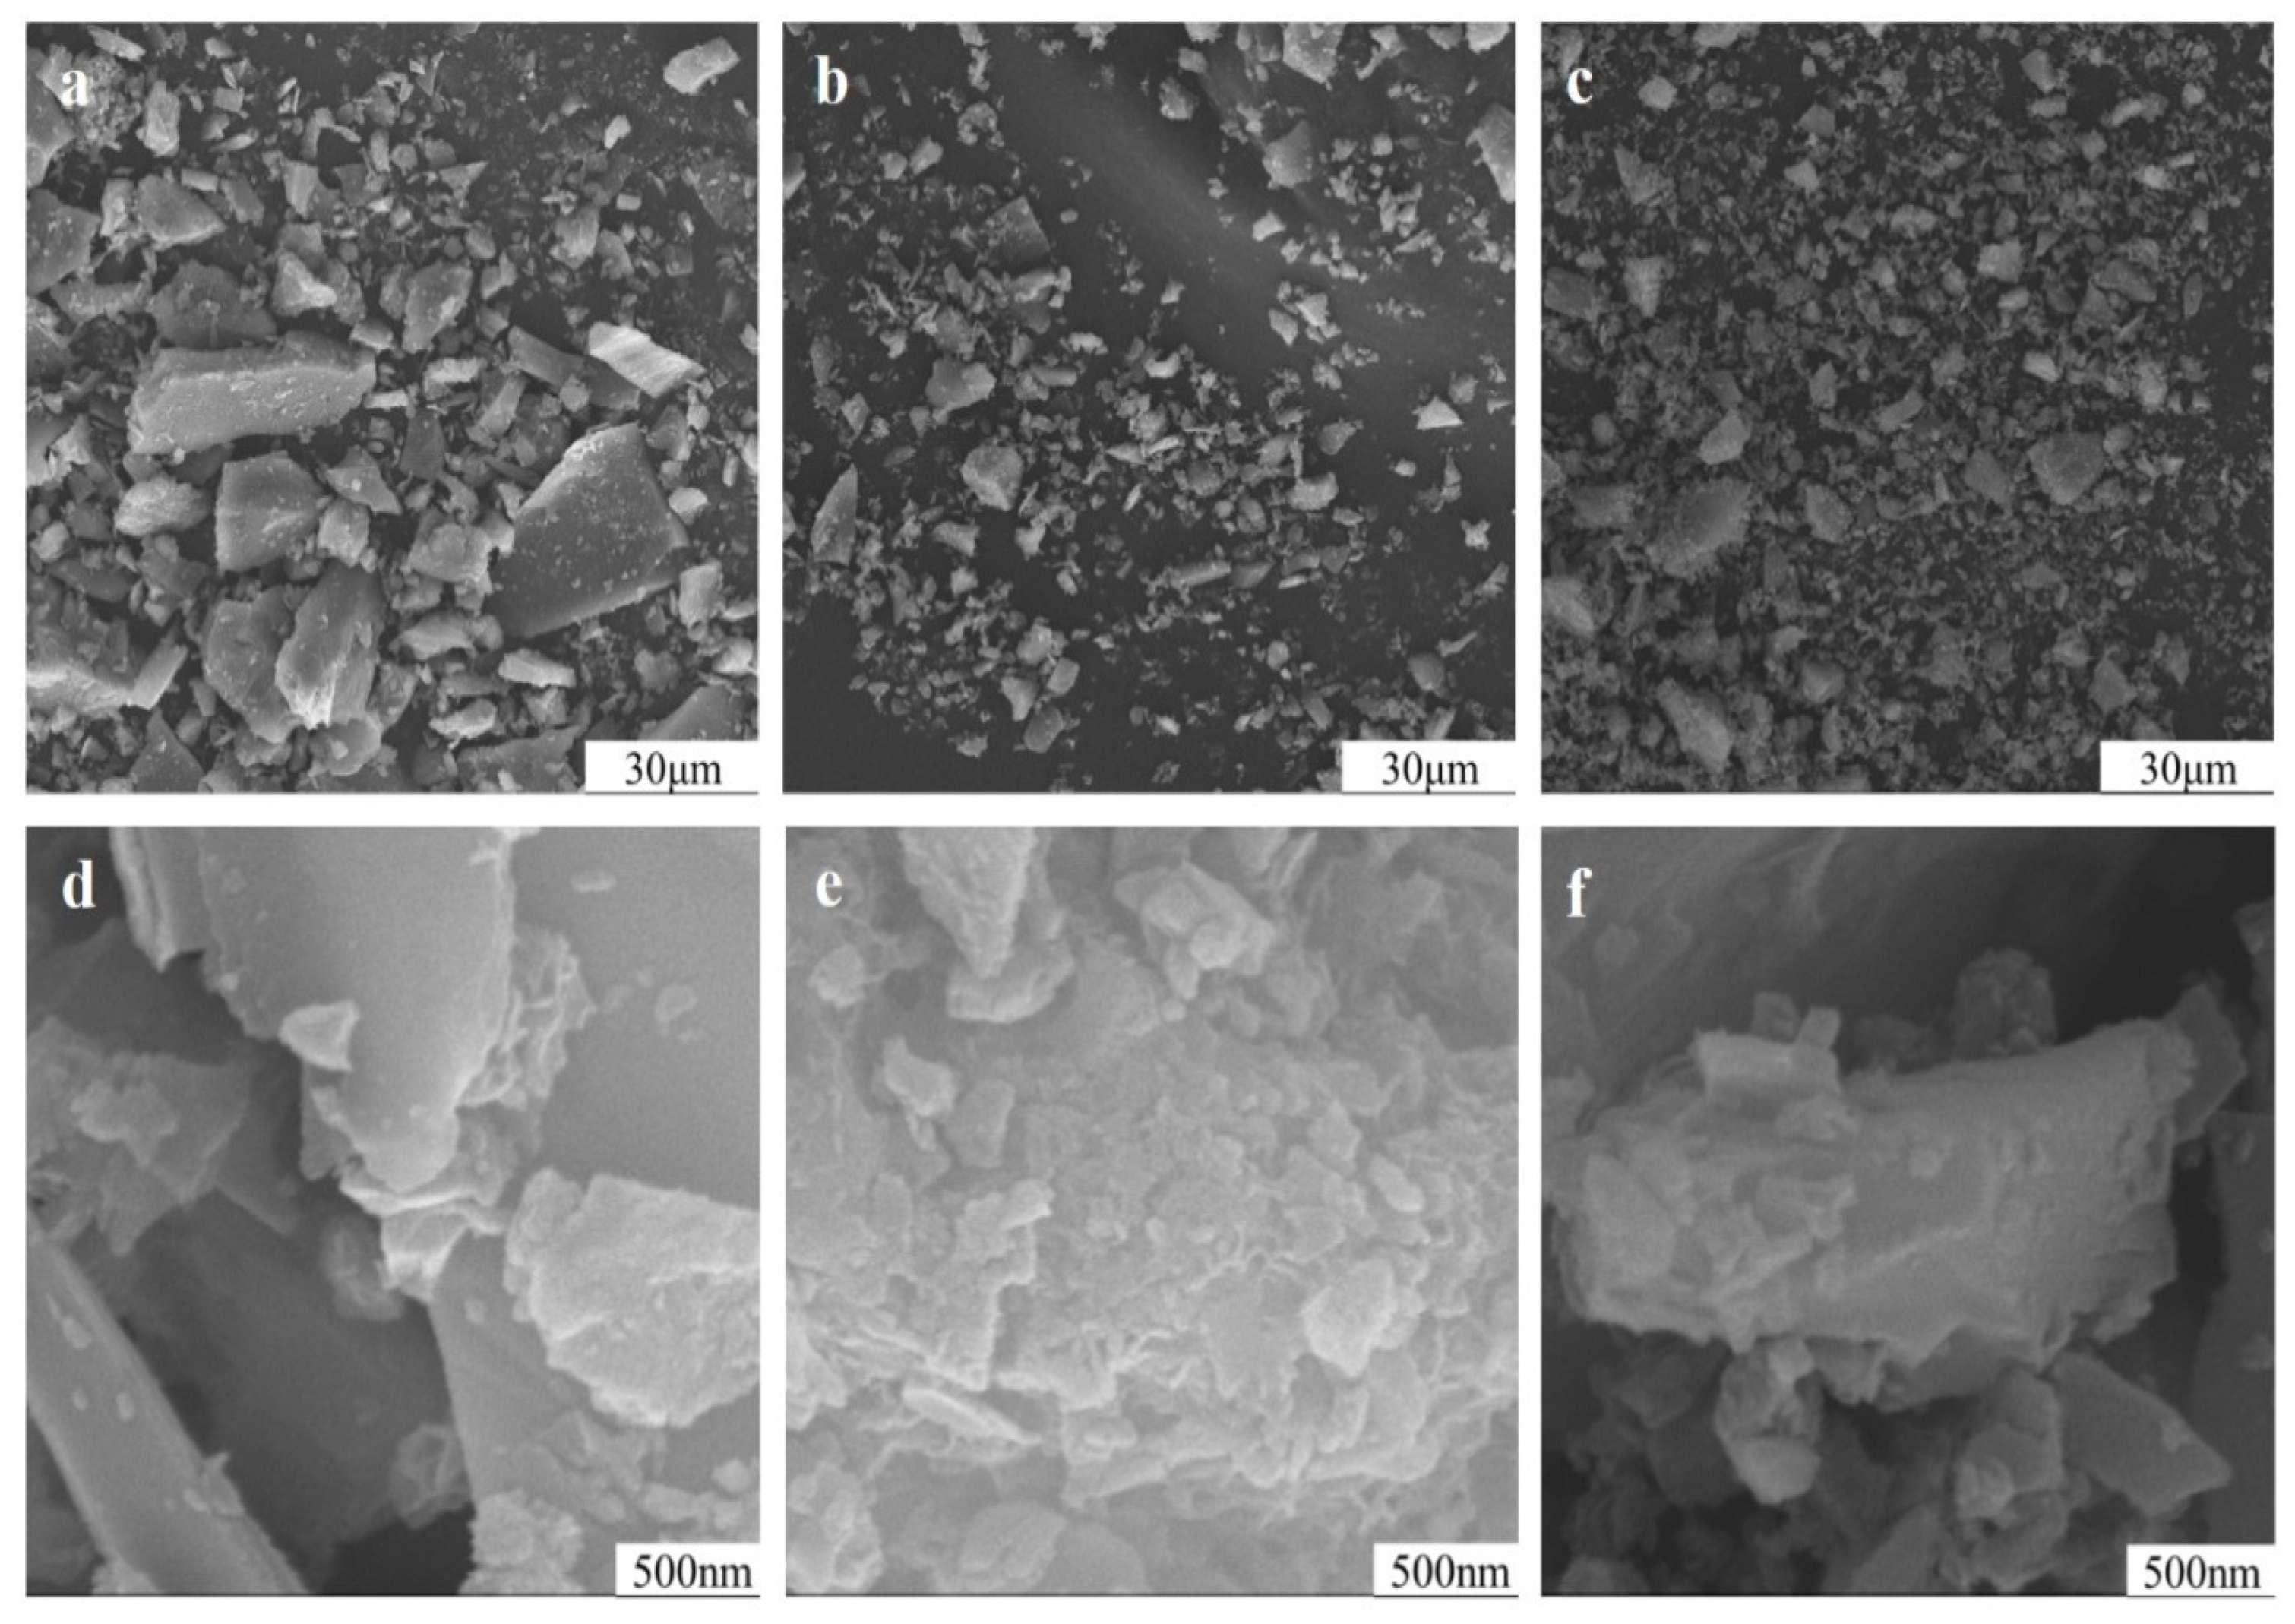
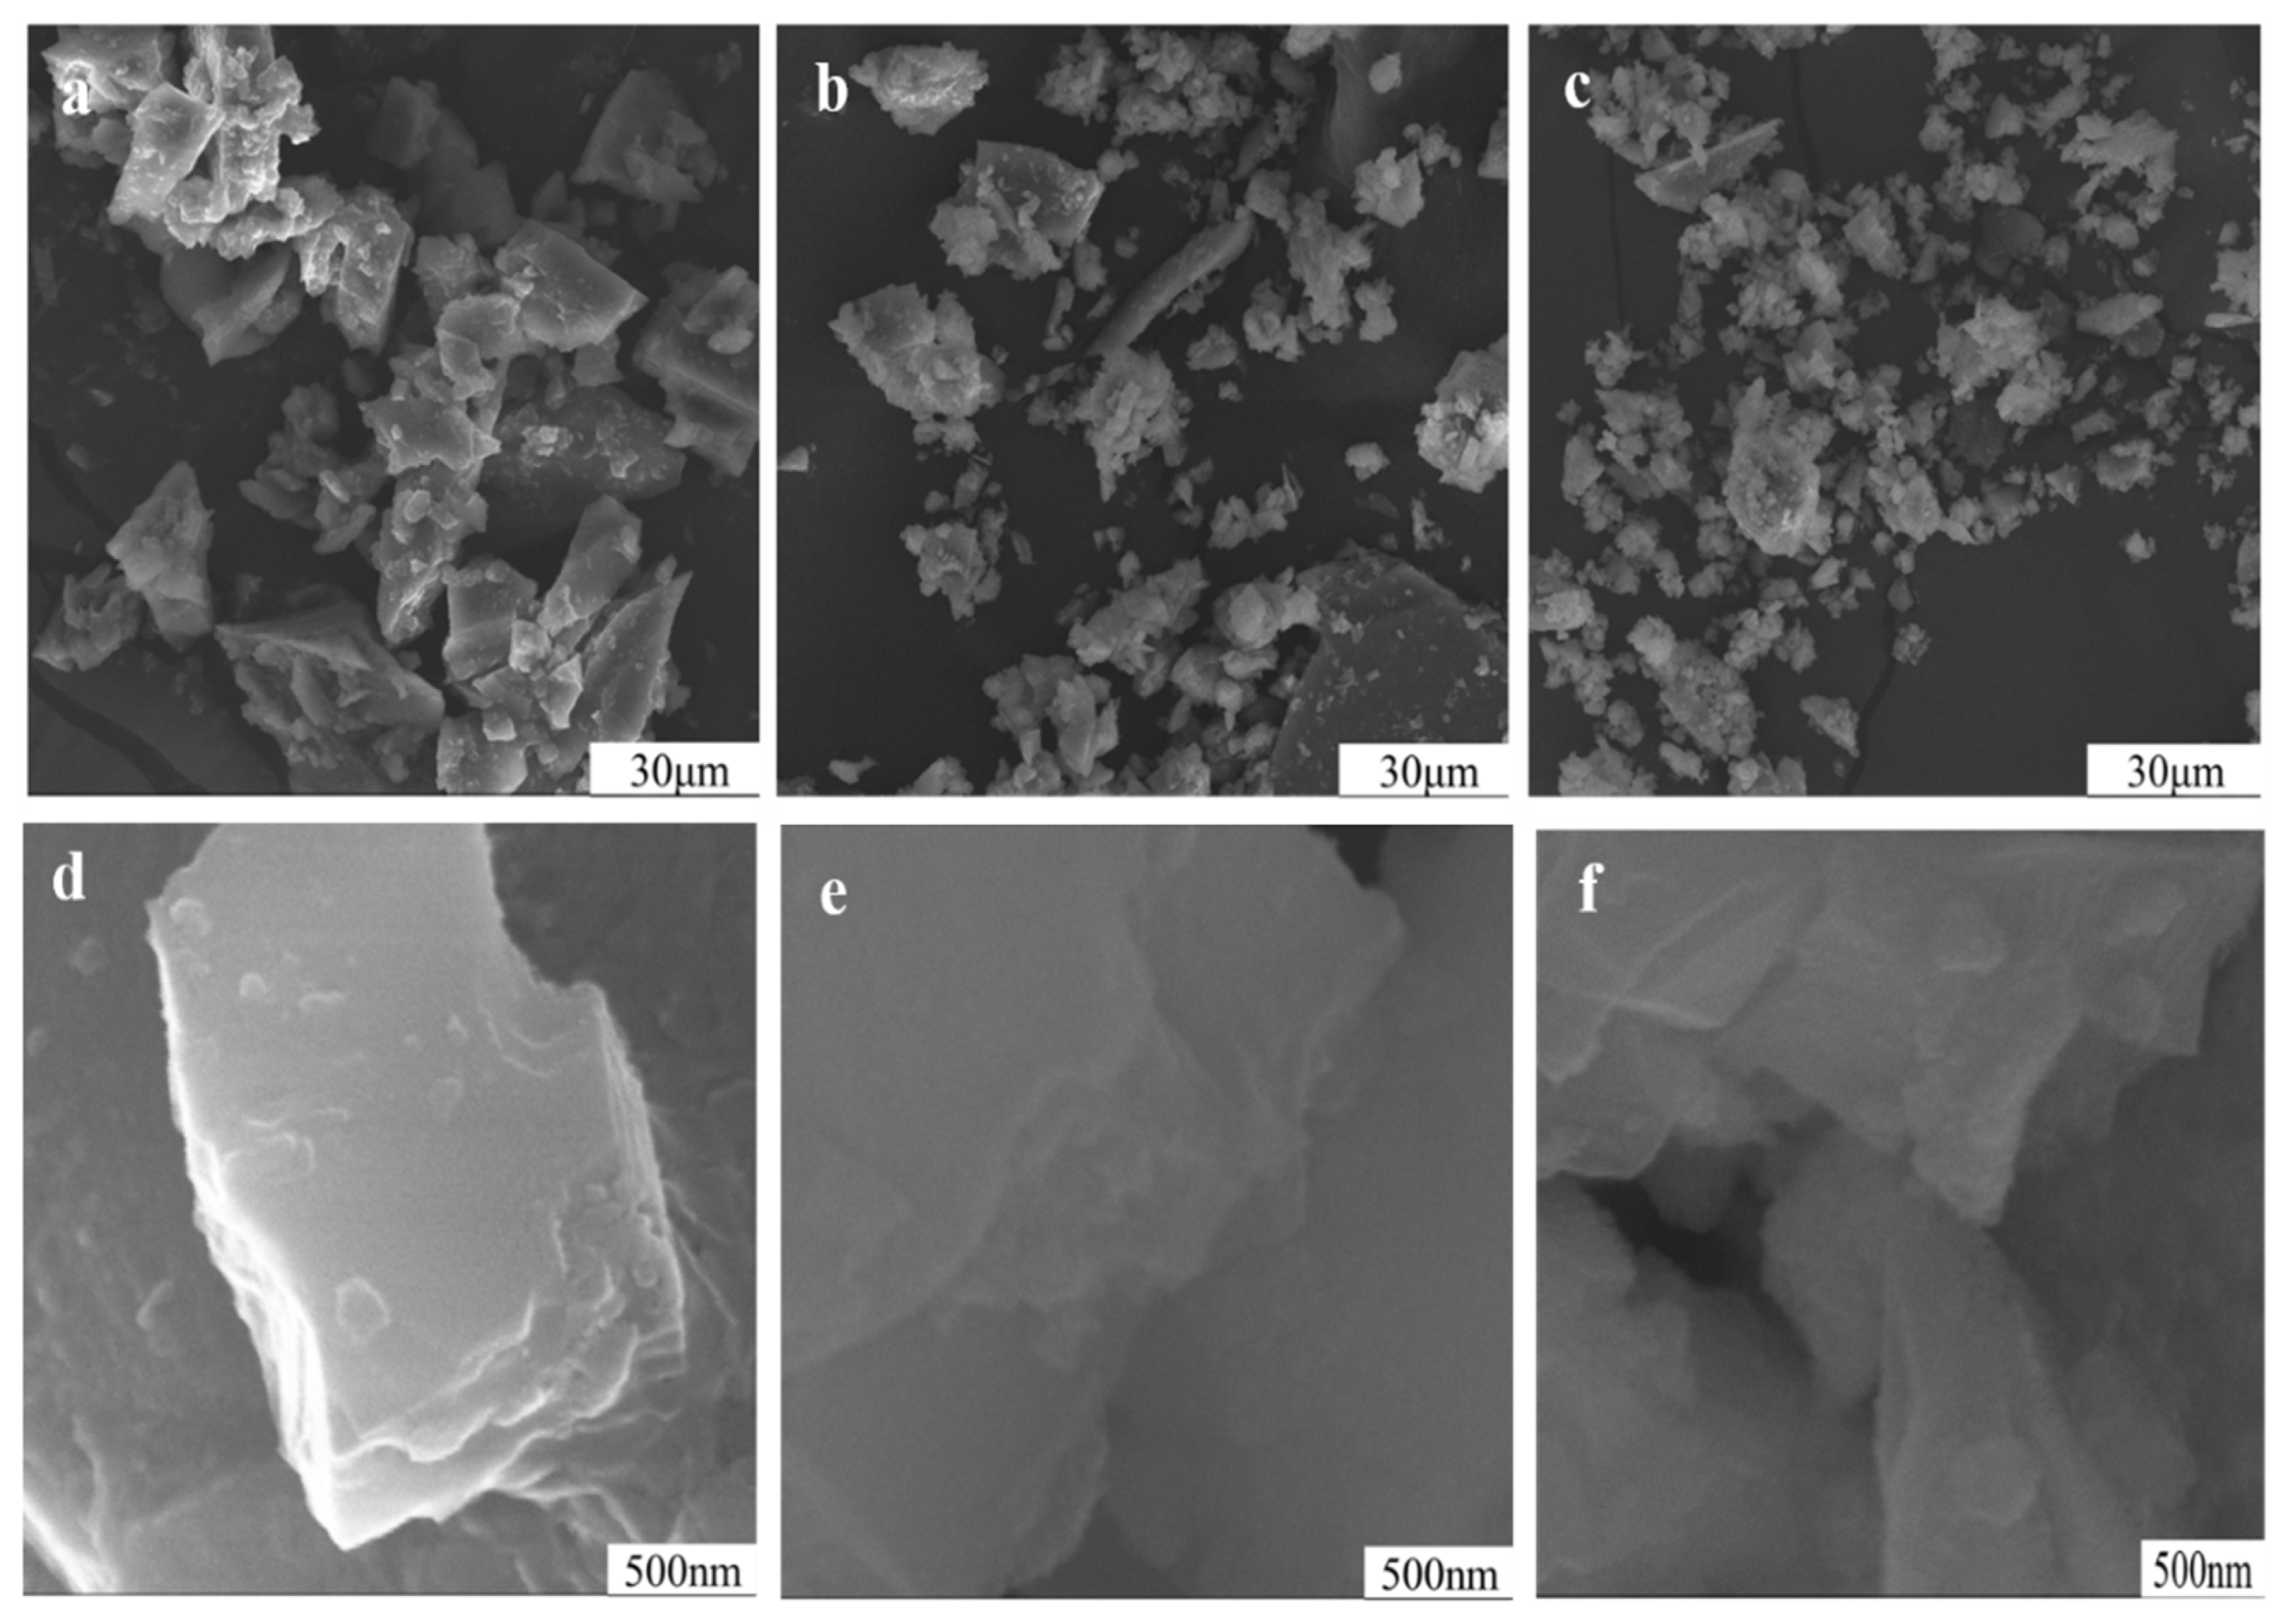
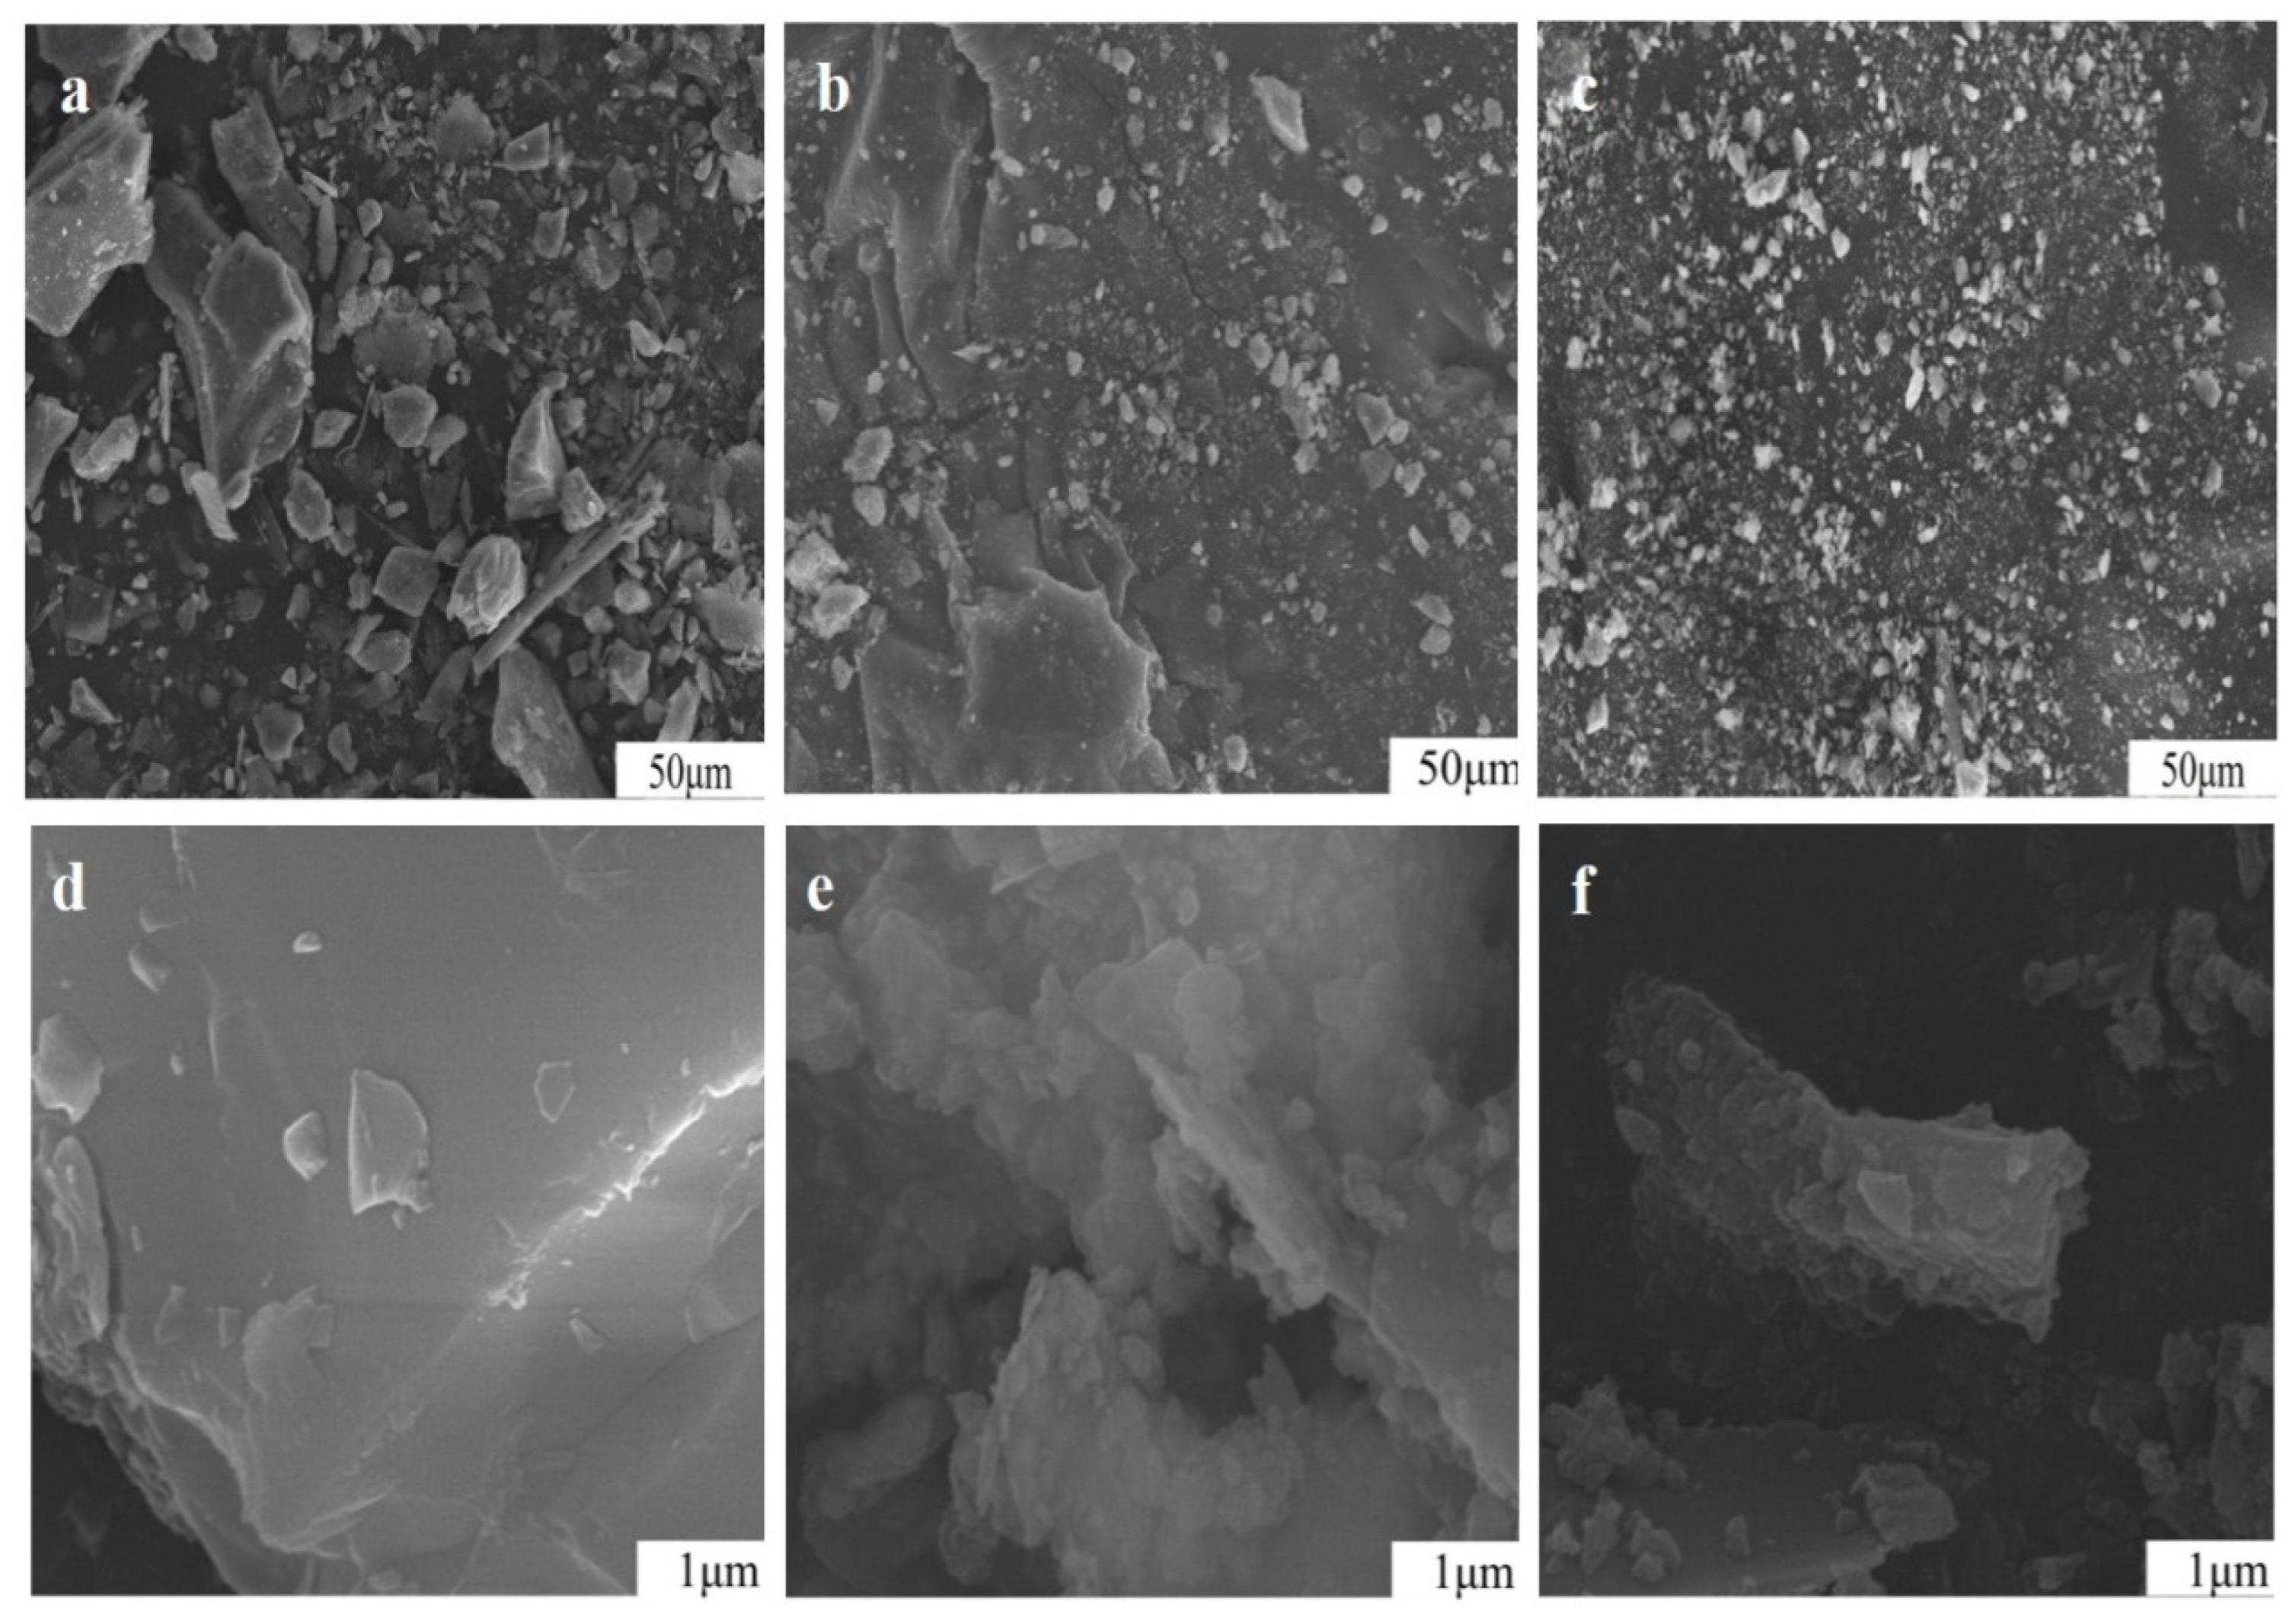
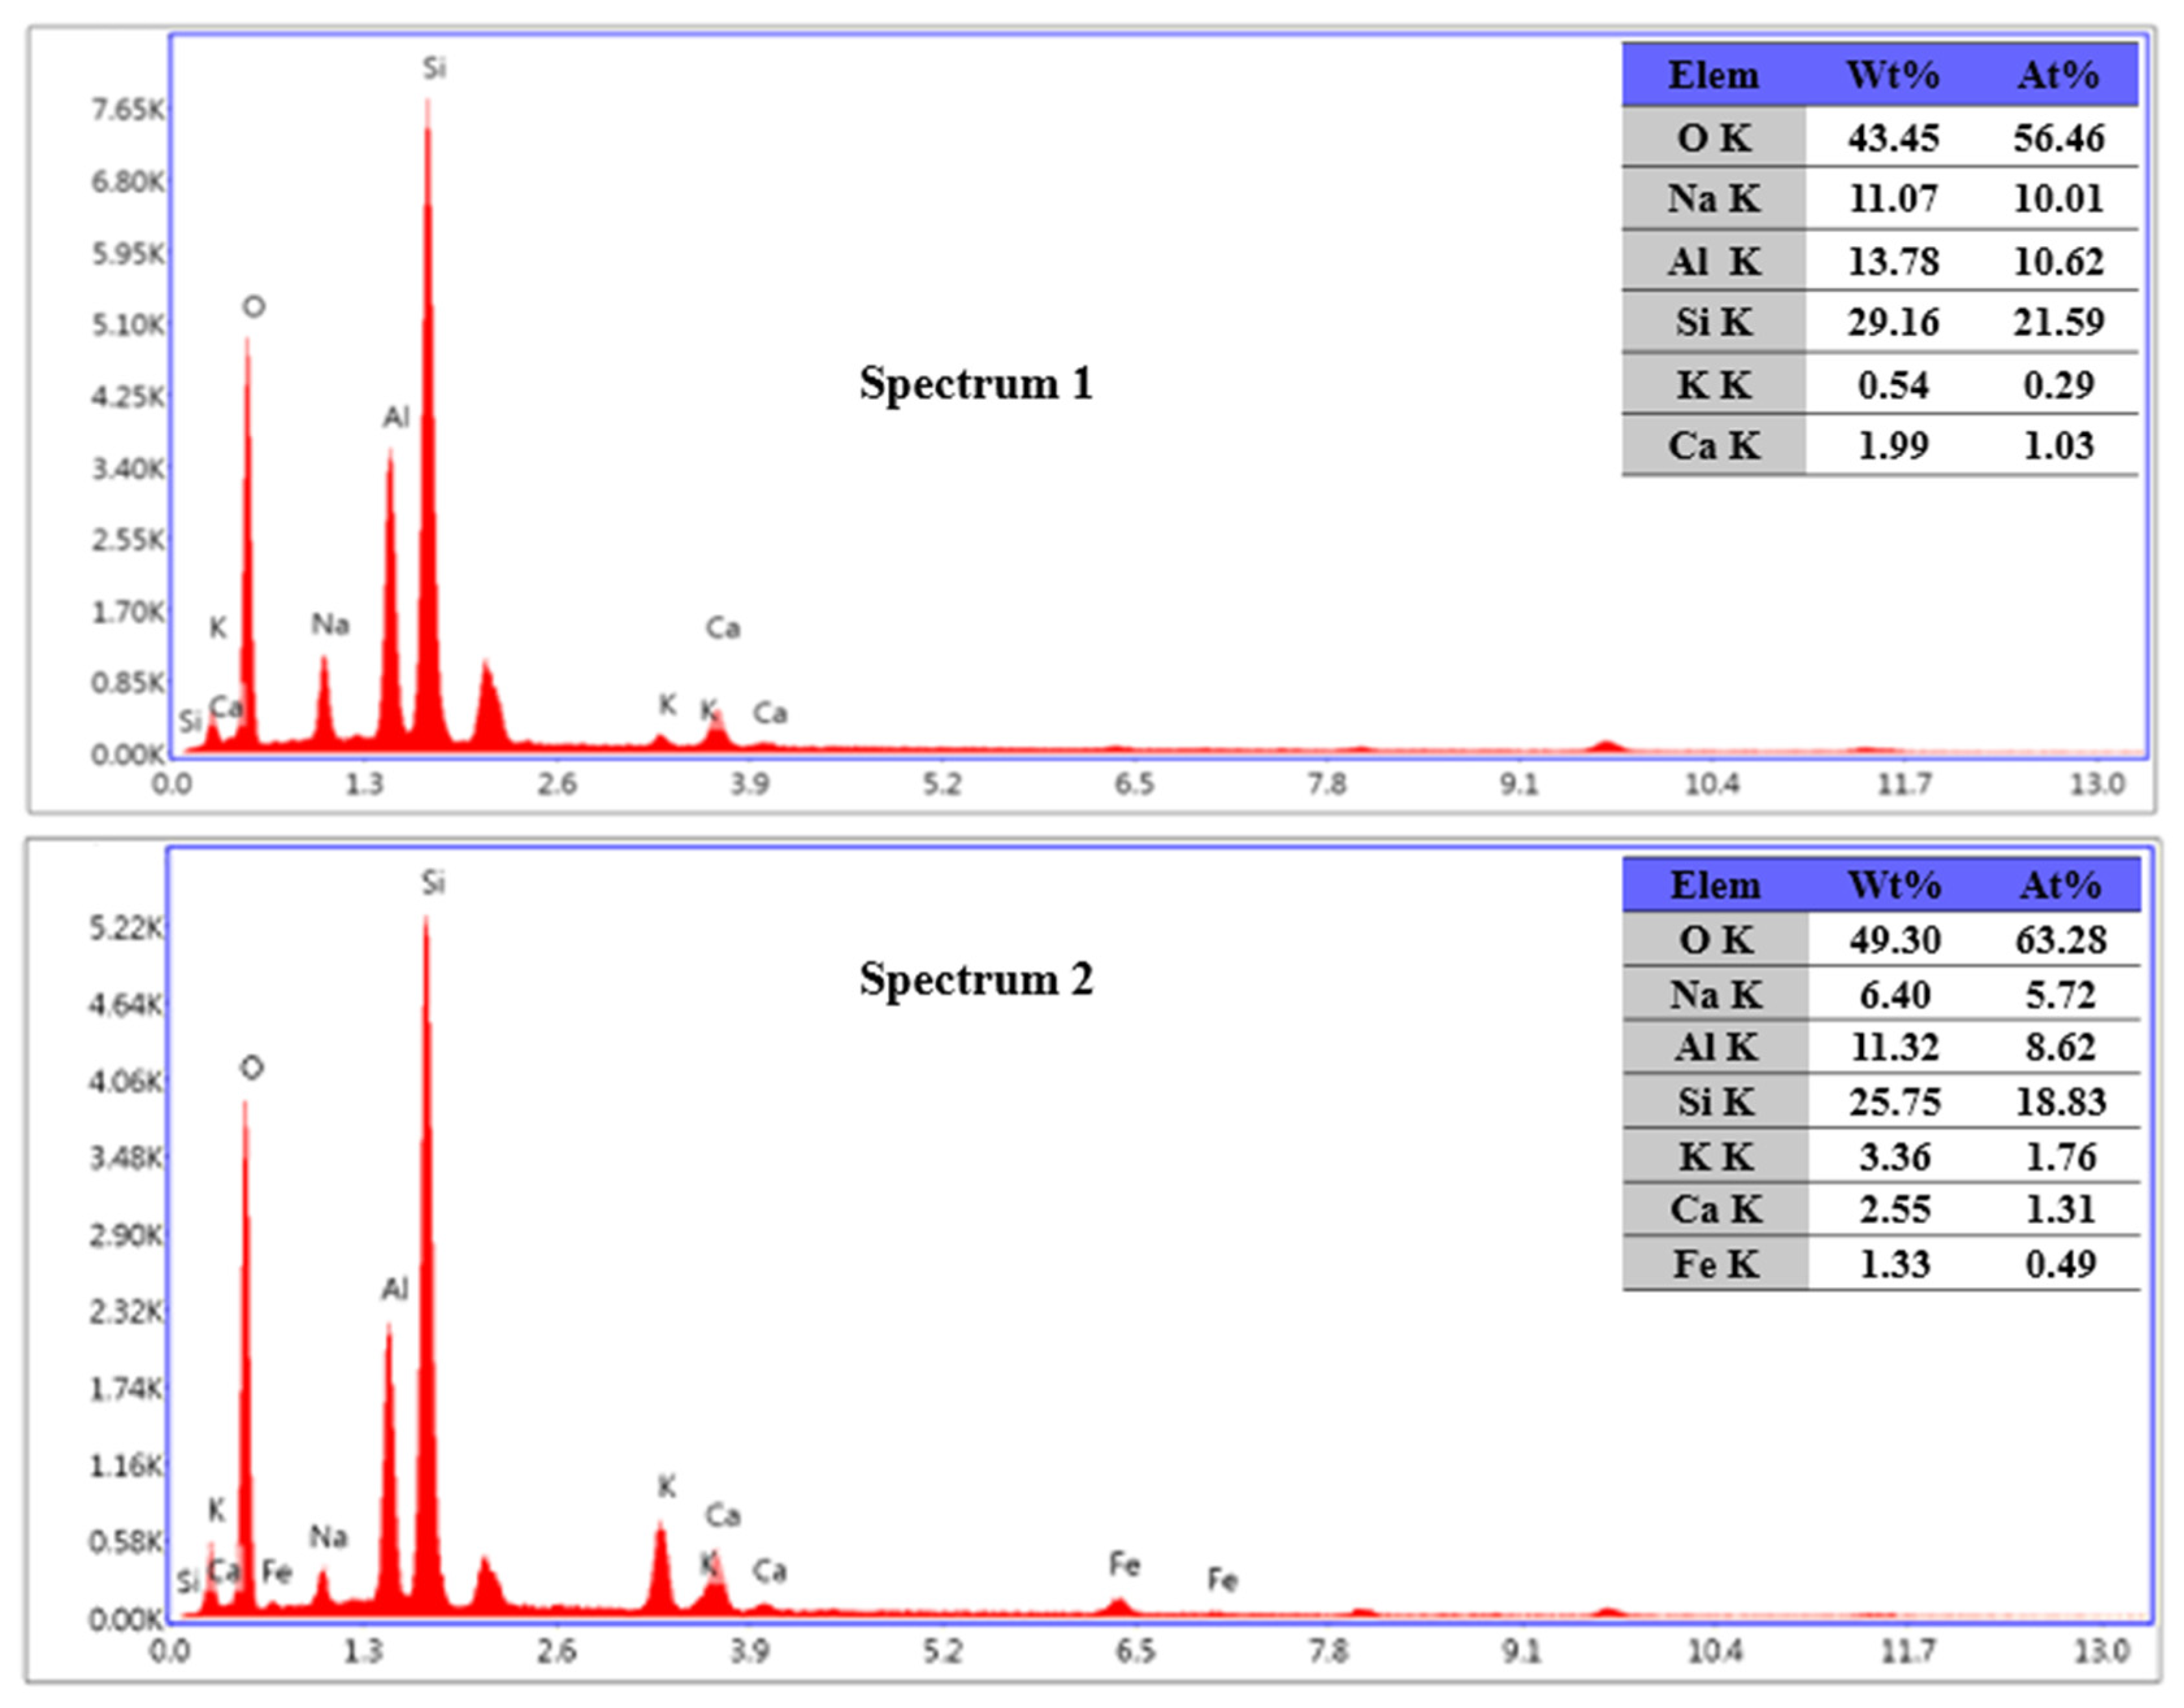
3.7. Impact of Mechanical Grinding on Particle Surface of Potassium Feldspar
4. Discussion
4.1. Change in Particle Distribution and Crystal Structure of Potassium Feldspar by Mechanochemical Activation
4.2. Acceleration of Ion Exchange by Mechanochemical Activation
5. Conclusions
Author Contributions
Funding
Institutional Review Board Statement
Informed Consent Statement
Data Availability Statement
Conflicts of Interest
References
- Jena, S.K.; Dash, N.; Samal, A.K.; Misra, P.K. Competency of chlorination roasting coupled water leaching process for potash recovery from K-feldspar: Mechanism and kinetics aspects. Korean J. Chem. Eng. 2019, 36, 2060–2073. [Google Scholar] [CrossRef]
- Production & International Trade and Agriculture Services. Fertilizer Outlook 2017–2021; International Fertilizer Association (IFA): Paris, France, 2017; pp. 1–4. [Google Scholar]
- Sun, X.H.; Tang, Y.; Chen, C.L.; Qu, Y.Y. Present status of potassium salt industry in the world. Mod. Chem. Ind. 2015, 35, 1–3. [Google Scholar]
- Liu, R.; Wang, Z.H.; Xu, Q.; Yu, N.; Cao, M.C. Experimental research on ion exchange reactions of orthoclase with sodium chloride. Acta Petrol. Mineral. 2013, 32, 930–934. [Google Scholar]
- Liu, S.; Han, C.; Liu, J.M. Process optimization of potassium release from K–Feldspar by combining calcination and hydrothermal method. ChemistrySelect 2020, 5, 522–527. [Google Scholar] [CrossRef]
- Rashwan, B.R.A.; Shaheen, A.E.A. The Impact of Potassium Sources and Bio Fertilizer on Corn Plant and Potassium Availability in Calcareous Soil. Asian Soil Res. J. 2021, 5, 27–37. [Google Scholar] [CrossRef]
- Doaa, M.; Ashmawi, A.E. Effect of Feldspar, Compost and Biochar on Cultivating Cowpea (Vigna unguiculata ssp. unguiculata) Plant and Soil Sandy Clay Loam Properties. Asian Soil Res. J. 2022, 6, 42–57. [Google Scholar] [CrossRef]
- Yousef, A.F.; Ali, A.M.; Azab, M.A.; Lamlom, S.F.; Al-Sayed, H. Improved plant yield of potato through exogenously applied potassium fertilizer sources and biofertilizer. AMB Express 2023, 13, 124. [Google Scholar] [CrossRef]
- Zuo, H.Y.; Liu, R.; Lu, A.H. The Behavior of Water in Orthoclase Crystal and Its Implications for Feldspar Alteration. Crystals 2022, 12, 1042. [Google Scholar] [CrossRef]
- Tao, L.F.; Guo, L.; Liu, C.J.; Ma, X.; Ma, H.W. Activate nutrients access to plants as multiphase slow-release fertilizers by sintering reaction in K2O–MgO–Al2O3–SiO2 system using K-feldspar as a major source. J. Clean. Prod. 2022, 370, 133511. [Google Scholar] [CrossRef]
- Sánchez, E.; Enrique, T.M.; Diaz, C.; Saito, F. Effects of grinding of the feldspar in the sintering using a planetary ball mill. J. Mater. Process. Technol. 2004, 152, 284–290. [Google Scholar] [CrossRef]
- Weng, X.Y.; Ma, M. Preparation of potassium calcium fertilizer by potassium feldspar slim. Burn Chin. Ceram. Soc. 2012, 31, 749–752. [Google Scholar]
- Peng, Q.J.; Peng, L.B.; Zou, X.Y.; Huang, C. Study on the extracting potassium from potash feldspar ores with calcium chlorid. J. Chem. Eng. Chin. Univ. 2003, 17, 185–189. [Google Scholar]
- Ciceri, D.; Close, T.C.; Barker, A.V.; Allanore, A. Fertilizing properties of potassium feldspar altered hydrothermally. Commun. Soil Sci. Plant Anal. 2019, 50, 482–491. [Google Scholar] [CrossRef]
- Li, L.; Lei, S.M.; Hu, M.; Luo, H.H.; Huang, T. Effect of negative pressure on the dissolution behavior and mechanism from potassium feldspar. Main Group Chem. 2017, 16, 275–289. [Google Scholar]
- Peng, Q.J.; Yi, L.B.; Peng, Q.Z.; Peng, Y.Y. Draft genome sequence of the potassium feldspar-solubilizing bacterium ensifer adhaerens L18. Genome Announc. 2017, 5, e00199-17. [Google Scholar] [CrossRef] [PubMed]
- Basha, A.A.A.B.; Hassan, M.S. Evaluation of rock phosphate and potassium feldspar with biological and organic amendments and its effect on soil phosphorus and potassium availability and uptake. Int. J. Plant Soil Sci. 2017, 14, 1–14. [Google Scholar] [CrossRef] [PubMed]
- Liu, Y.; Pang, S.H. Experimental study of preparing silicon-calcium-potassium fertilizer with sodium sulfate as promoter. Chem. Fertil. Ind. 2017, 44, 60–62+66. [Google Scholar]
- Liu, C.J.; Ma, H.W.; Gao, Y. Hydrothermal processing on potassic syenite powder: Zeolite synthesis and potassium release kinetics. Adv. Powder Technol. 2019, 30, 2483–2491. [Google Scholar] [CrossRef]
- Sun, H.Q.; Song, J.; Sun, S. Decomposition kinetics of zircon sand in naoh sub-molten salt solution. Trans. Nonferrous Met. Soc. China 2019, 29, 1948–1955. [Google Scholar] [CrossRef]
- Lv, L.F.; Gai, G.S.; Liu, C.S.; Yang, Y.F.; He, Z.Q.; Li, W.C.; Zhang, X.M. Mechanical grinding improved quality of potassium-feldspar rocks. Adv. Mater. Res. 2013, 826, 79–84. [Google Scholar] [CrossRef]
- Lodi, L.A.; Klaic, R.; Ribeiro, C.; Farinas, C.S. A Green K-fertilizer Using Mechanical Activation to Improve the Solubilization of a Low-reactivity Potassium Mineral by Aspergillus Niger. Bioresour. Technol. Rep. 2021, 15, 100711. [Google Scholar] [CrossRef]
- Himanshu, T.; Nikhil, D. Recovery of potash values from feldspar. Sep. Sci. Technol. 2020, 55, 1398–1406. [Google Scholar]
- Lv, L.F.; Gai, G.S.; Liu, C.S. Effects of microcrystalline grinding on physical characteristics and element release in k-feldspar rocks. Adv. Mater. Res. 2013, 826, 175–182. [Google Scholar] [CrossRef]
- Zhang, X.M.; Gai, G.S.; He, Z.Q.; Gai, D.H.; Li, R.T.; Meng, F.R.; Li, X.Y. Effect of mechanical activation on potassium of potash feldspar adding calcium hydroxide. China Powder Sci. Technol. 2021, 27, 105–110. [Google Scholar]
- Zhai, Y.Y.; Hellmann, R.; Campos, A.; Findling, N.; Mayanna, S.; Wirth, R.; Schreiber, A.; Cabié, M.; Zeng, Q.D.; Liu, S.K.; et al. Fertilizer Derived from Alkaline Hydrothermal Alteration of K-feldspar: A Micrometer to Nanometer-scale Investigation of K in Secondary Reaction Products and the Feldspar Interface. Appl. Geochem. 2021, 126, 104828. [Google Scholar] [CrossRef]
- Tülay, T.; Murat Olga, K. Extraction of KCl from Potassium Feldspar by Various Inorganic Salts. Minerals 2023, 13, 1342. [Google Scholar]
- Bao, S.D. Soil Agro-Chemistrical Analysis, 3rd ed.; China Agriculture Press: Beijing, China, 2007; Volume 268–270, pp. 389–391. [Google Scholar]
- Lu, W.D. Statistical Analysis of SPSS for Windows; Electronic Industry Publishing Co.: Beijing, China, 2004; pp. 50–55. [Google Scholar]
- Gai, G.S. Powder Engineering; Tsinghua University Press: Beijing, China, 2009. [Google Scholar]
- Liu, Y.H.; Liu, P.G. Mechanism and Application of X-ray Diffraction Analysis, 2nd ed.; Chemical Industry Press: Beijing, China, 2003. [Google Scholar]
- Abart, R.; Petrishcheva, E.; Habler, G.; Sutter, C.; Fischer, F.D.; Predan, J.; Kegl, M.; Rammerstorfer, F.G. Evolution of chemically induced cracks in alkali feldspar: Thermodynamic analysis. Phys. Chem. Miner. 2022, 49, 14. [Google Scholar] [CrossRef]
- Ewelina, G.B.; Rafał, P.; Małgorzata, F.; Franusm, W. Mechanochemically Assisted Coal Fly Ash Conversion into Zeolite. Materials 2022, 15, 7174. [Google Scholar]
- Zhang, X.M.; He, Z.Q.; Su, Z.X.; Meng, F.R.; Lu, C.A.; Gai, G.S.; Huang, Z.H. Effect of mechanical activation on surface characteristic of potassium feldspar particle. China Powder Sci. Technol. 2023, 29, 145–154. [Google Scholar]
- Baki, V.A.; Ke, X.; Heath, A.; Calabria-Holley, J.; Terzi, C.; Sirin, M. The impact of mechanochemical activation on the physicochemical properties and pozzolanic reactivity of kaolinite, muscovite and montmorillonite. Cem. Concr. Res. 2022, 162, 106962. [Google Scholar] [CrossRef]
- Demnitz, M.; Schymura, S.; Neumann, J.; Schmidt, M.; Schäfer, T.; Stumpf, T.; Müller, K. Mechanistic understanding of Curium (III) sorption on natural K-feldspar surfaces. Sci. Total Environ. 2022, 843, 156920. [Google Scholar] [CrossRef]
- Wang, Y.J.; Yu, G.Y.; Deng, M.; Tang, M.S. Alkali release from feldspathic mineral and the effect in alkali-silica reaction. J. Mater. Sci. Eng. 2006, 24, 403–409. [Google Scholar] [CrossRef]
- Lodi, L.A.; Klaic, R.; Bortoletto-Santos, R.; Ribeiro, C.; Farinas, C.S. Unveiling the Solubilization of Potassium Mineral Rocks in Organic Acids for Application as K-Fertilizer. Appl. Biochem. Biotechnol. 2022, 194, 2431–2447. [Google Scholar] [CrossRef]
- Benjamin, C.; Damien, D.; Martiane, C.; Damine, L.; Stéphane, G. A Comparative Study of the Dissolution Mechanisms of Amorphous and Crystalline Feldspars at Acidic PH Conditions. Npj Mater. Degrad. 2022, 6, 34–47. [Google Scholar]
- Kumar, A.; Bertram, A.K.; Patey, G.N. Molecular Simulations of Feldspar Surfaces Interacting with Aqueous Inorganic Solutions: Interfacial Water/Ion Structure and Implications for Ice Nucleation. ACS Earth Space Chem. 2021, 5, 2169–2183. [Google Scholar] [CrossRef]


| Element | Content (%) | Element | Content (%) | Element | Content (%) | Element | Content (%) |
|---|---|---|---|---|---|---|---|
| SiO2 | 67.03 | CaO | 1.44 | Rb2O | 0.0293 | S | 0.0139 |
| Al2O3 | 18 | BaO | 0.633 | Cr2O3 | 0.0273 | Nd2O3 | 0.0040 |
| K2O | 8.69 | MgO | 0.106 | Ag2O | 0.0113 | PbO | 0.0039 |
| Na2O | 3.36 | P2O5 | 0.0708 | MnO | 0.0054 | Ga2O3 | 0.003 |
| Fe2O3 | 0.359 | TiO2 | 0.0323 | NiO | 0.0024 | ||
| SrO | 0.155 | Cl | 0.018 | ZnO | 0.0011 |
| NaOH Addition | Fitting Equation | R2 | Fitting Equation Type |
|---|---|---|---|
| 0% mass | y = 59.64 + 1.83x | 0.9431 | linear equation |
| 5% mass | y = 418.98(x − 0.01)0.23 | 0.9751 | power function equation |
| 10% mass | y = 808.25x0.23 | 0.9613 | power function equation |
| NaOH Addition | Fitting Equation | R2 | Fitting Equation Type |
|---|---|---|---|
| 0% mass | y = 391.07 + 12.06x | 0.9963 | linear equation |
| 5% mass | y = 435.48(x + 1.15)0.38 | 0.9837 | power function equation |
| 10% mass | y = 1112.69(x − 0.03)0.27 | 0.9810 | power function equation |
| Time/min | The Diffraction Peak | ||
|---|---|---|---|
| Mineral | KAlSi3O8 | SiO2 | NaAlSi3O8 |
| 2θ | 26.64° | 27.54° | 28.00° |
| Crystal plane | 220 | 011 | 002 |
| 0 | 14,546 | 51,322 | 23,928 |
| 15 | 11,950 | 15,713 | 10,404 |
| 90 | 9624 | 9858 | 6803 |
| 180 | 9211 | 8382 | 5794 |
| 300 | 7944 | 6273 | 4708 |
| Time/min | Diffraction Peak Intensity | ||
|---|---|---|---|
| mineral | KAlSi3O8 | SiO2 | NaAlSi3O8 |
| 2θ | 26.64° | 27.54° | 28.00° |
| Crystal plane | 220 | 011 | 002 |
| 0 | 14,546 | 51,322 | 23,928 |
| 15 | 11,864 | 15,479 | 9447 |
| 90 | 8975 | 9213 | 6105 |
| 180 | 9351 | 5712 | 4892 |
| 300 | 8233 | 5259 | 3998 |
| Time/min | The Diffraction Peak Intensity | |||
|---|---|---|---|---|
| Mineral | KAlSi3O8 | KAlSi3O8 | KAlSi3O8 | KAlSi3O8 |
| Additives | +NaOH | +NaCl | +Na2CO3 | |
| 2θ | 26.64° | 26.64° | 26.64° | 26.64° |
| crystal plane | 220 | 220 | 220 | 220 |
| 0 | 14,546 | 14,546 | 14,546 | 14,546 |
| 15 | 11,950 | 11,864 | 11,083 | 9207 |
| 90 | 9624 | 8975 | 9643 | 10,776 |
| 180 | 9211 | 9351 | 9943 | 8959 |
| 300 | 7944 | 8233 | 8329 | 7647 |
Disclaimer/Publisher’s Note: The statements, opinions and data contained in all publications are solely those of the individual author(s) and contributor(s) and not of MDPI and/or the editor(s). MDPI and/or the editor(s) disclaim responsibility for any injury to people or property resulting from any ideas, methods, instructions or products referred to in the content. |
© 2023 by the authors. Licensee MDPI, Basel, Switzerland. This article is an open access article distributed under the terms and conditions of the Creative Commons Attribution (CC BY) license (https://creativecommons.org/licenses/by/4.0/).
Share and Cite
Zhang, X.; He, Z.; Jia, W.; Meng, F.; Zhang, W.; Lu, C.; Hao, X.; Gai, G.; Huang, Z.; Xu, M.; et al. Mechanism of Potassium Release from Feldspar by Mechanical Activation in Presence of Additives at Ordinary Temperatures. Materials 2024, 17, 144. https://doi.org/10.3390/ma17010144
Zhang X, He Z, Jia W, Meng F, Zhang W, Lu C, Hao X, Gai G, Huang Z, Xu M, et al. Mechanism of Potassium Release from Feldspar by Mechanical Activation in Presence of Additives at Ordinary Temperatures. Materials. 2024; 17(1):144. https://doi.org/10.3390/ma17010144
Chicago/Turabian StyleZhang, Xianmei, Zhenquan He, Wei Jia, Fanrong Meng, Wenju Zhang, Changai Lu, Xiangyang Hao, Guosheng Gai, Zhaohui Huang, Minggang Xu, and et al. 2024. "Mechanism of Potassium Release from Feldspar by Mechanical Activation in Presence of Additives at Ordinary Temperatures" Materials 17, no. 1: 144. https://doi.org/10.3390/ma17010144
APA StyleZhang, X., He, Z., Jia, W., Meng, F., Zhang, W., Lu, C., Hao, X., Gai, G., Huang, Z., Xu, M., Wang, K., & Yun, S. (2024). Mechanism of Potassium Release from Feldspar by Mechanical Activation in Presence of Additives at Ordinary Temperatures. Materials, 17(1), 144. https://doi.org/10.3390/ma17010144