
Predicting Stress Intensity Factor for Aluminum 6062 T6 Material in L-Shaped Lower Control Arm (LCA) Design Using Extended Finite Element Analysis

 ,
,  ,
,  ,
,
Abstract
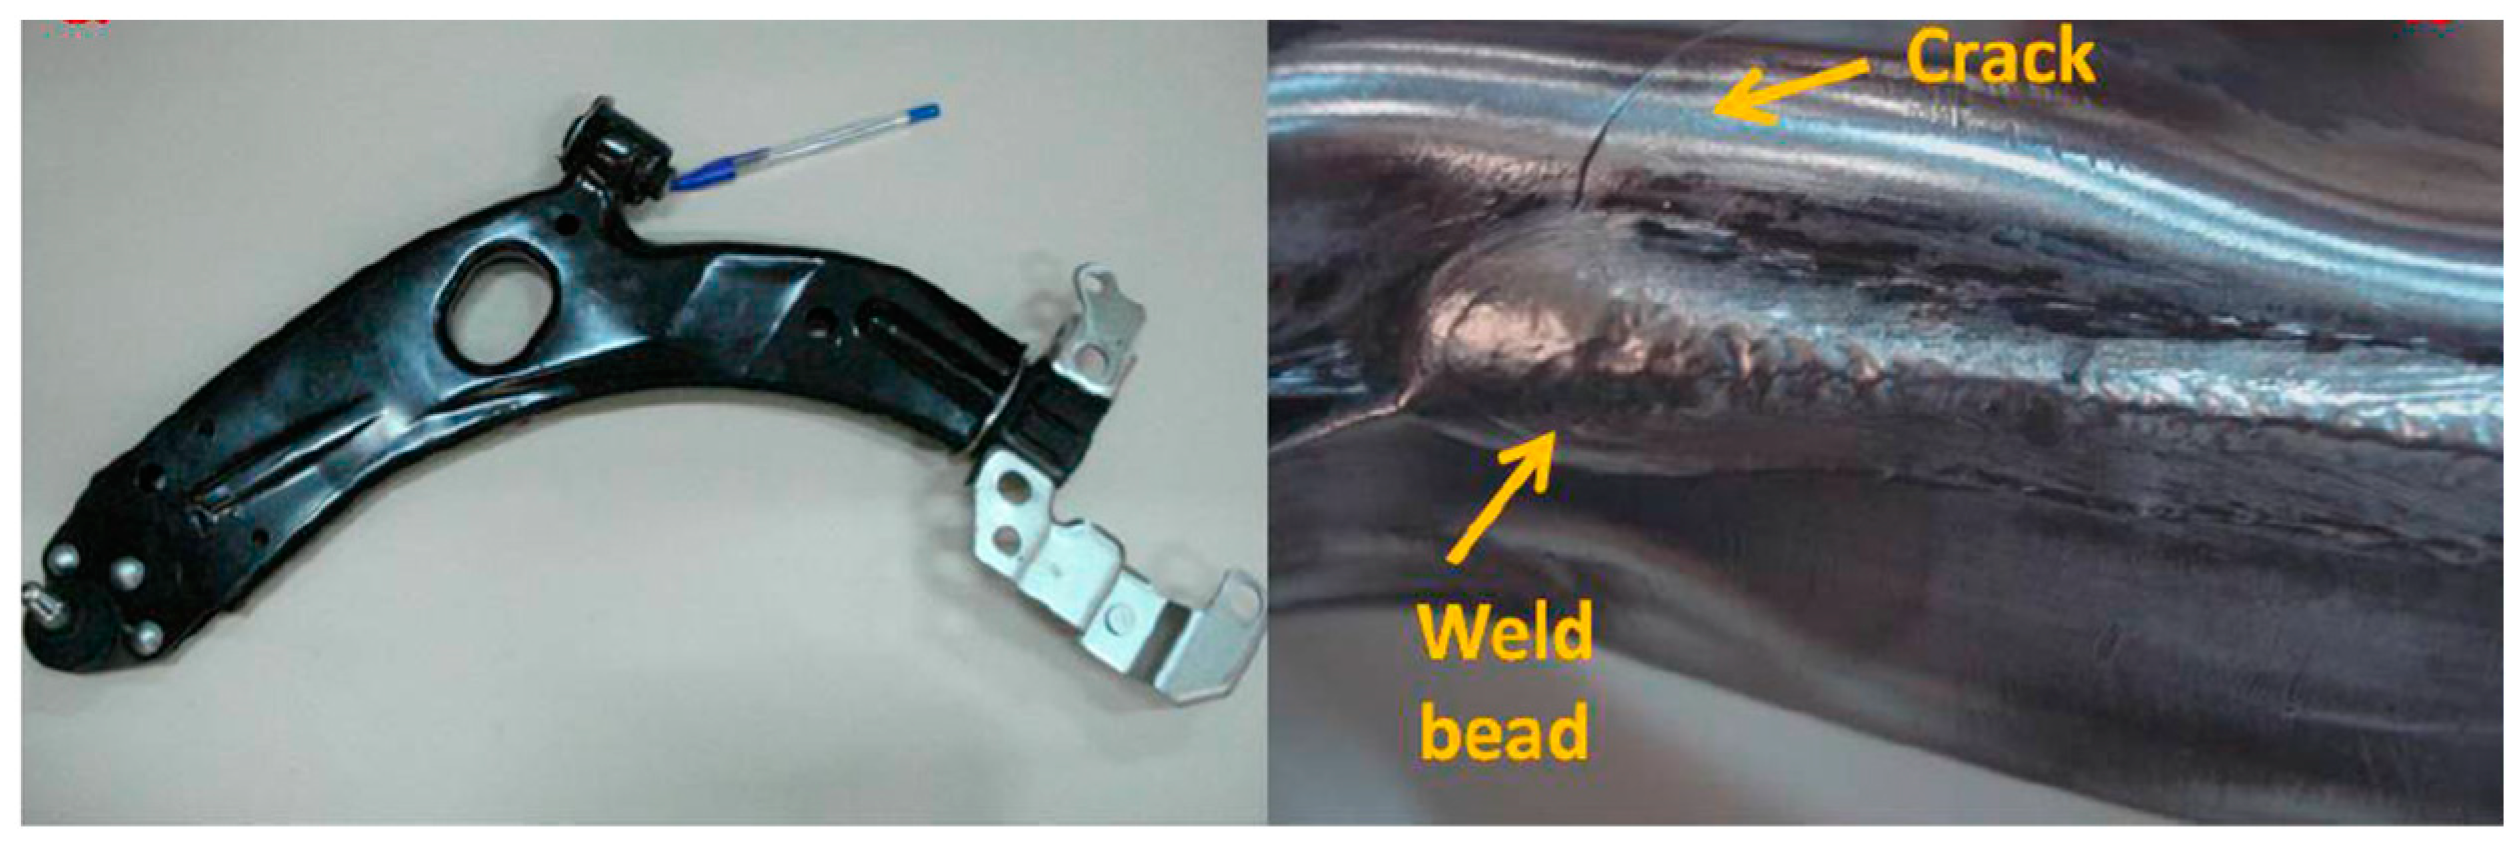
:1. Introduction
2. Theoretical Background
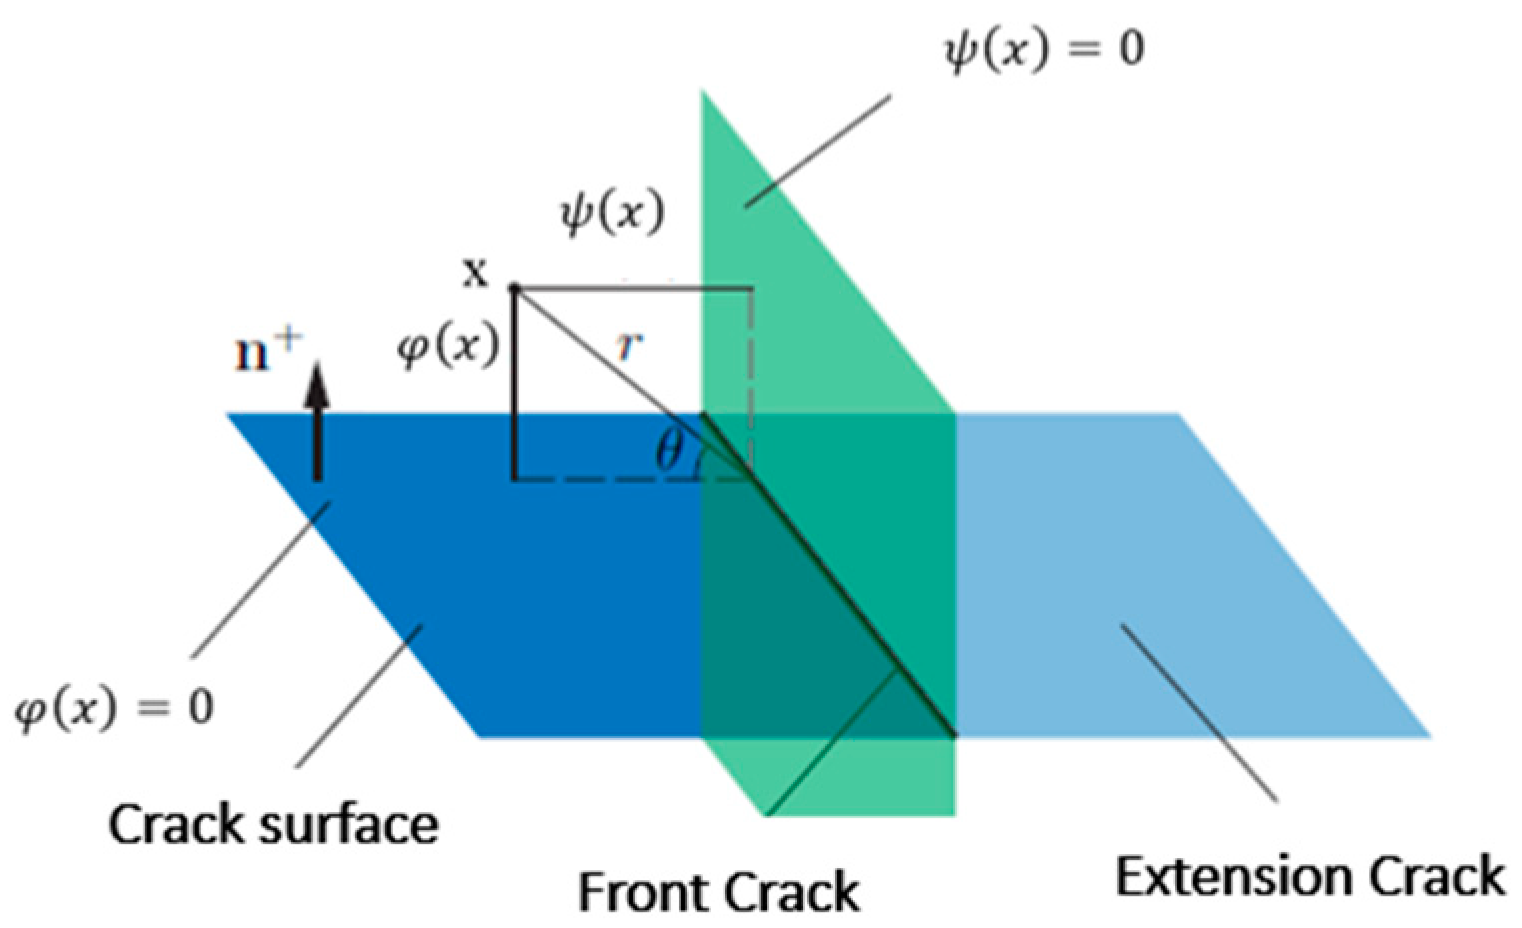
2.1. Overview of Extended Finite Element Method
- : coordinates of the global reference;
- : the classical finite element interpolation function;
- : the Heaviside function enrichment represented the crack edge;
- : the additional degrees of freedom related to the Heaviside function;
- : the enrichment function which models the stress singularity in the vicinity of the crack tip;
- : the additional degrees of freedom associated with singular functions.
- is the polar coordinate system and its origin at the crack tip.
2.2. Stress Intensity Factor KI
- the size of the crack;
- : the constraint applied, depending on the type of loading and the test specimen used;
- Y: geometric factor, depending on the geometry and size of the crack (a).
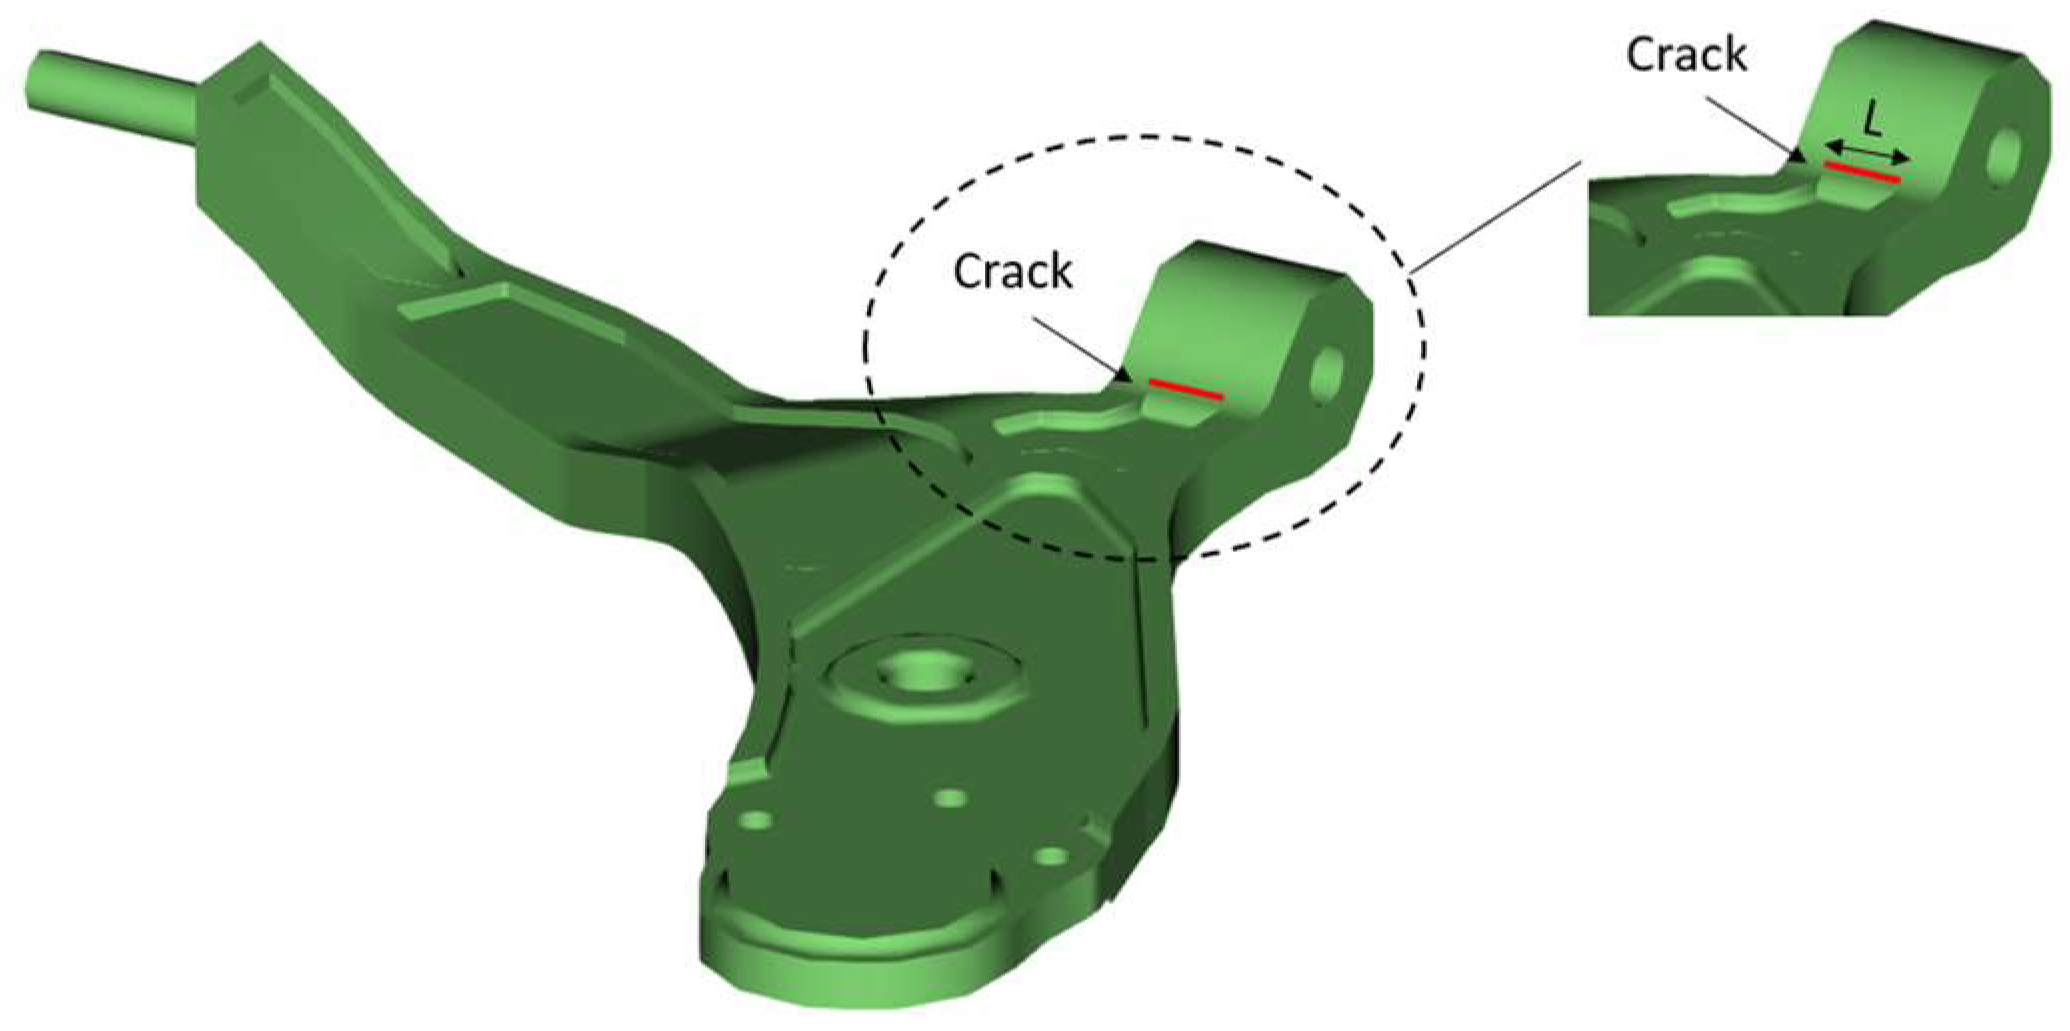
3. Computational Modelling
3.1. Design
3.2. Material
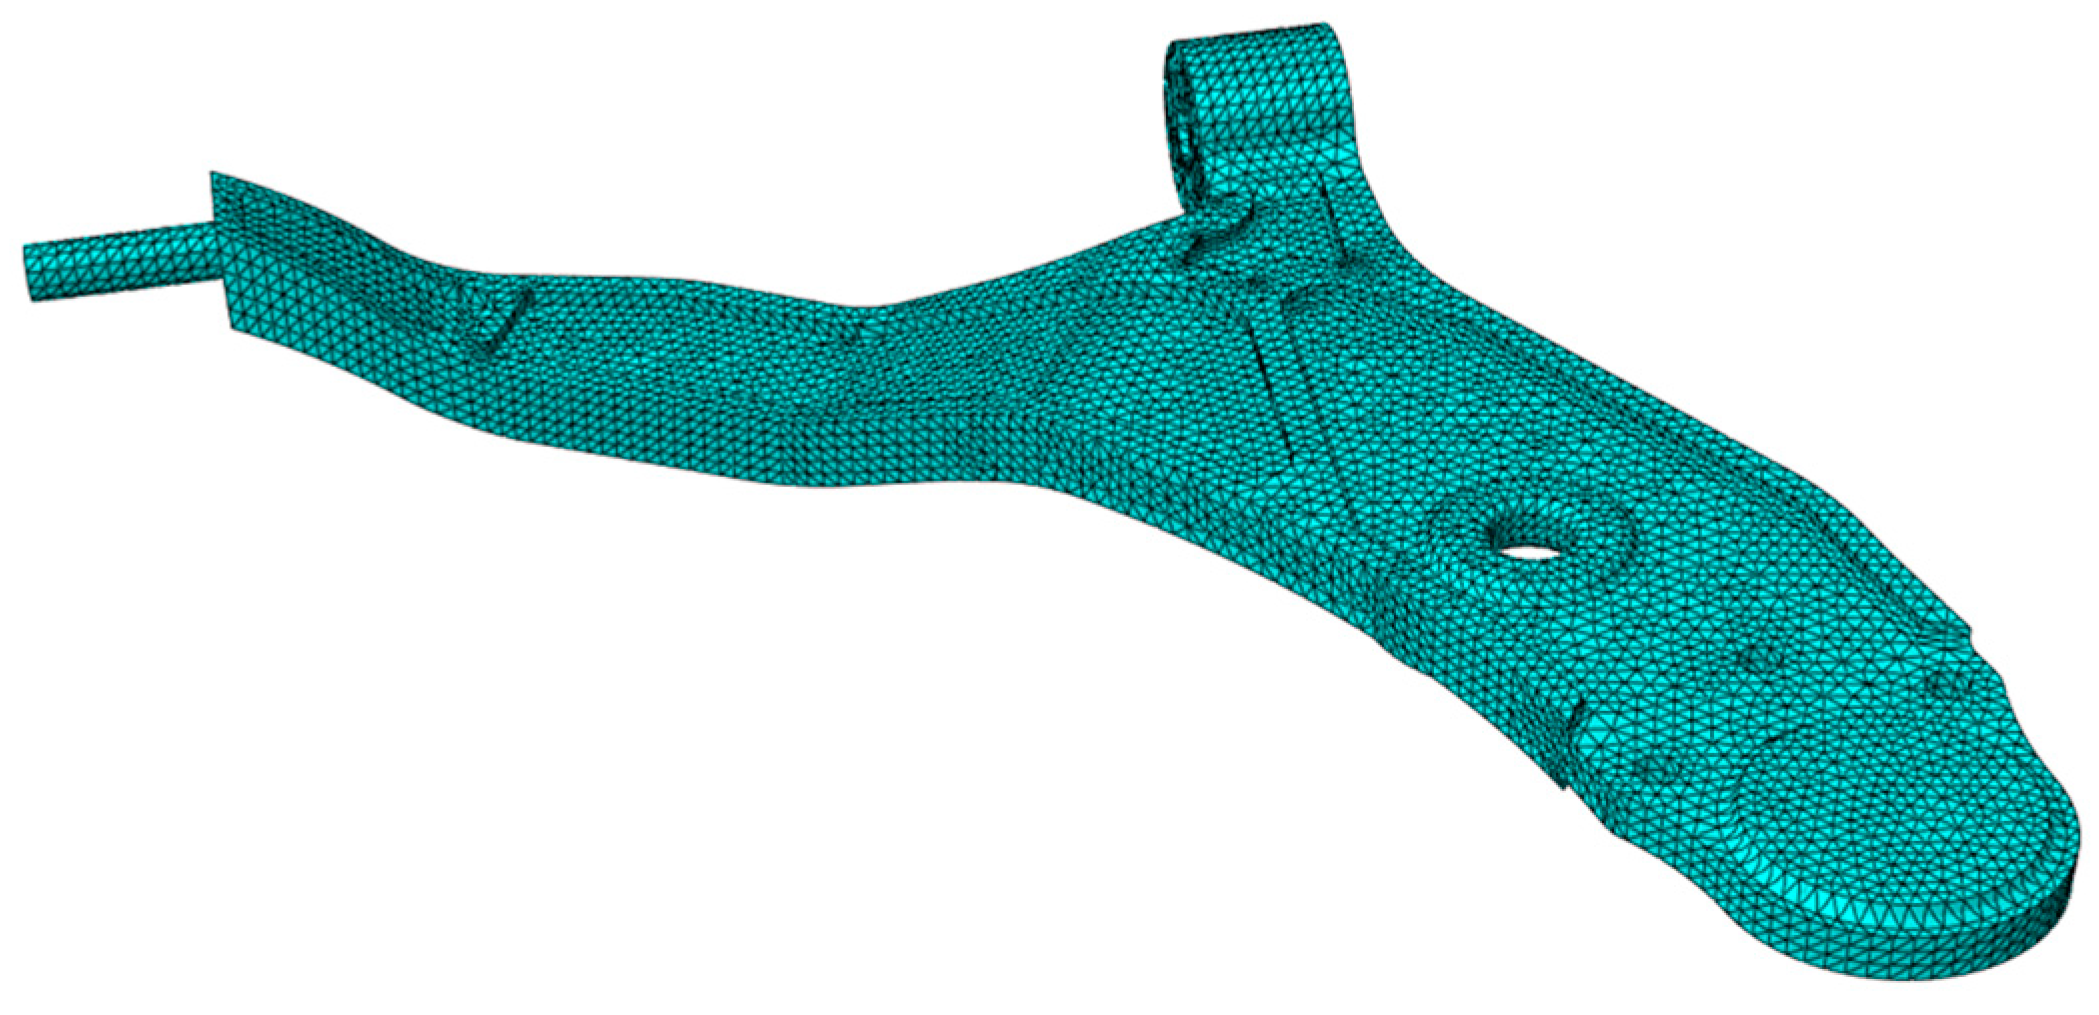
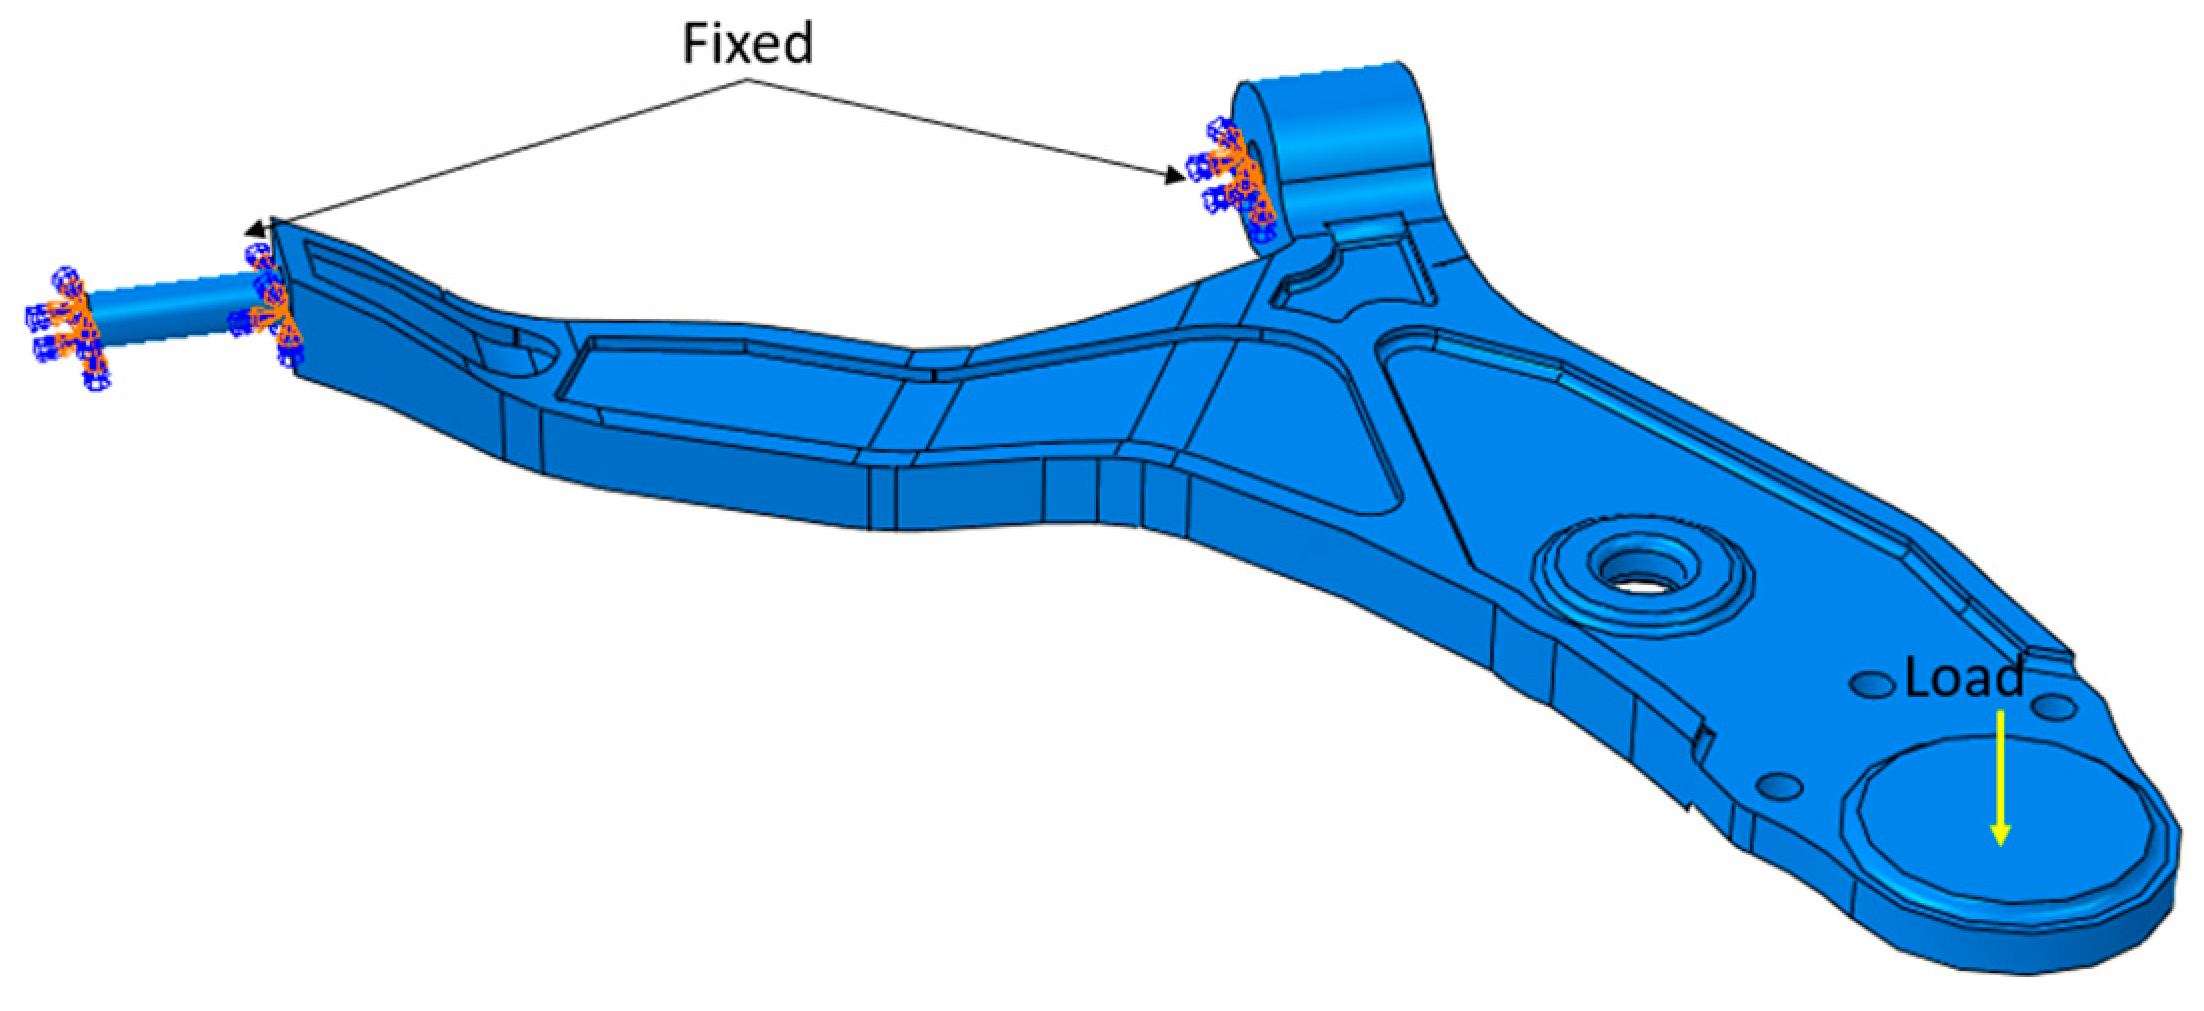
3.3. Meshing, Loadings, and Boundary Condition
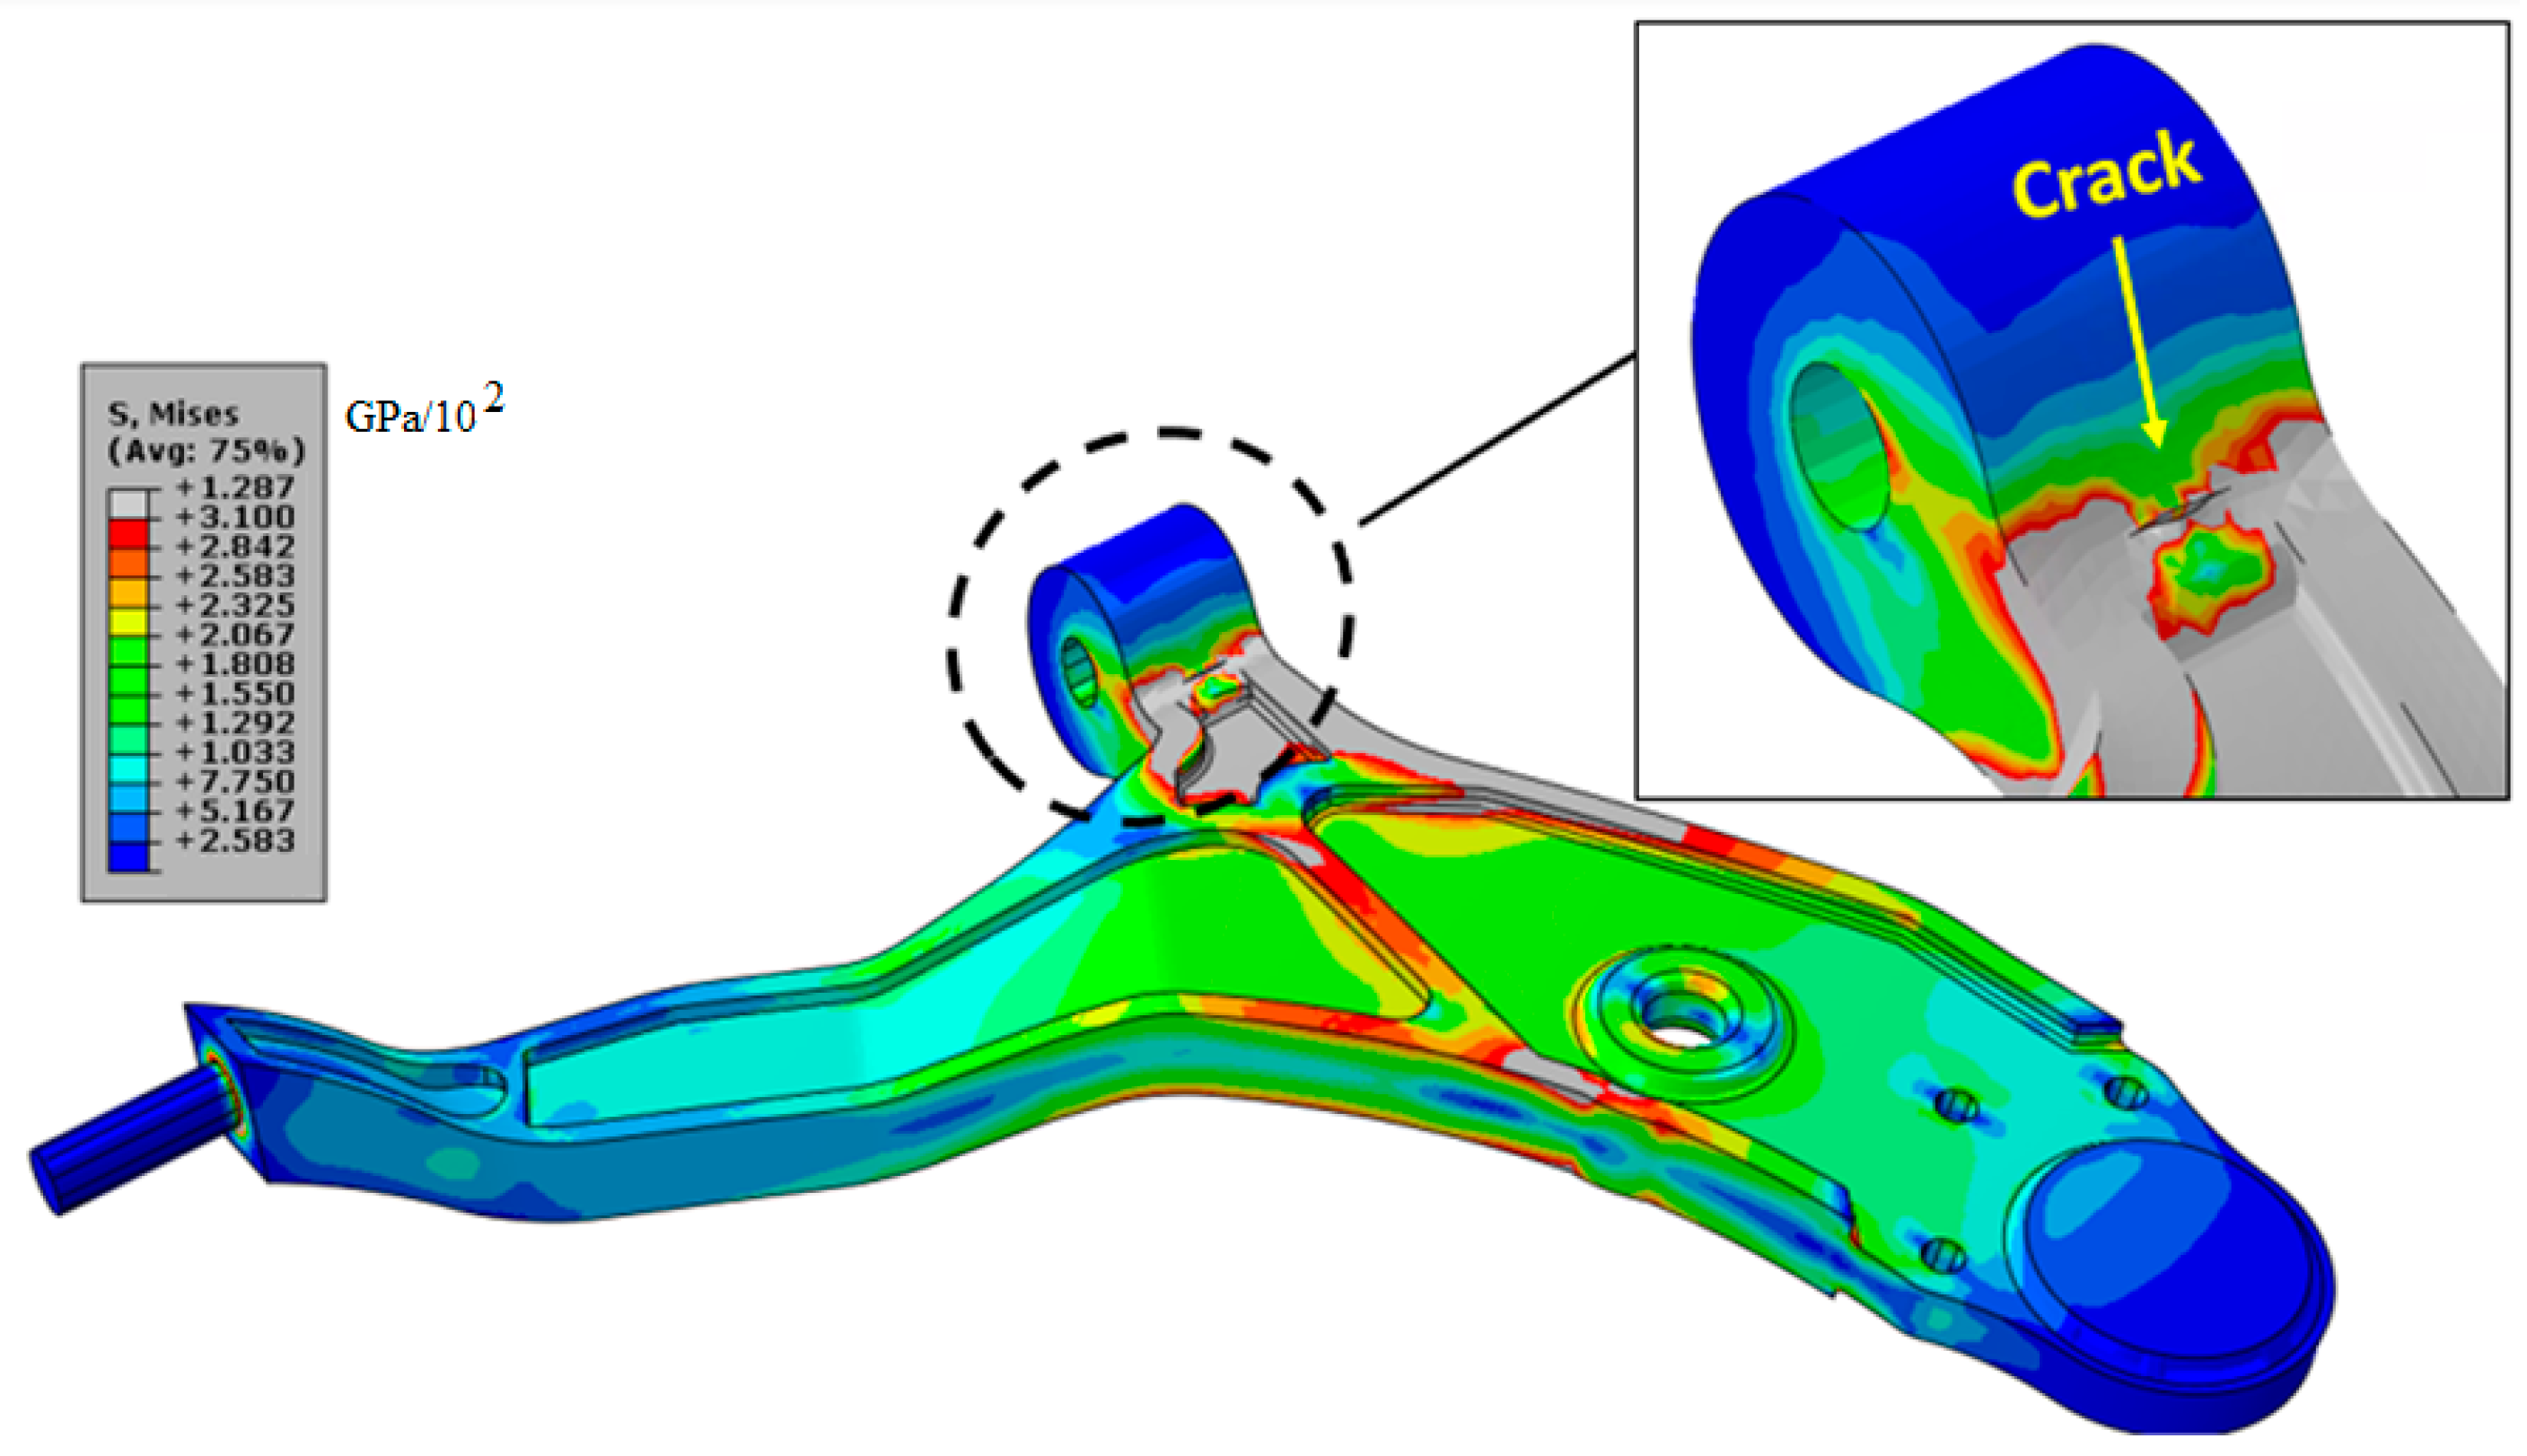
3.4. The Extended Finite Element Analysis
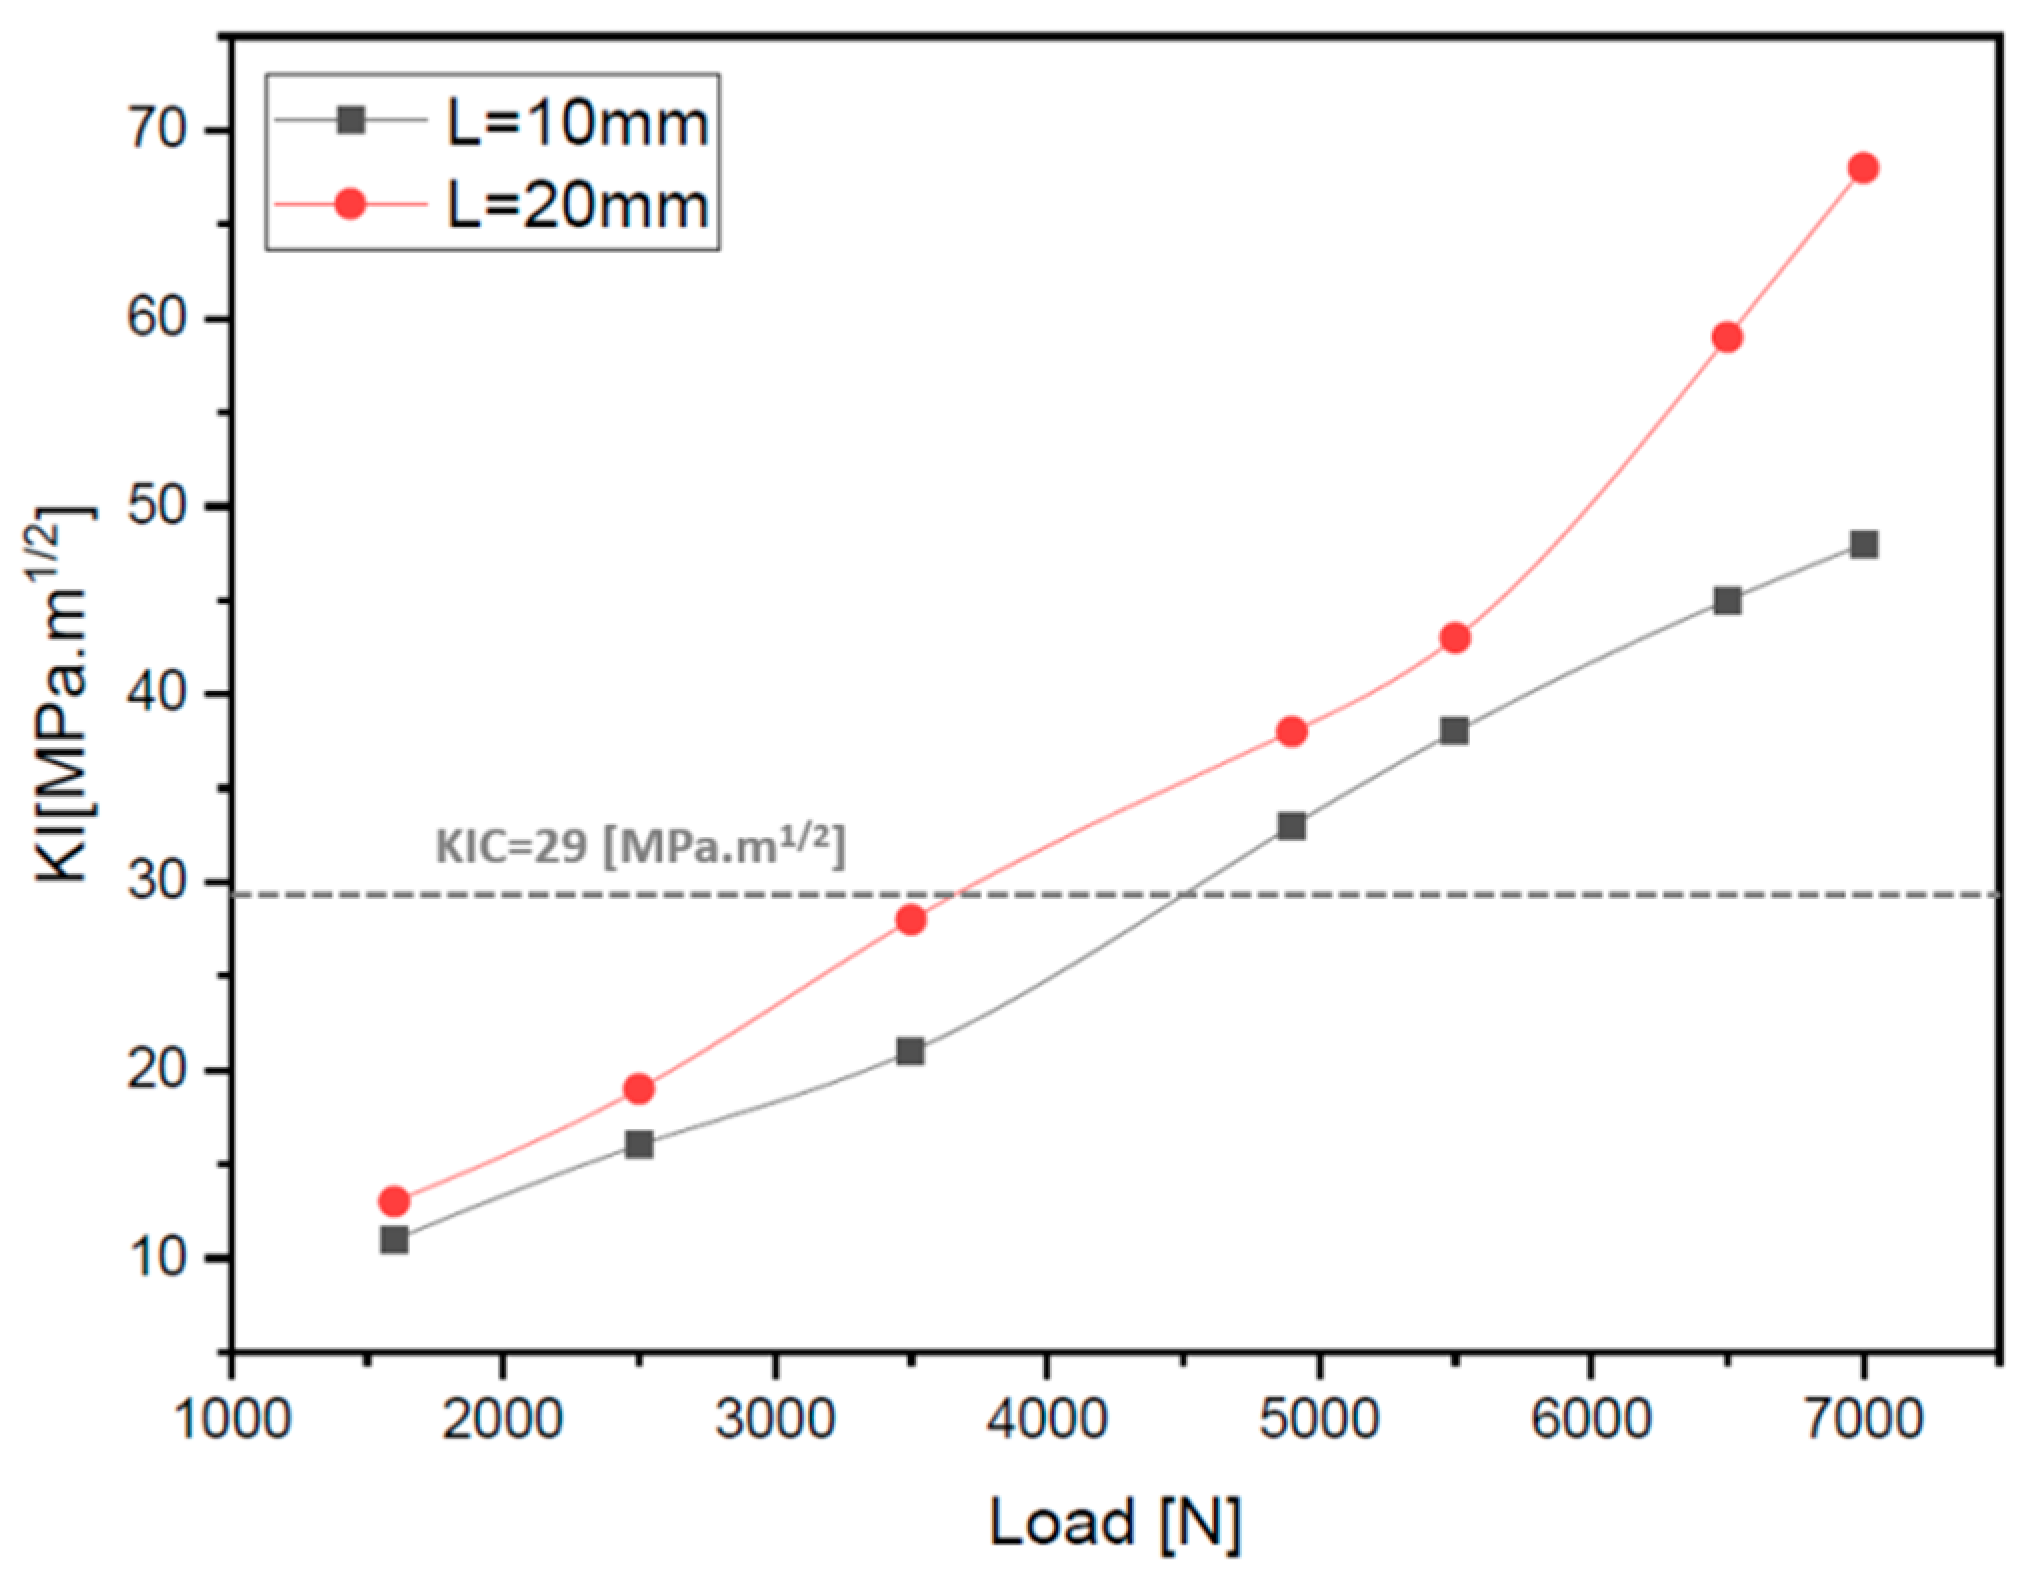
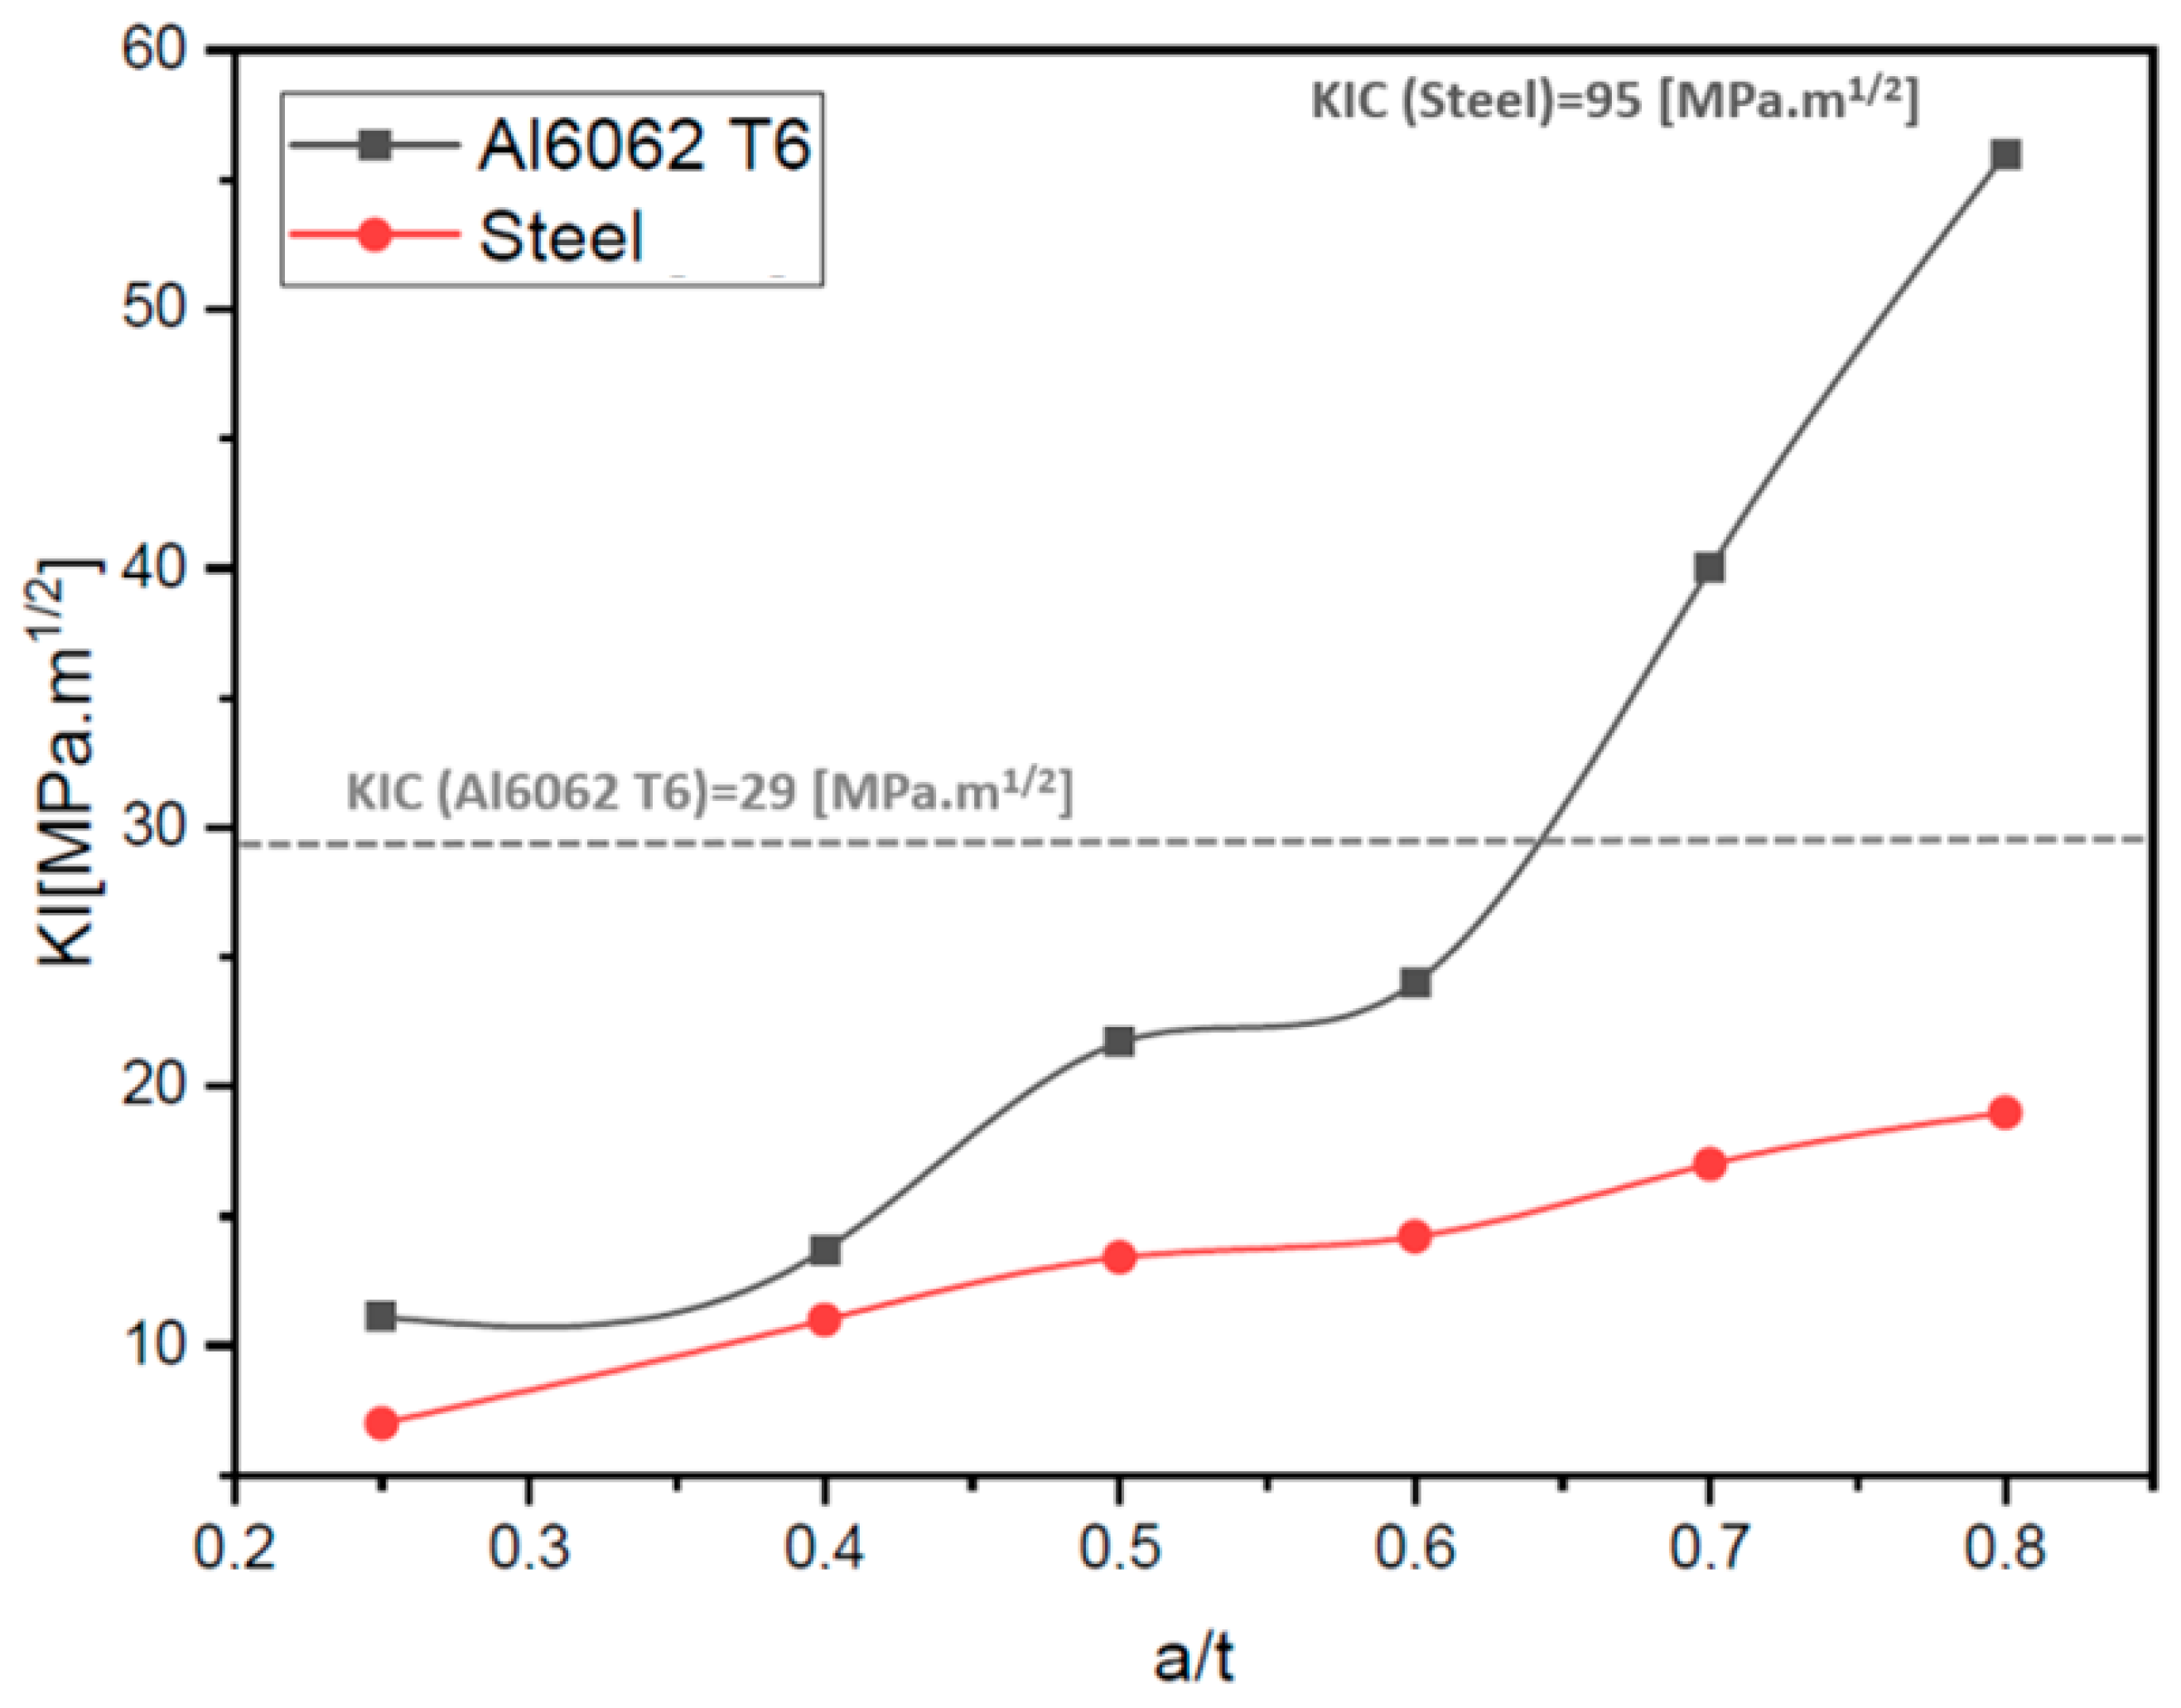
4. Results and Discussion
5. Conclusions
Author Contributions
Funding
Institutional Review Board Statement
Informed Consent Statement
Data Availability Statement
Conflicts of Interest
References
- Gunasekarn, K.; Dundulis, G. Numerical Estimation of the Influence of Pre-Induced Micro-Cracks in the Stress Concentration Zone on the SIFs of a Lower Suspension Arm. Mechanika 2023, 29, 97–103. [Google Scholar] [CrossRef]
- Koubaiti, O.; Elkhalfi, A.; El-Mekkaoui, J.; Mastorakis, N. Solving the problem of constraints due to Dirichlet boundary conditions in the context of the mini element method. Int. J. Mech. 2020, 14, 12–22. [Google Scholar]
- Yakoubi, K.; Montassir, S.; Moustabchir, H.; Elkhalfi, A.; Pruncu, C.I.; Arbaoui, J.; Farooq, M. An extended finite element method (XFEM) study on the elastic t-stress evaluations for a notch in a pipe steel exposed to internal pressure. Mathematics 2021, 9, 507. [Google Scholar] [CrossRef]
- Montassir, S.; Moustabchir, H.; Elkhalfi, A.; Scutaru, M.L.; Vlase, S. Fracture modelling of a cracked pressurized cylindrical structure by using extended iso-geometric analysis (X-IGA). Mathematics 2021, 9, 2990. [Google Scholar] [CrossRef]
- Attia, M.; Ragab, K.; Bouazara, M.; Chen, X.G. Influence of Thermal Treatment and Design Parameters on the Fatigue Life of Automotive Control Arm Fabricated from A357 Semi-Solid Alloy. In Light Metals 2020; Tomsett, A., Ed.; The Minerals, Metals & Materials Serie; Springer: Berlin/Heidelberg, Germany, 2020. [Google Scholar] [CrossRef]
- Zhang, L.; Dong, Y.; Meng, D.; Li, W. A Hybrid Model for Predicting Steering Brake Squeal Based on Multibody Dynamics and Finite Element Methods. Shock. Vib. 2022, 2022, 1906498. [Google Scholar] [CrossRef]
- Messana, A.; Ferraris, A.; Airale, A.G.; Fasana, A.; Carello, M. Enhancing Vibration Reduction on Lightweight Lower Control Arm. Shock. Vib. 2020, 2020, 8891831. [Google Scholar] [CrossRef]
- Abu Bakar, S.K.; Daud, R.; Mas Ayu, H.; Salwani, M.S.; Shah, A. Prediction of Fatigue Failure Location on Lower Control Arm Using Finite Element Analysis (Stress Life Method). In Advances in Material Sciences and Engineering, Lecture Notes in Mechanical Engineering; Springer: Berlin/Heidelberg, Germany, 2020. [Google Scholar] [CrossRef]
- Godefroida, L.B.; Fariaa, G.L.; Cândidoa, L.C.; Araujoa, S.C. Fatigue failure of a welded automotive component. Procedia Mater. Sci. 2014, 3, 1902–1907. [Google Scholar] [CrossRef]
- Sadiq, M.; Pachapuri, A.; Lingannavar, R.G.; Nagaraj, K.; Kritesh, K.; Phadate, K. Design and analysis of lower control arm of suspension system. In Proceedings of the 3rd International Conference on Advances in Mechanical Engineering and Nanotechnology, Pink City Jaipur, India, 18–19 March 2021; Elsevier Ltd.: Amsterdam, The Netherlands, 2021; pp. 2214–7853. [Google Scholar] [CrossRef]
- Yokoyama, Y.; Sugiyama, H.; Okazawa, S. Isogeometric Analysis For Vehicle Model In Dynamic Explicit Method. In Proceedings of the 14th World Congress on Computational Mechanics (WCCM) ECCOMAS Congress 2020, Virtual Congress, 11–15 January 2021. [Google Scholar]
- Jiang, R.; Sun, T.; Liu, D.; Pan, Z.; Wang, D. Multi-Objective Reliability-Based Optimiza-tion of Control Arm Using MCS and NSGA-II Coupled with Entropy Weighted GRA. Appl. Sci. 2021, 11, 5825. [Google Scholar] [CrossRef]
- Zhao, H.; Chen, Y.; Liu, X. Lightweight Design of the Vehicle Suspension Control Arm. In Proceedings of the 5th International Conference on Vehicle, Mechanical and Electrical Engineering (ICVMEE 2019), Dalian, China, 28–30 September 2019; pp. 21–25. [Google Scholar] [CrossRef]
- Xie, Q.; Liu, X.; Fan, L.; Peng, S.; Zeng, Y. Evaluation of equivalent crack propagation length and fracture energy of two commonly used rock fracture toughness test configurations based on Bažant’s size effect law. Eng. Fract. Mech. 2023, 281, 109067. [Google Scholar] [CrossRef]
- Kim, D.-H.; Park, M.J.; Chang, Y.-S.; Baek, U. Evaluation of Fracture Properties of Two Metallic Materials under Hydrogen Gas Conditions by Using XFEM. Metals 2022, 12, 1813. [Google Scholar] [CrossRef]
- Saurabh Gairola, S.; Jayaganthanu, R. XFEM Simulation of Tensile and Fracture Behavior of Ultrafine-Grained Al 6061 Alloy. Metals 2021, 11, 1761. [Google Scholar] [CrossRef]
- Yahya, A.F. Fatigue Crack Growth Analysis with Extended Finite Element for 3D Linear Elastic Material. Material. Metals 2021, 11, 397. [Google Scholar] [CrossRef]
- Moës, N.; Belytschko, T. Extended finite element method for cohesive crack growth. Eng. Fract. Mech. 2002, 69, 813–833. [Google Scholar] [CrossRef]
- Nguyen, H.-D.; Huang, S.-C. Using the extended finite element method to integrate the level-set method to simulate the stress concentration factor at the circular holes near the material boundary of a functionally-graded material plate. J. Mater. Res. Technol. 2022, 21, 4658–4673. [Google Scholar] [CrossRef]
- Okodi, A.; Lin, M.; Yoosef-Ghodsi, N.; Kainat, M.; Hassanien, S.; Adeeb, S. Crack propagation and burst pressure of longitudinally cracked pipelines using extended finite element method. Int. J. Press. Vessel. Pip. 2020, 184, 104115. [Google Scholar] [CrossRef]
- Lei, Y. Validation of contour integral functions (J and C(t)) in ABAQUS v6.11-v6.14 for combined mechanical and residual stresses. Procedia Struct. Integr. 2016, 2, 2566–2574. [Google Scholar] [CrossRef]
- Gunjan, P.; Sarda, A. Design and Analysis of Front Lower Control Arm by Using Topology Optimization. Int. J. Adv. Res. Innov. Ideas Educ. 2018, 4, 1982–1986. [Google Scholar]
- Koubaiti, O.; El-Mekkaoui, J.; Elkhalfi, A. Complete study for solving Navier-Lamé equation with new boundary condition using mini element method. Int. J. Mech. 2018, 12, 46–58. [Google Scholar]


| Thickness (t) | Fixation Diameter | Width | Length (L′) |
|---|---|---|---|
| 20 mm | 16 mm | 425 mm | 313 mm |
| Material | Elastic Modulus (GPa) | Poisson’s Ratio | Yield Strength (MPa) | Ultimate Tensile Strength (MPa) | Elongation at Break | Fatigue Resistance (MPa) | Fracture Toughness KIC (MPa·m1/2) |
|---|---|---|---|---|---|---|---|
| 6062 T6 | 68.9 | 0.33 | 276 | 310 | 12% | 96.5 | 29 |
| Von Mises Stress (MPa) | 315 | 391 | 466 | 653 |
|---|---|---|---|---|
| Load (N) | 1600 | 4900 | 5500 | 7000 |
Disclaimer/Publisher’s Note: The statements, opinions and data contained in all publications are solely those of the individual author(s) and contributor(s) and not of MDPI and/or the editor(s). MDPI and/or the editor(s) disclaim responsibility for any injury to people or property resulting from any ideas, methods, instructions or products referred to in the content. |
© 2023 by the authors. Licensee MDPI, Basel, Switzerland. This article is an open access article distributed under the terms and conditions of the Creative Commons Attribution (CC BY) license (https://creativecommons.org/licenses/by/4.0/).
Share and Cite
El Fakkoussi, S.; Vlase, S.; Marin, M.; Koubaiti, O.; Elkhalfi, A.; Moustabchir, H. Predicting Stress Intensity Factor for Aluminum 6062 T6 Material in L-Shaped Lower Control Arm (LCA) Design Using Extended Finite Element Analysis. Materials 2024, 17, 206. https://doi.org/10.3390/ma17010206
El Fakkoussi S, Vlase S, Marin M, Koubaiti O, Elkhalfi A, Moustabchir H. Predicting Stress Intensity Factor for Aluminum 6062 T6 Material in L-Shaped Lower Control Arm (LCA) Design Using Extended Finite Element Analysis. Materials. 2024; 17(1):206. https://doi.org/10.3390/ma17010206
Chicago/Turabian StyleEl Fakkoussi, Said, Sorin Vlase, Marin Marin, Ouadie Koubaiti, Ahmed Elkhalfi, and Hassane Moustabchir. 2024. "Predicting Stress Intensity Factor for Aluminum 6062 T6 Material in L-Shaped Lower Control Arm (LCA) Design Using Extended Finite Element Analysis" Materials 17, no. 1: 206. https://doi.org/10.3390/ma17010206
APA StyleEl Fakkoussi, S., Vlase, S., Marin, M., Koubaiti, O., Elkhalfi, A., & Moustabchir, H. (2024). Predicting Stress Intensity Factor for Aluminum 6062 T6 Material in L-Shaped Lower Control Arm (LCA) Design Using Extended Finite Element Analysis. Materials, 17(1), 206. https://doi.org/10.3390/ma17010206