


Properties, Microstructure Development and Life Cycle Assessment of Alkali-Activated Materials Containing Steel Slag under Different Alkali Equivalents
Abstract
:1. Introduction
2. Materials and Methods
2.1. Materials
2.2. Mix Design
2.3. Specimen Preparation
2.4. Characterization Methods
2.4.1. Workability and Mechanical Properties of AAM
2.4.2. Microstructure Characterizations
2.4.3. Life Cycle Assessment
3. Results and Discussion
3.1. Workability
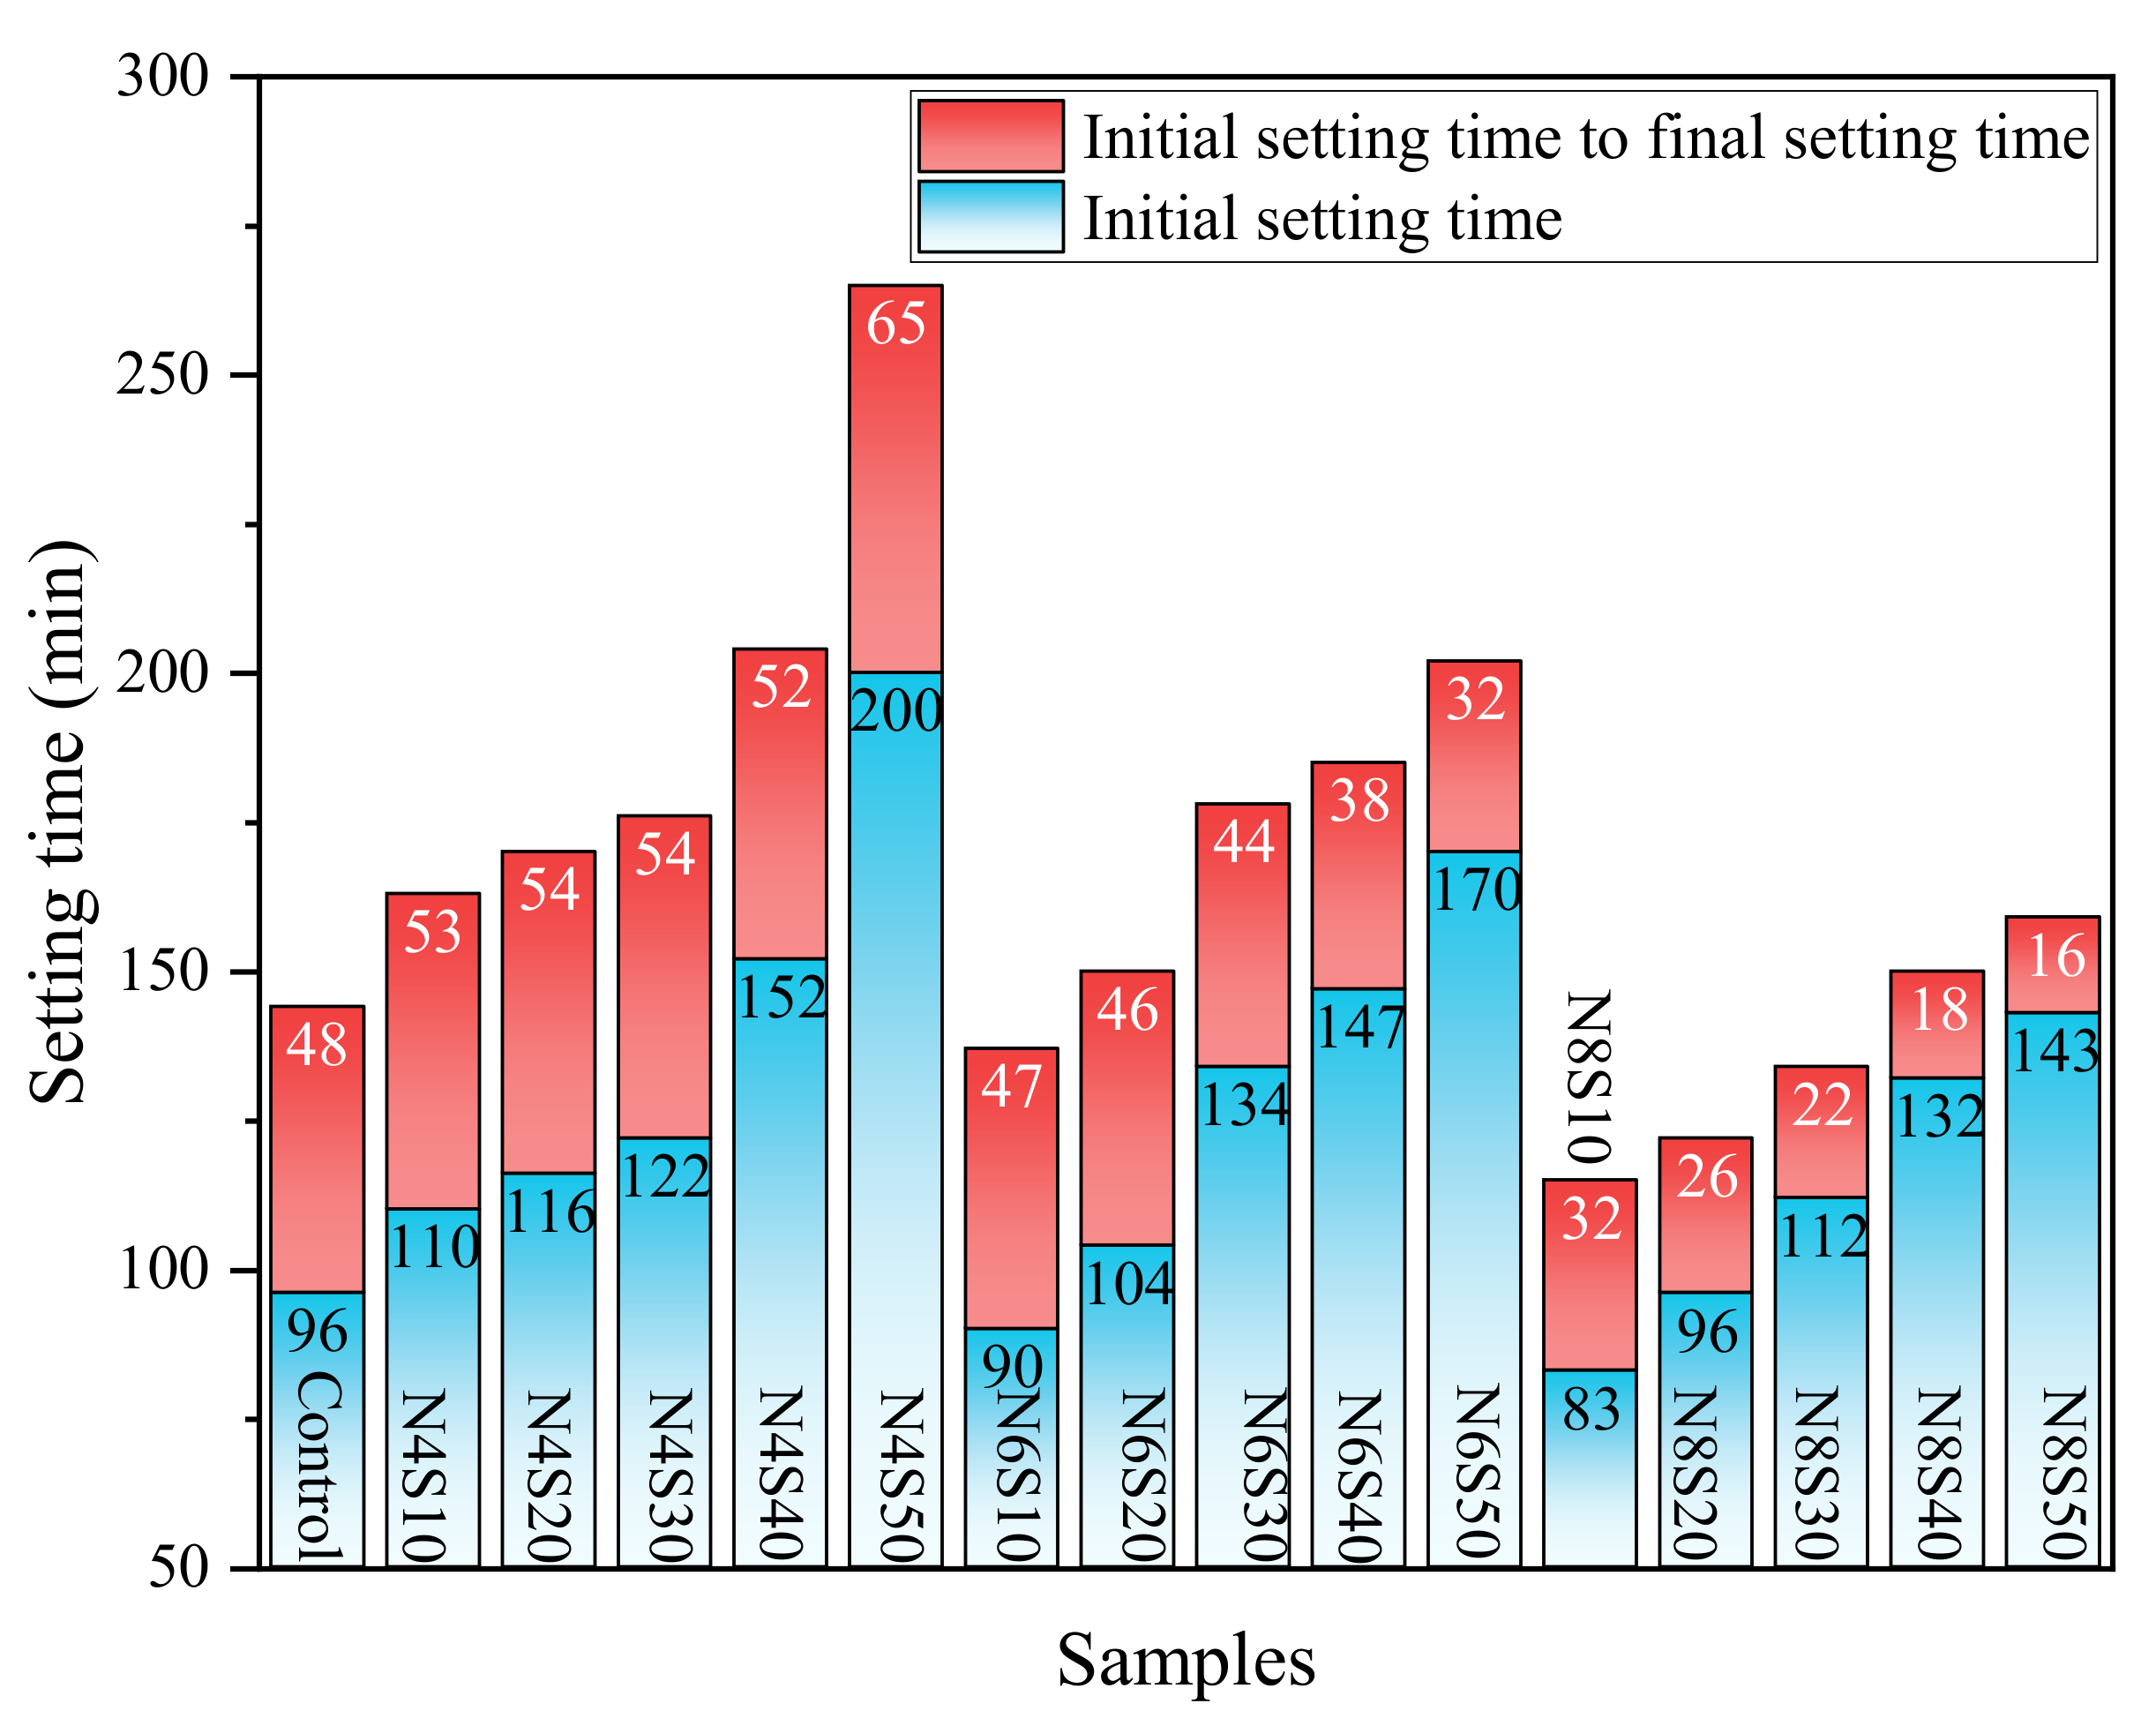
3.1.1. Effects of Ne and SS on Setting Time of AAM
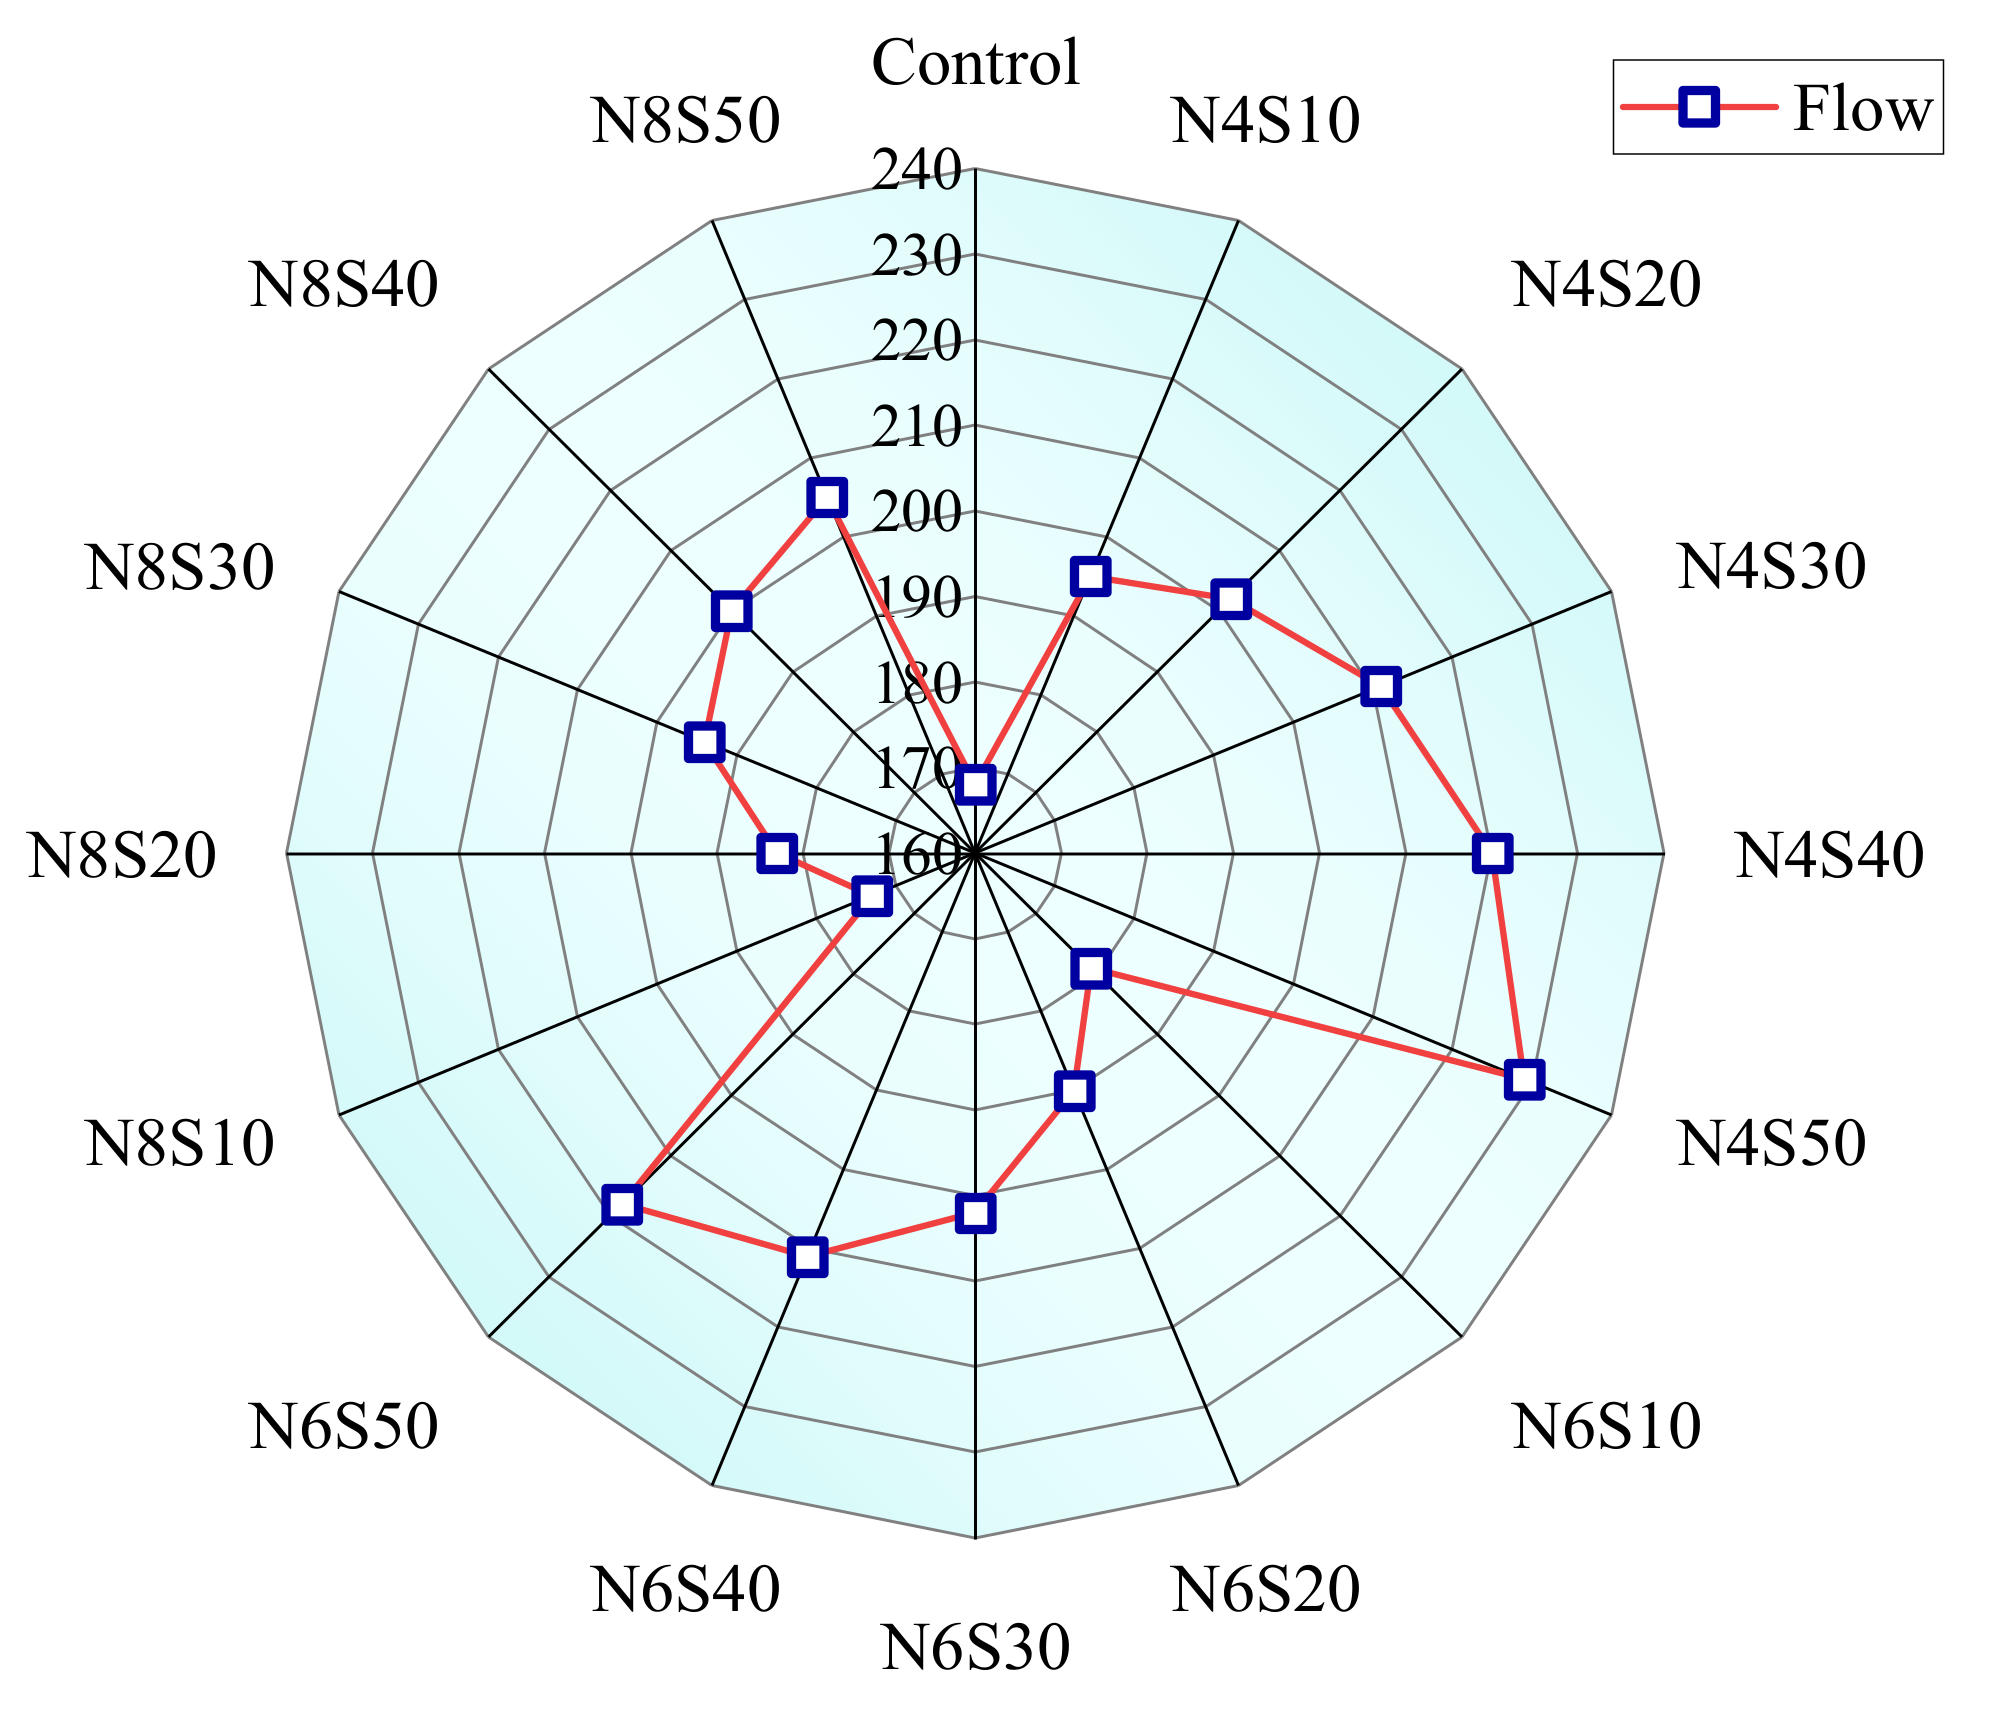
3.1.2. Effects of Ne and SS on Fluidity of AAM
3.2. Mechanical Properties
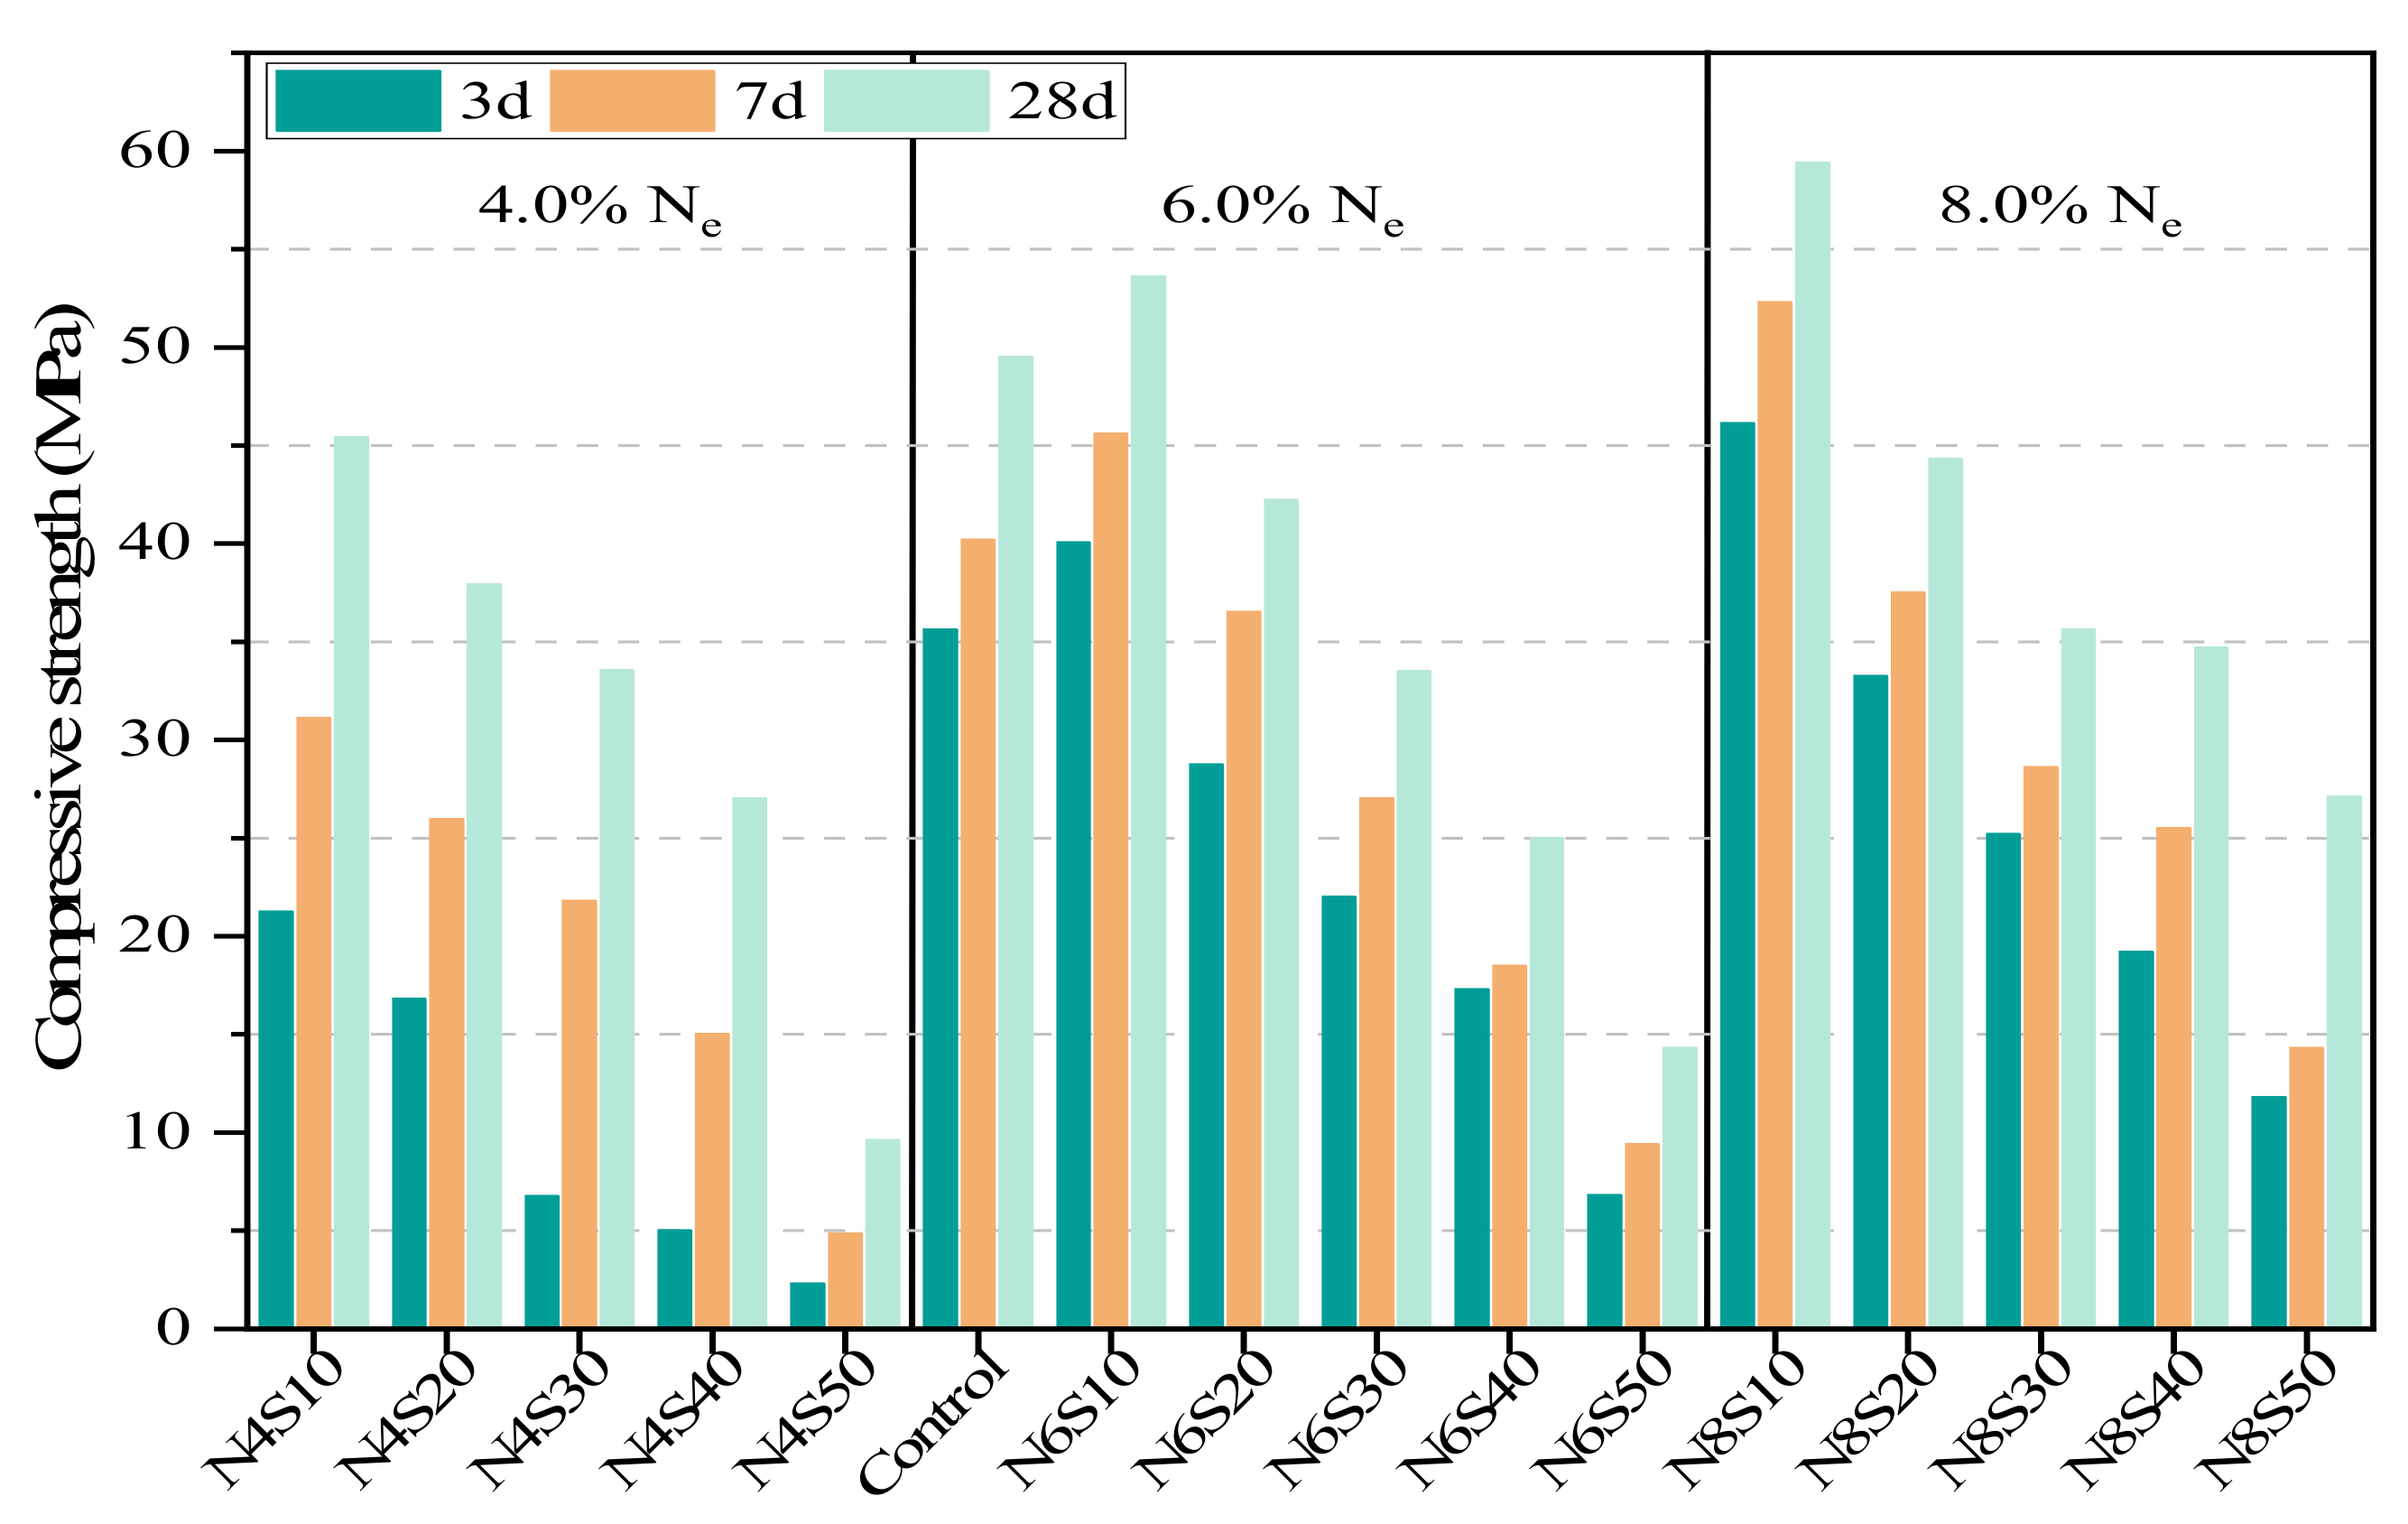
3.2.1. Effects of Ne and SS on Compressive Strength of AAM
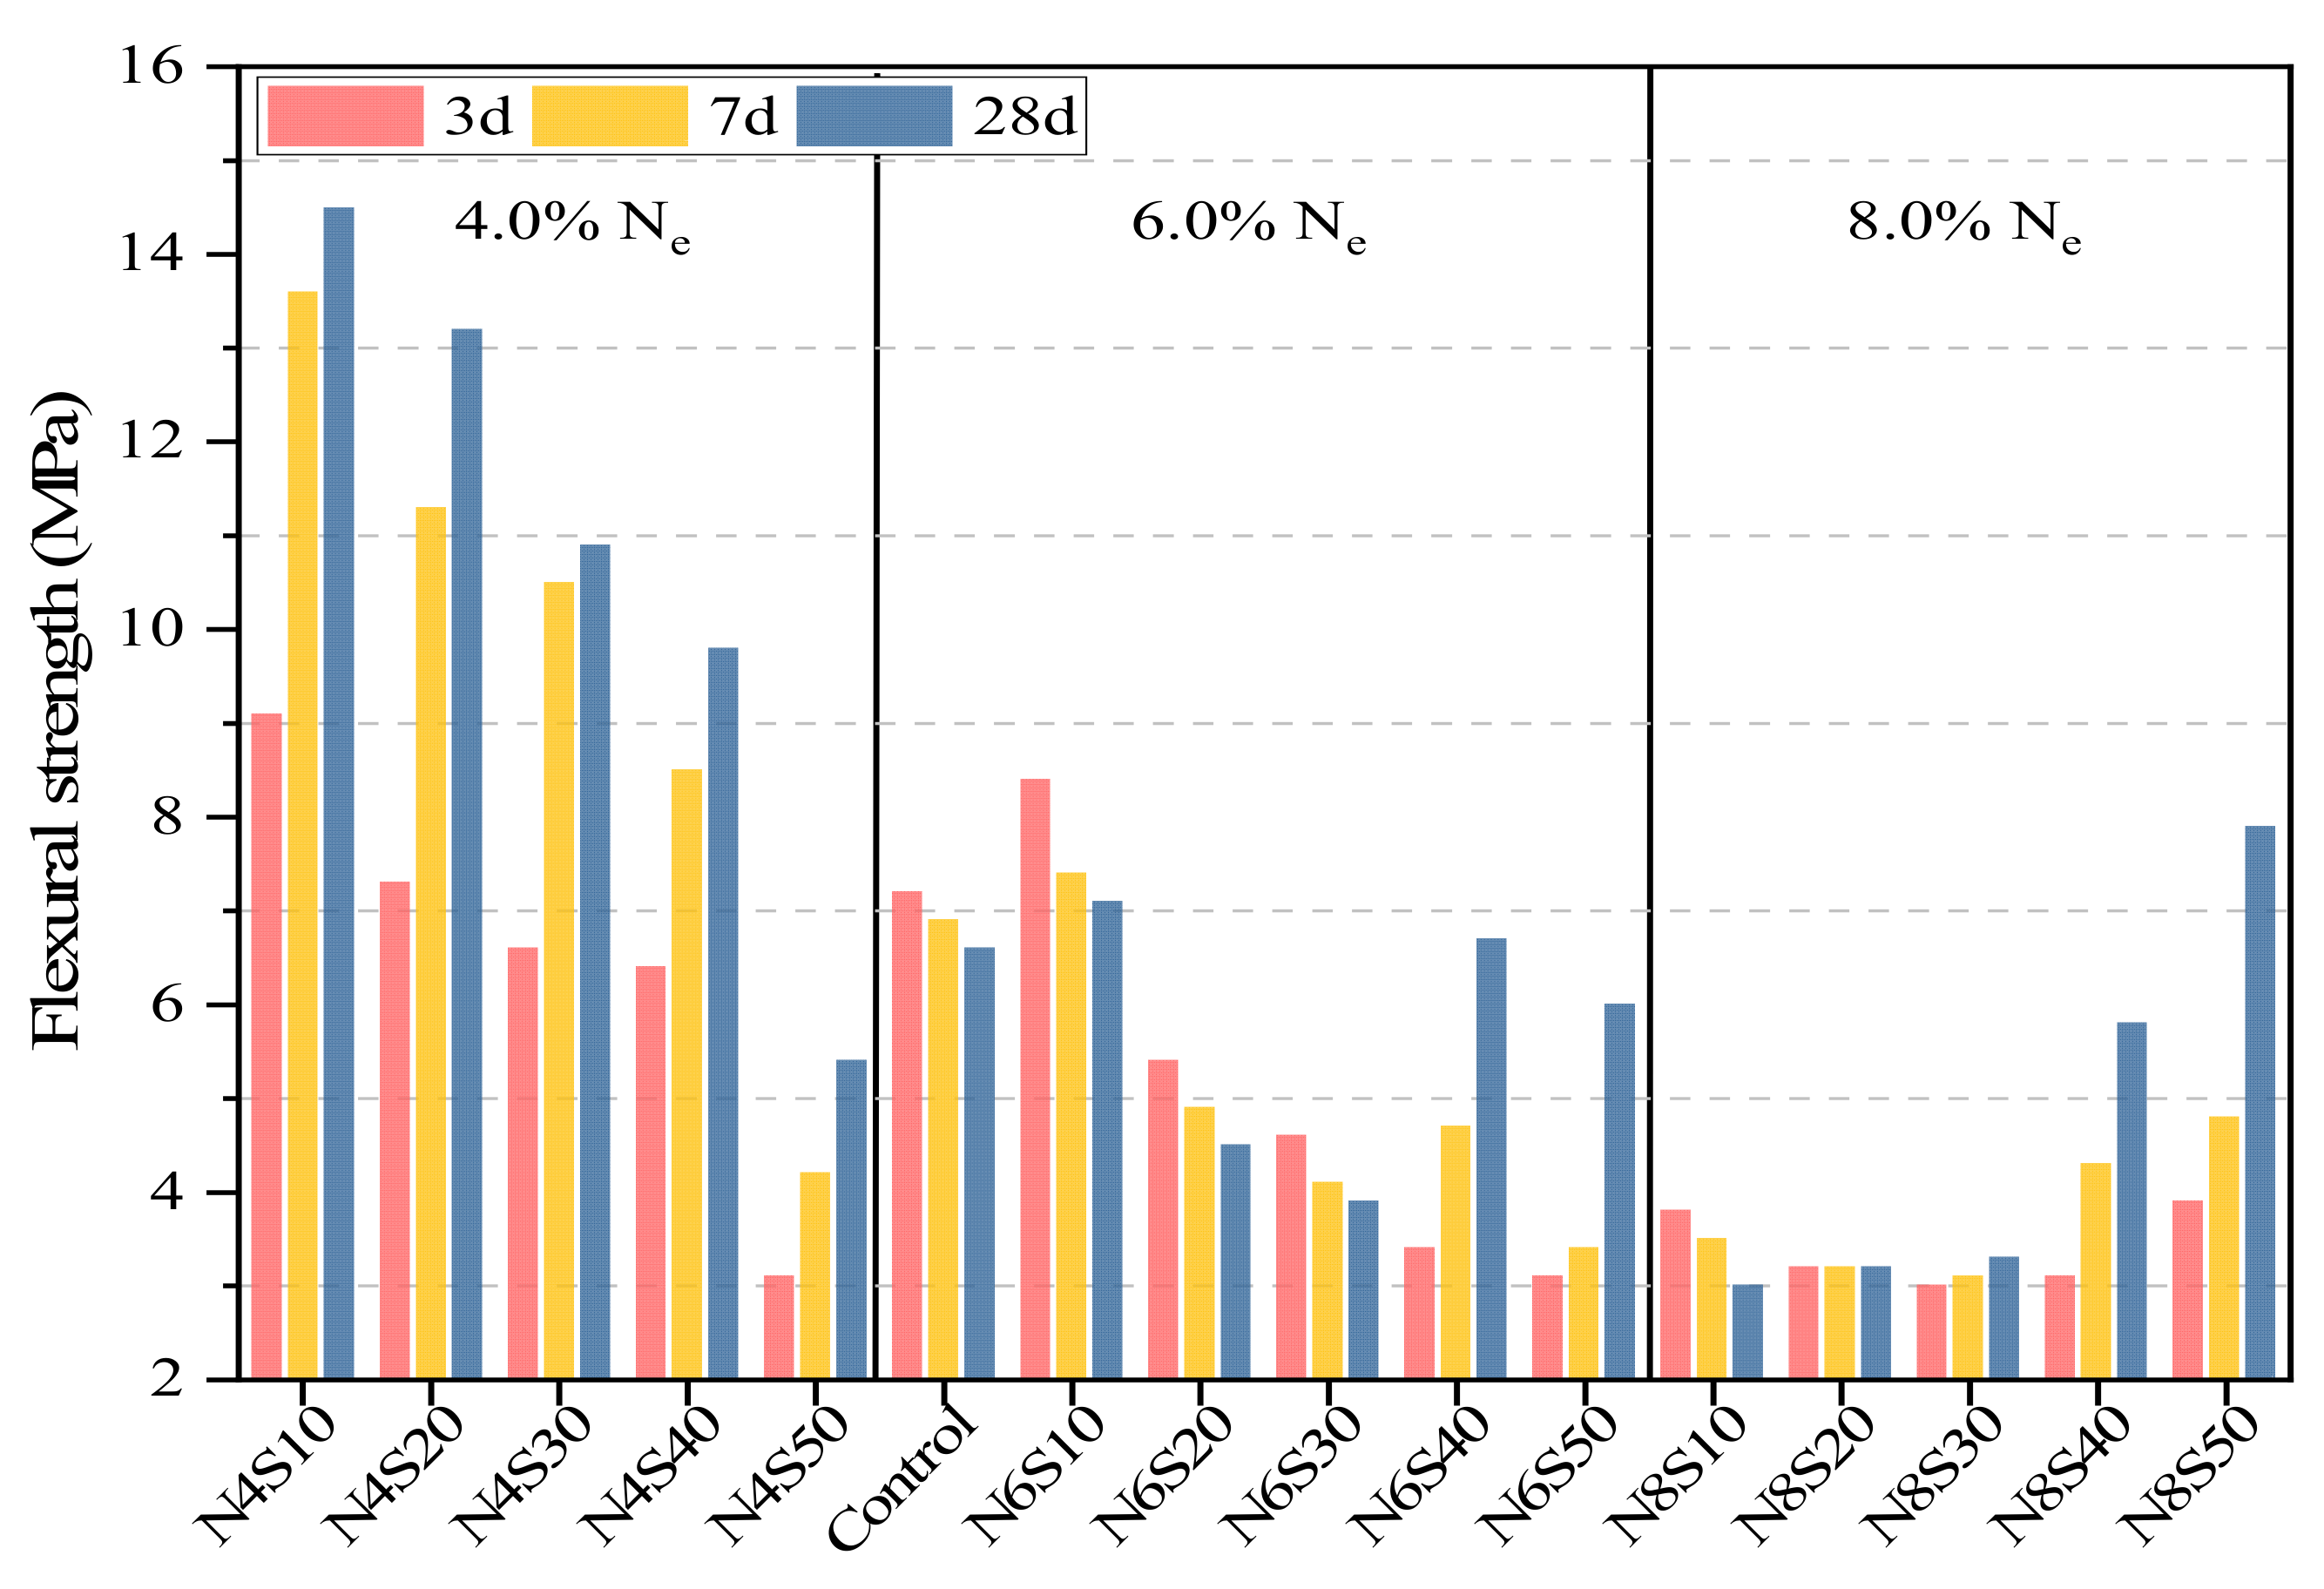
3.2.2. Effects of Ne and SS on Flexural Strength of AAM
3.3. Life Cycle Assessment
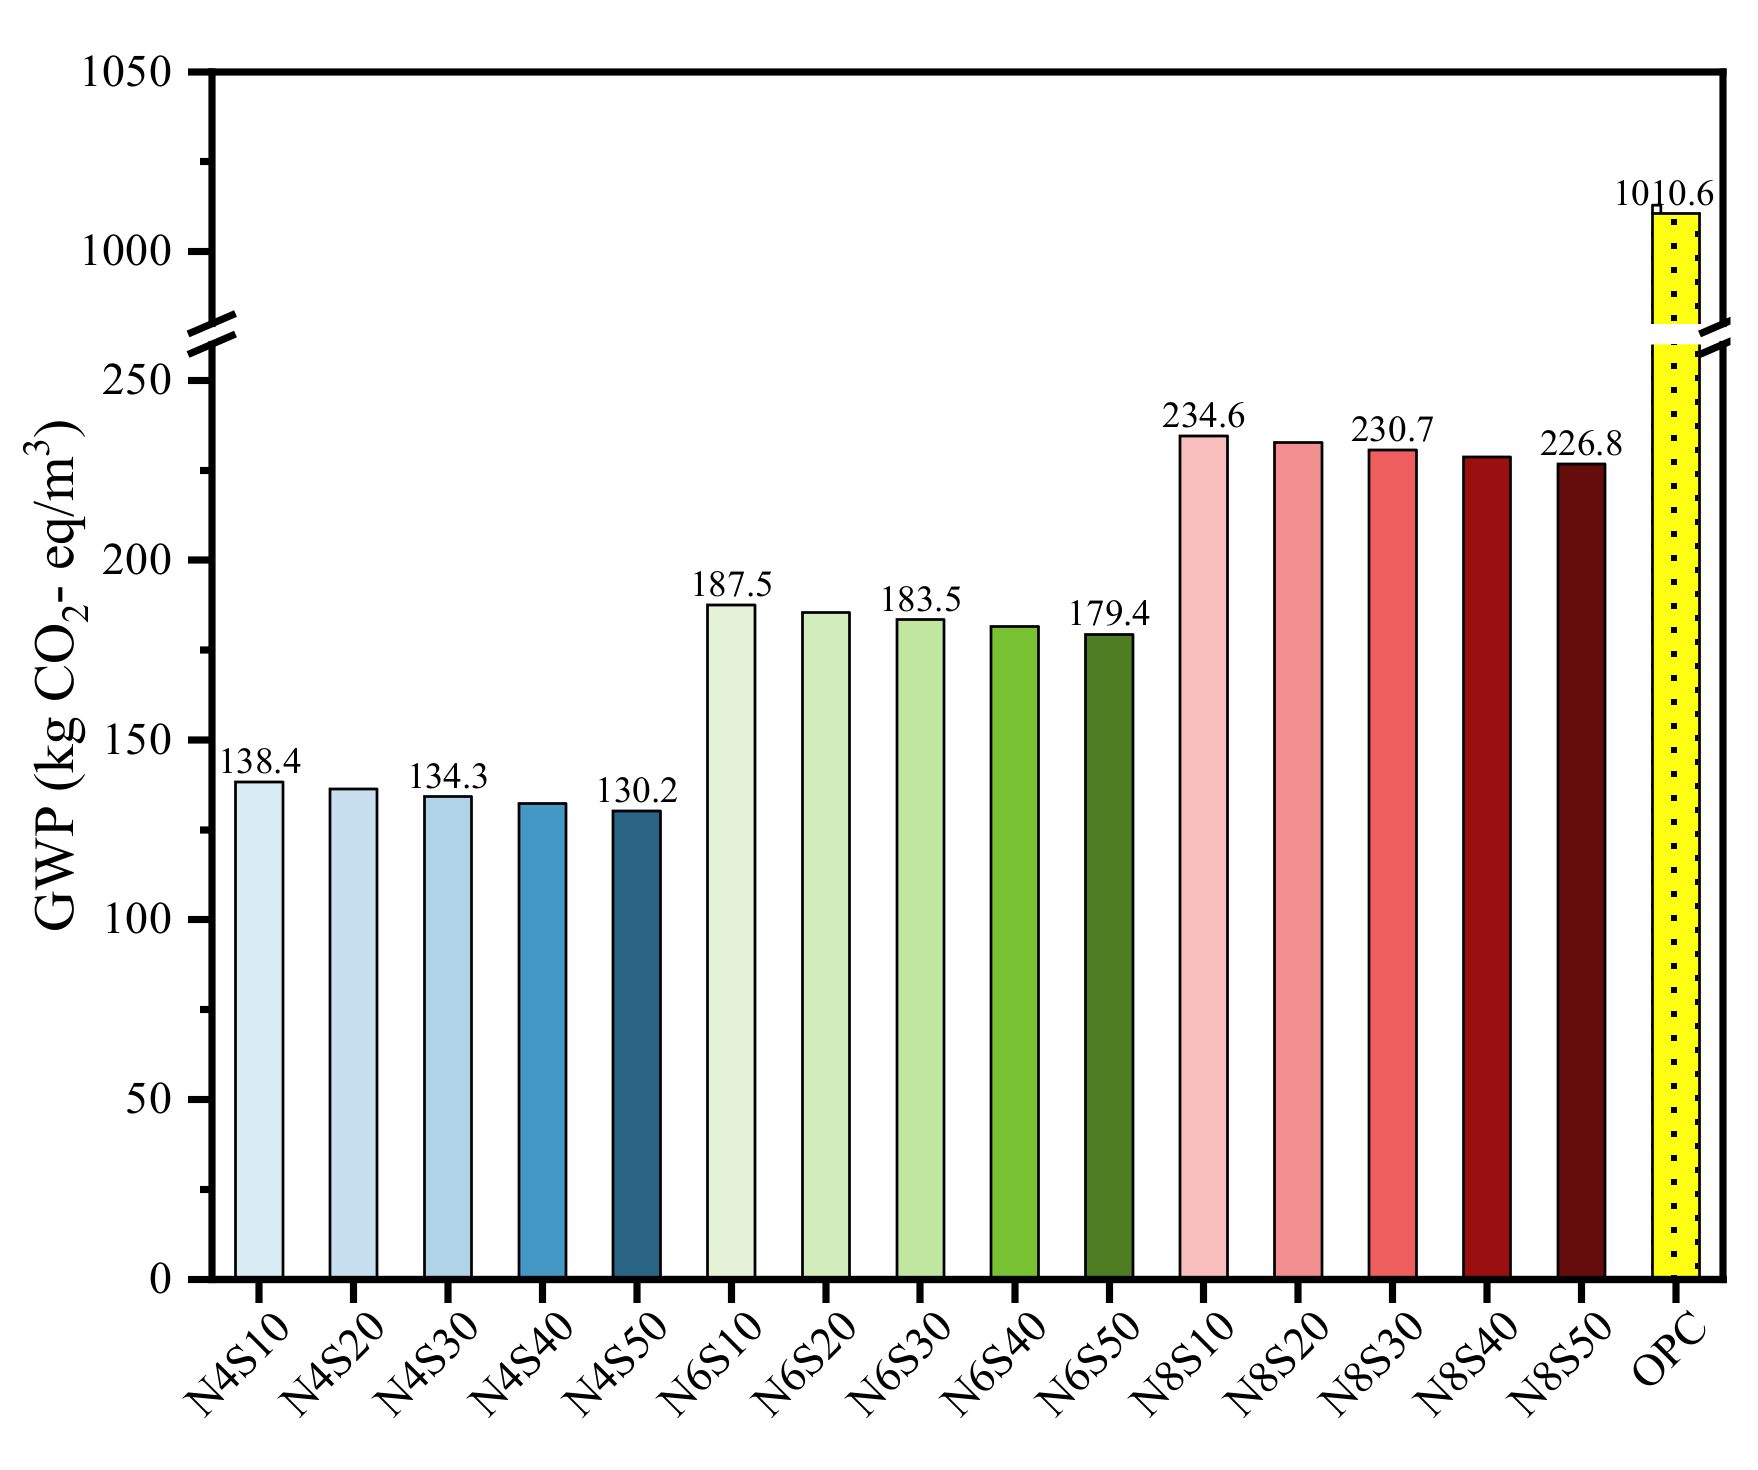
3.3.1. GWP Analysis
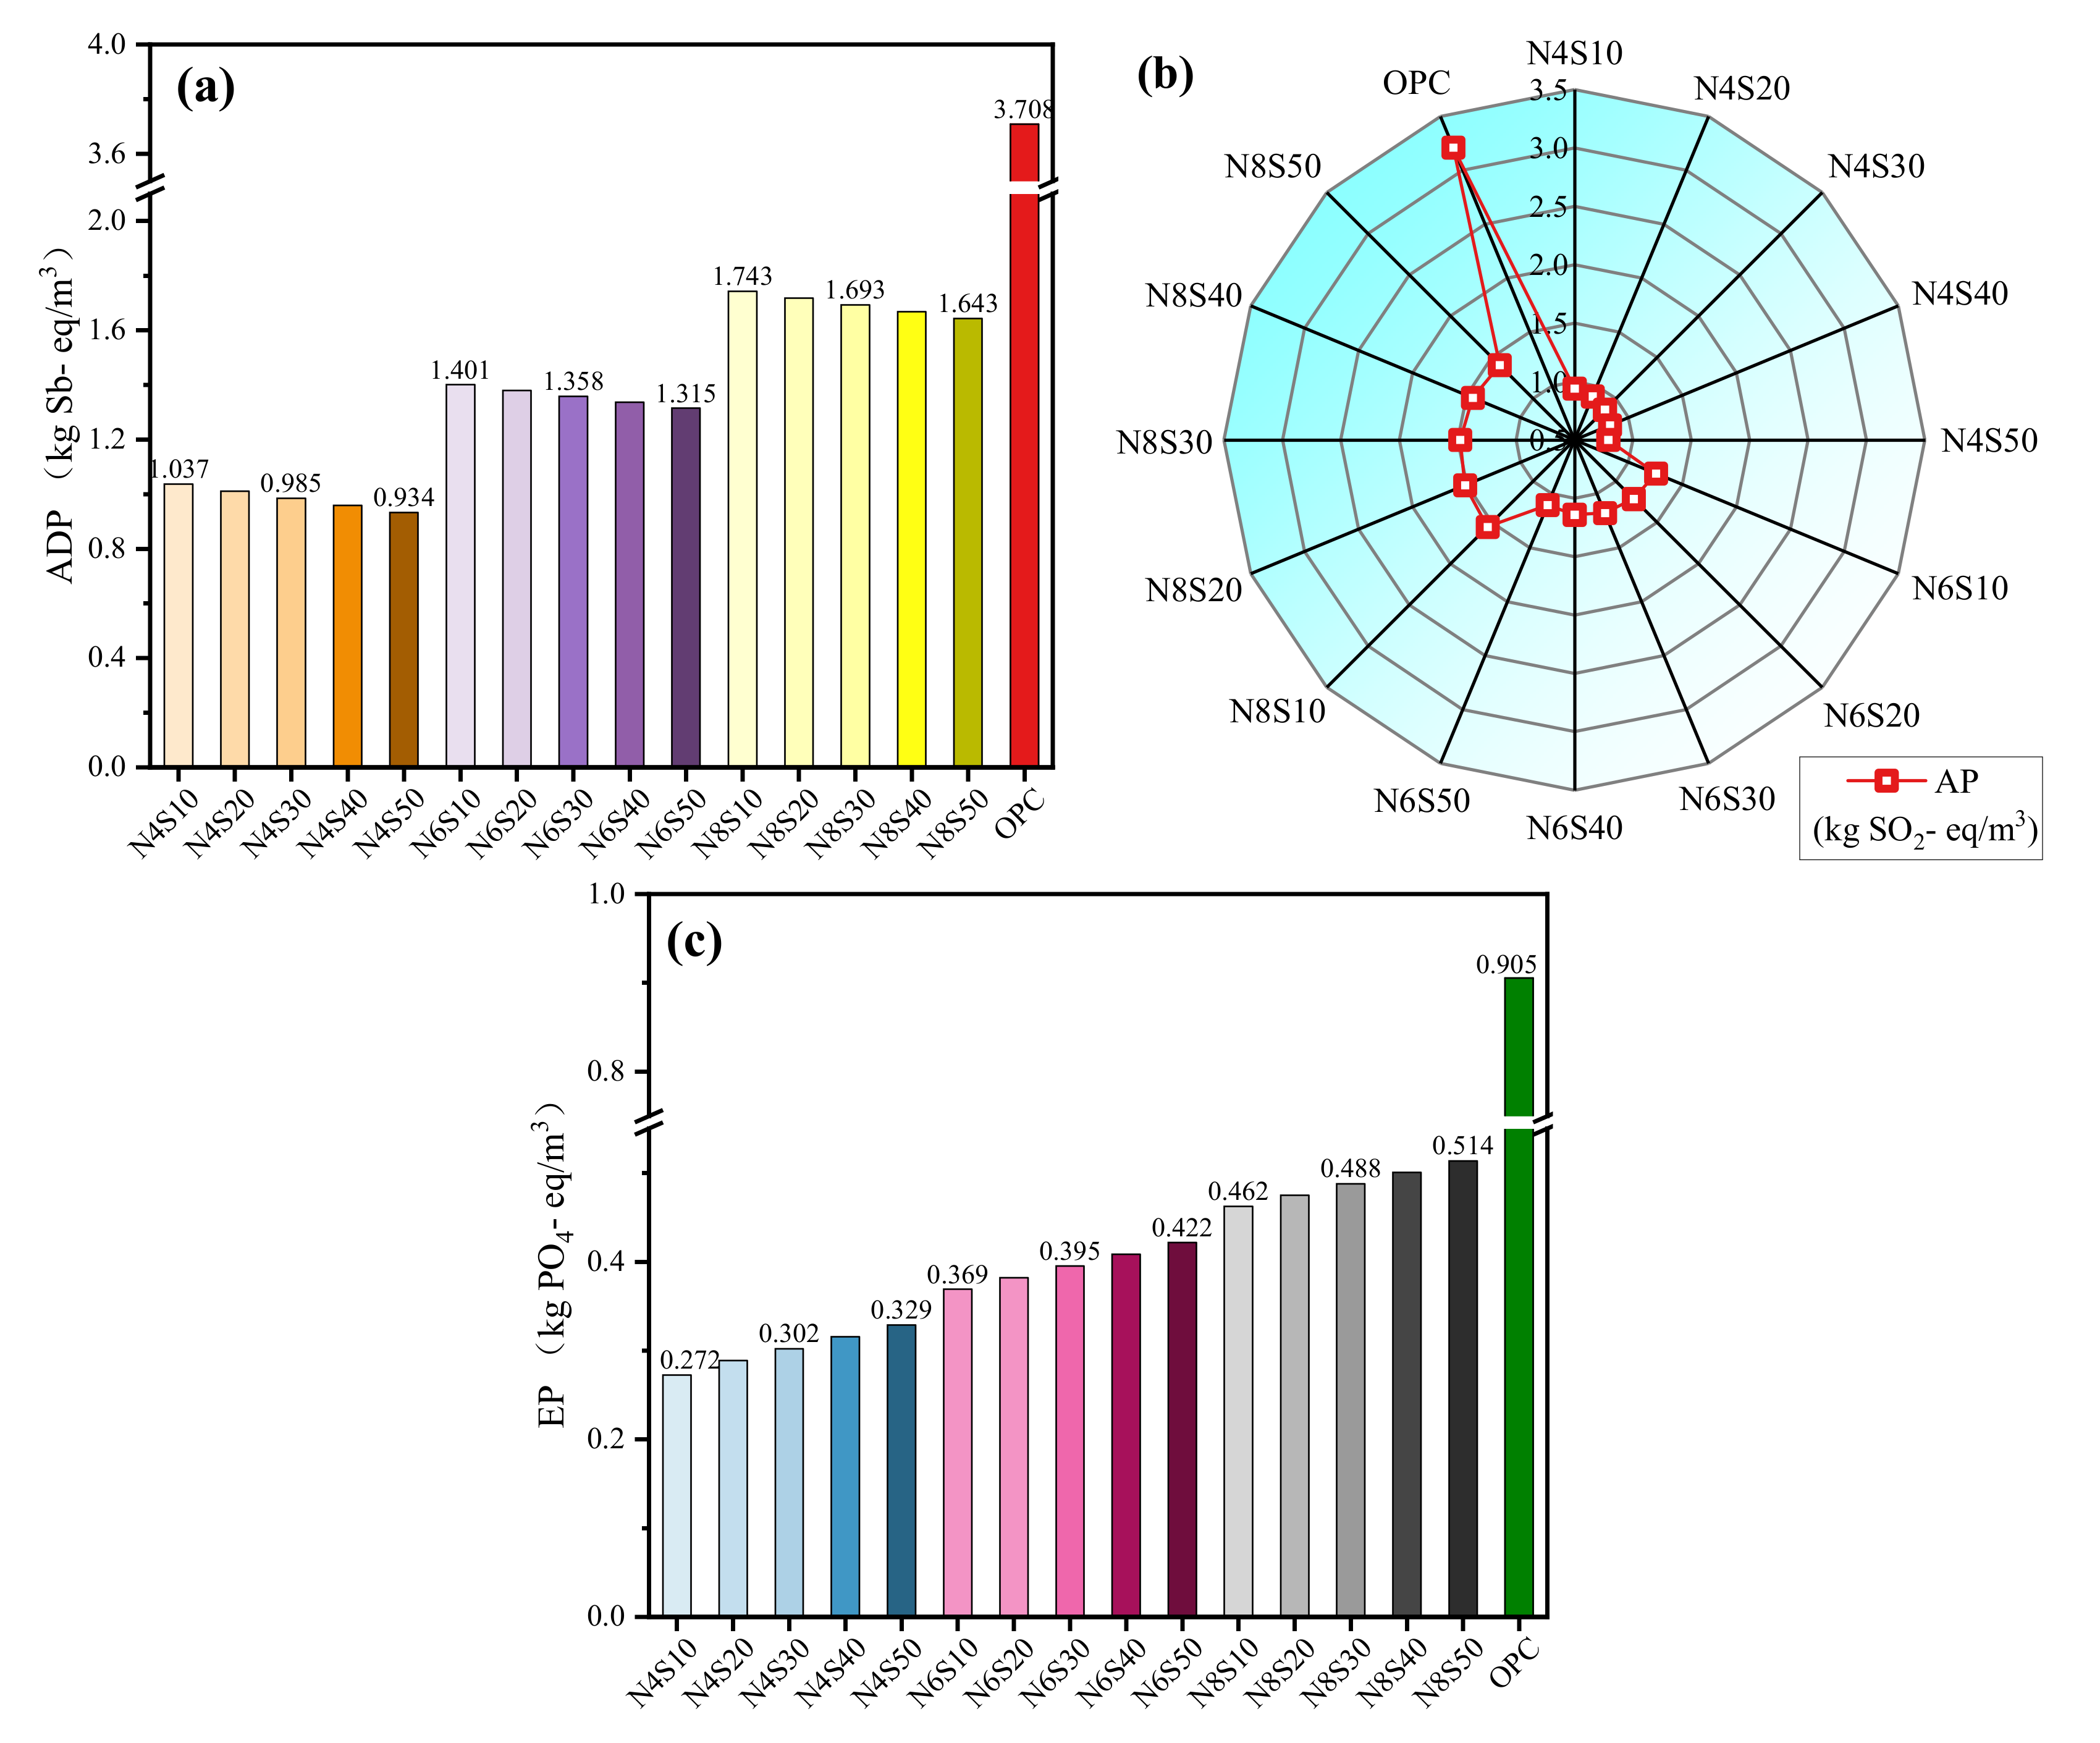
3.3.2. Impact Potential of Other Environmental Indicators
3.4. Microscopic Analyses
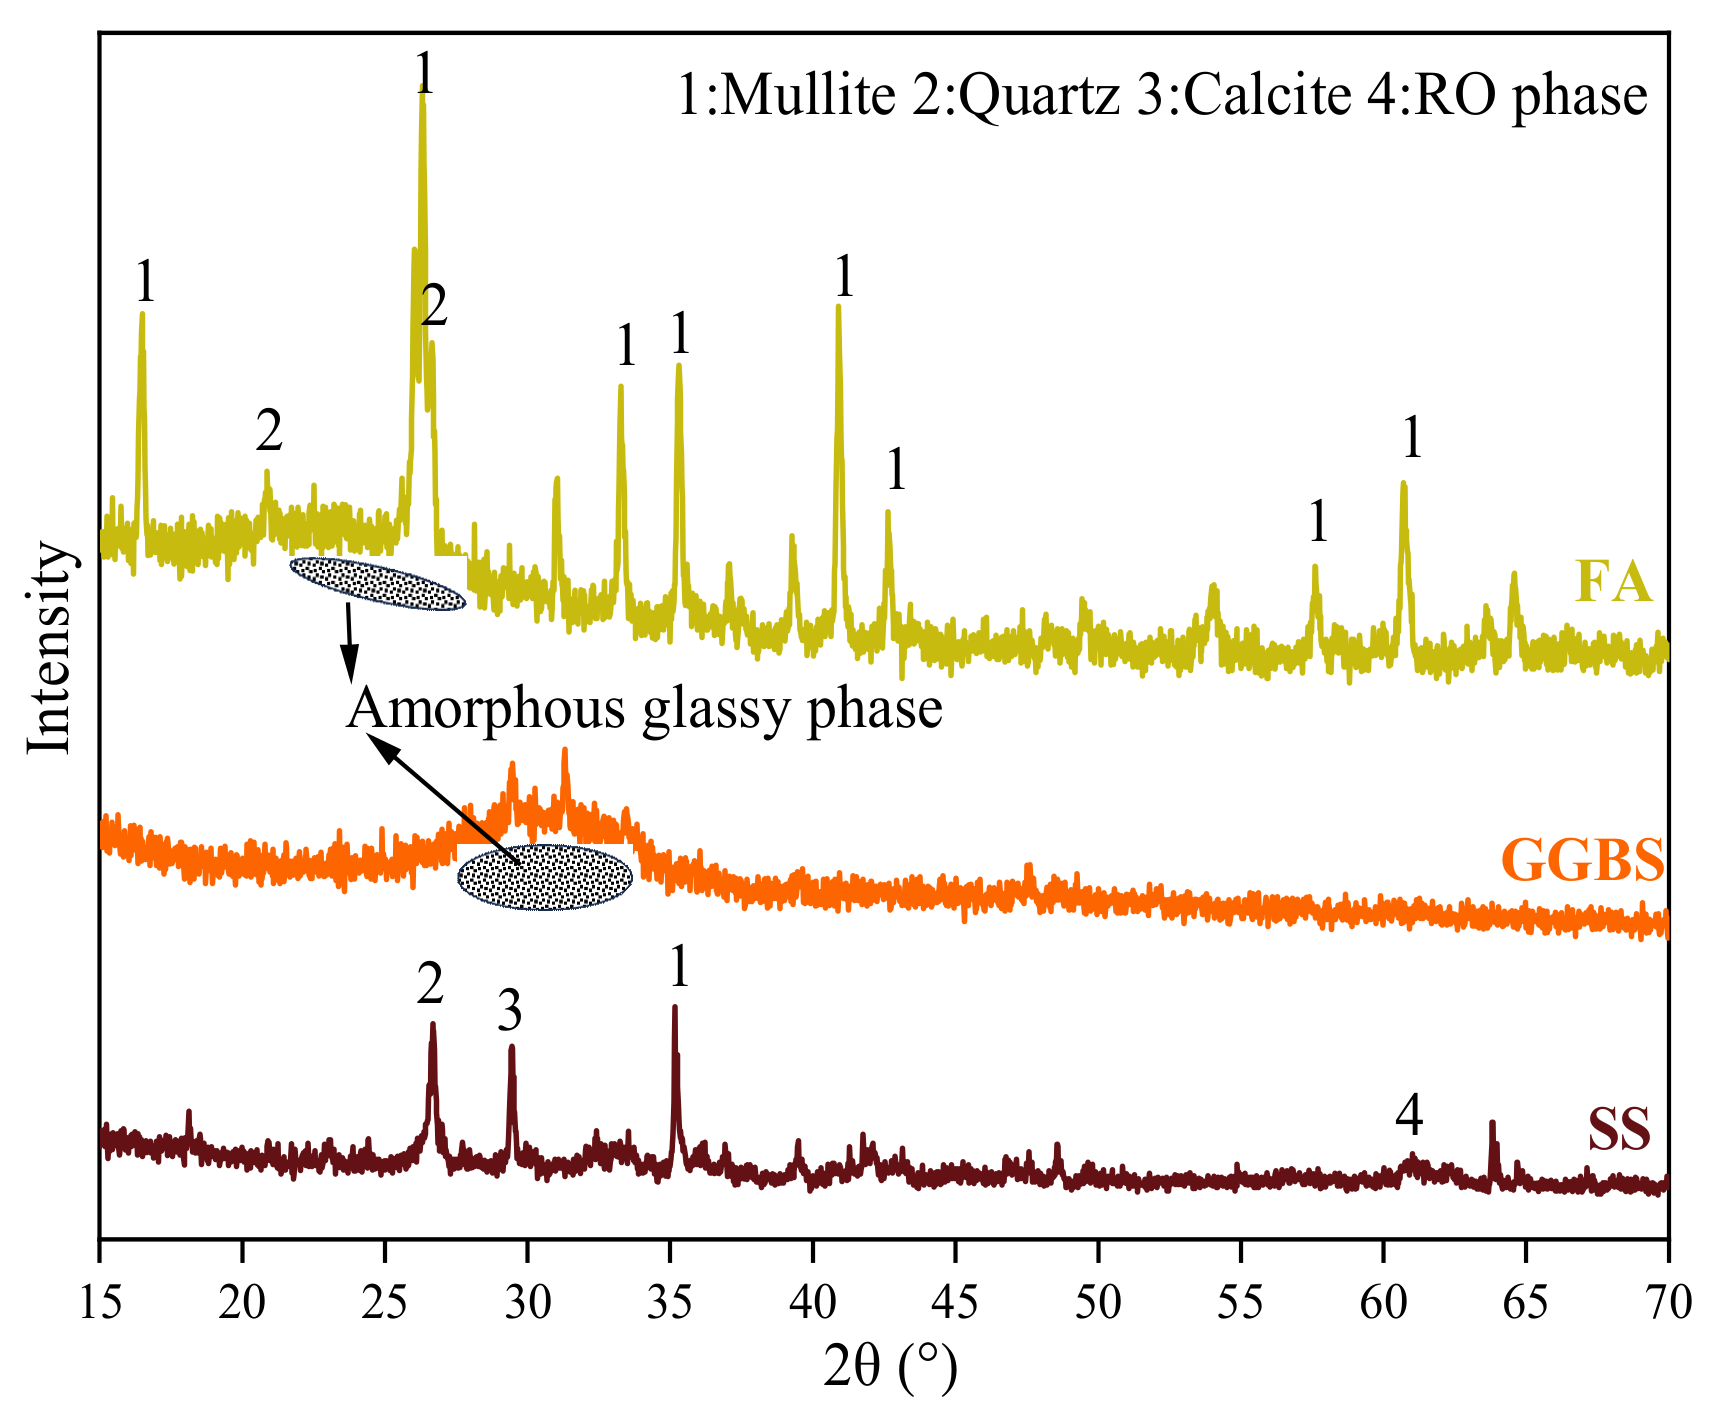
3.4.1. XRD Analysis
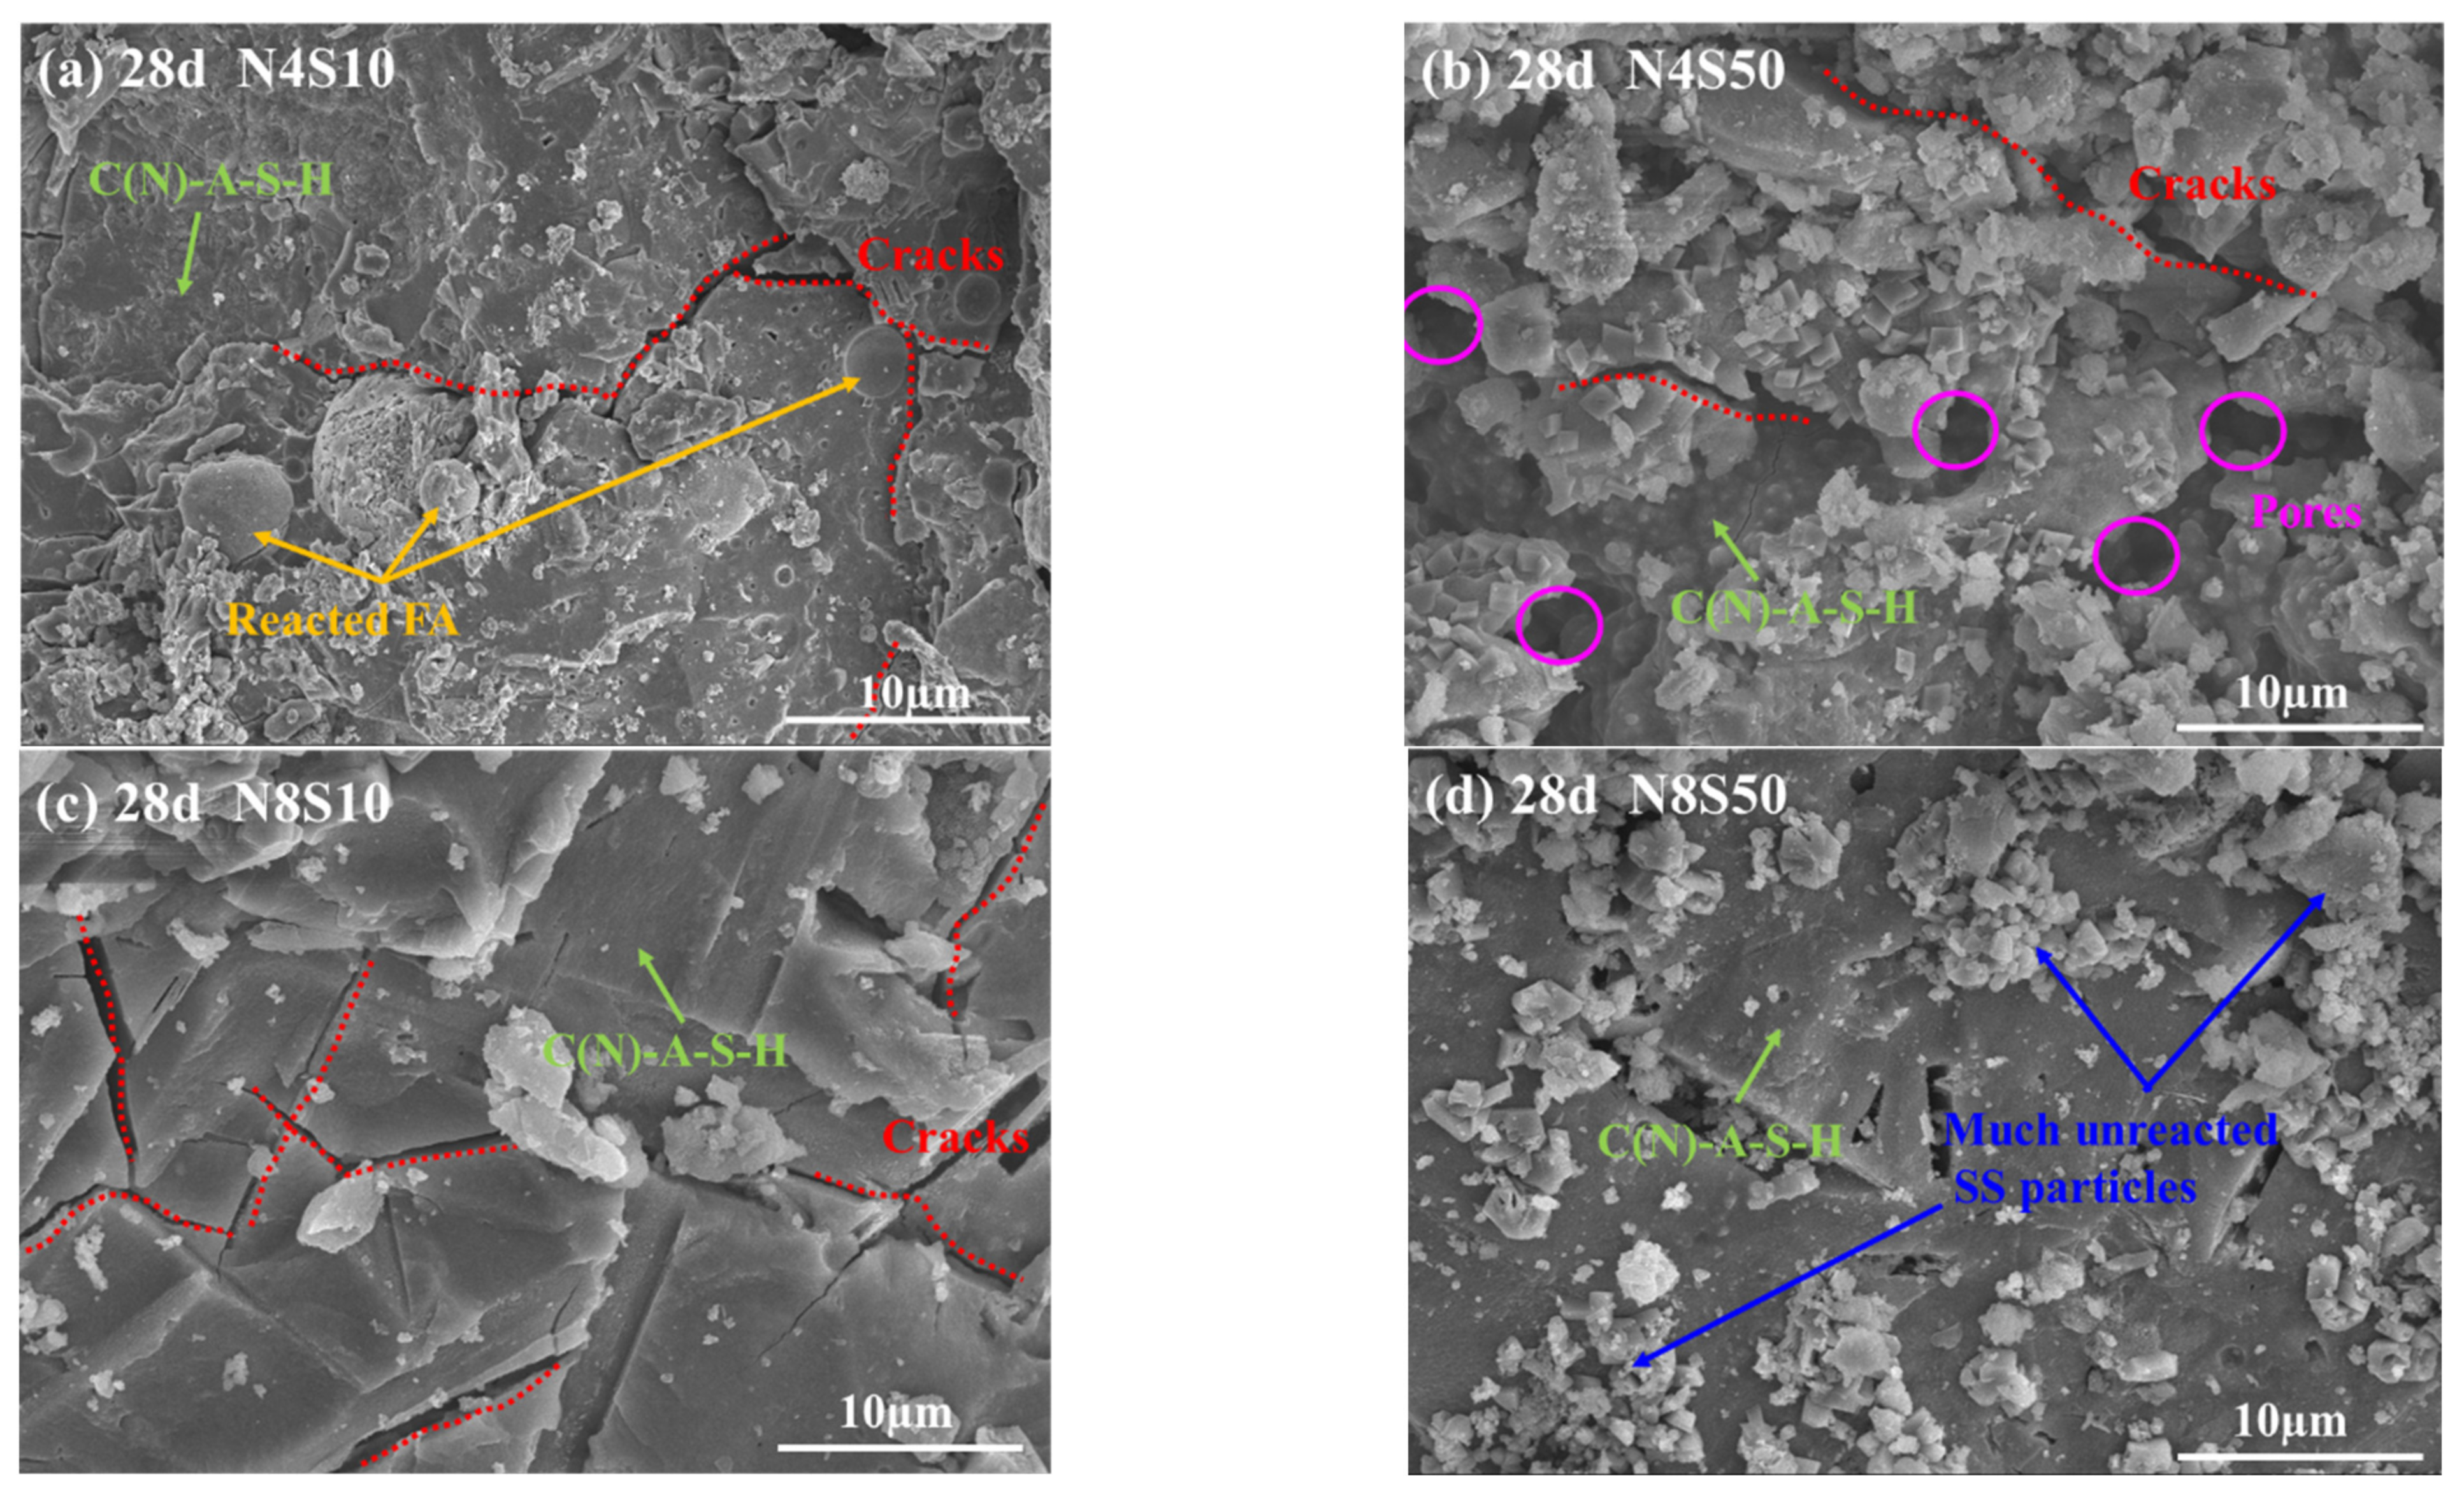
3.4.2. SEM Analysis
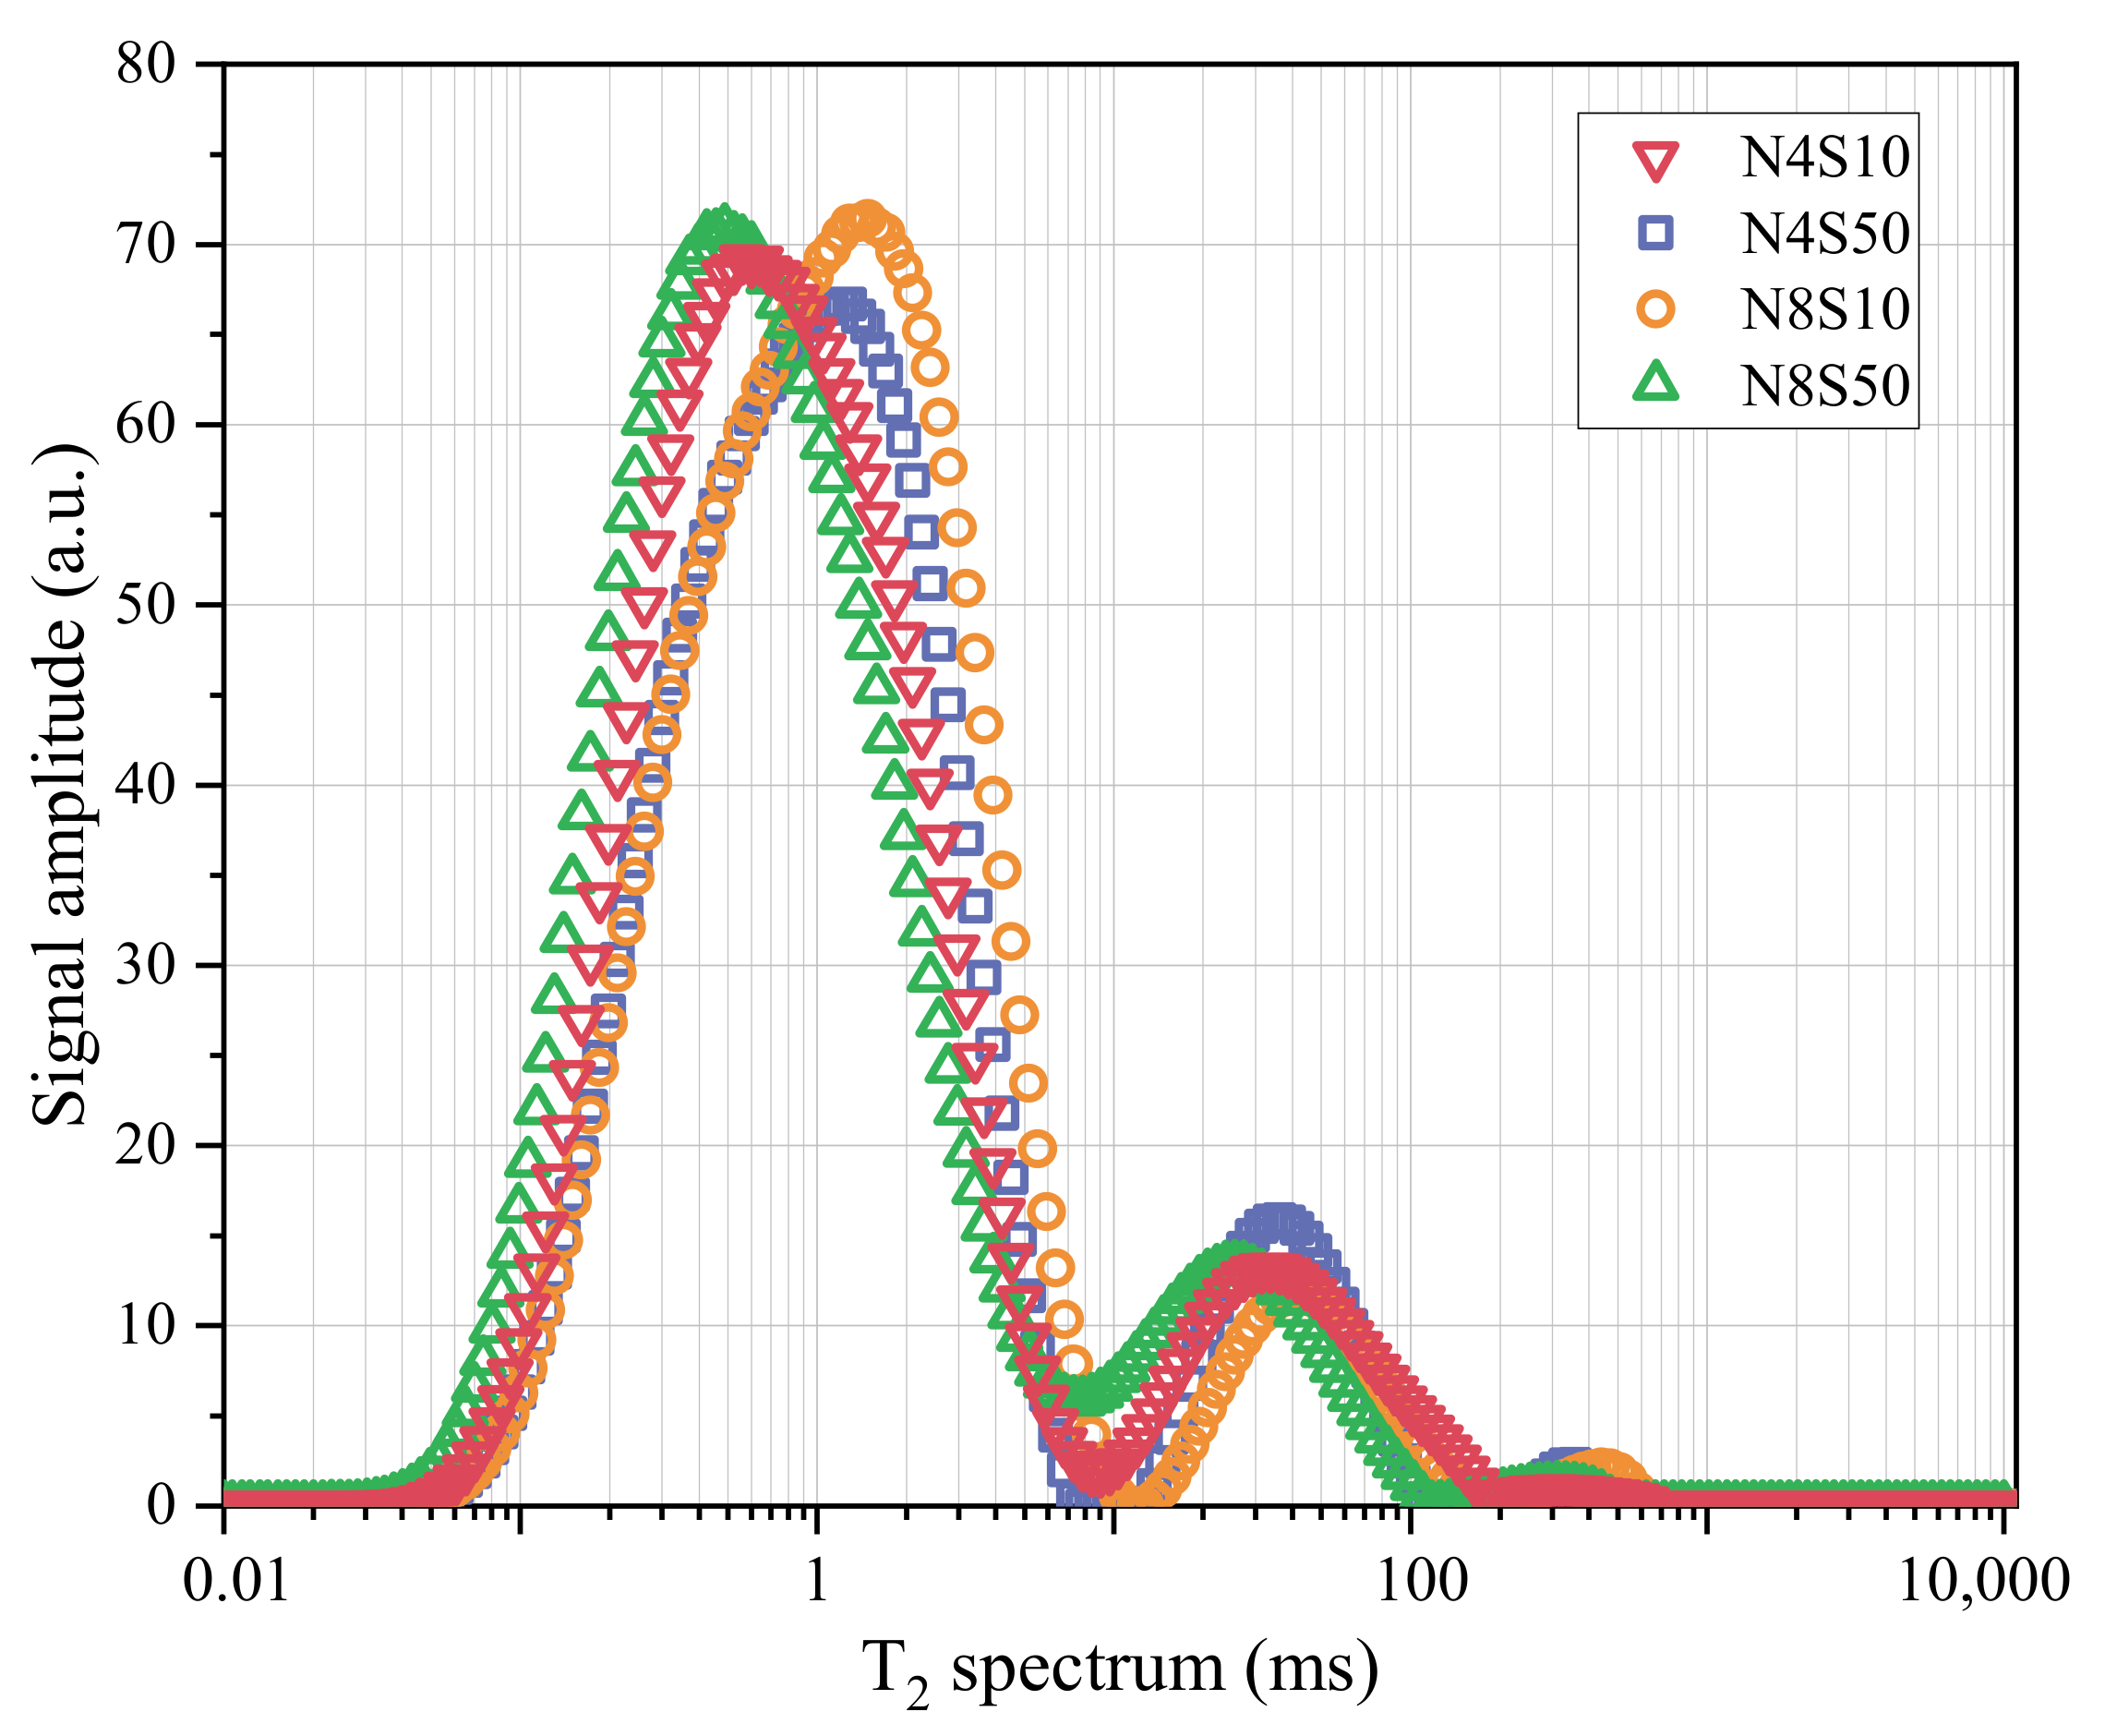
3.4.3. NMR Analysis
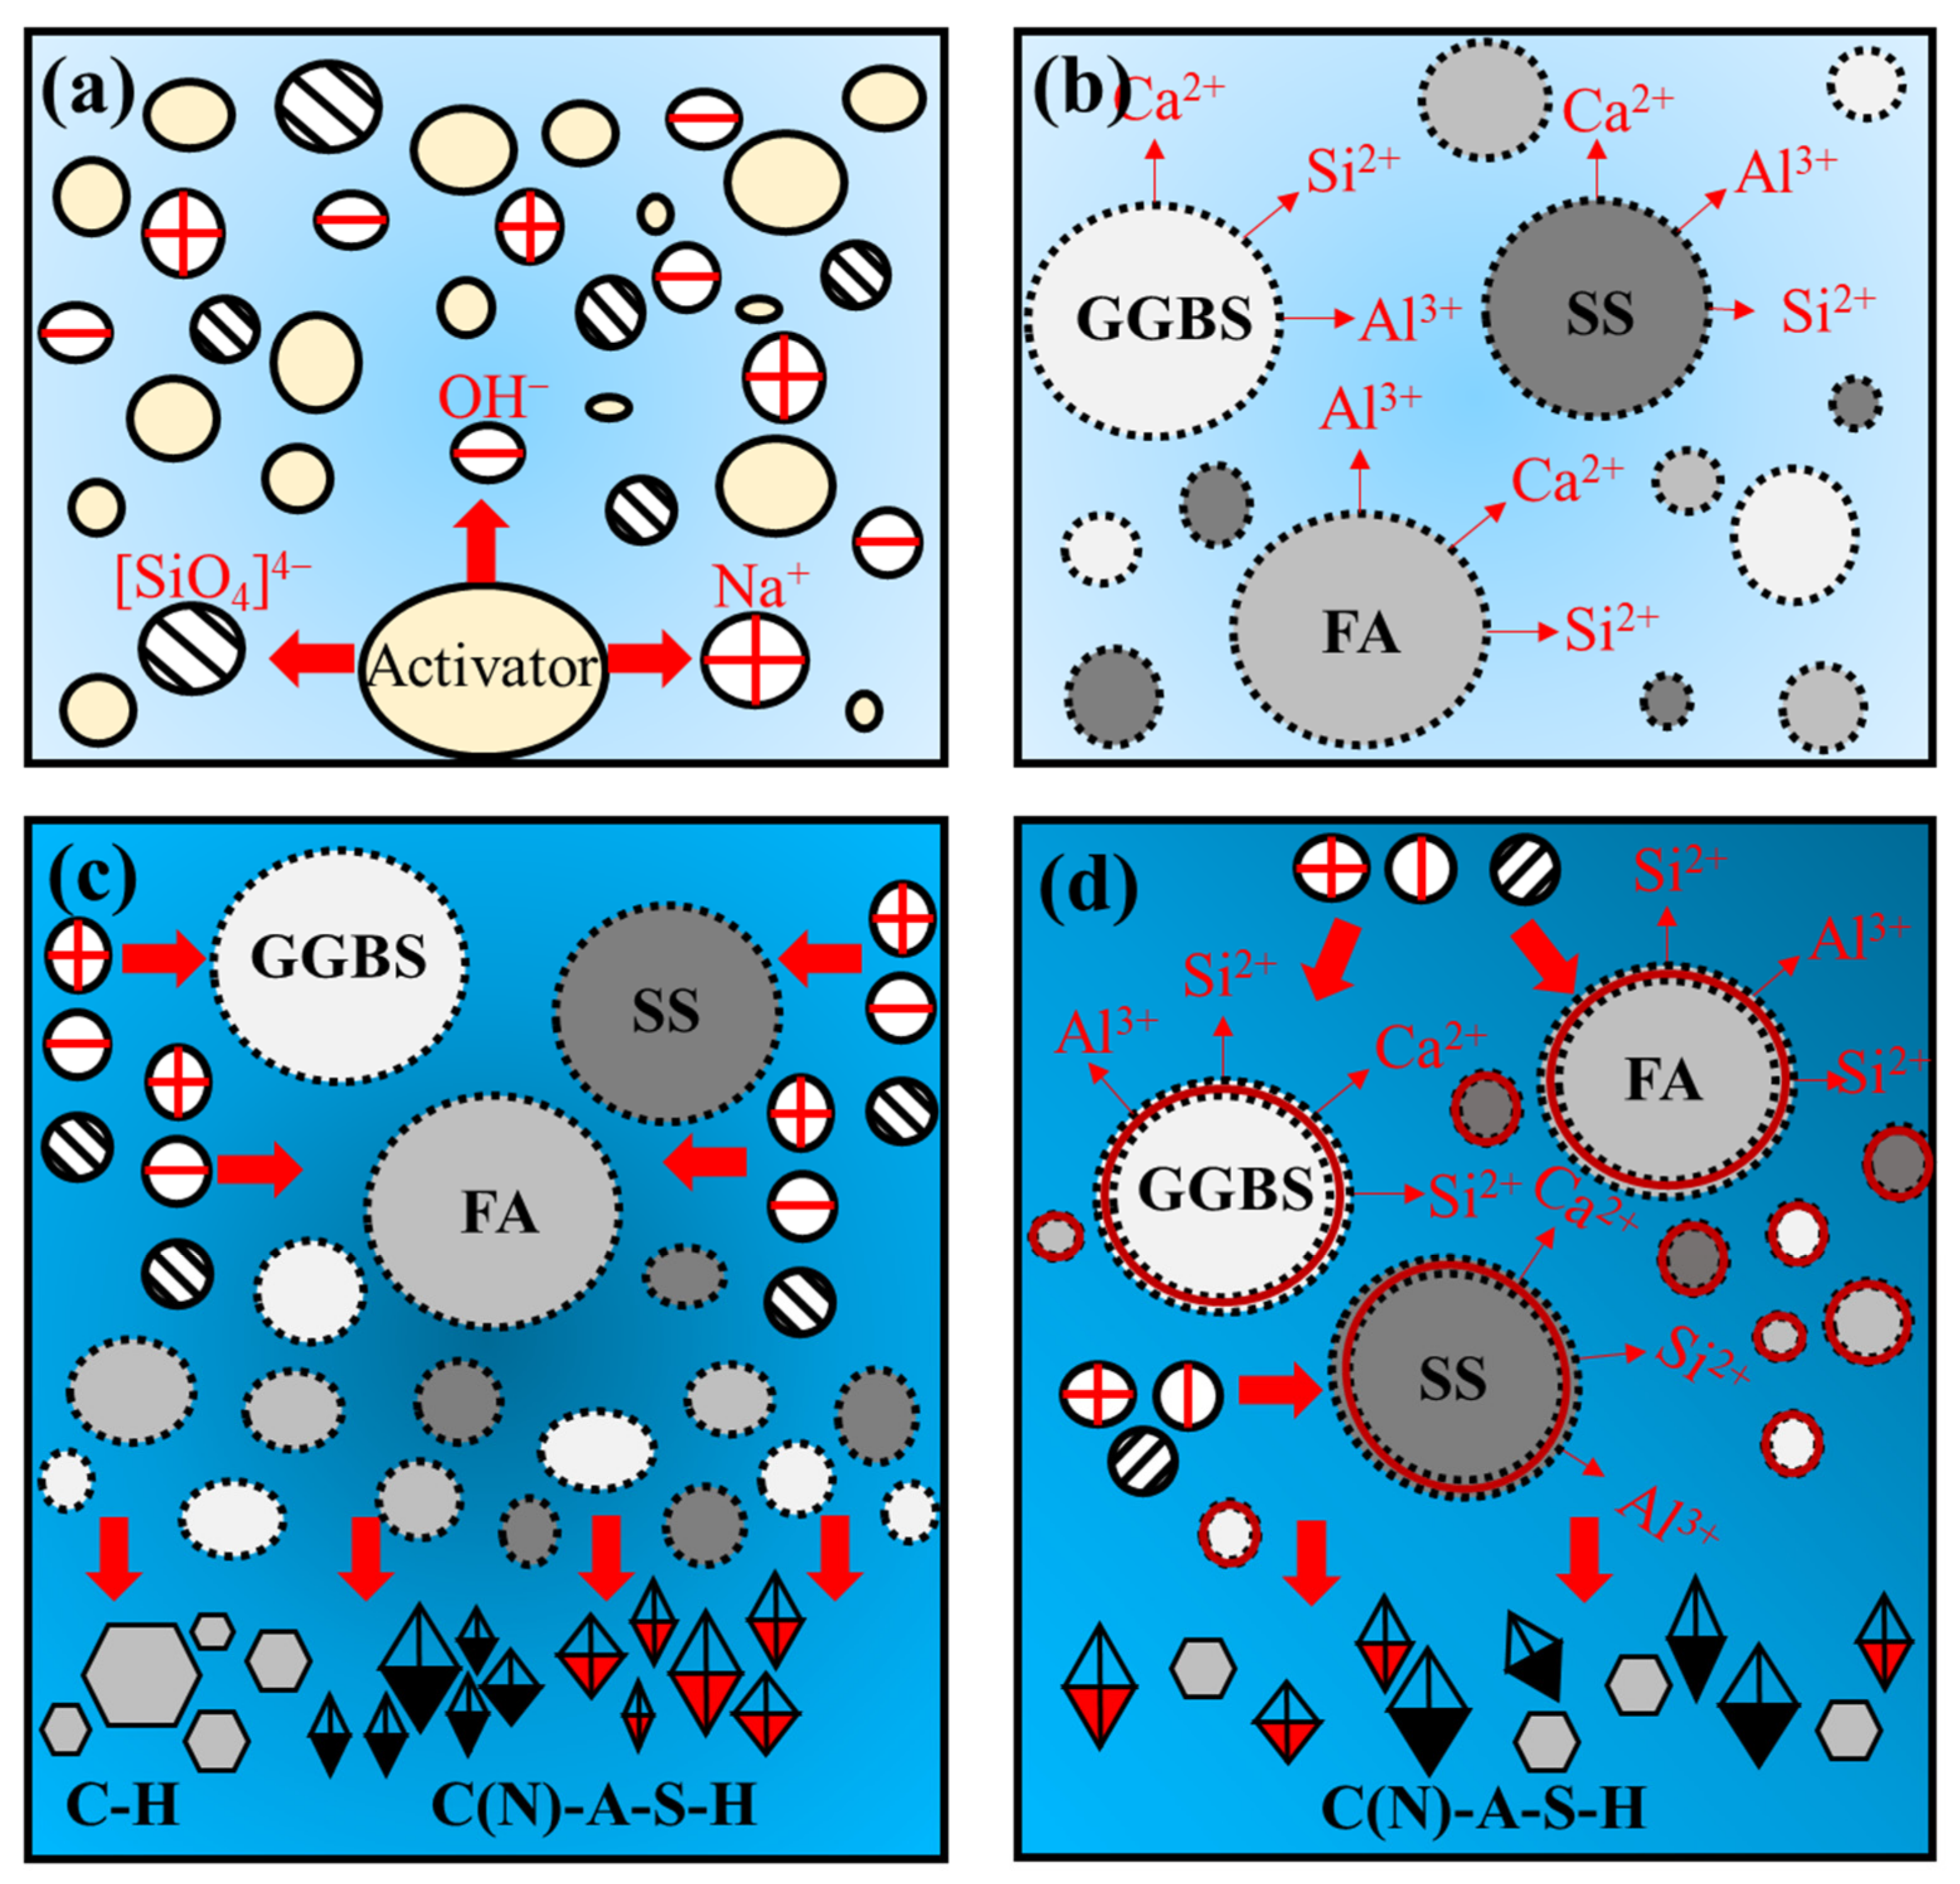
3.4.4. Mechanism Analysis
4. Conclusions
- (1)
- Although the increase in GGBS content and alkali equivalent speeds up the early reaction rate of the paste, the rapid generation of reaction products reduces fluidity and setting time. The incorporation of SS can improve the fluidity and setting time of the paste to a certain extent, which is mainly related to the slowdown of the paste reaction rate caused by the reduction in the vitreous content and hydration water demand in the system.
- (2)
- Thanks to the geopolymerization reaction and physical filling effect of SS, the highest compressive strength of the paste is obtained when the SS content is 10%. In addition, the significant increase in the compressive strength of the paste with the increase in the alkali equivalent from 4.0% to 8.0% is related to the accelerated reaction process, the increase in hydration products and refinement of the pores.
- (3)
- With the gradual increase in the alkali equivalent, the microcracks in the hardened paste caused by thermal stress gradually increase and the cracks gradually expand with the increase in the age of curing, which is the main reason for the decrease in the flexural strength. The microaggregate effect exerted by SS is significant when the content of SS is 40% and 50%, which blocks the developing cracks and improves the paste brittleness.
- (4)
- The paste reaction product mainly consists of C(N)-A-S-H, hydrotalcite, Ca(OH)2 and CaCO3. As the alkali equivalent increases from 4.0% to 8.0%, the gel products gradually stack and cement together with unreacted particles, which improves the microstructure compactness. However, when the SS content increases from 10% to 50%, the unreacted SS gradually increases and adheres to the surface of the reaction product, which results in a loose and rough microstructure.
- (5)
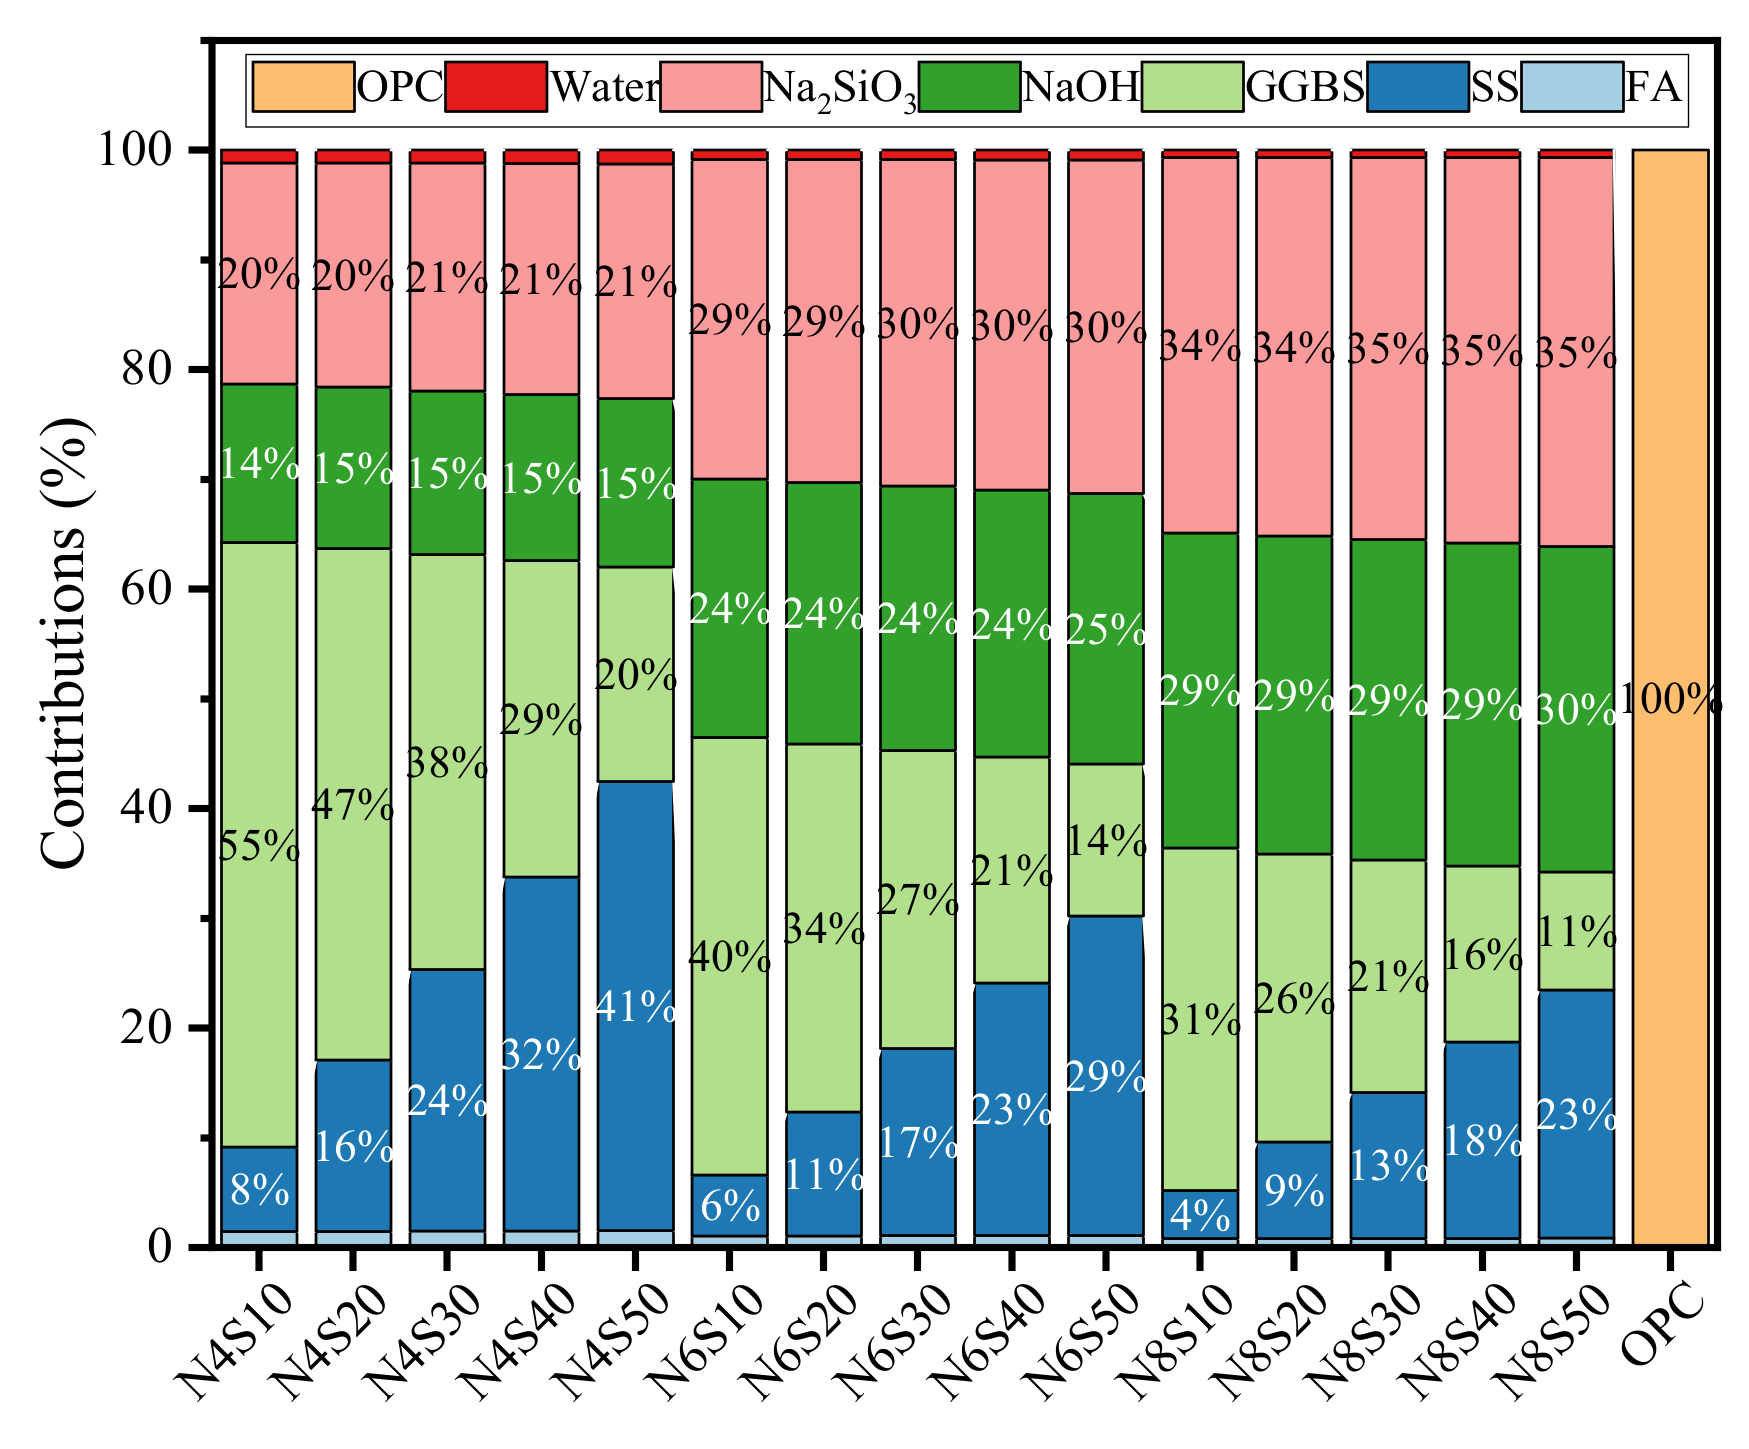
- The life cycle assessment shows that the average GWP, ADP, AP and EP values of all the samples prepared in this work that meet the compressive strength requirements of grade 42.5 cement are reduced by 80.5%, 60.7%, 59.3% and 56.6% compared to that of cement. The reuse of solid waste such as steel slag and fly ash reduces original resource consumption and CO2 emissions, which has a guiding significance for the recycling and low-carbonization of solid waste in the engineering field.
Author Contributions
Funding
Institutional Review Board Statement
Informed Consent Statement
Data Availability Statement
Acknowledgments
Conflicts of Interest
References
- Provis, J.L.; Palomo, A.; Shi, C. Advances in understanding alkali-activated materials. Cem. Concr. Res. 2015, 78, 110–125. [Google Scholar] [CrossRef]
- Mendes, B.C.; Pedroti, L.G.; Vieira, C.M.F.; Carvalho, J.M.F.D.; Ribeiro, J.C.L.; Souza, C.M.M.D. Application of mixture design of experiments to the development of alkali-activated composites based on chamotte and waste glass. Constr. Build. Mater. 2023, 379, 131139. [Google Scholar] [CrossRef]
- Cheah, C.B.; Tan, L.E.; Ramli, M. Recent advances in slag-based binder and chemical activators derived from industrial by-products—A review. Constr. Build. Mater. 2021, 272, 121657. [Google Scholar] [CrossRef]
- Arifeen, S.U.; Amin, M.N.; Ahmad, W.; Althoey, F.; Ali, M.; Alotaibi, B.S.; Abuhussain, M.A. A comparative study of prediction models for alkali-activated materials to promote quick and economical adaptability in the building sector. Constr. Build. Mater. 2023, 407, 133485. [Google Scholar] [CrossRef]
- Aiken, T.A.; Gu, L.; Kwasny, J.; Huseien, G.F.; McPolin, D.; Sha, W. Acid resistance of alkali-activated binders: A review of performance, mechanisms of deterioration and testing procedures. Constr. Build. Mater. 2022, 342, 128057. [Google Scholar] [CrossRef]
- Hanjitsuwan, S.; Phoo-ngernkham, T.; Li, L.-Y.; Damrongwiriyanupap, N.; Chindaprasirt, P. Strength development and durability of alkali-activated fly ash mortar with calcium carbide residue as additive. Constr. Build. Mater. 2018, 162, 714–723. [Google Scholar] [CrossRef]
- Jittin, V.; Madhuri, P.; Santhanam, M.; Bahurudeen, A. Influence of preconditioning and curing methods on the durability performance of alkali-activated binder composites. Constr. Build. Mater. 2021, 311, 125346. [Google Scholar] [CrossRef]
- Siddique, S.; Jang, J.G. Acid and sulfate resistance of seawater based alkali activated fly ash: A sustainable and durable approach. Constr. Build. Mater. 2021, 281, 122601. [Google Scholar] [CrossRef]
- Munir, Q.; Abdulkareem, M.; Horttanainen, M.; Kärki, T. A comparative cradle-to-gate life cycle assessment of geopolymer concrete produced from industrial side streams in comparison with traditional concrete. Sci. Total Environ. 2023, 865, 161230. [Google Scholar] [CrossRef]
- Zhang, P.; Gao, Z.; Wang, J.; Guo, J.; Hu, S.; Ling, Y. Properties of fresh and hardened fly ash/slag based geopolymer concrete: A review. J. Clean. Prod. 2020, 270, 122389. [Google Scholar] [CrossRef]
- Wang, S.-D.; Scrivener, K.L. Hydration products of alkali activated slag cement. Cem. Concr. Res. 1995, 25, 561–571. [Google Scholar] [CrossRef]
- Thymotie, A.; Chang, T.-P.; Nguyen, H.-A. Improving properties of high-volume fly ash cement paste blended with β-hemihydrate from flue gas desulfurization gypsum. Constr. Build. Mater. 2020, 261, 120494. [Google Scholar] [CrossRef]
- Rakngan, W.; Williamson, T.; Ferron, R.D.; Sant, G.; Juenger, M.C.G. Controlling workability in alkali-activated Class C fly ash. Constr. Build. Mater. 2018, 183, 226–233. [Google Scholar] [CrossRef]
- Amran, M.; Onaizi, A.M.; Makul, N.; Abdelgader, H.S.; Tang, W.C.; Alsulami, B.T.; Alluqmani, A.E.; Gamil, Y. Shrinkage mitigation in alkali-activated composites: A comprehensive insight into the potential applications for sustainable construction. Results Eng. 2023, 20, 101452. [Google Scholar] [CrossRef]
- Mastali, M.; Kinnunen, P.; Dalvand, A.; Firouz, R.M.; Illikainen, M. Drying shrinkage in alkali-activated binders—A critical review. Constr. Build. Mater. 2018, 190, 533–550. [Google Scholar] [CrossRef]
- Al Makhadmeh, W.; Soliman, A. Understanding the shrinkage behaviour of alkali-activated slag binders modified by the superabsorbent polymer. Constr. Build. Mater. 2023, 365, 130053. [Google Scholar] [CrossRef]
- Kim, G.W.; Oh, T.; Chun, B.; Lee, S.W.; Hung, C.-C.; Yoo, D.-Y. Enhanced tensile performance of ultra-high-performance alkali-activated concrete using surface roughened steel fibers. Constr. Build. Mater. 2023, 409, 133867. [Google Scholar]
- Abdollahnejad, Z.; Luukkonen, T.; Mastali, M.; Giosue, C.; Favoni, O.; Ruello, M.L.; Kinnunen, P.; Illikainen, M. Microstructural Analysis and Strength Development of One-Part Alkali-Activated Slag/Ceramic Binders Under Different Curing Regimes. Waste Biomass Valorization 2020, 11, 3081–3096. [Google Scholar] [CrossRef]
- Jia, R.; Liu, J.; Jia, R. A study of factors that influence the hydration activity of mono-component CaO and bi-component CaO/Ca2Fe2O5 systems. Cem. Concr. Res. 2017, 91, 123–132. [Google Scholar] [CrossRef]
- Wang, G.C. 13-Slag use in cement manufacture and cementitious applications. In The Utilization of Slag in Civil Infrastructure Construction; Wang, G.C., Ed.; Woodhead Publishing: Sawston, UK, 2016; pp. 305–337. [Google Scholar]
- Wang, Y.; Suraneni, P. Experimental methods to determine the feasibility of steel slags as supplementary cementitious materials. Constr. Build. Mater. 2019, 204, 458–467. [Google Scholar] [CrossRef]
- Zhuang, S.; Wang, Q. Inhibition mechanisms of steel slag on the early-age hydration of cement. Cem. Concr. Res. 2021, 140, 106283. [Google Scholar] [CrossRef]
- Zhao, J.; Li, Z.; Wang, D.; Yan, P.; Luo, L.; Zhang, H.; Zhang, H.; Gu, X. Hydration superposition effect and mechanism of steel slag powder and granulated blast furnace slag powder. Constr. Build. Mater. 2023, 366, 130101. [Google Scholar] [CrossRef]
- Song, W.; Zhu, Z.; Peng, Y.; Wan, Y.; Xu, X.; Pu, S.; Song, S.; Wei, Y. Effect of steel slag on fresh, hardened and microstructural properties of high-calcium fly ash based geopolymers at standard curing condition. Constr. Build. Mater. 2019, 229, 116933. [Google Scholar] [CrossRef]
- Song, W.; Zhu, Z.; Pu, S.; Wan, Y.; Hu, L. Efficient use of steel slag in alkali-activated fly ash-steel slag-ground granulated blast furnace slag ternary blends. Constr. Build. Mater. 2020, 259, 119814. [Google Scholar] [CrossRef]
- ASTM C151-09; Test Method for Autoclave Expansion of Hydraulic Cement. American Society for Testing and Materials: West Conshohocken, PA, USA, 2009.
- GB/T 1346-2011; Test Methods for Water Requirement of Normal Consistency, Setting Time and Soundness of the Portland Cement. Standards Press of China: Beijing, China, 2011.
- GB/T 8077-2012; Methods for Testing Uniformity of Concrete Admixture. Standards Press of China: Beijing, China, 2012.
- GB/T 17671-1999; Method of Testing Cements—Determination of Strength. Standards Press of China: Beijing, China, 1999.
- ISO 14040; Environment Management—Life Cycle Assessment—Principles and Framework. Technical Committee ISO/TC 207: Geneva, Switzerland, 2006.
- Kim, M.J.; Ishida, T.; Cho, W.J. Characteristics of micro structure and strength development of alkali activated GGBS-FNS hybrid cement. Constr. Build. Mater. 2023, 408, 133773. [Google Scholar] [CrossRef]
- Bílek, V.; Novotný, R.; Koplík, J.; Kadlec, M.; Kalina, L. Philosophy of rational mixture proportioning of alkali-activated materials validated by the hydration kinetics of alkali-activated slag and its microstructure. Cem. Concr. Res. 2023, 168, 107139. [Google Scholar] [CrossRef]
- Antzaras, A.N.; Papalas, T.; Heracleous, E.; Kouris, C. Techno–economic and environmental assessment of CO2 capture technologies in the cement industry. J. Clean. Prod. 2023, 428, 139330. [Google Scholar] [CrossRef]
- Long, W.-J.; Tan, X.-W.; Xiao, B.-X.; Han, N.-X.; Xing, F. Effective use of ground waste expanded perlite as green supplementary cementitious material in eco-friendly alkali activated slag composites. J. Clean. Prod. 2019, 213, 406–414. [Google Scholar] [CrossRef]
- Rivera, J.F.; de Gutiérrez, R.M.; Ramirez-Benavides, S.; Orobio, A. Compressed and stabilized soil blocks with fly ash-based alkali-activated cements. Constr. Build. Mater. 2020, 264, 120285. [Google Scholar] [CrossRef]
- Wang, Y.; Cao, Y.; Zhang, Z.; Huang, J.; Zhang, P.; Ma, Y.; Wang, H. Study of acidic degradation of alkali-activated materials using synthetic C-(N)-A-S-H and N-A-S-H gels. Compos. Part B 2022, 230, 109510. [Google Scholar] [CrossRef]
- Schade, T.; Bellmann, F.; Middendorf, B. Quantitative analysis of C-(K)-A-S-H-amount and hydrotalcite phase content in finely ground highly alkali-activated slag/silica fume blended cementitious material. Cem. Concr. Res. 2022, 153, 106706. [Google Scholar] [CrossRef]
- Quan, X.; Wang, S.; Liu, K.; Xu, J.; Zhao, N.; Liu, B. Evaluation of molybdenum tailings as replacement for fine aggregate in concrete: Mechanical, corrosion resistance, and pore microstructural characteristics. Constr. Build. Mater. 2022, 343, 127982. [Google Scholar] [CrossRef]
- Watson, A.T.; Chang, C.T.P. Characterizing porous media with NMR methods. Prog. Nucl. Magn. Reson. Spectrosc. 1997, 31, 343–386. [Google Scholar] [CrossRef]
- Li, Y.; Liu, X.; Sun, H.; Cang, D. Mechanism of phase separation in BFS (blast furnace slag) glass phase. Sci. China Technol. Sci. 2011, 54, 105–109. [Google Scholar] [CrossRef]
- Zhang, N.; Li, H.; Liu, X. Hydration mechanism and leaching behavior of bauxite-calcination-method red mud-coal gangue based cementitious materials. J. Hazard. Mater. 2016, 314, 172–180. [Google Scholar] [CrossRef] [PubMed]
- Xu, D.; Ni, W.; Wang, Q.; Xu, C.; Li, K. Ammonia-soda residue and metallurgical slags from iron and steel industries as cementitious materials for clinker-free concretes. J. Clean. Prod. 2021, 307, 127262. [Google Scholar] [CrossRef]
- Ji, X.; Wang, Z.; Zhang, H.; Wang, X.; Huo, J.; Zhang, T. Optimization design and characterization of slag cementitious composites containing carbide slag and desulfurized gypsum based on response surface methodology. J. Build. Eng. 2023, 77, 107441. [Google Scholar] [CrossRef]


| Composition | CaO | SiO2 | Al2O3 | Fe2O3 | SO3 | MgO | K2O | Na2O | Other | LOI |
|---|---|---|---|---|---|---|---|---|---|---|
| FA | 2.79 | 51.51 | 37.53 | 3.15 | 0.99 | 0.52 | 0.99 | 1.49 | 0.38 | 0.65 |
| GGBS | 39.46 | 31.17 | 15.01 | 0.28 | 0.59 | 8.91 | 0.28 | 0.46 | 2.53 | 1.31 |
| SS | 32.57 | 21.67 | 7.35 | 21.85 | 0.79 | 6.46 | 0.55 | 0.49 | 6.08 | 2.19 |
| Items | Baume | Na2O (%) | SiO2 (%) | H2O (%) | Density (g/mL) | Modulus |
|---|---|---|---|---|---|---|
| Results | 40 | 8.3 | 26.5 | 65.2 | 1.371 | 3.2 |
| Sample ID | Mix Proportion of Binder by Weight (g) | Ne (External Addition) | Water–Binder Ratio | ||
|---|---|---|---|---|---|
| SS | GGBS | FA | |||
| Control | 700 | 300 | 6.0% | 0.45 | |
| N4S10 | 100 | 600 | 4.0% (235.71 g modified Na2SiO3) | ||
| N4S20 | 200 | 500 | |||
| N4S30 | 300 | 400 | |||
| N4S40 | 400 | 300 | |||
| N4S50 | 500 | 200 | |||
| N6S10 | 100 | 600 | 6.0% (353.565 g modified Na2SiO3) | ||
| N6S20 | 200 | 500 | |||
| N6S30 | 300 | 400 | |||
| N6S40 | 400 | 300 | |||
| N6S50 | 500 | 200 | |||
| N8S10 | 100 | 600 | 8.0% (471.42 g modified Na2SiO3) | ||
| N8S20 | 200 | 500 | |||
| N8S30 | 300 | 400 | |||
| N8S40 | 400 | 300 | |||
| N8S50 | 500 | 200 | |||
| Raw Materials | FA | SS | GGBS | NaOH | Na2SiO3 | Water | OPC |
|---|---|---|---|---|---|---|---|
| GWP (kg CO2- eq/kg) | 4.00 × 10⁻² | 6.30 × 10⁻² | 7.51 × 10⁻² | 1.48 × 100 | 8.23 × 10⁻¹ | 2.14 × 10⁻³ | 8.49 × 10⁻¹ |
| Raw Materials | Abiotic Resource Depletion Potential (ADP) | Acidification Potential (AP) | Eutrophication Potential (EP) |
|---|---|---|---|
| kg Sb- eq/kg | kg SO2- eq/kg | kg PO4- eq/kg | |
| FA | 3.29 × 10⁻¹⁰ | 7.26 × 10⁻⁶ | 1.05 × 10⁻⁶ |
| SS | 4.47 × 10⁻⁴ | 3.32 × 10⁻⁴ | 2.17 × 10⁻⁴ |
| GGBS | 6.00 × 10⁻⁴ | 5.58 × 10⁻⁴ | 1.38 × 10⁻⁴ |
| NaOH | 1.04 × 10⁻² | 6.87 × 10⁻³ | 2.81 × 10⁻³ |
| Na2SiO3 | 6.26 × 10⁻³ | 6.53 × 10⁻³ | 1.68 × 10⁻³ |
| Water | 1.34 × 10⁻⁶ | 1.29 × 10⁻⁶ | 2.28 × 10⁻⁷ |
| OPC | 2.15 × 10⁻³ | 1.86 × 10⁻³ | 5.25 × 10⁻⁴ |
| Samples | T2 Spectral Area | Peak 1 | Peak 2 | Peak 3 | |||
|---|---|---|---|---|---|---|---|
| Area | Proportion | Area | Proportion | Area | Proportion | ||
| N4S10 | 3012.396 | 2666.22 | 88.508 | 333.894 | 11.084 | 12.282 | 0.408 |
| N4S50 | 3193.792 | 2920.092 | 91.43 | 235.942 | 7.388 | 37.758 | 1.182 |
| N8S10 | 2866.567 | 2558.843 | 89.265 | 292.971 | 10.22 | 14.752 | 0.515 |
| N8S50 | 3065.423 | 2724.849 | 88.89 | 327.059 | 10.669 | 13.515 | 0.441 |
Disclaimer/Publisher’s Note: The statements, opinions and data contained in all publications are solely those of the individual author(s) and contributor(s) and not of MDPI and/or the editor(s). MDPI and/or the editor(s) disclaim responsibility for any injury to people or property resulting from any ideas, methods, instructions or products referred to in the content. |
© 2023 by the authors. Licensee MDPI, Basel, Switzerland. This article is an open access article distributed under the terms and conditions of the Creative Commons Attribution (CC BY) license (https://creativecommons.org/licenses/by/4.0/).
Share and Cite
Ji, X.; Wang, X.; Zhao, X.; Wang, Z.; Zhang, H.; Liu, J. Properties, Microstructure Development and Life Cycle Assessment of Alkali-Activated Materials Containing Steel Slag under Different Alkali Equivalents. Materials 2024, 17, 48. https://doi.org/10.3390/ma17010048
Ji X, Wang X, Zhao X, Wang Z, Zhang H, Liu J. Properties, Microstructure Development and Life Cycle Assessment of Alkali-Activated Materials Containing Steel Slag under Different Alkali Equivalents. Materials. 2024; 17(1):48. https://doi.org/10.3390/ma17010048
Chicago/Turabian StyleJi, Xin, Xiaofeng Wang, Xin Zhao, Zhenjun Wang, Haibao Zhang, and Jianfei Liu. 2024. "Properties, Microstructure Development and Life Cycle Assessment of Alkali-Activated Materials Containing Steel Slag under Different Alkali Equivalents" Materials 17, no. 1: 48. https://doi.org/10.3390/ma17010048
APA StyleJi, X., Wang, X., Zhao, X., Wang, Z., Zhang, H., & Liu, J. (2024). Properties, Microstructure Development and Life Cycle Assessment of Alkali-Activated Materials Containing Steel Slag under Different Alkali Equivalents. Materials, 17(1), 48. https://doi.org/10.3390/ma17010048