Article

The Impact of Surface Roughness on Conformal Cooling Channels for Injection Molding

1
Faculty of Technology, Tomas Bata University in Zlin, Vavreckova 5669, 760 01 Zlin, Czech Republic
2
Faculty of Chemical and Food Technology, Slovak University of Technology in Bratislava, Radlinskeho 9, 812 37 Bratislava, Slovakia
*
Author to whom correspondence should be addressed.
Materials 2024, 17(11), 2477; https://doi.org/10.3390/ma17112477
Submission received: 17 April 2024 / Revised: 3 May 2024 / Accepted: 16 May 2024 / Published: 21 May 2024
(This article belongs to the Special Issue Advances in Additive Manufacturing: Characteristics and Innovation)

Abstract

:
Injection molding technology is widely utilized across various industries for its ability to fabricate complex-shaped components with exceptional dimensional accuracy. However, challenges related to injection quality often arise, necessitating innovative approaches for improvement. This study investigates the influence of surface roughness on the efficiency of conformal cooling channels produced using additive manufacturing technologies, specifically Direct Metal Laser Sintering (DMLS) and Atomic Diffusion Additive Manufacturing (ADAM). Through a combination of experimental measurements, including surface roughness analysis, scanning electron microscopy, and cooling system flow analysis, this study elucidates the impact of surface roughness on coolant flow dynamics and pressure distribution within the cooling channels. The results reveal significant differences in surface roughness between DMLS and ADAM technologies, with corresponding effects on coolant flow behavior. Following that fact, this study shows that when cooling channels’ surface roughness is lowered up to 90%, the reduction in coolant media pressure is lowered by 0.033 MPa. Regression models are developed to quantitatively describe the relationship between surface roughness and key parameters, such as coolant pressure, Reynolds number, and flow velocity. Practical implications for the optimization of injection molding cooling systems are discussed, highlighting the importance of informed decision making in technology selection and post-processing techniques. Overall, this research contributes to a deeper understanding of the role of surface roughness in injection molding processes and provides valuable insights for enhancing cooling system efficiency and product quality.

1. Introduction

Injection molding technology stands as one of the most pervasive and continually advancing methods for processing plastics. Its applications span various industrial sectors, notably, the automotive, aerospace, and defense industries. The technology’s primary advantage lies in its capability to fabricate complex-shaped components with exceptional dimensional accuracy, especially in high-series production. This encompasses the production of thin-walled and thick-walled components, as well as products with complex geometries. However, challenges concerning injection quality can arise during the production of certain components, necessitating attention [1,2,3].
Addressing such challenges often involves employing specialized injection molding methods, like multi-component injection molding or injection compression molding (ICM). On the other hand, when traditional injection molding must be used, high requirements on mold design are present, especially on the cooling system design, to ensure uniform temperature distribution across the product surface. Temperature uniformity plays a pivotal role in ensuring dimensional stability and minimizing residual stresses. However, conventional manufacturing methods may fall short in ensuring temperature uniformity for uniquely shaped products, prompting the adoption of conformal cooling facilitated by additive manufacturing technologies. Following that fact, the usage of conformal cooling in the injection molding design is still higher, but problems connected to an additive manufacturing technology, such as surface roughness, have not been extensively researched in this field [1,2,3,4].
Current research predominantly revolves around conformal cooling, with efforts focused on enhancing cooling system efficiency. Several studies by Venkatesh et al., Deepika et al., Jahan et al., Dimla et al., Park et al., and Shen et al. have compared conventional cooling methods with those employing additive manufacturing technologies, primarily through simulations due to the relatively high cost of additive manufacturing of steel parts [1,2,3,4,5,6]. As mentioned before, the conformal cooling application has the closest match with parts that require precise dimensional stability and quality such as optical parts [7,8,9,10,11,12,13,14,15].
However, additive manufacturing presents its own challenges, such as low-quality surfaces and high roughness, which can impede flow in cooling channels and hinder heat transfer, as mentioned by Han et al., Galati et al., and Babu et al. [16,17,18]. This fact is closely connected with the principle of additive manufacturing itself. For example, Direct Metal Laser Sintering (DMLS) creates the structure by sequentially depositing layers of microscopic grains and using high-power laser beams to selectively melt the powder grains in each layer. Among others, this type of technology is also used in the nuclear energy industry for its precision [19,20]. One of the main challenges to the acceptance of DMLS in conformal cooling design is the appearance of microscopic porosity defects in 3D-printed metal structures. Such pores are an artifact of the metal additive manufacturing process involving rapid melting and solidification without well-defined boundary conditions [21]. Depending on the shape, size, and orientation relative to structure surfaces, porosity defects could lead to material crack formation and cause structural failure [22,23,24]. Scanning electron microscopy (SEM) is a suitable method for determining how these defects could be detected [25].
As another option, ADAM technology has great application potential in this field and can be used in conformal cooling production. Another aspect that could be positive is that ADAM does not have as high safety requirements as DMLS technology. However, DMLS is still the most widely used technology in the field of conformal cooling, but ADAM technology could be a suitable alternative method of conformal cooling manufacturing. Nevertheless, surfaces of 3D-printed structures exhibit very low quality with high values of surface roughness either in the use of DMLS or ADAM technology [26,27].
DMLS technology is commonly used for manufacturing injection molding conformal cooling systems, and on the other hand, ADAM technology is not often used in this field but has great potential in this application. However, ADAM technology requires other additional steps after printing, such as washing out the binder. This can cause the creation of air capsules inside the part, which has a negative impact on the cooling effectivity. This fact is not in the scope of this study, and surely future research is necessary. Due to these aspects, this study is focused just on these two types of AM technologies and the surface roughness connected with these two types of AM technologies [26,27].
To optimize additive technologies for injection mold cooling, further processing of channel surfaces to reduce roughness is imperative, and these facts are discussed by Han et al., Günther et al., and Dumas et al. [28,29,30]. As conventional types of surface finishing are not suitable to use on internal surfaces, such as cooling channels, on the other hand, Abrasive Flow Machining (AFM) emerges as a suitable method for finishing internal channels produced using additive technologies [31,32,33,34]. However, AFM technology needs to be deeply researched in the field of injection molding.
Overall, the main task of this study is to verify the influence of the cooling channels’ surface roughness made by DMLS and ADAM technology on the total cooling systems’ effectivity and closely describe a possible benefit of the usage of finishing operations of the internal surfaces for the purpose of lowering surface roughness.

2. Materials and Methods

2.1. Overview of the Experiment

The experimental part is primarily focused on how surface roughness influences the efficiency of the conformal cooling channels. However, this experiment contains a roughness measurement of the test specimens made by additive technologies and also deals with a cooling channel flow analysis and evaluation of the measured data.

2.2. Materials and Equipment

The choice of which material can be used for the test specimens is limited by additive technology or the fact that the production of the injection mold cavities uses mainly tool steels. All these aspects had to be taken into mind and applied to the choice of material. Following the facts, the tool steel was chosen. The selected technologies and equipment for the fabrication of the test specimens are EOS M 290 (Direct Metal Laser Sintering—DMLS technology, EOS GmbH, Krailling, Germany) and Markforged Metal X (Atomic Diffusion Additive Manufacturing—ADAM technology, Markforged, Waltham, MA, USA).
Roughness measurements were performed using a Zygo Newview 8000 optical surface profiler (Lambda Photometrics, Harpenden, UK). However, for successful measurement, the test specimens had to be turned using the DMG MORI-NTX 1000 CNC machining center for turning and milling (DMG MORI USA, Hoffman Estates, IL, USA).
Scanning electron microscopy images were performed using Phenom XL G2 (Thermo Fisher Scientific, Waltham, MA, USA).
Cooling system flow analysis was performed using Moldex3D (version R14.0).

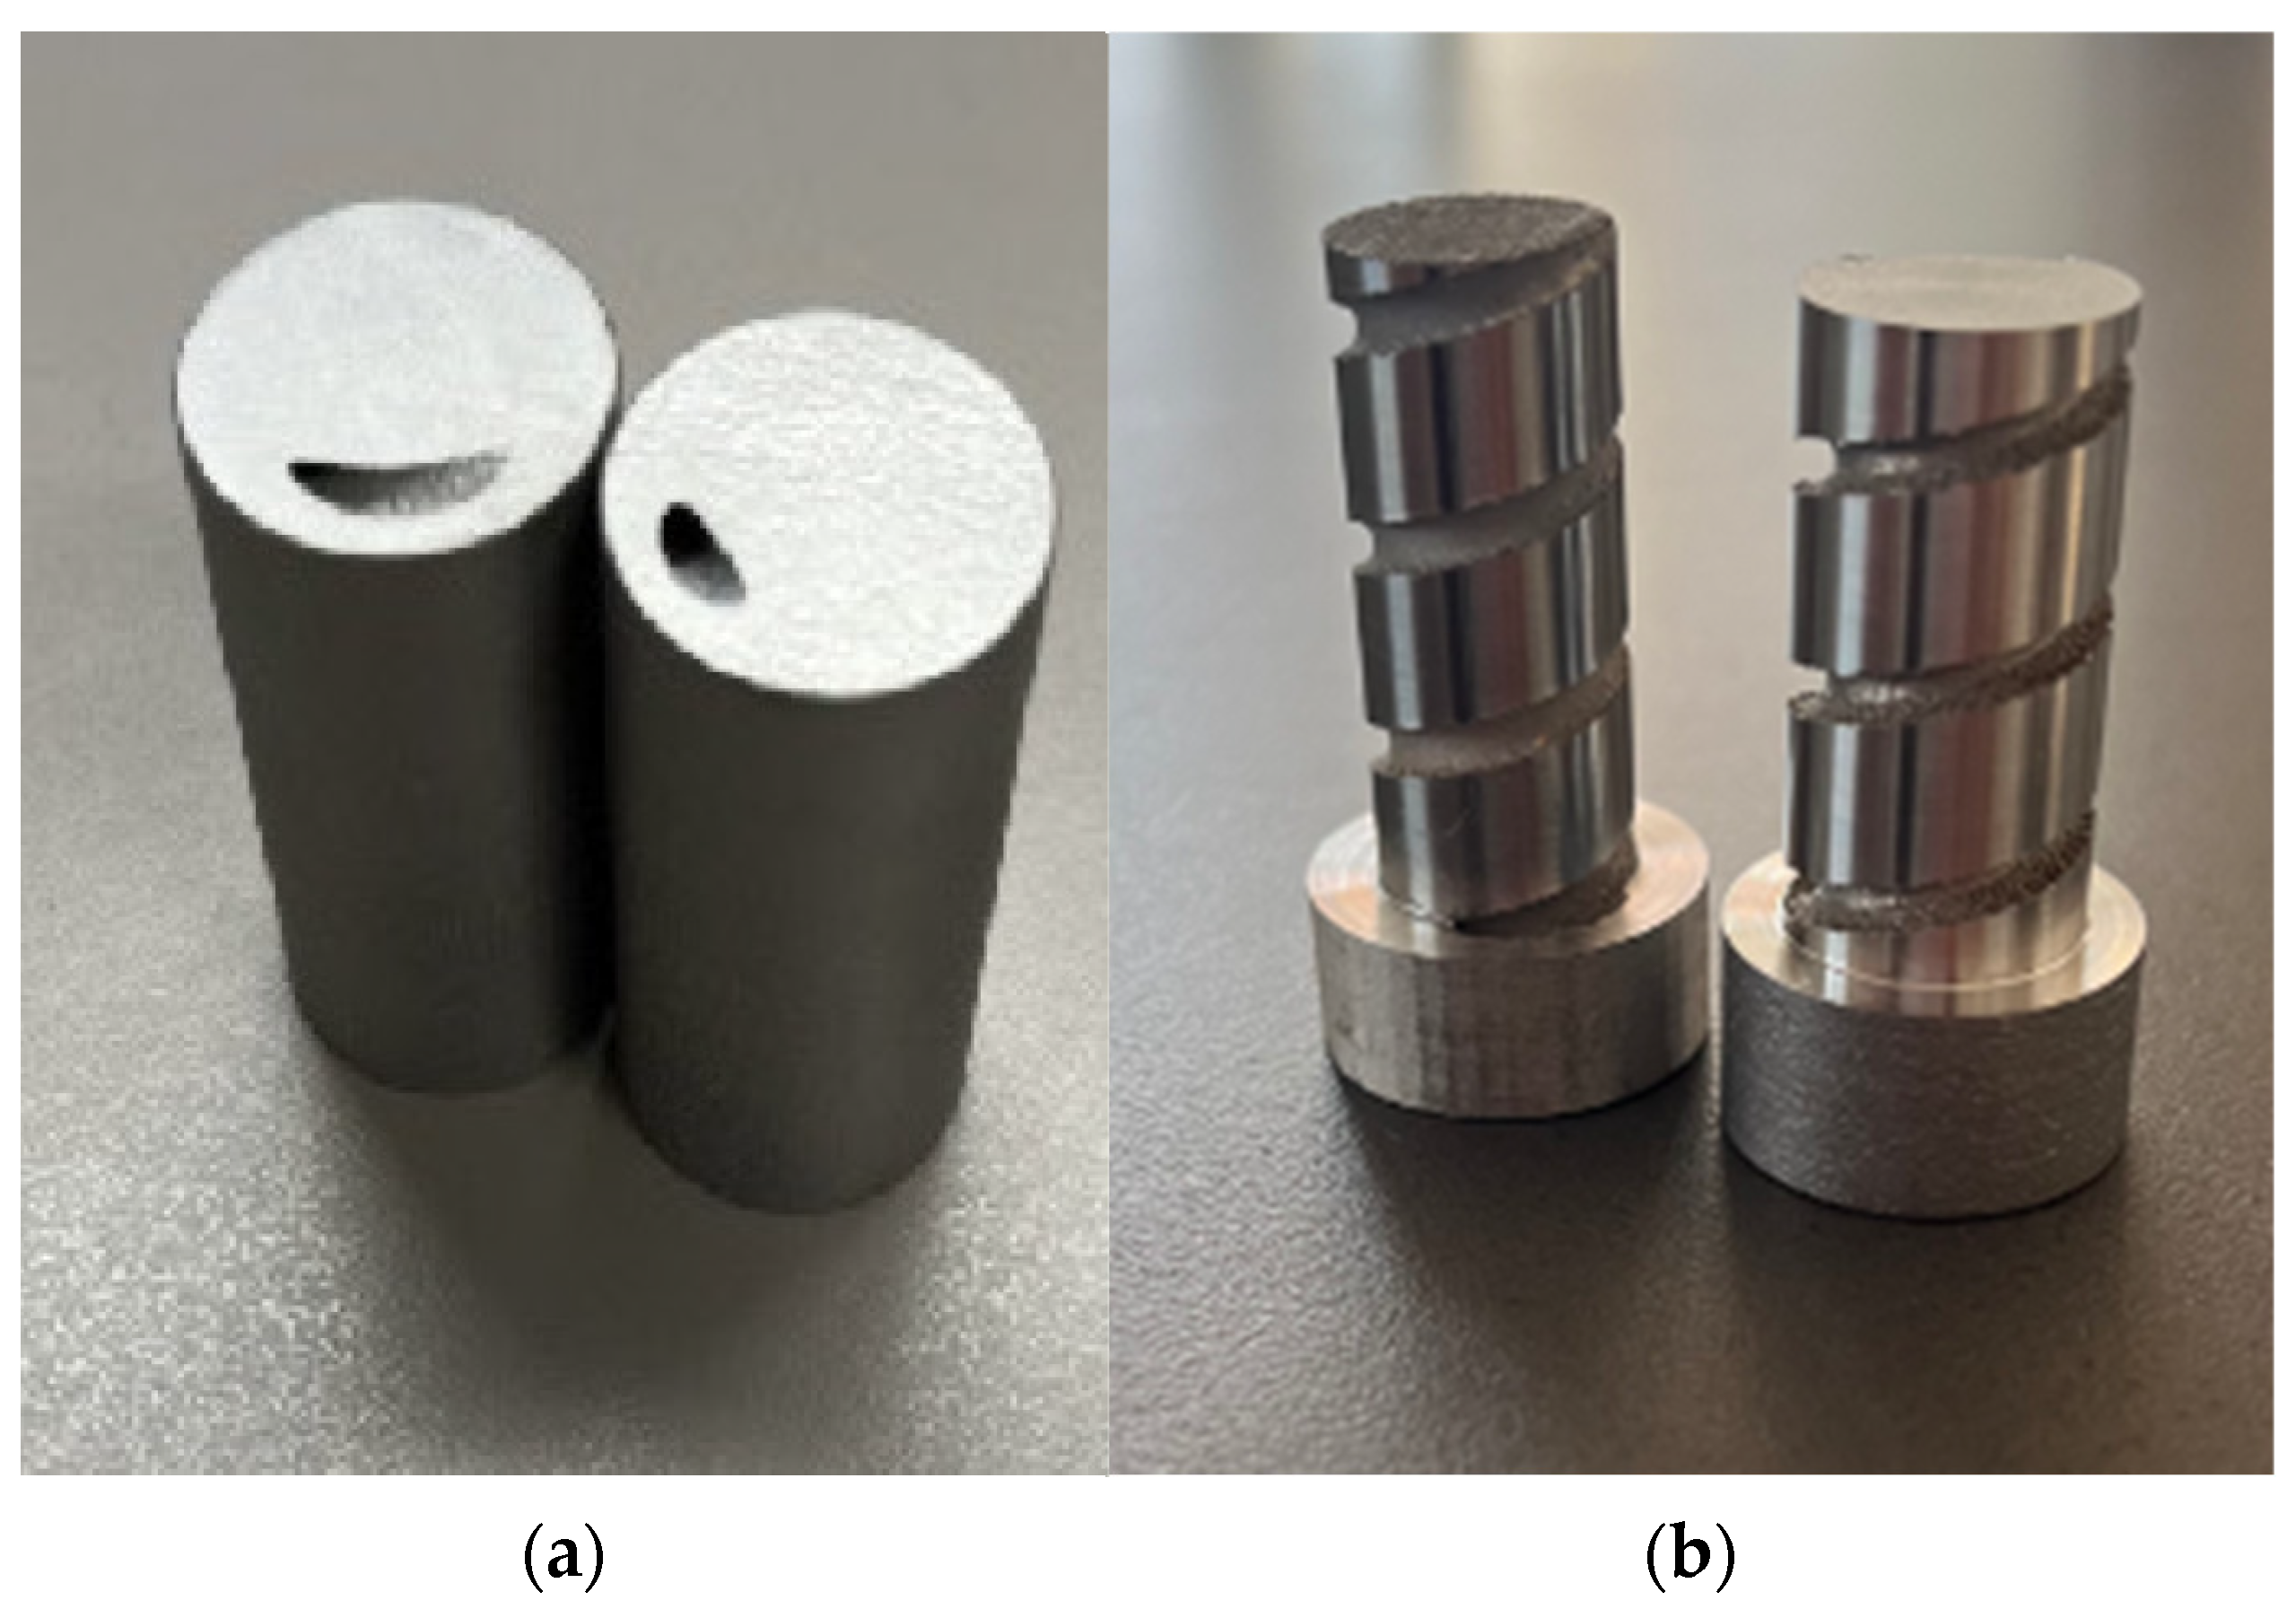
2.3. Test Specimens’ Design

Real injection mold cavities made by additive technology are relatively expensive in contrast to conventional manufacturing. Internal surface roughness measurement requires the destruction of the injection mold cavity. Due to this fact, the test specimens were designed. However, the idea of the test specimen design is inspired by the research of Han et al. [30]. These specimens substitute real injection mold cooling channels. Conformal cooling channels are made in these test specimens. The diameter of the cooling channel in this test specimen is 3 mm, and the channel has a helix pattern with a pitch of 10 mm.
Machining of the test specimen is required for successful surface roughness measurement. Turning on a machining center was chosen as the appropriate method for this step. Machined test specimens are shown in Figure 1.

2.4. Internal Surface Roughness Measurement

As was mentioned before, one of the main goals of this research was to measure the internal surface roughness of the test specimens, simulating real conformal cooling channels. It was crucial to set a measurement procedure. First of all, fabricated test specimens had to be turned on the CNC machine because of exposure to the cooling channel inside of the test specimen. Next, the exposed cooling channel was scanned by an optical surface profiler along its length, and this means that each test specimen (specimen A—DMLS, specimen B—ADAM) was measured in five different places. Every one of the five measurements was translated from a curved surface to a flat surface and sliced up to fifty slices. Right after, parameters such as average roughness (Ra) and profile height (Rz) were evaluated. The Rz parameter is especially important for following cooling analyses. It is obvious that high peaks in the surface roughness affect the flow behavior of coolant media through the channel.

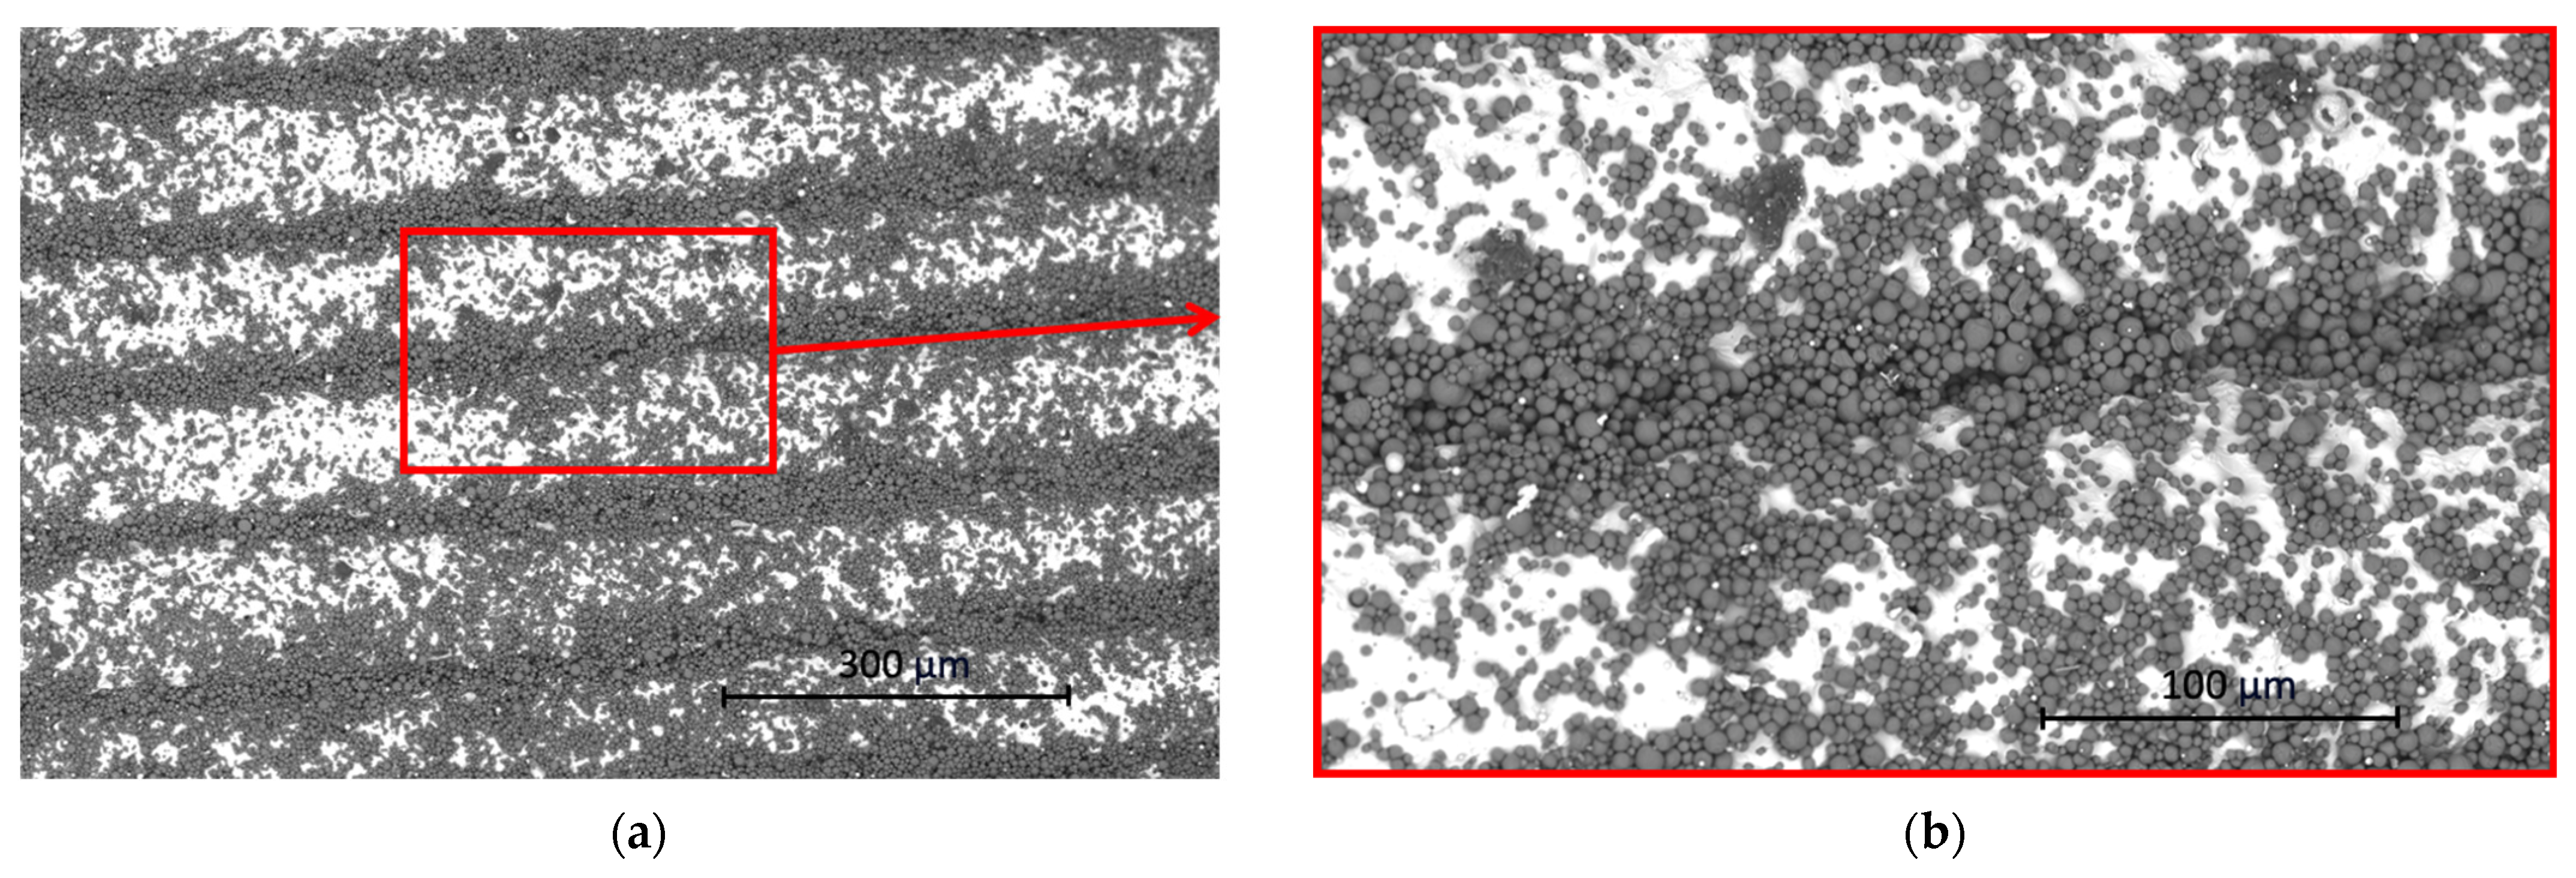
2.5. Scanning Electron Microscopy

Scanning electron microscopy could reveal porosity defects in the specimens. In this case, multiple images of the uncovered cooling channel of both specimens A and B have been taken. The voltage used during measurement was 10 kV.

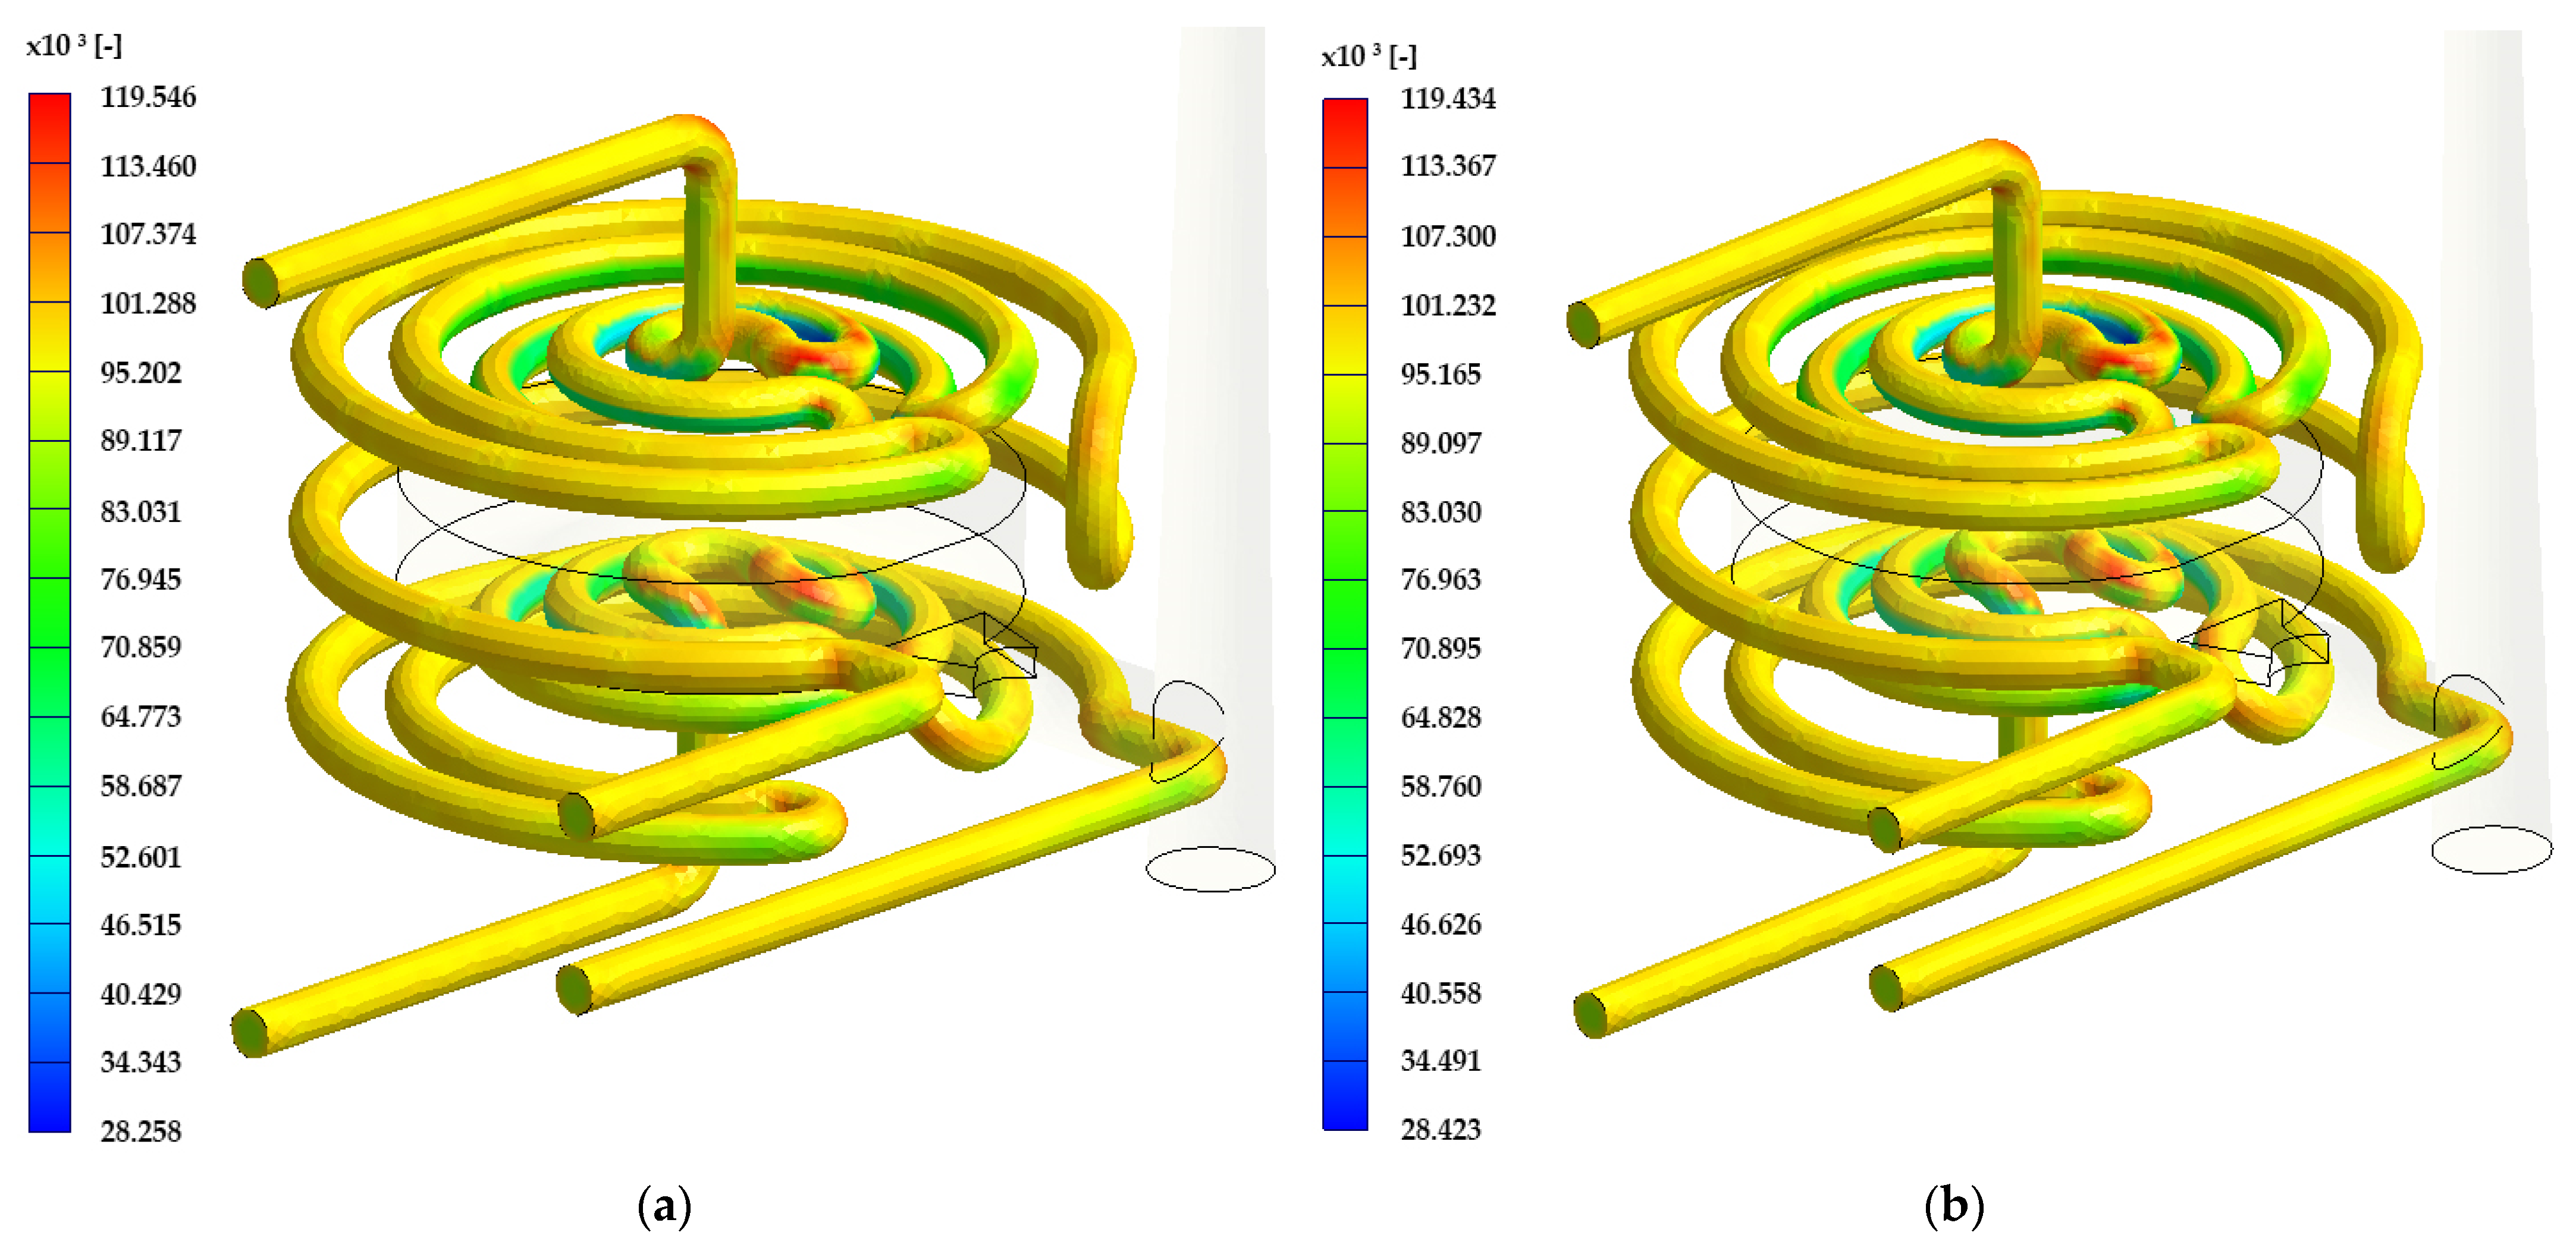
2.6. Cooling System Flow Analysis

Performing the cooling system analysis was the next step in this research. It was important to closely simulate the process of the internal surface finishing because the Rz parameter of the finished surface roughness of the test specimens’ cooling channels is unknown. To achieve this, the default value of the Rz parameter was set as the value reached by the surface roughness measurement mentioned above. This default value was lowered by 10% until it reached a 90% smaller value of Rz. For each value of the Rz parameter, a single analysis was computed. Other process parameters were constant in all analyses.
Cooling channel analysis provides selected data, such as pressure along the cooling circuit or coolant media flow velocity.
It is important to mention that all the analyses were performed on the real injection molded optical part.

Analysis Parameters

Selected analysis parameters were constant in all performed analyses and are mentioned in Table 1 below.

3. Results

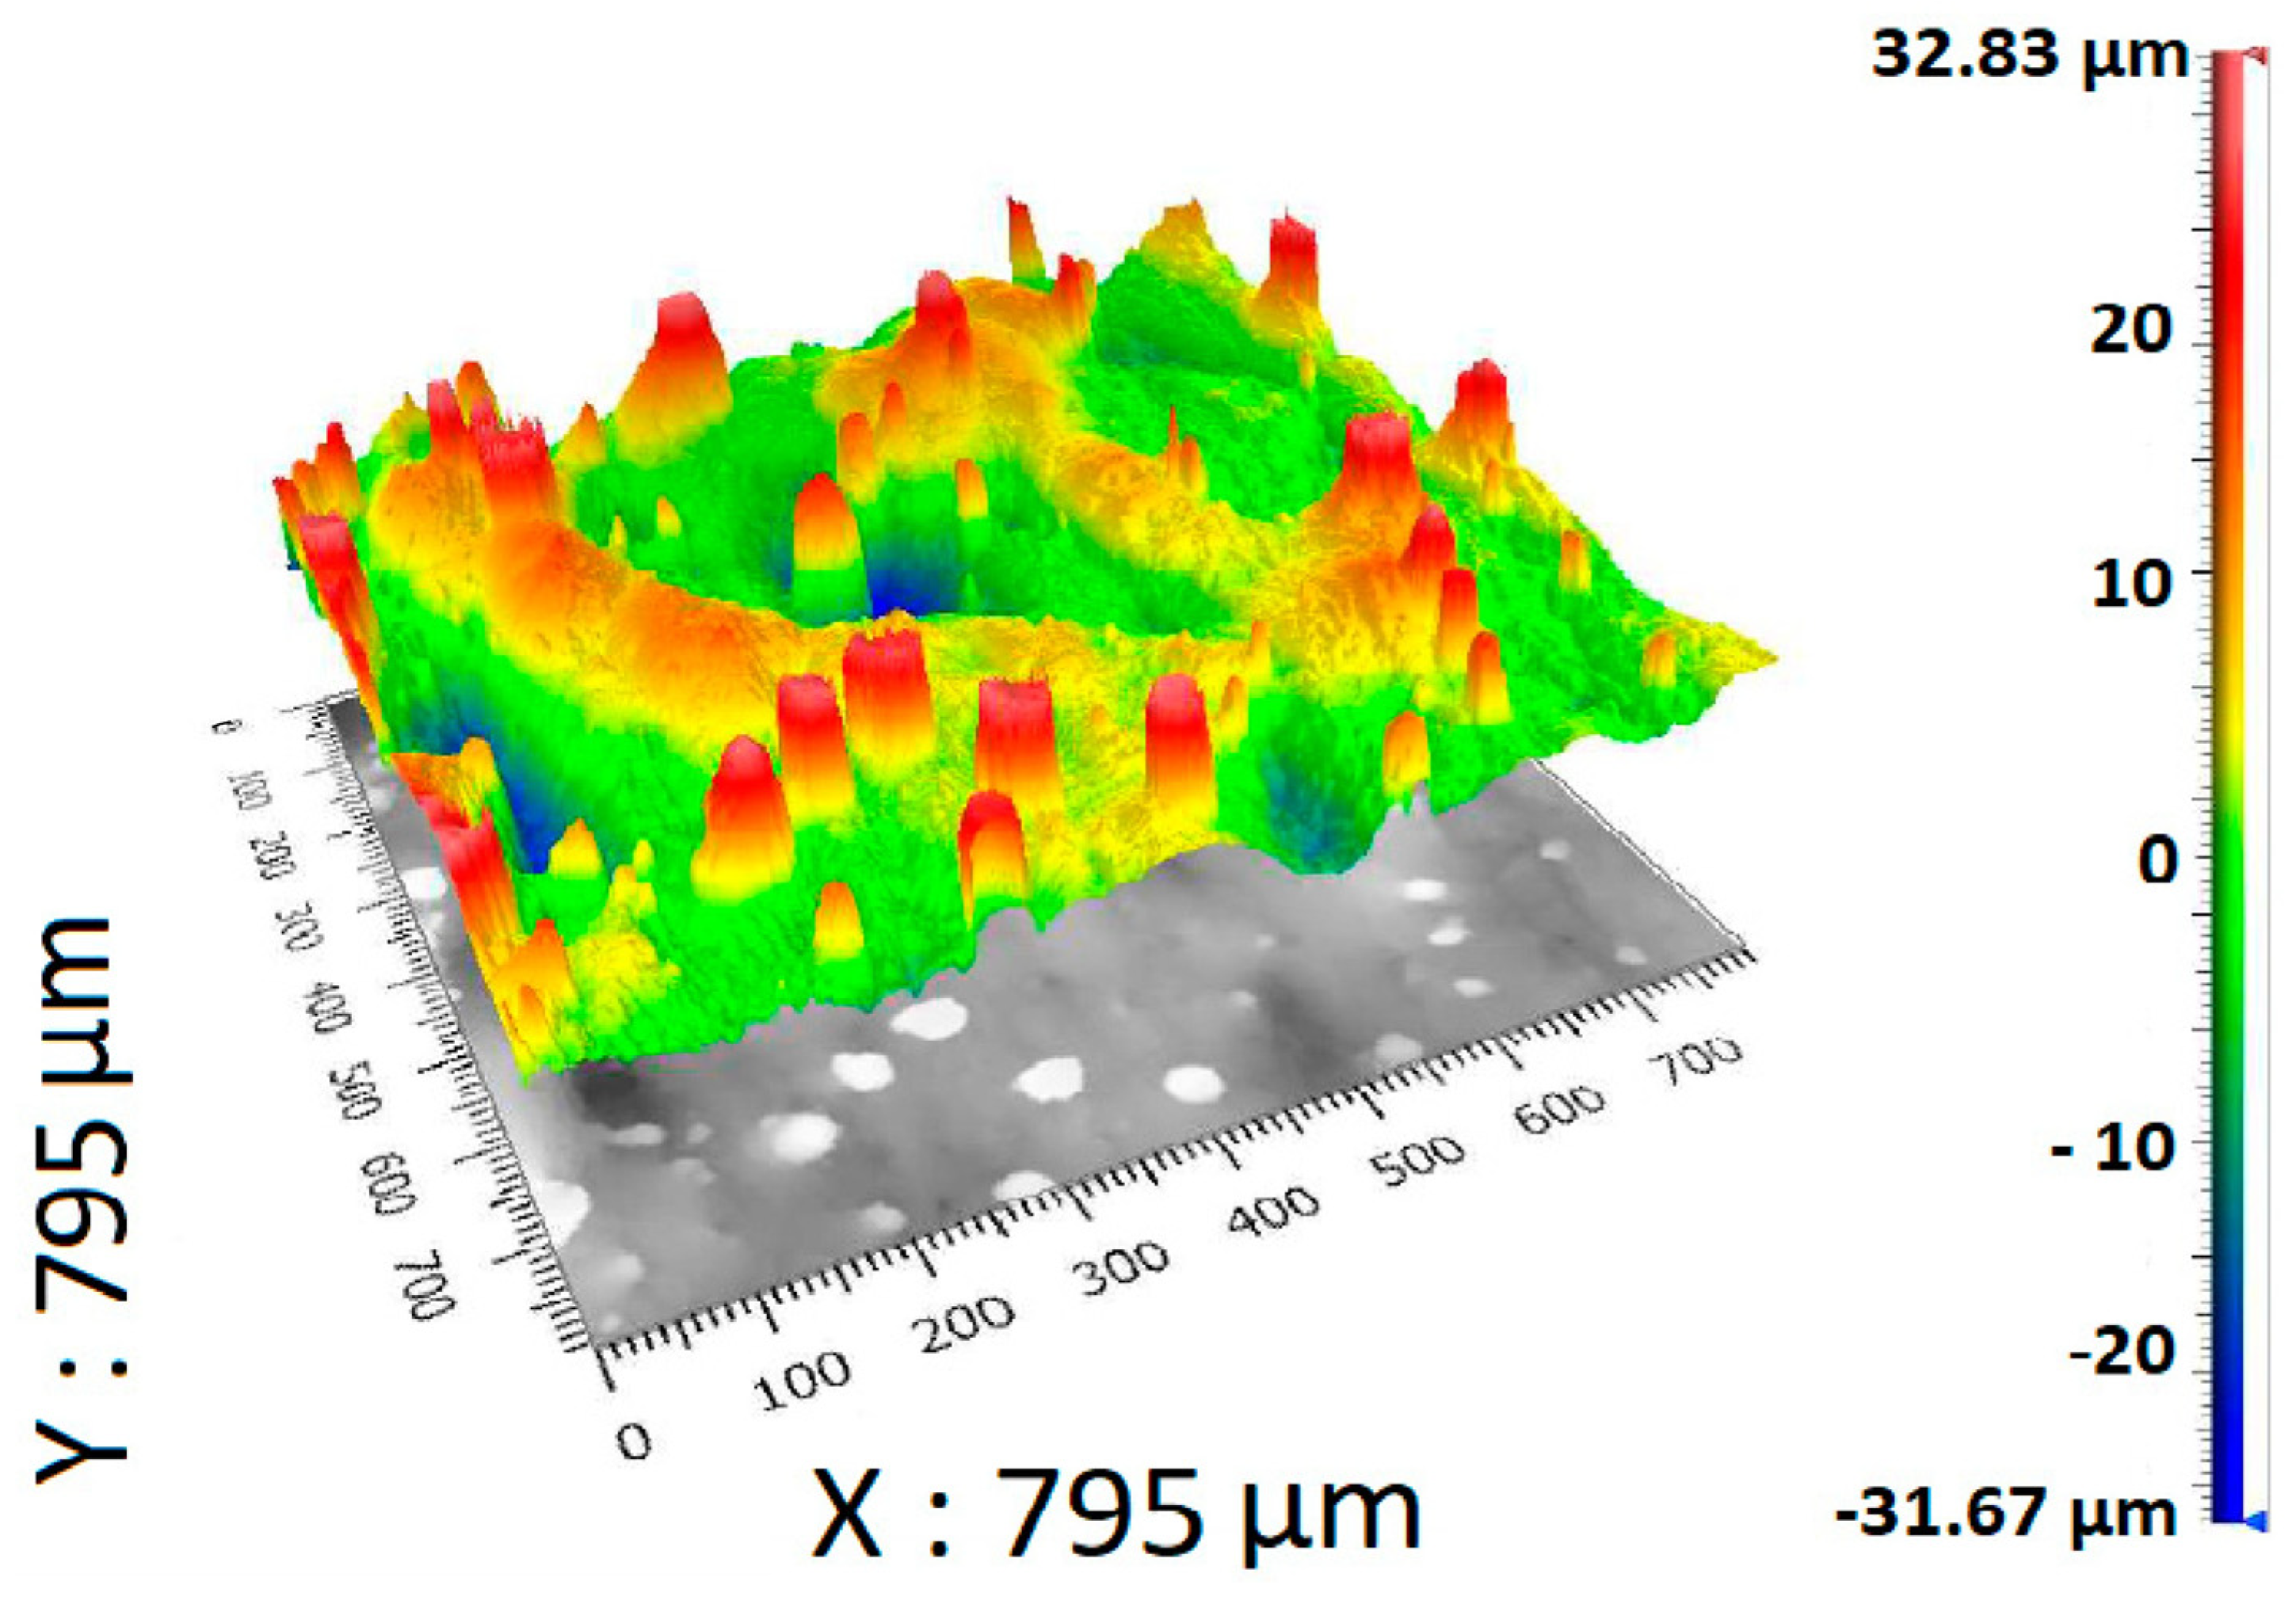
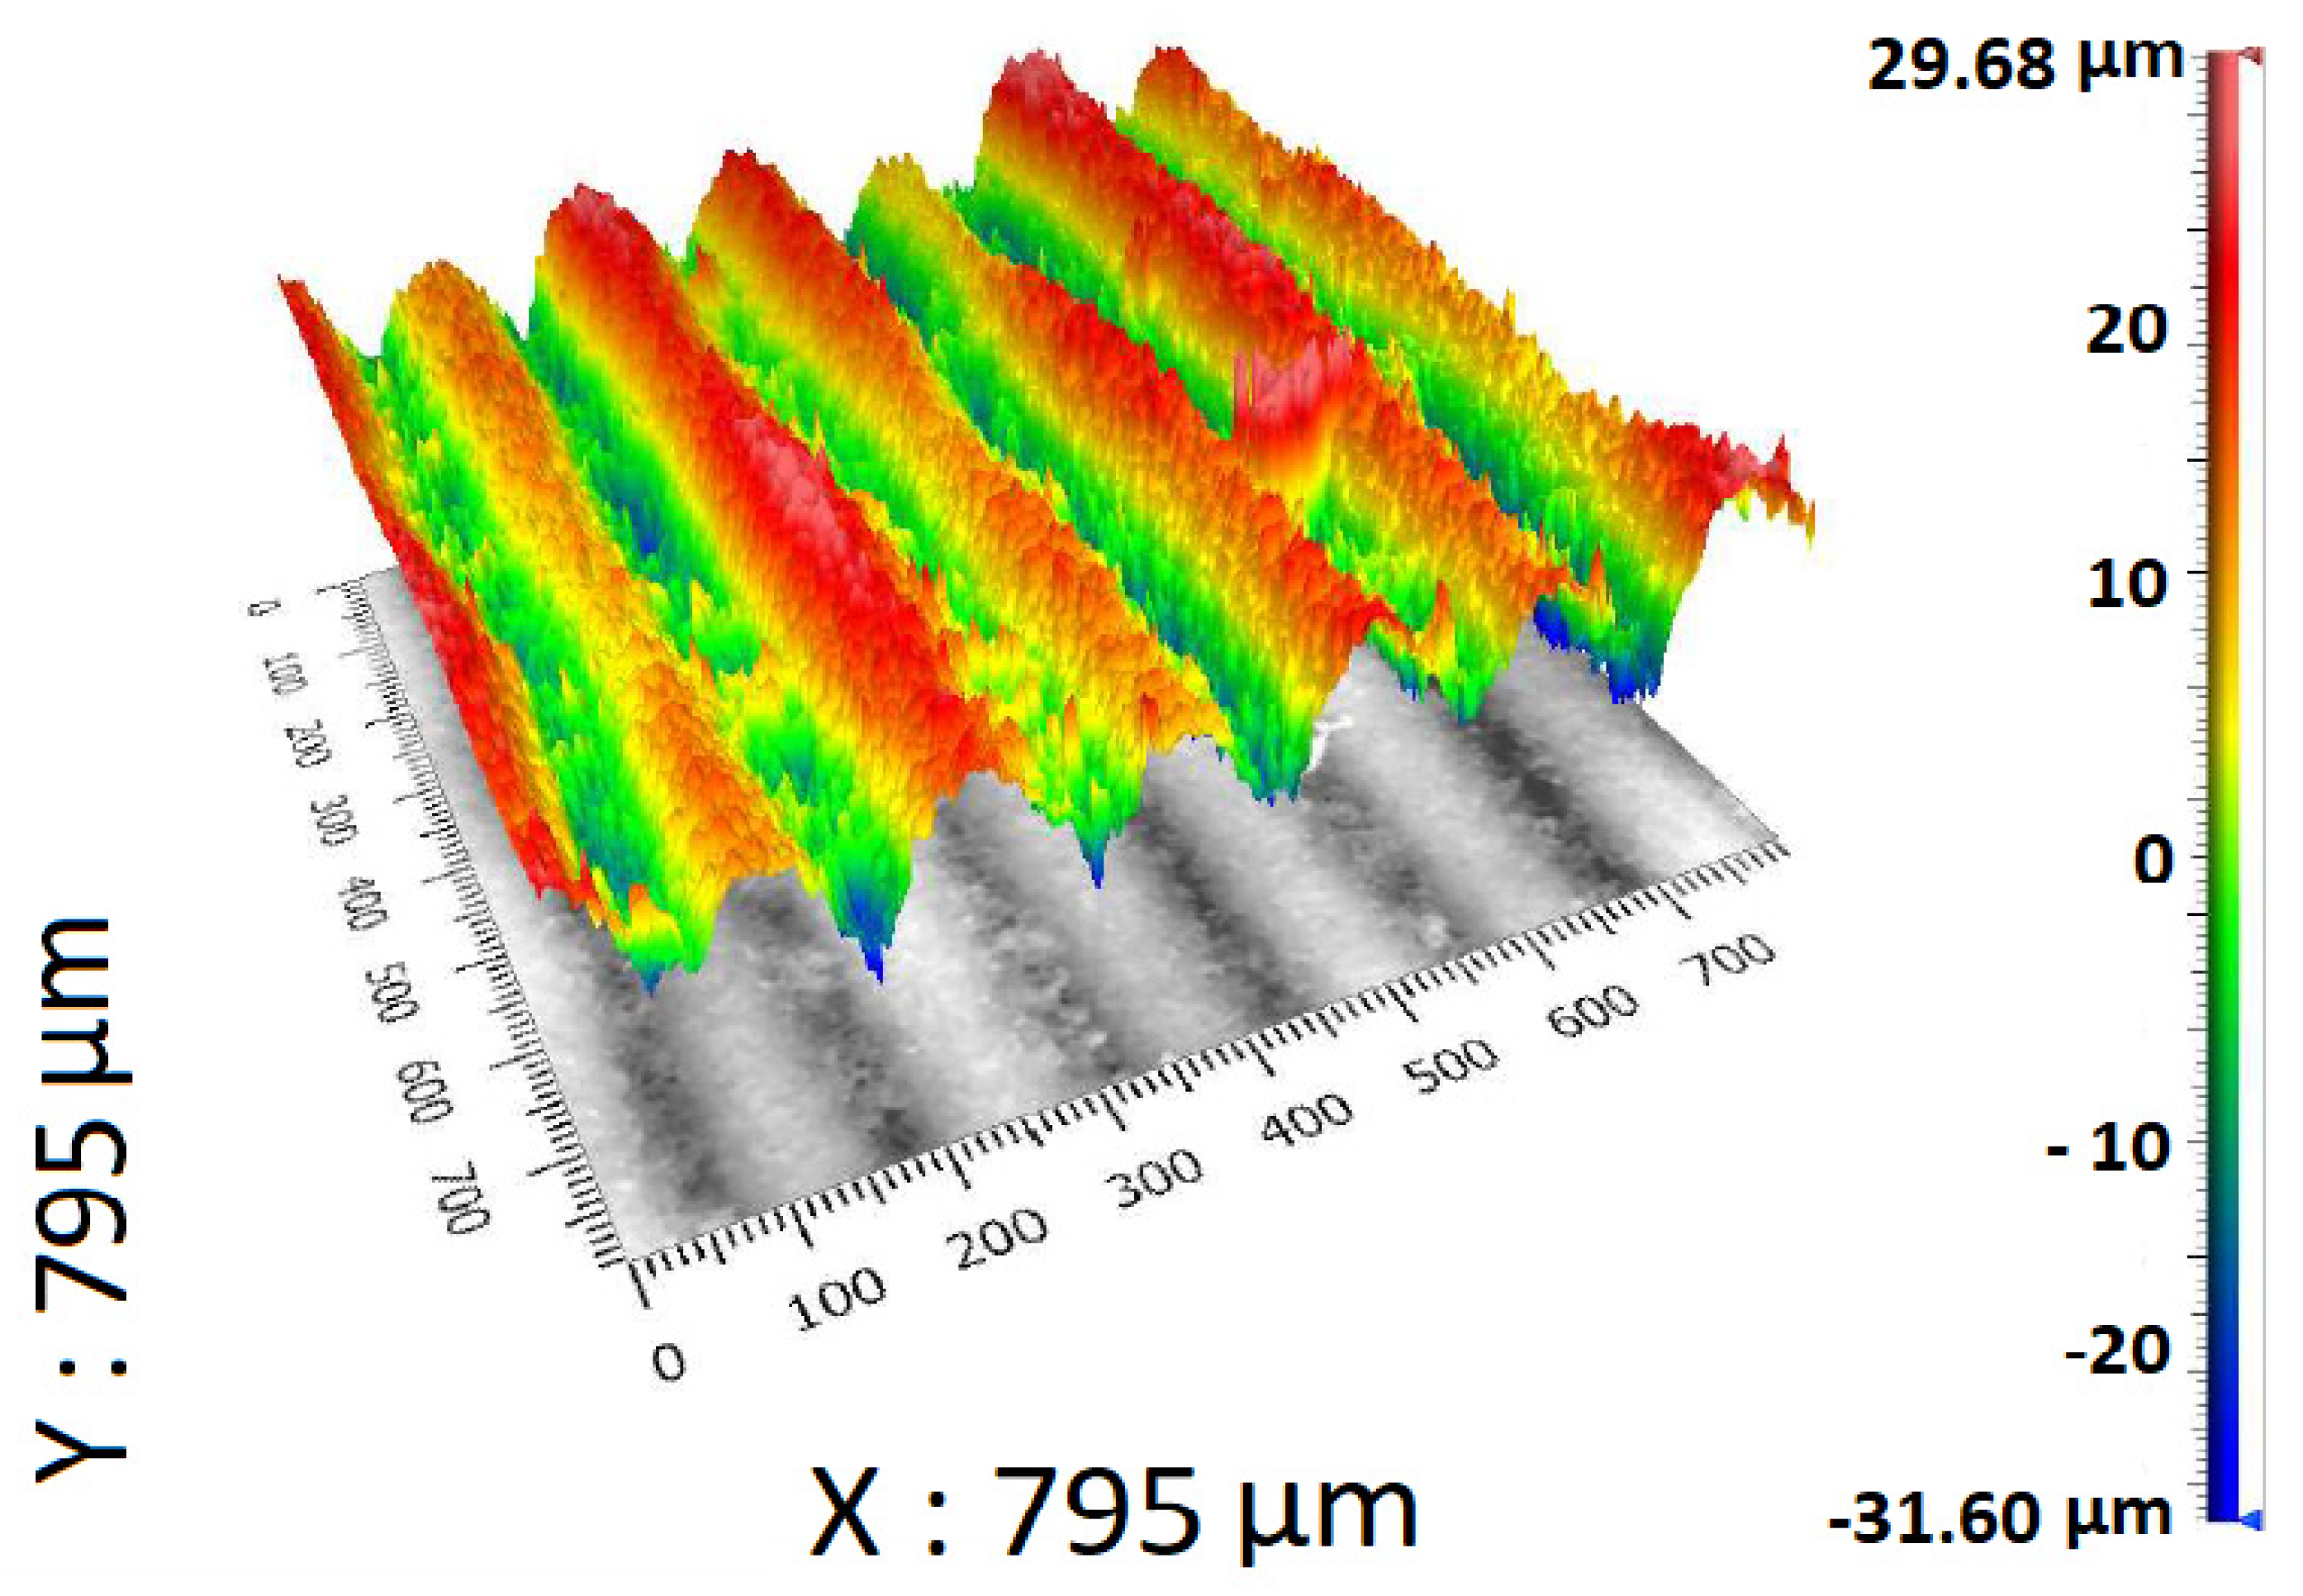
3.1. Internal Surface Roughness Measurement

The arithmetic mean of the Rz parameter was selected as a characteristic statistic parameter used for analysis. Its statistical significance was verified by estimating the coefficients of variation. Next, the estimated arithmetic means were recalculated to values of transformed arithmetic means using Box–Cox transformation, which is commonly used in engineering practice for this purpose [35].
The created surface scan can be interpreted as having a plane through the surface, which is interpreted as a zero in the scale on the right. However, this is a zero determined by statistical methods, namely, the least squares method. This means that all positive roughness values are scaled up to a maximum, which is colored red, while values below the plane are scaled in green and blue. A higher saturation of a given color or color combination then indicates a greater distance from the zero plane.
A projection of the measured data of specimen A is shown in Figure 2. The topology of the surface made by DMLS technology is shown in Figure 2, as well as values of the surface roughness.
Figure 2 shows the maximal and minimal measured values of surface roughness. In this case, the maximal value is 32.83 μm, and the minimal value is −31.67 μm. High peaks of the measured surface are colored red.
Figure 3 shows the maximal and minimal values of the measured surface. It is obvious that the maximal value is 29.68 μm and the minimal value is −31.60 μm. As was mentioned before, the topology of specimen B’s surface is dramatically different in comparison to the surface of specimen A. However, this type of surface shown in Figure 3 closely corresponds with ADAM technology.
Data in Figure 4 prove that the surface of specimen A and specimen B is topologically different, and this is caused by a type of additive technology. It is obvious that two topologically different surfaces are in the same general range of Rz and are not extremely different from each other.
Table 2 shows values of transformed arithmetic means of the Rz parameter, and these values are used during analyses as default values of the Rz parameter.

3.2. Scanning Electron Microscopy

A dense and uniform microstructure is a key to efficient cooling in injection mold inserts, as it ensures high thermal conductivity. Typically, a fine-grain structure with low porosity is preferred for optimal heat transfer. Incorporating complex geometries, like conformal cooling channels, can also improve cooling efficiency. The manufacturing process parameters are also critical in achieving the desired microstructure.
Results obtained by SEM match with the measurements of internal surface roughness measurements. Specimen A shows the type of surface that corresponds with a surface created by DMLS technology and does not show any significant type of porosity defect. This type of surface can be seen in Figure 5. This type of AM technology shows that surface structure can contain unmelted particles of the metal powder. This fact also can be seen in Figure 5.
Figure 6 shows the surface of specimen B made by ADAM technology. As can be seen, the surface is rapidly different in contrast with specimen A. SEM images of specimen B do not show any type of porosity, which could lead to coolant media leakage into the injection mold cavity. The surface structure of specimen B shows obvious signs of layers. This is caused by ADAM technology itself. The principle of ADAM technology is that parts are printed from filament and then sintered, and the principle is similar to FDM technology.

EDAX Analysis

The secondary output reached by SEM imaging was the elemental composition of the specimens. As can be seen in Table 3, the elemental composition of specimen A qualitatively corresponds with tool steel 1.2709, which is the tool steel used for specimen A fabrication. On the other hand, Table 4. shows the elemental composition of specimen B, which qualitatively matches tool steel 1.2344. This type of tool steel was used for specimen B fabrication.

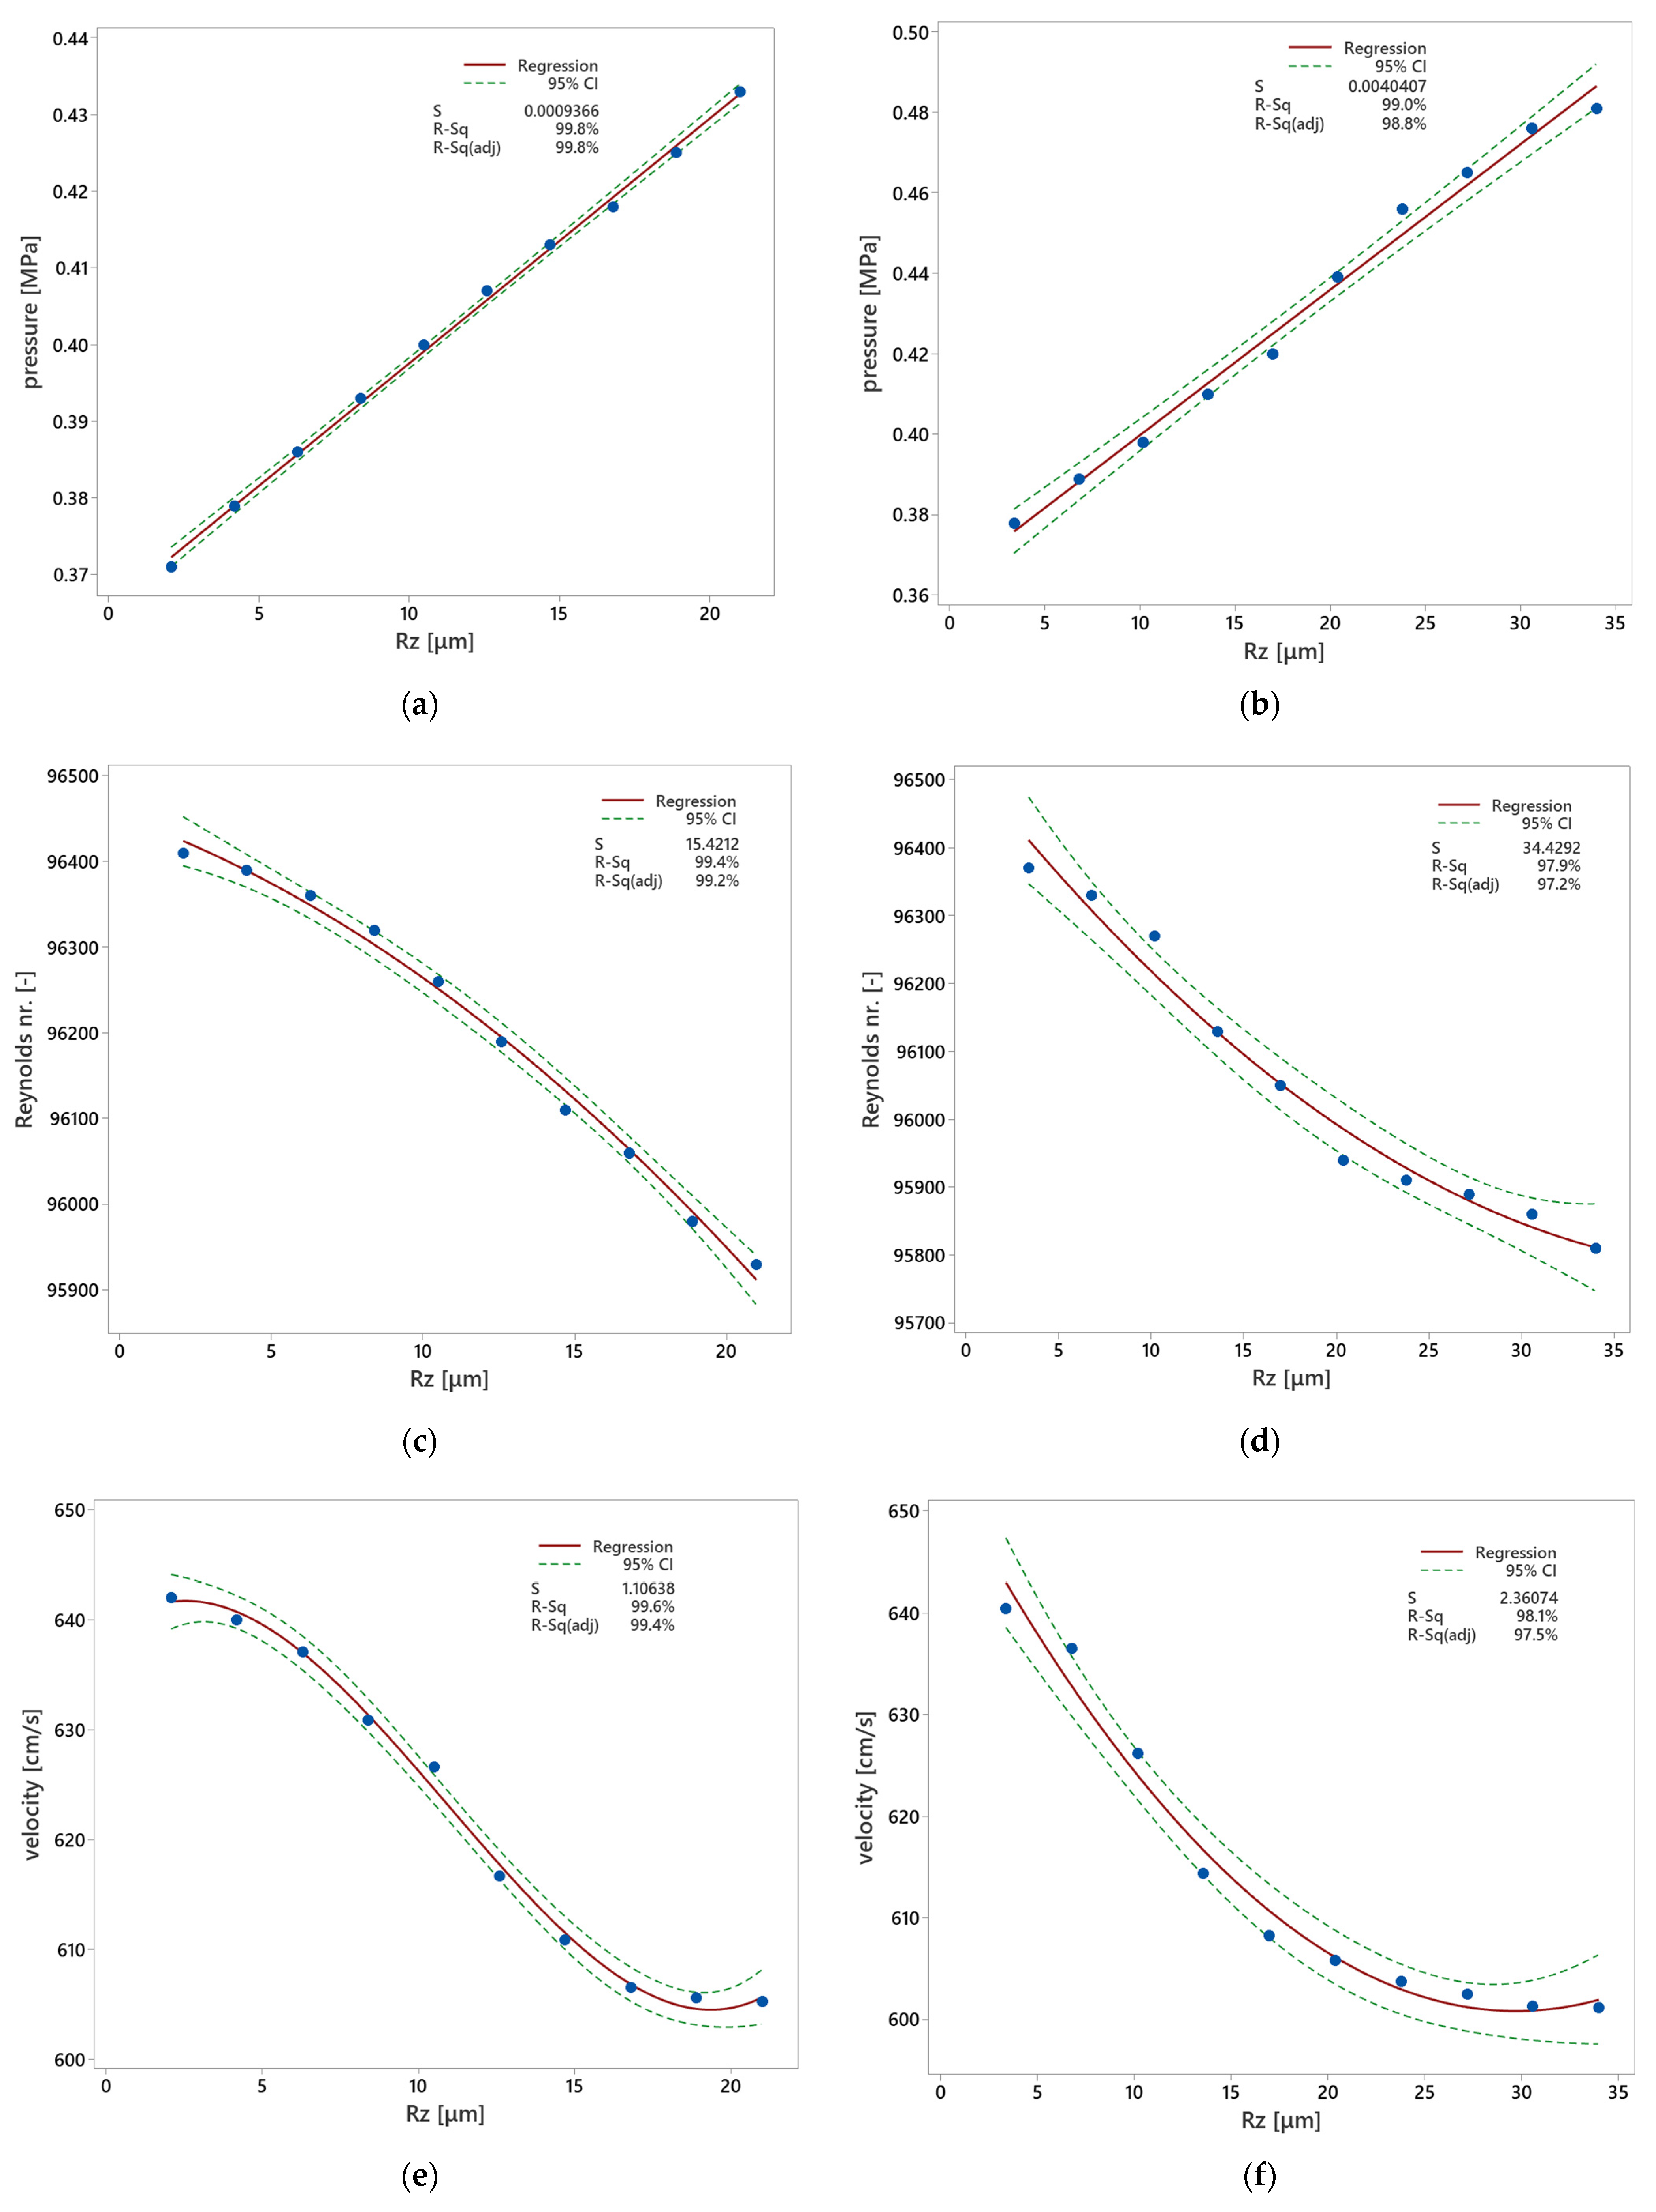
3.3. Cooling System Flow Analysis

Coolant pressure, Reynolds number, and streamline total velocity are the parameters that were evaluated. The surface roughness of the cooling channel influences all these parameters mentioned above. The visualization of the mentioned parameters is shown in the figures below, and values of every parameter for each Rz parameter are summarized in Table 5 and Table 6.
As can be seen in Figure 7, the maximal value of the coolant pressure is 0.481 MPa for Rz = 34 μm. This value decreases with the channel length from the inlet to the outlet of the cooling circuit. This maximal pressure value in the cooling channel defines the minimal performance of the cooling unit. Such a high surface roughness of the channels creates flow resistance of the coolant media, and the pressure is then higher.
Figure 8 shows the Reynolds number throughout the channel length. The maximum value in the case of Rz 34 μm is 119.43 × 10³, and the average value of the Reynolds nr. is 95,810. As can be seen, most of the channel is covered by yellow color, which matches with an average value.
Flow velocity streamlines are shown in Figure 9 for the roughness parameter Rz = 34 μm and Rz = 21 μm. It is obvious that the maximal value of flow velocity is in the corners of the cooling channel and is equal to 1226.33 cm/s in the case of Rz = 34 μm.
Table 5 summarizes the computed data of all parameters mentioned above. The maximal value of the Rz parameter for DMLS technology is 21 μm and the minimal value of Rz is 2.1 μm, which is a value obtained by simulating the cooling channel finishing process, and this value is commonly reachable by conventional drilling. Coolant pressure decreases by lowering Rz. On the other hand, Reynolds nr. and flow velocity increase when Rz decreases.
Table 6 summarizes the computed data of all parameters mentioned above. The maximal value of the Rz parameter is slightly higher for ADAM technology than DMLS. The minimal value of Rz is 90% lower than the maximal value. However, coolant pressure has a decreasing pattern from the highest to the lowest Rz. Flow velocity and Reynolds nr. grow with decreasing Rz.
The simulation software used for the analyses only allows for defining channel roughness in micrometers. It does not account for other variables from DMLS and ADAM, such as unique surface characteristics and internal morphology. This limitation might explain why the studied parameters seem similar between the two technologies, despite significant differences in their surface roughness and structure.

Regression Models

Based on the collected data, appropriate regression models were formulated to elucidate the impact of surface roughness on the observed characteristics. These models were developed using statistical software, such as Minitab® 2017 (version 17.1, Minitab Inc., State College, PA, USA) and QC-Expert 3.3 (TriloByte, Staré Hradiště, Czech Republic).
The formulated model takes the following form:
y = b 0 + b 1 x + b 2 x 2 + b 3 x 3
where y represents the observed characteristic, x denotes surface roughness (μm), and b0, b1, b2, and b3 are the estimates of regression parameters.
During the process of model selection, rigorous tests for statistical significance were conducted. The outcome of these tests led to the rejection of the hypothesis of insignificance, indicating the robustness of the chosen regression model. Additionally, a calculation of the predicted correlation coefficient and median quadratic error of prediction was performed with the intent to estimate the regression parameters and find the type of regression function on a confidential level of 1 − α = 0.95, i.e., α = 0.05. Following data processing, a regression triplet was tested [36].
The results shown in Figure 10, Table 7 and Table 8 demonstrate that surface roughness influences coolant pressure, Reynolds nr., and flow velocity. Linear behavior of the regression model appears in the case of the pressure for both technologies. When surface roughness is lower, the pressure linearly decreases. On the other hand, when surface roughness decreases, both Reynolds nr. and flow velocity nonlinearly grow. This fact is positive, in contrast with the performance of the injection molding cooling systems.

4. Discussion

This study investigated the impact of surface roughness on the efficiency of conformal cooling channels produced using additive manufacturing technologies. The results of the experiment shed light on the intricate relationship between surface roughness, coolant flow dynamics, and pressure within the cooling channels, providing insights crucial for optimizing injection molding processes.
The experiment compared two additive manufacturing technologies, Direct Metal Laser Sintering (DMLS) and Atomic Diffusion Additive Manufacturing (ADAM), in terms of surface roughness. It was found that the surface roughness values differed significantly between the two technologies, with DMLS exhibiting lower roughness compared to ADAM. This discrepancy can be attributed to the inherent differences in the manufacturing processes of these technologies, particularly the deposition and melting of metal powders. These findings correspond with recent studies in this area by Galati et al. and Babu et al. [26,27].
Surface roughness plays a critical role in influencing coolant flow dynamics within the cooling channels. Higher surface roughness results in increased flow resistance, leading to higher coolant pressures within the channels. This finding was consistent across both DMLS and ADAM technologies. The visualization of coolant pressure distribution along the channels highlighted the importance of surface smoothness in achieving uniform flow and pressure distribution, especially in complex geometries. The mentioned finding could bring improvement in the research by Venkatesh et al. and Dimla et al. [1,4].
Regression models were developed to quantitatively describe the relationship between surface roughness and key parameters, such as coolant pressure, Reynolds number, and flow velocity. These models provided valuable insights into how variations in surface roughness affect coolant flow behavior. It was observed that while coolant pressure exhibited a linear decrease with decreasing surface roughness, Reynolds number and flow velocity showed nonlinear increases. This suggests that optimizing surface roughness can lead to more efficient coolant flow and enhanced cooling performance in injection molding processes.
The findings of this study have significant practical implications for the design and optimization of injection molding cooling systems. By understanding the intricate relationship between surface roughness and coolant flow dynamics, manufacturers can make informed decisions regarding the selection of additive manufacturing technologies and post-processing techniques to achieve desired surface quality and cooling efficiency. Additionally, the developed regression models provide a valuable tool for predicting cooling system performance based on surface roughness parameters, facilitating the optimization of injection molding processes for enhanced productivity and product quality.
In the end, the main target of this study was quantifying the influence of conformal cooling channels’ surface roughness. The designed regression models should contribute to better prediction of the cooling channels’ finishing process influence on the effectivity of the whole injection mold cooling systems and also on the overall quality of the injection molded parts.

5. Conclusions

In conclusion, this study represents the importance of surface roughness in influencing the efficiency of conformal cooling channels in injection molding processes. By clarifying the complex interplay between surface roughness, coolant flow dynamics, and pressure distribution, the research provides valuable insights for optimizing cooling system design and enhancing the overall productivity and quality of injection molded components. Further research in this area should focus on exploring advanced post-processing techniques to further refine surface roughness and optimize cooling system performance in real practice and focus on to how non-destructively measure and evaluate surface roughness inside the cooling channels, especially using computer tomography equipment.

Author Contributions

Conceptualization, J.H., J.V. and M.B.; methodology, J.H. and J.V.; validation, M.P., J.K. and V.S.; formal analysis, V.S. and J.K.; investigation, J.K.; resources, J.H.; data curation, V.P.; writing—original draft preparation, J.H.; writing—review and editing, J.H., J.V. and M.B.; visualization, M.P.; supervision, J.H. and M.B.; project administration, M.P. All authors have read and agreed to the published version of the manuscript.

Funding

This research was funded by the Internal Grant Agency of Tomas Bata University in Zlin, supported under project No. IGA/FT/2024/003.

Institutional Review Board Statement

Not applicable.

Informed Consent Statement

Not applicable.

Data Availability Statement

Data are contained within the article.

Acknowledgments

An AI tool was only used for language corrections.

Conflicts of Interest

The authors declare no conflicts of interest.

References

  1. Venkatesh, G.; Kumar, Y.R.; Raghavendra, G. Comparison of Straight Line to Conformal Cooling Channel in Injection Molding. Mater. Today Proc. 2017, 4, 1167–1173. [Google Scholar] [CrossRef]
  2. Deepika, S.S.; Patil, B.T.; Shaikh, V.A. Plastic Injection Molded Door Handle Cooling Time Reduction Investigation Using Conformal Cooling Channels. Mater. Today Proc. 2020, 27, 519–523. [Google Scholar] [CrossRef]
  3. Jahan, S.A.; El-Mounayri, H. Optimal Conformal Cooling Channels In 3D Printed Dies for Plastic Injection Molding. Procedia Manuf. 2016, 5, 888–900. [Google Scholar] [CrossRef]
  4. Dimla, E.; Rull-Trinidad, J.; Garcia-Granada, A.A.; Reyes, G. Thermal Comparison of Conventional and Conformal Cooling Channel Designs For A Non-Constant Thickness Screw Cap. J. Korean Soc. Precis. Eng. 2018, 35, 95–101. [Google Scholar] [CrossRef]
  5. Park, H.-S.; Dang, X.-P.; Nguyen, D.-S.; Kumar, S. Design of Advanced Injection Mold to Increase Cooling Efficiency. Int. J. Precis. Eng. Manuf.-Green Technol. 2020, 7, 319–328. [Google Scholar] [CrossRef]
  6. Shen, S.; Kanbur, B.B.; Zhou, Y.; Duan, F. Thermal and Mechanical Analysis for Conformal Cooling Channel in Plastic Injection Molding. Mater. Today Proc. 2020, 28, 396–401. [Google Scholar] [CrossRef]
  7. Chung, C.-Y. Integrated Optimum Layout of Conformal Cooling Channels and Optimal Injection Molding Process Parameters for Optical Lenses. Appl. Sci. 2019, 9, 4341. [Google Scholar] [CrossRef]
  8. Park, H.-S.; Dang, X.-P. Development of A Smart Plastic Injection Mold with Conformal Cooling Channels. Procedia Manuf. 2017, 10, 48–59. [Google Scholar] [CrossRef]
  9. Torres-Alba, A.; Mercado-Colmenero, J.M.; Caballero-Garcia, J.d.D.; Martin-Doñate, C. Application of New Triple Hook-Shaped Conformal Cooling Channels for Cores and Sliders in Injection Molding to Reduce Residual Stress and Warping in Complex Plastic Optical Parts. Polymers 2021, 13, 2944. [Google Scholar] [CrossRef]
  10. Goldsberry, C. Milacron’s DME Partners with Linear AMS to Develop 3D-Printed Conformal Cooling Technology; Plastics Today: Santa Monica, CA, USA, 2017. [Google Scholar]
  11. Spina, R.; Walach, P.; Schild, J.; Hopmann, C. Analysis of Lens Manufacturing with Injection Molding. Int. J. Precis. Eng. Manuf. 2012, 13, 2087–2095. [Google Scholar] [CrossRef]
  12. Bensingh, R.J.; Boopathy, S.R.; Jebaraj, C. Minimization of Variation in Volumetric Shrinkage and Deflection on Injection Molding of Bi-Aspheric Lens Using Numerical Simulation. J. Mech. Sci. Technol. 2016, 30, 5143–5152. [Google Scholar] [CrossRef]
  13. Huang, M.-S.; Chen, J.-Y.; Xiao, Y.-Q. Quality Monitoring of Micro-Shrinkage Defects in Thick-Walled Injection Molded Components. Measurement 2022, 201, 111733. [Google Scholar] [CrossRef]
  14. Wang, Y.; Lee, C. Design and Optimization of Conformal Cooling Channels for Increasing Cooling Efficiency In Injection Molding. Appl. Sci. 2023, 13, 7437. [Google Scholar] [CrossRef]
  15. Vanek, J.; Stanek, M.; Martin Ovsik, M.; Chalupa, V. Injection Molding of Polycarbonate Thick-Walled Parts Using a Tool with Variously Designed Gate Inserts. Mater. Tehnol. 2023, 57, 299–305. [Google Scholar] [CrossRef]
  16. Kuo, C.-C.; Jiang, Z.-F.; Yang, X.-Y.; Chu, S.-X.; Wu, J.-Q. Characterization of A Direct Metal Printed Injection Mold with Different Conformal Cooling Channels. Int. J. Adv. Manuf. Technol. 2020, 107, 1223–1238. [Google Scholar] [CrossRef]
  17. Simiyu, L.W.; Mutua, J.M.; Muiruri, P.I.; Ikua, B.W. Optimization of Polygonal Cross-Sectioned Conformal Cooling Channels in Injection Molding. Int. J. Interact. Des. Manuf. (IJIDeM) 2023, 18, 1593–1609. [Google Scholar] [CrossRef]
  18. Jahan, S.; El-Mounayri, H. A Thermomechanical Analysis of Conformal Cooling Channels in 3D Printed Plastic Injection Molds. Appl. Sci. 2018, 8, 2567. [Google Scholar] [CrossRef]
  19. Hensley, C.; Sisco, K.; Beauchamp, S.; Godfrey, A.; Rezayat, H.; McFalls, T.; Galicki, D.; List, F.; Carver, K.; Stover, C.; et al. Qualification Pathways for Additively Manufactured Components for Nuclear Applications. J. Nucl. Mater. 2021, 548, 152846. [Google Scholar] [CrossRef]
  20. Sun, C.; Wang, Y.; McMurtrey, M.D.; Jerred, N.D.; Liou, F.; Li, J. Additive Manufacturing for Energy: A Review. Appl. Energy 2021, 282, 116041. [Google Scholar] [CrossRef]
  21. Khairallah, S.A.; Anderson, A.T.; Rubenchik, A.; King, W.E. Laser Powder-Bed Fusion Additive Manufacturing: Physics of Complex Melt Flow and Formation Mechanisms of Pores, Spatter and Denudation Zones. Acta Mater. 2016, 108, 36–45. [Google Scholar] [CrossRef]
  22. Brennan, M.C.; Keist, J.S.; Palmer, T.A. Defects in Metal Additive Manufacturing Processes. J. Mater. Eng. Perform. 2021, 30, 4808–4818. [Google Scholar] [CrossRef]
  23. Tammas-Williams, S.; Withers, P.J.; Todd, I.; Prangnell, P.B. The Influence of Porosity on Fatigue Crack Initiation in Addi-tively Manufactured Titanium Components. Sci. Rep. 2017, 7, 7308. [Google Scholar] [CrossRef] [PubMed]
  24. Sangid, M.D.; Ravi, P.; Prithivirajan, V.; Miller, N.A.; Kenesei, P.; Park, J.-S. ICME Approach to Determining Critical Pore Size of IN718 Produced by Selective Laser Melting. JOM 2019, 72, 465–474. [Google Scholar] [CrossRef]
  25. Scott, S.; Chen, W.-Y.; Heifetz, A. Multi-Task Learning of Scanning Electron Microscopy and Synthetic Thermal Tomography Images for Detection of Defects in Additively Manufactured Metals. Sensors 2023, 23, 8462. [Google Scholar] [CrossRef] [PubMed]
  26. Galati, M.; Minetola, P. Analysis of Density, Roughness, and Accuracy of the Atomic Diffusion Additive Manufacturing (Adam) Process for Metal Parts. Materials 2019, 12, 4122. [Google Scholar] [CrossRef] [PubMed]
  27. Phani Babu, V.V.; GB, V.K. A Review On 3D Printing Process on Metals and Their Surface Roughness and Dimensional Accuracy. Mater. Today Proc. 2022, 64, 523–530. [Google Scholar] [CrossRef]
  28. Abbès, B.; Abbès, F.; Abdessalam, H.; Upganlawar, A. Finite Element Cooling Simulations of Conformal Cooling Hybrid Injection Molding Tools Manufactured by Selective Laser Melting. Int. J. Adv. Manuf. Technol. 2019, 103, 2515–2522. [Google Scholar] [CrossRef]
  29. Han, S.; Salvatore, F.; Rech, J.; Bajolet, J.; Courbon, J. Effect of Abrasive Flow Machining (Afm) Finish of Selective Laser Melting (Slm) Internal Channels on Fatigue Performance. J. Manuf. Process. 2020, 59, 248–257. [Google Scholar] [CrossRef]
  30. Günther, J.; Leuders, S.; Koppa, P.; Tröster, T.; Henkel, S.; Biermann, H.; Niendorf, T. On the Effect of Internal Channels and Surface Roughness on the High-Cycle Fatigue Performance of Ti-6Al-4V Processed by Slm. Mater. Des. 2018, 143, 1–11. [Google Scholar] [CrossRef]
  31. Dumas, M.; Cabanettes, F.; Kaminski, R.; Valiorgue, F.; Picot, E.; Lefebvre, F.; Grosjean, C.; Rech, J. Influence of the Finish Cutting Operations on the Fatigue Performance of Ti-6Al-4V Parts Produced by Selective Laser Melting. Procedia CIRP 2018, 71, 429–434. [Google Scholar] [CrossRef]
  32. Han, S.; Salvatore, F.; Rech, J.; Bajolet, J. Abrasive Flow Machining (Afm) Finishing of Conformal Cooling Channels Created by Selective Laser Melting (Slm). Precis. Eng. 2020, 64, 20–33. [Google Scholar] [CrossRef]
  33. Chawla, G.; Mittal, V.K.; Mittal, S. Design and Development of Fixture and Modification Of Existing Afm Setup to Magnetic Abrasive Flow Machining (Mafm) Process Setup. J. Phys. Conf. Ser. 2019, 1240, 012009. [Google Scholar] [CrossRef]
  34. François, M.; Han, S.; Segonds, F.; Dupuy, C.; Rivette, M.; Turpault, S.; Mimouna, M.; Salvatore, F.; Rech, J.; Peyre, P. Electromagnetic Performance of Ti6Al4V and Alsi7Mg0.6 Waveguides with Laser Beam Melting (Lbm) Produced and Abrasive Flow Machining (Afm) Finished Internal Surfaces. J. Electromagn. Waves Appl. 2021, 35, 2510–2526. [Google Scholar] [CrossRef]
  35. Bílek, O.; Pata, V.; Kubišová, M.; Řezníček, M. Mathematical Methods of Surface Roughness Evaluation of Areas with a Distinctive Inclination. Manuf. Technol. 2018, 18, 363–368. [Google Scholar] [CrossRef]
  36. Meloun, M.; Militky, J. A Compendium of Statistical Data Processing; Karolinum: Prague, Czech Republic, 2013; p. 984. ISBN 978-80-246-2196-8. [Google Scholar]
Figure 1. Test specimens made by DMLS technology: (a) fabricated test specimens (outer diameter is 20 mm and height of the specimen is 40 mm); (b) machined test specimens prepared for internal surface roughness measurement.
Materials 17 02477 g001
Figure 2. Projection of the measured data of specimen A containing color scale.
Materials 17 02477 g002
Figure 3. Projection of the measured data of specimen B containing color scale.
Materials 17 02477 g003
Figure 4. Comparison values of the Rz parameter of specimens A and B. A1–A5 and B1–B5 represent repeatability of the measurement.
Materials 17 02477 g004
Figure 5. (a) SEM image of specimen A (magnification 500×); (b) detailed red rectangular area (magnification 1500×).
Materials 17 02477 g005
Figure 6. (a) SEM image of specimen B (magnification 500×); (b) detailed red rectangular area (magnification 1500×).
Materials 17 02477 g006
Figure 7. Visual coolant pressure interpretation: (a) DMLS technology (Rz = 21 μm); (b) ADAM technology (Rz = 34 μm).
Materials 17 02477 g007
Figure 8. Visual Reynolds number interpretation: (a) DMLS technology (Rz = 21 μm); (b) ADAM technology (Rz = 34 μm).
Materials 17 02477 g008
Figure 9. Visual flow velocity interpretation: (a) DMLS technology (Rz = 21 μm); (b) ADAM technology (Rz = 34 μm).
Materials 17 02477 g009
Figure 10. Proposed regression models—the influence of surface roughness on coolant pressure, Reynolds nr., and flow velocity in the cooling channels: (a) DMLS technology pressure; (b) ADAM technology pressure; (c) DMLS technology Reynolds nr.; (d) ADAM technology Reynolds nr.; (e) DMLS technology flow velocity; (f) ADAM technology flow velocity.
Materials 17 02477 g010
Table 1. Selected analysis parameters.
Parameter
Channel diameter4 mm
Coolant mediumWater (90 °C)
Defined flow rate6 L/min
Mesh typeVolumetric
Element typeTetra
Number of elements172,374
Bad element0
SolverStandard
Analysis type3D solid cooling channel
Turbulence modelingYes
Cooling channel mesh aspect ratio range0.7–1
Table 2. Values of transformed arithmetic means of the Rz parameter.
ParameterSpecimen A (DMLS)Specimen B (ADAM)
Rz [μm]2134
Table 3. EDAX analysis of specimen A.
ElementAtomic Concentration [%]Weight Concentration [%]
C31.6511.01
O20.089.31
Al2.311.80
Si2.091.70
Ca2.502.90
Fe29.6347.95
Ni10.2321.12
Mo1.514.20
Table 4. EDAX analysis of specimen B.
ElementAtomic Concentration [%]Weight Concentration [%]
C10.695.39
O41.3327.77
Al36.9541.86
V2.194.70
Cr2.745.99
Fe6.0914.29
Table 5. Analysis results summary for DMLS technology.
Rz
[μm]
Pressure
[MPa]
Reynolds nr.
[-]
Flow Velocity [cm/s]
210.43395,930605.3
18.90.42595,980605.6
16.80.41896,060606.6
14.70.41396,110610.9
12.60.40796,190616.7
10.50.40096,260626.6
8.40.39396,320630.9
6.30.38696,360637.1
4.20.37996,390640.0
2.10.37196,410642.0
Table 6. Analysis results summary for ADAM technology.
Rz
[μm]
Pressure
[MPa]
Reynolds nr.
[-]
Flow Velocity [cm/s]
340.48195,810601.2
30.60.47695,860601.3
27.20.46595,890602.5
23.80.45695,910603.8
20.40.43995,940605.8
170.42096,050608.3
13.60.41096,130614.4
10.20.39896,270626.2
6.80.38996,330636.5
3.40.37896,370640.4
Table 7. Estimations of the regression parameters—pressure and flow properties.
Type of AM TechnologyTested ParameterEstimations of Regression Parameters
b0b1b2b3
DMLSPressure [MPa]3.656 × 10−13.195 × 10−3--
Reynolds nr. [-]9.645 × 10⁴−1.262 × 101−6.270 × 10⁻¹-
Flow velocity [cm/s]9.640 × 1041.153 × 101–3.120 × 1007.194 × 10−2
ADAMPressure [MPa]3.673 × 10−13.472 × 10−3--
Reynolds nr. [-]9.652 × 10⁴−3.456 × 1013.998 × 10–1-
Flow velocity [cm/s]6.546 × 102−3.614 × 1006.078 × 10–2-
Table 8. The characteristics of the designed regression models—pressure and flow properties.
ParametersDMLSADAM
PressureReynolds nr.Flow VelocityPressureReynolds nr.Flow Velocity
Coefficient of Multiple Correlation9.989 × 10−19.969 × 10−19.979 × 10−19.915 × 10−19.892 × 10−19.958 × 10⁻¹
Coefficient of Determination9.979 × 10−19.938 × 10−19.958 × 10−19.831 × 10−19.785 × 10−19.916 × 10⁻¹
Predicted Correlation Coefficient9.926 × 10−19.999 × 10−19.665 × 10−19.518 × 10−19.999 × 10−19.147 × 10⁻¹
Mean Squared Error of Prediction1.374 × 10−63.749 × 10–13.358 × 1003.071 × 10−51.242 × 1008.781 × 100
Testing of Regression Triplet
Fisher–Snedecor Test of Model SignificanceModel is significant
Scott’s Criteria of MulticollinearityModel is correct
Cook–Weisberg Score Test for HeteroskedasticityResidue demonstrating homoskedasticity
Jarque–Berra Test of NormalityResidue has a normal distribution
Wald Test of Auto CorrelationAutocorrelation is insignificant
Durbin–Watson Test of Auto CorrelationNegative autocorrelation of residues not demonstrated
Disclaimer/Publisher’s Note: The statements, opinions and data contained in all publications are solely those of the individual author(s) and contributor(s) and not of MDPI and/or the editor(s). MDPI and/or the editor(s) disclaim responsibility for any injury to people or property resulting from any ideas, methods, instructions or products referred to in the content.

