
Vapor Pressure and Enthalpy of Vaporization of Guanidinium Methanesulfonate as a Phase Change Material for Thermal Energy Storage


Abstract
1. Introduction
2. Experimental
2.1. Materials
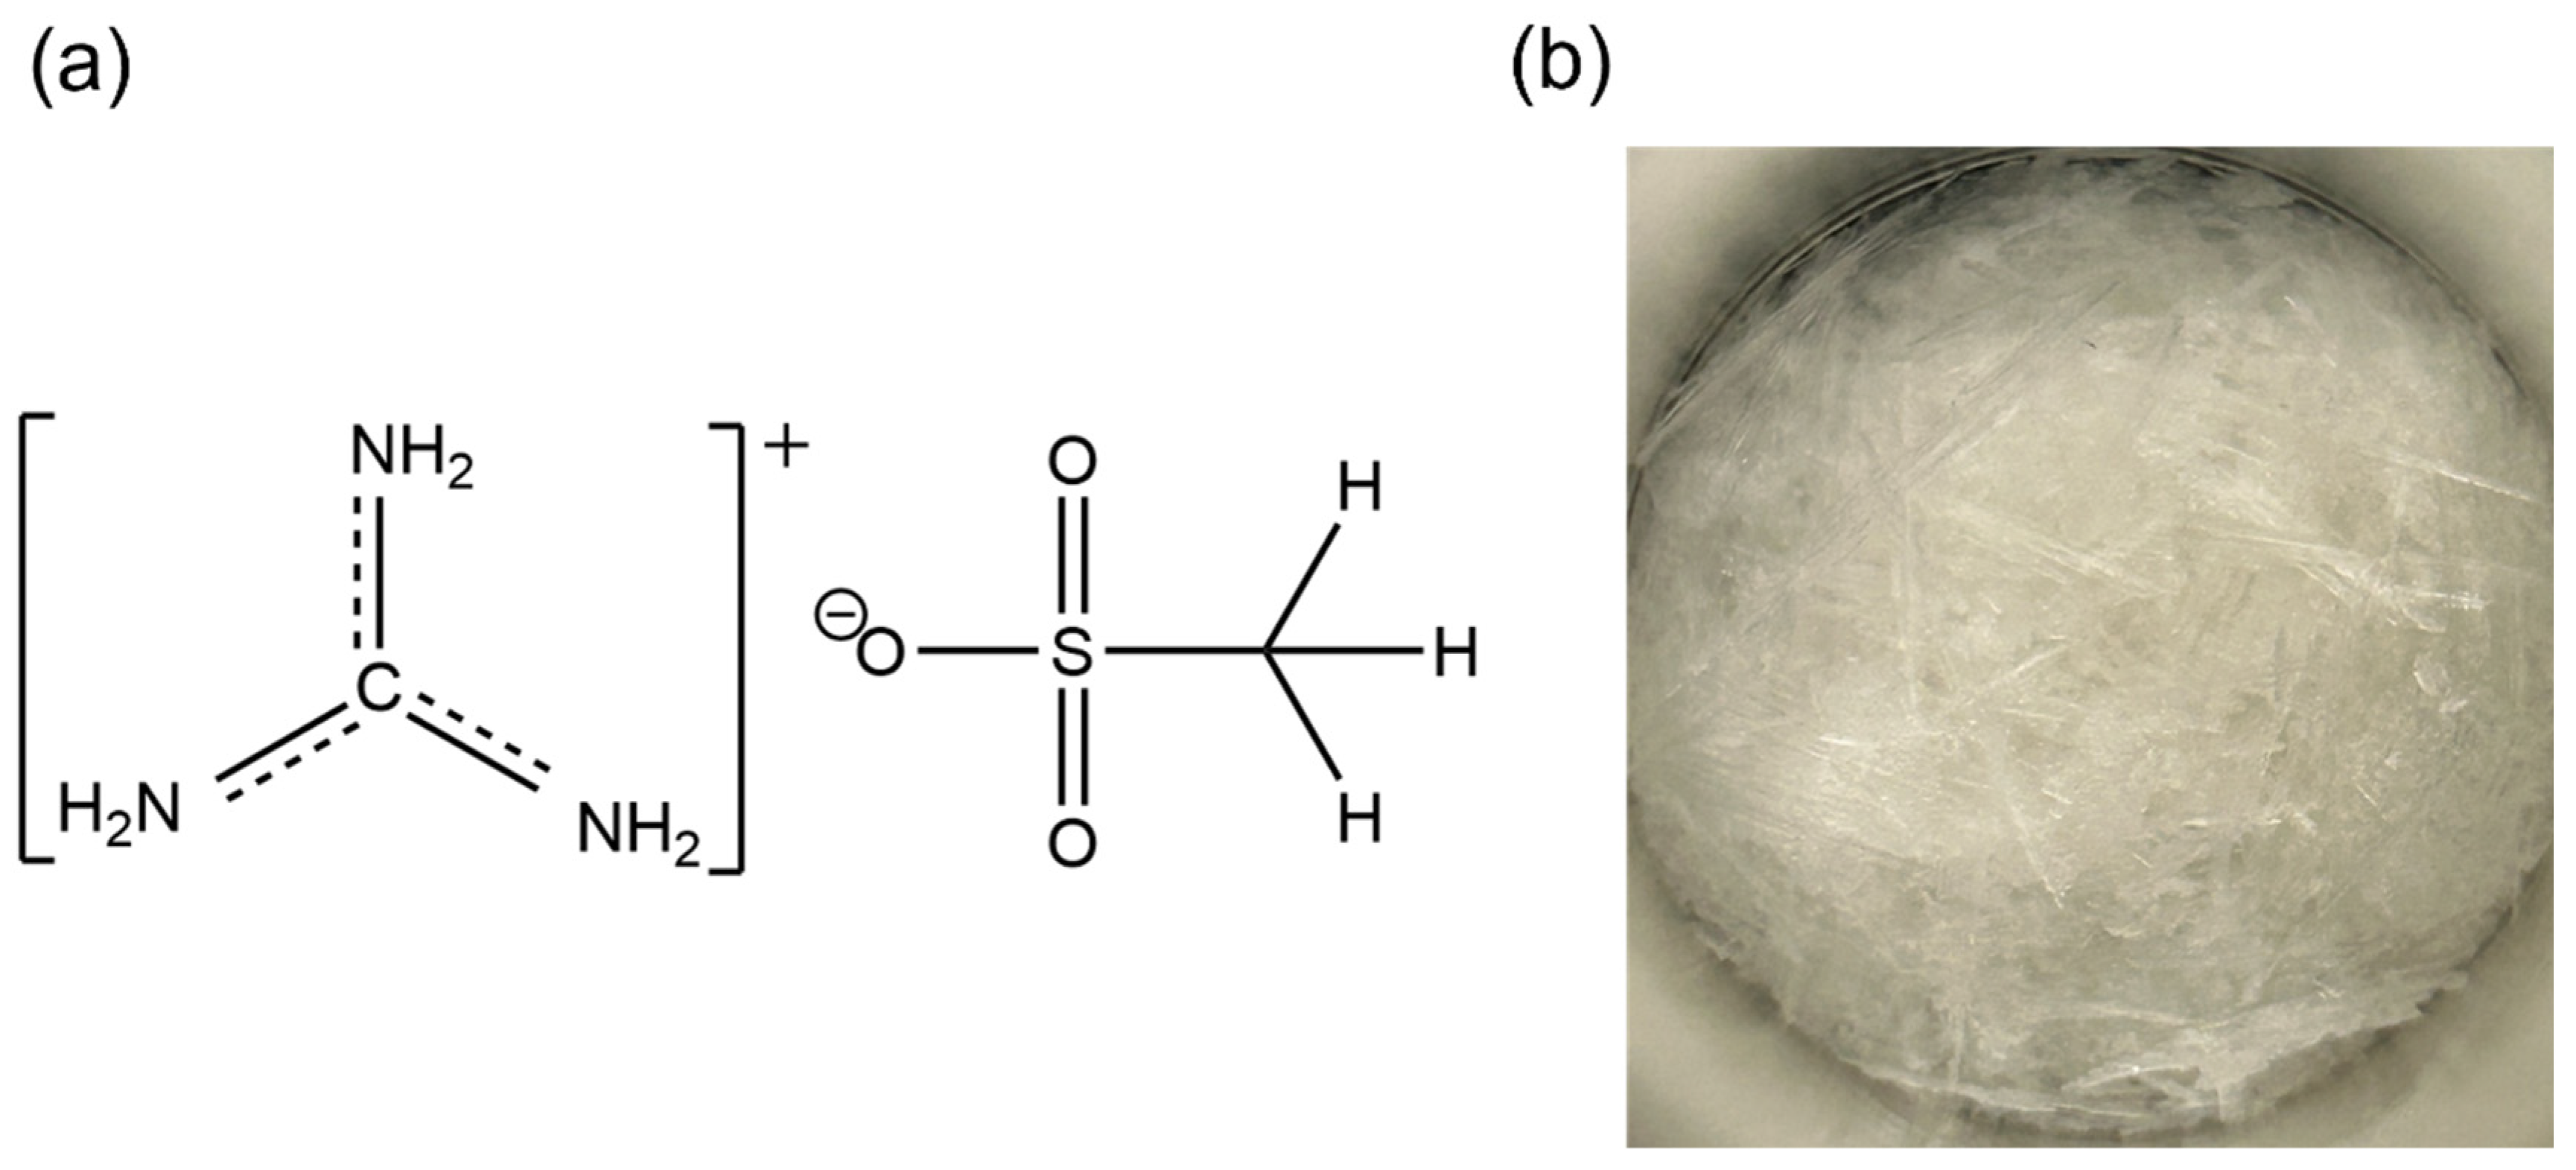
2.2. Synthesis of the Organic Salt
2.3. Recrystallization
2.4. Elemental Analysis
2.5. Fourier Transform Infrared (FT-IR) Analysis
2.6. Differential Scanning Calorimetry (DSC)
2.7. Thermogravimetric Analysis (TGA)
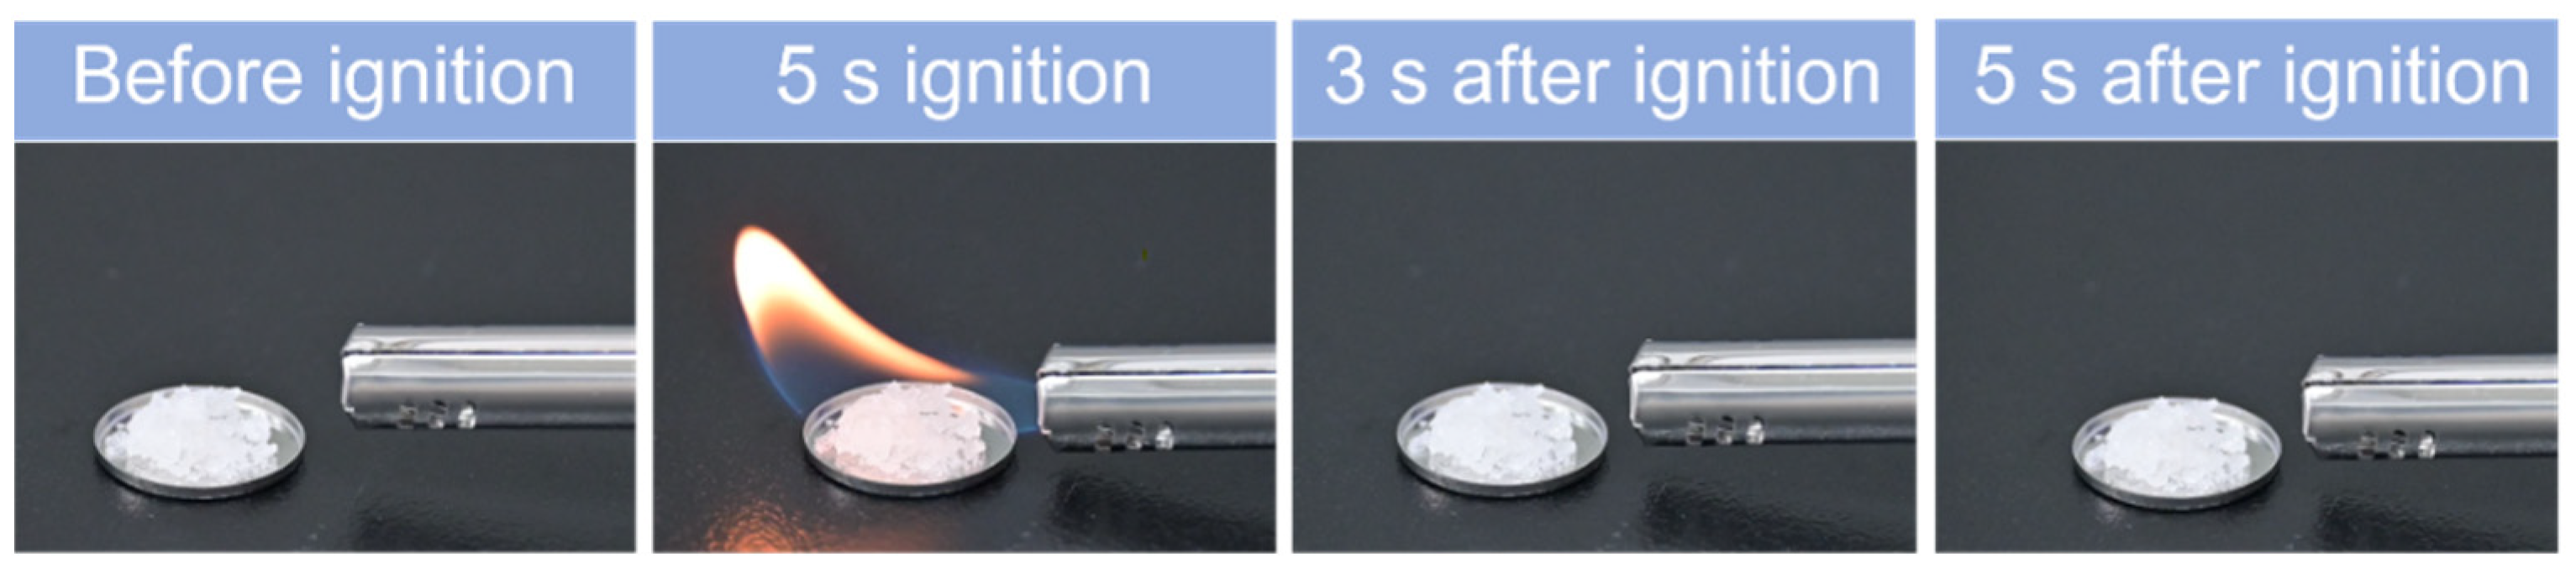
2.8. Flammability Test
3. Theoretical Basis
3.1. Vapor Pressure
3.2. Enthalpy of Vaporization
4. Results and Discussions
4.1. Basic Characterizations
4.2. Vapor Pressure and Enthalpy of Vaporization
5. Conclusions
Author Contributions
Funding
Institutional Review Board Statement
Informed Consent Statement
Data Availability Statement
Conflicts of Interest
References
- Tang, Z.; Gao, Y.; Cheng, P.; Jiang, Y.; Xu, J.; Chen, X.; Li, A.; Wang, G. Metal-organic framework derived magnetic phase change nanocage for fast-charging solar-thermal energy conversion. Nano Energy 2022, 99, 107383. [Google Scholar] [CrossRef]
- İnada, A.A.; Arman, S.; Safaei, B. A novel review on the efficiency of nanomaterials for solar energy storage systems. J. Energy Storage 2022, 55, 105661. [Google Scholar] [CrossRef]
- Zhang, Y.; Ren, J.; Pu, Y.; Wang, P. Solar energy potential assessment_ A framework to integrate geographic, technological, and economic indices for a potential analysis. Renew. Energy 2020, 149, 577–586. [Google Scholar] [CrossRef]
- Liu, D.; Lei, C.; Wu, K.; Fu, Q. A Multidirectionally Thermoconductive Phase Change Material Enables High and Durable Electricity via Real-Environment Solar–Thermal–Electric Conversion. ACS Nano 2020, 14, 15738–15747. [Google Scholar] [CrossRef] [PubMed]
- Alva, G.; Lin, Y.; Fang, G. An overview of thermal energy storage systems. Energy 2018, 144, 341–378. [Google Scholar] [CrossRef]
- Song, Z.; Deng, Y.; Li, J.; Nian, H. Expanded graphite for thermal conductivity and reliability enhancement and supercooling decrease of MgCl2⋅6H2O phase change material. Mater. Res. Bull. 2018, 102, 203–208. [Google Scholar] [CrossRef]
- Matuszek, K.; Kar, M.; Pringle, J.M.; MacFarlane, D.R. Phase change materials for renewable energy storage at intermediate temperatures. Chem. Rev. 2022, 123, 491–514. [Google Scholar] [CrossRef] [PubMed]
- Yuan, M.; Xu, C.; Wang, T.; Zhang, T.; Pan, X.; Ye, F. Supercooling suppression and crystallization behaviour of erythritol/expanded graphite as form-stable phase change material. Chem. Eng. J. 2021, 413, 127394. [Google Scholar] [CrossRef]
- del Barrio, E.P.; Godin, A.; Duquesne, M.; Daranlot, J.; Jolly, J.; Alshaer, W.; Kouadio, T.; Sommier, A. Characterization of different sugar alcohols as phase change materials for thermal energy storage applications. Sol. Energy Mater. Sol. Cells 2017, 159, 560–569. [Google Scholar] [CrossRef]
- Solé, A.; Neumann, H.; Niedermaier, S.; Martorell, I.; Schossig, P.; Cabeza, L.F. Stability of sugar alcohols as PCM for thermal energy storage. Sol. Energy Mater. Sol. Cells 2014, 126, 125–134. [Google Scholar] [CrossRef]
- Gasia, J.; Martin, M.; Solé, A.; Barreneche, C.; Cabeza, L. Phase Change Material Selection for Thermal Processes Working under Partial Load Operating Conditions in the Temperature Range between 120 and 200 °C. Appl. Sci. 2017, 7, 722. [Google Scholar] [CrossRef]
- Zhang, H.; Xu, W.; Liu, J.; Li, M.; Yang, B. Thermophysical properties of dicationic imidazolium-based ionic. J. Mol. Liq. 2019, 282, 474–483. [Google Scholar] [CrossRef]
- Matuszek, K.; Vijayaraghavan, R.; Forsyth, C.M.; Mahadevan, S.; Kar, M.; MacFarlane, D.R. Pyrazolium Phase-Change Materials for Solar-Thermal Energy Storage. Chemsuschem 2019, 13, 159–164. [Google Scholar] [CrossRef] [PubMed]
- Matuszek, K.; Hatton, C.; Kar, M.; Pringle, J.M.; MacFarlane, D.R. Molecular patterns in the thermophysical properties of pyridinium ionic liquids as phase change materials for energy storage in the intermediate temperature range. J. Non-Cryst. Solids X 2022, 15, 100108. [Google Scholar] [CrossRef]
- Matuszek, K.; Vijayaraghavan, R.; Kar, M.; Mahadevan, S.; MacFarlane, D.R. Guanidinium Organic Salts as Phase-Change Materials for Renewable Energy Storage. Chemsuschem 2021, 14, 2757–2762. [Google Scholar] [CrossRef] [PubMed]
- Vijayraghavan, R.; Rana, U.A.; Elliott, G.D.; MacFarlane, D.R. Protic Ionic Solids and Liquids Based on the Guanidinium Cation as Phase-Change Energy-Storage Materials. Energy Technol. 2013, 1, 609–612. [Google Scholar] [CrossRef]
- Zhang, H.; Li, M.; Yang, B. Design, synthesis, and analysis of thermophysical properties for imidazolium-based geminal dicationic ionic liquids. J. Phys. Chem. C 2018, 122, 2467–2474. [Google Scholar] [CrossRef]
- Piper, S.L.; Kar, M.; MacFarlane, D.R.; Matuszek, K.; Pringle, J.M. Ionic liquids for renewable thermal energy storage—A perspective. Green. Chem. 2022, 21, 102. [Google Scholar] [CrossRef]
- Horner, M.J.; Holman, K.T.; Ward, M.D. Architectural diversity and elastic networks in hydrogen-bonded host frameworks: from molecular jaws to cylinders. J. Am. Chem. Soc. 2007, 129, 14640–14660. [Google Scholar] [CrossRef]
- Dunaev, A.M.; Motalov, V.B.; Kudin, L.S.; Butman, M.F. Thermodynamic properties of the ionic vapor species over EMImNTf 2 ionic liquid studied by Knudsen effusion mass spectrometry. J. Mol. Liq. 2016, 223, 407–411. [Google Scholar] [CrossRef]
- Liu, S.; Wei, R.; Ma, G.; Li, A.; Conrad, O.; Luo, J. The cohesive properties and pyrolysis mechanism of an aprotic ionic liquid tetrabutylammonium bis(trifluoromethanesulfonyl)imide. Soft Matter 2023, 19, 6458–6467. [Google Scholar] [CrossRef]
- Langmuir, I. The vapor pressure of metallic tungsten. Phys. Z. 1913, 11, 1273–1280. [Google Scholar] [CrossRef]
- Price, D.M.; Hawkins, M. Calorimetry of two disperse dyes using thermogravimetry. Thermochim. Acta 1998, 315, 19–24. [Google Scholar] [CrossRef]
- Shahbaz, K.; Mjalli, F.S.; Vakili-Nezhaad, G.; AlNashef, I.M.; Asadov, A.; Farid, M.M. Thermogravimetric measurement of deep eutectic solvents vapor pressure. J. Mol. Liq. 2016, 222, 61–66. [Google Scholar] [CrossRef]
- Verevkin, S.P.; Ralys, R.V.; Zaitsau, D.H.; Emel’yanenko, V.N.; Schick, C. Express thermo-gravimetric method for the vaporization enthalpies appraisal for very low volatile molecular and ionic compounds. Thermochim. Acta 2012, 538, 55–62. [Google Scholar] [CrossRef]
- Wisniak, J. Historical development of the vapor pressure equation from dalton to antoine. J. Phase Equilibria 2001, 22, 622–630. [Google Scholar] [CrossRef]
- Luo, H.; Baker, G.A.; Dai, S. Isothermogravimetric determination of the enthalpies of vaporization of 1-Alkyl-3-methylimidazolium ionic liquids. J. Phys. Chem. B 2008, 112, 10077–10081. [Google Scholar] [CrossRef] [PubMed]
- Liu, L.; Jing, L.-Q.; Liu, H.-C.; Fang, D.-W.; Tong, J. Measurement of vaporization enthalpy for amino acid ionic liquids [Cnmim][Thr](n = 3, 5) using the isothermogravimetrical analysis. J. Therm. Anal. Calorim. 2018, 134, 2247–2254. [Google Scholar] [CrossRef]
- Kelkar, M.S.; Maginn, E.J. Calculating the enthalpy of vaporization for ionic liquid clusters. J. Phys. Chem. B 2007, 111, 9424–9427. [Google Scholar] [CrossRef]
- Kabo, G.J.; Paulechka, Y.U.; Zaitsau, D.H.; Firaha, A.S. Prediction of the enthalpies of vaporization for room-temperature ionic liquids: Correlations and a substitution-based additive scheme. Thermochim. Acta 2015, 609, 7–19. [Google Scholar] [CrossRef]
- Chen, X.; Tang, H.; Putzeys, T.; Sniekers, J.; Wübbenhorst, M.; Binnemans, K.; Fransaer, J.; De Vos, D.E.; Li, Q.; Luo, J. Guanidinium nonaflate as a solid-state proton conductor. J. Mater. Chem. A 2016, 4, 12241–12252. [Google Scholar] [CrossRef]
- Luo, J.; Hu, J.; Saak, W.; Beckhaus, R.; Wittstock, G.; Vankelecom, I.F.J.; Agert, C.; Conrad, O. Protic ionic liquid and ionic melts prepared from methanesulfonic acid and 1H-1,2,4-triazole as high temperature PEMFC electrolytes. J. Mater. Chem. 2011, 21, 10426–10436. [Google Scholar] [CrossRef]
- Enev, V.; Sedláček, P.; Řihák, M.; Kalina, M.; Pekař, M. IR-supported thermogravimetric analysis of water in hydrogels. Front. Mater. 2022, 9, 931303. [Google Scholar] [CrossRef]
- Brubach, J.B.; Mermet, A.; Filabozzi, A.; Gerschel, A.; Roy, P. Signatures of the hydrogen bonding in the infrared bands of water. J. Chem. Phys. 2005, 122, 184509. [Google Scholar] [CrossRef] [PubMed]
- Luo, J.; Jensen, A.H.; Brooks, N.R.; Sniekers, J.; Knipper, M.; Aili, D.; Li, Q.; Vanroy, B.; Wübbenhorst, M.; Yan, F.; et al. 1,2,4-Triazolium perfluorobutanesulfonate as an archetypal pure protic organic ionic plastic crystal electrolyte for all-solid-state fuel cells. Energy Environ. Sci. 2015, 8, 1276–1291. [Google Scholar] [CrossRef]
- Roseanne, J.S.; Hudson, B.; Callis, P.R. Resonance Raman studies of guanidinium and substituted guanidinium ions. J. Phys. Chem. 1990, 94, 4015–4025. [Google Scholar]
- Ghazaryan, V.V.; Drebushchak, T.N.; Boldyreva, E.V.; Petrosyan, A.M. Bis-l-cysteinium sulfate and l-cysteinium methanesulfonate. Struct. Chem. 2020, 31, 1919–1925. [Google Scholar] [CrossRef]
- Langner, R.; Zundel, G. FTIR investigation of O···H···O hydrogen bonds with large proton polarizability in sulfonic acid–N-oxide systems in the middle and far-IR. J. Chem. Soc. Faraday Trans. 1998, 94, 1805–1811. [Google Scholar] [CrossRef]
- Drozd, M. Molecular structure and infrared spectra of guanidinium cation. Mater. Sci. Eng. B 2007, 136, 20–28. [Google Scholar] [CrossRef]
- Chackalackal, S.M.; Stafford, F.E. Infrared spectra of methane-, fluoro-, and vhlorosulfonic acids. J. Am. Chem. Soc. 1966, 88, 4815–4819. [Google Scholar] [CrossRef]
- Clarke, J.H.R.; Woodward, L.A. Raman spectrophotometric determination of the degrees of dissociation of methanesulphonic acid in aqueous solution at 25°C. Trans. Faraday Soc. 1966, 62, 2226–2233. [Google Scholar] [CrossRef]
- Luo, J.; Conrad, O.; Vankelecom, I.F.J. Physicochemical properties of phosphonium-based and ammonium-based. J. Mater. Chem. 2012, 22, 20574–20579. [Google Scholar] [CrossRef]
- Luo, J.; Tan, T.V.; Conrad, O.; Vankelecom, I.F.J. 1H-1,2,4-Triazole as solvent for imidazolium methanesulfonate. Phys. Chem. Chem. Phys. 2012, 14, 11441–11447. [Google Scholar] [CrossRef] [PubMed]
- Matsuoka, H.; Nakamoto, H.; Susan, M.A.B.H.; Watanabe, M. Brønsted acid–base and –polybase complexes as electrolytes for fuel cells under non-humidifying conditions. Electrochim. Acta 2005, 50, 4015–4021. [Google Scholar] [CrossRef]
- Takamura, K.; Fischer, H.; Morrow, N.R. Physical properties of aqueous glycerol solutions. J. Pet. Sci. Eng. 2012, 98–99, 50–60. [Google Scholar] [CrossRef]
- Ravula, S.; Larm, N.E.; Mottaleb, M.A.; Heitz, M.P.; Baker, G.A. Vapor pressure mapping of ionic liquids and low-volatility fluids using graded isothermal thermogravimetric analysis. ChemEngineering 2019, 3, 42. [Google Scholar] [CrossRef]
- Paulechka, Y.U.; Zaitsau, D.H.; Kabo, G.J.; Strechan, A.A. Vapor pressure and thermal stability of ionic liquid 1-butyl-3-methylimidazolium Bis(trifluoromethylsulfonyl)amide. Thermochim. Acta 2005, 439, 158–160. [Google Scholar] [CrossRef]


| PCMs | Tm (°C) | ΔfusH (J g−1) | ΔT (°C) [b] |
|---|---|---|---|
| MgCl2·6H2O [6] | 123 | 117 | 41 |
| Indium [7] | 157 | 29 | / |
| Selenium [7] | 220 | 86 | / |
| Erythritol [8,9] | 118 | 340 | 86 |
| D-dulcitol [11] | 186 | 334 | / |
| C3(mim)2(Br)2 [12] | 173 | 116 | 46 |
| [Pzy][OMs] [13] | 168 | 160 | / |
| [Pzy][OTf] [13] | 147 | 17 ss, 24 ss, 27 | / |
| [Pzy][C6H5SO3] [13] | 137 | 105 | / |
| [PyH][OMs] [14] | 180 | 21 ss, 77 | 16 |
| [PyH][OTf] [14] | 226 | 24 ss, 38 | 41 |
| [pyH][C6H5SO3] [14] | 135 | 123 | 80 |
| [Gdm][OMs] [15,16] | 208 | 190 | / |
| [Gdm][OTf] [15,16] | 160 | 6 ss [a], 130 | / |
| [Gdm][C6H5SO3] [15,16] | 210 | 138 | / |
| C2(mim)2(Br)2 [17] | 188 | 116 | 24 |
| C2(mim)2(PF6)2 [17] | 191 | 109 | / |
| Experimental Conditions and Results | This Work | Literature [15,16] |
|---|---|---|
| Sample mass | 8.34 mg | 3~8 mg |
| Scanning rate | 5 °C min−1 | 10 °C min−1 |
| Atmosphere and flow rate | N2, 60 mL min−1 | N2 (flow rate not mentioned) |
| Measurement temperature range | 25~240 °C | −40~220 °C |
| DSC instrument | STARe DSC 3, Mettler-Toledo (with 120 thermocouples) | DSC TA Q200 calorimeter (TA Instruments) |
| Sample condition | powders | NOT MENTIONED |
| Crucible | 40 μL aluminum pan (sealed) | NOT MENTIONED |
| Data selection | the second run of the DSC cycle | the second run of the DSC cycle |
| Tm (peak maximum) | 207.6 °C | 208 ± 1 °C |
| ΔfusH | 183.0 J g−1 | 190 ± 9.5 J g−1 |
| T/°C | T/K | (−dm/dt)/S/g min−1 cm−2 | R2 | v/g0.5 mol0.5 K0.5 min−1 cm−2 | Pvap/Pa [45,46] |
|---|---|---|---|---|---|
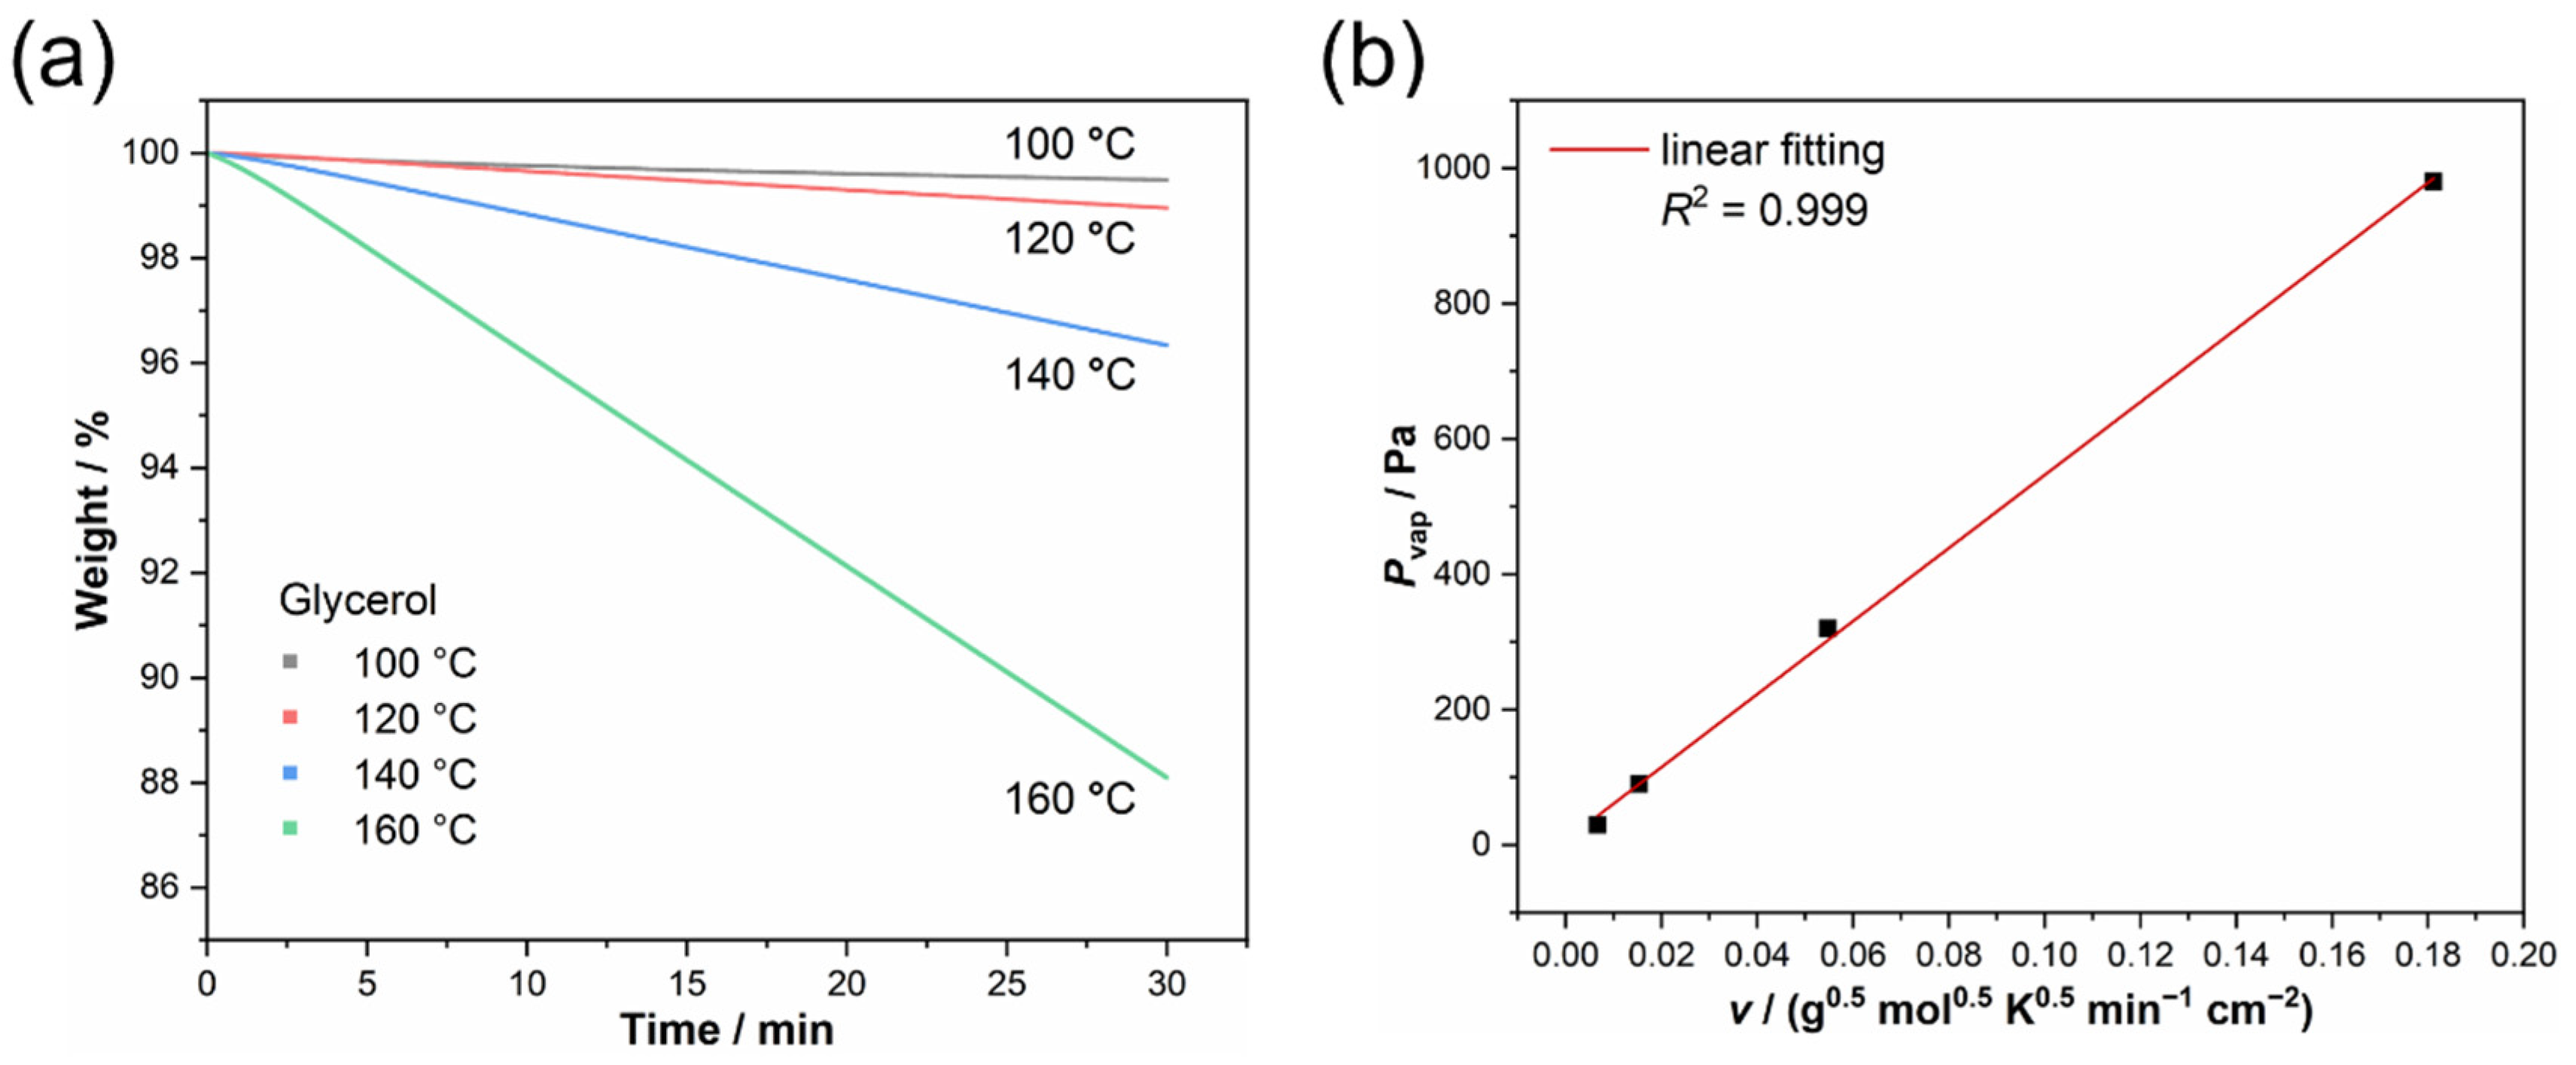
| 100 | 373.15 | 3.32 × 10⁻³ | 0.980 | 6.69 × 10⁻³ | 30.0 |
| 120 | 393.15 | 7.42 × 10⁻³ | 0.999 | 1.53 × 10⁻² | 90.0 |
| 140 | 413.15 | 2.58 × 10⁻² | 0.999 | 5.47 × 10⁻² | 320 |
| 160 | 433.15 | 8.36 × 10⁻² | 0.999 | 1.81 × 10⁻¹ | 980 |
| T/°C | T/K | (−dm/dt)/S/g min−1 cm−2 | R2 | v/ g0.5 mol0.5 K0.5 min−1 cm−2 | Pvap/Pa |
|---|---|---|---|---|---|
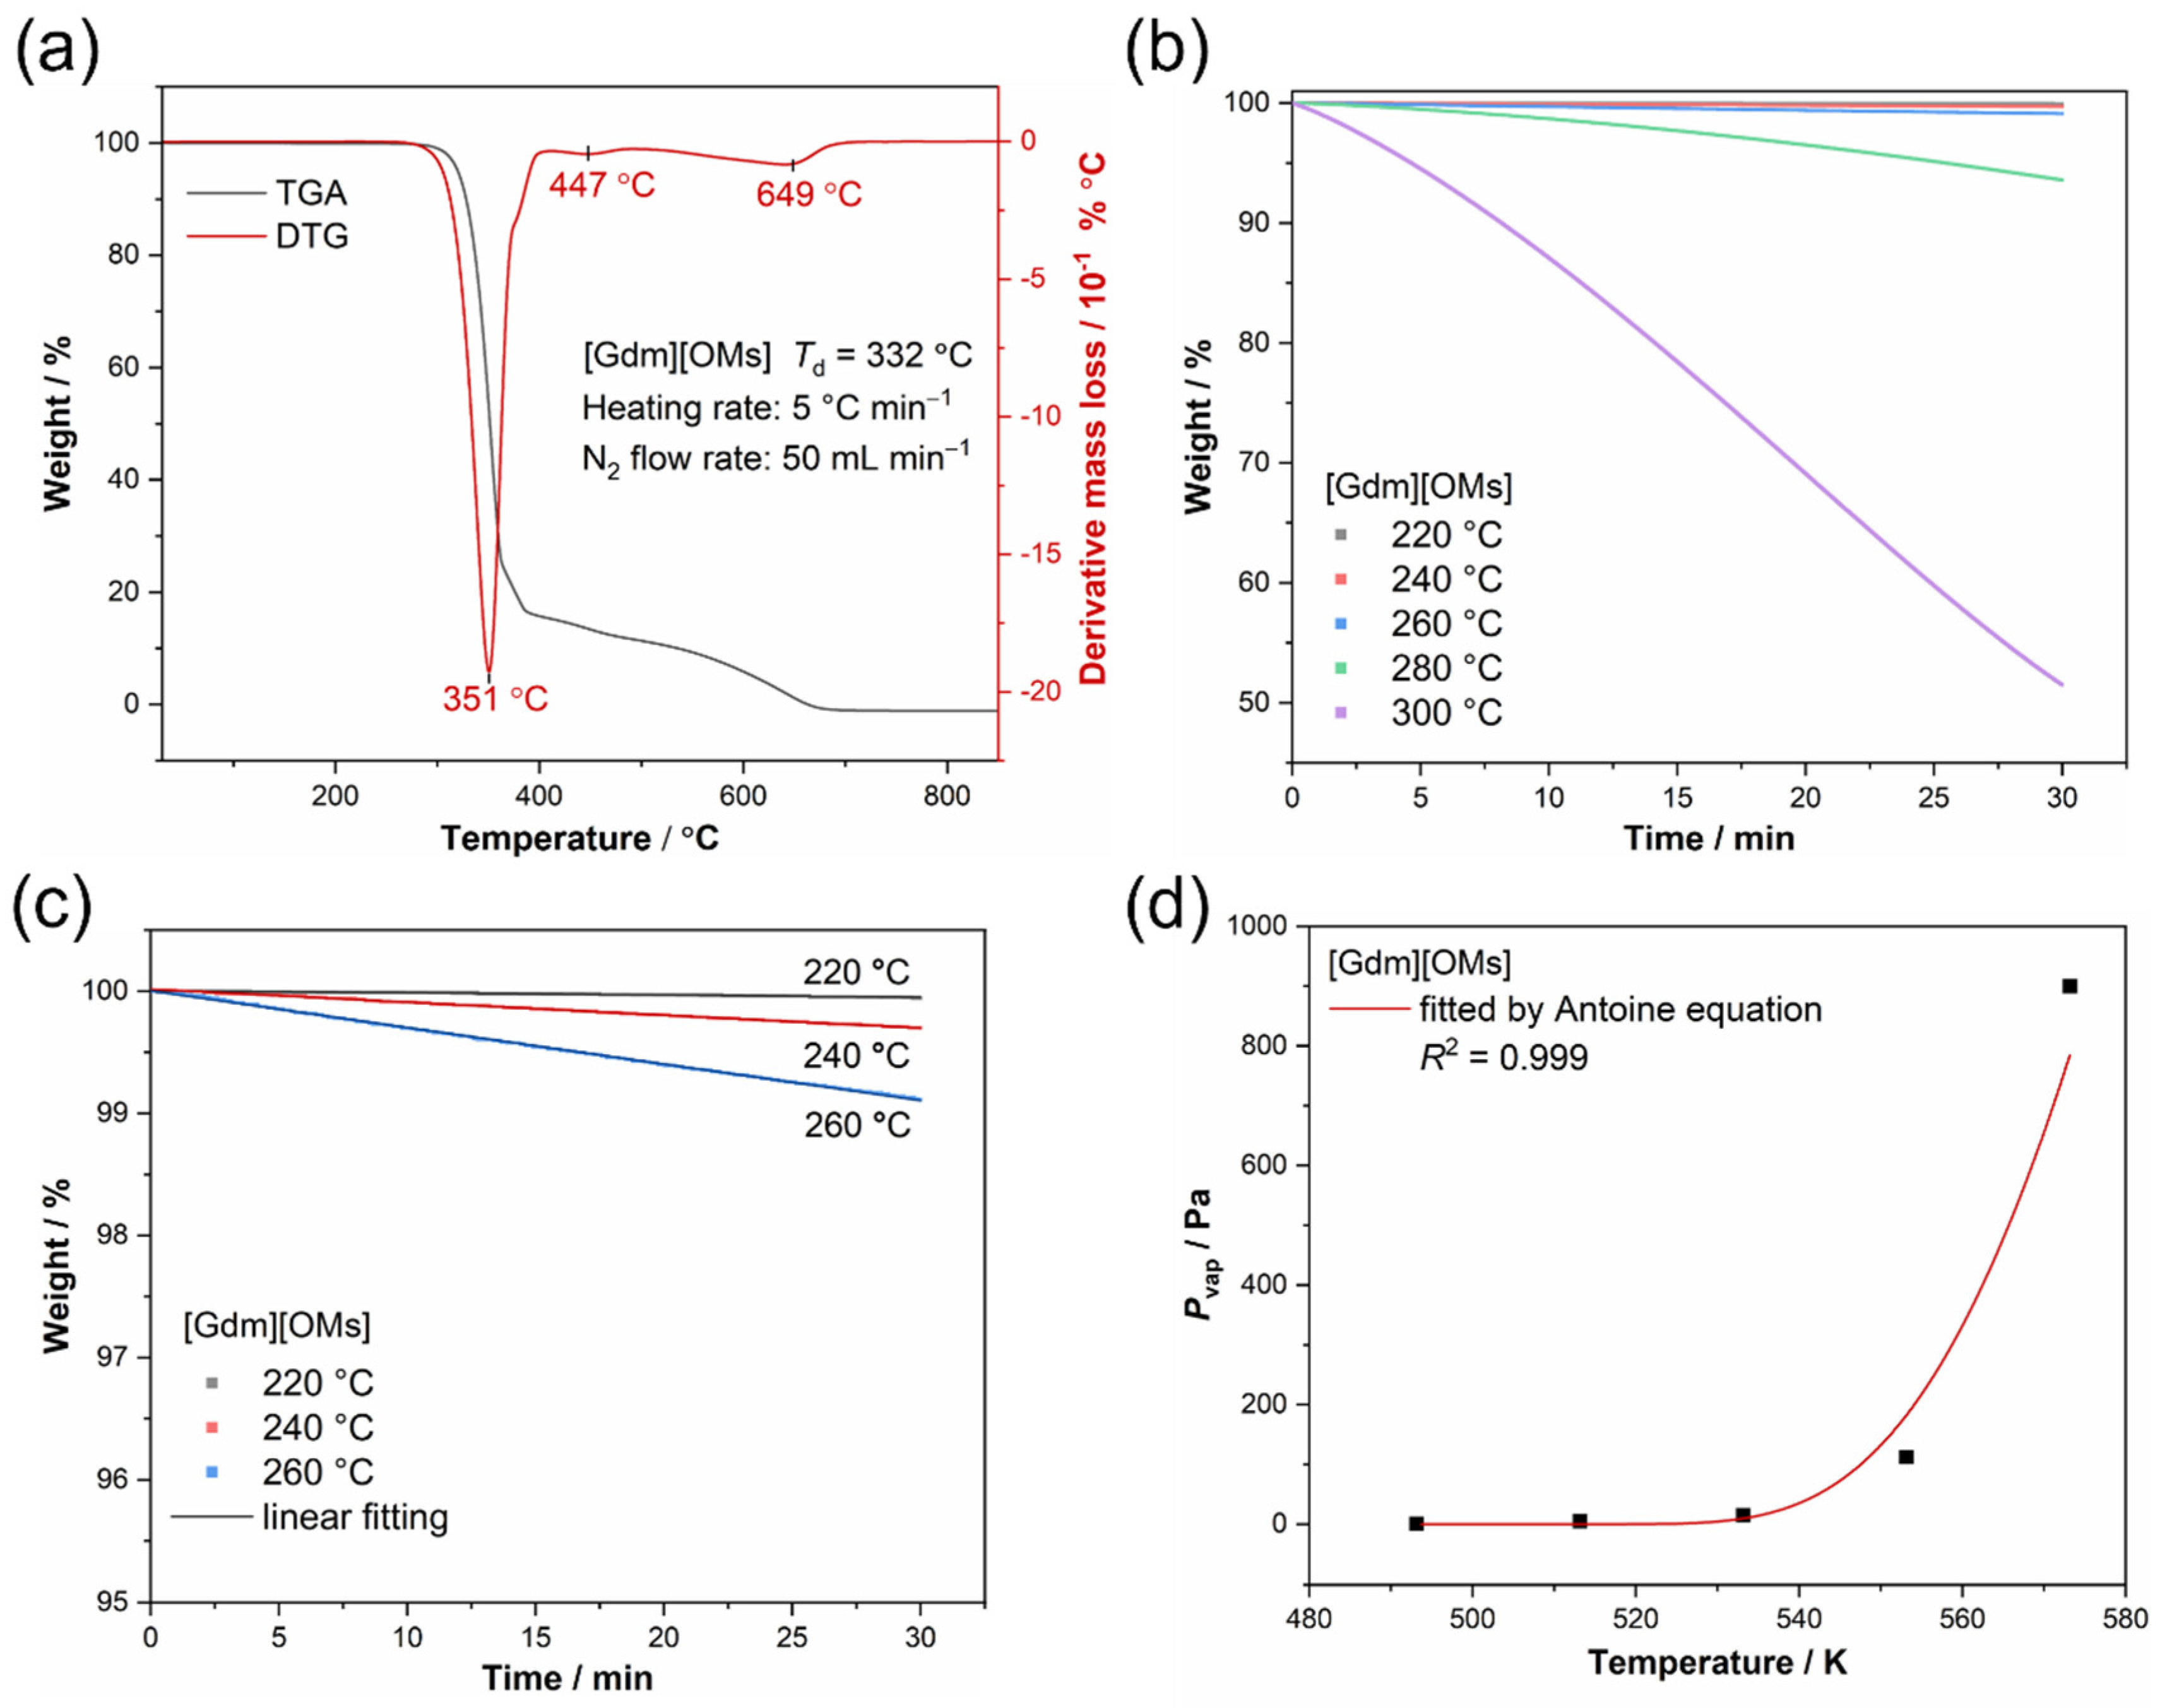
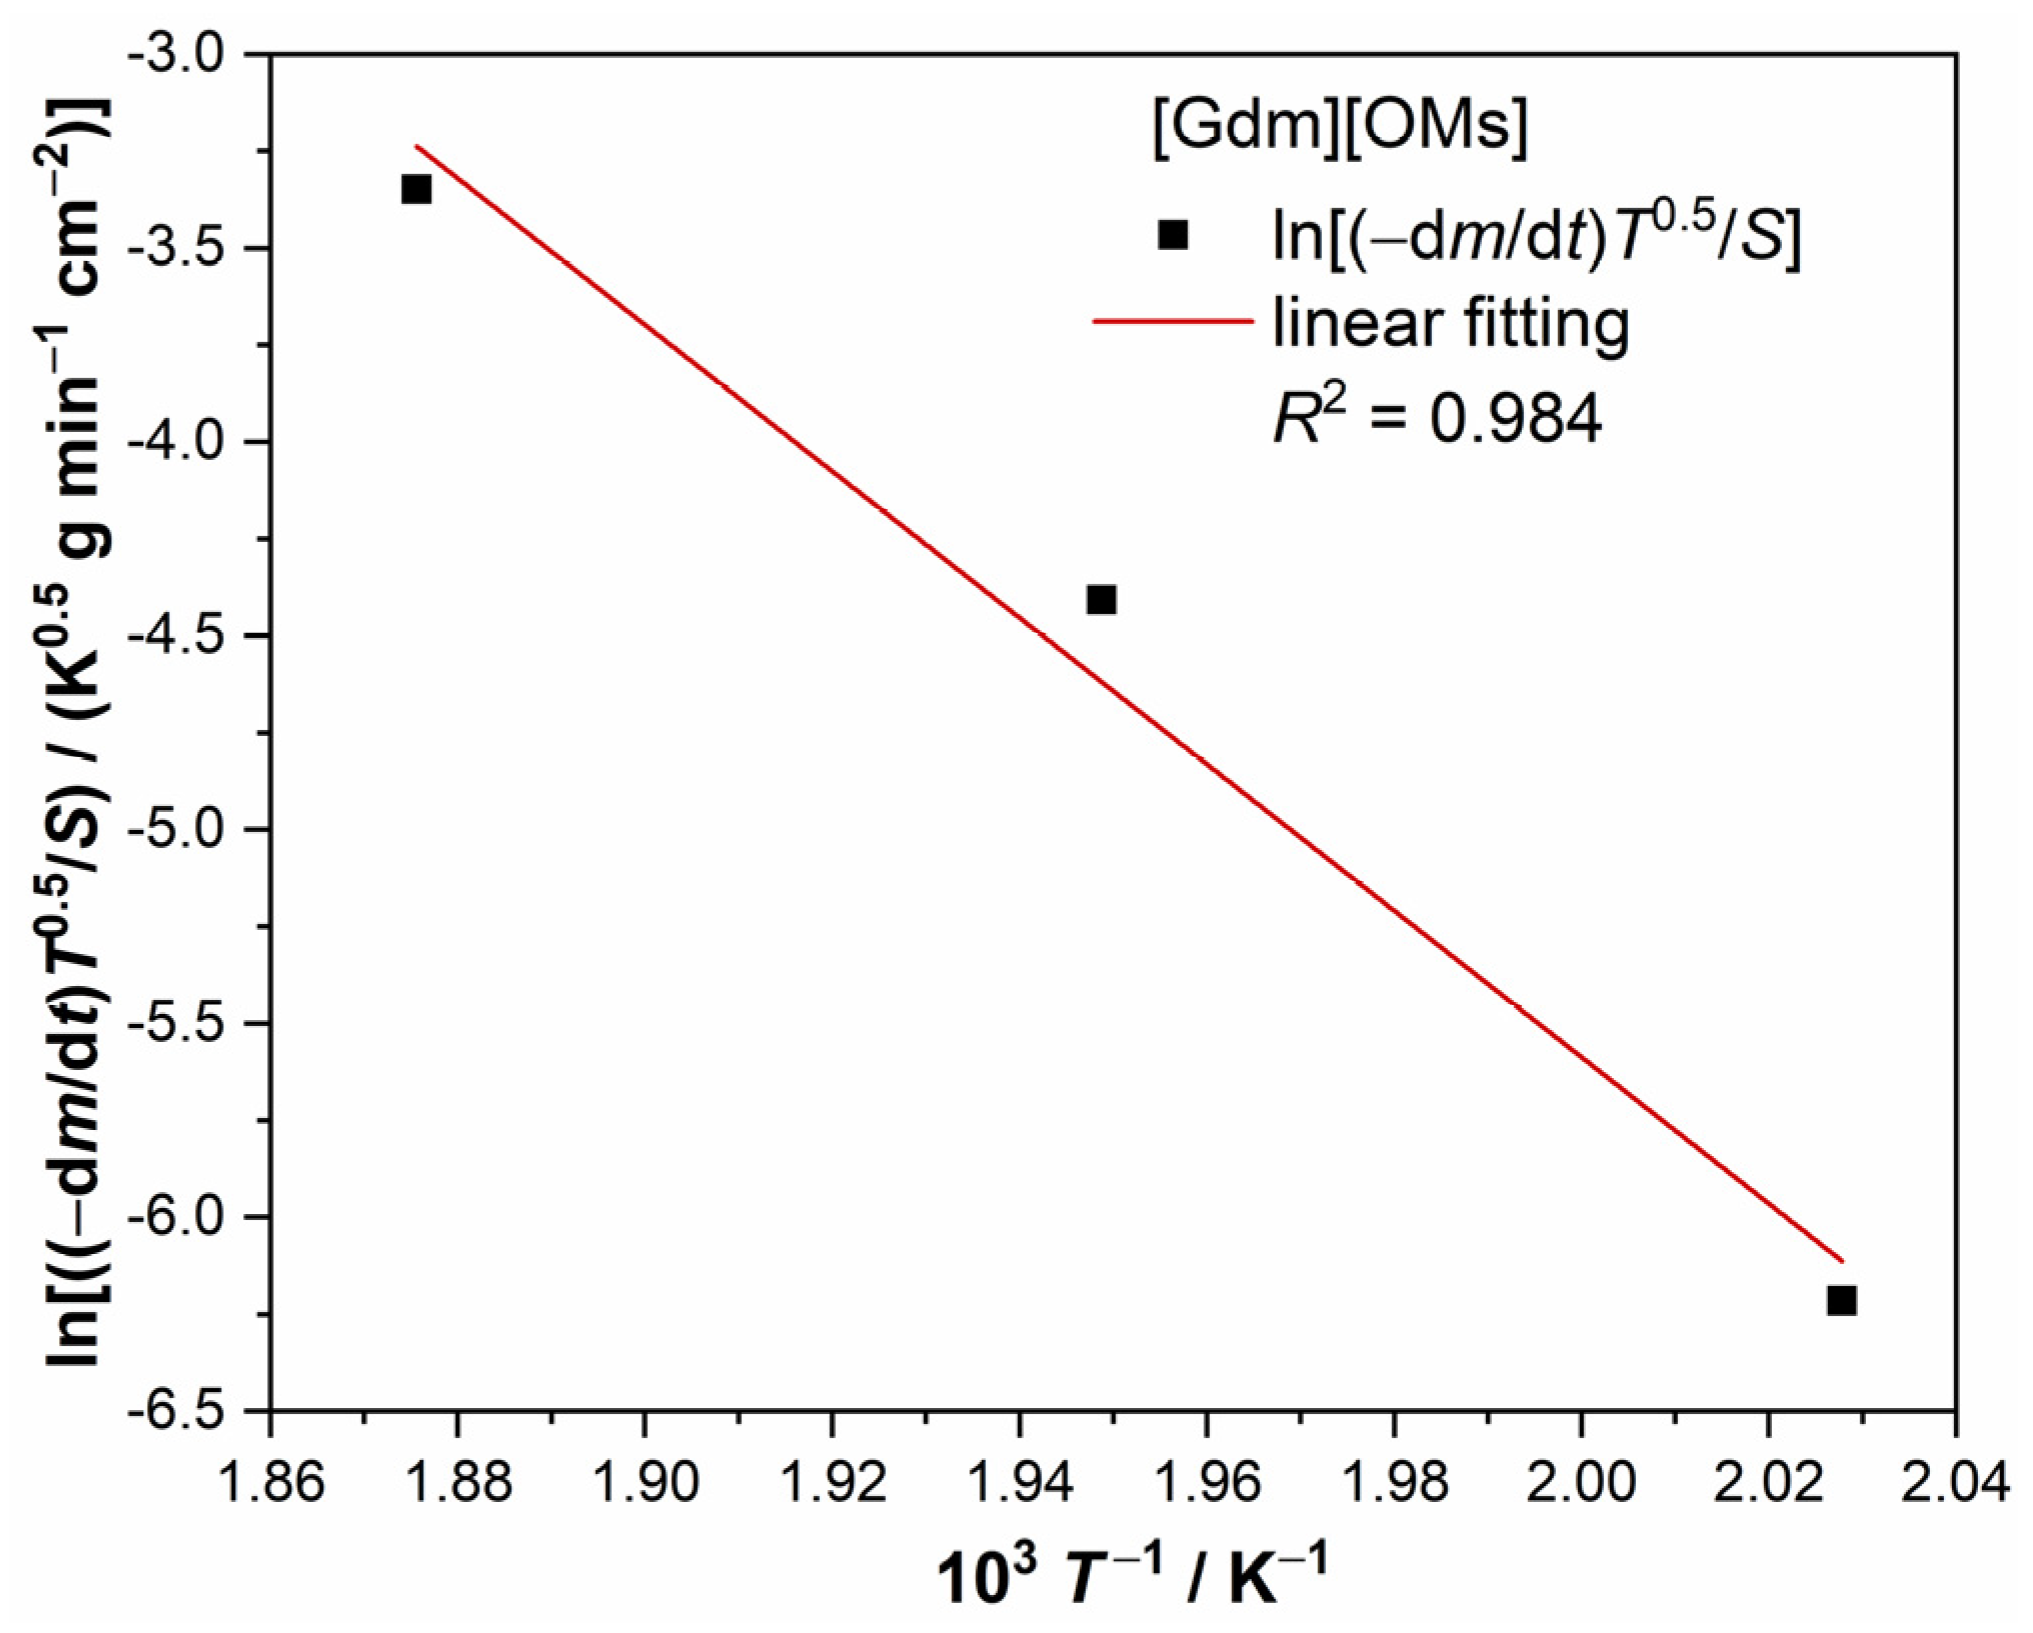
| 220 | 493.15 | 9.01 × 10⁻⁵ | 0.939 | 1.61 × 10⁻⁴ | 0.87 |
| 240 | 513.15 | 5.39 × 10⁻⁴ | 0.998 | 9.79 × 10⁻⁴ | 5.29 |
| 260 | 533.15 | 1.52 × 10⁻³ | 0.999 | 2.82 × 10⁻³ | 15.23 |
| 280 | 553.15 | 1.10 × 10⁻³ | 0.980 | 2.08 × 10⁻² | 112.26 |
| 300 | 573.15 | 8.68 × 10⁻² | 0.996 | 1.67 × 10⁻¹ | 899.98 |
Disclaimer/Publisher’s Note: The statements, opinions and data contained in all publications are solely those of the individual author(s) and contributor(s) and not of MDPI and/or the editor(s). MDPI and/or the editor(s) disclaim responsibility for any injury to people or property resulting from any ideas, methods, instructions or products referred to in the content. |
© 2024 by the authors. Licensee MDPI, Basel, Switzerland. This article is an open access article distributed under the terms and conditions of the Creative Commons Attribution (CC BY) license (https://creativecommons.org/licenses/by/4.0/).
Share and Cite
Bi, W.; Liu, S.; Rong, X.; Ma, G.; Luo, J. Vapor Pressure and Enthalpy of Vaporization of Guanidinium Methanesulfonate as a Phase Change Material for Thermal Energy Storage. Materials 2024, 17, 2582. https://doi.org/10.3390/ma17112582
Bi W, Liu S, Rong X, Ma G, Luo J. Vapor Pressure and Enthalpy of Vaporization of Guanidinium Methanesulfonate as a Phase Change Material for Thermal Energy Storage. Materials. 2024; 17(11):2582. https://doi.org/10.3390/ma17112582
Chicago/Turabian StyleBi, Wenrong, Shijie Liu, Xing Rong, Guangjun Ma, and Jiangshui Luo. 2024. "Vapor Pressure and Enthalpy of Vaporization of Guanidinium Methanesulfonate as a Phase Change Material for Thermal Energy Storage" Materials 17, no. 11: 2582. https://doi.org/10.3390/ma17112582
APA StyleBi, W., Liu, S., Rong, X., Ma, G., & Luo, J. (2024). Vapor Pressure and Enthalpy of Vaporization of Guanidinium Methanesulfonate as a Phase Change Material for Thermal Energy Storage. Materials, 17(11), 2582. https://doi.org/10.3390/ma17112582