Article

Comparative Study on Passive Film Formation Mechanism of Cast and PBF-LB/M-TC4 in Simulated Physiological Solution

1
Department of Materials Science and Engineering, Xi’an University of Technology, Xi’an 710048, China
2
Shaanxi Province Key Laboratory of Corrosion and Protection, Xi’an University of Technology, Xi’an 710048, China
3
Center for Advancing Materials Performance from the Nanoscale (CAMP-Nano), State Key Laboratory for Mechanical Behavior of Materials, Xi’an Jiaotong University, Xi’an 710049, China
4
Shaanxi Zhou Doctor Dental Medical Co., Ltd., Xi’an 710086, China
5
Xi’an QinTi Intelligent Manufacturing Technologies Co., Ltd., Xi’an 710061, China
6
State Key Laboratory of Solidification Processing, Northwestern Polytechnical University, Xi’an 710072, China
7
Research and Development Department, Beijing Med-Zenith Medical Scientific Corporation Limited, Beijing 101316, China
*
Authors to whom correspondence should be addressed.
Those authors contribute equally to this work.
Materials 2024, 17(11), 2583; https://doi.org/10.3390/ma17112583
Submission received: 11 April 2024 / Revised: 22 May 2024 / Accepted: 24 May 2024 / Published: 27 May 2024
(This article belongs to the Special Issue Corrosion and Mechanical Behavior of Metal Materials (2nd Edition))

Abstract

:
Personalized laser powder bed fusion (PBF-LB/M) Ti-6Al-4V (TC4) has a broader application prospect than that of traditional casting. In this paper, the composition and corrosion resistance of the passive film formation mechanism of TC4 prepared by optimization of PBF-LB/M techniques and traditional casting were systematically studied in 0.9 wt.% NaCl at 37 °C by electrochemical technique and surface analysis. The rates of the passive film formation process, corrosion resistance and composition of TC4 show different characteristics for the different preparation processes. Although the rate of passive film formation of cast-TC4 was higher at the initial immersion, the open circuit potential was more positive, and the film thickness was larger after stabilization, those facts show no positive correlation with corrosion resistance. On the contrary, with no obvious defects on the optimized PBF-LB/M-TC4, the passive film resistance is 2.5 times more, the defect concentration is reduced by 30%, and the TiO2 content is higher than that of the cast-TC4, making the martensitic-based PBF-LB/M-TC4 exhibit excellent corrosion resistance. This also provides good technical support for the further clinical application of PBF-LB/M-TC4.

1. Introduction

Titanium (Ti) and its alloys have been widely employed in the medicine field. The studies on Ti and Ti alloys have already become the focus of study and the front field as biomedical implants [1,2,3], and they occupy “half of the country” in the field of medical metals. TC4 (Ti-6Al-4V) has a series of advantages, such as small density, high specific strength, excellent corrosion resistance, good toughness and weld ability, and has been resoundingly applied as artificial joints, vascular stents and orthopedic instruments [4,5,6].
As a kind of easy passivation alloy, the surface of Ti and Ti alloys can form a TiO2-containing passive film in the air protecting it from corrosion [7]. Nevertheless, the corrosion environment of Ti implants in human body is relatively severe, and the local acidizing and mechanical loading on implants may reduce the stability of its passive films, which may lead to further environmental pollution and damage of the formed film, affecting the durability of the implant. It has been confirmed that the corrosion resistance of TC4 in vivo or in vitro will be affected by many factors, such as the microstructure of materials, the coatings and the corrosive environment [8,9,10,11].
At present, the manufacturing process of TC4 includes casting, forging and machining [12,13], which are time-consuming and costly. With its complex operation, casting is at a high cost and causes environmental pollution, but it still is the conventional process for manufacturing oral prostheses. Hence, the design and manufacture of biomedical Ti alloys urgently require a fast and economical manufacturing method. In recent years, PBF-LB/M technology (also known as additive manufacturing) has unique advantages compared with traditional equal or reduced manufacturing. PBF-LB/M is a rapid prototyping technology for the direct manufacturing of terminal and near-terminal TC4 products [14,15]. The phase corrosion resistance in PBF-LB/M-TC4 is β > α > α’, and the V element in the β phase can stabilize the lattice structure, which is conducive to corrosion resistance; however, the V element in the α’ phase is relatively easy to dissolve, resulting in poor corrosion resistance [16,17,18,19]. There have also been plenty of studies on the passive film corrosion resistance of other Ti alloys [20,21,22,23]; a systematic and comprehensive evaluation of the corrosion behavior of Ti alloys is given, but it is worth noting that the good corrosion resistance of Ti and Ti alloys derives from the compact corrosion-resistant passive films.
In this study, the formation mechanism of the passive film and corrosion resistance of the optimized PBF-LB/M-TC4 prepared by PBF-LB/M and the traditional cast TC4 (cast-TC4) were systematically investigated in a simulated physiological solution (0.9 wt.% NaCl). Electrochemical techniques were applied to evaluate the passive film formation mechanism and corrosion resistance, and the composition and thickness of the passive film were further analyzed by surface technology.

2. Experimental Section

2.1. Material and Sample Preparation

The YLM-120 selective laser melting equipment produced by Jiangsu Yongnian laser forming Technology Co., Ltd. (Wuxi, Jiangsu, China) with high-precision circular working cylinder and multi-level precision guidance-sealing system was applied to fabricate the PBF-LB/M-TC4, which can effectively reduce the loss of metal powder and pollution. The raw material is 0.02 mm of spherical powder. In the preparation process, argon gas was selected as the protection gas. The following parameters could be selected based on our optimization: the hatch distance is 0.12 mm, the laser power is 275 W, the scanning velocity is 1100 mm/s, and the layer thickness is 30 μm. The comparison cast-TC4 sample was fabricated with lost wax.
The PBF-LB/M- and cast-TC4 cube samples (10 × 10 × 4 mm) were chosen for microstructure analysis, electrochemical testing and surface detection, respectively. For electrochemical testing samples, the one side (10 × 10 mm) was spliced with copper wire by conductive adhesive, the exposed testing area is 1 cm2, and the rest of the sample was sealed with epoxy resin. All samples were polished step by step with SiC sandpaper from 200–2000 # before the experiment, then washed with alcohol and deionized water and dried.

2.2. Electrochemical Tests

Electrochemical tests were performed on a VMP3 multi-channel electrochemical workstation (Biologic, Seyssinet-Pariset, France) with a standard three-electrode system. The reference electrode is SCE (the saturated calomel reference electrode), the platinum sheet (12 cm2) is the counter electrode, and the PBF-LB/M- and cast-TC4 sample is the working electrode. The simulated physiological solution with a mass fraction of 0.9 wt.% NaCl was applied in the test. Firstly, a long open circuit potential (OCP) was continuously monitored for 168 h. The polarization curves were measured after immersion for 0.5 h and 120 h, respectively. The scanning of the potentiodynamic polarization curve was from cathodic −250 mV vs. OCP to the anode with a 1 mV/s scanning rate and stopped when the anode current density exceeded 100 μA/cm2. Four potential ranges were applied for the cyclic voltammetry (CV) test: −2 VSCE to 2.5 VSCE, −2 VSCE to 2 VSCE, −1.5 VSCE to 1.5 VSCE and −1 VSCE to 1 VSCE. The scanning started from cathode to anode and then back to the cathode, with five scanning cycles and a fixed scanning rate of 100 mV/s. The linear polarization was performed from cathode to anode with a scanning potential range of ±20 mVSCE and a scanning rate of 0.2 mV/s. Electrochemical impedance spectroscopy (EIS) measurements were performed under OCP with a signal of 10 mV sine wave and a test frequency range of 100 kHz–10 mHz. ZsimpWin 3.5 software was applied to analyze the test results. The Mott–Schottky was tested with a fixed frequency and scanning rate of 1 kHz and 50 mV/s, and the potential range of scanning was −1.0 VSCE to 3 VSCE. All electrochemical measurements were tested three times, and the representative results were given. The temperature for all electrochemical tests was controlled at 37 °C by a thermostat water bath.

2.3. X-ray Photoelectron Spectroscopy Analysis

The X-ray photoelectron spectroscopy (XPS) was applied (Thermo Scientific, Oxford, UK) to identify the passive film composition of PBF-LB/M- and cast-TC4 samples’ immersion in physiological solution for 168 h. The monochromator was Al Kα, the sensitivity was 100 kcps, the spectrum scanning range was 0–1350 eV, the wide scanning interval was 1 eV, the narrow scanning interval was 0.1 eV, and the spectrum was calibrated with C1s (285.0 eV). The composition of two TC4 passive films was analyzed by Xpspeak 4.1 software using the Gauss–Newton fitting mode.

2.4. Auger Electron Spectroscopy Analysis

Auger electron spectroscopy (AES) was performed on a PHI-700 (ULVAC-PHI, Chigasaki, Japan) equipped to analyze the passive films’ thickness variation of a two TC4 sample’s immersion in physiological solution for 168 h. A coaxial electron gun and CMA energy analyzer were adopted. Auger spectra were taken at 5 keV with an energy resolution of 0.1%, the incidence angle was 30°, and the vacuum of the analysis chamber was <3.9 × 10⁻⁹ Torr. The depth profile was obtained by etching a Φ100 nm spot on the surface of the passive film with Ar+ ions, and the thermal oxidation of standard SiO2/Si was adopted to determine the sputtering rate of 1 nm/min.

3. Results and Discussion

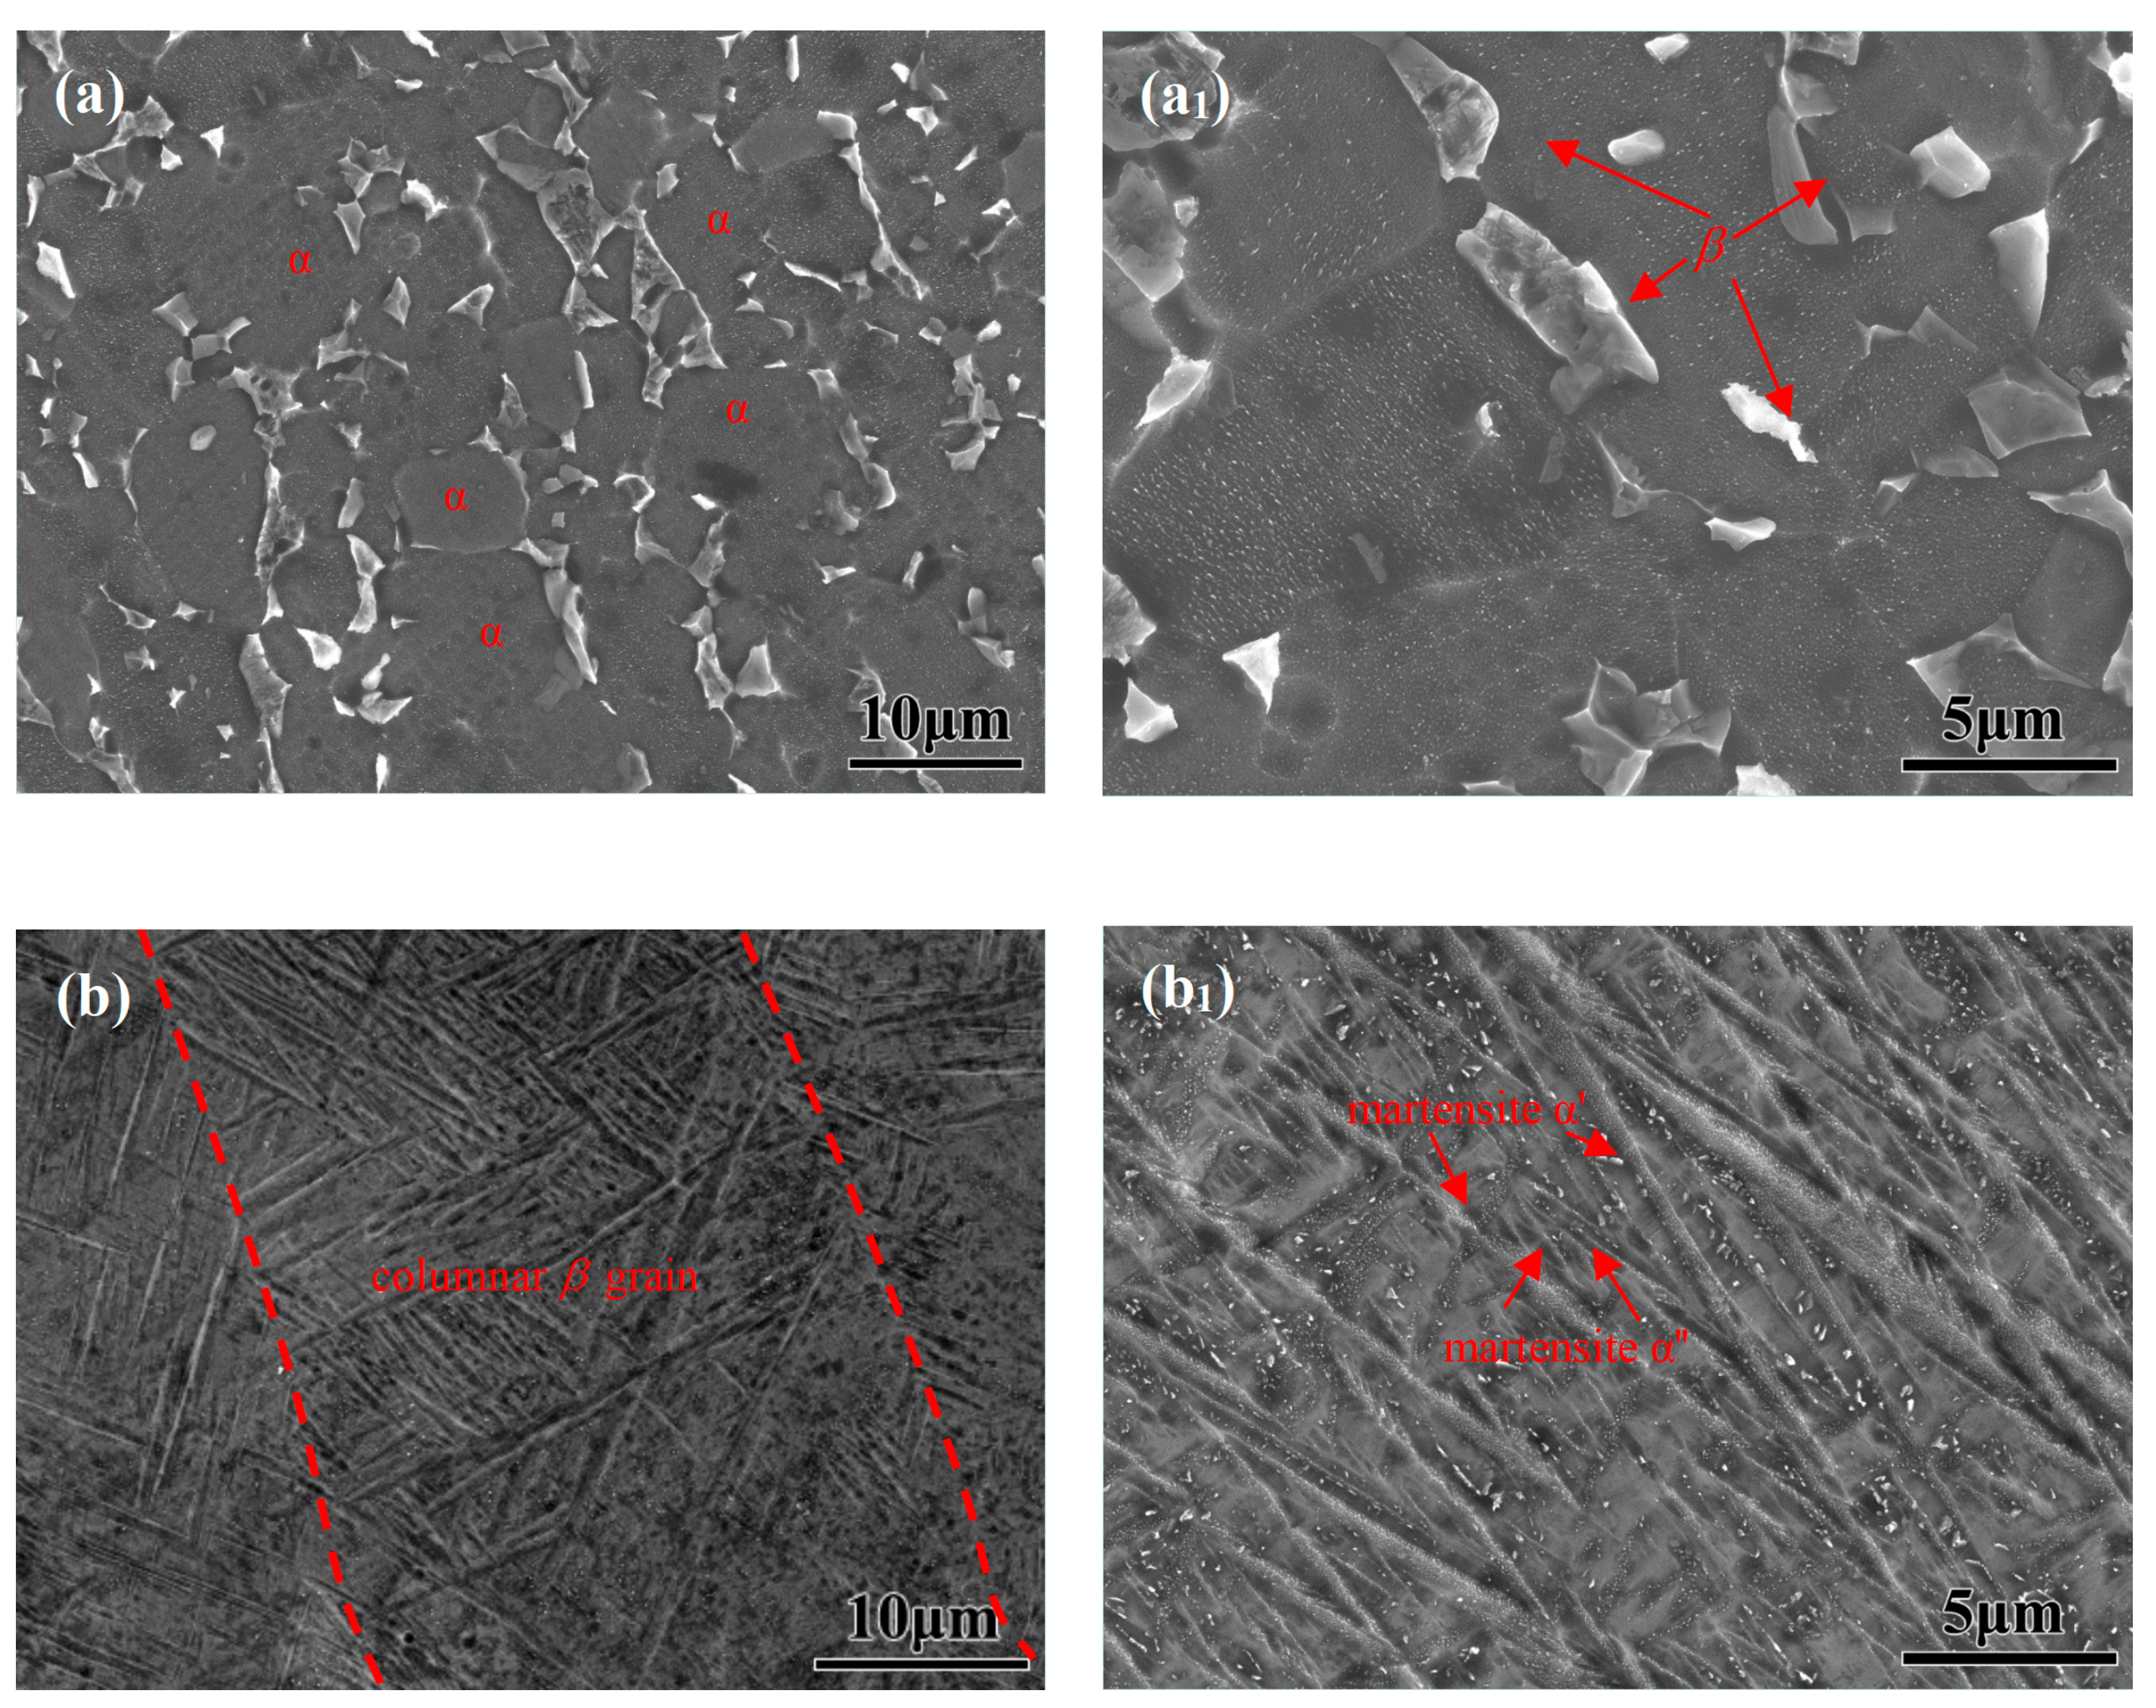
3.1. Microstructure Analysis

It can be seen from the scanning electron microscopy (SEM) in Figure 1a,a1 that the microstructure of traditional cast-TC4 is mainly equiaxed. The metastable β phase and the equiaxial α phase are uniformly distributed on the matrix, the duplex α-phase microstructure volume fraction is about 73.65%, the microstructure dispersion is high, and the grain size is about 9.75 μm. Figure 1b,b1 depicts the SEM morphology of PBF-LB/M-TC4.
The β-phase self-diffusion coefficient is higher, and the grain growth activation energy is lower, which leads to the epitaxial growth of grains. The martensitic lath in the β-phase columnar crystal has a preferred orientation, so the structure diagram shows an alternating phenomenon of light and dark. The longitudinal macro structure is an epitaxial growth columnar crystal with a length of up to a millimeter and a width of 27.34 μm. Upon further enlarging the longitudinal section of the metallographic structure, it is found that a large number of acicular martensite is distributed in the columnar crystal, which is basically parallel along the length direction and is composed of martensite α’ and martensite α″.

3.2. Electrochemical Analysis

3.2.1. Open Circuit Potential

Figure 2 depicts the OCPs of cast- and PBF-LB/M-TC4 after immersion in physiological solution for 1800 s.
The variation in OCP at the early stage of immersion can determine the passive film formation rate [24]. As can be seen from Figure 2a, the OCP of two TC4 increases in the positive direction rapidly. The passive film growth rate can be derived by Equation (1) [25]:
E = const . + 2 . 303   δ / A log t
wherein δ is the passivation film formation rate corresponding to logt. A can be calculated by Equation (2):
A = n F R T α δ
where α and δ represent the charge transfer coefficient (α = 0.5) [26] and charge transfer process energy accumulation width ( δ = 1), respectively. Numerous studies have demonstrated that TiO2 is the main composition in the passive film of Ti-related alloys [2,19], and the results of XPS and AES will support that the passive film of two TC4is mainly TiO2. Herein, the thickening of the passive film is assumed to be mainly through Ti4+ diffusion to the Ti and oxygen interface and n = 4 in Equation (2); the calculated A equals 78 nm/V. The early-stage formation rate of passive film δ can be derived (see Figure 2b) and shows the following order: Cast-TC4 > PBF-LB/M-TC4 (see Figure 2c).
The long-term OCP of the two TC4 continuous monitoring for 168 h in physiological solution is depicted in Figure 2d. The OCP increases rapidly at the initial 0.5 h, then rises slowly at 0.5–48 h and stabilizes at 72 h. The 168 h OCP of the cast- and PBF-LB/M-TC4 is 101 mVSCE and −7 mVSCE, respectively. Here, the power function was applied to fitting the OCP vs. t [25]:
E = a exp ( t / b ) + c exp ( t / d ) + e
where ae are all constants. The E vs. t of two TC4 in 0.9 wt.% NaCl solution is fitted by Equation (3). It can be seen from the fitting results (see Figure 2e and Table 1) that the OCP of two TC4 alloy conforms well to the power function.

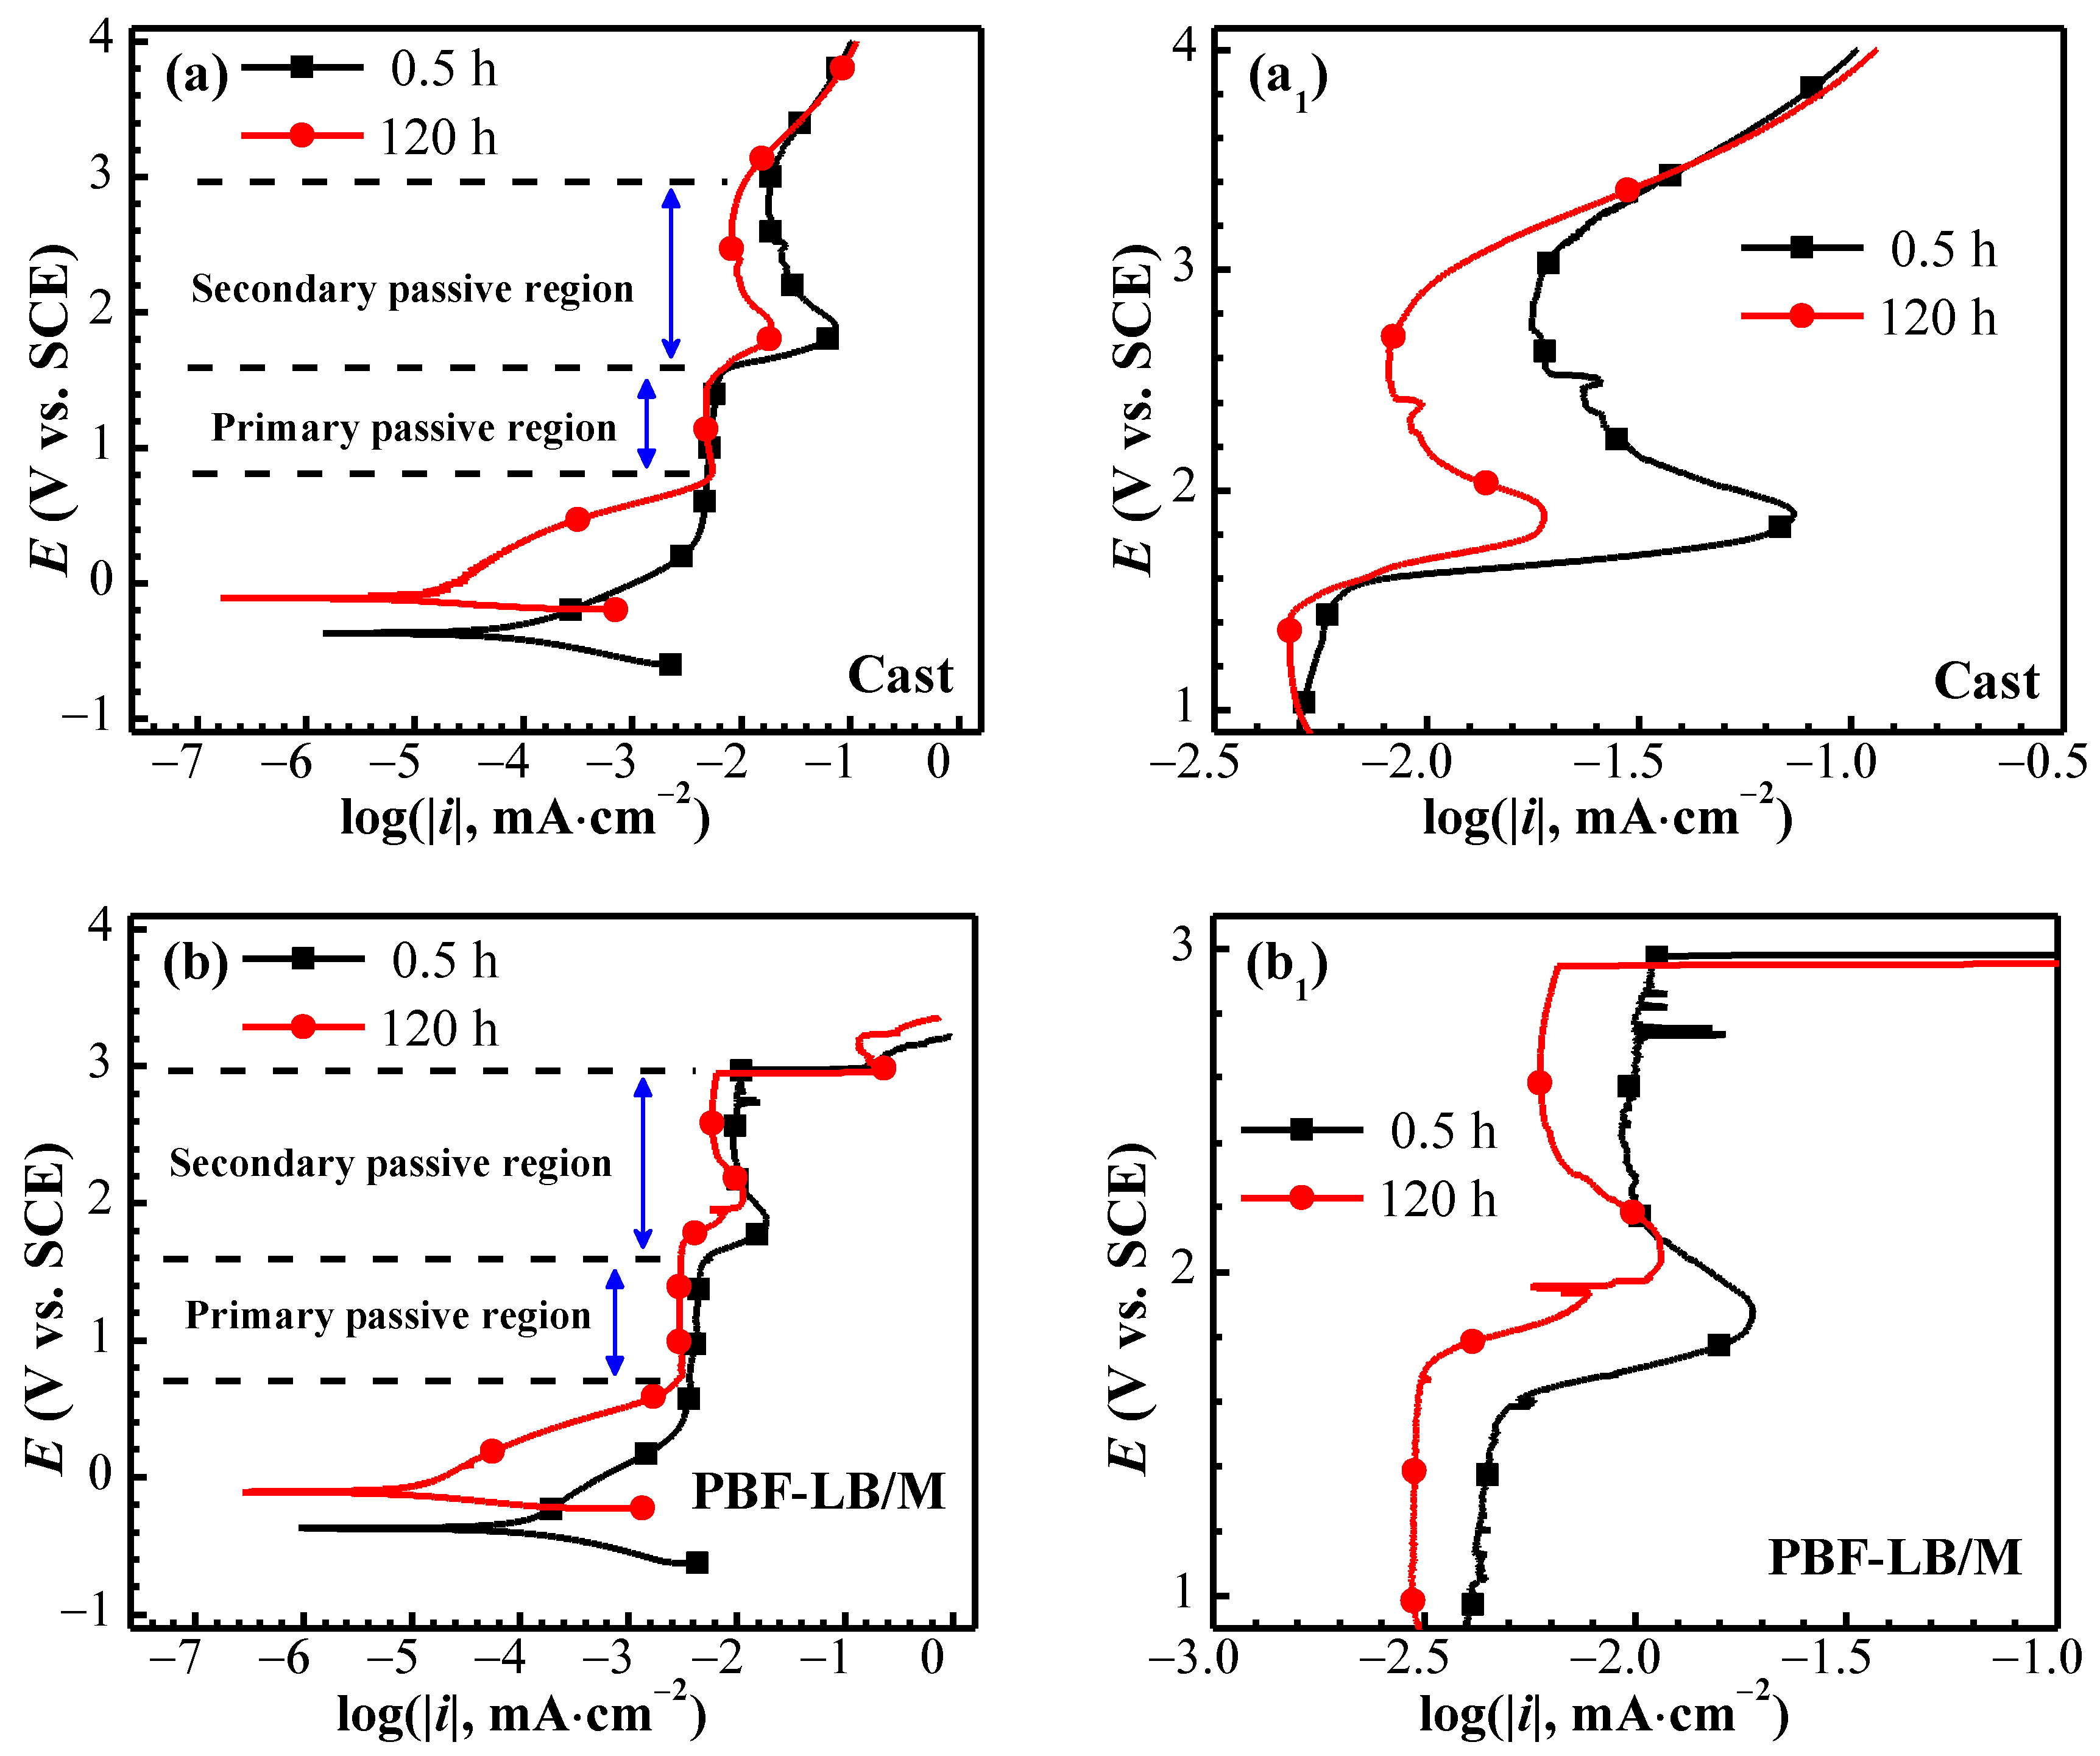
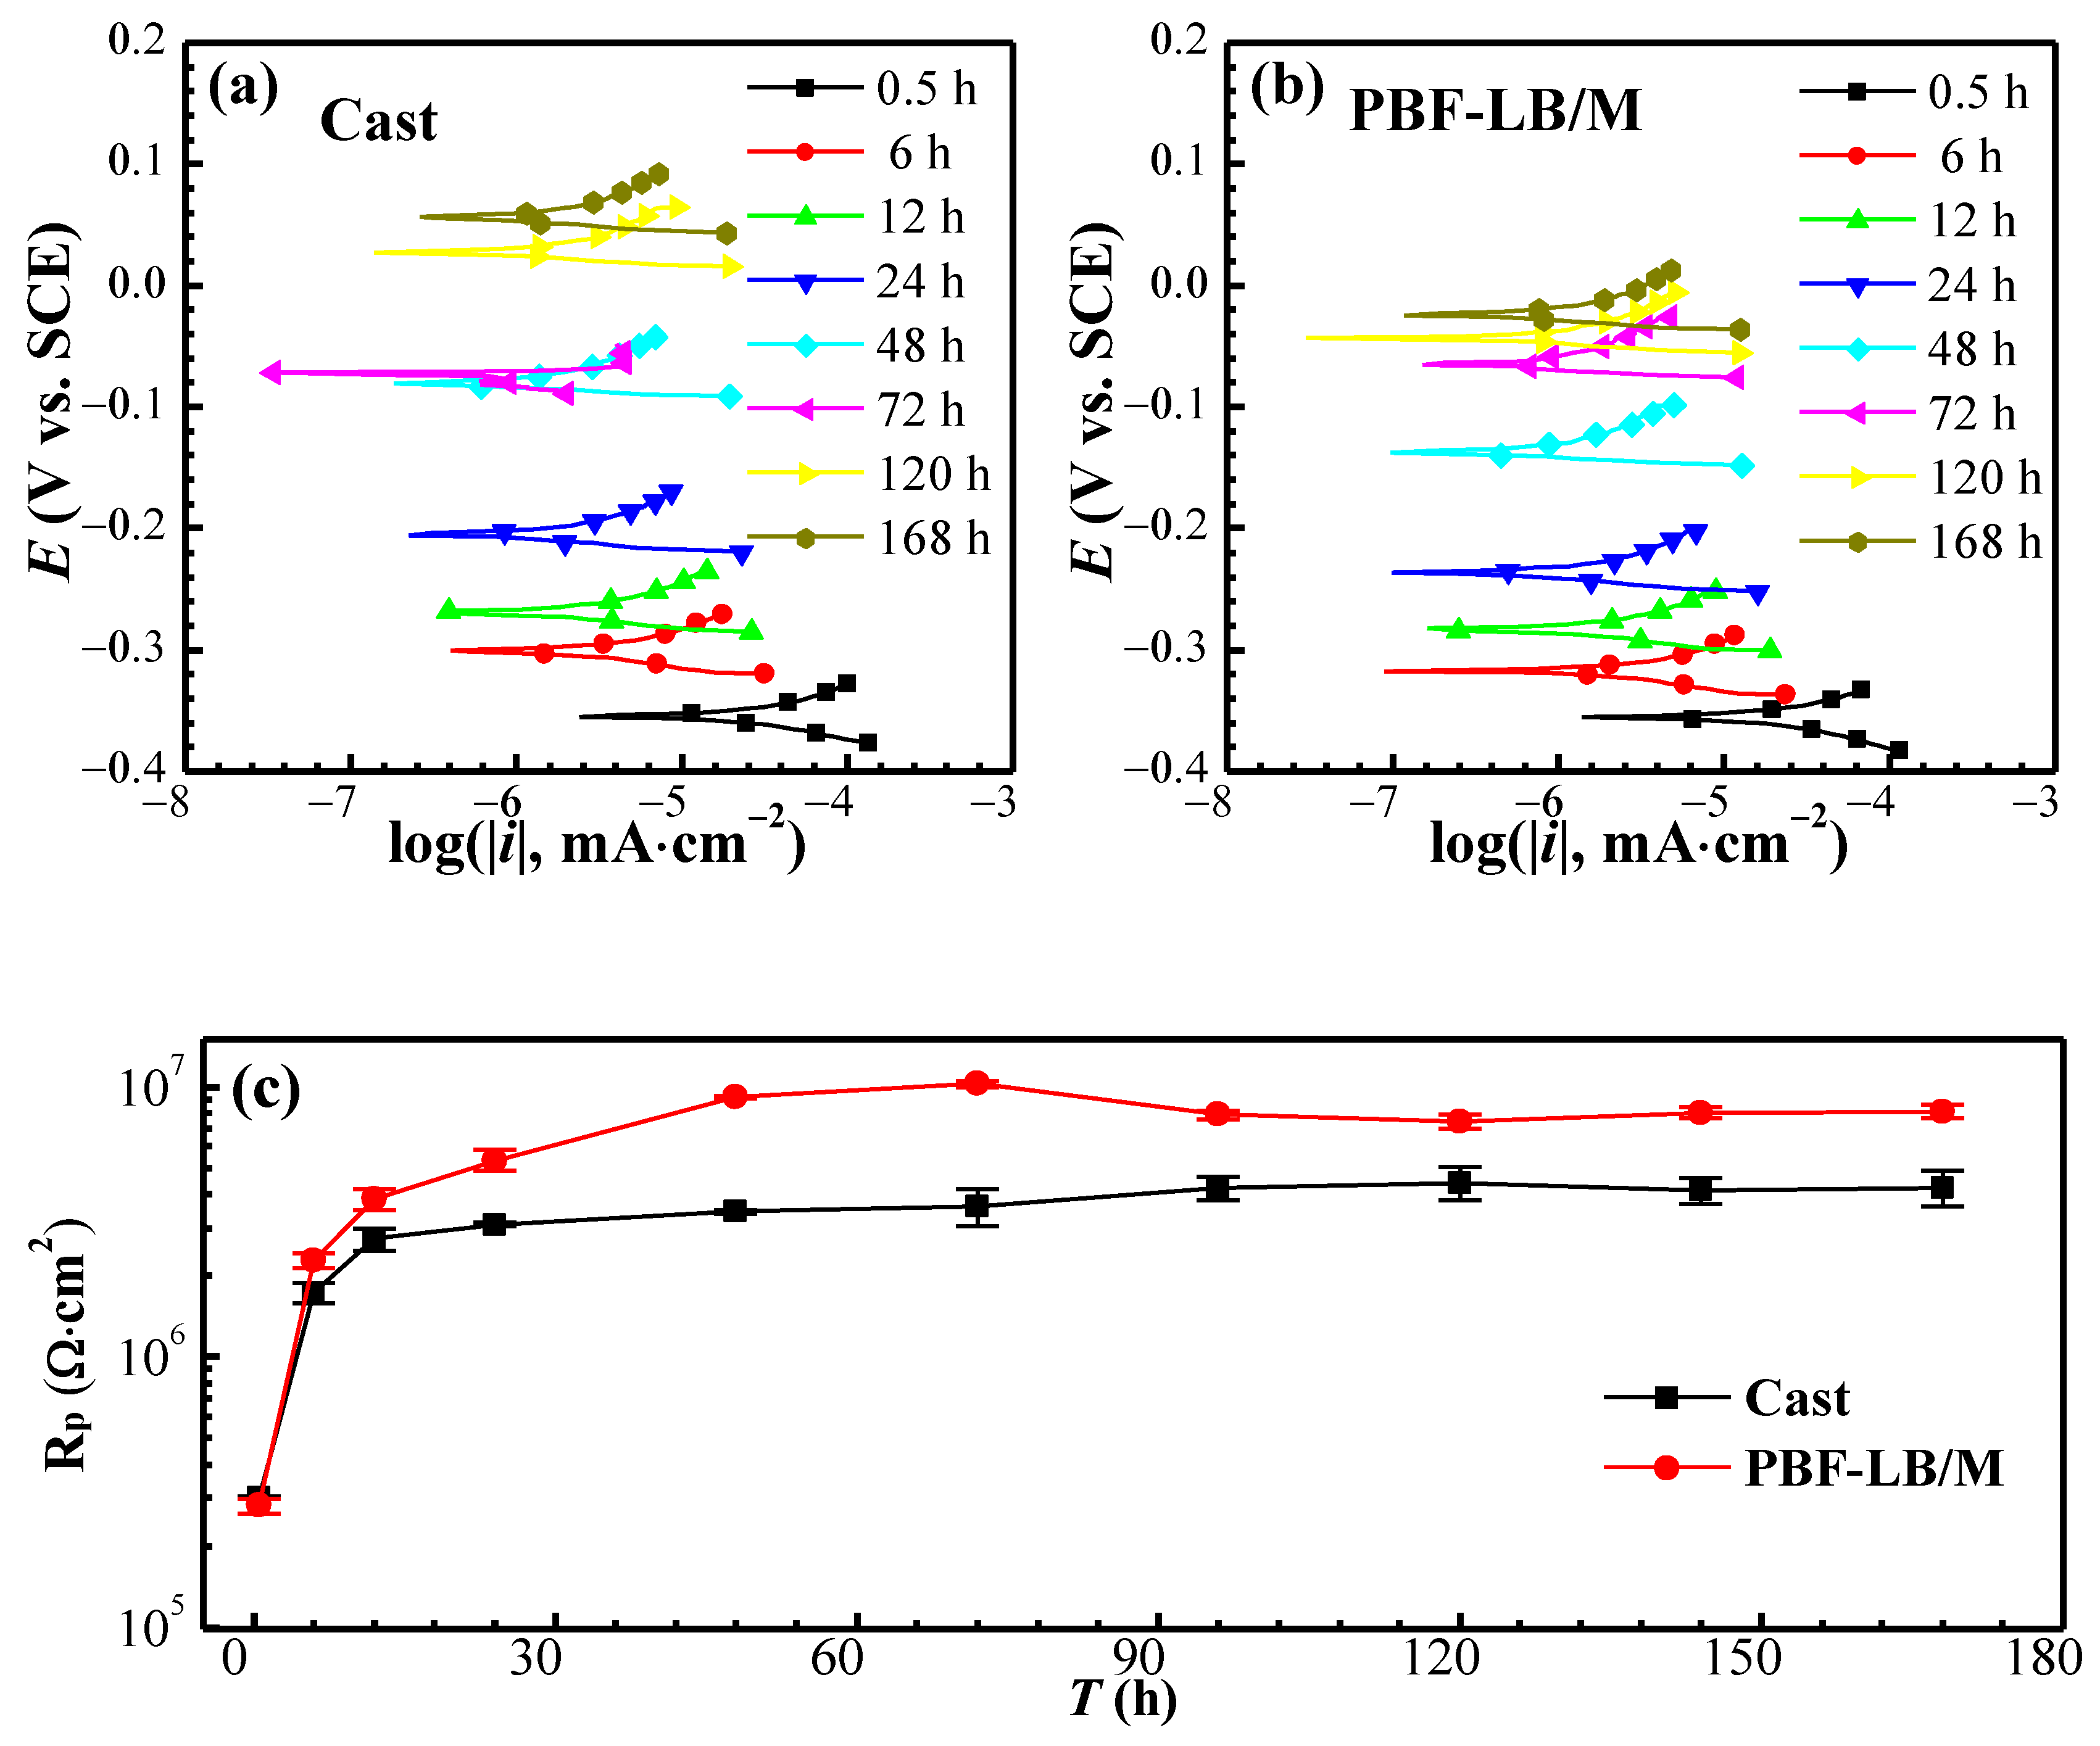
3.2.2. Potentiodynamic Polarization

In terms of corrosion thermodynamics, a completely stabilized OCP of two TC4 needs at least 72 h of immersion (see Figure 2). Herein, the test of potentiodynamic polarization curves chosen for 0.5 h and 120 h corresponds to the OCP (see Figure 3).
The anode polarization curves exhibit typical metal passivation characteristics, and two obvious passivation zones can be observed without obvious activation to passivation transition. The primary and the secondary passivation regions are 0.8–1.6 VSCE and 1.6–3 VSCE, respectively [27]. It can be seen from the fitting results derived from the potentiodynamic polarization curves shown in Table 2 that PBF-LB/M-TC4 has a relatively negative self-corrosion potential (Ecorr). The self-corrosion current density (icorr) from low to high at the first 0.5 h of immersion is as follows: cast-TC4 < PBF-LB/M-TC4 and inversely shows PBF-LB/M-TC4 < Cast-TC4 after 120 h of immersion. However, the maintaining passivity current density (ipass) of PBF-LB/M-TC4 is all along lower than that of cast-TC4 at fixed 1 VSCE.
The relatively limited integrity of the 0.5 h formed passive film may result in lower corrosion resistance. The metastable β phase and the equiaxial α phase of cast-TC4 promotes the passive film formation rate (Figure 3a). Nevertheless, the corrosion resistance of martensitic-based PBF-LB/M-TC4 (0.02 μA·cm−2) is higher than cast-TC4 (0.04 μA·cm−2) after immersion for 120 h and is positively correlated with the microstructure (Figure 1). Furthermore, the icorr of two TC4 reduces greatly after 120 h of immersion, which is much lower than 0.1 μA·cm−2 [24], indicating that a corrosion-resistant passive film could be formed under a longer period of immersion.

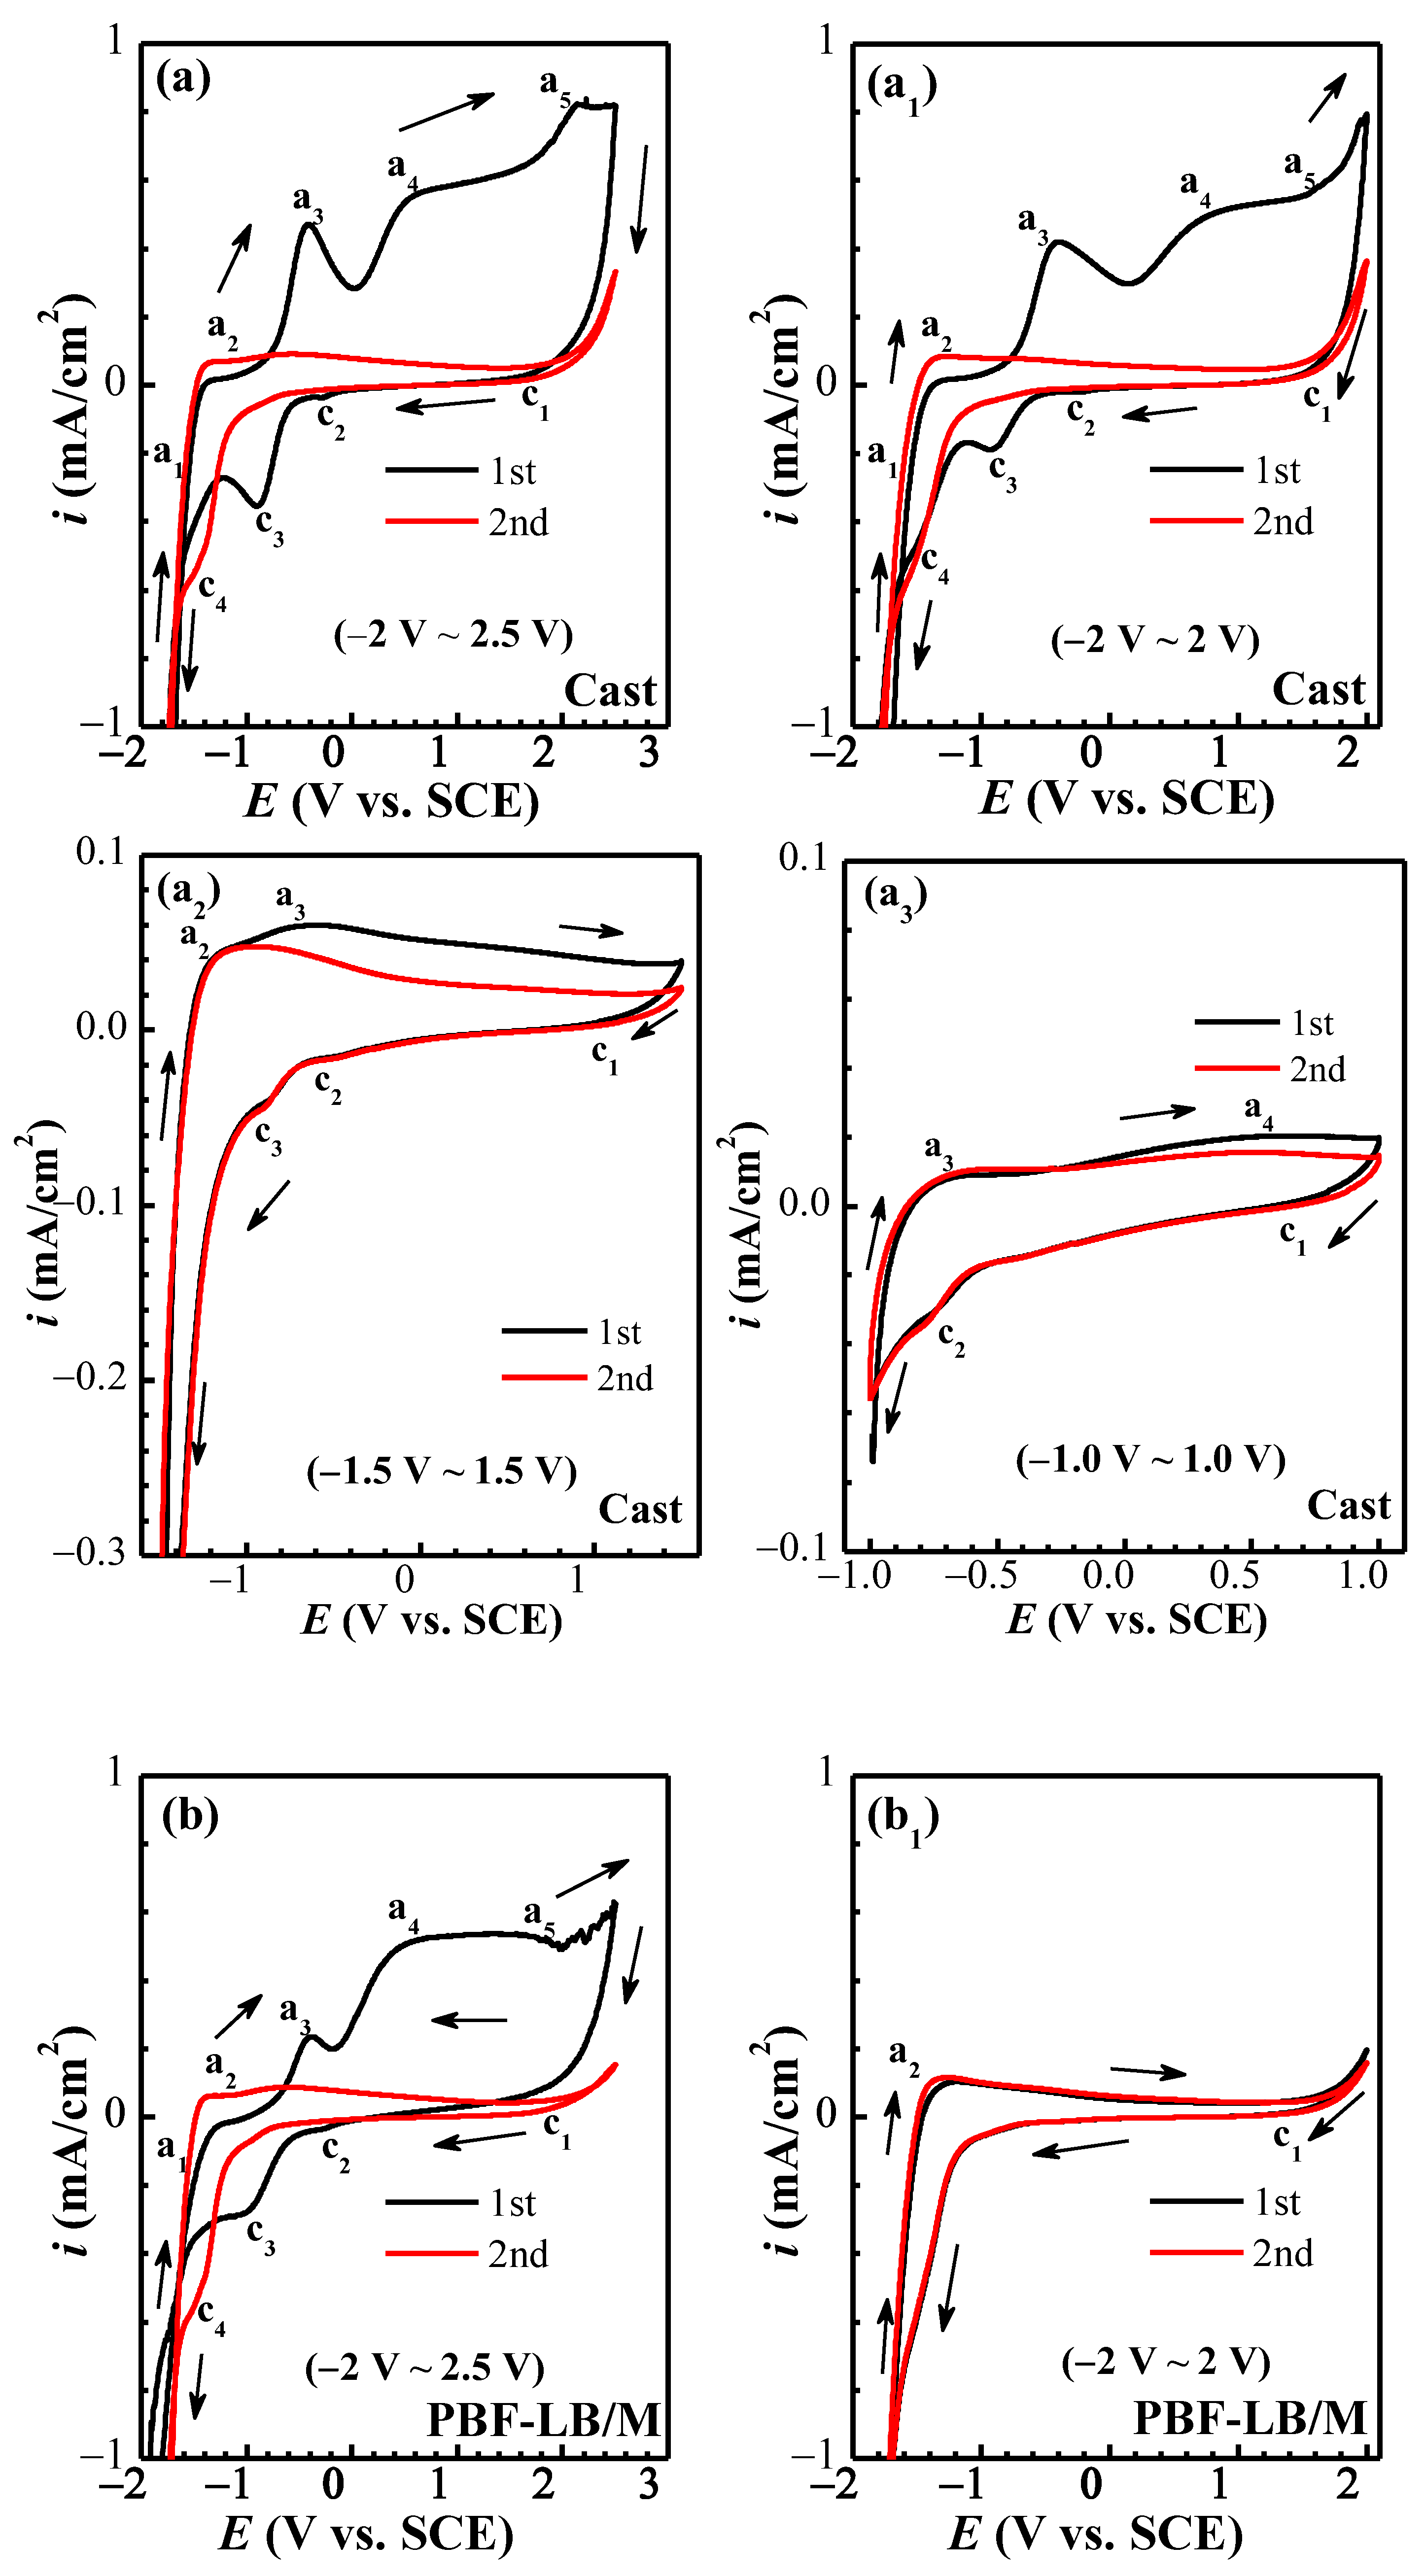
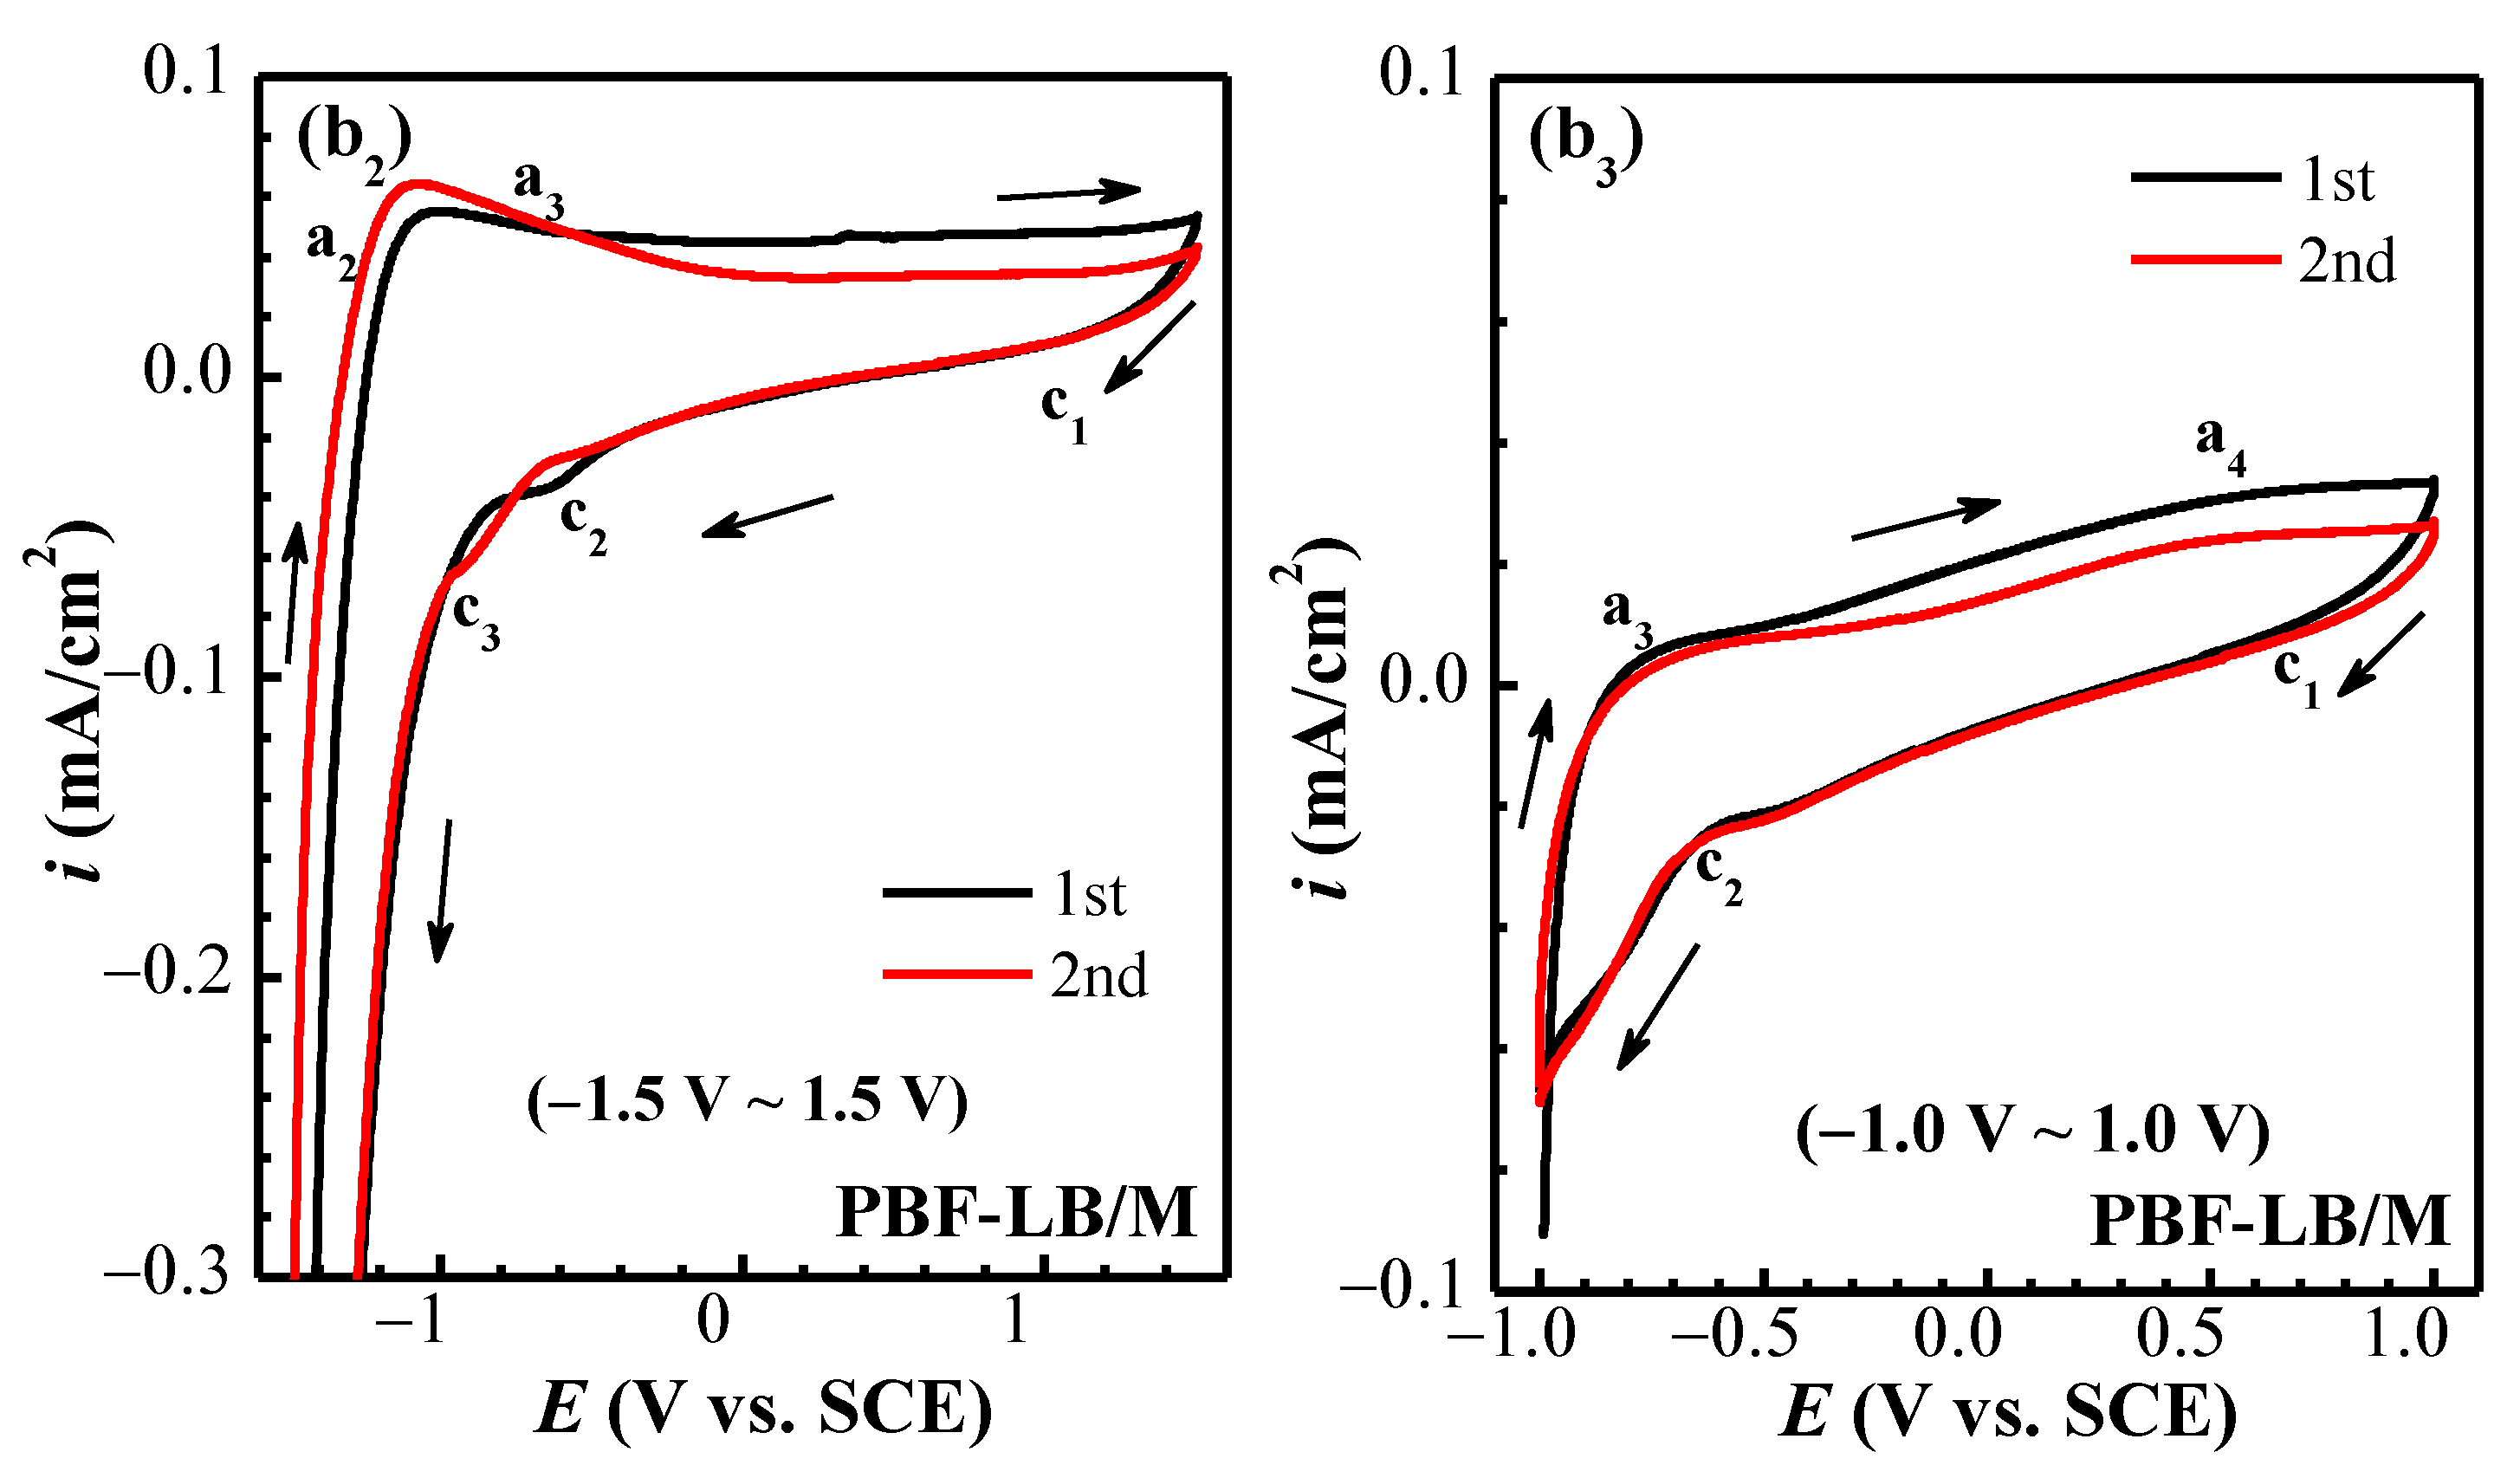
3.2.3. Cyclic Voltammetry

The cyclic voltammetry (CV) curves of two TC4 tested in different potential ranges are exhibited in Figure 4. Four different scanning potential ranges—(−2.0–2.5 VSCE), (2.0–2.0 VSCE), (−1.5–1.5 VSCE) and (−1.0–1.0 VSCE)—were selected to distinguish redox reactions as much as possible. In the first cycle of the wide potential range (−2–2.5 VSCE) in Figure 4a,b, five distinct anode current peaks could be seen—a1 (−1.38 VSCE), a2 (−1.1 VSCE) and a3 (−0.59 VSCE)—corresponding to the oxidizing of Ti to Ti2+, Ti2+ to Ti3+ and Ti3+ to Ti4+, respectively [21,27]:
a 1 :   Ti + H 2 O TiO + 2 H + + 2 e
a 2 :   2 TiO + H 2 O Ti 2 O 3 + 2 H + + 2 e
a 3 :   Ti 2 O 3 + H 2 O 2 TiO 2 + 2 H + + 2 e
The other two peaks (a4 and a5) could be seen when forward scan potential exceeds 0.6 VSCE, indicating that the electrode enters an oxygen-controlled zone.
Four cathodic current peaks can be detected in the reverse scanning, among which c1 (1.9 VSCE), c2 (−0.3 VSCE) and c3 (−0.87 VSCE) are the reduction peaks of a4 and a5, and a3 and a2, respectively. Due to the dissolved oxygen having a strong reduction reaction and reaching its limit at −0.6 VSCE [28], part of the reduction process signal of Ti4+/Ti2+/Ti could be covered up, resulting in an insignificant reduction peak. The a3 peak is the highest and the c2 peak can be observed, indicating that the film is mainly Ti4+ [27]. The a2 peak is relatively small, and a larger c3 peak can be seen, indicating Ti3+ may be present in the passive film. Except for the relatively obvious a2 peak, the other anode peaks are sharply reduced in the second scanning cycle for two alloys, but a new reduction peak c4 (−1.4 VSCE) corresponding to the oxidation peak a1 can be observed, indicating that Ti2+ is in an unstable state.
For the test potential range of −2~2 VSCE in Figure 4a1,b1, the CV curve of cast-TC4 is similar to that in Figure 4a.
Nevertheless, a stable film could be detected for PBF-LB/M-TC4, and only the inconspicuous peaks a2 and c1 could be seen on the overlapped CV curves. Only the a2 and a3 peaks and the corresponding c2 and c3 peaks can be seen in the scanning range of −1.5–1.5 VSCE (see Figure 4a2,b2), indicating that Ti4+ and Ti3+ exist in the passive film. The c3 peak of cast-TC4 is smaller, suggesting that Ti3+ is unstable, while the c2 peak of PBF-LB/M-TC4 is relatively larger, implying that Ti4+ remains in the passive film and shows better corrosion resistance [24]. The a3, a4, c1 and c2 peaks can be seen while further shortening the potential range to −1–1 VSCE (see Figure 4a3,b3), manifesting that TiO2 is mainly in the passive film.
The peaks of Al and V cannot be observed in the CV curves within the test potential ranges. Here, a preliminary judgement can be made that the two TC4 passive film is mainly Ti oxides, of which Ti4+ is the key component in the film. The stability of film from high to low is PBF-LB/M-TC4 > cast-TC4; the specific composition and change with thickness will be discussed in the XPS and AES section.

3.2.4. Linear Polarization Curve

The linear polarization (LPR) curves and the fitting results after being immersed for different times are depicted in Figure 5.
As can be seen from Figure 5a,b, the Ecorr moves upward, and the overall potential of the cast-TC4 is more positive than that of the PBF-LB/M-TC4 under the same conditions, which is consistent with the OCP part (see Figure 2c). The polarization resistance (Rp) values after fitting the slope of the LPR curves is shown in Figure 5c. Despite the Ecorr of the cast-TC4 being more positive than that of PBF-LB/M-TC4, the RP shows the opposite trend except for immersion for 0.5 h. After 168 h of immersion, the RP of PBF-LB/M-TC4 (8.2 × 10⁶ Ω·cm2) is twice that of cast-TC4 (4.1 × 10⁶ Ω·cm2), indicating that the passive film of PBF-LB/M-TC4 has excellent corrosion resistance.

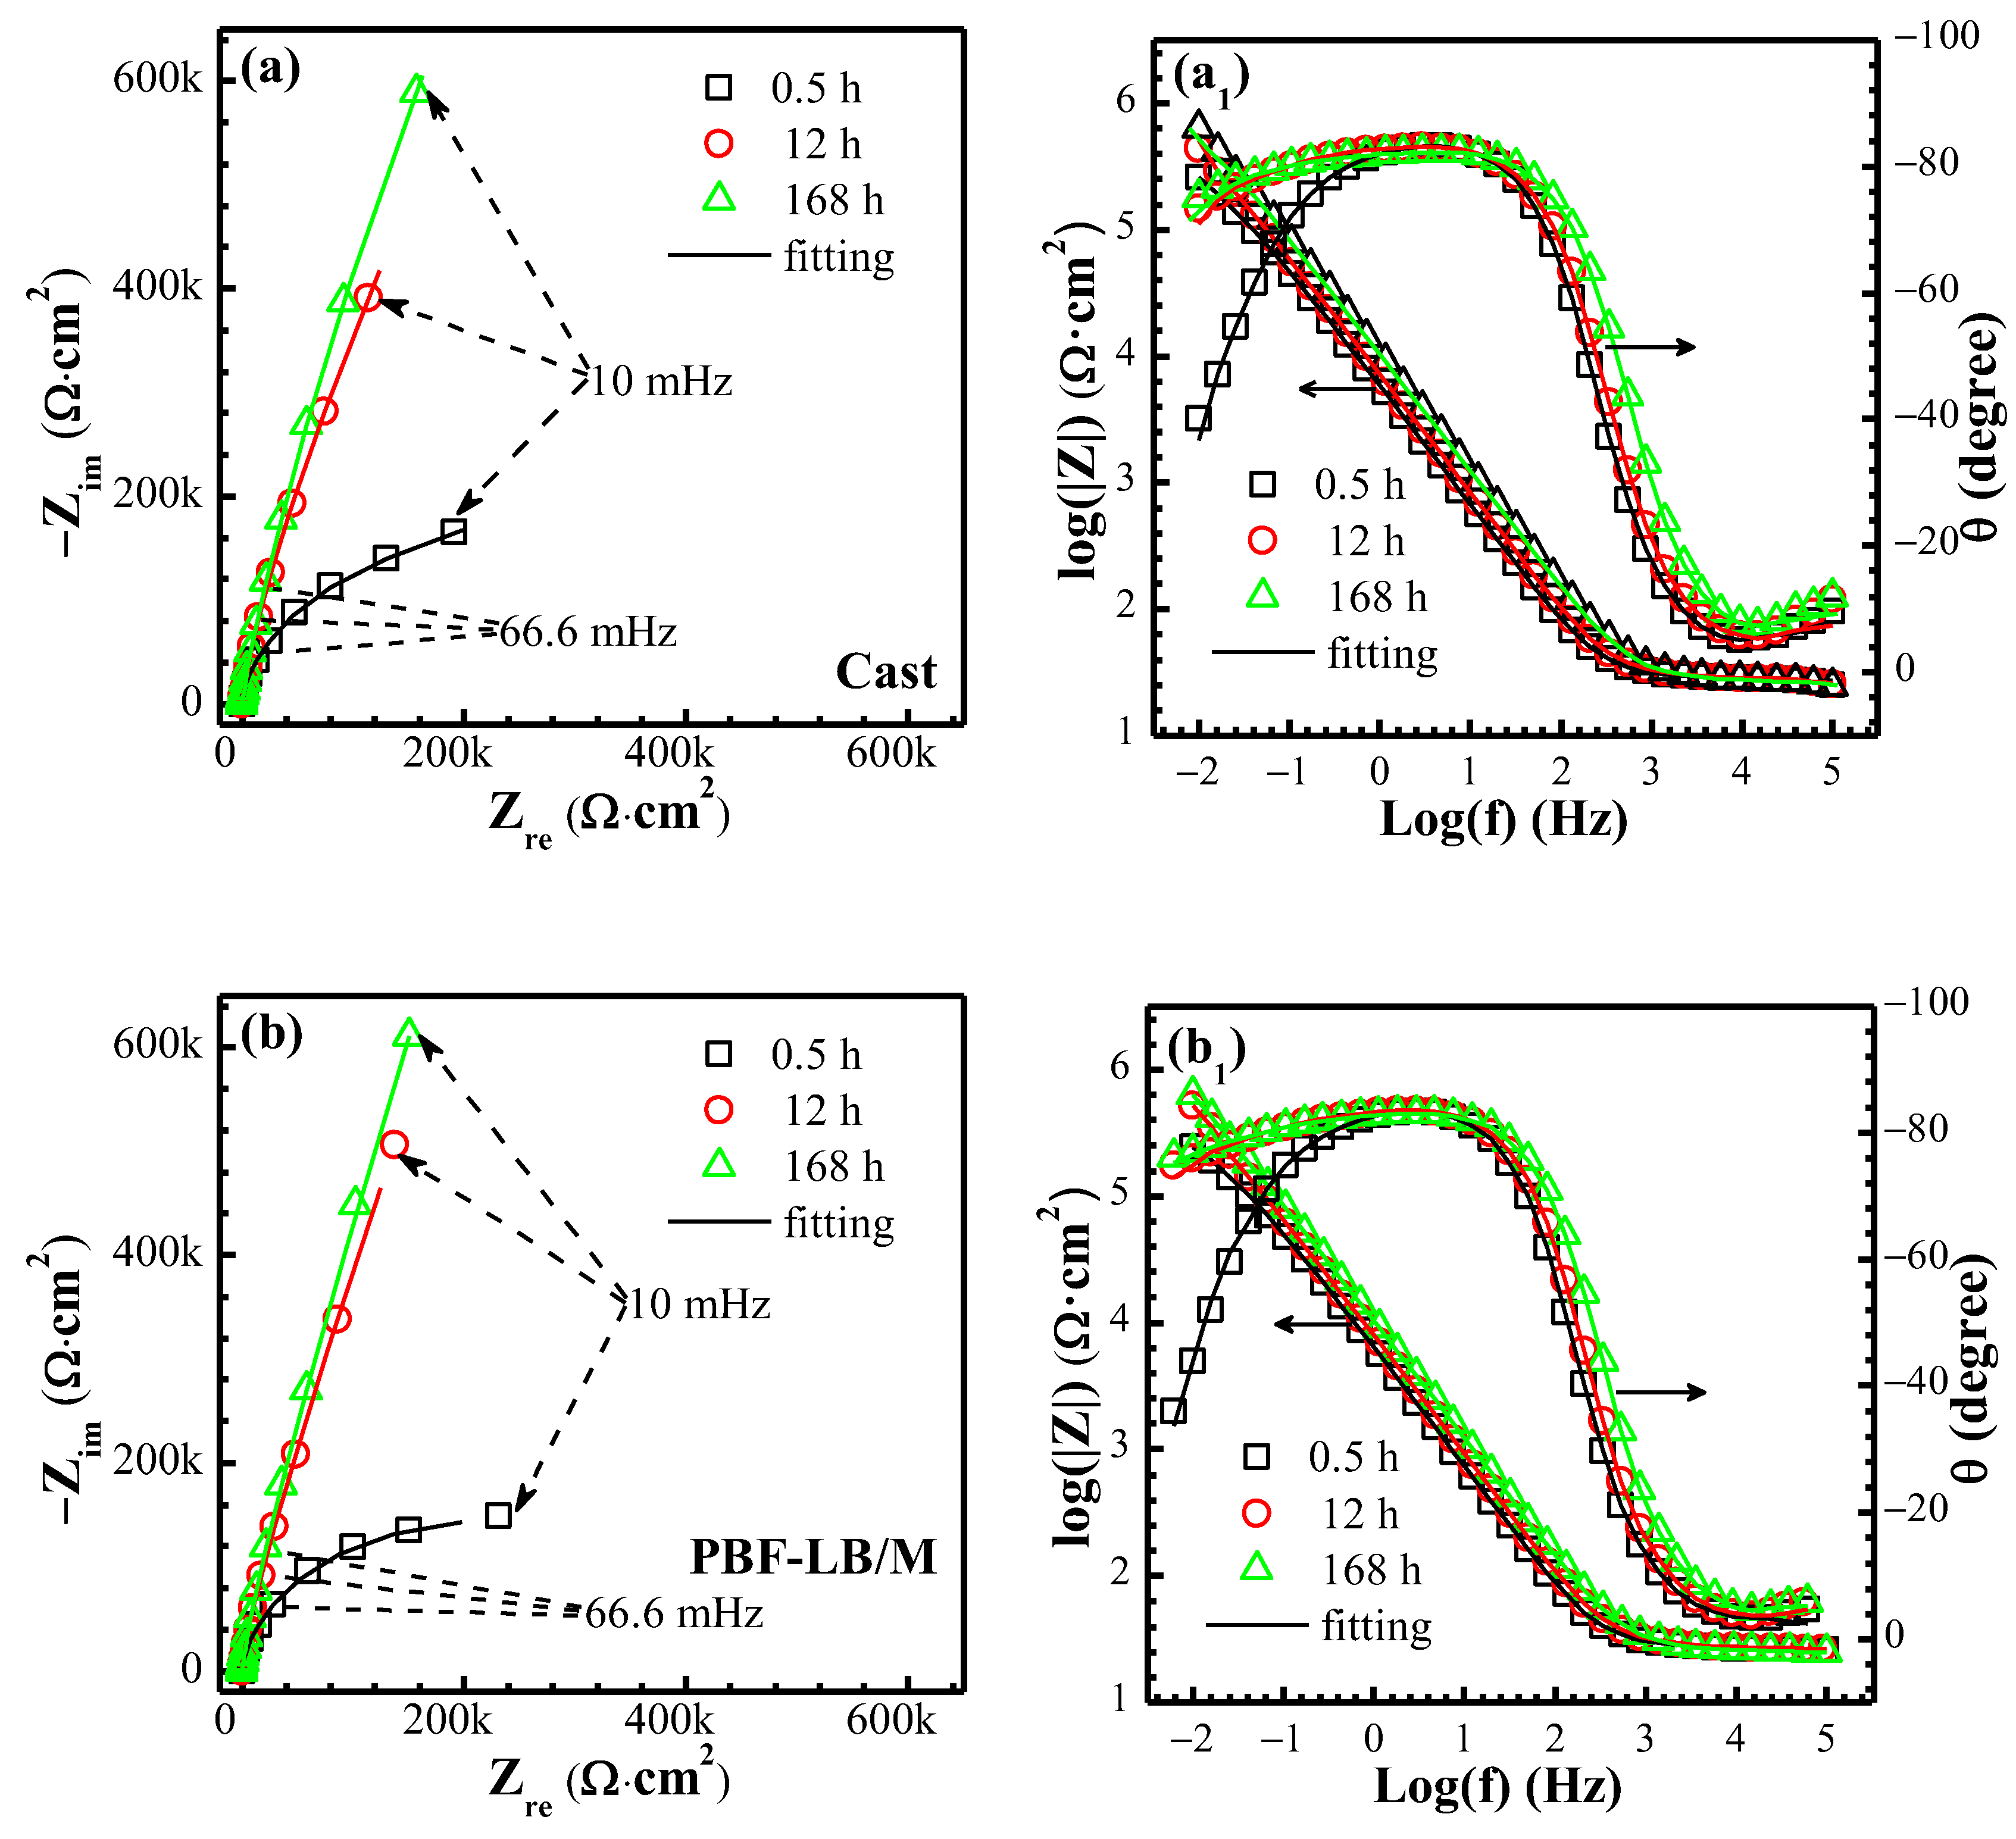
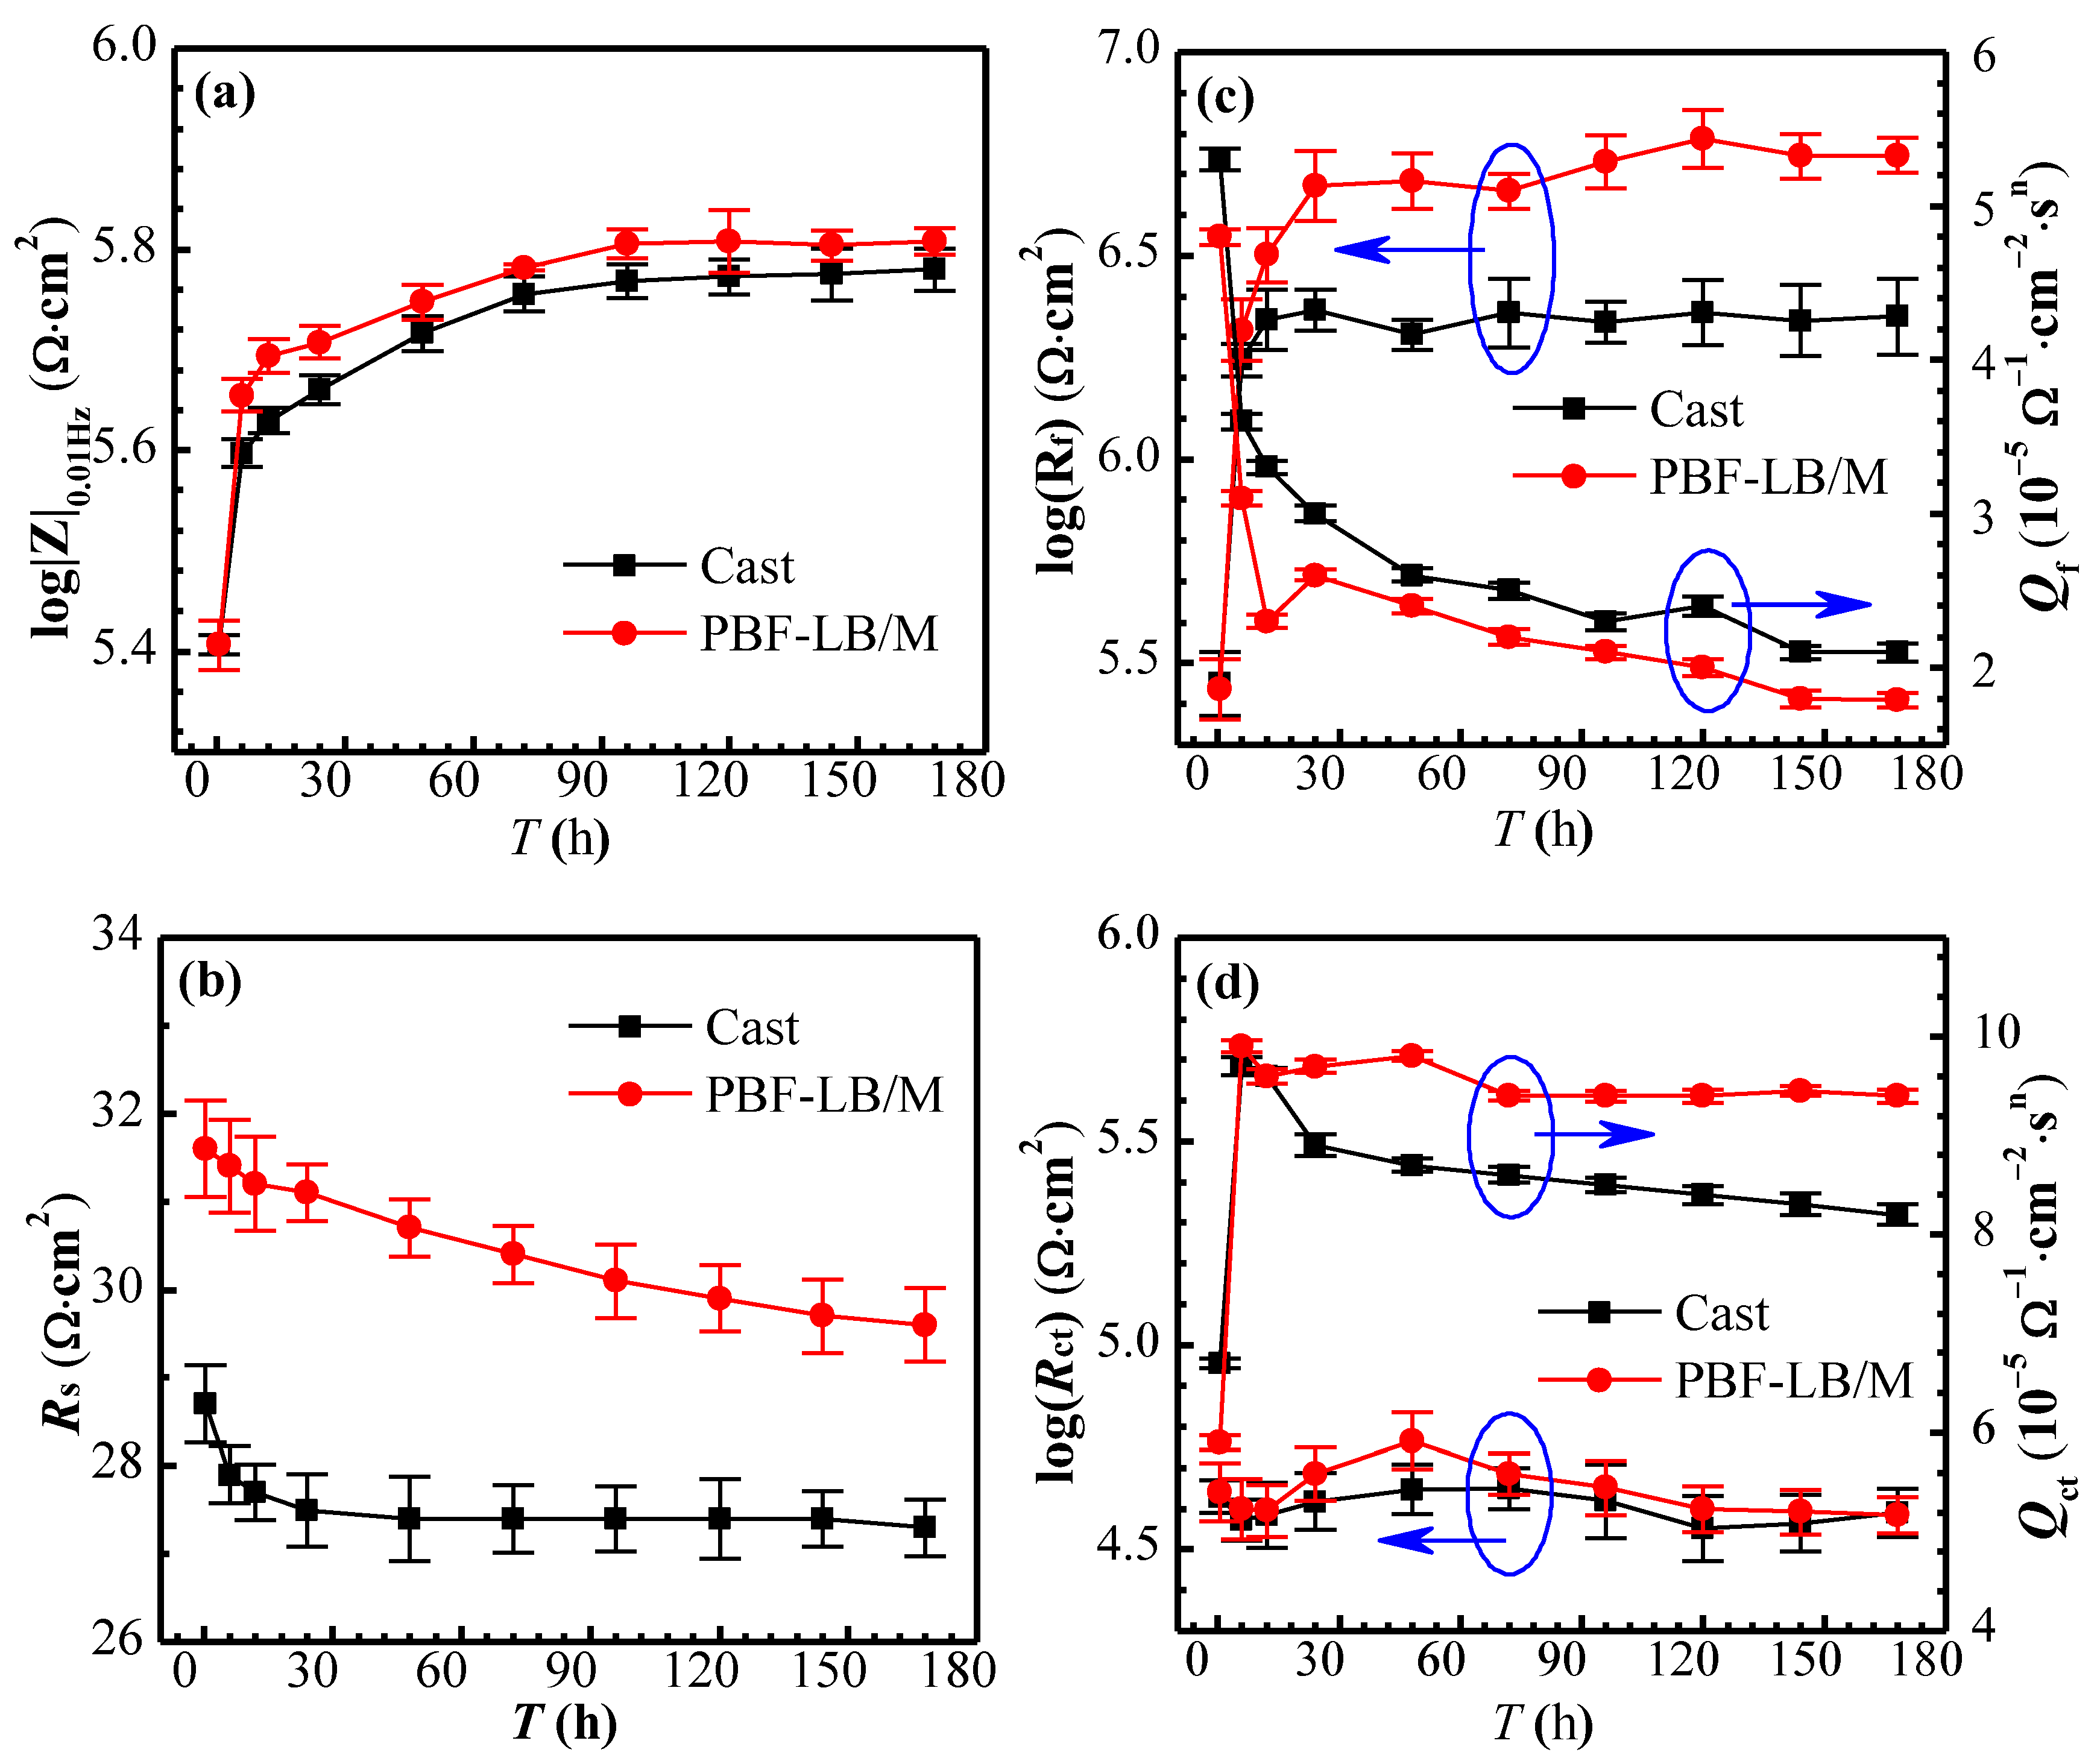
3.2.5. Electrochemical Impedance Spectroscopy

The representative Nyquist (Figure 6a,b) and Bode (Figure 6a1,b1) plots of TC4 immersed in 0.9 wt.% NaCl solution are exhibited in Figure 6.
The radius of the capacitance loop in the Nyquist plot of two TC4 increases remarkably from 0.5 h to 168 h. The Bode plots of the phase angle of two TC4 show a wide arc of capacitance in the frequency range (103–10−2 Hz), indicating that there are at least two superposed time constants and that after 12 h and 168 h of immersion, the phase angle gradually moves upward in the low-frequency region (100–10−2 Hz). The impedance modulus |Z|0.01 is commonly applied to identify the corrosion resistance of the alloy [29]. The|Z|0.01 from high to low of the two alloys is PBF-LB/M-TC4 > cast-TC4 (see Figure 6), indicating that PBF-LB/M-TC4 has better corrosion resistance.
The equivalent circuit (EEC) in Figure 7 is often chosen to fit the passive film corrosion process of Ti and its alloys [9,27]. The model considers the passive film layer (Rf, Qf) and in series the charge transfer layer (Rct, Qdl), where Rs is the solution resistance, Rf and Qf are the passive film resistance and related double-layer constant phase element and Rct and Qdl are the charge transfer resistance and related electrical double-layer constant phase element, respectively. In general, capacitance is non-ideal due to the electrode surface roughness [27,28,29,30], which can be written as [30,31,32,33]
Z Q dl = 1 Y 0 ( j ω ) n
where ω, j and n are the imaginary unit, angular frequency and exponent, respectively, and the constant phase element is equal to the capacitance while n = 1 [27,28,29,30,31,32,33].
The EIS fitting results are shown in Figure 8. The Rs depicted in Figure 8b changes little in the range of 27–32 Ω·cm2 (cast-TC4 < PBF-LB/M-TC4).
The Rf of two TC4 increases rapidly from 105 Ω·cm2 (0.5 h) to 106.3 Ω·cm2 (12 h) and then fluctuates around 106.3 Ω·cm2 for cast-TC4 (see Figure 8c). However, the Rf of the PBF-LB/M-TC4 continues to increase, reaching the order of 106.7 Ω·cm2 after 24 h of immersion, and then fluctuates around this value in subsequent immersion. The Rct depicted in Figure 8d of the two alloys is much smaller than that of the Rf and stabilizes at around 104.6 Ω·cm2 during the whole test period, indicating that the resistance of the reaction mainly comes from the passive film, which is consistent with CV and LPR tests and indicates that the EEC model (Figure 7) applied here is appropriate. The Qf and Rf show an apparent opposite trend (see Figure 8c): the passive film thickness of the alloy is usually preserved inversely proportionally to Qf [27,30], and the sharply decreased Qf with the extension of immersion time indicates a thickened passive film. Nevertheless, the Qdl increases rapidly after immersion for 0.5 h, then reaches a maximum value at 6 h and then decreases slowly (see Figure 8d). Due to the relatively small and minimal difference in the Rct of two TC4, herein the 168 h Rf was adopted to differentiate the corrosion resistance. PBF-LB/M-TC4 (106.7 Ω·cm2) is 2.5 times more than that of cast-TC4 (106.3 Ω·cm2), indicating that PBF-LB/M-TC4 has excellent corrosion resistance. In addition, it can be seen from the results [5,21] that the passive film resistance of the Ti alloy in simulated body fluids is also on the order of 106 Ω·cm2, indicating that the test results here have high reliability and that further in vivo research is also needed.

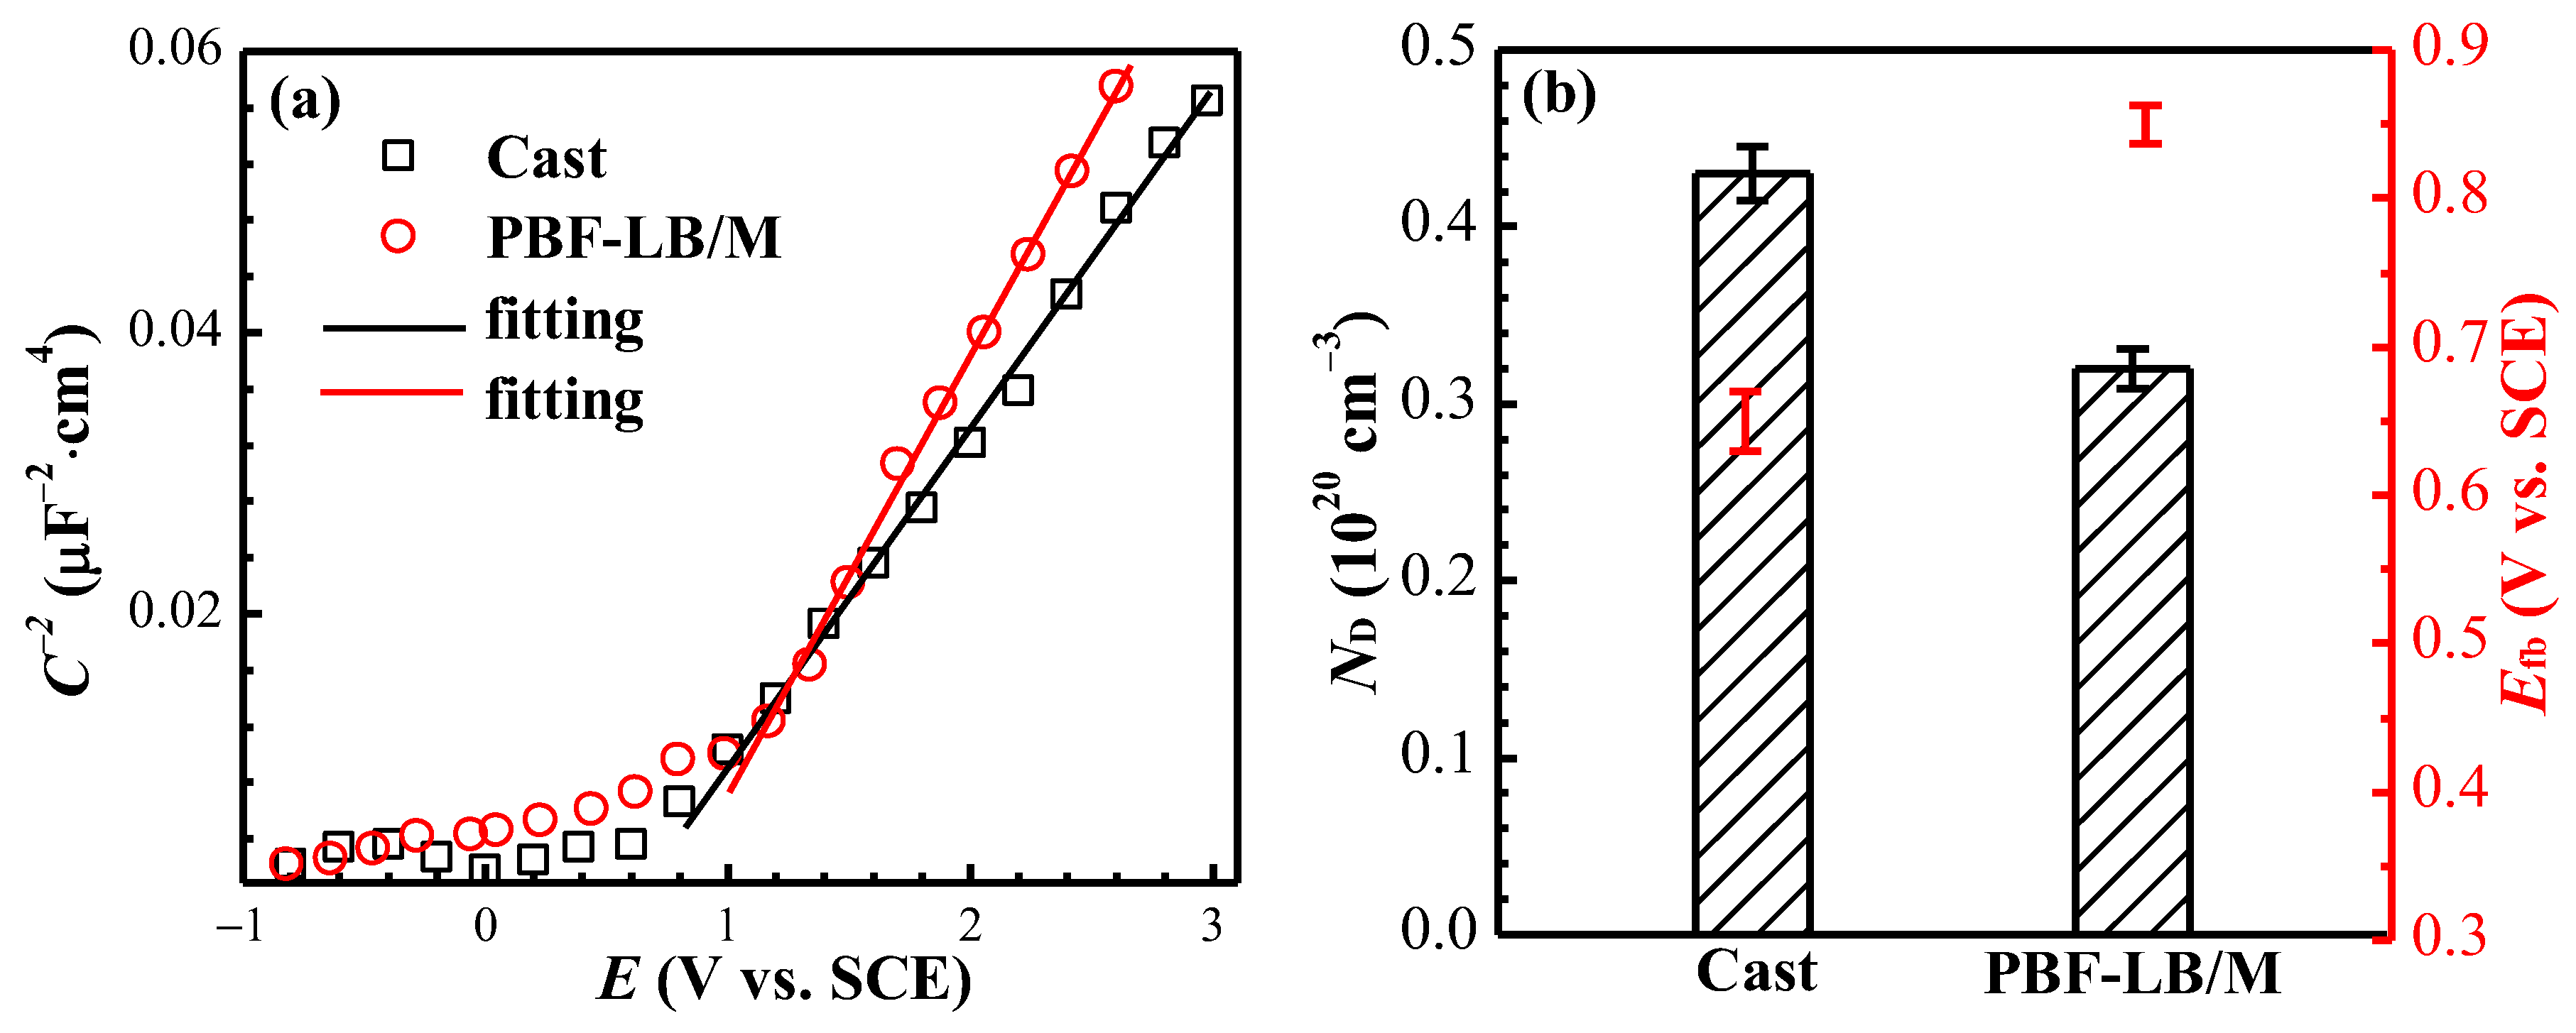
3.2.6. Mott–Schottky Analysis

The Mott–Schottky (M–S) curve after 168 h of immersion of two TC4 in physiological solution is exhibited in Figure 9.
The linear relation between 1/C2 and E (a) shown in Figure 9a can be described in Equation (8) [19,30]. The curves appear positive while the E is higher than the flat-band potential (Efb), the curves are all positive, indicating that the film of two TC4 shows an n-type semiconductor. The donor carrier density ND can be derived from Equation (8) [19]:
1 C 2 = 2 ε ε 0 e N D ( E E fb k T e )
where, C, ε, ε0, e, E, Efb, k and T are the space charge layer capacitance, dielectric constant of passive film (for TiO2, ε = 100) [19,21], dielectric constant of vacuum (ε0 = 8.85 × 10⁻¹² F/m), number of electrons (e = 1.602 × 10⁻¹⁹ C), applied potential, flat-band potential, Boltzmann constant (k = 1.38×10⁻²³ J/K) and the thermodynamic temperature.
The Efb and ND fitting results in Figure 9b of PBF-LB/M- and cast-TC4 are 0.852, 0.653 VSCE and 0.31, 0.43 (1020 cm−3), respectively. The defects of the passive film in cast-TC4 are 139% times those of PBF-LB/M-TC4, indicating that a more compacted passive film is formed on the PBF-LB/M-TC4 surface [19].

3.3. XPS Analysis

Figure 10 exhibits the XPS peaks analysis of the two TC4 passive film immersed in physiological solution for 168 h.
For the full spectrum in Figure 10a, the film is mainly composed of Ti and O, weak Al, and hardly any V peak could be detected. Ti is mainly in TiO2 2p3/2 (458.8 eV) and 2p1/2 (464.3 eV) in the film; small amounts of Ti2O3 2p3/2 (456.8 eV) and 2p1/2 (462.0 eV) could also be detected (see Figure 10b). Our previous studies confirmed that Ti4+ mainly exists in the outer layer, and a low-priced Ti element mainly exists in the inner layer [7]. Only a weak Al peak can be detected (Figure 10c); the Al oxides are mainly Al(OH)3 (75.1 eV) and Al2O3 (74.3 eV). In Figure 10d, O is mainly composed of O2− (530.2 eV); a small amount of OH (531.8 eV) and H2O (533 eV) can also be detected. The O2− may be involved in the formation of Ti oxides (Ti2O3, TiO2) and Al oxides (Al2O3), and the OH mainly participates in the formation of Al(OH)3 and other compounds.
The valence states and contents of each major element of two TC4 alloys were summarized and analyzed, as shown in Figure 11.
In general, the O element accounts for the largest proportion (cast- and PBF-LB/M-TC4 are 75.39% and 74.73%, respectively), followed by Ti (cast- and PBF-LB/M-TC4 are 23.73% and 25.06%, respectively), and Al accounts for a small proportion, less than 1% (cast- and PBF-LB/M-TC4 are 0.88% and 0.21%, respectively). O and Ti mainly in the form of O2− and Ti4+ conform to TiO2; the content of TiO2 in PBF-LB/M-TC4 is higher than that of cast-TC4, indicating that PBF-LB/M-TC4 has better corrosion resistance. These findings match perfectly with CV (Figure 4), LPR (Figure 5) and EIS (Figure 6) results.

3.4. AES Analysis

Figure 12 depicts the AES passive film depth profile of two TC4 immersed in physiological solution for 168 h.
In Figure 12a, Ti content increases slowly when the sputtering depth is in the region of 0–7.1 nm, increases sharply between 7.1 and 20 nm and changes little and becomes stable after the sputtering depth exceeds 20 nm. The overall Al content does not change much and stays at a relatively low level (Figure 12b). The V content decreases slowly in the region of 0–7.1 nm, increases between 7.1 and 20 nm and remains relatively stable after 20 nm (Figure 12c). The change trend of O content is completely opposite to that of Ti, which decreases in the range of 0–7.1 nm, increases between 7.1 and 20 nm and tends to be stable after sputtering exceeds 20 nm (Figure 12d). This again verifies that the outer passive film is mainly TiO2, while other low-priced Ti-oxide content increases in the inner layer, and the oxygen content decreases correspondingly. Despite the fact that the thickness of the PBF-LB/M-TC4 passive film (13.2 nm) is smaller than that of cast-TC4 (15.1 nm) (the location of the passive film thickness is defined as the oxygen content halved [34]), the passive film thickness is not a good criterion to evaluate corrosion resistance; on the contrary, the content of TiO2 in the passive film shows a positive correlation to corrosion resistance, with a higher concentration of TiO2 and fewer defects in the passive film enhancing better corrosion protection of martensitic based PBF-LB/M-TC4.

4. Conclusions

The formation and corrosion resistance of cast- and PBF-LB/M-TC4 passive films in physiological solution were studied by electrochemical techniques combined with surface analysis. The following main conclusions can be drawn:
  • The OCP of cast- and PBF-LB/M-TC4 conforms to the power function and increases rapidly with an extension of immersion time. Due to the large grain size of cast-TC4, the passive film formation rate shows the following order: cast-TC4 > PBF-LB/M-TC4.
  • The early-stage formed passive film shows a lower corrosion resistance. The metastable β phase and the equiaxial α phase of cast-TC4 promotes the passive film formation rate. A corrosion-resistant passive film could be formed during a longer period of immersion. The martensitic-based PBF-LB/M-TC4 shows better corrosion resistance than that of cast-TC4 after 120 h of immersion.
  • The RP of LPR immersed for 168 h of PBF-LB/M-TC4 (8.2 × 10⁶ Ω·cm2) is twice of that cast-TC4 (4.1 × 10⁶ Ω·cm2), indicating the formed passive film of PBF-LB/M-TC4 has excellent corrosion resistance. The two TC4 passive film shows a typical n-type semiconductor, and the defect density in cast-TC4 is 139% times that of PBF-LB/M-TC4.
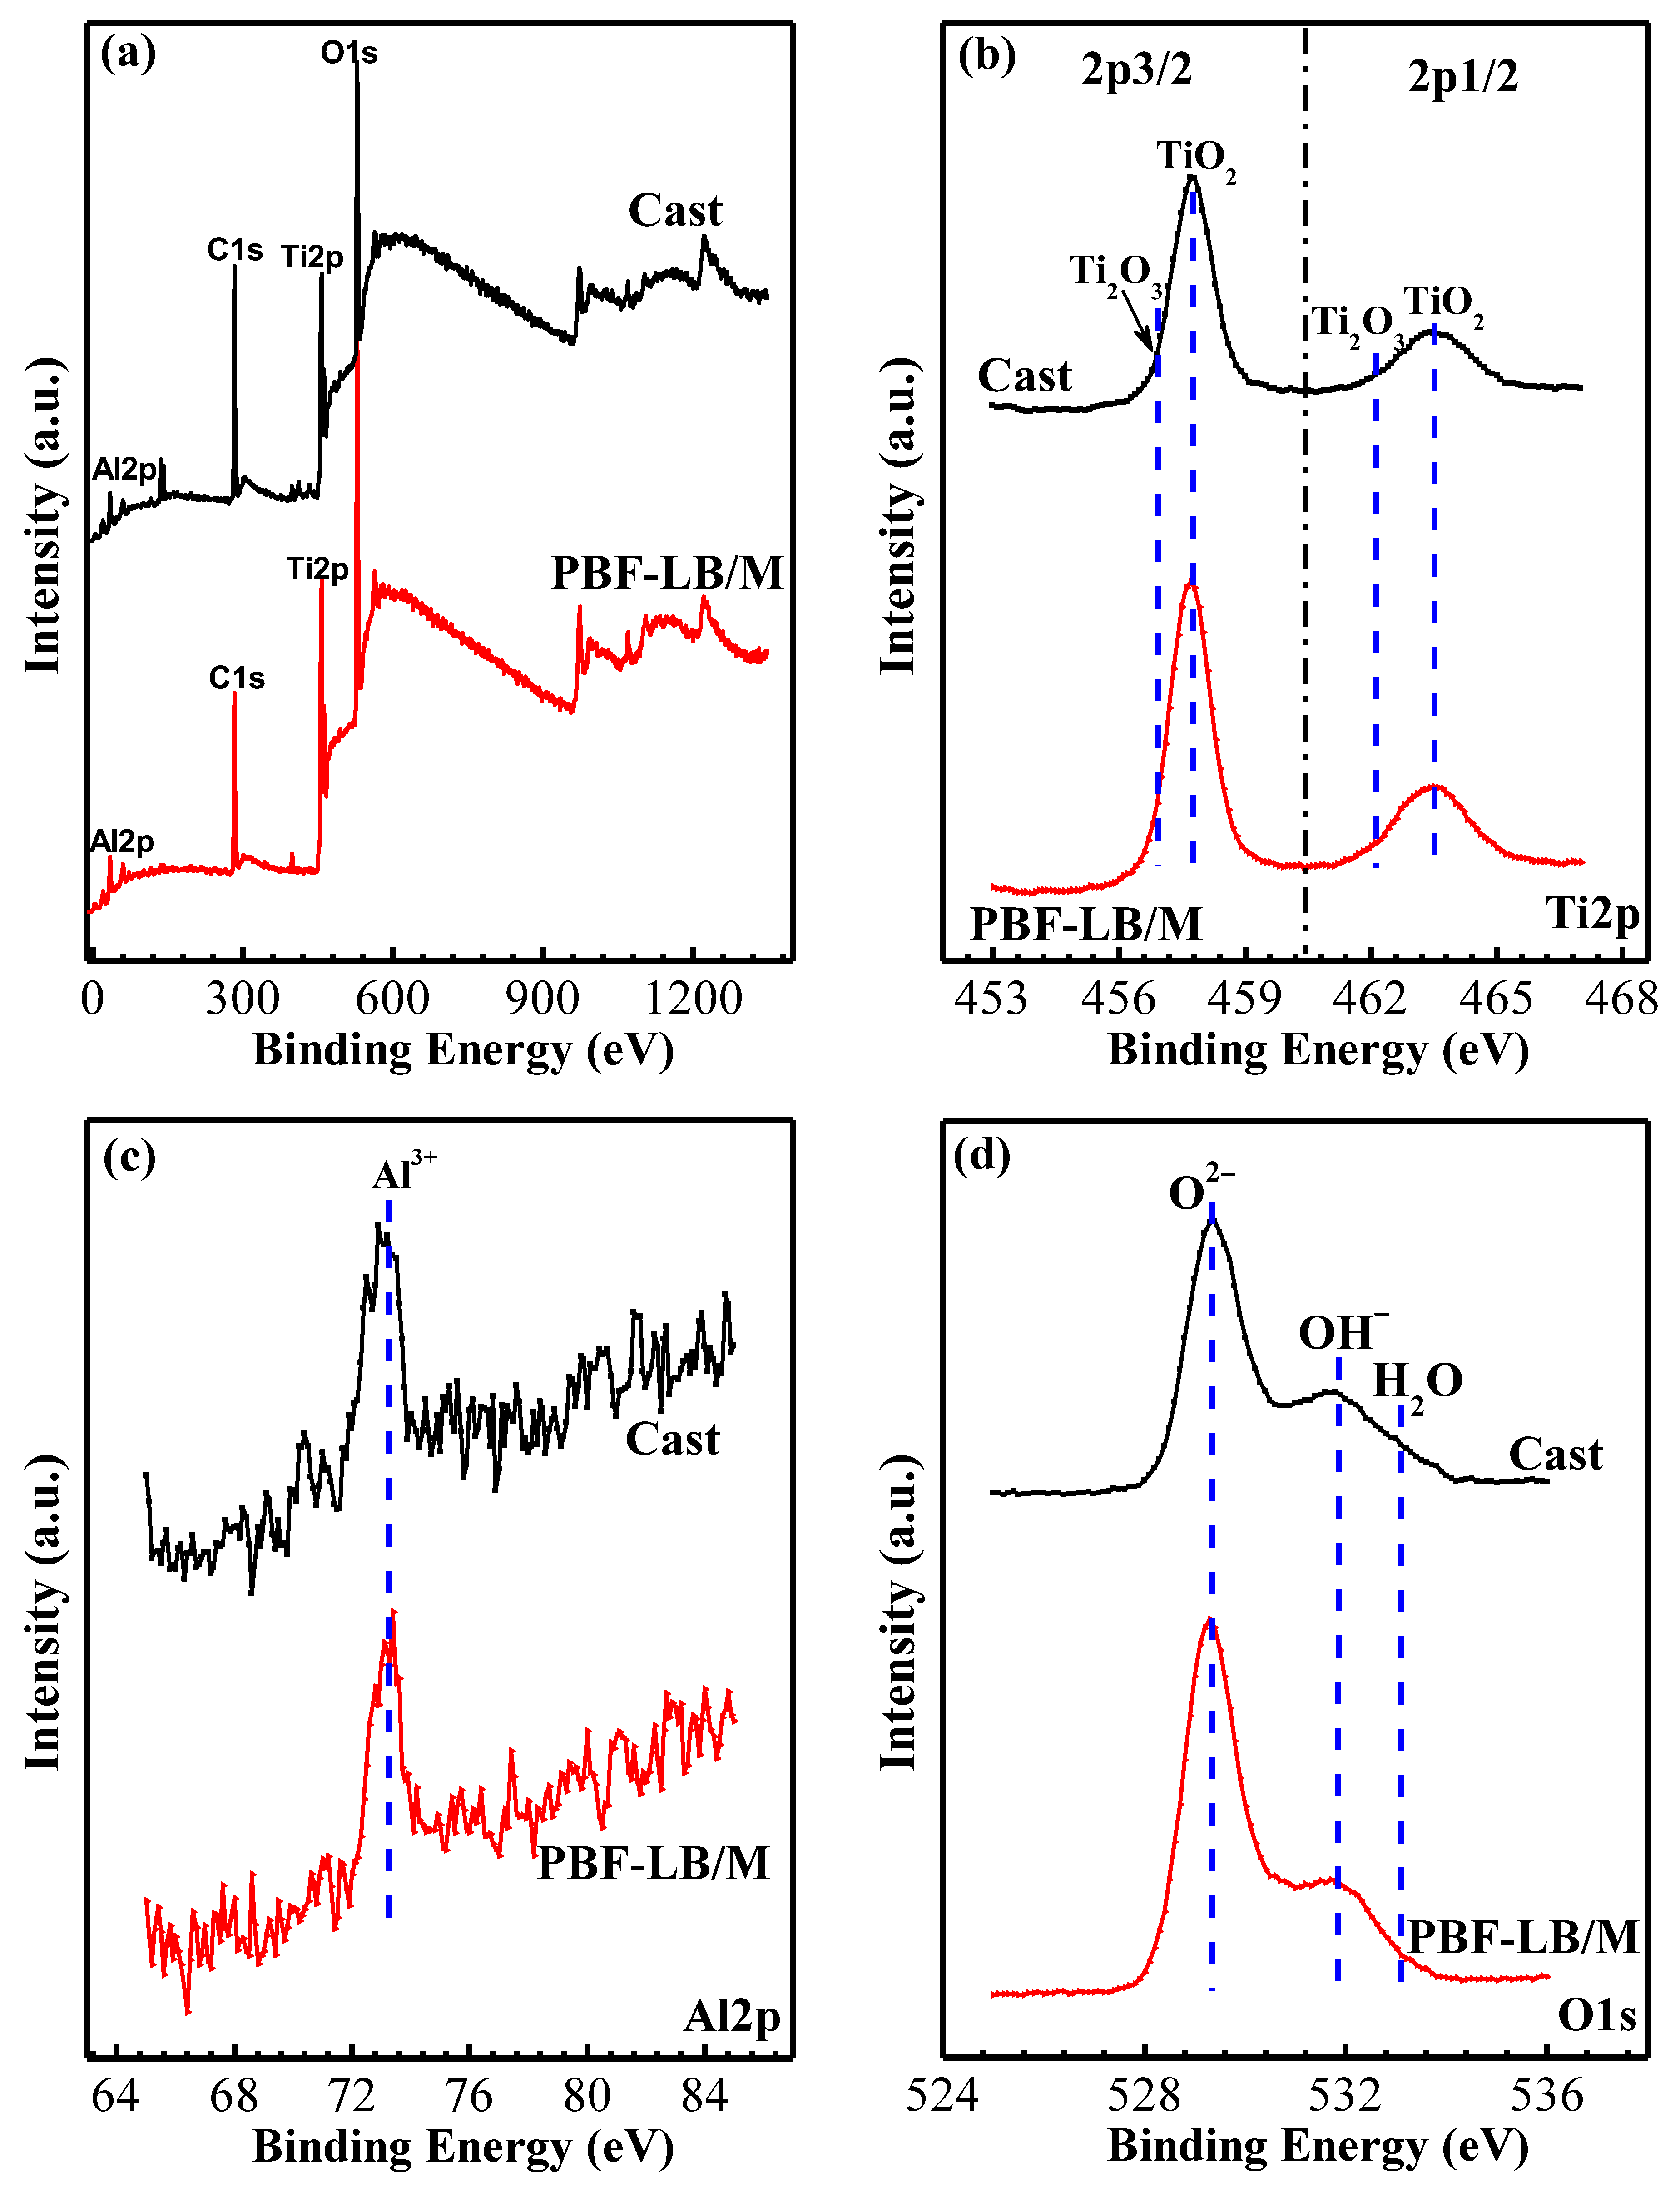
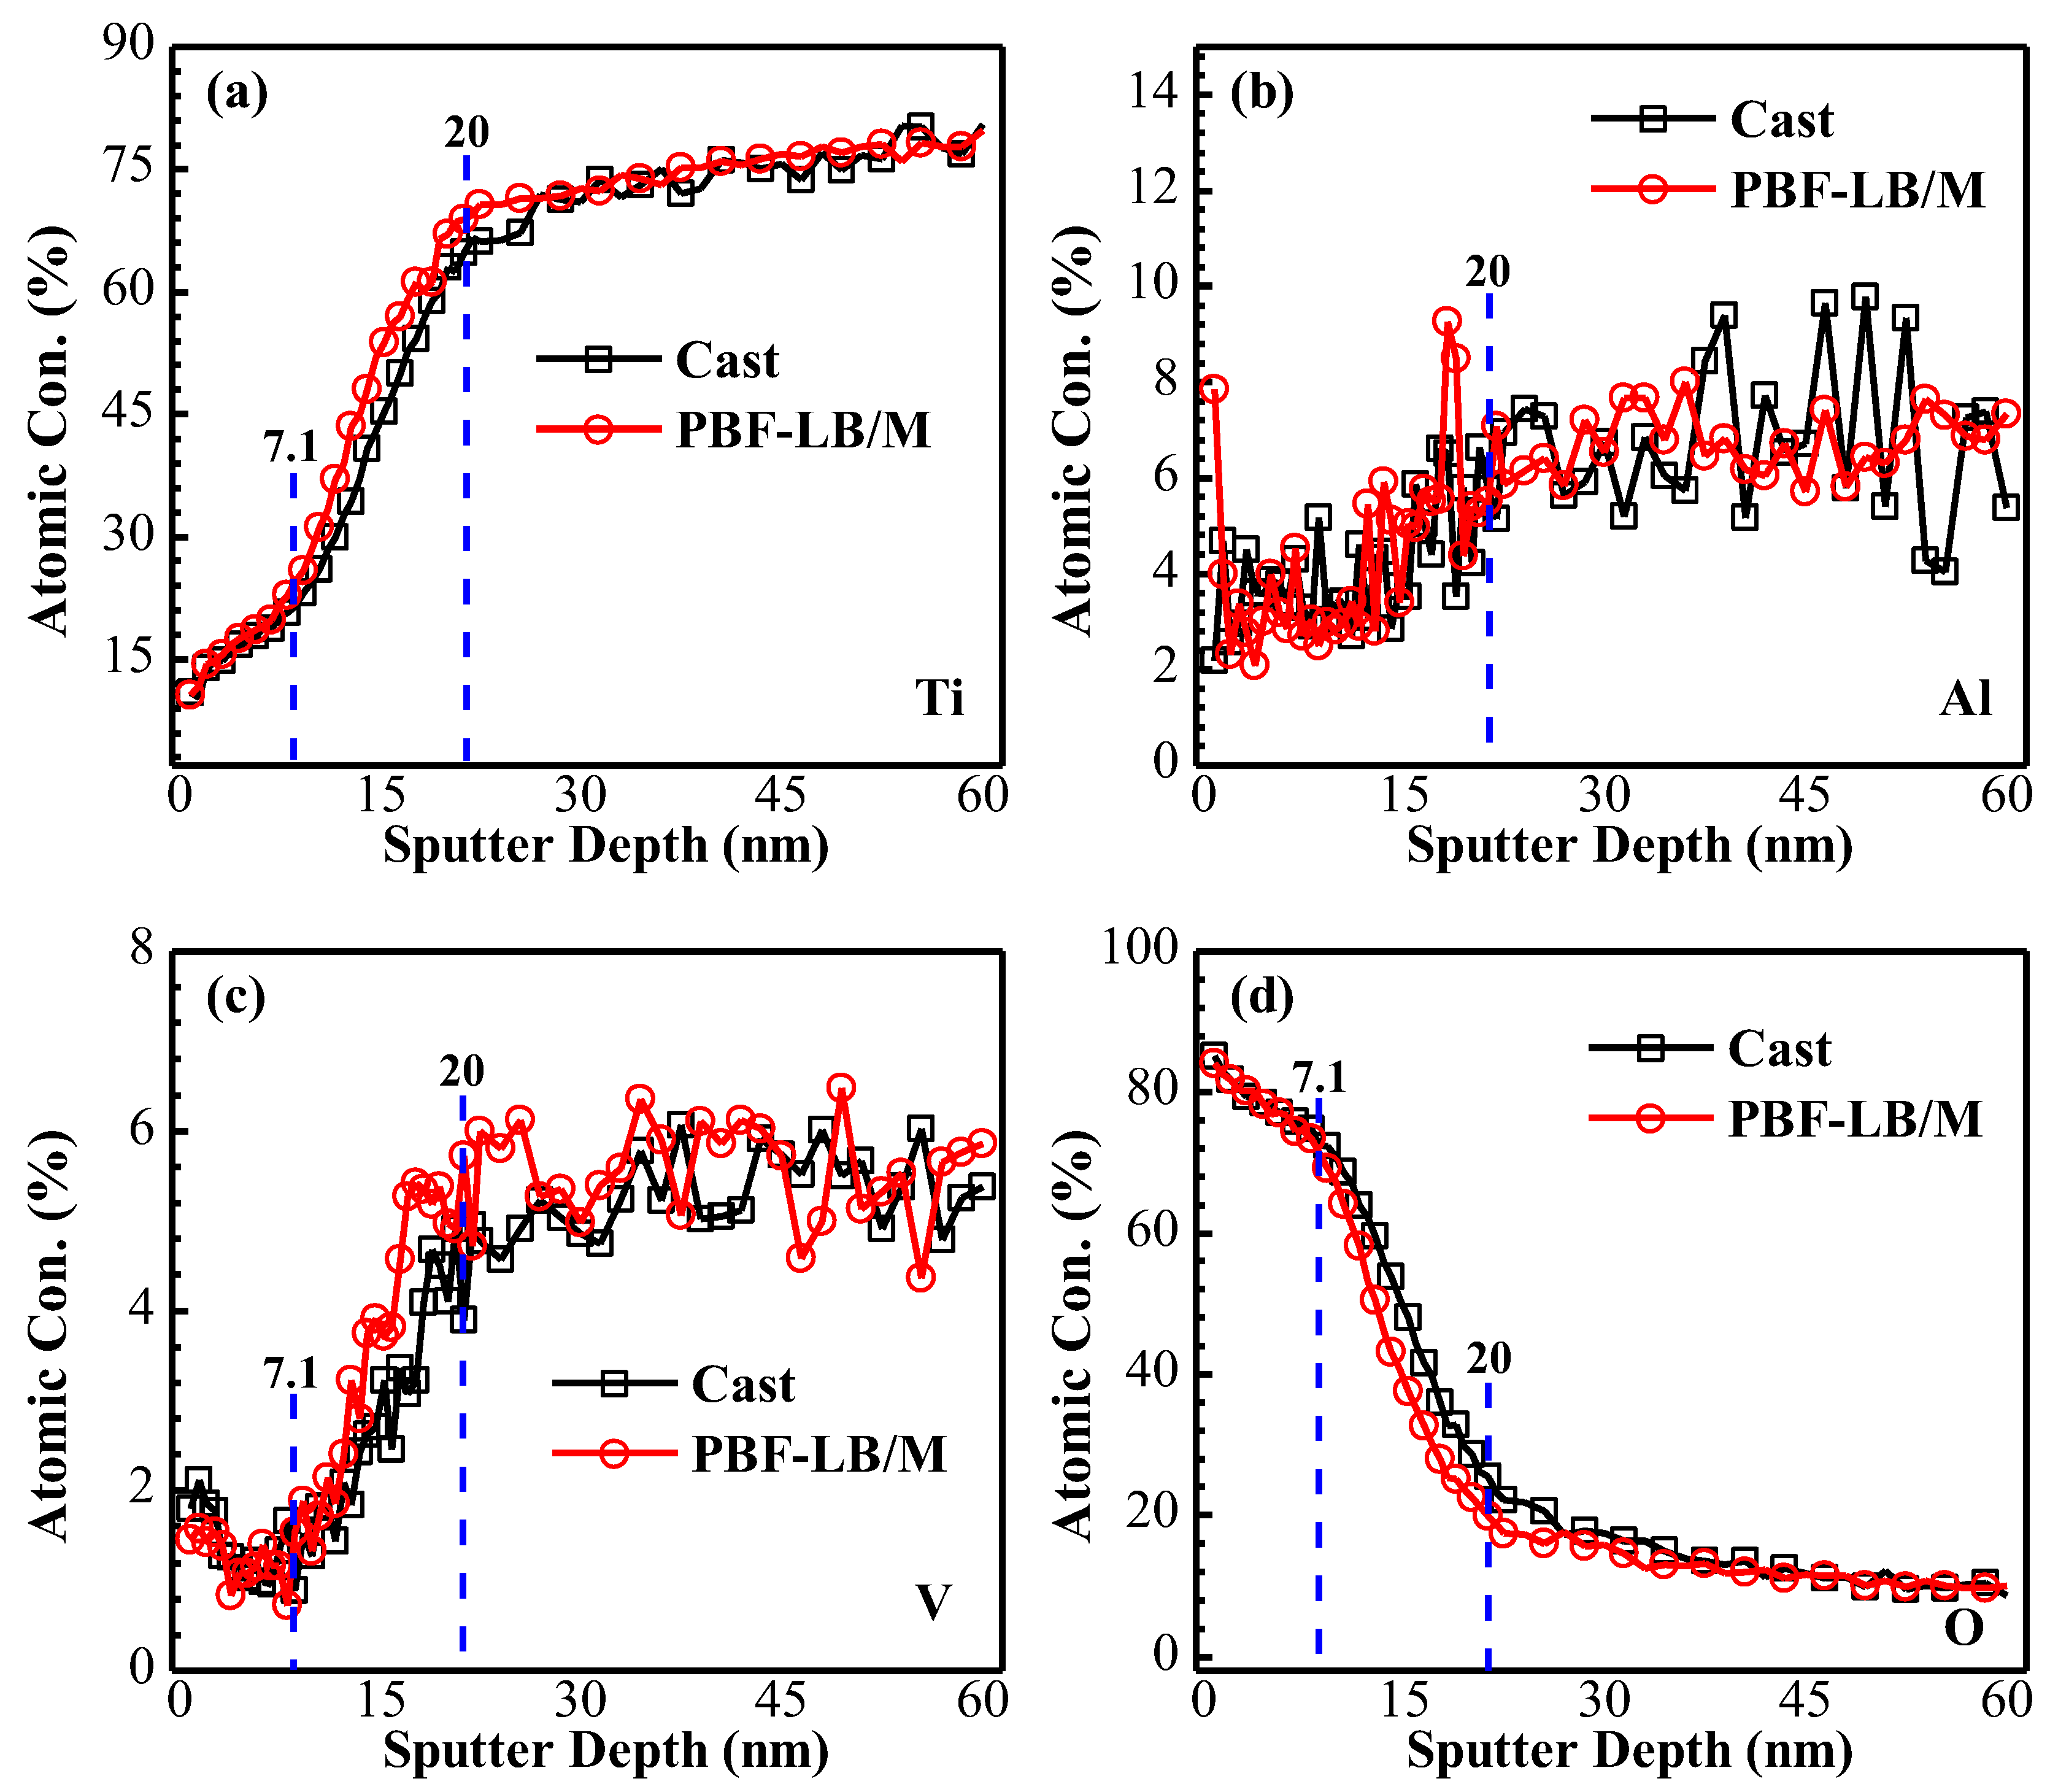
  • The passive film of two TC4 alloy is mainly Ti oxide. Ti4+ plays a dominant role, and the passive film’s stability from high to low is PBF-LB/M-TC4 > cast-TC4. Compared to the passive film thickness, the content of TiO2 in the passive film is a good criterion to evaluate corrosion resistance. A higher TiO2 concentration and fewer defects promote better corrosion protection of martensite-based PBF-LB/M-TC4.

Author Contributions

Conceptualization, M.L.; Methodology, Y.Z.; Formal analysis, M.L.; Resources, J.W. and X.G.; Data curation, M.L. and Z.L.; Writing—original draft, M.L.; Writing—review & editing, M.L. and Z.L.; Visualization, J.W. and Y.Z.; Supervision, M.L. and X.G. All authors have read and agreed to the published version of the manuscript.

Funding

This research was funded by Shaanxi Natural Science Foundation project (2024JC-YBMS-339), the doctoral initial funding for teachers of Xi’an University of Technology (101-451124004).

Institutional Review Board Statement

Not applicable.

Informed Consent Statement

Not applicable.

Data Availability Statement

The original contributions presented in the study are included in the article, further inquiries can be directed to the corresponding author.

Acknowledgments

The authors acknowledge the financial support by Xuechao Feng the manager of Shaanxi Gryffindor Software Technology Co., Ltd.

Conflicts of Interest

Jie Wang was employed by the company Shaanxi Zhou Doctor Dental Medical Co., Ltd. Yongqiang Zhang was employed by the company Xi’an QinTi Intelligent Manufacturing Technologies Co. Ltd. Xin Gao was employed by Beijing Med-Zenith Medical Scientific Corporation Limited. The remaining authors declare that the research was conducted in the absence of any commercial or financial relationships that could be construed as a potential conflict of interest.

Nomenclatures

PBF-LB/Mlaser powder bed fusion of metals
TC4Ti-6Al-4V
SCEsaturated calomel reference electrode
OCPopen circuit potential
CVcyclic voltammetry
EISelectrochemical impedance spectroscopy
M-SMott–Schottky
XPSX-ray photoelectron spectroscopy
AESAuger electron spectroscopy
SEMscanning electron microscopy
δ passivation film formation rate
αcharge transfer coefficient
δ energy accumulation width
Ecorrself-corrosion potential
icorrself-corrosion current density
ipassmaintaining passivity current density
LPRlinear polarization
EECequivalent circuit
Rssolution resistance
Rfpassive film resistance
Qfpassive film double-layer constant phase element
Rctcharge transfer resistance
Qdlcharge transfer double-layer constant phase element
Cspace charge layer capacitance
εdielectric constant of passive film
ε0dielectric constant of vacuum (ε0 = 8.85 × 10⁻¹² F/m)
enumber of electrons (e = 1.602×10⁻¹⁹ C)
Eapplied potential
Efbflat-band potential
kBoltzmann constant (k = 1.38 × 10⁻²³ J/K)
Tthermodynamic temperature

References

  1. Du, H.; To, S.; Yin, T.; Zhu, Z. Microstructured surface generation and cutting force prediction of pure titanium TA2. Precis. Eng. 2022, 75, 101–110. [Google Scholar] [CrossRef]
  2. Huang, G.; Fan, Z.; Li, L.; Lu, Y.; Lin, J. Corrosion Resistance of Selective Laser Melted Ti6Al4V3Cu Alloy Produced Using Pre-Alloyed and Mixed Powder. Materials 2022, 15, 2487. [Google Scholar] [CrossRef] [PubMed]
  3. Wang, D.; Chen, G.; Wang, A.; Wang, Y.; Qiao, Y.; Liu, Z.; Qi, Z.; Liu, C.T. Corrosion behavior of single-and poly-crystalline dual-phase TiAl-Ti3Al alloy in NaCl solution. Int. J. Miner. Metall. Mater. 2023, 30, 689–696. [Google Scholar]
  4. Hattingh, D.G.; Botha, S.; Bernard, D.; James, M.N.; du Plessis, A. Corrosion fatigue of Ti-6Al-4V coupons manufactured by directed energy deposition. Fatigue Fract. Eng. Mater. Struct. 2022, 45, 1969–1980. [Google Scholar] [CrossRef]
  5. Chen, L.-Y.; Zhang, H.-Y.; Zheng, C.; Yang, H.-Y.; Qin, P.; Zhao, C.; Lu, S.; Liang, S.-X.; Chai, L.; Zhang, L.-C. Corrosion behavior and characteristics of passive films of laser powder bed fusion produced Ti–6Al–4V in dynamic Hank’s solution. Mater. Des. 2021, 208, 109907. [Google Scholar] [CrossRef]
  6. Feng, J.; Wang, J.; Yang, K.; Rong, J. Microstructure and performance of YTaO4 coating deposited by atmospheric plasma spraying on TC4 titanium alloy surface. Surf. Coatings Technol. 2022, 431, 128004. [Google Scholar] [CrossRef]
  7. Liu, M.; Zhu, J.-N.; Popovich, V.; Borisov, E.; Mol, J.; Gonzalez-Garcia, Y. Passive film formation and corrosion resistance of laser-powder bed fusion fabricated NiTi shape memory alloys. J. Mater. Res. Technol. 2023, 23, 2991–3006. [Google Scholar] [CrossRef]
  8. Cao, J.; Zhao, W.; Wang, X.; Zhao, Y.; Ma, P.; Jiang, W.; Song, G. The Microstructure and tribological behavior of ultrasonic electroless Ni-P plating on TC4 titanium alloy with heat-Treatment. Ferroelectrics 2022, 589, 1–11. [Google Scholar] [CrossRef]
  9. Huo, W.; Zhao, L.; Zhang, W.; Lu, J.; Zhao, Y.; Zhang, Y. In vitro corrosion behavior and biocompatibility of nanostructured Ti6Al4V. Mater. Sci. Eng. C 2018, 92, 268–279. [Google Scholar] [CrossRef]
  10. Kazemi, M.; Ahangarani, S.; Esmailian, M.; Shanaghi, A. Investigation on the corrosion behavior and biocompatibility of Ti-6Al-4V implant coated with HA/TiN dual layer for medical applications. Surf. Coatings Technol. 2020, 397, 126044. [Google Scholar] [CrossRef]
  11. Ilani, M.A.; Khoshnevisan, M. An evaluation of the surface integrity and corrosion behavior of Ti-6Al-4 V processed thermodynamically by PM-EDM criteria. Int. J. Adv. Manuf. Technol. 2022, 120, 5117–5129. [Google Scholar] [CrossRef]
  12. Liao, Y.; Bai, J.; Chen, F.; Xu, G.; Cui, Y. Microstructural strengthening and toughening mechanisms in Fe-containing Ti-6Al-4V: A comparison between homogenization and aging treated states. J. Mater. Sci. Technol. 2022, 99, 114–126. [Google Scholar] [CrossRef]
  13. Cheng, R.; Luo, X.; Huang, G.; Li, C.J. Corrosion and wear resistant WC17Co-TC4 composite coatings with fully dense microstructure enabled by in-situ forging of the large-sized WC17Co particles in cold spray. J. Am. Acad. Dermatol. 2021, 296, 117231. [Google Scholar] [CrossRef]
  14. Yao, J.; Wang, Y.; Wu, G.; Sun, M.; Wang, M.; Zhang, Q. Growth characteristics and properties of micro-arc oxidation coating on SLM-produced TC4 alloy for biomedical applications. Appl. Surf. Sci. 2019, 479, 727–737. [Google Scholar] [CrossRef]
  15. Dai, N.; Zhang, L.-C.; Zhang, J.; Chen, Q.; Wu, M. Corrosion behavior of selective laser melted Ti-6Al-4 V alloy in NaCl solution. Corros. Sci. 2016, 102, 484–489. [Google Scholar] [CrossRef]
  16. Zhang, H.; Man, C.; Dong, C.; Wang, L.; Li, W.; Kong, D.; Wang, L.; Wang, X. The corrosion behavior of Ti-6Al-4V fabricated by selective laser melting in theartificial saliva with different fluoride concentrations and pH values. Corros. Sci. 2021, 179, 109097. [Google Scholar] [CrossRef]
  17. Zhao, B.; Wang, H.; Qiao, N.; Wang, C.; Hu, M. Corrosion resistance characteristics of a Ti-6Al-4V alloy scaffold that is fabricated by electron beam melting and selective laser melting for implantation in vivo. Mater. Sci. Eng. C 2017, 70, 832–841. [Google Scholar] [CrossRef] [PubMed]
  18. Hamza, H.M.; Deen, K.M.; Haider, W. Microstructural examination and corrosion behavior of selective laser melted and conventionally manufactured Ti6Al4V for dental applications. Mater. Sci. Eng. C 2020, 113, 110980. [Google Scholar] [CrossRef] [PubMed]
  19. Kong, D.; Dong, C.; Ni, X.; Li, X. Corrosion of metallic materials fabricated by selective laser melting. npj Mater. Degrad. 2019, 3, 24. [Google Scholar] [CrossRef]
  20. Zhou, L.; Yuan, T.; Tang, J.; He, J.; Li, R. Mechanical and corrosion behavior of titanium alloys additively manufactured by selective laser melting—A comparison between nearly b titanium, a titanium and a + b titanium. Opt. Laser Tech. 2019, 119, 105625. [Google Scholar] [CrossRef]
  21. Liu, M.; Zhu, J.-N.; Popovich, V.A.; Borisov, E.; Mol, J.M.C.; Gonzalez-Garcia, Y. Corrosion and passive film characteristics of 3D-printed NiTi shape memory alloys in artificial saliva. Rare Met. 2023, 42, 3114–3129. [Google Scholar] [CrossRef]
  22. Qin, P.; Chen, Y.; Liu, Y.J.; Zhang, J.; Chen, L.Y.; Li, Y.; Zhang, X.; Cao, C.; Sun, H.; Zhang, L.C. Resemblance in corrosion behavior of selective laser melted and traditional monolithic b Ti-24Nb-4Zr-8Sn alloy. ACS Biomater. Sci. Eng. 2019, 5, 1141–1149. [Google Scholar] [CrossRef] [PubMed]
  23. Chen, Y.; Zhang, J.; Dai, N.; Qin, P.; Attar, H.; Zhang, L.C. Corrosion behaviour of selective laser melted Ti-TiB biocomposite in simulated body fluid. Electrochim. Acta 2017, 232, 89–97. [Google Scholar] [CrossRef]
  24. Liu, M.; Cheng, X.; Li, X.; Pan, Y.; Li, J. Effect of Cr on the passive film formation mechanism of steel rebar in saturated calcium hydroxide solution. Appl. Surf. Sci. 2016, 389, 1182–1191. [Google Scholar] [CrossRef]
  25. El Haleem, S.A.; El Aal, E.A.; El Wanees, S.A.; Diab, A. Environmental factors affecting the corrosion behaviour of reinforcing steel: I. The early stage of passive film formation in Ca(OH)2 solutions. Corros. Sci. 2010, 52, 3875–3882. [Google Scholar] [CrossRef]
  26. Fischer, H.; Hauffe, K. Passivierende Filme und Deckschichten Anlaufschichten; Springer: Berlin/Heidelberg, Germany, 1956. [Google Scholar]
  27. Yang, X.; Du, C.; Wan, H.; Liu, Z.; Li, X. Influence of sulfides on the passivation behavior of titanium alloy TA2 in simulated seawater environments. Appl. Surf. Sci. 2018, 458, 198–209. [Google Scholar] [CrossRef]
  28. Wang, J.; Wang, Z.; Sui, Q.; Xu, S.; Yuan, Q.; Zhang, D.; Liu, J. A Comparison of the Microstructure, Mechanical Properties, and Corrosion Resistance of the K213 Superalloy after Conventional Casting and Selective Laser Melting. Materials 2023, 16, 1331. [Google Scholar] [CrossRef] [PubMed]
  29. Chen, G.; Wen, S.; Ma, J.; Sun, Z.; Lin, C.; Yue, Z.; Mol, J.; Liu, M. Optimization of intrinsic self-healing silicone coatings by benzotriazole loaded mesoporous silica. Surf. Coatings Technol. 2021, 421, 127388. [Google Scholar] [CrossRef]
  30. Jia, C.; Wang XHu, M.; Su, Y.; Li, S.; Gai, X.; Sheng, L. Corrosion Behavior of TiNi Alloy Fabricated by Selective Laser Melting in Simulated Saliva. Coatings 2022, 12, 840. [Google Scholar] [CrossRef]
  31. Wang, Y.; Cheng, X.; Li, X. Electrochemical behavior and compositions of passive films formed on the constituent phases of duplex stainless steel without coupling. Electrochem. Commun. 2015, 57, 56–60. [Google Scholar] [CrossRef]
  32. Chen, X.; Liao, Q.; Gong, M.; Fu, Q. Corrosion Performances of Selective Laser Melting Ti6Al4V Alloy in Different Solutions. Metals 2023, 13, 192. [Google Scholar] [CrossRef]
  33. Liu, M.; Cheng, X.; Li, X.; Lu, T.J. Corrosion behavior of low-Cr steel rebars in alkaline solutions with different pH in the presence of chlorides. J. Electroanal. Chem. 2017, 803, 40–50. [Google Scholar] [CrossRef]
  34. Luo, H.; Su, H.; Dong, C.; Xiao, K.; Li, X. Electrochemical and passivation behavior investigation of ferritic stainless steel in alkaline environment. Constr. Build. Mater. 2015, 96, 502–507. [Google Scholar] [CrossRef]
Figure 1. Scanning electron microscopy (SEM) of (a,a1) cast- and (b,b1) PBF-LB/M-TC4.
Materials 17 02583 g001
Figure 2. (a) The 1800 s OCPs of TC4 immersion in simulated physiological solution, (b) E vs. logt (s), (c) passive film formation rate, (d) OCP of 168 h, (e) fitting results of OCP.
Materials 17 02583 g002
Figure 3. Potentiodynamic polarization curves of cast- and PBF-LB/M-TC4 immersed in physiological solution for 0.5 and 120 h. (a) cast-TC4, (a1) magnification of anode curve of cast-TC4, (b) PBF-LB/M-TC4 and (b1) magnification of anode curve of PBF-LB/M-TC4.
Materials 17 02583 g003
Figure 4. Cyclic voltammetry curves of TC4 with different scanning ranges of immersion in physiological solution: (aa3) cast-TC4, (bb3) PBF-LB/M-TC4.
Materials 17 02583 g004aMaterials 17 02583 g004b
Figure 5. LPR curves of two TC4 immersed for different times: (a) cast-TC4, (b) PBF-LB/M-TC4 and (c) Rp fitting.
Materials 17 02583 g005
Figure 6. The EIS test results of two TC4 immersion in physiological solution: (a,b) Nyquist and (a1,b1) Bode.
Materials 17 02583 g006
Figure 7. Equivalent circuit of TC4 immersion in physiological solution.
Materials 17 02583 g007
Figure 8. EIS fitting results of TC4 after immersion in physiological solution for different times. (a) |Z|0.01, (b) Rs, (c) Rf and Qf, (d) Rct and Qct.
Materials 17 02583 g008
Figure 9. Mott–Schottky curves and fitting results of two TC4 immersed in physiological solution for 168 h: (a) M–S curve, (b) ND and Efb.
Materials 17 02583 g009
Figure 10. XPS peaks comparison of cast- and PBF-LB/M-TC4 immersed in physiological solution for 168 h. (a) full spectrum, (b) Ti 2p, (c) Al2p, (d) O1s.
Materials 17 02583 g010
Figure 11. XPS element content comparison of passive film of cast- and PBF-LB/M-TC4 immersed in physiological solution for 168 h.
Materials 17 02583 g011
Figure 12. AES depth profile of cast- and PBF-LB/M-TC4 immersed in physiological solution for 168 h ((a)—Ti, (b)—Al, (c)—V, and (d)—O).
Materials 17 02583 g012
Table 1. OCP fitting results of two TC4 after continuous monitoring in physiological solution for 168 h.
AlloyFitting ResultR2
Cast-TC4 E = 0.268 exp ( t / 0.923 ) 0.268 exp ( t / 0.923 ) + 0.099 0.9666
PBF-LB/M-TC4 E = 0.369 exp ( t / 1.528 ) 0.170 exp ( t / 0.003 ) + 0.004 0.9969
Table 2. Fitting values of potentiodynamic polarization parameters of cast- and PBF-LB/M-TC4.
SampleTime (h)Ecorr (mVSCE)bc, mV·dec−1icorr, μA·cm−2ipass, μA·cm−2
Cast-TC40.5−383 ± 12−144 ± 110.12 ± 0.036.5 ± 0.6
120−113 ± 8−127 ± 90.04 ± 0.024.6 ± 0.4
PBF-LB/M-TC40.5−385 ± 13−191 ± 140.17 ± 0.034.4 ± 0.5
120−118 ± 7−143 ± 60.02 ± 0.013.0 ± 0.3
Disclaimer/Publisher’s Note: The statements, opinions and data contained in all publications are solely those of the individual author(s) and contributor(s) and not of MDPI and/or the editor(s). MDPI and/or the editor(s) disclaim responsibility for any injury to people or property resulting from any ideas, methods, instructions or products referred to in the content.

