
Effect of Composition Characteristics on Mechanical Properties of UHPMC Based on Response Surface Methodology and Acoustic Emission Monitoring


Abstract
:1. Introduction
2. Materials and Methods
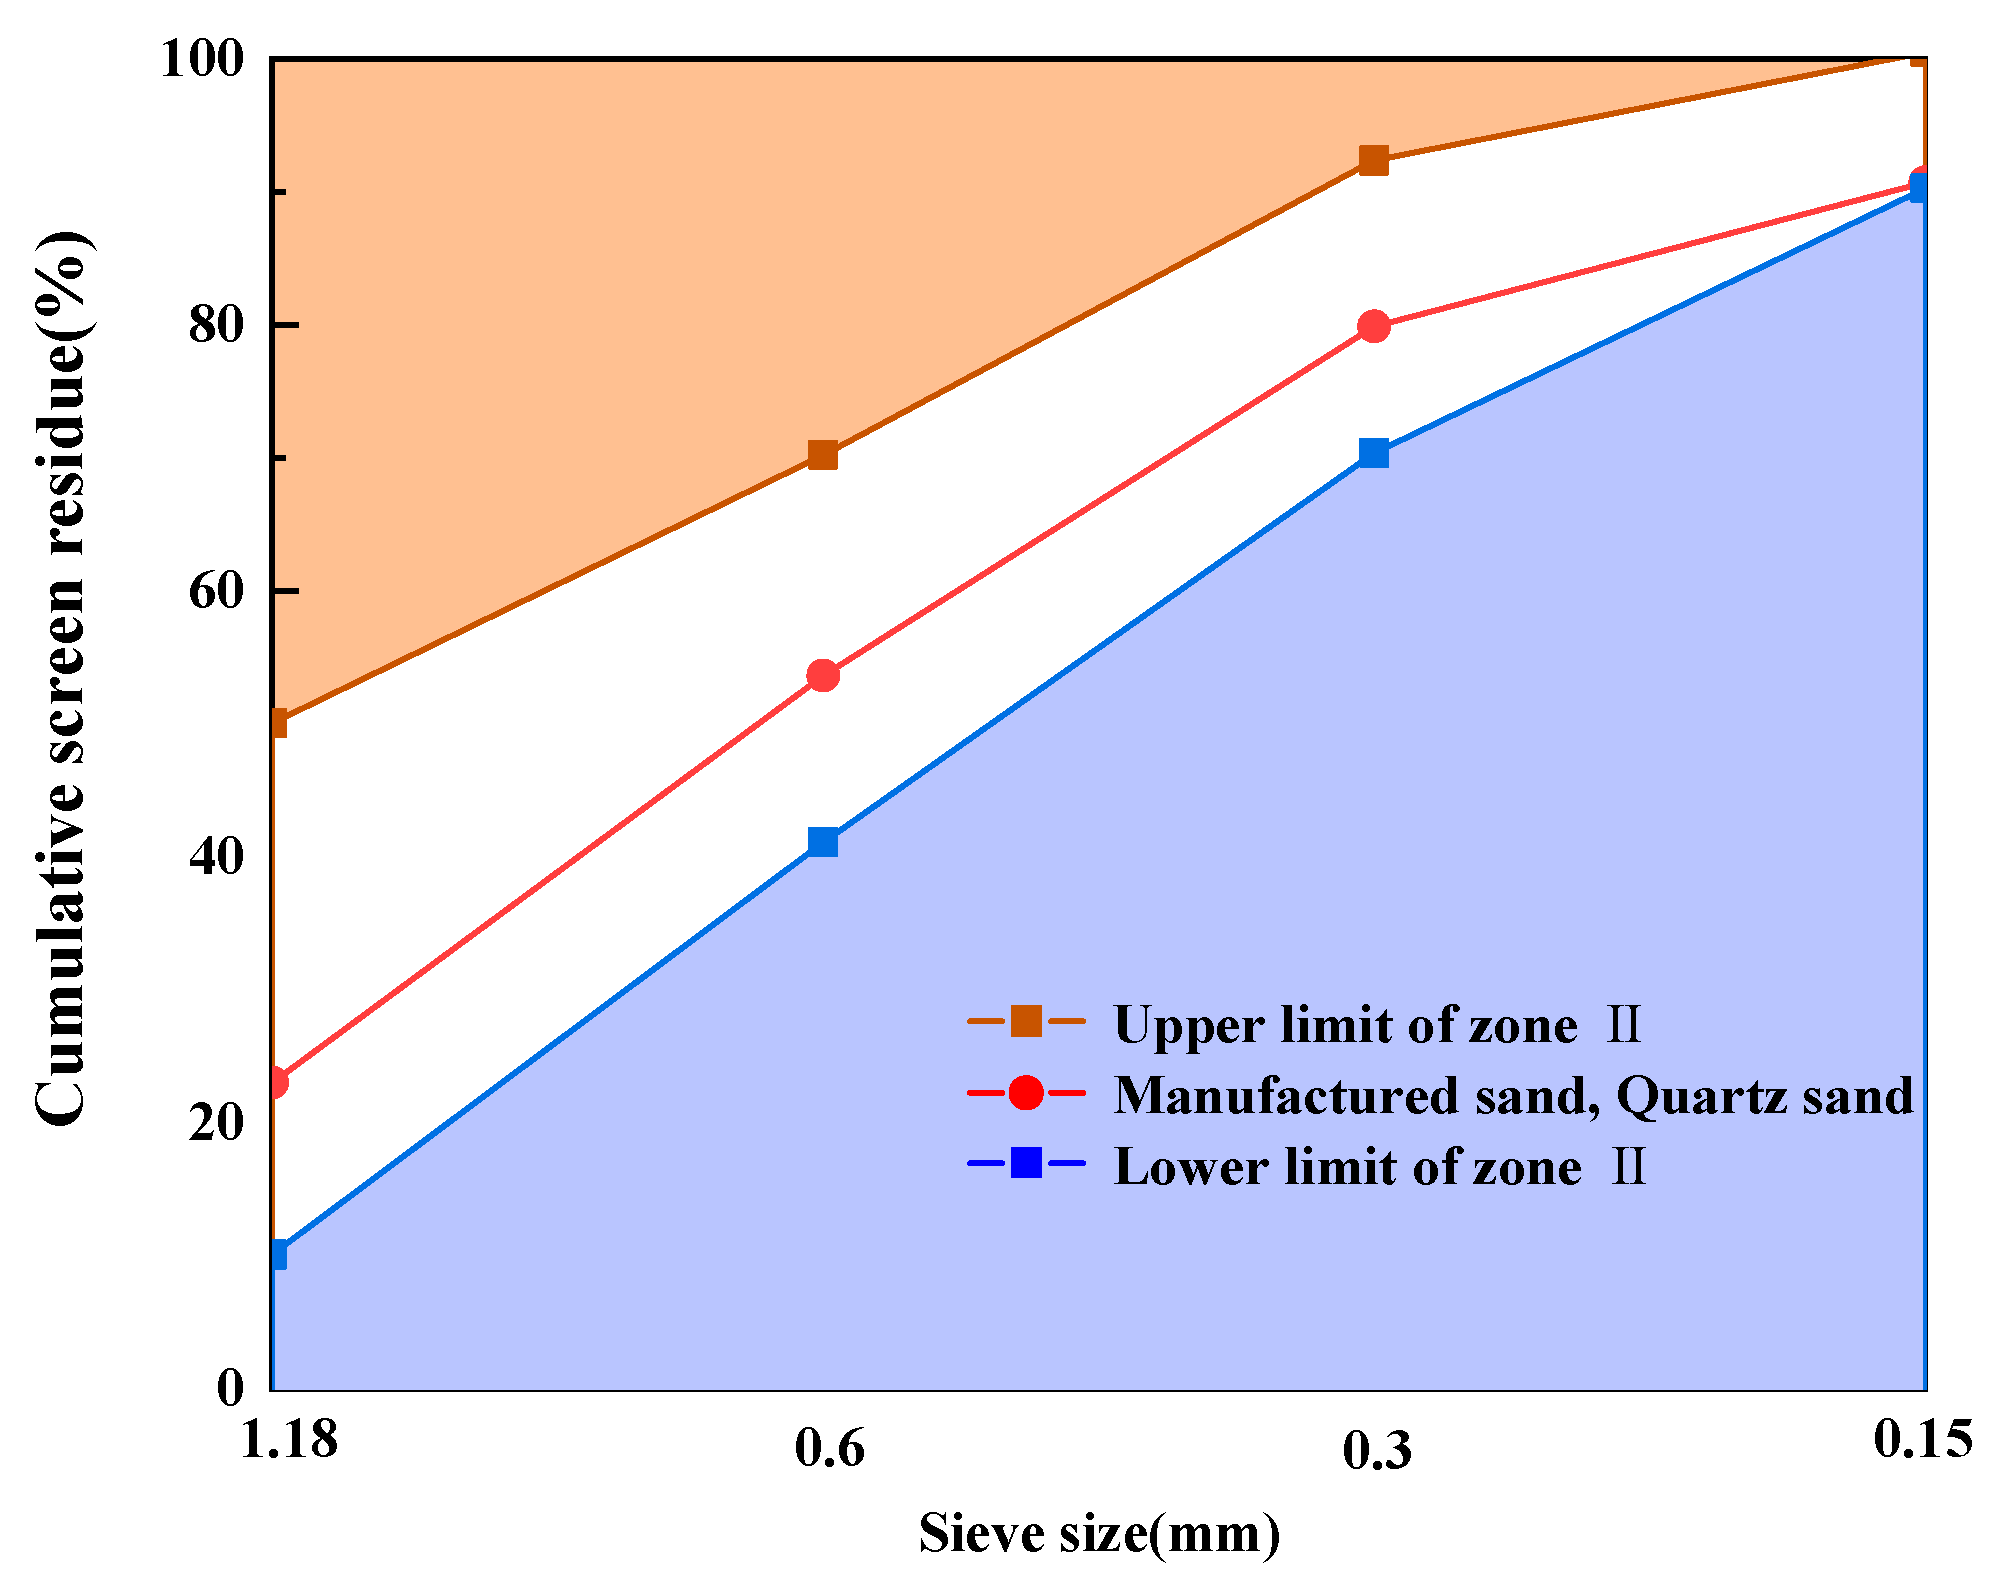
2.1. Raw Materials
2.2. Proportion of Mixes
2.3. Specimen Preparation
2.4. Test Procedure
2.4.1. Mechanical Test
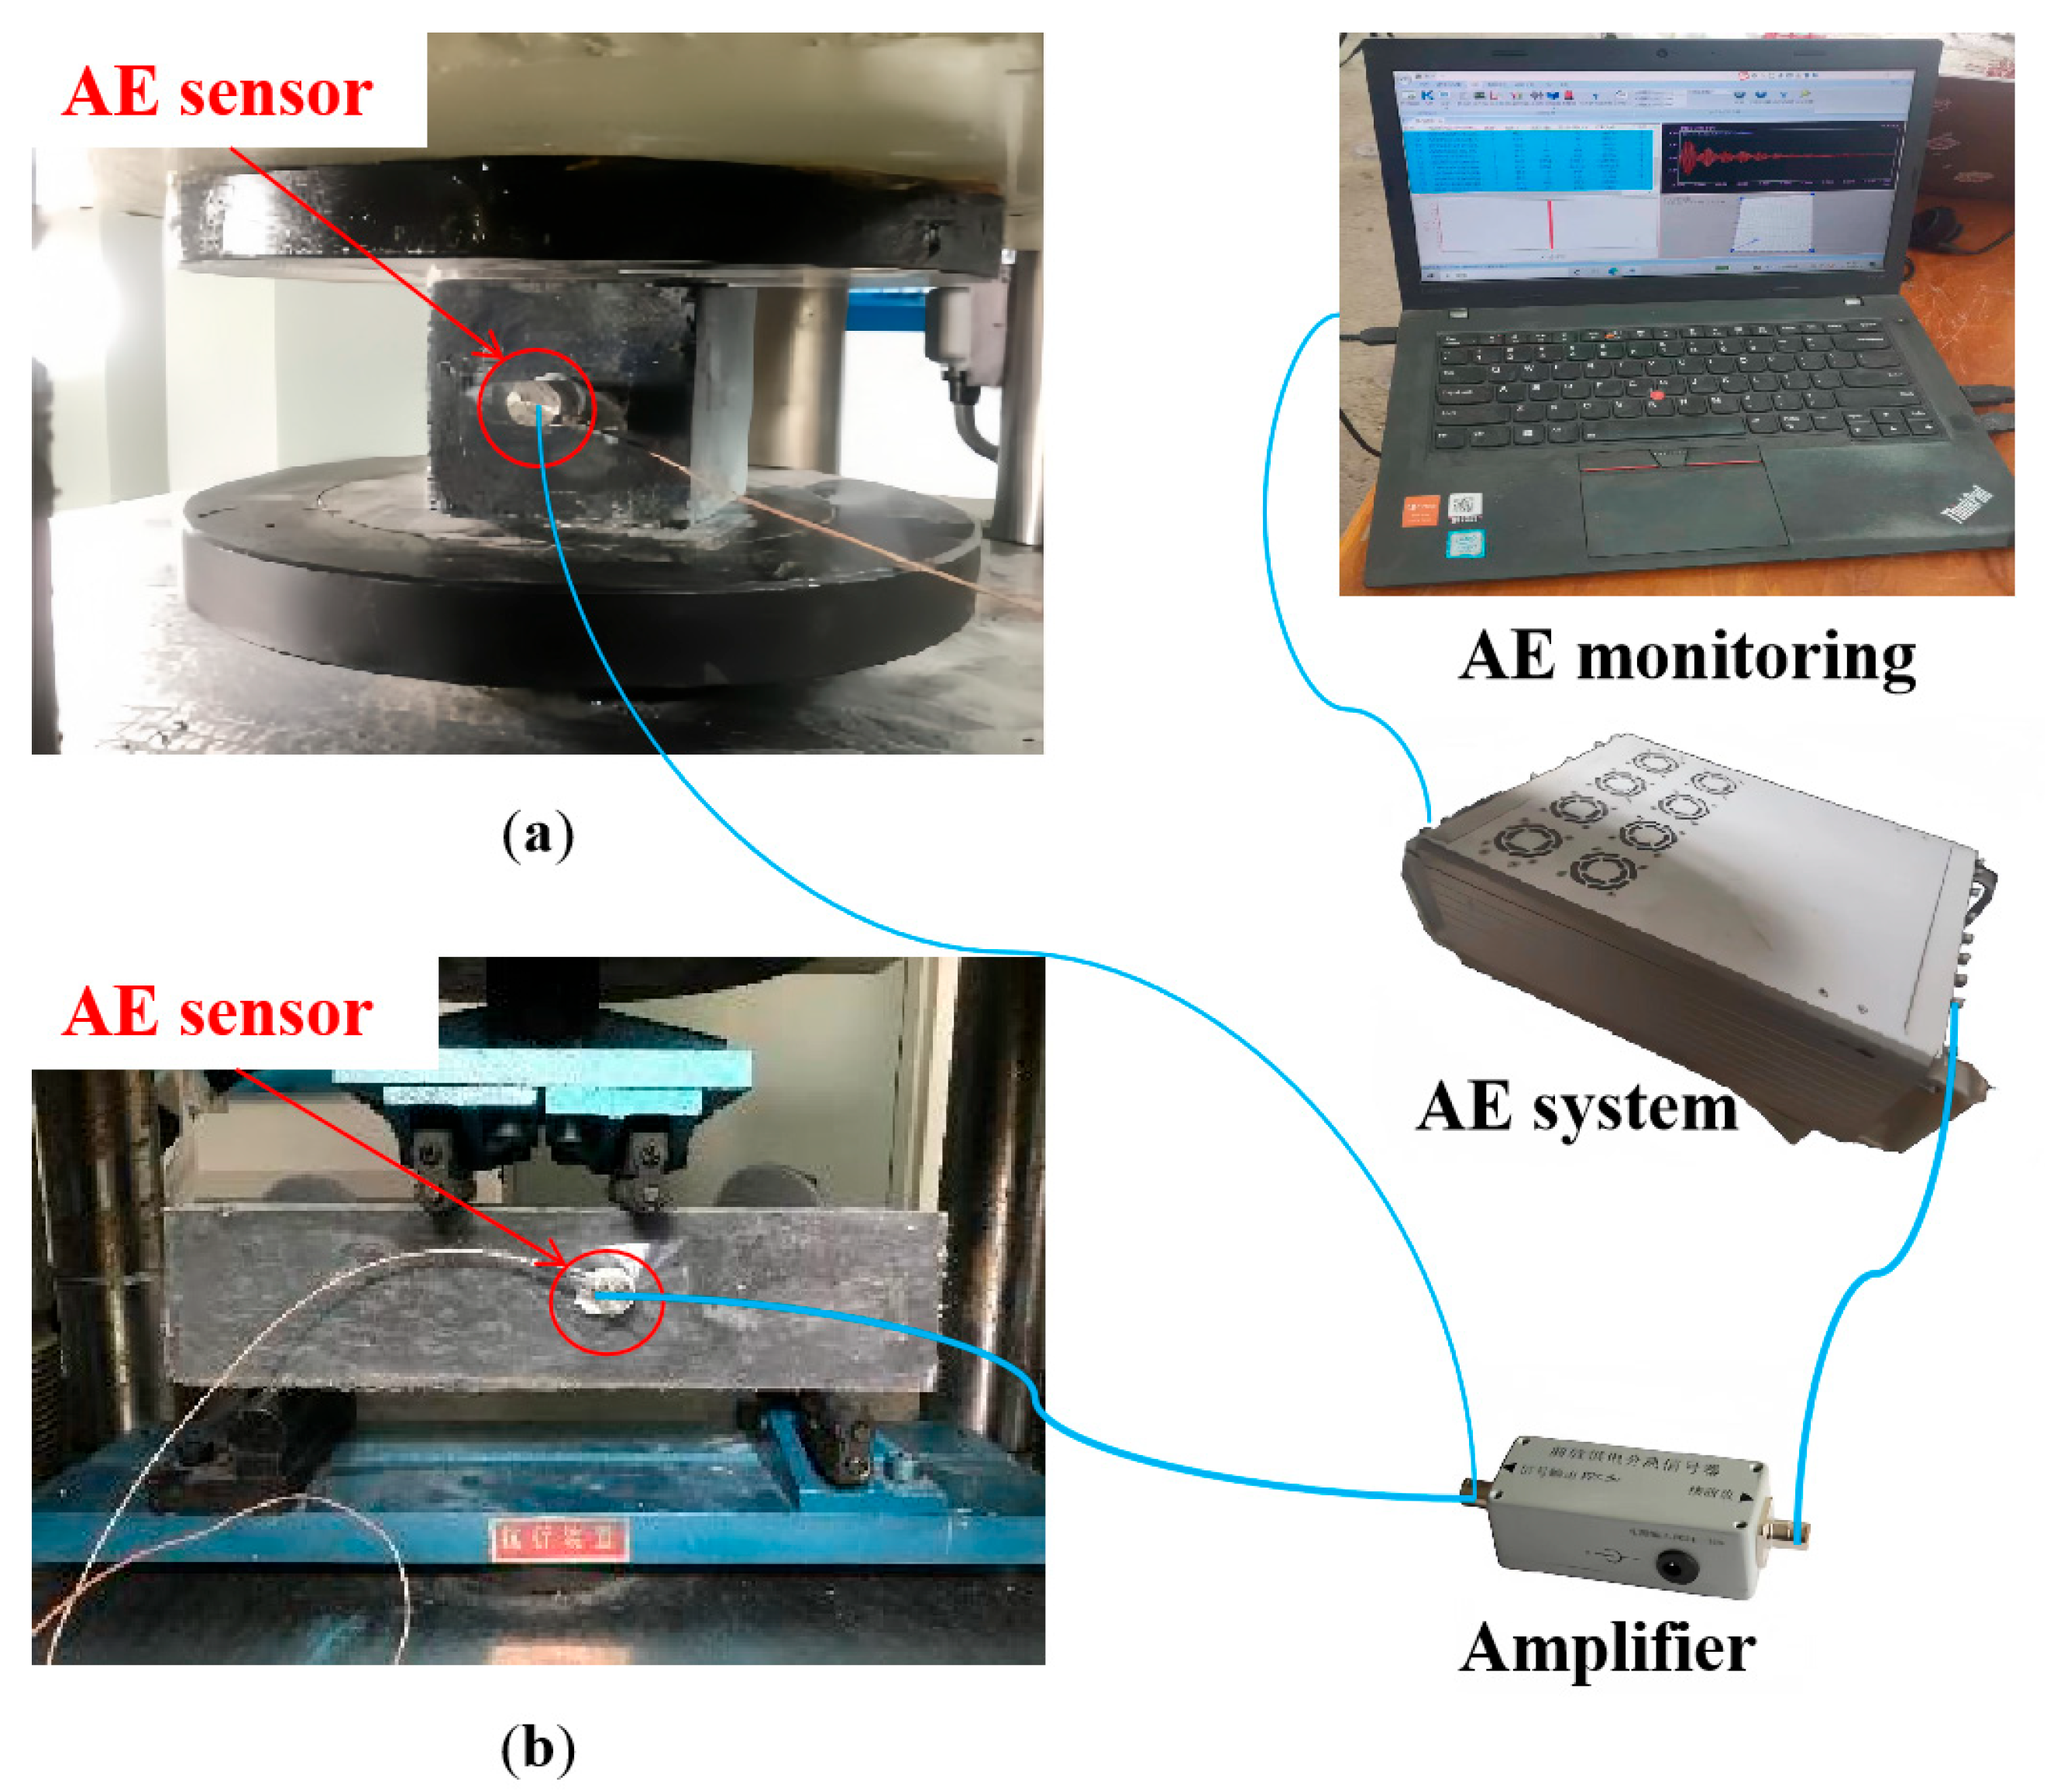
2.4.2. AE Test
2.4.3. Parameter Index
- Flexural toughness
- 2.
- Displacement ductility ratio
- 3.
- AE parameter
3. Results
3.1. Mechanical Properties Analysis Based on RSM
3.1.1. Compressive Strength
3.1.2. Flexural Strength
3.1.3. Flexural Toughness
3.1.4. Combinatorial Optimization Forecasting
3.2. Load–Displacement Curve
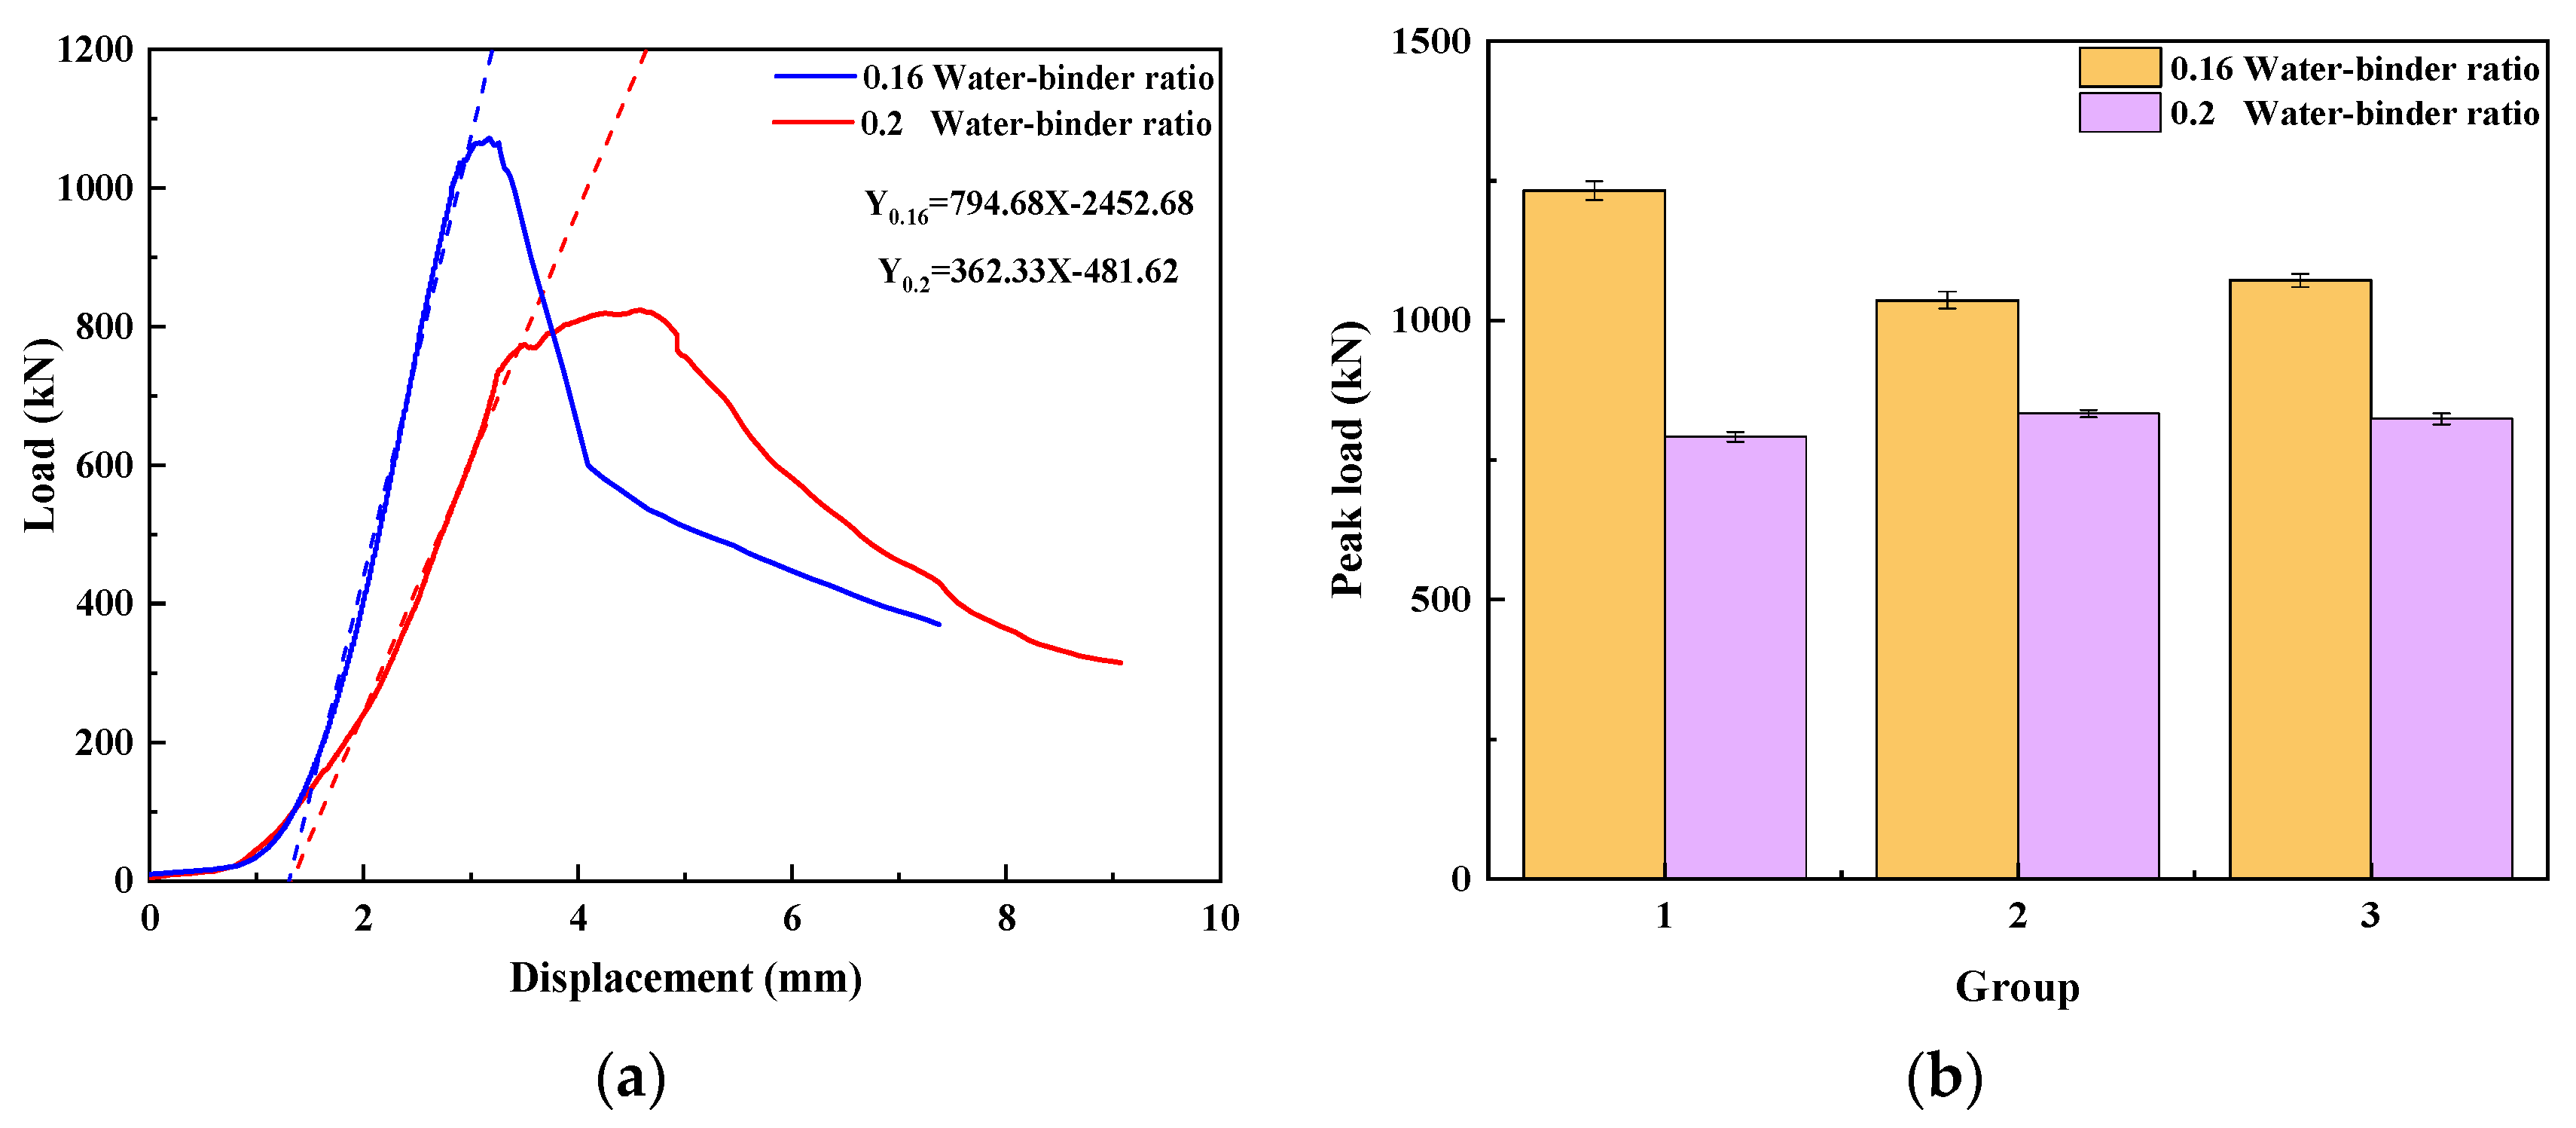
3.2.1. Load–Displacement Curve of Compression Tests
- Water–binder ratio
- 2.
- MS replacement ratio
- 3.
- Stone powder content
3.2.2. Load–Displacement Curves of Four–Point Bending Tests
- Water–binder ratio
- 2.
- MS replacement ratio
- 3.
- Stone powder content
3.3. Fracture Analysis of UHPMC under Compression Based on AE Parameters
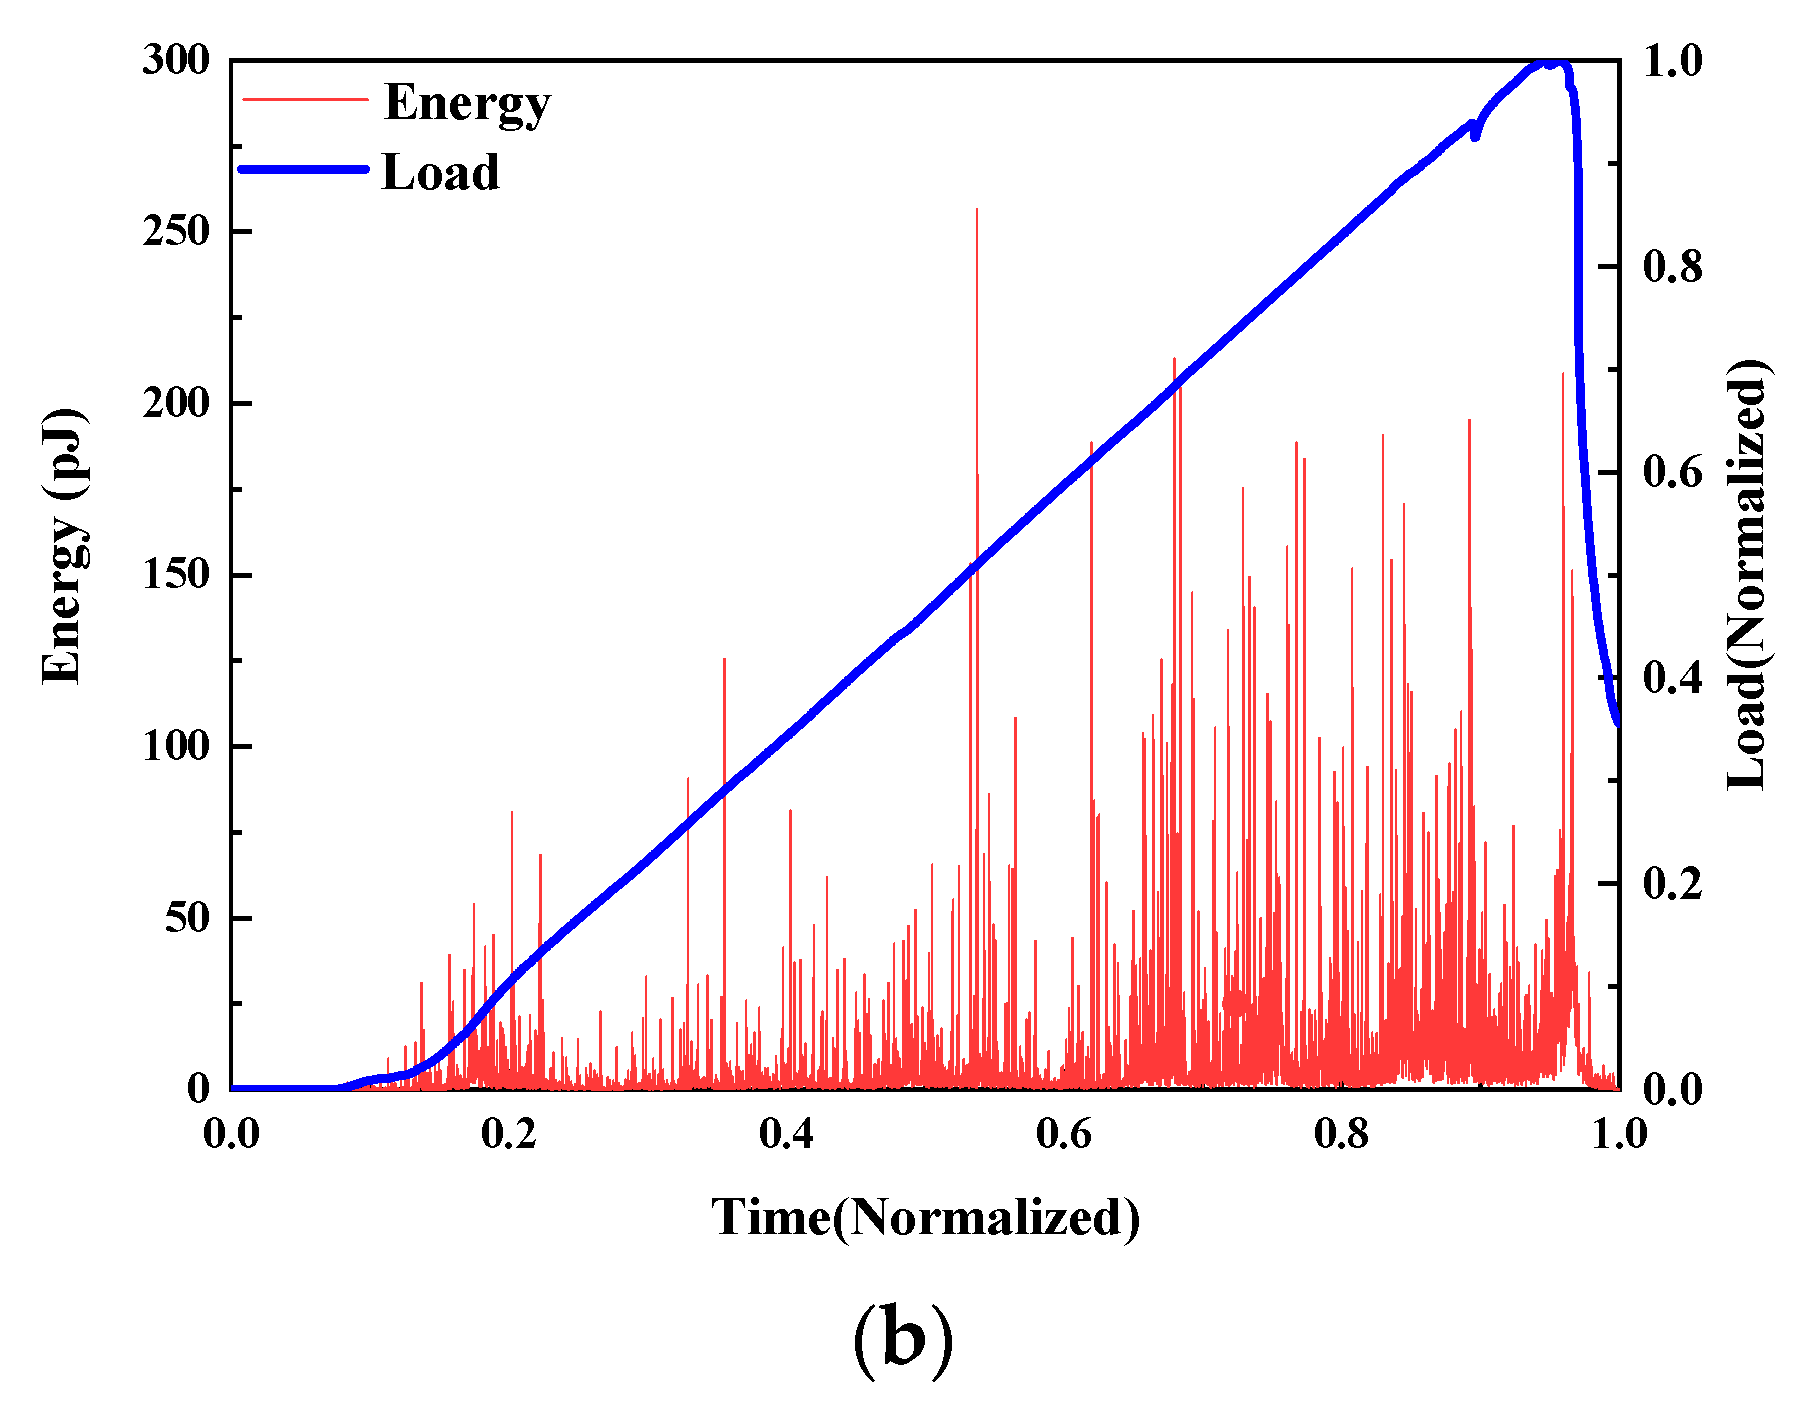
3.3.1. Effect of Water–Binder Ratio
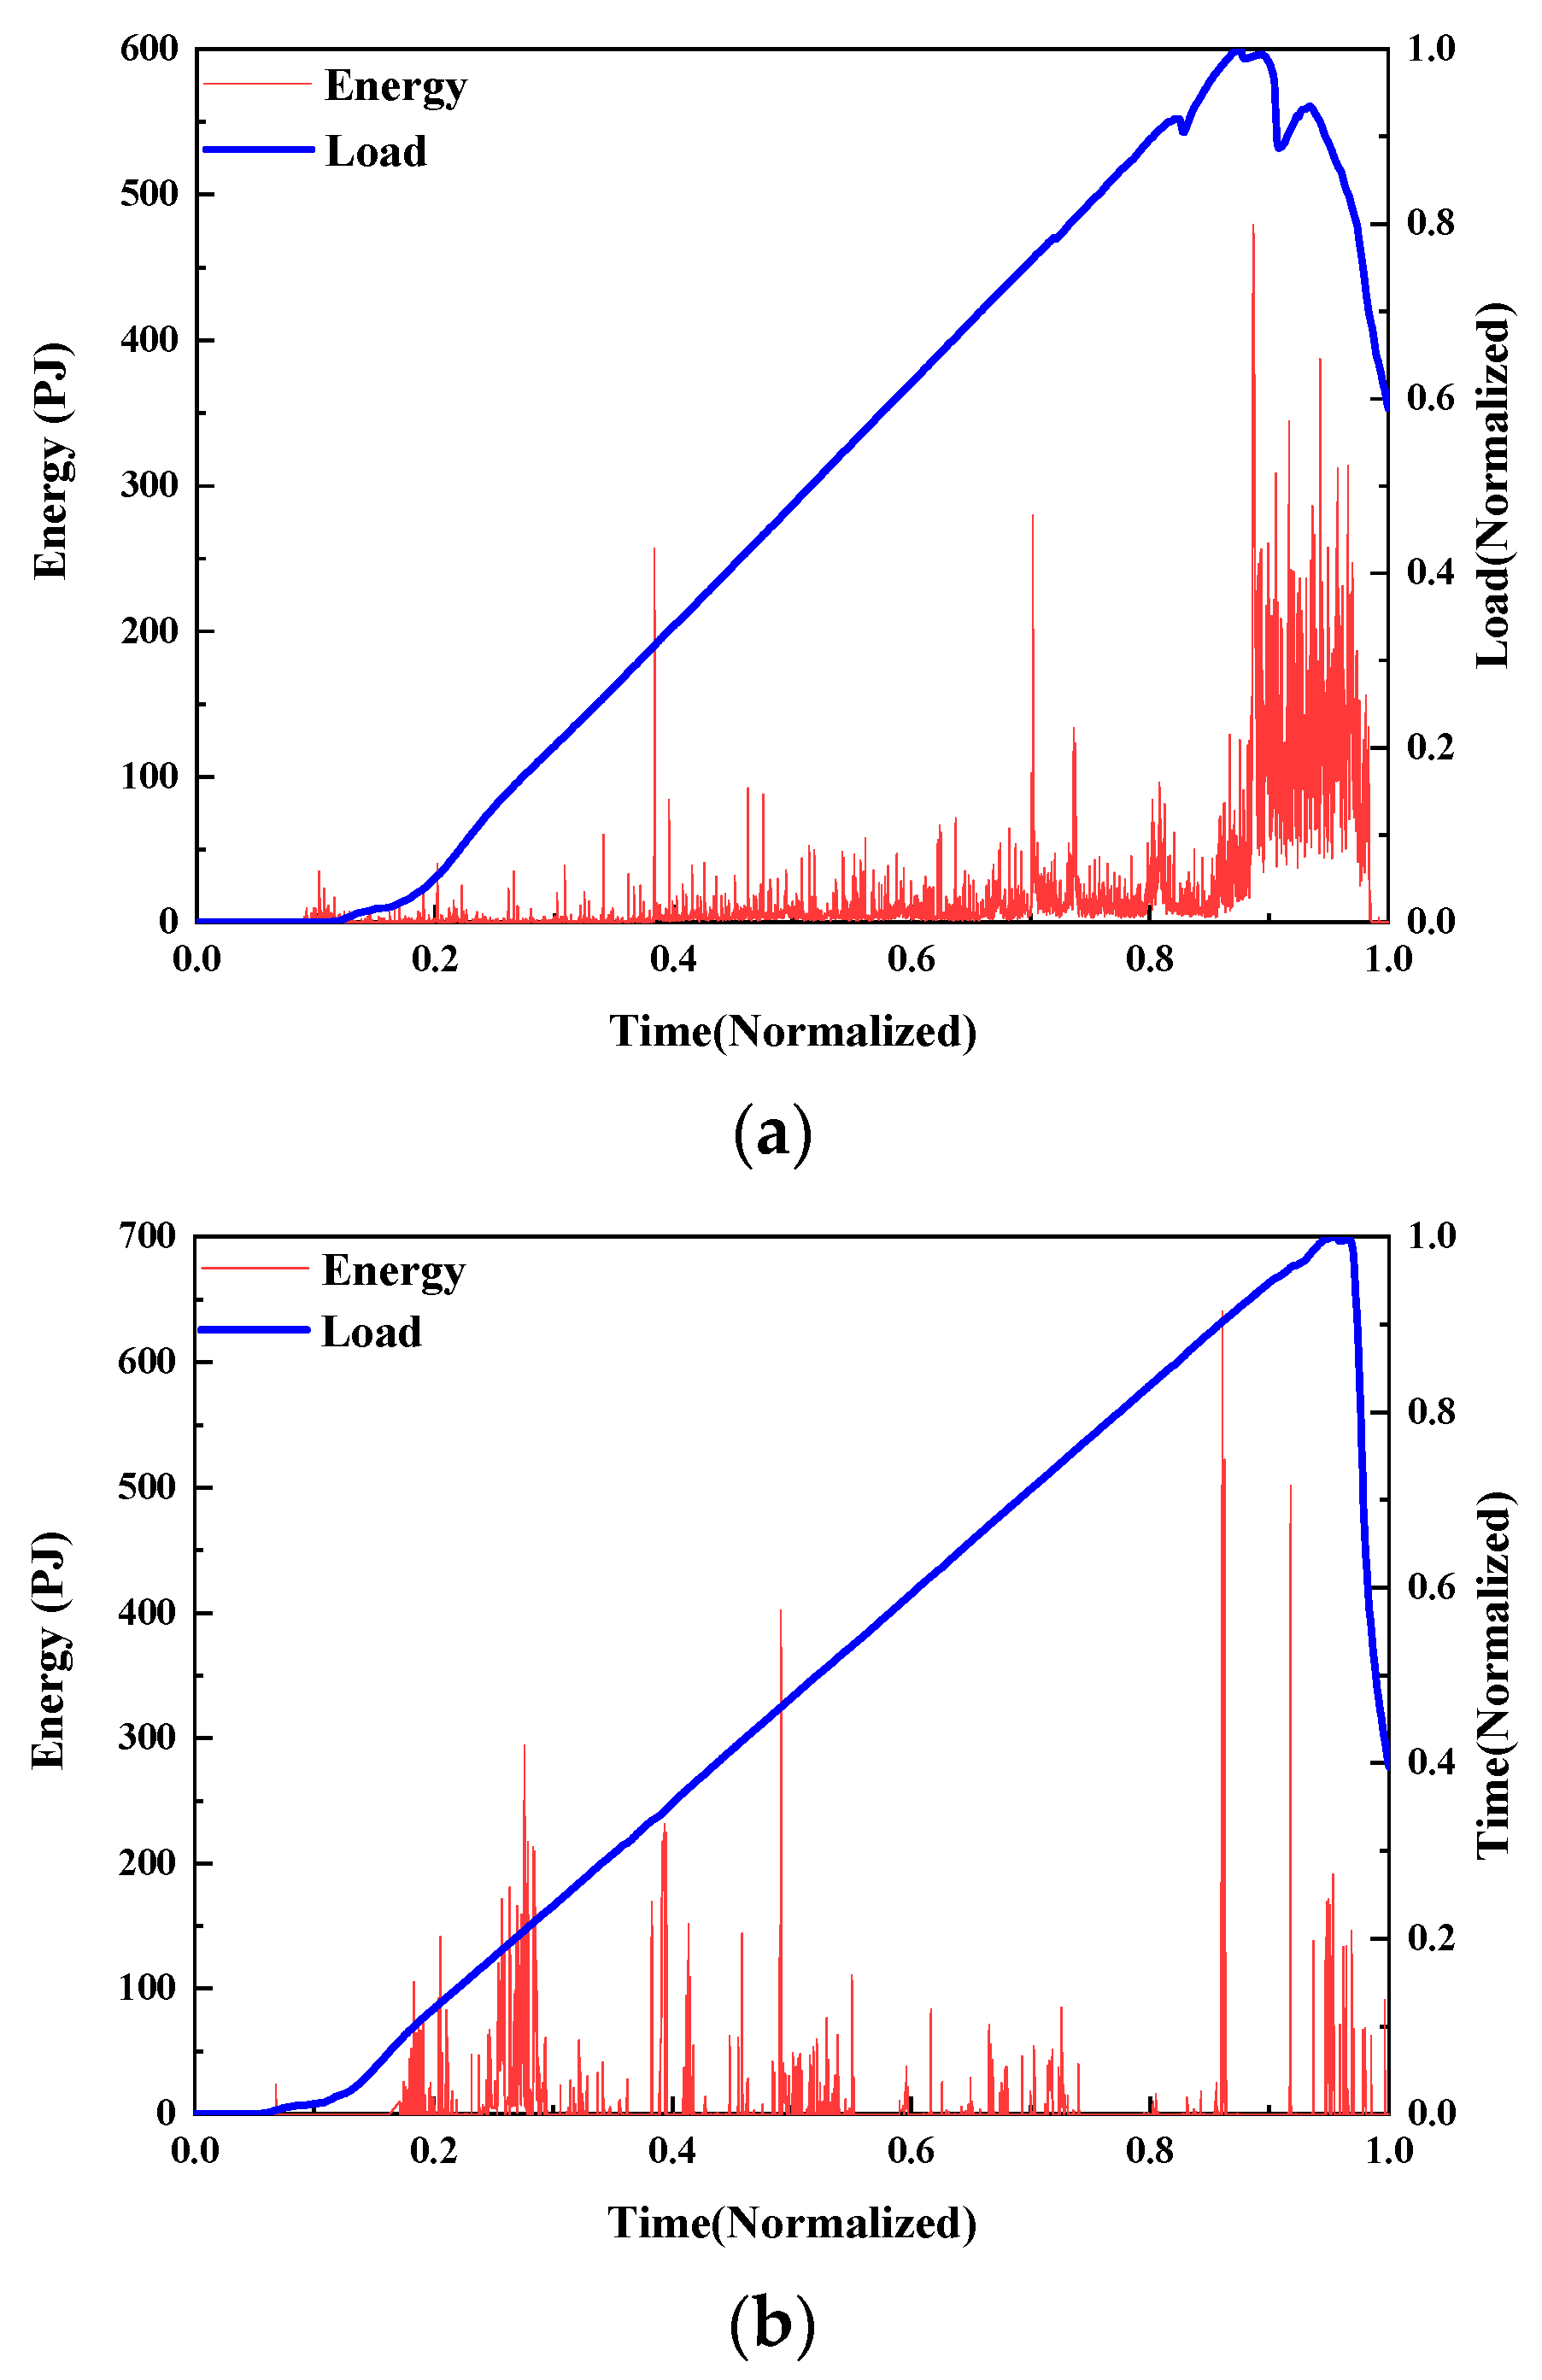
- AE energy
- 2.
- b-value
3.3.2. Effect of MS Replacement Ratio
- AE energy
- 2.
- b-value
3.3.3. Effect of Stone Powder Content
- AE energy
- 2.
- b-value
3.4. Flexural Damage Analysis of UHPMC under Four–Point Bending via AE Parameters
3.4.1. Effect of the Water–Binder Ratio
- Ringing count
- 2.
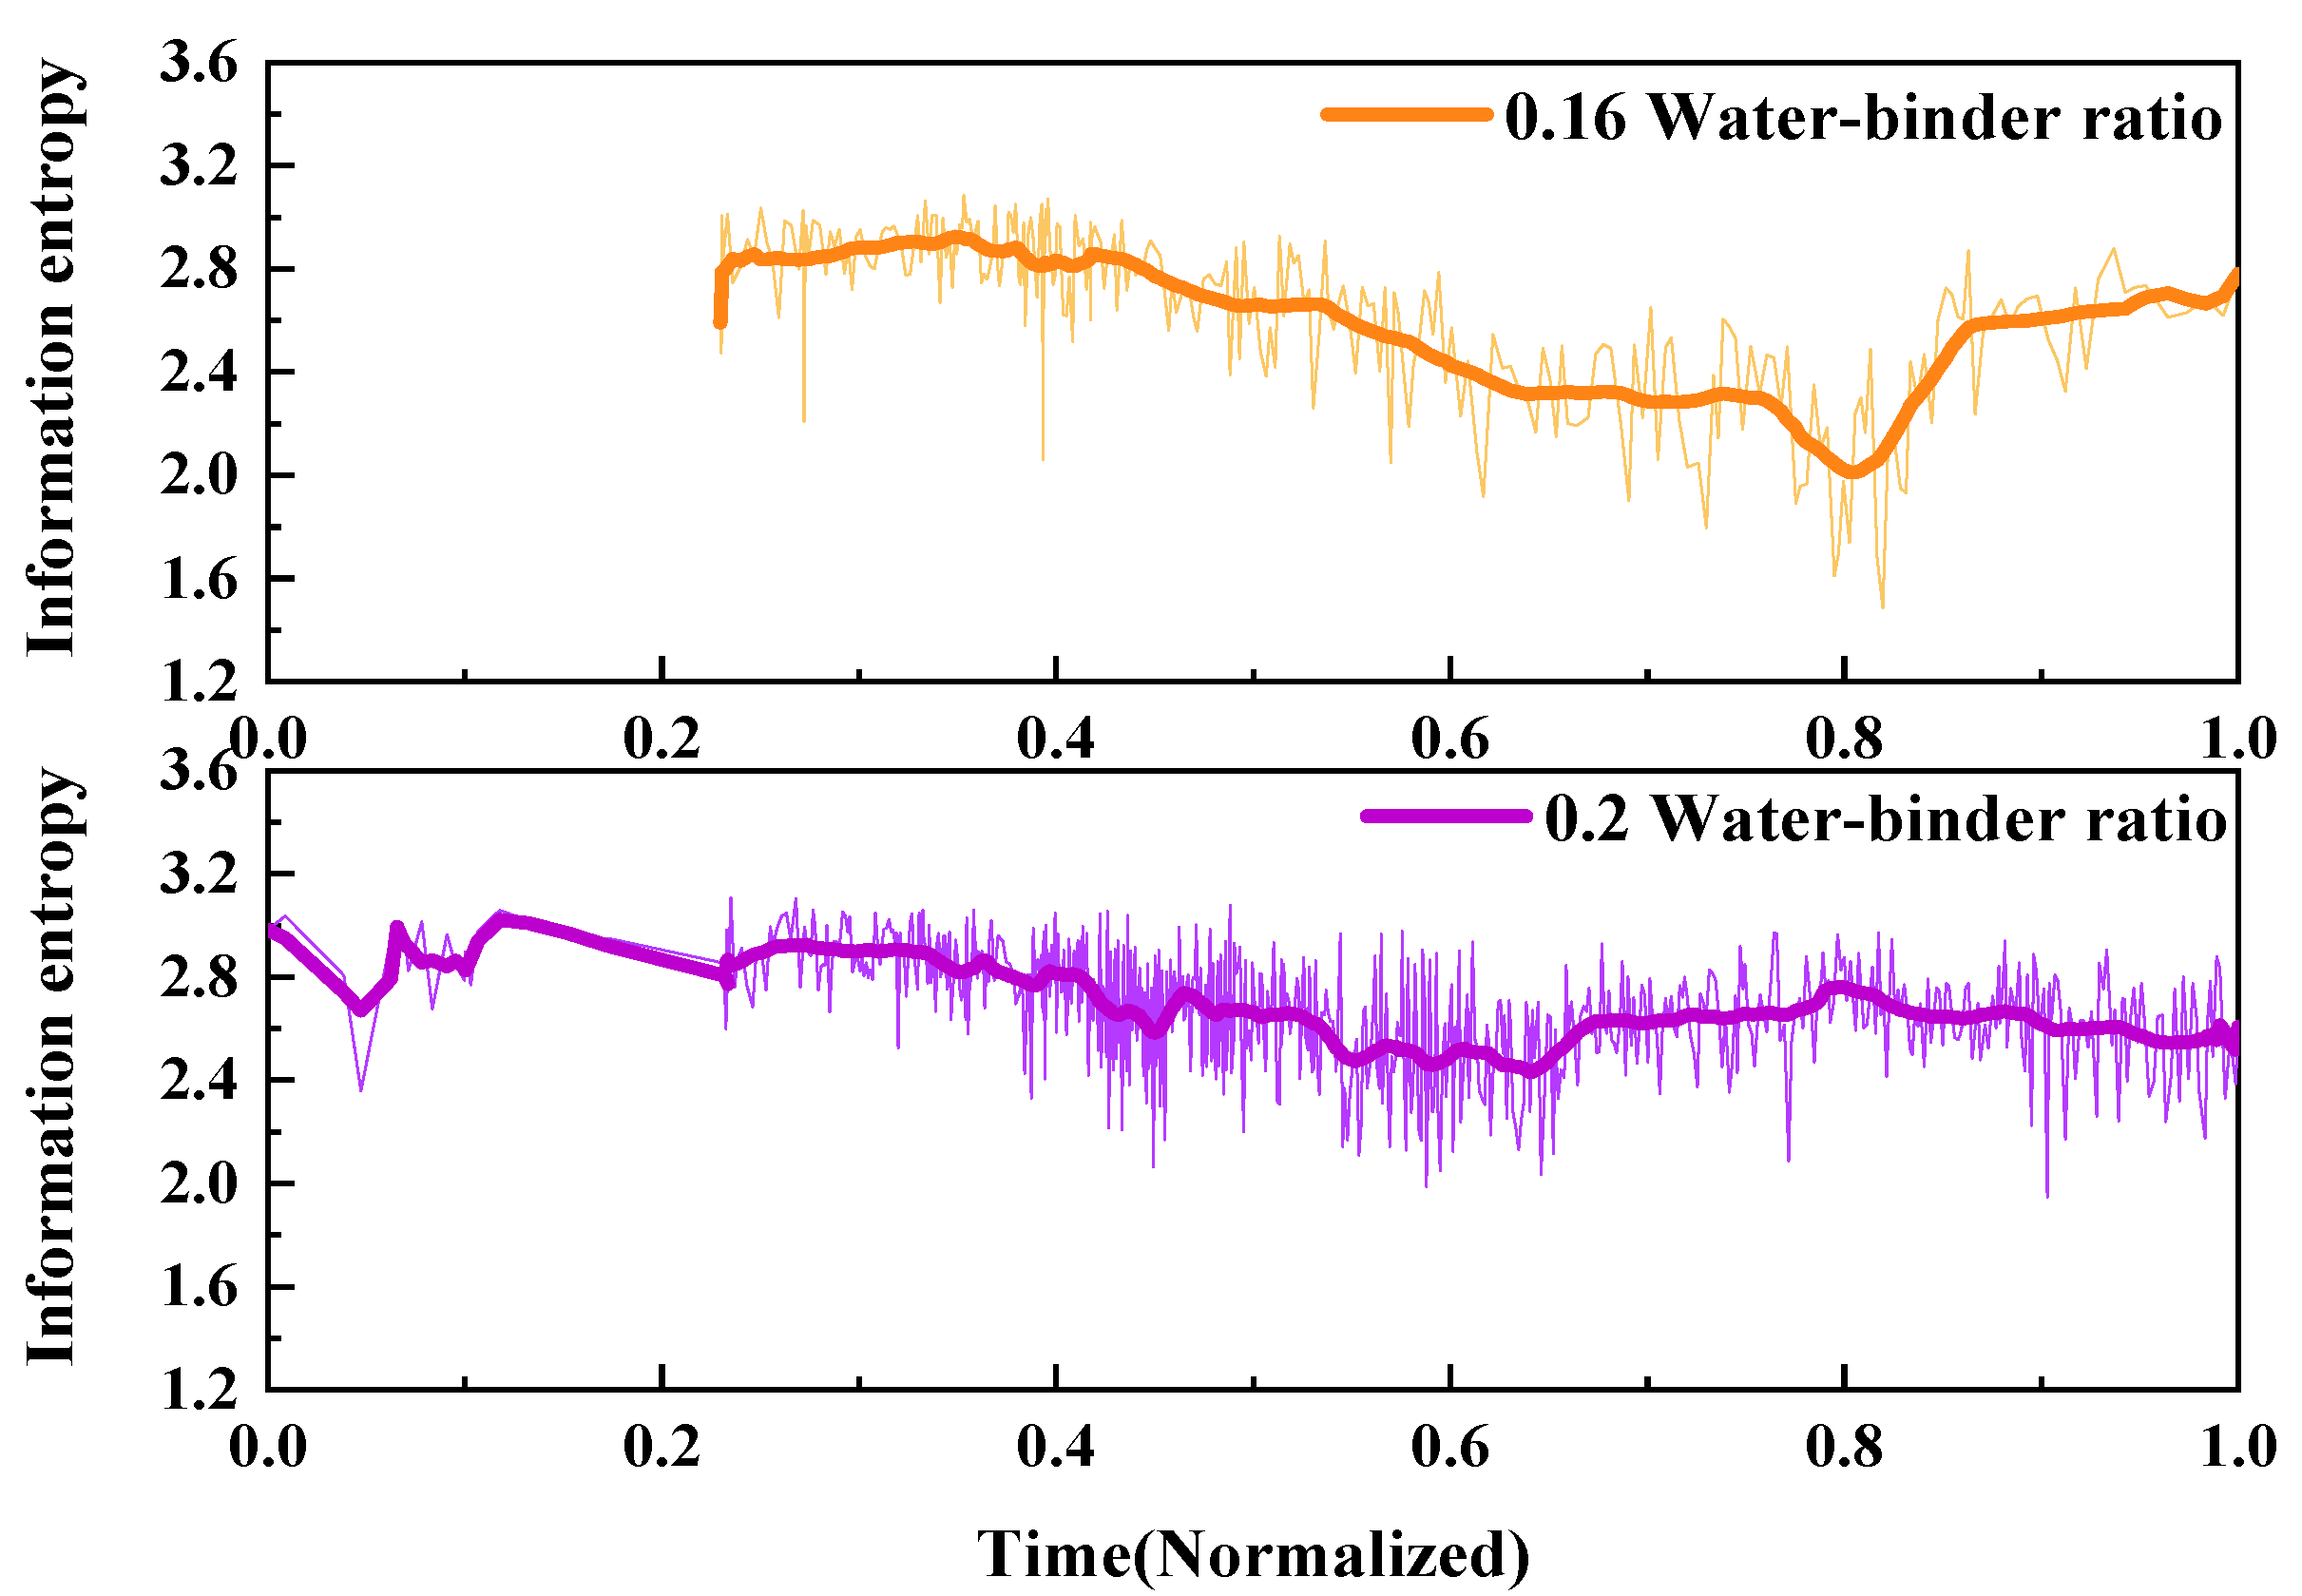
- Information entropy
- 3.
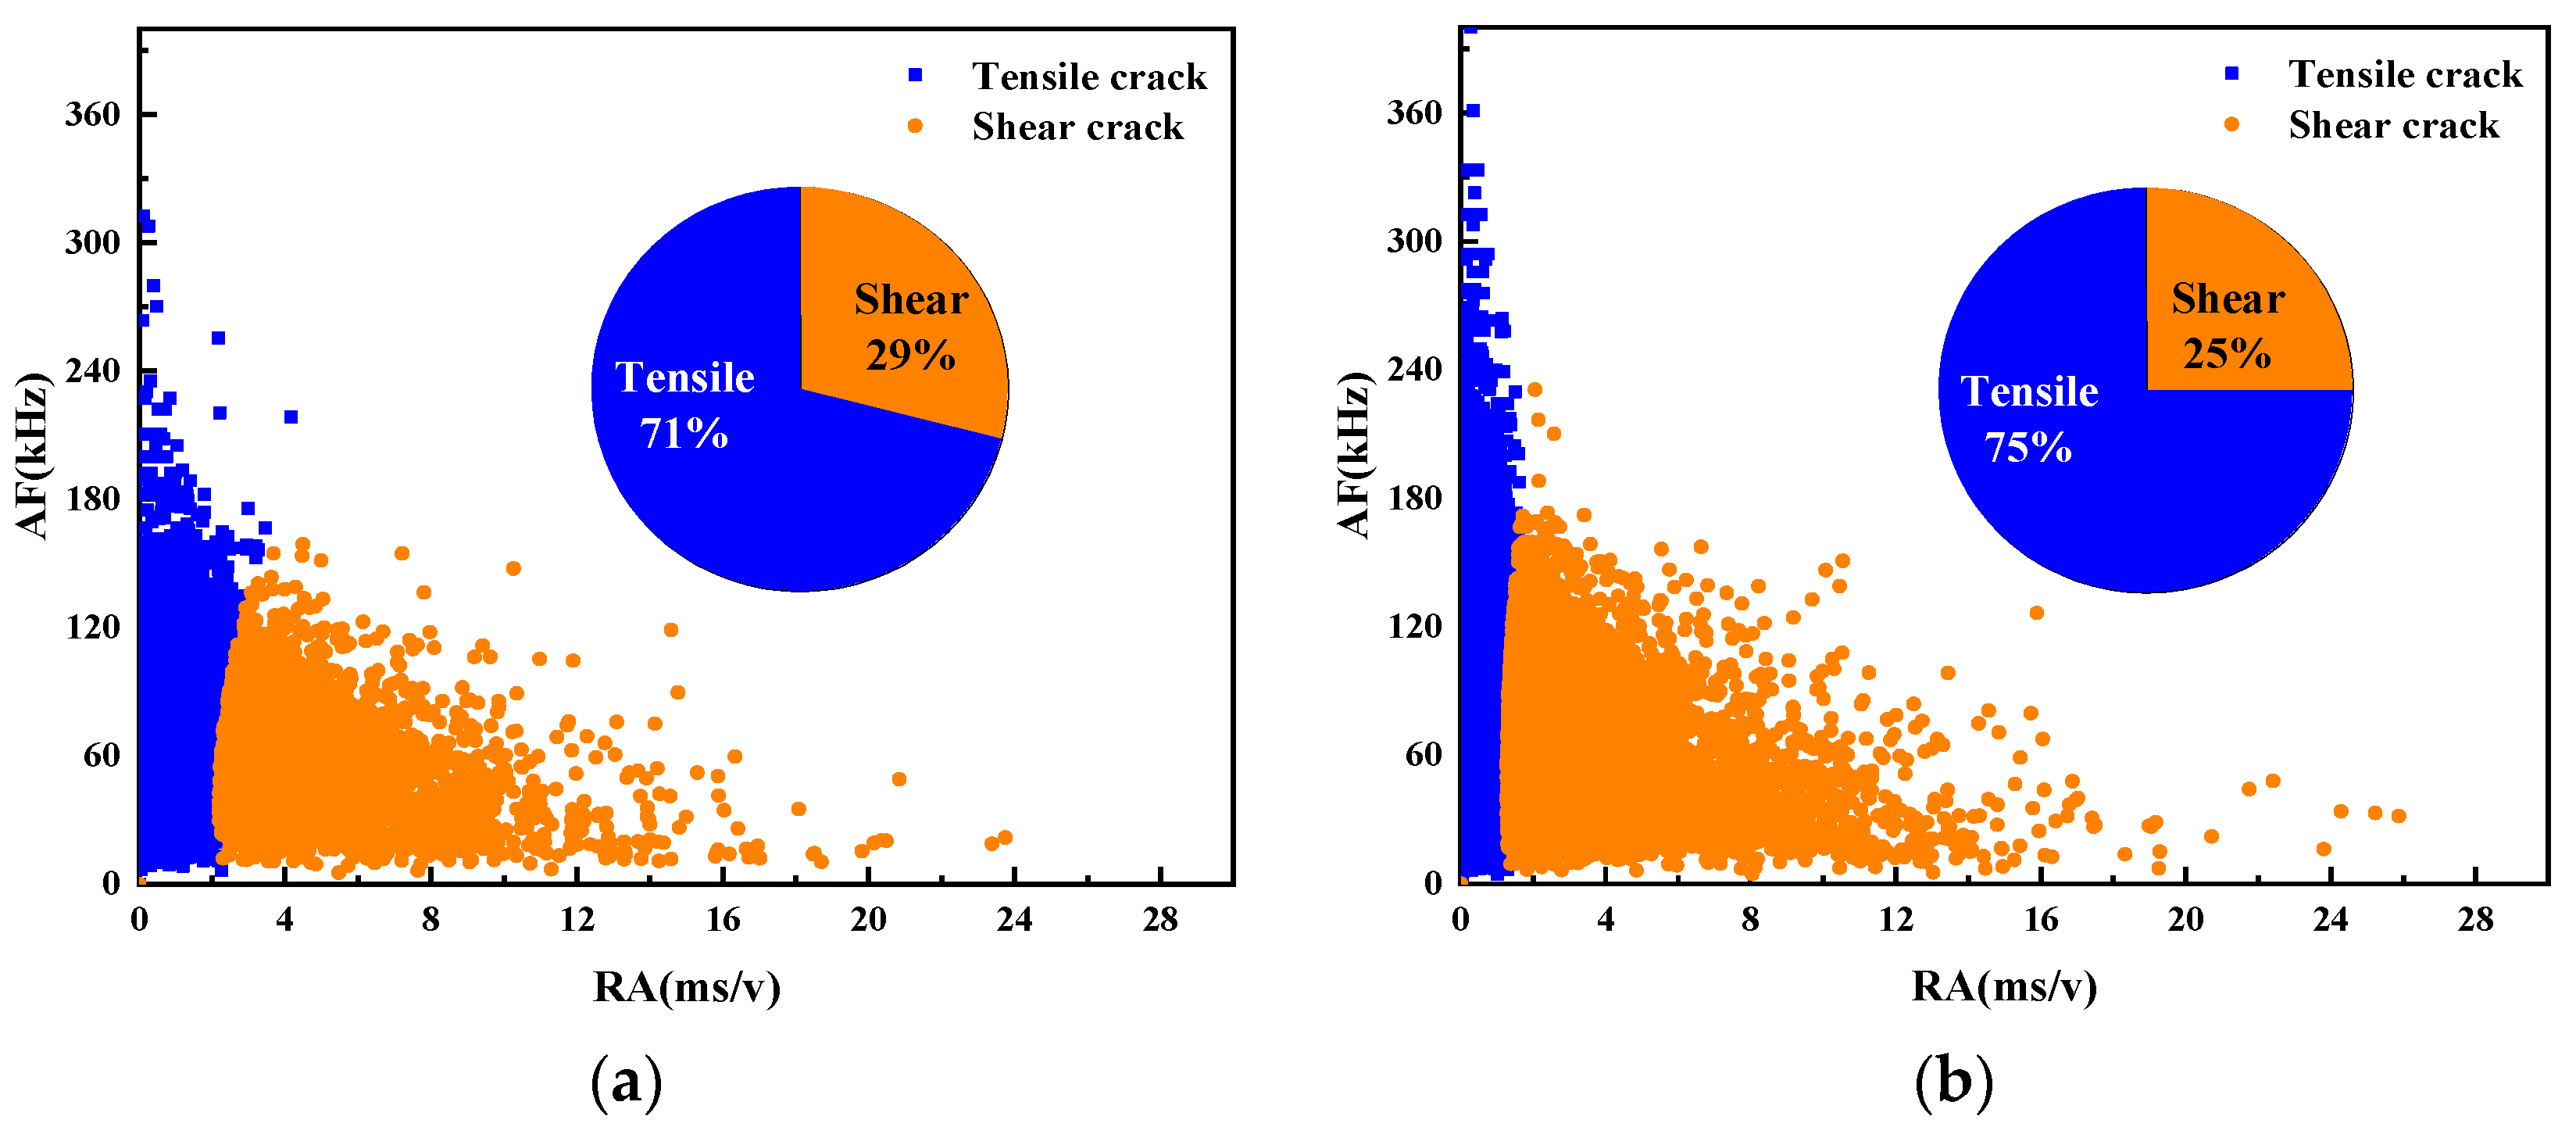
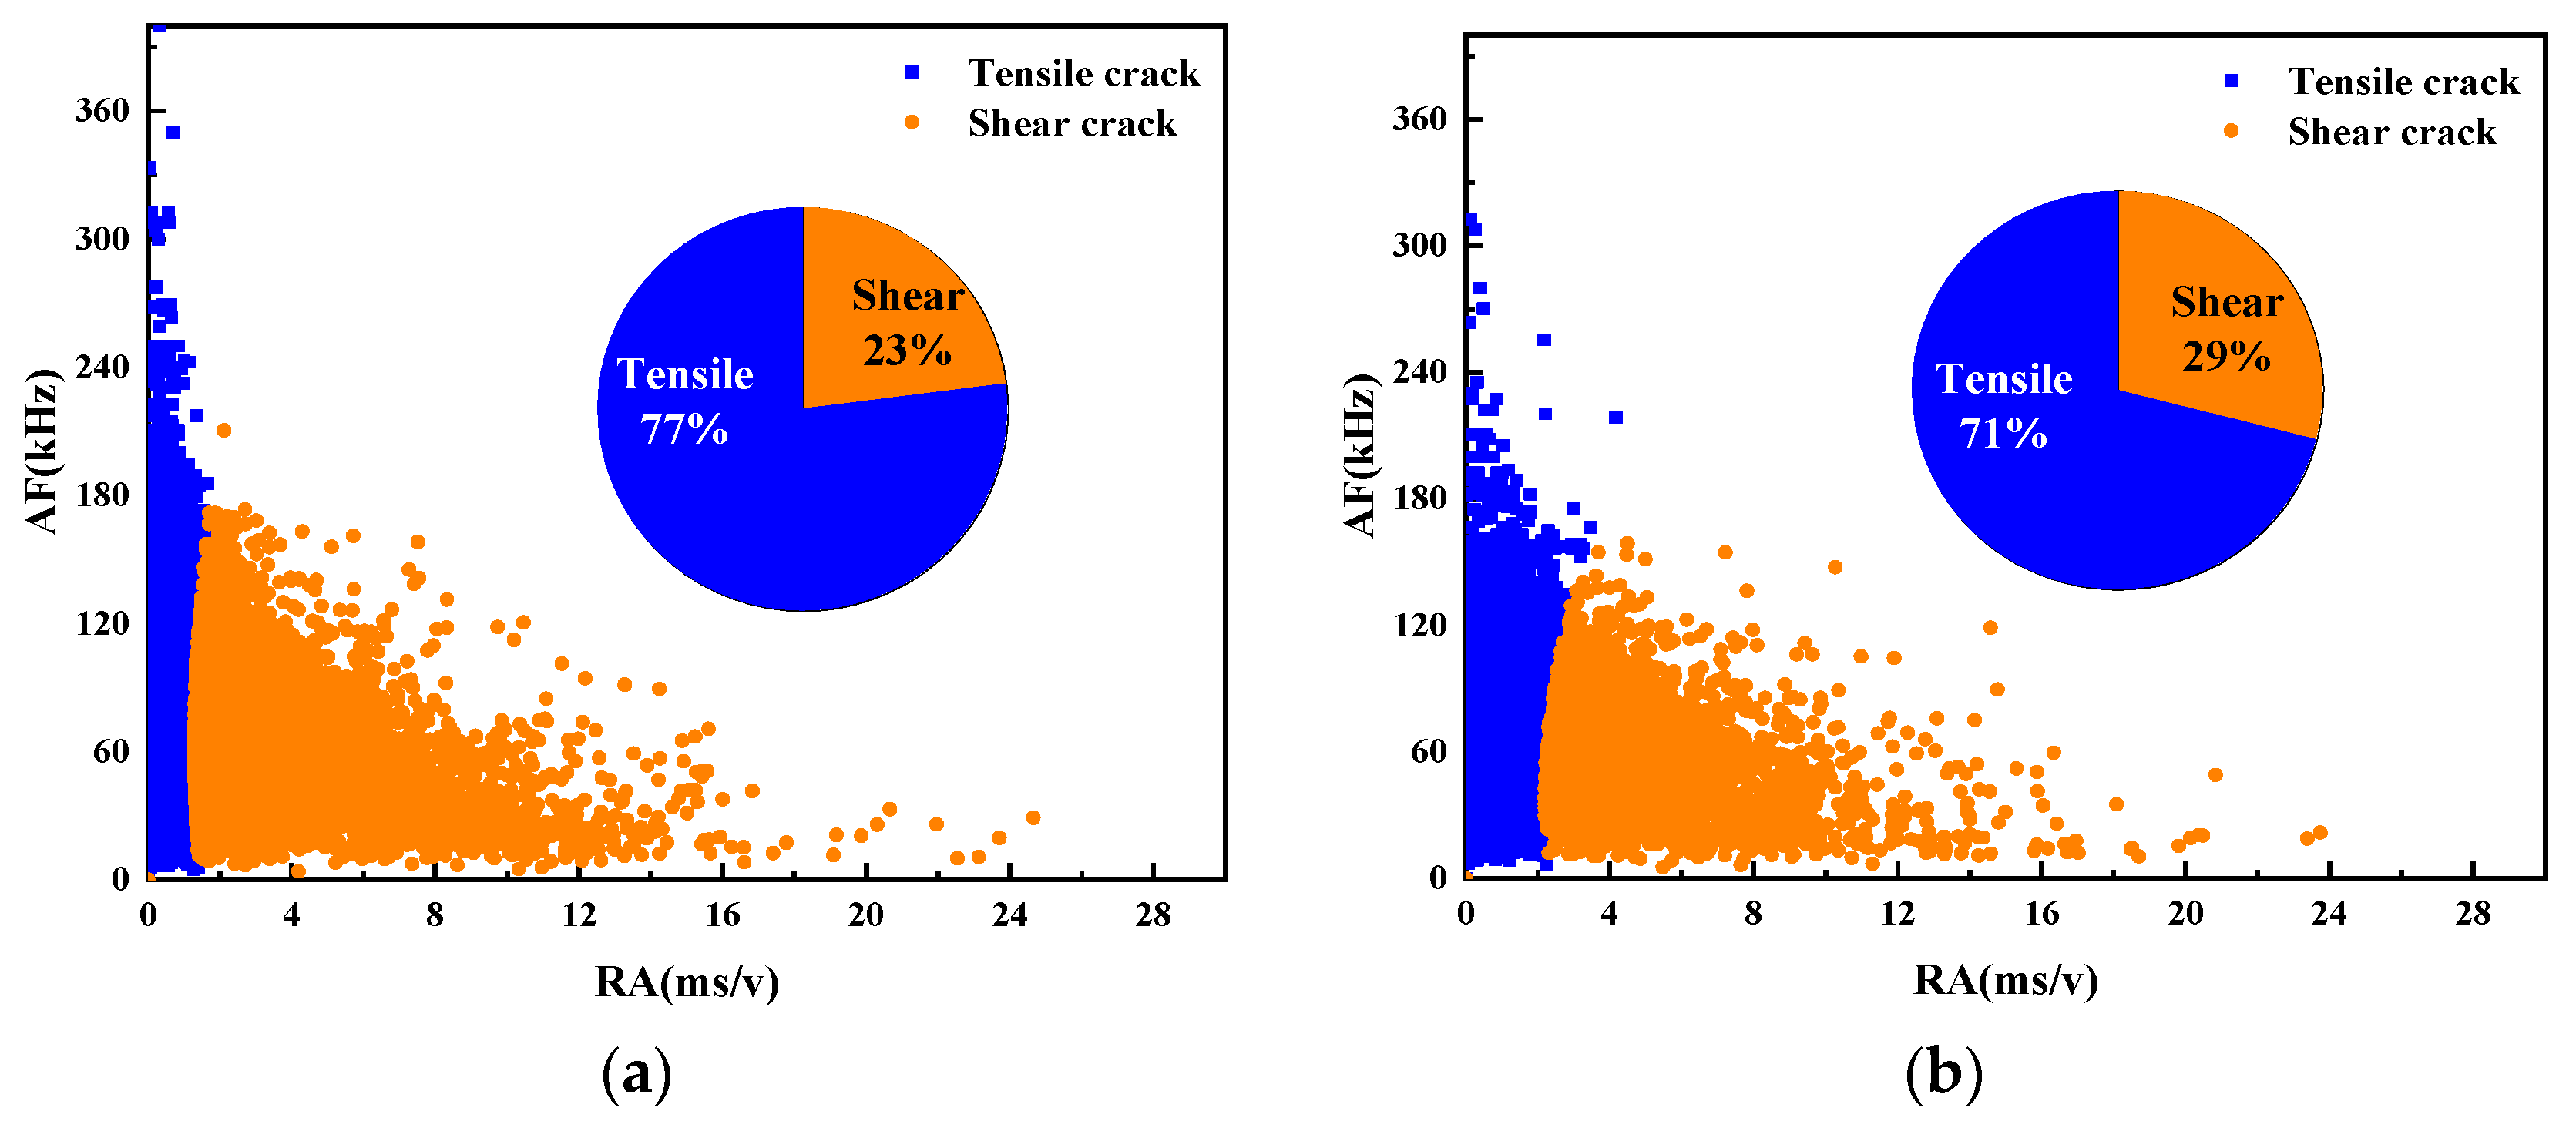
- Fracture mode analysis based on RA and AF
3.4.2. Effect of the MS Replacement Ratio
- Ringing count
- 2.
- Information entropy
- 3.
- Fracture mode analysis based on RA and AF
3.4.3. Effect of Stone Powder Content
- Ringing count
- 2.
- Information entropy
- 3.
- Fracture mode analysis based on RA and AF
4. Conclusions
- (1)
- The compressive strength, stiffness, and elastic modulus of UHPMC are positively correlated with the MS replacement rate and negatively correlated with the water–binder ratio. Additionally, the compressive strength shows an increasing-then-decreasing trend with increasing stone powder content. When the stone powder content is 5%, the compressive strength shows the best performance.
- (2)
- Increasing the MS replacement ratio or reducing the water–binder ratio enhances the flexural strength, stiffness and modulus of elasticity of UHPMC, while increasing the stone powder content initially increases and then decreases the flexural strength of UHPMC. The coefficient of the influence of the MS replacement ratio on the flexural toughness ratio is 0.031, indicating a slightly positive effect.
- (3)
- UHPC specimens with a 100% MS replacement ratio or a 0.16 water–binder ratio exhibit smaller acoustic emission signals during compression and bending processes, indicating delayed crack initiation and fewer cracks. The b-value and entropy fluctuation are more stable. Compared to specimens with a 0% stone powder content, UHPC specimens with a 10% stone powder content show later failure, indicating a stronger resistance.
- (4)
- In the four-point bending test of UHPMC beams, the damage primarily occurs in the form of a tensile–shear mixed failure mode, but tensile failure accounts for more than 70% of the damage. A 0.16 water–binder ratio and a 100% MS replacement ratio can suppress tensile cracks and increase shear cracks. The specimens with 0% and 10% stone powder content have little impact on the crack pattern.
Author Contributions
Funding
Institutional Review Board Statement
Informed Consent Statement
Data Availability Statement
Conflicts of Interest
References
- Larrard, F.D.; Sedran, T. Optimization of ultra-high-performance concrete by the use of a packing model. Cem. Concr. Res. 1994, 24, 997–1009. [Google Scholar] [CrossRef]
- Arora, A.; Almujaddidi, A.; Kianmofrad, F.; Mobasher, B.; Neithalath, N. Material design of economical ultra-high performance concrete (UHPC) and evaluation of their properties. Cem. Concr. Compos. 2019, 104, 103346. [Google Scholar] [CrossRef]
- Yang, R.; Yu, R.; Shui, Z.H.; Guo, C.; Wu, S.; Gao, X.; Peng, S. The physical and chemical impact of manufactured sand as a partial replacement material in Ultra-High Performance Concrete (UHPC). Cem. Concr. Compos. 2019, 99, 203–213. [Google Scholar] [CrossRef]
- Kim, J.E.; Park, W.S.; Yun, S.H.; Kim, D.G.; Noh, J.M. Development of high performance concrete containing admixture in nuclear power plants. Appl. Mech. Mater. 2013, 357–360, 1062–1065. [Google Scholar] [CrossRef]
- Lampropoulos, A.P.; Paschalis, S.A.; Tsioulou, O.T.; Dritsos, S.E. Strengthening of reinforced concrete beams using ultra high performance fiber reinforced concrete (UHPFRC). Eng. Struct. 2016, 106, 370–384. [Google Scholar] [CrossRef]
- Noshiravani, T.; Bruehwiler, E. Experimental investigation on reinforced ultra-high-performance fiber-reinforced concrete composite beams subjected to combined bending and shear. ACI Struct. J. 2013, 110, 251–261. [Google Scholar]
- Liang, T.X.; Zheng, Y.X. Review of Research on Ultra-high Performance concrete. Sci. Technol. 2016, 26, 19–20. [Google Scholar]
- Lyu, X.; Ahmed, T.; Elchalakani, M.; Yang, B.; Youssf, O. Influence of Crumbed Rubber Inclusion on Spalling, Microstructure, and Mechanical Behaviour of UHPC Exposed to Elevated Temperatures. Constr. Build. Mater. 2023, 403, 133174. [Google Scholar] [CrossRef]
- Lyu, X.; Elchalakani, M.; Ahmed, T.; Sadakkathulla, M.A.; Youssf, O. Residual Strength of Steel Fibre Reinforced Rubberised UHPC under Elevated Temperatures. J. Build. Eng. 2023, 76, 107173. [Google Scholar] [CrossRef]
- Zhang, L.; Shan, M.; Xing, C.; Cui, Y.; Wang, P.; Liu, M. Mechanism of Physical Hardening on the Fracture Characteristics of Polymer-Modified Asphalt Binder. Constr. Build. Mater. 2023, 409, 134091. [Google Scholar] [CrossRef]
- Ma, R.; Zhang, L.; Chen, Z.; Miao, C.; Zhang, C.; Fan, T.; Zhang, J.; Qian, X. Utilization of Solid Waste From Tunnel Excavation as Manufactured Sand with Different Lithology and Pre-Washing Process for Preparation of Eco-Friendly Ultra-High Performance Concretes: Properties and Microstructural Analysis. J. Build. Eng. 2024, 82, 108252. [Google Scholar] [CrossRef]
- Elmahdy, H.; Tahwia, A.M.; Elmasoudi, I.; Youssf, O. Mechanical and Thermal Properties of Sustainable Low-Heat High-Performance Concrete. Sustainability 2023, 15, 16139. [Google Scholar] [CrossRef]
- Environment Canada, Health Canada. Screening Assessment for the Challenge. Canada: 2008. Available online: https://www.canada.ca/en/environment-climate-change/services/evaluating-existing-substances/screening-assessment-forchallenge26.html (accessed on 30 April 2024).
- Li, B.; Ke, G.; Zhou, M. Influence of manufactured sand characteristics on strength and abrasion resistance of pavement cement concrete. Constr. Build. Mater. 2011, 25, 3849–3853. [Google Scholar] [CrossRef]
- Joe, M.A.; Rajesh, A.M.; Brightson, P.; Anand, M.P. Experimental Investigation on the Effect of M-Sand in High Performance Concrete. Am. J. Eng. Res. 2013, 12, 46–51. [Google Scholar]
- Mogre, R.P.; Parbat, D.K.; Bajad, S.P. Feasibility of Artificial Sand in Concrete. Int. J. Eng. Res. Technol. 2013, 2, 1606–1610. [Google Scholar]
- Ramos, T.; Matos, A.M.; Schmidt, B.; Rio, J.; Sousa-Coutinho, J. Granitic quarry sludge waste in mortar: Effect on strength and durability. Constr. Build. Mater. 2013, 47, 1001–1009. [Google Scholar] [CrossRef]
- Raja, G.; Ramalingam, M.K. Experimental Study on Partial Replacement of Fine Aggregate by Granite. Int. J. Innov. Res. Sci. Technol. 2016, 2, 202–209. [Google Scholar]
- Shirule, P.A.; Rahman, A.; Gupta, R.D. Partial replacement of cement with marble dust powder. Int. J. Adv. Eng. Res. Stud. 2012, 1, 2241–2249. [Google Scholar]
- Shanmugapriya, T.; Uma, R.N. Optimization of partial replacement of m-sand by natural sand in high performance concrete with silica fume. Int. J. Eng. Sci. Emerg. Technol. 2014, 2, 73–80. [Google Scholar]
- Amudhavalli, N.K.; Sivasankar, S.; Shunmugasundaram, M.; Kumar, A.P. Characteristics of granite dust concrete with M-sand as replacement of fine aggregate composites. Mater. Today Proc. 2020, 27, 1401–1406. [Google Scholar] [CrossRef]
- Zhao, S.; Ding, X.; Zhao, M.; Li, C.; Pei, S. Experimental study on tensile strength development of concrete with manufactured sand. Constr. Build. Mater. 2017, 138, 247–253. [Google Scholar] [CrossRef]
- Shen, W.G.; Liu, Y.; Cao, L.H.; Huo, X.; Yang, Z.; Zhou, C.; He, P.; Lu, Z. Mixing design and microstructure of ultra high strength concrete with manufactured sand. Constr. Build. Mater. 2017, 143, 312–321. [Google Scholar] [CrossRef]
- Chu, H.Y.; Jiang, J.Y. Effect of Eco-friendly Fine Aggregates on Mechanical Properties of Ultra-high Performance Concrete. Mater. Rep. 2020, 34, 5. [Google Scholar]
- Felekoglu, B. Utilisation of high volumes of limestone quarry wastes in concrete industry (self-compacting concrete case). Resour. Conserv. Recycl. 2007, 51, 770–791. [Google Scholar] [CrossRef]
- Trainor, K.J.; Foust, B.W.; Landis, E.N. Measurement of Energy Dissipation Mechanisms in Fracture of Fiber-Reinforced Ultrahigh-Strength Cement-Based Composites. J. Eng. Mech. 2013, 139, 771–779. [Google Scholar] [CrossRef]
- Yoo, D.Y.; Shin, H.O.; Yoon, Y.S. Ultrasonic Monitoring of Setting and Strength Development of Ultra-High-Performance Concrete. Materials 2016, 9, 294. [Google Scholar] [CrossRef]
- Dai, Q.; Ng, K.; Zhou, J.; Kreiger, E.L.; Ahlborn, T.M. Damage investigation of single-edge notched beam tests with normal strength concrete and ultra high performance concrete specimens using acoustic emission techniques. Constr. Build. Mater. 2012, 31, 231–242. [Google Scholar] [CrossRef]
- Wang, M.; Yang, N.J.; Wang, X.G. Research status and development trend of acoustic emission detection technology. In Proceedings of the National Conference on Vibration Theory and Application, Nanjing, China, 1 October 2011. [Google Scholar]
- Abdelrahman, M.; Elbatanouny, M.K.; Ziehl, P.H. Acoustic emission based damage assessment method for prestressed concrete structures: Modified index of damage. Eng. Struct. 2014, 60, 258–264. [Google Scholar] [CrossRef]
- Bai, Y.; Su, H.; Yin, B.; Cai, Y. Mechanical properties and damage mechanisms of concrete under four temperature gradients combined with acoustic emission method. J. Build. Eng. 2022, 10, 104906. [Google Scholar]
- Xu, J.; Chang, F.; Bai, J.; Liu, C. Statistical analysis on the fracture behavior of rubberized steel fiber reinforced recycled aggregate concrete based on acoustic emission. J. Mater. Res. Technol. 2023, 5, 8997–9014. [Google Scholar] [CrossRef]
- Zhang, X.C.; Shan, W.C.; Zhang, Z.W.; Li, B. AE monitoring of reinforced concrete squat wall subjected to cyclic loading with information entropy-based analysis. Eng. Struct. 2018, 6, 359–367. [Google Scholar] [CrossRef]
- Jiao, Y.B.; Zhang, Y.; Guo, M.; Zhang, L.; Ning, H.; Liu, S. Mechanical and fracture properties of ultra-high performance concrete (UHPC) containing waste glass sand as partial replacement material. J. Clean. Prod. 2020, 277, 123501. [Google Scholar] [CrossRef]
- GB/T 50081-2019; Standard for Test Method of Concrete Physical and Mechanical Properties. China Architecture & Building Press: Beijing, China, 2019.
- Fardoun, H.; Saliba, J.; Saiyouri, N. Evolution of acoustic emission activity throughout fine recycled aggregate earth concrete under compressive tests. Theor. Appl. Fract. Mech. 2022, 119, 103365. [Google Scholar] [CrossRef]
- Zhu, D.; Tang, A.; Wan, C.; Zeng, Y.; Wang, Z. Investigation on the flexural toughness evaluation method and surface cracks fractal characteristics of polypropylene fiber reinforced cement-based composites. J. Build. Eng. 2021, 43, 103045. [Google Scholar] [CrossRef]
- Ding, Y.; Yu, K.Q.; Yu, J.T.; Xu, S.L. Structural behaviors of ultra-high performance engineered cementitious composites (UHP-ECC) beams subjected to bending-experimental study. Constr. Build. Mater. 2018, 5, 102–115. [Google Scholar] [CrossRef]
- Yoo, D.; Yoon, Y. Structural Performance of Ultra-High-Performance Concrete Beams with Different Steel Fibers. Eng. Struct. 2015, 102, 409–423. [Google Scholar] [CrossRef]
- Kanamori, H. The energy release of great earthquakes. J. Geophys. Res. 1977, 82, 2981–2987. [Google Scholar] [CrossRef]
- Zhang, Q.; Zhang, X.P. A numerical study on cracking processes in limestone by the b-value analysis of acoustic emissions. Comput. Geotech. 2017, 92, 1–10. [Google Scholar] [CrossRef]
- Bao, T.F.; Peng, Y.; Wang, C.J. Analysis of crack propagation in concrete structures with structural information entropy. Sci. China Technol. Sci. 2010, 53, 1943–1948. [Google Scholar] [CrossRef]
- Ju, S.; Li, D.; Jia, J. Machine-learning-based methods for crack classification using acoustic emission technique. Mech. Syst. Signal Process. 2022, 178, 109253. [Google Scholar] [CrossRef]
- Jiao, Y.; Chen, Y.; Yang, H.; Wang, C. Experimental Characterization on Fracture Behavior of UHPMC under Small-Scale Sample Tensile Testing: Acoustic Emission Monitoring and Digital Image Correlation. Theor. Appl. Fract. Mech. 2024, 130, 104342. [Google Scholar] [CrossRef]


| Index | Unit | MS | QS |
|---|---|---|---|
| Fineness modulus | / | 2.50 | 2.44 |
| SP content | % | 3.2 | - |
| Methylene blue value | MB | 0.5 | - |
| Crushing value index | % | 17.14 | 5.28 |
| Apparent density | kg/m3 | 2799 | 2631 |
| Bulk density | kg/m3 | 1790 | 1730 |
| Voidage | % | 36 | 34 |
| Group | Cement | SF | QS | MS | SP | QP | Steel Fiber | Water | HRWRA |
|---|---|---|---|---|---|---|---|---|---|
| M20-S5-W0.16 | 850 | 195.5 | 748 | 177.65 | 9.35 | 331.5 | 148.75 | 167.28 | 42.5 |
| M20-S5-W0.2 | 850 | 195.5 | 748 | 177.65 | 9.35 | 331.5 | 148.75 | 209.1 | 42.5 |
| M20-S0-W0.18 | 850 | 195.5 | 748 | 187 | - | 331.5 | 148.75 | 188.19 | 42.5 |
| M20-S10-W0.18 | 850 | 195.5 | 748 | 168.3 | 18.7 | 331.5 | 148.75 | 188.19 | 42.5 |
| M60-S5-W0.18 | 850 | 195.5 | 374 | 532.95 | 28.05 | 331.5 | 148.75 | 188.19 | 42.5 |
| M60-S5-W0.18 | 850 | 195.5 | 374 | 532.95 | 28.05 | 331.5 | 148.75 | 188.19 | 42.5 |
| M60-S10-W0.2 | 850 | 195.5 | 374 | 504.9 | 56.1 | 331.5 | 148.75 | 209.1 | 42.5 |
| M60-S0-W0.16 | 850 | 195.5 | 374 | 561 | - | 331.5 | 148.75 | 167.28 | 42.5 |
| M60-S0-W0.2 | 850 | 195.5 | 374 | 561 | - | 331.5 | 148.75 | 209.1 | 42.5 |
| M60-S10-W0.16 | 850 | 195.5 | 374 | 504.9 | 56.1 | 331.5 | 148.75 | 167.28 | 42.5 |
| M60-S5-W0.18 | 850 | 195.5 | 374 | 532.95 | 28.05 | 331.5 | 148.75 | 188.19 | 42.5 |
| M60-S5-W0.18 | 850 | 195.5 | 374 | 532.95 | 28.05 | 331.5 | 148.75 | 188.19 | 42.5 |
| M60-S5-W0.18 | 850 | 195.5 | 374 | 532.95 | 28.05 | 331.5 | 148.75 | 188.19 | 42.5 |
| M100-S5-W0.16 | 850 | 195.5 | - | 888.25 | 46.75 | 331.5 | 148.75 | 167.28 | 42.5 |
| M100-S5-W0.2 | 850 | 195.5 | - | 888.25 | 46.75 | 331.5 | 148.75 | 209.1 | 42.5 |
| M100-S0-W0.18 | 850 | 195.5 | - | 935 | - | 331.5 | 148.75 | 188.19 | 42.5 |
| M100-S10-W0.18 | 850 | 195.5 | - | 841.5 | 93.5 | 331.5 | 148.75 | 188.19 | 42.5 |
| Water–Binder Ratio | Stone Powder Content (%) | MS Replacement Ratio (%) | Compressive Strength (MPa) | Flexural Strength (MPa) | Flexural Toughness Ratio | Confidence |
|---|---|---|---|---|---|---|
| 0.162 | 5.05 | 100 | 137.221 | 14.505 | 0.436 | 95% |
| Factor | Group | Level | Yield Displacement | Limit Displacement | Displacement Ductility Ratio |
|---|---|---|---|---|---|
| Water–binder ratio | M20-S5-W0.16 | 0.16 | 1.586 | 5.019 | 3.164 |
| M20-S5-W0.2 | 0.2 | 2.059 | 5.658 | 2.748 | |
| M60-S0-W0.16 | 0.16 | 1.333 | 5.504 | 4.128 | |
| M60-S0-W0.2 | 0.2 | 1.397 | 4.608 | 3.297 | |
| M100-S5-W0.16 | 0.16 | 1.598 | 6.608 | 4.136 | |
| M100-S5-W0.2 | 0.2 | 1.812 | 5.74 | 3.168 | |
| MS replacement ratio | M20-S5-W0.16 | 20% | 1.586 | 5.019 | 3.164 |
| M100-S5-W0.16 | 100% | 1.598 | 6.608 | 4.136 | |
| M20-S5-W0.2 | 20% | 2.059 | 5.658 | 2.748 | |
| M100-S5-W0.2 | 100% | 1.812 | 5.74 | 3.168 | |
| M20-S0-W0.18 | 20% | 1.549 | 4.478 | 2.891 | |
| M100-S0-W0.18 | 100% | 1.217 | 4.79 | 3.936 | |
| Stone powder content | M20-S0-W0.18 | 0% | 1.549 | 4.478 | 2.891 |
| M20-S10-W0.18 | 10% | 1.617 | 4.169 | 2.578 | |
| M60-S0-W0.16 | 0% | 1.333 | 5.504 | 4.128 | |
| M60-S10-W0.16 | 10% | 1.809 | 4.615 | 2.551 | |
| M100-S0-W0.18 | 0% | 1.217 | 4.79 | 3.936 | |
| M100-S10-W0.18 | 10% | 2.958 | 5.549 | 1.876 |
Disclaimer/Publisher’s Note: The statements, opinions and data contained in all publications are solely those of the individual author(s) and contributor(s) and not of MDPI and/or the editor(s). MDPI and/or the editor(s) disclaim responsibility for any injury to people or property resulting from any ideas, methods, instructions or products referred to in the content. |
© 2024 by the authors. Licensee MDPI, Basel, Switzerland. This article is an open access article distributed under the terms and conditions of the Creative Commons Attribution (CC BY) license (https://creativecommons.org/licenses/by/4.0/).
Share and Cite
Chen, R.; Jiao, Y.; Xiao, M.; Yang, H.; Wang, C. Effect of Composition Characteristics on Mechanical Properties of UHPMC Based on Response Surface Methodology and Acoustic Emission Monitoring. Materials 2024, 17, 2714. https://doi.org/10.3390/ma17112714
Chen R, Jiao Y, Xiao M, Yang H, Wang C. Effect of Composition Characteristics on Mechanical Properties of UHPMC Based on Response Surface Methodology and Acoustic Emission Monitoring. Materials. 2024; 17(11):2714. https://doi.org/10.3390/ma17112714
Chicago/Turabian StyleChen, Ranran, Yubo Jiao, Mingqi Xiao, Hua Yang, and Caiqin Wang. 2024. "Effect of Composition Characteristics on Mechanical Properties of UHPMC Based on Response Surface Methodology and Acoustic Emission Monitoring" Materials 17, no. 11: 2714. https://doi.org/10.3390/ma17112714