Abstract
Current research studies devoted to cutting forces in drilling are oriented toward predictive model development, however, in the case of mechanistic models, the material effect on the drilling process itself is mostly not considered. This research study aims to experimentally analyze how the machined material affects the feed force (Ff) during drilling, alongside developing predictive mathematical–statistical models to understand the main effects and interactions of the considered technological and tool factors on Ff. By conducting experiments involving six factors (feed, cutting speed, drill diameter, point angle, lip relief angle, and helix angle) at five levels, the drilling process of stainless steel AISI1045 and case-hardened steel 16MnCr5 is executed to validate the numerical accuracy of the established prediction models (AdjR = 99.600% for C45 and AdjR = 97.912% for 16MnCr5). The statistical evaluation (ANOVA, RSM, and Lack of Fit) of the data proves that the drilled material affects the Ff value at the level of 17.600% (p < 0.000). The effect of feed represents 44.867% in C45 and 34.087% in 16MnCr5; the cutting speed is significant when machining C45 steel only (9.109%). When machining 16MnCr5 compared to C45 steel, the influence of the point angle (lip relief angle) is lower by 49.198% (by 22.509%). The effect of the helix angle is 163.060% higher when machining 16MnCr5.
1. Introduction
The machining industry is constantly driven to increase productivity, optimize quality, and minimize the costs of the machining process [1,2,3,4]. To achieve these ends, it is necessary to have important knowledge of each machining technology, realize the research and development in the field of machine–tool–workpiece–fixture systems, and subsequently, implement the obtained knowledge into production [5,6]. Drilling is considered to be one of the most time-consuming operations, and it is estimated that up to 36% of all machine time is spent on holes’ production [7,8]. It is necessary to use high-throughput drilling tools to decrease the costs of drilling operations and significantly decrease the machining time [8], knowing that the magnitude of the tool force load and torque plays a key role when designing them [8,9,10]. Two approaches are used to determine the force load on the drilling tool: either direct measurement of the force load [11,12,13] or substitution into a mathematical model. Based on the classification provided by Song et al. in [14], models of cutting forces can be divided into four categories. Specifically: (i) macro-mechanical models based on the machining theory; (ii) mechanistic models which reflect the relationship between the cutting force, feed, cutting speed, tool geometry, and so on; (iii) micro-mechanical models describing the physical nature of machining; and (iv) numerical models developed by using the finite elements method (FEM) and discrete element method (DEM) to simulate the machining process.
A macro-mechanical model was used by Priyanka et al. [15], where the formulas for calculation of feed force and torque were compiled (based on experiments with the drill diameter and cut depth as independent variables). The direct impact of the feed size on the feed force was demonstrated in [11,16,17]. In some cases, with an increasing cutting speed, the cutting force and torque increase, applying, e.g., deep hole drilling [18]. It is possible to influence the size of cutting forces by other parameters such as the process environment or the geometry of the tool. The team of Rodriguez et al. performed an experiment varying the point angle and cooling conditions [19]. Cutting force and torque increase with an increasing point angle of the drilling tool.
Mechanistic models were designed by Parsian et al. [20] for torque, axis force (feed force), and cutting force in the plane perpendicular to the drilling axis. Anand et al. in [21], established a mechanistic model of cutting force effects during micro-drilling. A mechanistic model devoted to transient states was designed by Arif et al. [22] based on an analysis of the chip formation and local cutting forces along the main cutting edge. It is necessary to reach a relatively huge number of orthogonal tests to design equations for cutting forces and related specific cutting pressures, as Hamade et al. [23] reports. It is necessary to take into an account a wide range of cutting speeds, feeds, and rake angles. The studies [24,25,26,27,28,29] can be included in the field of micro-mechanical model application. FEM is an increasingly popular method to predict the impact of cutting conditions on machining performance [30]. This method has some issues nevertheless (e.g., the numerical implementation of major configuration changes) [31]. Material costs and maximizing productivity are the main benefits of FE analysis, and due to this, it is the target of many studies. Two-dimensional and three-dimensional FE models are designed to predict cutting forces [32,33,34,35,36]; the temperature of the tool and workpiece [30,32,33,34]; the shape of an emerging chip [37]; and residual stresses, etc.
A review of related works reveals weaknesses in terms of limitations in the application of the proposed models in many research and practice situations. Current studies of the cutting forces acting during drilling are mainly targeted toward predictive model development, but in the case of mechanistic models, mostly without taking into account the effect of the machined material on the drilling process. The microstructure of the machined material (carbon steels C05, C45, and C75) was studied in [37] while developing a 3D finite element computation model. The authors performed micro-drilling tests (with drills of different diameters) for the model verification regarding chip formation, torque, and feed force. Stainless steels are attractive materials due to their various applications, but high cutting forces and rapid tool wear occur during their machining/drilling. Therefore, many researchers are interested in the prediction and optimization of steel drilling parameters. For example, Ahmed et al. [38] used linear regression analysis to create empirical models predicting the responses (tool life, cutting force, and specific cutting energy) in relation to the defined control variables (the tool material, cutting speed, and feed rate) during the drilling of AISI 304 and AISI 2205. As stated in [39], the modeling of drilling (not only steel) is accompanied by various difficulties (changing conditions of the contact of the tool with the material) and requires considerable computing time, therefore, the development of techniques in mathematical modeling and simulation represents new research trends in this area [40]. Storchak et al. [39] dealt with the numerical modelling of drilling short holes in AISI 1045 material, and FEM and DOE were applied. Size effects during the micro drilling of carbon steel C45 are predicted by a 3D multiphase FE model in [41], and incremental hole drilling (AISI 1045 and CFRP) is modelled by FEM in [42]. In addition to these studies, the Deform 3D software is frequently used to simulate drilling operations in the literature [43,44,45], e.g., in [41], carbon steel AISI 1050 (DIN 1.1210) is the experimental material for the FE simulation of the drilling process, and drill stresses are analyzed by the Deform-3D. Artificial intelligence, multi-objective, and hybrid optimization of the drilling of AISI 1045 steel occur in the literature [46,47]. The examination of thrust force and torque remains a key issue in drilling processes [48]. Experiments devoted to the machining of the material 16MnCr5 (case-hardened steel) were carried out by Molnar [49] in order to achieve the selection of the most favorable cutting parameters based on the DOE, correlation analysis, and relative deviation analysis. The study [50] examined the fretting and plain fatigue behavior of case-hardened steel 16MnCr5, which is comparable to AISI 5115, as reported in [51].
Providing an adequate combination of experimental, numerical, and analytical approaches to modeling the drilling process is the object of this article. The main aim of the study is, therefore, to experimentally analyze the influence of machined material on changes in the value of the feed component of the cutting force Ff (feed or thrust force) during drilling operation, with consideration of the influence mechanism of the chosen basic technological (fn and vc) and tool (D, εr, αo, and ωr) factors on the monitored response (Ff). We are interested in the statistically significant main effects and interactions of the chosen input variables. Based on the fact that machining processes are stochastic, the secondary aim of the study is to design a mathematical–statistical computational model providing a prediction of the influence of the technological and tool parameters on changes in the value of the feed component of the cutting force when drilling two different materials, C45 (EN 1.0503 and AISI 1045) and 16MnCr5 (C10E and EN 10132-2). The next aim is the subsequent implementation of experimental verification of the developed models.
2. Theoretical Backgrounds
The authors of this study deal with the analysis of a drilling process with a helical (also called spiral or twist) drill, as shown in Figure 1.

Figure 1.
The standard nomenclature of a helical drill (1—axis, 2—shank or clamping part (conical, smooth cylindrical, or smooth cylindrical with a driver), 3—tang, 4—driver, 5—the drill body, 6—neck, 7—total length, 8—helix length of the groove, 9—groove, 10—body clearance surface, 11—the width of body clearance surface, 12—web (core), 13—web diameter, 14—margin, 15—margin width, 16—side cutting edge, 17—land relief, 18—land relief depth, 19—heel, 20—flank, 21—face, 22—main cutting edge, 23—wedge, 24—drill tip, 25—chisel, 26—chisel edge length, 27—main cutting edge length, 28—nominal tool diameter, 29—diameter of the relief, 30—reverse taper, 31—helix pitch, 32—helix angle, 33—chisel edge angle, 34—point angle, and 35—lip relief angle).
The geometric shape of the cutting part of the drilling tool influences the cutting process. The shape of the cutting edge (the lip) has an impact on the magnitude of the cutting forces, quality of the machined area, geometric accuracy, and tool wear [52,53,54]. The cutting force is decomposed for each cutting edge into three basic values influencing the tangential (cutting force Fc), radial (passive force Fp), and axial directions (feed force Ff). The following relations are known: Ff = Ff1 + Ff2; Fp = Fp1 + Fp2; Fc = Fc1 + Fc2; where Ff is the feed component of the cutting force [N], Fp is the passive component of the cutting force [N] and Fc is the main component of the cutting force [N]. Their size depends on many factors such as the workpiece material, cutting depth, feed, and cutting tool geometry. The parameters affecting the cutting forces’ magnitude are the material characteristics of the workpiece; the parameters of the cutting process, i.e., the cutting conditions; and the geometric parameters of a helical drill. The magnitude of the cutting forces is influenced by the machined material, specifically, by its physical properties. The cutting process is evaluated according to the cutting environment (dry machining or when using cooling, etc.), further, according to the toughness of the whole assembly machine–tool–workpiece and to the cutting conditions (feed and cutting force). The tool angles represent geometric parameters [52,53]: side flank tool angle or lip clearance angle αo; tool tip angle or point angle εr; main cutting edge tool angle κr; helix pitch tool angle ωr; and side rake tool angle or chisel edge angle λs [54,55,56]. The experimentally obtained Equation (1) is the most used formula for the cutting force Fc determination [4]. In (1), the three most important factors are involved (in terms of the resulting effect), namely, the machined material, nominal diameter of the tool, and spindle feed rate.
where CFc is a constant proportional to the influence of the machined material [MPa], xFc is a constant appropriate to the drill diameter [–], yFc is a constant expressing the influence of the spindle feed rate [–], D is the nominal diameter of the drilling tool [mm], and fot is the feed per revolution [mm·rev−1]. Similarly, it is possible to calculate the feed force by Equation (2):
the meaning of CFf, xFf, yFf, D, and fot is analogously the same as mentioned above for Equation (2). The specific values of these constants are listed in Table 1.

Table 1.
Coefficient values used for cutting forces calculating.
3. Materials and Methods
3.1. Materials
Two types of material were used within the experimental part, i.e., unalloyed stainless steel for further refinement labelled as C45 (EN 1.0503 and AISI 1045) [57] and case hardening steel 16MnCr5 (1.7131, C10E, and EN 10 132-2) [58]. The C45 steel is suitable for the production of less-stressed machine parts in the refined state or after normalization annealing. The optimal mechanic values, including stiffness, are reached in a quenched and subsequently tempered state. C45 steel is suitable for surface quenching under blaze or induction, and oil quenching is preferred to prevent cracks for parts with a more complex shape. From the machining point of view (machinability), C45 is etalon steel with the machinability class 14b (or 13b). The specific chemical composition of the mechanic properties of the C45 steel is listed in Table 2.
Table 2.
Chemical composition and mechanical properties of the drilled steel C45.
The practical experimental verification of the chemical composition and mechanical properties of the used C45 samples confirmed the hardness values of HV10C45 = 221.500 ± 3.023 and the UTS of Rm,C45 = 740.500 ± 1.447 MPa. As seen in Figure 2, the used material manifested a ferritic–pearlitic structure with the ferrite proportion of 17.489 ± 1.290%.

Figure 2.
Microstructure of the used C45 steel samples.
A low alloy steel 16MnCr5 (also labelled as C10E, 1.7131, and EN 10 132-2) was the second experimental material, representing case-hardening steels [59] suitable for cementation. 16MnCr5 is widely used for moderately stressed machine parts and automobile components (gears and shafts, etc.) thanks to its mechanical properties [60]. The implementation of quenching and tempering appropriates its usage for components with a diameter of up to 35 mm max. It is suitable for welding and also for cold forming when suitably heat treated. Boron additive (0.0008 to 0.0050%) allows for increasing the toughness of the case-hardened layer. Within this study, the 16MnCr5 steel was used in the form of a round bar with a diameter of 120 mm, and its specific chemical composition and mechanical properties, determined experimentally, are listed in Table 3.
Table 3.
Chemical composition and mechanical properties of the drilled material 16MnCr5 (1.7131).
The experimental verification of the chemical composition and mechanical properties of the used 16MnCr5 samples confirmed the hardness values of HV1016MnCr5 = 175.667 ± 2.267 and the ultimate tensile strength (UTS) of Rm,16MnCr5 = 549.167 ± 10.894 MPa. As shown in Figure 3, the used material samples demonstrated a ferritic–pearlitic structure with ferrite proportion shares of 53.212 ± 1.975%.

Figure 3.
Microstructure of the used steel 16MnCr5.
3.2. Technological Parameters—Machine, Tool, Workpiece
The considered technological parameters were set as constant factors regarding the concept (principle) of the performed experiment. Namely: machine—DMU eVo40 linear (DMG, Bielefeld, Germany) (Figure 4a); workpiece (stock)—Ø 118 × 30 mm—ground; tool fixture—hydro plastic fixture with exchangeable housing for tools of diameters ranging from 8 to 12 mm; dynamometer (workpiece clamping)—dynamometer Kistler 9272 (Kistler, Winterthur, Switzerland), with the workpiece clamped to the landing surfaces of the dynamometer by screws with a conical head (Figure 4b).
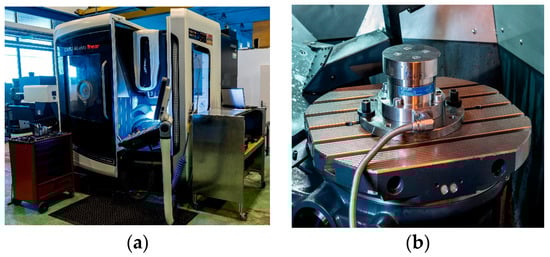
Figure 4.
Photographs from experimental verification. (a) Machine and (b) workpiece clamped on the dynamometer.
When setting the helical drill parameters as controlled factors, we focused on the macro geometry of the drilling tool. Micro geometric and surface parameters were set as constant factors. In the case of geometric factors, their independence is a critical condition, therefore, the input variables were divided into controlled (monitored) and constant factors (listed in Table 4). In terms of the aforementioned, the controlled factors were: D—nominal drill diameter [mm], ranging within the interval [8; 12]; αo—lip clearance angle in orthogonal plane [°], varying within the interval [8; 12]; ωr—helix angle in the basic plane [°], ranging within the interval [25; 35]; and εr—point angle [°] within the interval [130; 145].
Table 4.
An overview of values of constant tool factors.
The drill tools were specially manufactured by the Regional Technological Institute (RTI), University of West Bohemia. The oil emulsion BLASOCUT BC 35 KOMBI from Blaser Swisslube CZ was used as the process liquid. The concentration was set to 6.9%, which corresponds to the manufacturer’s recommended range (from 6% to 8%). The used drilling tools were made from the CTS20D (Ceratizit, Garbsen, Germany) material coated by Triple Cr SHM with a slightly convex shape of the cutting edge.
3.3. Experimental Set Up
Taking into account that machining processes are multi-factor stochastic systems, where input factors affect changes in the investigated response not only as main effects, but also in interactions, the use of Design of Experiments (DOE) methodology is a natural and logical solution. This methodology, representative of a scientifically justifiable method of experimentation, provides a number of advantages [61]. For example, obtaining the maximum amount of information with the minimum number of performed experiments, the high numerical and statistical correctness of its obtained conclusions, and cost and time savings required for the implementation of experimental activities [61,62]. The statistical approach application is an appropriate solution when considering the stochastic nature of both the technological process (drilling) and the evaluated response (feed force).
A central composite design based on fractional replicates [62] was applied as a basic experiment design with the consideration of 6 input factors (4 tool factors and 2 technological factors). The resulting required number of measurements for one block was 46 (32 cube points, 2 central points, and 12 star points). When using central points, it is possible to verify whether the tests/measurements are performed correctly, i.e., whether there is no error during the actual measurement (e.g., due to the operation of the machine or measuring device). Each test (design point) is repeated six times to maximize the statistical value of the corresponding statement. This means that, for one combination of observed factors, we obtain six values for each dependent variable. The needed quantity of experimental tools follows from the compiled designed of the experiment. According to a combination of observed geometrical factors, 25 pieces are needed. In total, 2 pieces will be produced in each variant, so this means 50 pieces in total. There are 276 holes in total needed to drill for one bloc when using 25 different geometrically varying tools based on the above mentioned. It is also necessary to determine the appropriate number of stocks and the used pattern of the drilled holes to avoid an inappropriate influence of each measurement. The minimum wall thickness between each hole is set to 5 mm based on previous experience from experimental measurements of cutting forces during drilling operation. When targeting the size, 9 pieces of stock from each material are needed. One of them is prepared as a compensator when an operator error or measuring device failure occur. Table 5 reports the basic setting of the levels of individual factors.
Table 5.
Setting of the levels of input factors according to the DOE.
3.4. Processing of Experimentally Obtained Data
When performing individual experimental runs in accordance with the applied central composite design, the estimatation of the observed dependent variable (Ff within this study) is generally described by a model in the form (3):
where b0, bj, buj, and bjj are appropriate regression coefficients and xj is an appropriate independent variable factor. Within our study, model (3) is used as the starting point of the second experimental step (DoE) and is aimed to predict the observed response y (Ff) based on the changes in individual variables xi (the cutting speed, feed, cutting depth, and angle of the main cutting edge). The used general model (3) was subjected to statistical analysis: Analysis of Variance (ANOVA) and a Lack of Fit [61]. The ANOVA of the observed parameter y (Ff) represents a statistical analysis of the suitability of the used general model (3). On the one hand, ANOVA enables analyzing whether the variability caused by random errors is significantly smaller than the variability of the measured values explained by the model. On the other hand, it allows for testing the null statistical hypothesis, which states that none of the effects used in the model (D, fn, vc, εr, αo, and ωr) have a significant effect on changes in the investigated/measured variable y (Ff).
The Lack of Fit test is the second step during the analysis procedure of the suitability of the used general prediction model (3). For each xi factor setting (the level of each i-th factor), a group of experimentally obtained values is measured. Measurements within groups have some variability. The residuum variability is approximately similar to the variability within groups, if the regression model adequately describes (fits) the investigated dependence of y on xi. Thus, by comparing the variance of residuals and the variance within the groups, it can be determined whether the regression model adequately describes the dependence of y on xi. The excess variance of residuum in an improperly fitted model is called the Lack of Fit error. The experimentally obtained results (measured data) were subjected to the statistical analysis, methods, and procedures, due to the fact that a statistically designed experiment was applied in our performed experimental research. Moreover, the observed response (feed force Ff) represents the measured value and can be understood as a random variable. It is burdened with gross, systematic, or random error, and the processing of the measured data in a non-statistical way would create the assumption of drawing erroneous conclusions and erroneous interpretations.
4. Results and Discussion
4.1. Regression Model of Feed Force for Drilled Steel C45 and Results of Statistical Analysis
The basic statistical analysis of the used general model (3) to predict the value of Ff (the observed response), depending on the changes in the values of the investigated (input and controlled) factors (D, fn, vc, εr, αo, and ωr) for drilled steel C45, is presented in Table 6 (ANOVA) and Table 7 (Lack of Fit). As part of the analysis, there is a conclusion that this model explains 99.600% of the measured feed forces’ Ff (response) variability based on the achieved value of the adjusted index of determination (Radj). The average value of the feed component of the cutting force Ff is 912.191 N, and the average error of the model is 18.711 N.
Table 6.
ANOVA of the prediction model of feed force Ff for drilled material C45.
Table 7.
Lack of Fit of the model of Ff for the material C45.
The obtained results listed in Table 6 and the achieved significance level of p < 0.0001 enable us to proclaim that the variability caused by random errors is less than the variability of the values explained by the model, and, thus, at least one regression coefficient, significantly different from zero, exists within the model. So, regarding the Fisher–Snedecor test criterion and based on the aforementioned, the feed force prediction model for the C45 experimental material can be considered as adequate.
The Lack of Fit test (Table 7) is the second step when evaluating the regression model’s suitability. It is based on the zero statistical hypothesis stating that the residual variance is smaller or equal to the variance within groups. Based on the reached significance level of the model’s Lack of Fit test (p = 0.3935), it is possible to accept the zero hypothesis at the significance level of α = 0.05 and conclude that the used model sufficiently describes (fits) the monitored relationship.
After verifying the second component of the regression triplet, the model, the regression parameters of the model (3) can be correctly estimated (statistically and numerically). Table 8 lists only statistically significant regression coefficients (at the significance level of α = 0.05) which, in a significant manner, influence changes in the observed response Ff.
Table 8.
Estimation of regression coefficients of the model of Ff for the C45 steel.
To accurately predict the response (the value of the feed component of the cutting force—Ff for the drilled material C45) and capture interactions between the explanatory variables considered within this study, the experimentally obtained data were fitted to a multivariate non-linear regression model (MNRm) expressed by the response function based upon a response surface methodology. Our previous analyses led us to the assumed general model (3). Several variants of its form have been analyzed within the very selection of a specific form (4) of the regression model. When developing such a model (MNRm), the key task is to identify which subset of the k input variables is required to provide the best fit of the dependent variable. Table 8 provides an estimation of individual regression coefficients (in Estimate column), including the testing of their significance and VIF estimation. These coefficients are listed in the coded unit here (so unscaled), but they refer to the original measurement scale presented in Table 5.
Based on Table 8, the absolute term of the regression model, i.e., Intercept (b0), is the most significant parameter of the regression model of the Ff for the C45 material. Its influence on the change in the value of the observed response Ff is at the level of 49.148%. This parameter b0 includes all effects that might have a significant influence on changes in the value of Ff, but they were not considered as explanatory variables and were set as constant factors within the performed experiment (see Table 4).
Let us evaluate the impact of the explanatory variables (according to Table 5) as the main effects, that is, without taking into account the Intercept (b0). Then, the most significant predictor is factor x2 (fn), with a 44.867% influence on the changing values of the feed force Ff. Factor x1 (D) is the second significant predictor as the main effect with an influence share of 12.183% on Ff. The next main effect demonstrates x3 (vc), with an influence share of 9.109% on the observed response. From the point of view of tool factors, D, εr, αo, and ωr (according to Table 5), the most significant impact on changes in the Ff value shows the factor x4 (εr), with a share of 8.625%. The tool factor x6 (ωr) manifests an influence of 7.905%, followed by x5 (αo) with a 2.474% influence.
Based on Table 8, it is obvious that mutual interactions of the observed factors also have a significant impact on changes in the Ff value. The feed (fn), as the most significant main effect, also influences the Ff in interaction with the nominal diameter of the drill D (3.432%), with the point angle εr (3.650%), with the lip clearance angle αo (2.237%), and with the helix angle ωr (1.832%), and in mutual interaction with the point angle εr and helix angle ωr (1.200%). The next significant interaction (p = 0.0076) with a significant impact on the feed force Ff, is a combination of the point angle εr with the clearance angle αo (1.325%), and also the squared value of the cutting speed vc (with an impact of 1.162% on the value changes of Ff).
In regard to the condition of the orthogonality of the experiment design, the analysis is performed with coded and dimensionless forms of the input variables (x1, x2, …, x6). To develop the regression model of the dependence of the feed force Ff on the input factors (D, fn, vc, εr, αo, and ωr) and express them in their natural scales, the DOE transformation was used [61]. Based on the estimation of regression coefficients, the application of DOE transformation, and subsequent modification, the prediction model of the feed component of the cutting force Ff for the drilled material C45 can be written by Formula (4) as follows:
The analysis of residuals as the third component of the regression triplet is the last part of testing the correctness of the regression model MNRm (4). Based on the Shapiro–Wilks normality test (p = 0.447), the residuals show a Gaussian normal distribution with an average value of −1.740 × 10⁻¹¹ N. Therefore, the developed mathematical–statistical model (4), describing the dependence of the observed parameter Ff on the defined tool and technological factors (D, fn, vc, εr, αo, and ωr), can be considered as the correct one, and, therefore, numerically and statistically appropriate. Regarding the aforementioned, it is possible to proclaim appropriate conclusions within the used intervals of the input factors.
The developed regression model (4) allows us to plot the influences of the selected technological and tool factors on the response (Ff), as shown subsequently in the next three figures (Figure 5, Figure 6 and Figure 7). Figure 5 demonstrates the feed (fn) impact on the feed force value (Ff) when simultaneously varying the cutting speed (vc) for the used drill with diameters of D = 8 mm (Figure 5a) and D = 12 mm (Figure 5b) at constant values of εr = 137.50°, αo = 10.00°, and ωr = 30.00°.
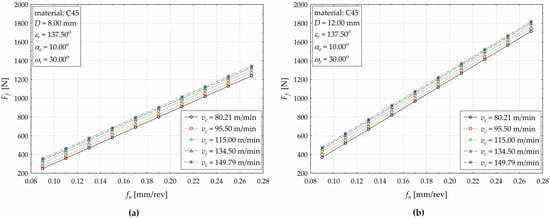
Figure 5.
The impact of feed fn and cutting speed vc on the change in the value of the feed force Ff (response) for the drilled material C45. (a) D = 8 mm and (b) D = 12 mm.
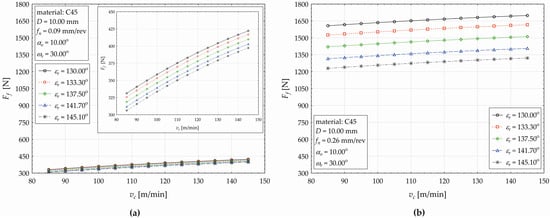
Figure 6.
The effect of the cutting speed (vc) and the point angle (εr) on the change in the value of response Ff for the drilled material C45 when setting (a) fn = 0.09 mm·rev−1 and (b) fn = 0.26 mm·rev−1.
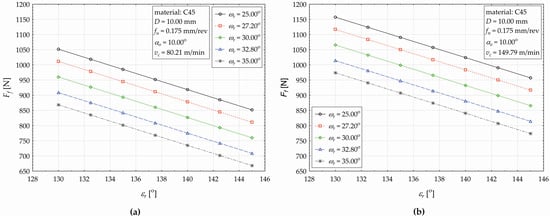
Figure 7.
The effect of the point angle (εr) and the helix angle (ωr) on the changes in the feed force (Ff) values for the drilled material C45 when setting (a) vc = 80.21 m·min−1 and (b) vc = 149.79 m·min−1.
As shown in Figure 5, the value of response Ff conditionally increases with an increasing feed (fn), and also increasing the cutting speed (vc) causes an increase in the values of Ff, but the impact of vc is less pronounced (compared to the fn effect). When increasing the cutting speed from vc = 80.21 m·min−1 to vc = 95.50 m·min−1, the Ff value increases by 28.98 N (it represents an increase by 11.628% for the drill with D = 8 mm in relative terms). When increasing the cutting speed (vc) from 95.50 m·min−1 to 115.00 m·min−1, the value of Ff increases by 32.23 N (11.585%). When increasing vc from 115.00 m·min−1 to 134.50 m·min−1, the value of Ff increases by 26.93 N (8.675%). When increasing the cutting speed from 134.50 m·min−1 to 149.79 m·min−1, the value of Ff increases by 17.41 N (5.159%). Therefore, it can be generalized that, for a drill of D = 8 mm (D = 12 mm), an increase in cutting speed vc by 1 m·min−1 will cause an average increase in the feed force Ff by 0.609% (0.411%), respectively. For a drill with a nominal diameter of D = 12 mm, the absolute value of the difference between the individual cutting speed levels is the same, but in relative terms, due to the higher value of Ff, this difference is significantly lower. It fluctuates from 7.846% (when increasing vc from 95.50 m·min−1 to 115.00 m·min−1) to 3.804% (increase in vc from 134.50 m·min−1 to 149.79 m·min−1). A more significant difference in response (Ff) values can be observed when simultaneously changing the drill diameter and increasing the feed. When setting the factor values at vc = 80.21 m·min−1 and fn = 0.09 mm·rev−1, the feed force value increases from 249.25 N (for a drill diameter of D = 8 mm) to 369.42 N (D = 12 mm). This increase by 120.18 N represents a relative difference of 48.217%. When setting the factor values at vc = 80.21 m·min−1 and fn = 0.11 mm·rev−1, the value of Ff increases from 359.08 N (D = 8 mm) to 518.69 N (D = 12 mm), and the difference decreases to the level of 44.453%. When gradually increasing the feed fn, the difference value of Ff between the used drill with D = 8 mm and D = 12 mm decreases (from 42.452% at fn = 0.13 mm·rev−1 to 38.389% at fn = 0.27 mm·rev−1). When setting the factor values at vc = 95.50 m·min−1 and fn = 0.09 mm·rev−1, the Ff value increases from 278.23 N (D = 8 mm) to 398.41 N (D = 12 mm), which represents increase by 43.194% in relative terms. Next, increasing the cutting speed to 115.00 m·min−1 causes an increase in the feed force of 38.709%, increasing to 134.50 m·min−1 causes an increase of 35.619%, and increasing vc to 149.79 m·min−1 causes an increase in the Ff value (for the drill with D = 12 mm) of 33.872%.
The effect of the cutting speed (vc) on the change in the feed force value (Ff) when using five different levels of the point angle (εr) is shown in Figure 6a for fn = 0.09 mm·rev−1 and in Figure 6b for fn = 0.26 mm·rev−1.
In general, based on the curves presented in Figure 6, it is possible to conclude for the drilled steel C45 that the response value (Ff) conditionally increases with an increasing cutting speed (vc), and in addition, at higher values of the point angle εr, the feed force values are higher. Of course, we can see differences in the course of the plotted functions for different feed settings, as at fn = 0.09 mm·rev−1 (Figure 6a), the non-linear change in the feed force Ff is more pronounced than that at fn = 0.26 mm·rev−1 (Figure 6b). Let us evaluate the dependence of Ff on the changing cutting speed vc for each setting of the point angle εr. When setting εr = 130.00°, the Ff values are the highest and the relative increase in Ff with an increasing cutting speed vc has a decreasing tendency. Specifically, during the drilling of C45 steel, if we increase vc by 5.00 m·min−1, starting from 85.00 m·min−1 and then vc ∈ {90, 95, …, 145}, the Ff acquires corresponding values starting from 331.187 N and then Ff ∈ {340.690, 349.844, …}, and the relative increase in the value of Ff gradually reaches values from the set {2.869%, 2.687%, …, 1.361%}. Therefore, when the cutting speed vc is increasing, the conditional relative increase in the value of the feed component of the cutting force (Ff) is not linear, it has a decreasing tendency. The average increase in Ff represents 2.045%, and the application of model (4) makes it possible to conclude that, when increasing vc by 1.00 m·min−1, the value of Ff increases by 0.034%. For εr = 130.00°, the relative changes (increases) in the Ff values with an increasing cutting speed vc fluctuate from 2.917% (vc = 90.00 m·min−1) to 1.379% (vc = 45.00 m·min−1). The average increase in the Ff values represents 2.076%. As the value of the point angle εr increases, the average increase in the feed force Ff also increases, depending on the change in the cutting speed, namely by 2.116% (εr = 137.50°), by 2.159% (εr = 141.70°), and by 2.194% (εr = 145.10°). Let us analyze the plotted functions in Figure 6a in the horizontal direction, i.e., for the chosen value of cutting force vc, let us analyze the changes in Ff when changing the point angle in a basic plane. When setting vc = 85.00 m·min−1 and simultaneously varying the point angle εr within the values set {130.00°, 133.30°, 137.50°, 141.70°, 145.10°}, the relative decrease in the value of Ff gradually acquires corresponding values from the set {1.650%, 2.136%, 2.182%, 1.806%}. For example, it stands that an increase in the point angle from εr = 133.30° to the level of εr = 137.50° causes a relative decrease in the feed force Ff by 2.136%. For example, at vc = 90.00 m·min−1, the relative decrease in the value of Ff is by 1.604% (εr = 133.30°) and 1.725% (εr = 145.10°), while the maximum value decrease is by 2.119% for εr = 141.70°. The average relative decrease in Ff conditionally depends on the varying point angle εr ranges from 1.944% (vc = 85.00 m·min−1) to 1.515% (vc = 145.00 m·min−1).
The same principle was applied for the feed fn = 0.26 mm·rev−1 (Figure 6b), and the main difference (compared to Figure 6a) was in the percentage value of the relative changes. Based on the developed regression model (4) and calculated values of Ff, the following can be stated: an increase in the cutting speed by 1 m·min−1 results in an average increase in the feed force within these values: by 0.094% (εr = 130.00°) to 0.123% (εr = 145.10°). When setting fn = 0.26 mm·rev−1 and vc = 85.00 m·min−1 and simultaneously varying the point angle εr within the values set {130.00°, 133.30°, 137.50°, 141.70°, 145.10°}, the relative decrease in the value of Ff gradually acquires corresponding values from the set {5.137%, 6.892%, 7.402%, 6.471%}. At vc = 90.00 m·min−1, the relative decrease in the Ff value fluctuates, e.g., by 5.107% at εr = 133.30°, by 6.425% (εr = 145.10°), and its maximum is by 7.353% at εr = 141.70°. For fn = 0.26 mm·rev−1, the average relative decrease in Ff depending on varying the point angle εr ranges from 6.475% (vc = 85.00 m·min−1) to 6.052% (vc = 145.00 m·min−1). The main difference between the used feed values fn = 0.09 mm·rev−1 (Figure 6a) and fn = 0.26 mm·rev−1 (Figure 6b) is in the absolute values of the feed component of the cutting force. The increase in the value of Ff is more than 200% when using appropriate values of the cutting speed and point angle, so of course it fluctuates. For example, when changing the feed (from fn = 0.09 mm·rev−1 to fn = 0.26 mm·rev−1) at a constant εr = 130.00° and vc = 85.00 m·min−1, there occurs an increase in Ff by 385.420% (by 302.328% at εr = 130.00° and vc = 145.00 m·min−1). The average difference in the feed force is 337.365% in the case mentioned above. When increasing point angle, this average difference of Ff fluctuates from 321.658% (εr = 133.30°) to 232.497% (εr = 145.10°).
The effect of the point angle (εr) on the change in the feed force value (Ff) when using five different levels of the helix angle (ωr) is shown in Figure 7a for vc = 80.21 m·min−1 and in Figure 7b for vc = 149.79 m·min−1.
As seen in Figure 7, the response value (Ff) conditionally decreases with an increasing the point angle value (εr), and in addition, at higher values of the helix angle, the feed force values are lower. When setting the cutting speed vc = 80.21 m·min−1, helix angle ωr = 25°, and simultaneously increasing the point angle εr in the values set {130.00°, 132.5°, 135°,145°}, the Ff consequently decreases {1051.701 N, 1018.350 N, 984.999 N, 851.595 N}, and the relative decrease in the Ff gradually acquires corresponding values {3.171%, 3.275%, etc.}. The total decrease in the feed force, when increasing the point angle from εr = 130.00° to εr = 145.00°, represents 19.027%. There is the conclusion that, at the listed values of the cutting speed and the angle, when the point angle increases by 1° (within the interval from εr = 130.00° to the 145.0°), the conditional value of the feed component of the cutting force decreases by 1.268%. At the cutting speed of vc = 149.79 m·min−1 (Figure 7b), the same trends are observed.
4.2. Regression Model of Feed Force for Drilled Steel 16MnCr5 and Results of Statistical Analysis
The statistical analysis of the used model (3) to predict the value of the feed force (Ff), depending on varying the input technological and tool factors (D, fn, vc, εr, αo, and ωr), is presented in Table 9 (ANOVA) and Table 10 (Lack of Fit). Based on the acquired value of the adjusted coefficient of the determination, this model explains 97.912% of the variability of the measured forces Ff. The average value of the feed component of the cutting force (Ff) for the material 16MnCr5 represents 1134.717 N, and the average error of the model reaches 55.186 N.
Table 9.
Analysis of variance (ANOVA) for the prediction model of the feed component of the cutting force Ff for material 16MnCr5.
Table 10.
Lack of Fit of the developed model predicting Ff for the drilled material 16MnCr5.
Based on the results listed in Table 9 and the achieved level of significance p < 0.0001, it can be stated that the variability caused by random errors is smaller than the variability of the values explained by the model. This means that, in the model, there is at least one regression coefficient significantly different from zero. The predictive model for the feed force Ff for the drilled material 16MnCr5 is, therefore, possible to consider as appropriate regarding the Fisher–Snedecor testing criterion.
The achieved significance level (Table 10) of the Lack of Fit test (p = 0.4933) allows us to accept the zero hypothesis at the significance level of α = 0.05 and conclude that the used model sufficiently fits the monitored relationship. After verification of the model, the values of the statistically significant regression parameters of the model (3) for the drilled material 16MnCr5 can be correctly estimated, as listed in Table 11 (only significant factors and their interactions).
Table 11.
Estimation of regression coefficients of the model predicting Ff for the drilled material 16MnCr5.
As seen in Table 11, the most significant coefficient of the regression model predicting the feed force Ff for the drilled material 16MnCr5 is Intercept (b0) with an influence of 45.558% (lower by 3.590% in comparison to the effect of b0 for C45). All effects that might have significant influence on the Ff value might be included in b0, but within the performed experiment, they were set as constant factors (see Table 4). We evaluated the impact of the explanatory variables (Table 5) as the main effects, i.e., without consideration of the Intercept (b0). Based on the estimation of the regression coefficients, the application of DOE transformation [59], and subsequent modification, the prediction model of the feed component of the cutting force Ff (influenced by D—x1, fn—x2, vc—x3, εr—x4, αo—x5, and ωr—x6) for the drilled material 16MnCr5 was developed and can be written by Formula (5) as follows:
According to the outputs of the Shapiro–Wilks normality test (p = 0.930), the residuals show a Gaussian normal distribution with an average value of 4.980 × 10⁻¹⁰ N. Therefore, the developed mathematical–statistical model (5), describing the dependence of Ff on the defined tools and technological factors (D—x1, fn—x2, vc—x3, εr—x4, αo—x5, and ωr—x6), can be considered as the correct one (numerically and statistically appropriate), and it is possible to reach the correct conclusions within the used intervals of the input factors. Based on Table 11, the influence of the input factors as main effects was evaluated, and the percentage of their influence on the change in feed force was calculated. We present the results in order, starting with the most significant predictor (we indicate the decrease/increase in % compared to C45). Specifically, the order of the main effects of the input factors (Table 5) according to the size of their impact is: x2—fn 34.087% (decrease 10.780%) and x1—D 14.013%. The cutting speed (x3) has a significant impact on the response Ff only in interaction with the feed (x2), and this interaction x2·x3 represents a 3.718% share of influence. The order of the main effects from the point of view of tools factors, D, εr, αo, and ωr (Table 5), according to their effect size (in %) on the Ff value when drilling samples of the 16MnCr5 material, is: x1 (D) 14.013%; x5 (αo) 8.839%; x6 (ωr) 6.125%; and x4 (εr) 4.382%. Table 11 shows that the mutual interactions of the considered explanatory variables (D—x1, fn—x2, vc—x3, εr—x4, αo—x5, and ωr—x6) also have a significant effect on the change in the value of the feed component of the cutting force Ff. The influences of the interaction (in %) of the input factors are as follows: the squared value of feed fn occurs as interaction x2·x2 (4.566%) also with the point angle x2·x2·x4 (2.380%); feed (x2) interacts with the nominal diameter x2·x1(3.736%); x2·x4·x5—an interaction of the feed fn, point angle εr, and lip clearance angle αo occurs (2.380%). The drill diameter (D) interacts with the lip clearance angle (αo) x1·x5 (3.958%); with the point angle (εr) x1·x4 (3.450%); and there is interaction x1·x4·x5 (2.814%). The next interaction with a significant impact on the feed force Ff that occurs is: the lip clearance angle (αo—x5) interacts with the point angle (εr—x4) x5·x4 (2.952%); with the helix angle (ωr—x6) x6·x5 (2.445%), and together (p = 0.0002) x4·x6·x5 (3.155%) p = 0.0002. Comparing the drilled material 16MnCr5 to the C45, there are differences in terms of the character and effect sizes of the observed significant interactions (this will be mentioned in the Discussion section).
The developed regression model (5) allows us to plot the influences of the selected technological and tool factors on the response (Ff) when drilling the 16MnCr5 material, as shown subsequently in the next three figures (Figure 8, Figure 9 and Figure 10). Figure 8 demonstrates the feed (fn) impact on the feed force value (Ff) when simultaneously varying the cutting speed (vc —five levels) for the used drill diameters of D = 8 mm (Figure 5a) and D = 12 mm (Figure 5b) at constant values of εr = 137.50°, αo = 10.00°, and ωr = 30.00°.
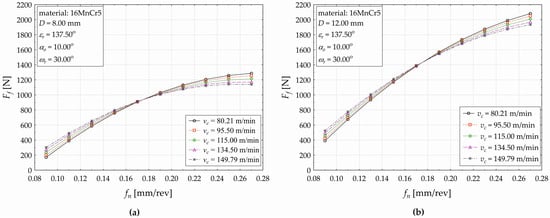
Figure 8.
The impact of feed fn and cutting speed vc on the change in the value of the feed force Ff for the drilled material 16MnCr5 using drill diameter of (a) D = 8 mm and (b) D = 12 mm.
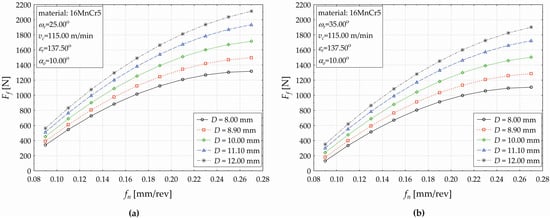
Figure 9.
The effect of the feed fn and the drill diameter D on the changes in the feed force (Ff) values for the drilled material 16MnCr5 when applying helix angle (a) ωr = 25.00° and (b) ωr = 35.00°.
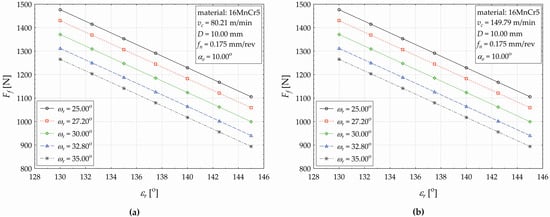
Figure 10.
The impact of the point angle (εr) and the helix angle (ωr) on the change in the response value of Ff for the drilled material 16MnCr5. (a) vc = 80.21 m·min−1 and (b) vc = 149.79 m·min−1.
As shown in Figure 8, the value of the response Ff conditionally increases with increasing the feed (fn). This increase in the value of Ff has a significantly non-linear character (compared to the observed dependence when drilling the C45 at the same cutting conditions (Figure 6a). When setting the drill diameter D = 8 mm and constant cutting conditions as seen in Figure 8a, setting the cutting speed vc = 80.21 [m·min−1] and simultaneously increasing the feed fn [mm·rev−1] from the values set {0.09, 0.11, 0.13, … }, the Ff consequently decreases {170.353N, 390.196N, 586.074N, …}, and the relative increase in the Ff gradually acquires corresponding values {129.051%, 50.200%, …}. Further increasing the feed causes an increase in the Ff, but the relative increase between the two adjacent applied feed values (Figure 8a) decreases (from 29.333% at fn = 0.13 mm·rev−1 to 2.236% at fn = 0.27 mm·rev−1). The nature of the value changes in the response when varying the feed is similar for the applied cutting speeds vc = 95.50 m·min−1 and vc = 134.50 m·min−1, but the gradual value change in Ff is less significant. The change in the investigated functional dependence (Ff on fn) is observed at the applied cutting force vc = 149.79 m·min−1. The effect of fn on the Ff at each applied level of the cutting speed vc can be divided into two areas. When increasing the cutting speed within the defined range (Figure 8a), the conditional change in the Ff value has a non-linear character, but increases within the interval (0.09, 0.17) of the feed fn [mm·rev−1] and decreases within the interval fn ∈ (0.19, 0.27). For example, increasing the cutting speed from vc = 80.21 m·min−1 to vc = 95.50 m·min−1, the value of Ff decreases from 1286.205 N to the value of 1253.667 N (−2.530%). When applying the drill diameter D = 12 mm, the cutting conditions presented in Figure 8b, and varying the cutting speed vc at five defined levels, similar trends in the conditional response values are observed (non-linear character of the plotted curves), and there are differences in the absolute (and relative) value changes in the observed response (the feed force Ff). The individual acquired values, as well as the percentage expressions of the increases/decreases in response values, are available on request from the authors.
The effect of the feed (fn) on the change in the feed force value (Ff) when using five different levels of drill diameter (D) is shown in Figure 9a for the applied helix angle ωr = 25.00°and in Figure 9b for ωr = 35.00°.
As seen in Figure 9, it can be generally said that the response value (Ff) conditionally increases with increasing the feed (fn) when using five different levels of drill diameter (D) and both levels of the helix tool angle ωr = 25.00° (Figure 9a) and ωr = 35.00° (Figure 9b). Moreover, when higher values of the drill diameter D are applied, lower feed force values are observed. The plotted functional dependences demonstrate the significant non-linear character in the value changes of the feed force (the response Ff) for the observed mutual interaction of the two most significant main effects (fn, D) of the developed regression model (5). The observed values of Ff are lower when higher values of the helix angle are applied, and this decrease fluctuates between −61.753% (fn = 0.09 mm·rev−1, D = 8.00 mm) and −16.039% (fn = 0.27 mm·rev−1, D = 8 00 mm). Increasing the nominal diameter of the drilling tool (D) causes a change in the decrease of the relative differences of the Ff value between the used ωr levels (ωr = 35.00° and ωr = 25.00°), and it ranges between the value −37.527% (fn = 0.09 mm·rev−1, D = 12.00 mm) and the value −10.001 (fn = 0.27 mm·rev−1, D = 12.00 mm). For example, when increasing the drill diameter to D = 11.10 mm, the value of Ff increases to 513.518 N, which represents an increase of about 13.421% (when compared to the applied diameter of D = 10.00 mm). More detail is presented in Table 12 and Table 13.
Table 12.
Relative changes in the feed force (Ff) value when increasing the drill diameter (D) at the applied helix angle ωr = 25.00° and setting the feed (fn) at specific values for the 16MnCr5 material.
Table 13.
Relative changes in the feed force (Ff) value when increasing the drill diameter (D) at the applied helix angle ωr = 35.00° and setting the feed (fn) at specific values for the 16MnCr5 material.
To better explain the observed conditional change in the feed force (a relative decrease) depending on the two main effects (the point angle εr and the helix angle ωr) when drilling the 16MnCr5 material, graphical representations of the observed relationship are displayed in Figure 10a (for vc = 80.21 m·min−1) and Figure 10b (for vc = 149.79 m·min−1).
In Figure 10, it is shown that, at both applied values of the cutting force vc, a decreasing trend of the response in Ff is observed. For example, when setting the cutting conditions in terms of Figure 10b, the helix angle at the value of ωr = 25°, and increasing the point angle by 1° (within the considered interval from εr = 130.00° to 145.00°), the total decrease in the feed component of the cutting force Ff will represent 25.146%. This detailed analysis of the influence of the technological and tool factors (considered within the experiment) on the change in the value of the feed component of the cutting force (Ff) is primarily aimed to compare the differences in their influences with respect to the machined material (C45, 16MnCr5).
5. Discussion
In the discussion section, we will provide an evaluation of the accuracy of the created prediction models (4) and (5) in comparison with Equation (2), applied in practice for the estimation of the feed component of the cutting force (Ff) using the constants listed in Table 1, for both the investigated materials. We will primarily provide an analysis of the influence of the material itself, and its basic analyzed properties Rm and HV10 on the change in the Ff value based on a verification experiment. To more accurately predict the feed component of the cutting force (Ff) during the drilling process of the materials C45 and 16MnCr5, multivariate non-linear regression models (4) and (5) were developed based on a statistical evaluation of the experimentally obtained data. Figure 11 and Figure 12 show the deviations between Ff values obtained by the experiment and those calculated by models, i.e., deviations in the Ff values predicted by models (2) and (4) for the C45 material (Figure 11a,b) and by models (2) and (5) for the 16MnCr5 material (Figure 12a,b).
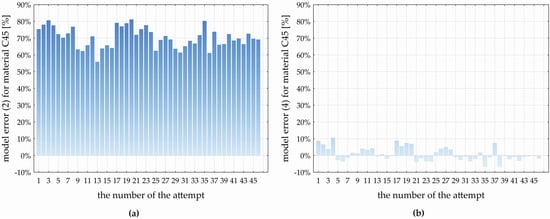
Figure 11.
A relative error of the model predicting the feed component of the cutting force (Ff) when drilling the material C45. (a) model (2) and (b) model (4).
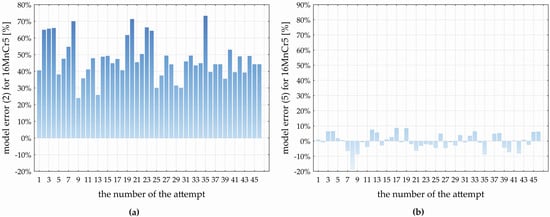
Figure 12.
A relative error of the model predicting the feed force (Ff) when drilling the material 16MnCr5. (a) model (2) and (b) developed model (5).
For the drilled material C45, model (2) shows an average relative deviation from the experimentally obtained Ff values at the level of 70.365 ± 1.796% with a standard deviation of 6.048 ± 1.032% (Figure 11a). The minimum value of the relative error of model (2) represents 55.872% (D = 8.90 mm, fn = 0.22 mm·rev−1, vc = 134.50 m·min−1, εr = 133.30°, αo = 8.90°, and ωr = 27.20°), and the maximum error of model (2) is 81.198% (D = 11.10 mm, fn = 0.13 mm·rev−1, vc = 95.50 m·min−1, εr = 141.70°, αo = 11.10°, and ωr = 32.80°). The variation range of the error of model (2) represents 25.326%. Based on Figure 11a, the relative error of model (2) demonstrates: the lower quartile represents 65.787%, the upper quartile represents 75.372%, and the interquartile range is at the level of 9.858%. In comparison with the experimentally obtained Ff values for C45, the developed MNRm (4) achieves an average relative error of 0.920 ± 1.229% with a standard deviation of 4.141 ± 0.706%. Based on Figure 11b, the maximum negative relative error of model (4) is −6.872% (D = 10.00 mm, fn = 0.18 mm·rev−1, vc = 149.79 m·min−1, εr = 137.50°, αo = 10.00°, and ωr = 30.00°), and the maximum positive relative error represents 10.578% (D = 8.90 mm, fn = 0.13 mm·rev−1, vc = 95.50 m·min−1, εr = 141.70°, αo = 11.10°, and ωr = 27.20°). The range of the relative error of model (4) represents 17.449%, the lower quartile is at the level of −1.931%, the upper quartile at 3.909%, and the interquartile range of the error of model (4) represents 5.840%. Based on the comparison of models (2) and (4) predicting the values of Ff when drilling the C45 steel, it can be concluded that the experimentally developed model (4) shows an average error lower than model (2), namely, by 69.445%.
For the drilled material 16MnCr5, model (2) represents an average relative deviation from the experimentally obtained Ff values at the level of 47.232 ± 3.556% with a standard deviation of 11.974 ± 9.932% (Figure 12a). The minimum relative error of (2) is 23.904% (D = 8.90 mm, fn = 0.22 mm·rev−1, vc = 95.50 m·min−1, εr = 133.30°, αo = 8.90°, and ωr = 32.80°), and the maximum relative error is 73.279% (D = 10.00 mm, fn = 0.09 mm·rev−1, vc = 115.00 m·min−1, εr = 137.50°, αo = 10.00°, and ωr = 30.00°). The relative error range of model (2) is 49.376%. Based on Figure 12a, the relative error of model (2) demonstrates that the lower quartile is 39.575%, the upper quartile is 50.364%, and the interquartile range reaches 10.789%. In comparison with the experimentally obtained Ff values for the 16MnCr5, the developed MNRm (5) achieves an average relative error of 0.269 ± 1.903% with a standard deviation of 5.498 ± 0.938%. In Figure 12b, the maximum negative relative error of model (5) is—8.735% (D = 8.90 mm, fn = 0.13 mm·rev−1, vc = 134.50 m·min−1, εr = 141.70°, αo = 11.10°, and ωr = 32.80°), and the maximum positive relative error of (5) is 8.578% (D = 11.10 mm, fn = 0.13 mm·rev−1, vc = 95.50 m·min−1, εr = 133.30°, αo = 8.90°, and ωr = 32.80°). The range of the relative error of the developed model (5) represents 27.313%, the lower quartile is at the level of -3.079%, and the upper quartile of 4.709%. Based on the comparison of models (2) and (5) predicting the values of Ff when drilling the 16MnCr5 steel, it can be concluded that the experimentally developed model (5) shows an average error lower than model (2), namely, by 46.963%.
A verification experiment was carried out to analyze the influence of the drilled material on the value change in the feed force (Ff). The values according to Table 5 when setting constant factors in terms of Table 4 were used within each partial experimental test run. The partial experiments were not performed according to the DOE, but the influence of the selected technological (fn, vc) and tool (D) factors on the value change in the feed force (Ff) was analyzed. The total number of tests reached 400, because each test was repeated N-times (N = 10) in the frame of the realized verification experiment.
Figure 13 presents the main changes in the feed force (Ff) in the dependence on the feed (fn) that manifests the most significant effect on the response, in terms of the performed statistical analysis (Table 8 and Table 11) when drilling the both of materials (C45 and 16MnCr5 steels). The fn effect size is 44.867% (when drilling the C45) and 34.087% (when drilling the 16MnCr5) when applying the cutting conditions reported in Figure 13. Specifically, when setting a cutting speed of vc = 80.21 m·min−1 (Figure 13a,c), cutting speed at the value of vc = 149.79 m·min−1 (Figure 13b,d), and simultaneously setting the drill diameter at the level of D = 8.00 mm (Figure 13a,b) and the level of D = 12.00 mm (Figure 13c,d). Other tool factors such as εr = 137.50°, αo = 10.00°, and ωr = 30.00° were constant during all the verification experiments.
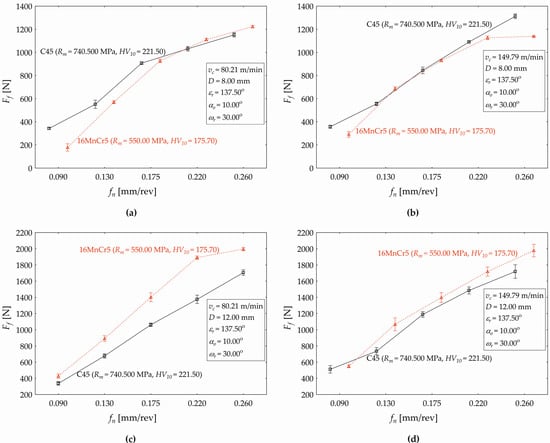
Figure 13.
The influence of selected technological (fn and vc) and tool (D) factors on the change in the value of the feed force (Ff) when setting (a) vc = 80.21 m·min−1, D = 8.00 mm; (b) vc = 149.79 m·min−1, D = 8.00 mm; (c) vc = 80.21 m·min−1, D = 12.00 mm; and (d) vc = 149.79 m·min−1, D = 12.00 mm.
The performed analysis points out some interesting facts. The machined material has a significant impact on the value change in the feed component of the cutting force Ff (p < 0.000). The average value of Ff represents 796.660 ± 87.154 N when machining the material C45 and 801.551 ± 109.821 N when drilling the 16MnCr5 steel. This difference in the average values of Ff is significant (p < 0.000) at the chosen level of significance α = 0.05 regarding the Scheffe test for both machined materials (C45 and 16MnCr5 steels). However, the material as a factor significantly (p < 0.000) impacts the change in the feed force value, even in interaction with the feed. When drilling the material C45, the feed force acquires the following average values (when setting the defined levels of the feed fn): 342.014 ± 2.246 N (fn = 0.09 mm·rev−1); 550.920 ± 8.439 N (fn = 0.13 mm·rev−1); 907.039 ± 2.939 N (fn = 0.175 mm·rev−1); 1031.390 ± 4.899 N (fn = 0.22 mm·rev−1); and finally, 1151.936 ± 4.359 N (fn = 0.26 mm·rev−1). When drilling the material 16MnCr5 (and setting the defined levels of the feed fn, the average value of the feed force acquires the following results. 177.894 ± 7.594 N (fn = 0.09 mm·rev−1); 569.312±3.017 N (fn = 0.13 mm·rev−1); 927.140 ± 3.581 N (fn = 0.175 mm·rev−1); 1111.028 ± 2.893 N (fn = 0.22 mm·rev−1); and 1222.381 ± 2.708 N at a feed of fn = 0.26 mm·rev−1. The differences in the average value of Ff are significant (p < 0.000) at all the defined feed values fn [mm·rev−1], fn ∈ {0.09, 0.13s, 0.175, 0.22, 0.26} (Figure 13a). Therefore, the first conclusion can be stated, which is that the response of Ff acquires higher values when machining C45 and setting the feed within the range fn ∈ {0.09, 0.13, 0.175}. However, when setting fn ∈ {0.22, 0.26}, the value of the feed force is significantly higher when machining the material 16MnCr5, specifically when applying the cutting speed vc = 80.21 m·min−1 and the nominal diameter D = 8.00 mm.
Increasing the cutting speed to the level of vc = 149.79 m·min−1 (drill diameter D = 8.00 mm) resulted in the drilled material having no significant impact (p = 0.103) as the main effect on the change in the response (Figure 13b). The average value of Ff is 831.775 ± 99.506 N when drilling the C45 steel and 834.590 ± 91.256 N when machining the 16MnCr5. The difference in the average values (0.341%) is not statistically significant (p = 0.989). The significant effect of the drilled material on the Ff (p < 0.000) is observed in mutual interaction with the feed. The differences in Ff values are significant (p < 0.000) at all defined feed values fn [mm·rev−1], fn ∈ {0.09, 0.13, 0.175, 0.22, 0.26} for the steel C45 and also for the 16MnCr5. When setting vc = 149.79 m·min−1 and D = 8.00 mm during drilling C45, the Ff values are significantly higher, but only for fn ∈ {0.09, 0.26}. When changing the drill diameter and the cutting speed to the level of D = 12.00 mm and vc = 80.21 m·min−1 (Figure 13c), the machined material manifests the significant main effect (p < 0.000) on the feed force. In this case, the average value of Ff is 1031.368 ± 139.602 N (for C45) and 1321.746 ± 170.864 N (for 16MnCr5). The difference in the average values of Ff between both machined materials is also statistically significant (p < 0.000). As seen in Figure 13, the absolute average value of Ff is higher when machining the material 16MnCr5 (by 29.049%) compared to C45 for all defined feed values. The maximum relative difference is observed at fn = 0.22 mm·rev−1 (37.511%) and the minimum at fn = 0.26 mm·rev−1 (17.079%).
Figure 13d shows that, when applying the presented cutting condition and setting vc = 149.79 m·min−1 and D = 12.00 mm, the machined material (C45 and 16MnCr5) manifests a significant impact on Ff as the main effect (p < 0.000), but also in mutual interaction (p < 0.000) with the feed. The average value of Ff represents 1128.008 ± 129.383 N (C45) and 1342.024 ± 143.799 N (16MnCr5). The difference in the Ff values between the machined materials (18.973%) is statistically significant (p < 0.000) at all defined feed values. Similar to the previous case (Figure 13c), the value of Ff is statistically significantly higher when machining the material 16MnCr5 (compared to the C45) at all defined feed values fn ∈ {0.09, 0.13, 0.175, 0.22, 0.26}. The maximum relative difference is observed at fn = 0.13 mm·rev−1 (45.012%) and the minimum occurs at fn = 0.09 mm·rev−1 (7.424%). According to Figure 13a,d, it is necessary to notice that the machined material (C45, 16MnCr5) manifests a significant impact on Ff also in a mutual interaction with the drill diameter (D) and the cutting speed (vc). When drilling the material samples and applying D = 8.00 mm and vc = 80.21 m·min−1, the average value of Ff is 796.660 ± 87.154 N (for C45) and 801.551 ± 109.821 N (for 16MnCr5). The difference in Ff average values between the machined materials is not statistically significant (p = 0.804) at these defined cutting conditions. When machining the material samples and setting D = 12.00 mm and vc = 80.21 m·min−1 (Figure 13c), the average value of Ff is 1032 ± 139.040 N (for the drilled steel C45) and 1325.006 ± 170.870 N (16MnCr5). The difference in the average values of Ff (28.287%) between both machined materials is statistically significant (p < 0.000) at the chosen significance level of α = 0.05. The tool factor (D) occurs as the key aspect in this mutual interaction influence (the drilled material, the drill diameter D, and the cutting speed vc). The differences in the average value of Ff are not significant and could be considered as the stochastic influence when applying D = 8.00 mm, with no regard to the used cutting speed.
The performed verification experiment and analysis of the relationship Ff = y(fn, vc, D, εr, αo, and ωr), i.e., the impact of the considered technological and tool factors (Table 5) on the feed force Ff when machining the C45 and 16MnCr5, outputs some interesting knowledge. The machined material is observed as the significant (p < 0.000) main effect (with a 17.600% share of impact) on the response (Ff), moreover, its mutual interactions with the defined technological and tool factors are confirmed as statistically significant. Primarily, the impact of the feed (fn) on the Ff represents 44.867% when machining the material C45, but a lower impact (34.087%) is recognized when machining the experimental material 16MnCr. The main differences occurred in the material effect on the Ff when analyzing the cutting speed influence. The vc manifested a 9.109% share of significant impact on the Ff when machining the material C45, but when machining the 16MnCr5, no significant effect of the cutting speed was demonstrated. The drill diameter demonstrated a 12.183% impact on the response (for the C45 material) and 14.103% when machining the material 16MnCr5. The influences of other considered tool factors (εr, αo, and ωr) on the value change of Ff demonstrate a significant dependence on the machined material. The impacts of the tool factors εr and αo in the value change of the feed force are lower when machining the material with a lower strength value and lower hardness (16MnCr5) than when machining the material C45. Specifically, the point angle confirms (εr) a 49.198% influence and the lip clearance angle in the orthogonal plane (αo) an influence of about 22.509%. On the other hand, the impact of the helix angle in the basic plane (ωr) on the change in the Ff value is about 136.060% higher when machining 16MnCr5 compared to the steel C45. The material 16MnCr5 manifests a higher tensile strength and higher hardness. The mutual interaction of the point angle (εr) and the helix angle (ωr) on the value change of Ff is higher (about 122.759%) when machining the experimental samples of 16MnCr5 compared to the material C45. In addition to the above mentioned, different effects of mutual interactions of the tool and technological factors on the value changes in Ff when machining the C45 (Table 8) and 16MnCr5 (Table 11) were observed.
The achieved results are valid for the considered materials and defined cutting conditions, which limits the applicability of the developed mathematical–statistical prediction models to simulate the drilling of other materials. Modification of these models requires the implementation of additional experiments, which would correct the estimations of the regression coefficients of models for other drilled materials. The novelty of our research work lies in the complexity and scope of the considered explanatory variables. Above all, in that, unlike other publications [37,38,39,40,41,42,43], we also consider such tool factors (point angle—εr, lip relief/clearance angle—αo, and helix angle—ωr) that meet the condition of mutual independence and the condition of orthogonality with respect to the DOE methodology. This article provides an adequate combination of experimental, numerical, and analytical approaches for hole drilling simulation.
6. Conclusions
The authors of the research study provide an adequate combination of experimental, numerical, and analytical approaches to the modelling of the drilling process of two materials, namely C45 (Rm = 740.500 ± 1.447 MPa and HV10 = 221.500 ± 3.023) and 16MnCr5 (Rm = 740.500 ± 1.447 MPa and HV10 = 221.500 ± 3.023). The study is focused on the analysis of the machined material’s influence on the change in the value of the feed force Ff during drilling operation, with consideration of the influence mechanism of the chosen basic technological (fn and vc) and tool factors (D, εr, αo, and ωr). The defined main and parallel goals (to catch the statistically significant main effects and interactions of the chosen explanatory variables and develop mathematical–statistical regression models predicting the response) were achieved. For this purpose, two large experiments were carried out. The first one was carried out regarding the DOE methodology, and the obtained data were subjected to statistical analysis. The second experiment was performed to verify the obtained scientific results. Based on the aforementioned, the following conclusions can be proclaimed:
- an excellent agreement between the actual measured values of the investigated response (Ff) and calculated Ff values applying the developed regression model (4) for the machined material C45 (0.920 ± 1.229%) and (5) for the material 16MnCr5 (0.269 ± 1.903%) is demonstrated;
- the machined material is observed as the significant (p < 0.000) main effect (with a 17.600% share of impact) on the response (Ff), moreover, its mutual interactions with the defined technological and tool factors are confirmed as statistically significant;
- the influence of the technological (fn and vc) and tool factors (D, εr, αo, and ωr) on the response (the feed force) during the drilling process is necessary to monitor in mutual interactions with the machined material;
- the effect of the feed (fn) on the Ff represents 44.867% when machining the material C45, but a lower impact (34.087%) is recognized when machining the experimental material 16MnCr;
- the vc manifests a 9.109% share of significant impact on the Ff when machining the material C45, but when machining the 16MnCr5, no significant effect of cutting speed is demonstrated;
- the observed significant impact of the nominal diameter of the drilling tool on the response Ff represents 12.183% when machining the material C45 and 14.103% when machining the material 16MnCr5;
- the influence of the point angle in the basic plane (εr) on the value change of Ff is about 49.198% lower when machining the material 16 MnCr5 compared to the material C45;
- the lip clearance angle in the orthogonal plane (αo) demonstrates about a 22.509% influence on the value change in Ff;
- the impact of the helix angle in the basic plane (ωr) on the change in the Ff value is about 136.060% higher when machining 16MnCr5 compared to the steel C45.
Despite certain conclusions that the effect of the drilled material on the change in the value of the feed component of the cutting force Ff has not been proven [63], this research study confirmed that the material plays a significant role, both in terms of the size of Ff and in terms of the mechanism of influence and mutual interactions of the technological (fn and vc) and tool (D, εr, αo, and ωr) factors on the response (the feed force). The study itself has its limitations: it focuses on two types of steel (C45 and 16MnCr5), which may limit the generalization of the results achieved (to other materials with different mechanical and physical properties). The validity of the stated conclusions remains only for the proposed levels of the explanatory variables within the used intervals of the drilling cutting conditions. Limitations are also given by the used methodology and setting of the experiments, including the choice of controlled and constant factors. There is no such thing as a perfect experiment, so the effect of certain variables or conditions encountered in industrial applications (e.g., tool wear and machine vibration) is sometimes neglected/excluded in experimentation. This also presents limitations for the applicability of the results obtained. In our work, we focused on the regression models, but it would be interesting to apply modern methods of machine learning and tools of artificial intelligence. Taking into account the scope of the article, we did not use/present these methods in this case. For a comprehensive and more detailed analysis of the effect of individual factors on the change in the observed response (cutting force component), the authors of this study intend to use modern methods to process experimentally obtained data using machine learning methods (neural networks and decision trees, etc.). The authors already have experience with application of these methods, and they have implemented them in other research fields, e.g., [64].
Based on the experimentally obtained results, it could be expected that the material will have a significant impact on the value change in torque (Mk) during drilling. Of course, observing the effect of the considered technological and tool factors on the value changes in Ff and Mk could give interesting results when machining other types of materials. The achieved results are valid for the defined materials and cutting conditions, and the modification of the models requires the implementation of additional experiments, which would correct the estimations of the regression coefficients of models for other drilled materials. The established mathematical–statistical models are applicable and will be used for prediction of the feed force in the CAM software (SolidCAM 2023 x64, SP3HF1) environment as a part of research projects at the University of Bohemia (CZ).
Author Contributions
Conceptualization, J.S., J.H., J.F., M.G., A.V. and A.J.; methodology, J.S., J.H., J.F., M.G., A.V. and A.J.; software, J.S., J.H., J.F., M.G., A.V. and A.J.; validation, J.S., J.H., J.F., M.G., A.V. and A.J.; formal analysis, J.S., J.H., J.F., M.G. and A.V.; investigation, J.S., J.H., J.F., M.G., A.V. and A.J.; resources, A.V., J.F. and M.G.; data curation M.G., J.S., J.H. and A.V.; writing—original draft preparation, J.S., J.H., J.F., M.G., A.V. and A.J.; writing—review and editing, J.S., J.H., M.G. and A.V.; visualization, M.G., J.S. and J.H.; supervision, J.S., J.H., J.F., M.G., A.V. and A.J.; project administration, J.S.; funding acquisition, J.S. All authors have read and agreed to the published version of the manuscript.
Funding
This research was funded by the grant Výzkum a vývoj pro inovace v oboru strojírenská technologie-technologie obrábění IV/SGS-2022-007/2022-2024. Research and development for innovations in the field of engineering technology-machining technology IV. The APC was funded by this grant SGS-2022-007/2022-2024.
Institutional Review Board Statement
Not applicable.
Informed Consent Statement
Not applicable.
Data Availability Statement
Data are available based upon the request.
Conflicts of Interest
The authors declare no conflicts of interest.
References
- Pelikán, L.; Slaný, M.; Beránek, L.; Andronov, V.; Nečas, M.; Čepová, L. Experimental Investigation of Suitable Cutting Conditions of Dry Drilling into High-Strength Structural Steel. Materials 2021, 14, 4381. [Google Scholar] [CrossRef] [PubMed]
- Bag, S.; Banik, S.; Nripen Mondal, N.; Mandal, M.C. Optimization of turning process parameters on EN8 unalloyed steel-based on MCDM methods. Mater. Today Proc. 2023, in press. [Google Scholar] [CrossRef]
- Sydor, M.; Rogoziński, T.; Stuper-Szablewska, K.; Starczewski, K. The accuracy of holes drilled in the side surface of plywood. BioResources 2020, 15, 117–129. [Google Scholar] [CrossRef]
- Sydor, M.; Potok, Z.; Pędzik, M.; Hitka, M.; Rogoziński, T. The influence of feed rate during pilot hole drilling on screw withdrawal resistance in particleboard. Eur. J. Wood Prod. 2024, 82, 5–13. [Google Scholar] [CrossRef]
- Makhesana, M.A.; Bagga, P.J.; Patel, K.M.; Taha-Tijerina, J.J. Effects of Machining Parameters of C45 Steel Applying Vegetable Lubricant with Minimum Quantity Cooling Lubrication (MQCL). Lubricants 2023, 11, 332. [Google Scholar] [CrossRef]
- Stephenson, D.A.; Agapiou, J.S. Metal Cutting Theory and Practice, 3rd ed.; CRC Press: Boca Raton, FL, USA, 2016. [Google Scholar] [CrossRef]
- Vrabeľ, M.; Eckstein, M.; Maňková, I. Analysis of the metallography parameters and residual stress induced when producing bolt holes in Inconel 718 alloy. Int. J. Adv. Manuf. Technol. 2018, 96, 4353–4366. [Google Scholar] [CrossRef]
- Martins, P.S.; Drumond, R.M.; da Silva, E.R.; Ba, E.C.T.; de Souza Lima, E.V.; Barbosa, J.W.; Fernandes, G.H.N.; Firpe, P.M. Evaluation of the drilling process in 6061-T6 Al-Mg-Si alloys using AISI M-35 diamond-like carbon coated high-speed steel drill. Tribol. Int. 2024, 192, 109250. [Google Scholar] [CrossRef]
- Jiang, A.; Liu, Z.; Wang, S.; Wen, J.; Li, Y.; Zhao, J. Optimized design of indexable insert drill based on radial cutting force balance. Int. J. Adv. Manuf. Technol. 2023, 128, 2029–2041. [Google Scholar] [CrossRef]
- Sedlak, J.; Zouhar, J.; Kolomy, S.; Slany, M.; Necesanek, E. Effect of high-speed steel screw drill geometry on cutting performance when machining austenitic stainless steel. Sci. Rep. 2023, 13, 9233. [Google Scholar] [CrossRef]
- Boughdiri, I.; Giasin, K.; Mabrouki, T.; Zitoune, R. Effect of cutting parameters on thrust force, torque, hole quality and dust generation during drilling of GLARE 2B laminates. Compos. Struct. 2021, 261, 113562. [Google Scholar] [CrossRef]
- Pelikán, L.; Slaný, M.; Stránský, O.; Beránek, L.; Pitrmuc, Z.; Čepová, L.; Dvořáčková, Š. Novel drill geometries for dry drilling of stainless steel. J. Manuf. Process. 2023, 92, 500–520. [Google Scholar] [CrossRef]
- Totis, G.; Sortino, M. Development of a modular dynamometer for triaxial cutting force measurement in Turning. Int. J. Mach. Tools Manuf. 2011, 51, 34–42. [Google Scholar] [CrossRef]
- Song, Y.; Cao, H.; Zheng, W.; Qu, D.; Liu, L.; Yan, C. Cutting force modeling of machining carbon fiber reinforced polymer (CFRP) composites: A review. Compos. Struct. 2022, 299, 116096. [Google Scholar] [CrossRef]
- Priyanka, P.; Kishore Kumar, P.; Lakshmi Kala, K.; Vemanaboina, H. Prediction of cutting forces in drilling of aluminum 6061-T6 alloy. Mater. Today Proc. 2023, in press. [Google Scholar] [CrossRef]
- Abrão, A.M.; Campos Rubio, J.C.; Faria, P.E.; Davim, J. The effect of cutting tool geometry on thrust force and delamination when drilling glass fibre reinforced plastic composite. Mater. Des. 2008, 29, 508–513. [Google Scholar] [CrossRef]
- Schmidt, R.; Strodick, S.; Walther, F.; Biermann, D.; Zabel, A. Influence of the cutting edge on the surface integrity in BTA deep hole drilling–part 1: Design of experiments, roughness and forces. Procedia CIRP 2022, 108, 329–334. [Google Scholar] [CrossRef]
- Zheng, H.; Feng, Y.; Huang, S. Optimization of cutting parameters for deep hole drilling of 42CrMo steel. J. Braz. Soc. Mech. Sci. Eng. 2023, 45, 451. [Google Scholar] [CrossRef]
- Rodriguez, I.; Soriano, D.; Ortiz-de-Zarate, G.; Cuesta, M.; Pušavec, F.; Arrazola, P.J. Effect of Tool Geometry and LCO2 Cooling on Cutting Forces and Delamination when Drilling CFRP Composites Using PCD Tools. Procedia CIRP 2022, 108, 752–757. [Google Scholar] [CrossRef]
- Parsian, A.; Magnevall, M.; Beno, T.; Eynian, M. A Mechanistic Approach to Model Cutting Forces in Drilling with Indexable Inserts. Procedia CIRP 2014, 24, 74–79. [Google Scholar] [CrossRef]
- Anand, R.S.; Patra, K.; Steiner, M.; Biermann, D. Mechanistic modeling of micro-drilling cutting forces. Int. J. Adv. Manuf. Technol. 2017, 88, 241–254. [Google Scholar] [CrossRef]
- Arif, R.; Fromentin, G.; Rossi, F.; Marcon, B. Mechanical analysis of local cutting forces and transient state when drilling of heat-resistant austenitic stainless steel. Int. J. Adv. Manuf. Technol. 2019, 104, 2247–2258. [Google Scholar] [CrossRef]
- Hamade, R.F.; Seif, C.Y.; Ismail, F. Extracting cutting force coefficients from drilling experiments. Int. J. Mach. Tools Manuf. 2006, 46, 387–396. [Google Scholar] [CrossRef]
- Bai, Y.; Jia, Z.-Y.; Fu, R.; Hao, J.-X.; Wang, F.-J. Mechanical model for predicting thrust force with tool wear effects in drilling of unidirectional CFRP. Compos. Struct. 2021, 262, 113601. [Google Scholar] [CrossRef]
- Matsumura, T.; Tamura, S. Cutting Force Model in Drilling of Multi-layered Materials. Procedia CIRP 2013, 8, 182–187. [Google Scholar] [CrossRef]
- Jia, Z.-Y.; Zhang, C.; Wang, F.-J.; Fu, R. A mechanistic prediction model for thrust force and torque during drilling of CFRP/Ti stacks. Int. J. Adv. Manuf. Technol. 2020, 106, 3105–3115. [Google Scholar] [CrossRef]
- Luo, B.; Li, Y.; Zhang, K.; Cheng, H.; Liu, S. A novel prediction model for thrust force and torque in drilling interface region of CFRP/Ti stacks. Int. J. Adv. Manuf. Technol. 2015, 81, 1497–1508. [Google Scholar] [CrossRef]
- Li, S.; Zhang, D.; Liu, C.; Shao, Z.; Ren, L. Influence of dynamic angles and cutting strain on chip morphology and cutting forces during titanium alloy Ti-6Al-4 V vibration-assisted drilling. J. Mater. Process. Technol. 2021, 288, 116898. [Google Scholar] [CrossRef]
- Kaymakci, M.; Kilic, Z.M.; Altintas, Y. Unified cutting force model for turning, boring, drilling and milling operations. Int. J. Mach. Tools Manuf. 2012, 54–55, 34–45. [Google Scholar] [CrossRef]
- Ucun, I.; Aslantas, K.; Oezkaya, E.; Çiçek, A. 3D numerical modelling of micro-milling process of Ti6Al4V alloy and experimental validation. Adv. Mater. Process. Technol. 2017, 3, 250–260. [Google Scholar] [CrossRef]
- Rodríguez, J.M.; Jonsén, P.; Svoboda, A. Simulation of metal cutting using the particle finite-element method and a physically based plasticity model. Comput. Part. Mech. 2017, 4, 35–51. [Google Scholar] [CrossRef]
- Uçak, N.; Çiçek, A.; Oezkaya, E.; Aslantas, K. Finite element simulations of cutting force, torque, and temperature in drilling of Inconel 718. Procedia CIRP 2019, 82, 47–52. [Google Scholar] [CrossRef]
- Giasin, K.; Hodzic, A.; Phadnis, V.; Ayvar-Soberanis, S. Assessment of cutting forces and hole quality in drilling Al2024 aluminium alloy: Experimental and finite element study. Int. J. Adv. Manuf. Technol. 2016, 87, 2041–2061. [Google Scholar] [CrossRef]
- Kuzu, A.T.; Berenji, K.R.; Bakkal, M. Thermal and force modeling of CGI drilling. Int. J. Adv. Manuf. Technol. 2016, 82, 1649–1662. [Google Scholar] [CrossRef]
- Türkes, E.; Erdem, M.; Gok, K.; Gok, A. Development of a new model for determine of cutting parameters in metal drilling processes. J. Braz. Soc. Mech. Sci. Eng. 2020, 42, 16. [Google Scholar] [CrossRef]
- Ducobu, F.; Beuscart, T.; Erice, B.; Cuesta, M.; Lauwers, B.; Arrazola, P.-J. A mechanistic-finite element hybrid approach to modelling cutting forces when drilling GFRP-AISI 304 stacks. CIRP Ann. 2023, 72, 69–72. [Google Scholar] [CrossRef]
- Abouridouane, M.; Klocke, F.; Lung, D. Microstructure-based 3D Finite Element Model for Micro Drilling Carbon Steels. Procedia CIRP 2013, 8, 94–99. [Google Scholar] [CrossRef]
- Ahmed, Y.S.; Youssef, H.; El-Hofy, H.; Ahmed, M. Prediction and Optimization of Drilling Parameters in Drilling of AISI 304 and AISI 2205 Steels with PVD Monolayer and Multilayer Coated Drills. J. Manuf. Mater. Process. 2018, 2, 16. [Google Scholar] [CrossRef]
- Storchak, M.; Stehle, T.; Möhring, H.-C. Numerical Modeling of Cutting Characteristics during Short Hole Drilling: Modeling of Kinetic Characteristics. J. Manuf. Mater. Process. 2023, 7, 195. [Google Scholar] [CrossRef]
- Bronis, M.; Miko, E.; Nowakowski, L. Influence of the Kinematic System on the Geometrical and Dimensional Accuracy of Holes in Drilling. Materials 2021, 14, 4568. [Google Scholar] [CrossRef] [PubMed]
- Abouridouane, M.; Klocke, F.; Lung, D.; Adams, O. Size Effects in Micro Drilling Ferritic-Pearlitic Carbon Steels. Procedia CIRP 2012, 3, 91–96. [Google Scholar] [CrossRef]
- Ammar, M.M.A.; Shirinzadeh, B.; Lai, K.Z.; Wei, W. On the Sensing and Calibration of Residual Stresses Measurements in the Incremental Hole-Drilling Method. Sensors 2021, 21, 7447. [Google Scholar] [CrossRef] [PubMed]
- Abdulkadir, Y.; Abdullah, K.; Selçuk, Y. Finite element simulation of drilling operation and theoretical analysis of drill stresses with the deform-3D. Simul. Model. Pract. Theory 2020, 104, 102153. [Google Scholar] [CrossRef]
- Gao, X.J.; Li, H.; Liu, Q.; Zou, P.; Liu, F. Simulation of Stainless Steel Drilling Mechanism Based on Deform-3D. Adv. Mater. Res. 2010, 160–162, 1685–1690. [Google Scholar] [CrossRef]
- Sun, Q.; Gao, B.; Yang, C.C.; Chen, B.B. FEA of Micro-Hole Drilling in Stainless Steel Based on DEFORM-3D. Adv. Mater. Res. 2012, 531, 566–570. [Google Scholar] [CrossRef]
- Bustillo, A.; Correa, M. Using artificial intelligence to predict surface roughness in deep drilling of steel components. J. Intell. Manuf. 2012, 23, 1893–1902. [Google Scholar] [CrossRef]
- Amini, S.; Alinaghian, I.; Lotfi, M.; Teimouri, R.; Alinaghian, M. Modified drilling process of AISI 1045 steel: A hybrid optimization. Eng. Sci. Technol. Int. J. 2017, 20, 1653–1661. [Google Scholar] [CrossRef]
- Naisson, P.; Rech, J.; Paris, H. Analytical modeling of thrust force and torque in drilling. Proc. Inst. Mech. Eng. Part B J. Eng. Manuf. 2013, 227, 1430–1441. [Google Scholar] [CrossRef]
- Molnar, V. Experimental Investigation of Tribology-Related Topography Parameters of Hard-Turned and Ground 16MnCr5 Surfaces. Lubricants 2023, 11, 263. [Google Scholar] [CrossRef]
- Dizisaz, M.; Parast, M.S.A.; Azadi, M.; Dadashi, A. Plain and fretting fatigue characteristics of 16MnCr5 steel under cyclic bending loading with the application of engine piston pin. Mater. Chem. Phys. 2024, 316, 129110. [Google Scholar] [CrossRef]
- Tönshoff, H.K.; Arendt, C.; Amor, R.B. Cutting of Hardened Steel. CIRP Ann. 2000, 49, 547–566. [Google Scholar] [CrossRef]
- Bedelean, B.; Ispas, M.; Răcășan, S. Combining Artificial Neural Network and Response Surface Methodology to Optimize the Drilling Operating Parameters of MDF Panels. Forests 2023, 14, 2254. [Google Scholar] [CrossRef]
- Zeng, T.; Chen, Z.C.; Liu, Z.; Yi, Z.; Wang, S. An applied explicit mathematical model of conical drill point geometry without flank rubbing. Int. J. Adv. Manuf. Technol. 2020, 106, 3707–3720. [Google Scholar] [CrossRef]
- Hale, P.; Ng, E.-G. 3D Finite Element Model on Drilling of CFRP with Numerical Optimization and Experimental Validation. Materials 2021, 14, 1161. [Google Scholar] [CrossRef]
- Joy Mathavan, J.; Hassan, M.H.; Xu, J.; Franz, G. Hole Quality Observation in Single-Shot Drilling of CFRP/Al7075-T6 Composite Metal Stacks Using Customized Twist Drill Design. J. Compos. Sci. 2022, 6, 378. [Google Scholar] [CrossRef]
- Hassan, M.H.; Abdullah, J.; Franz, G. Multi-Objective Optimization in Single-Shot Drilling of CFRP/Al Stacks Using Customized Twist Drill. Materials 2022, 15, 1981. [Google Scholar] [CrossRef] [PubMed]
- Moravčíková, J.; Moravčík, R.; Palcut, M. Effect of Heat Treatment on the Resulting Dimensional Characteristics of the C45 Carbon Steel after Turning. Metals 2022, 12, 1899. [Google Scholar] [CrossRef]
- Amini, K.; Araghi, A.; Akhbarizadeh, A. Effect of deep cryogenic heat treatment on the wear behavior of carburized DIN 1.7131 grade steel. Acta Metall. Sin. (Engl. Lett.) 2015, 28, 348–353. [Google Scholar] [CrossRef]
- Gunnberg, F.; Escursell, M.; Jacobson, M. The influence of cutting parameters on residual stresses and surface topography during hard turning of 18MnCr5 case carburised steel. J. Mater. Process. Technol. 2006, 174, 82–90. [Google Scholar] [CrossRef]
- Mohan, M.; Arul, S. Effect of Cryogenic Treatment on the Mechanical Properties of Alloy Steel 16MnCr5. Mater. Today Proc. 2018, 5 Pt 3, 25265–25275. [Google Scholar] [CrossRef]
- Dean, A.; Voss, D.; Graguljic, D. Design and Analysis of Experiments, 2nd ed.; Springer: Cham, Switzerland, 2017; 847p. [Google Scholar] [CrossRef]
- Box, G.E.P.; Wilson, K.B. On the experimental attainment of optimum conditions. J. R. Stat. Soc. Ser. B 1951, 13, 1–45. [Google Scholar] [CrossRef]
- Beňo, J. Theory of Metal Cutting. In Teória Obrábania; Vienala: Košice, Slovakia, 1999; 255p, ISBN 80-7099-429-0. [Google Scholar]
- Vagaská, A.; Gombár, M. Comparison of usage of different neural structures to predict AAO layer thickness. Teh. Vjesn. 2017, 24, 333–339. [Google Scholar] [CrossRef]
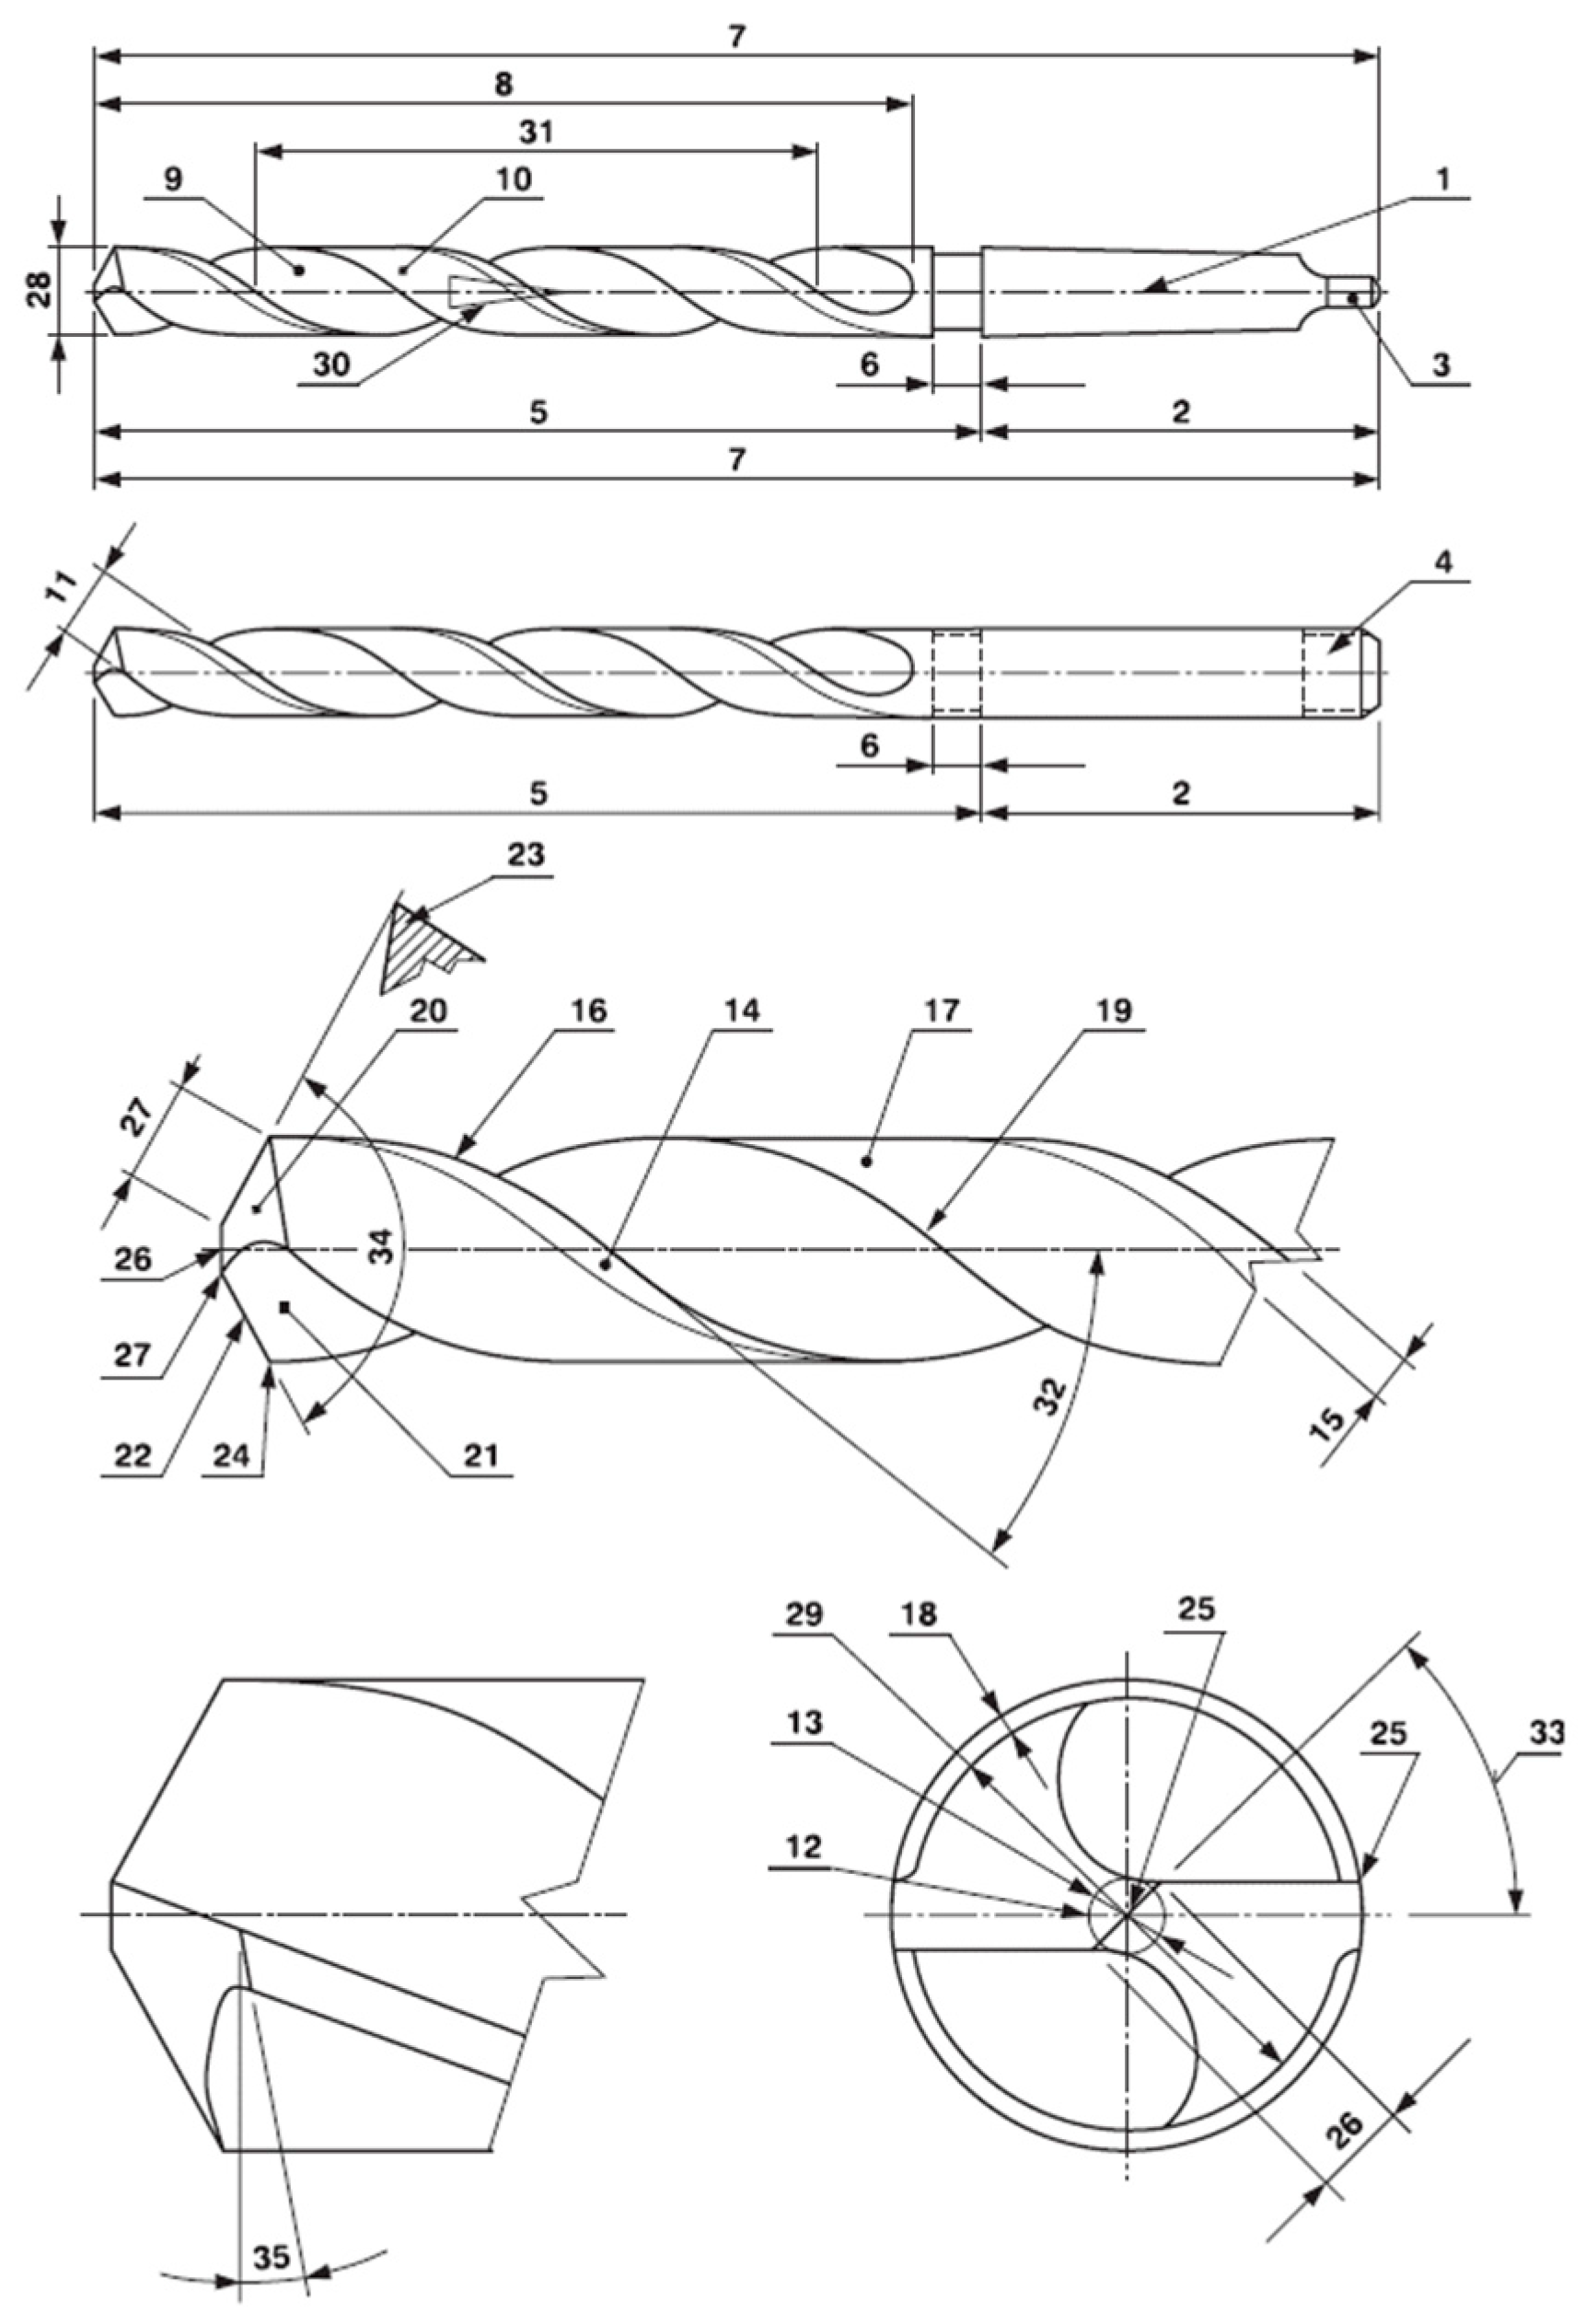
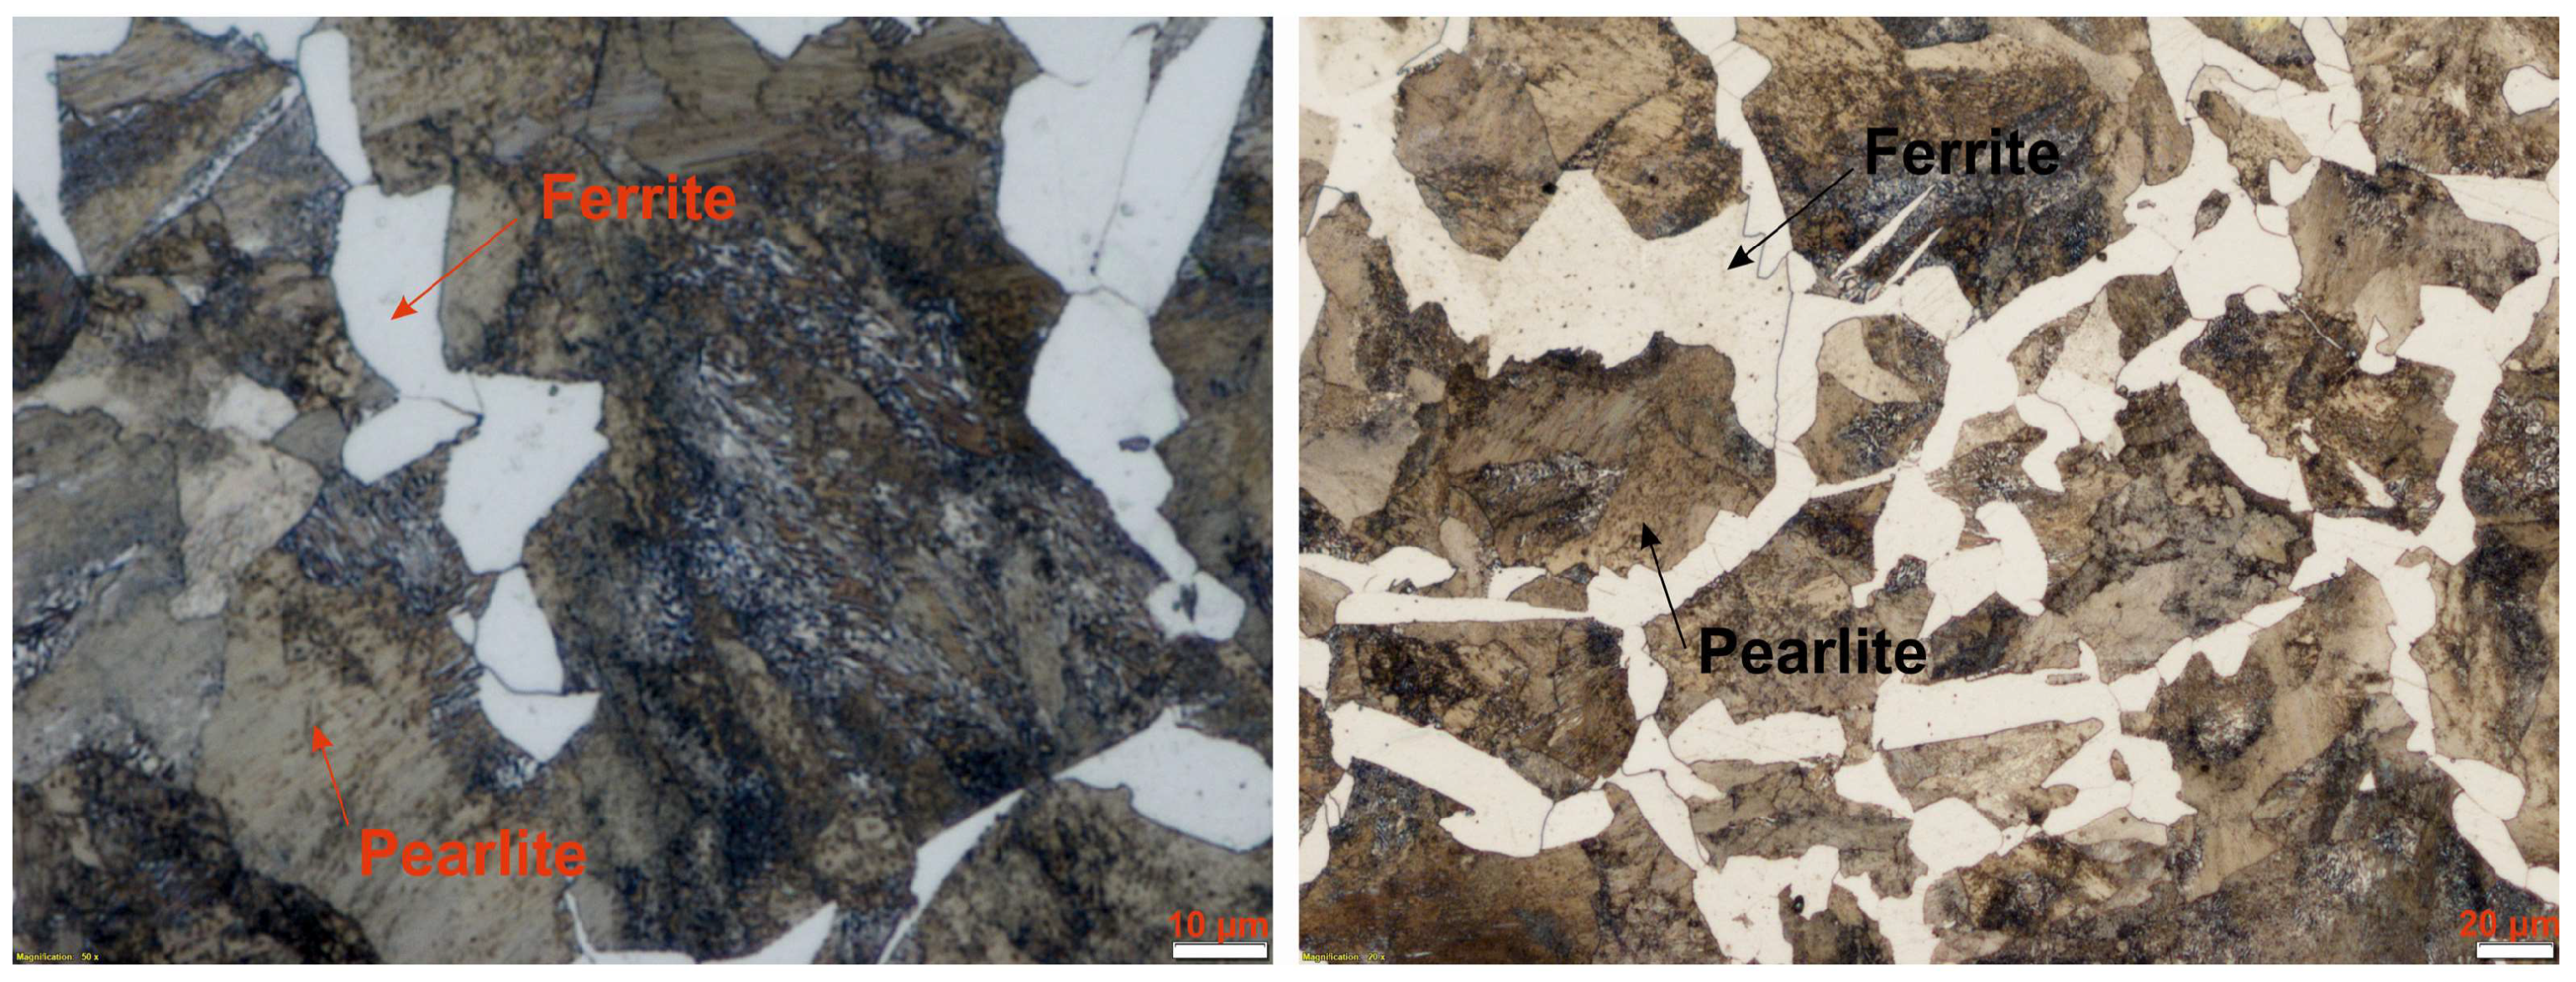
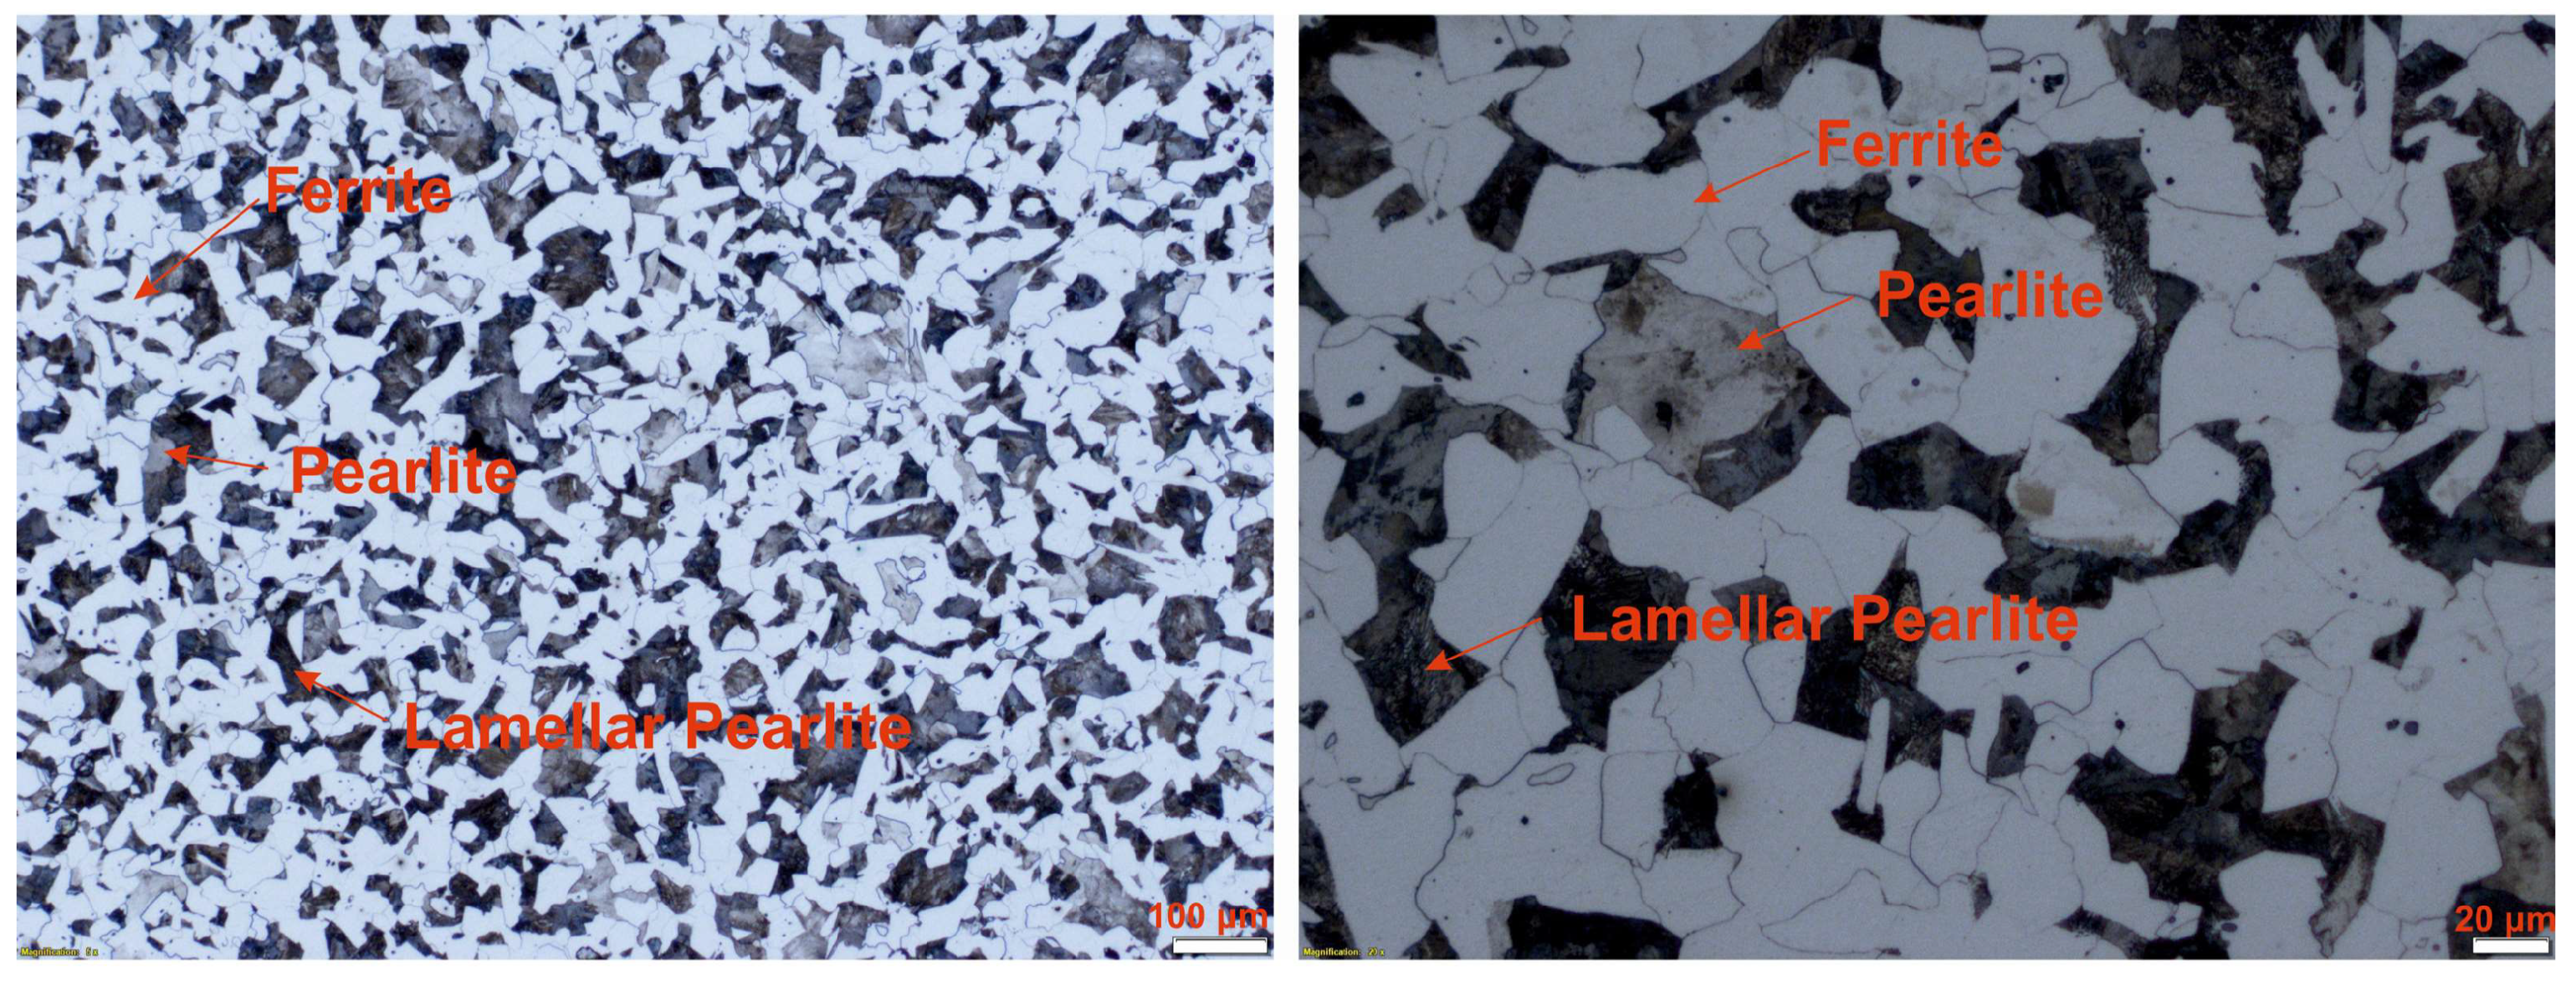

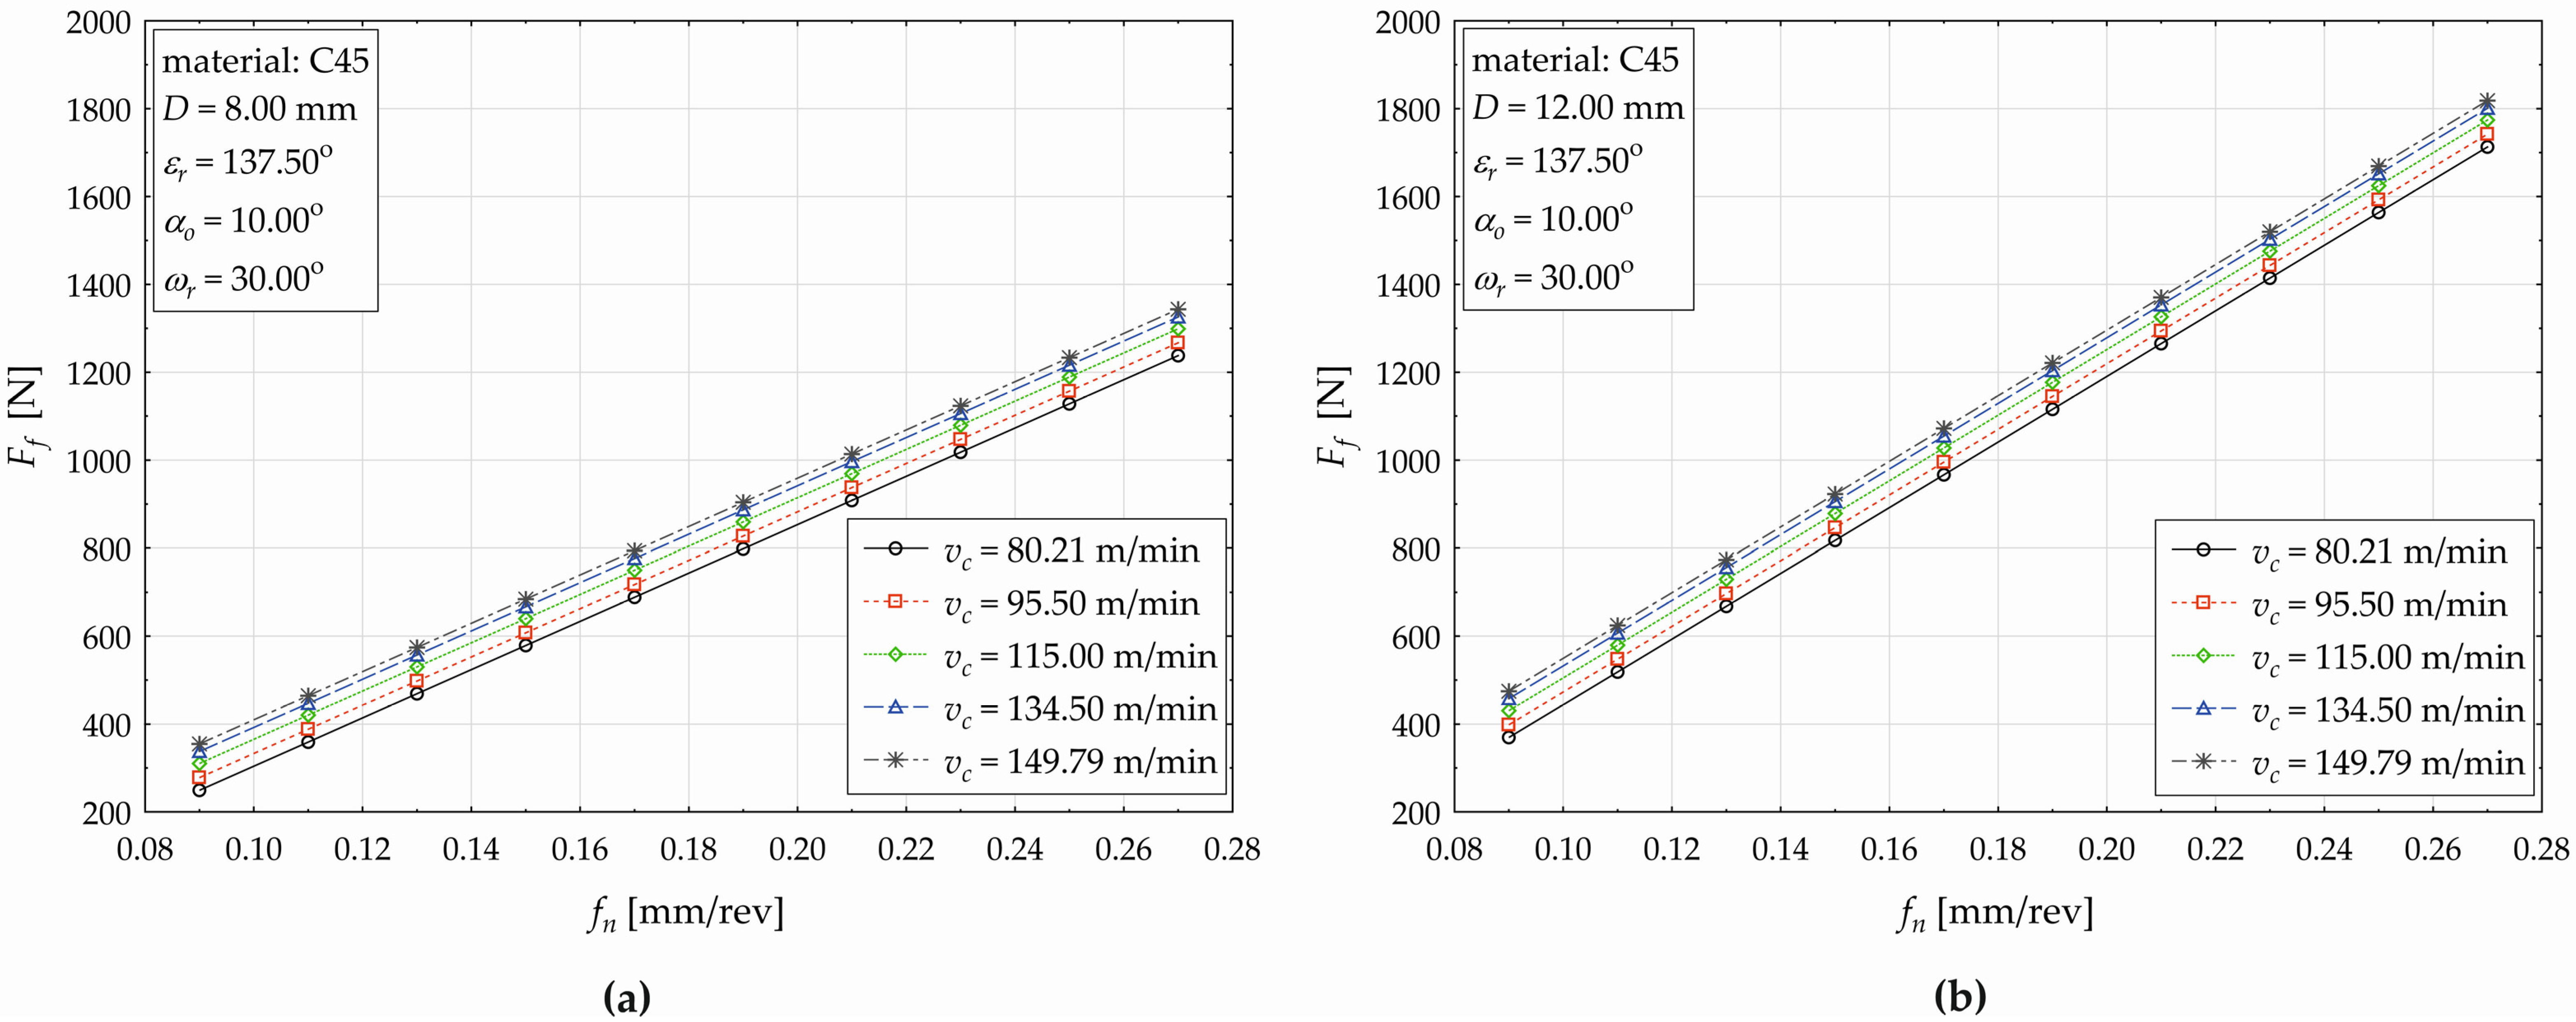
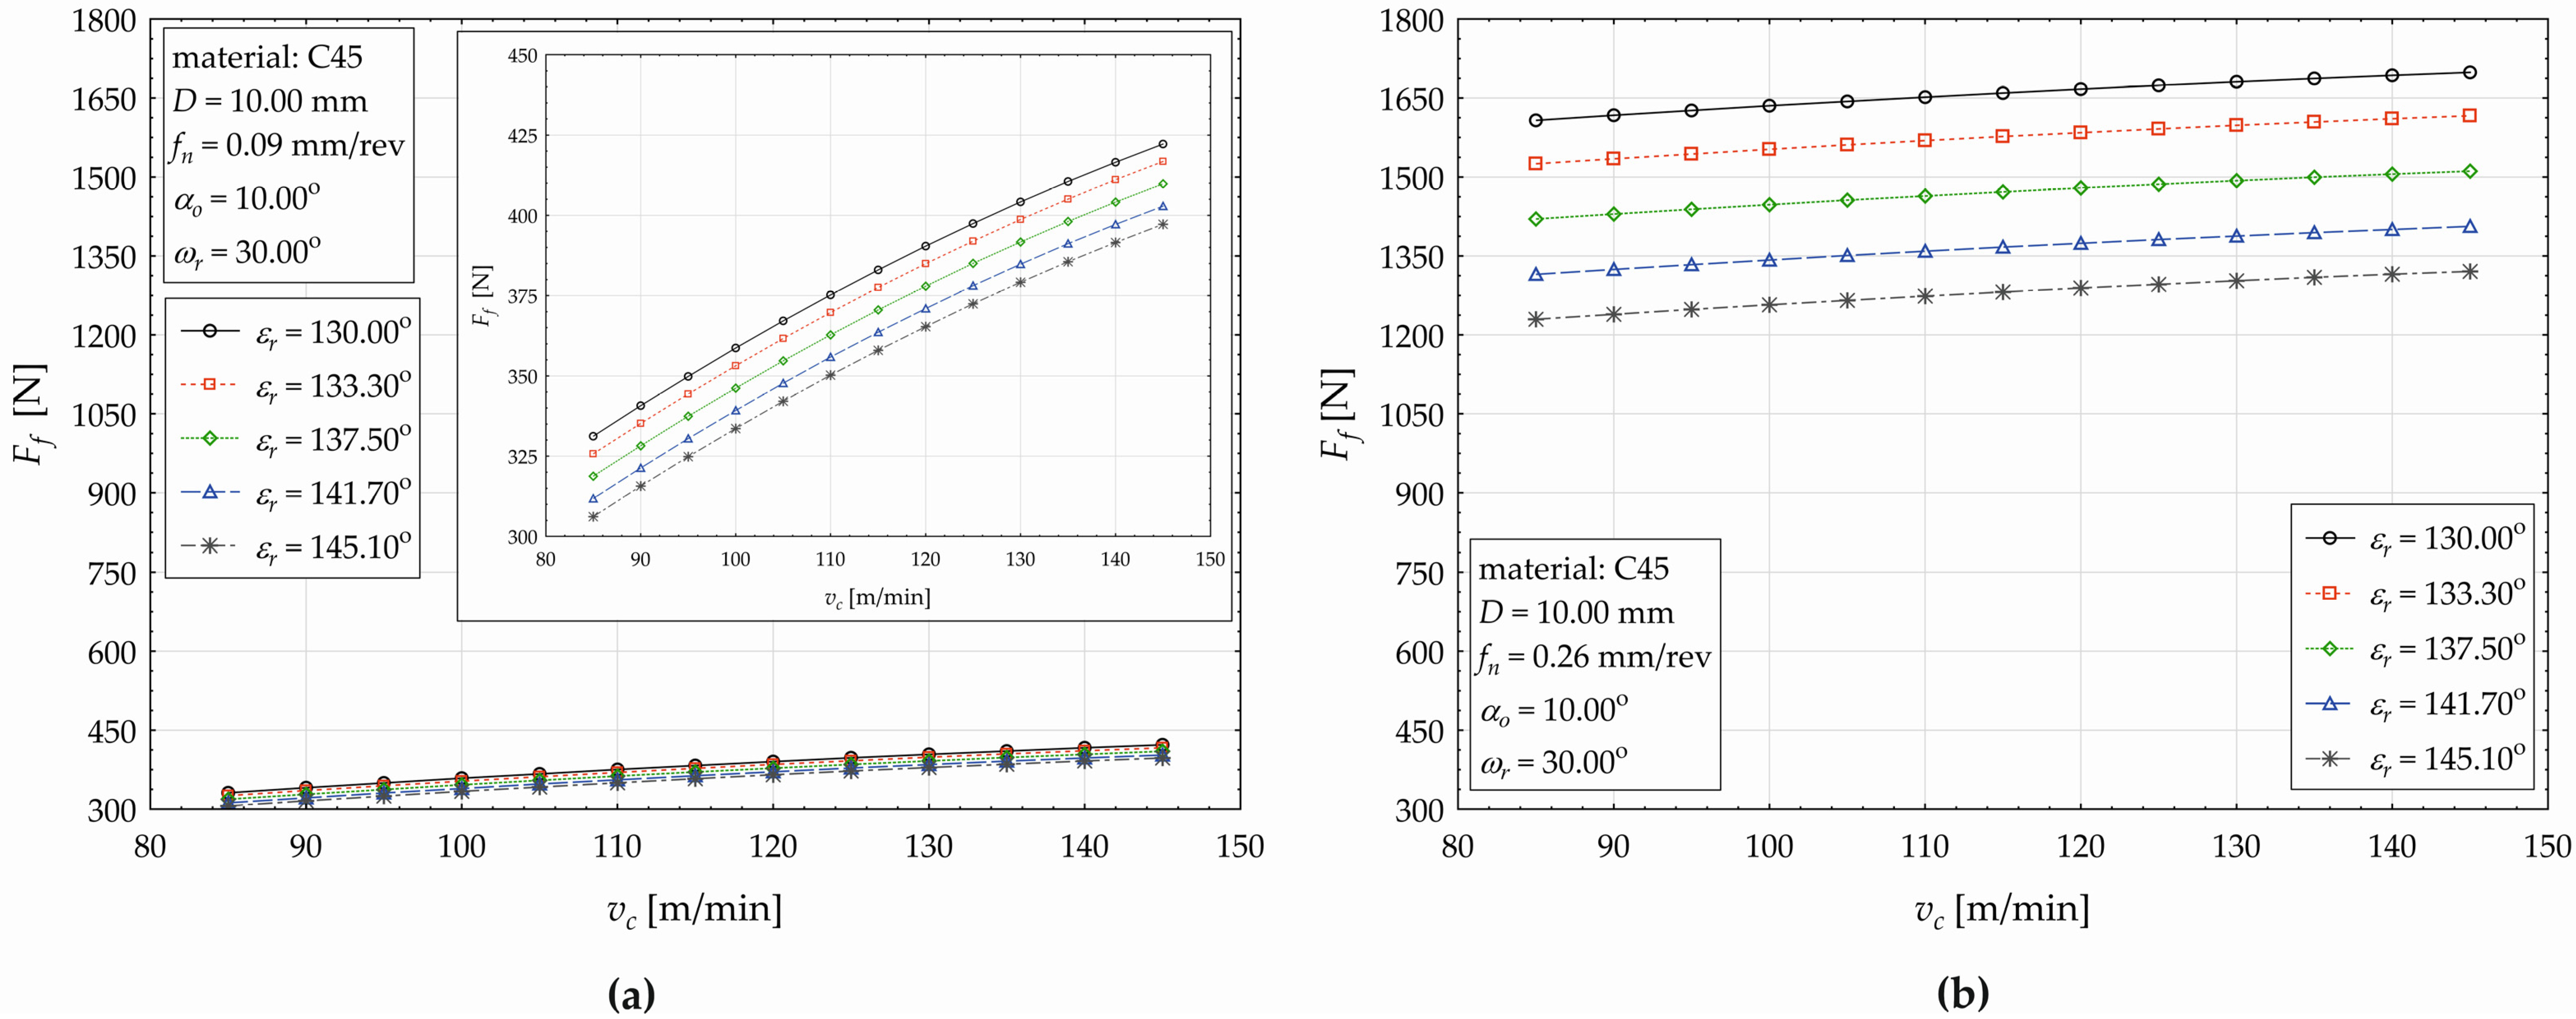
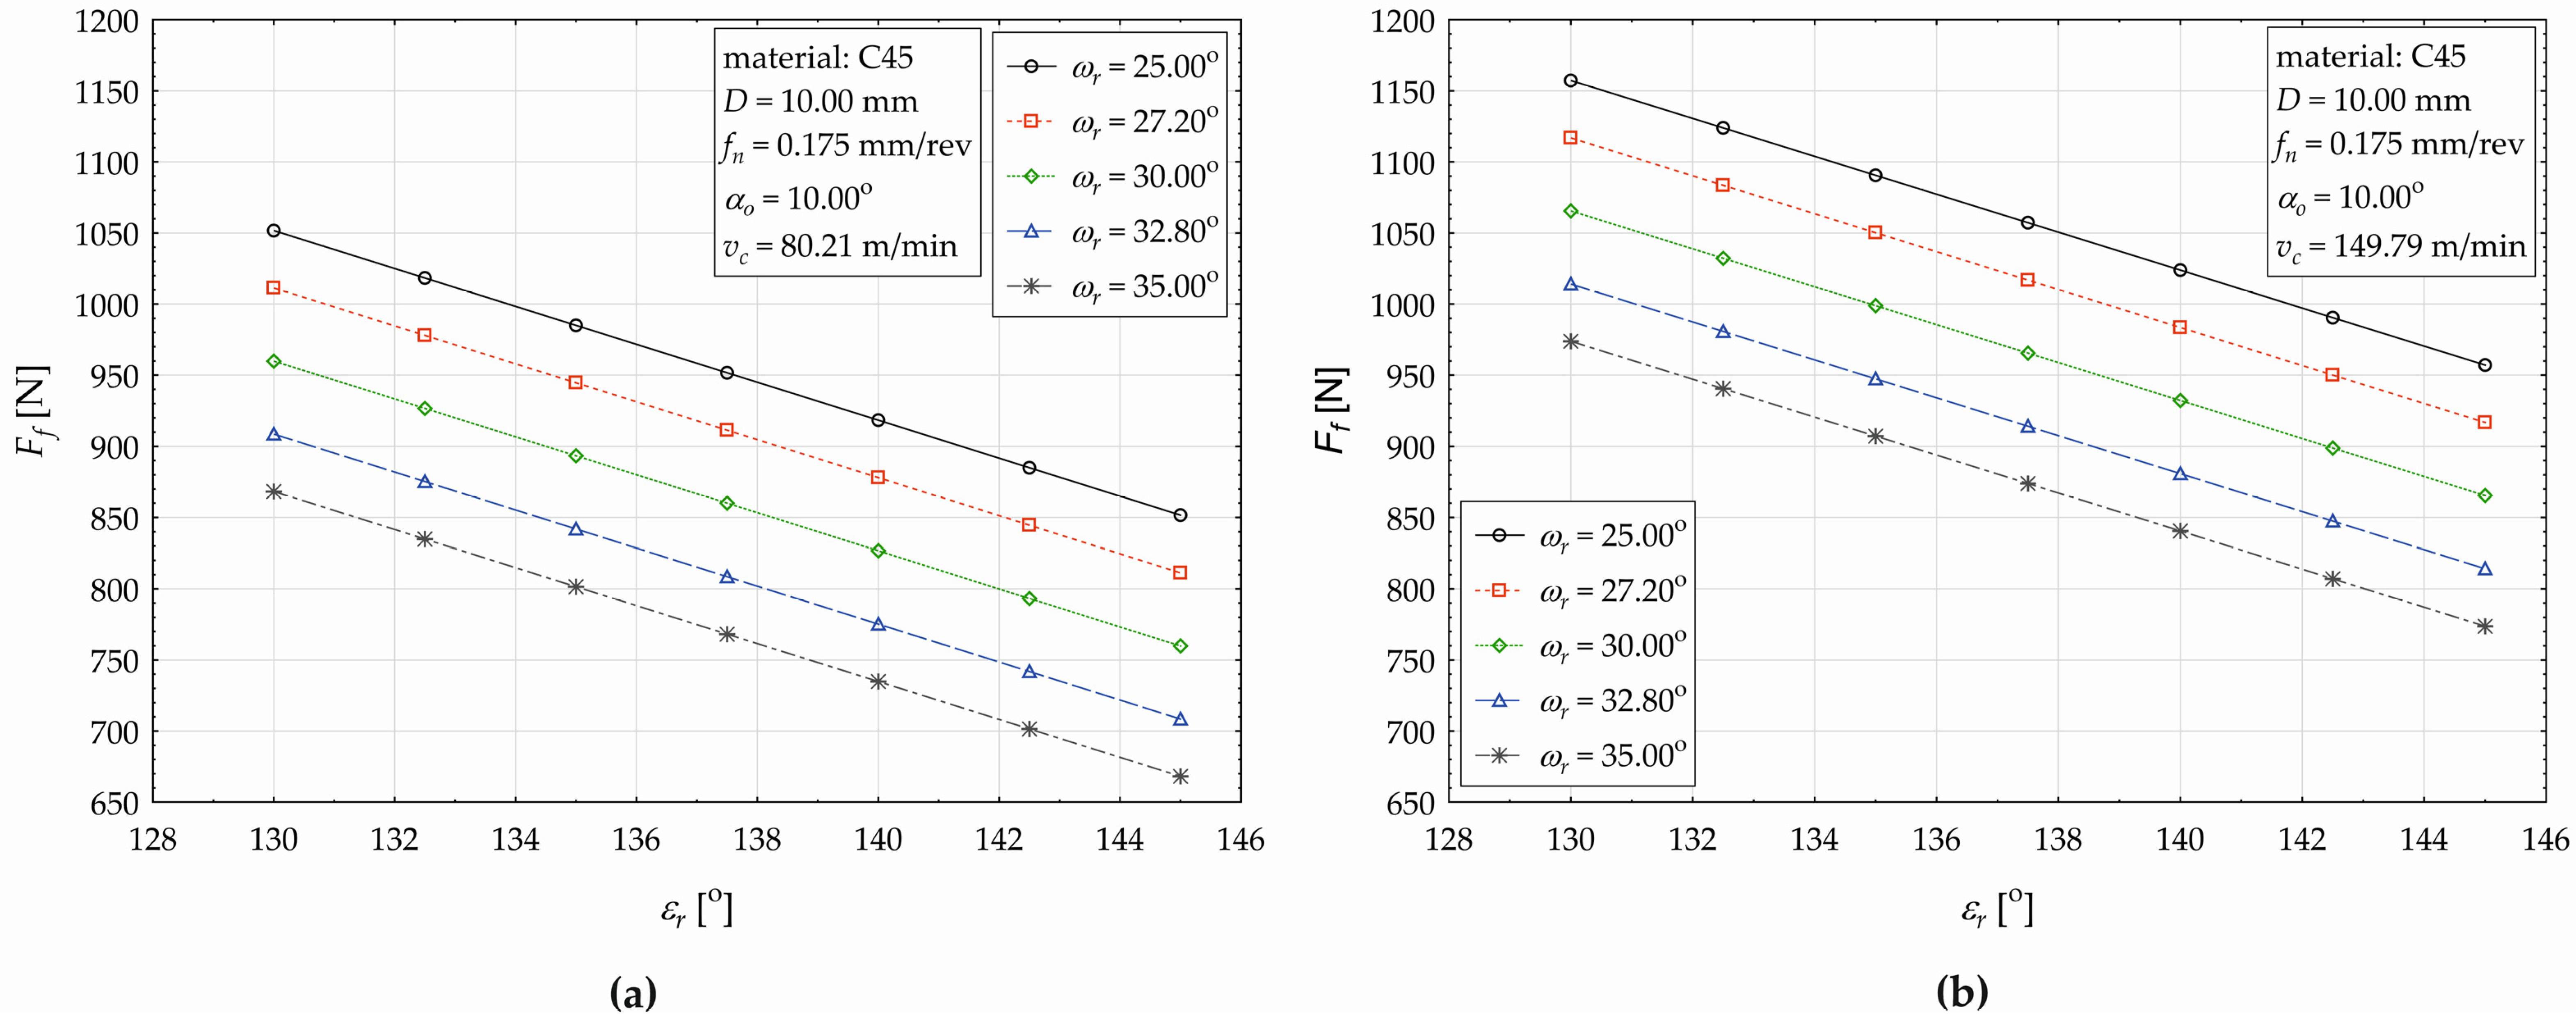
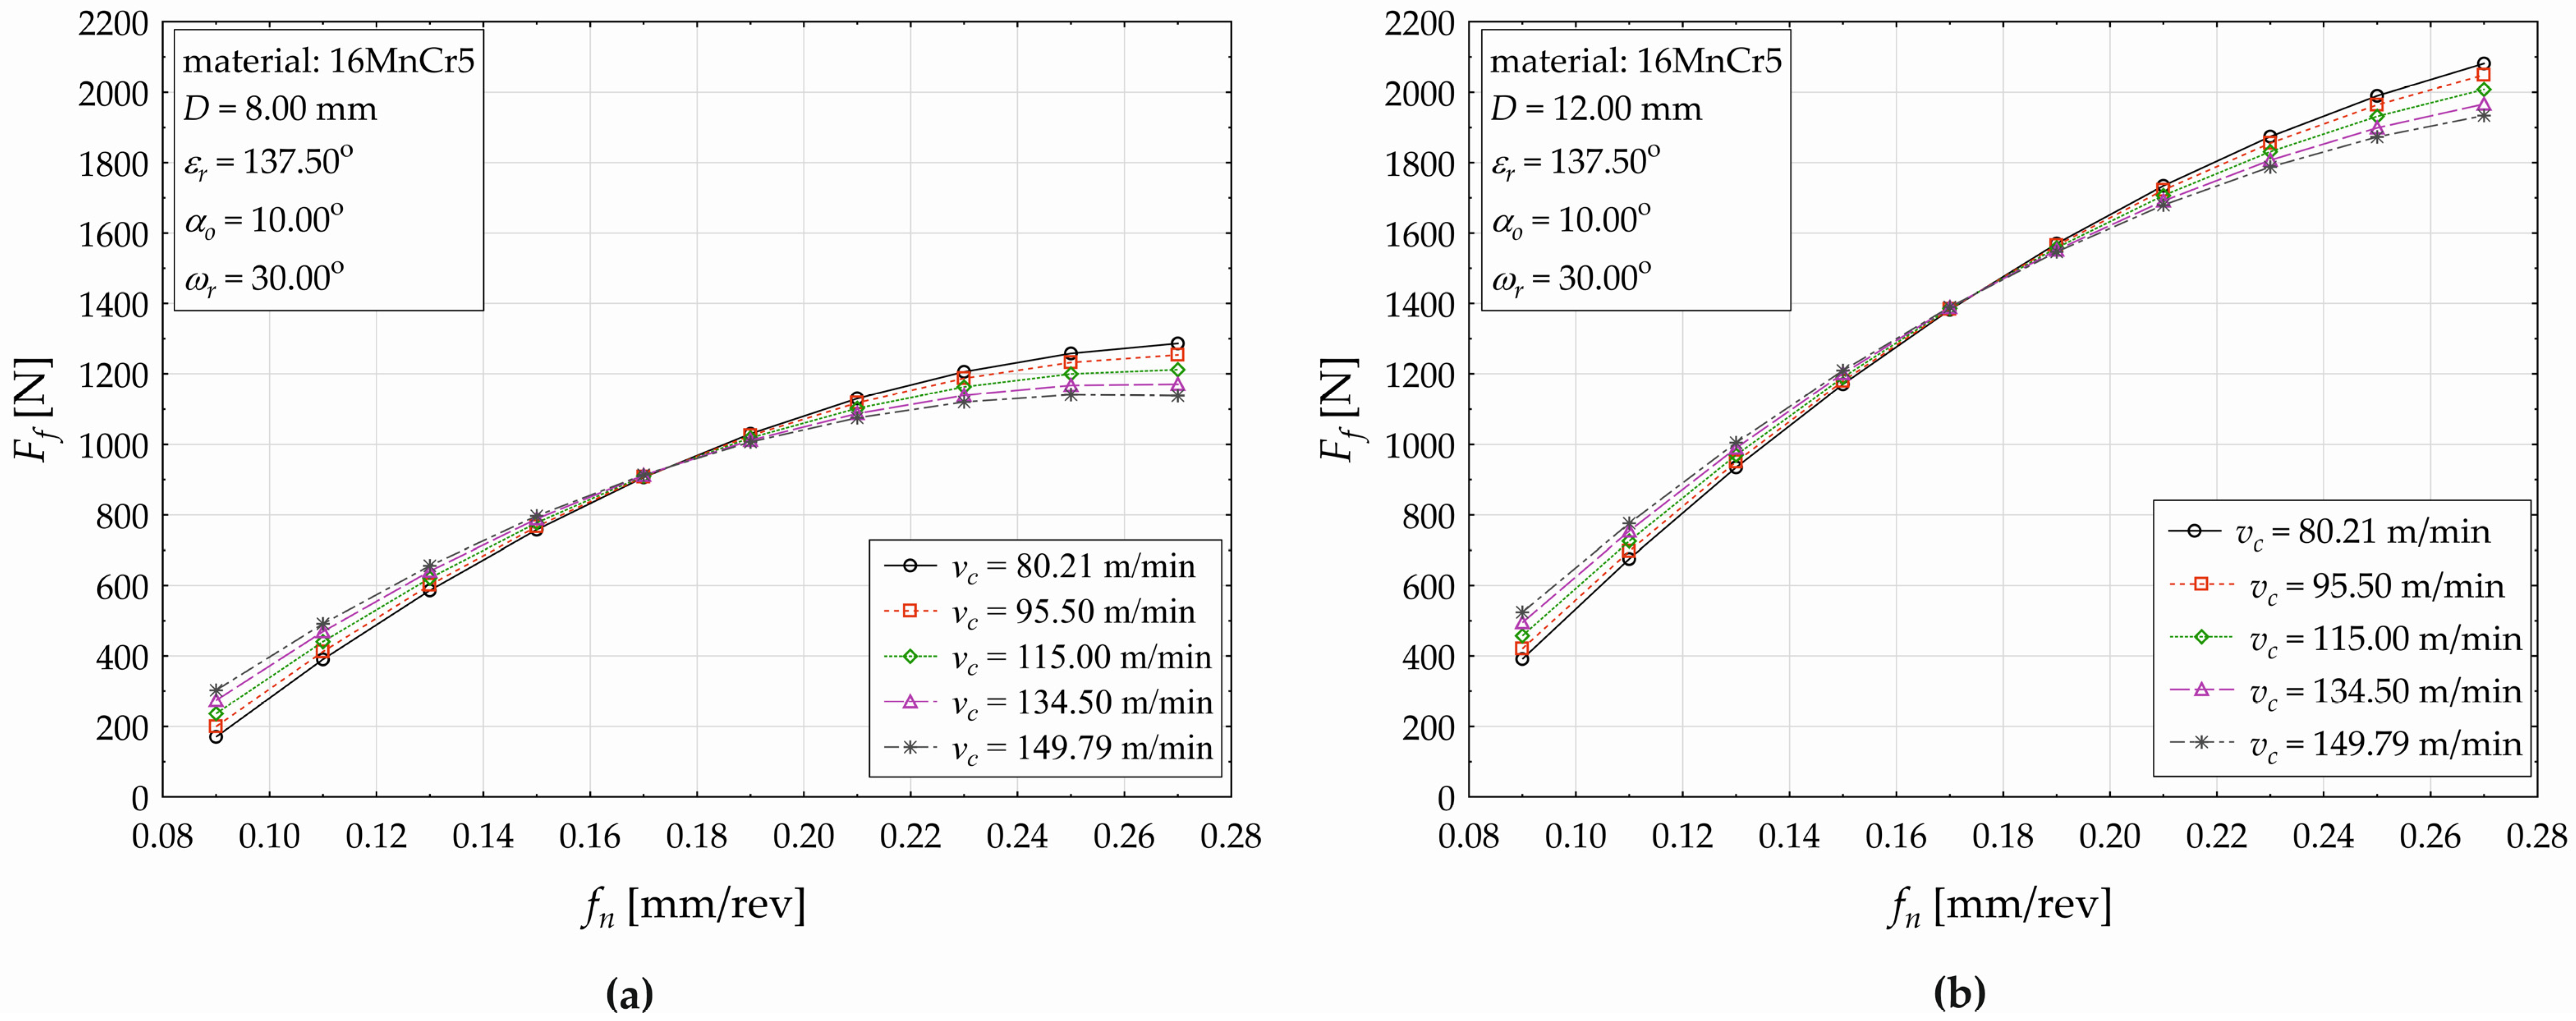
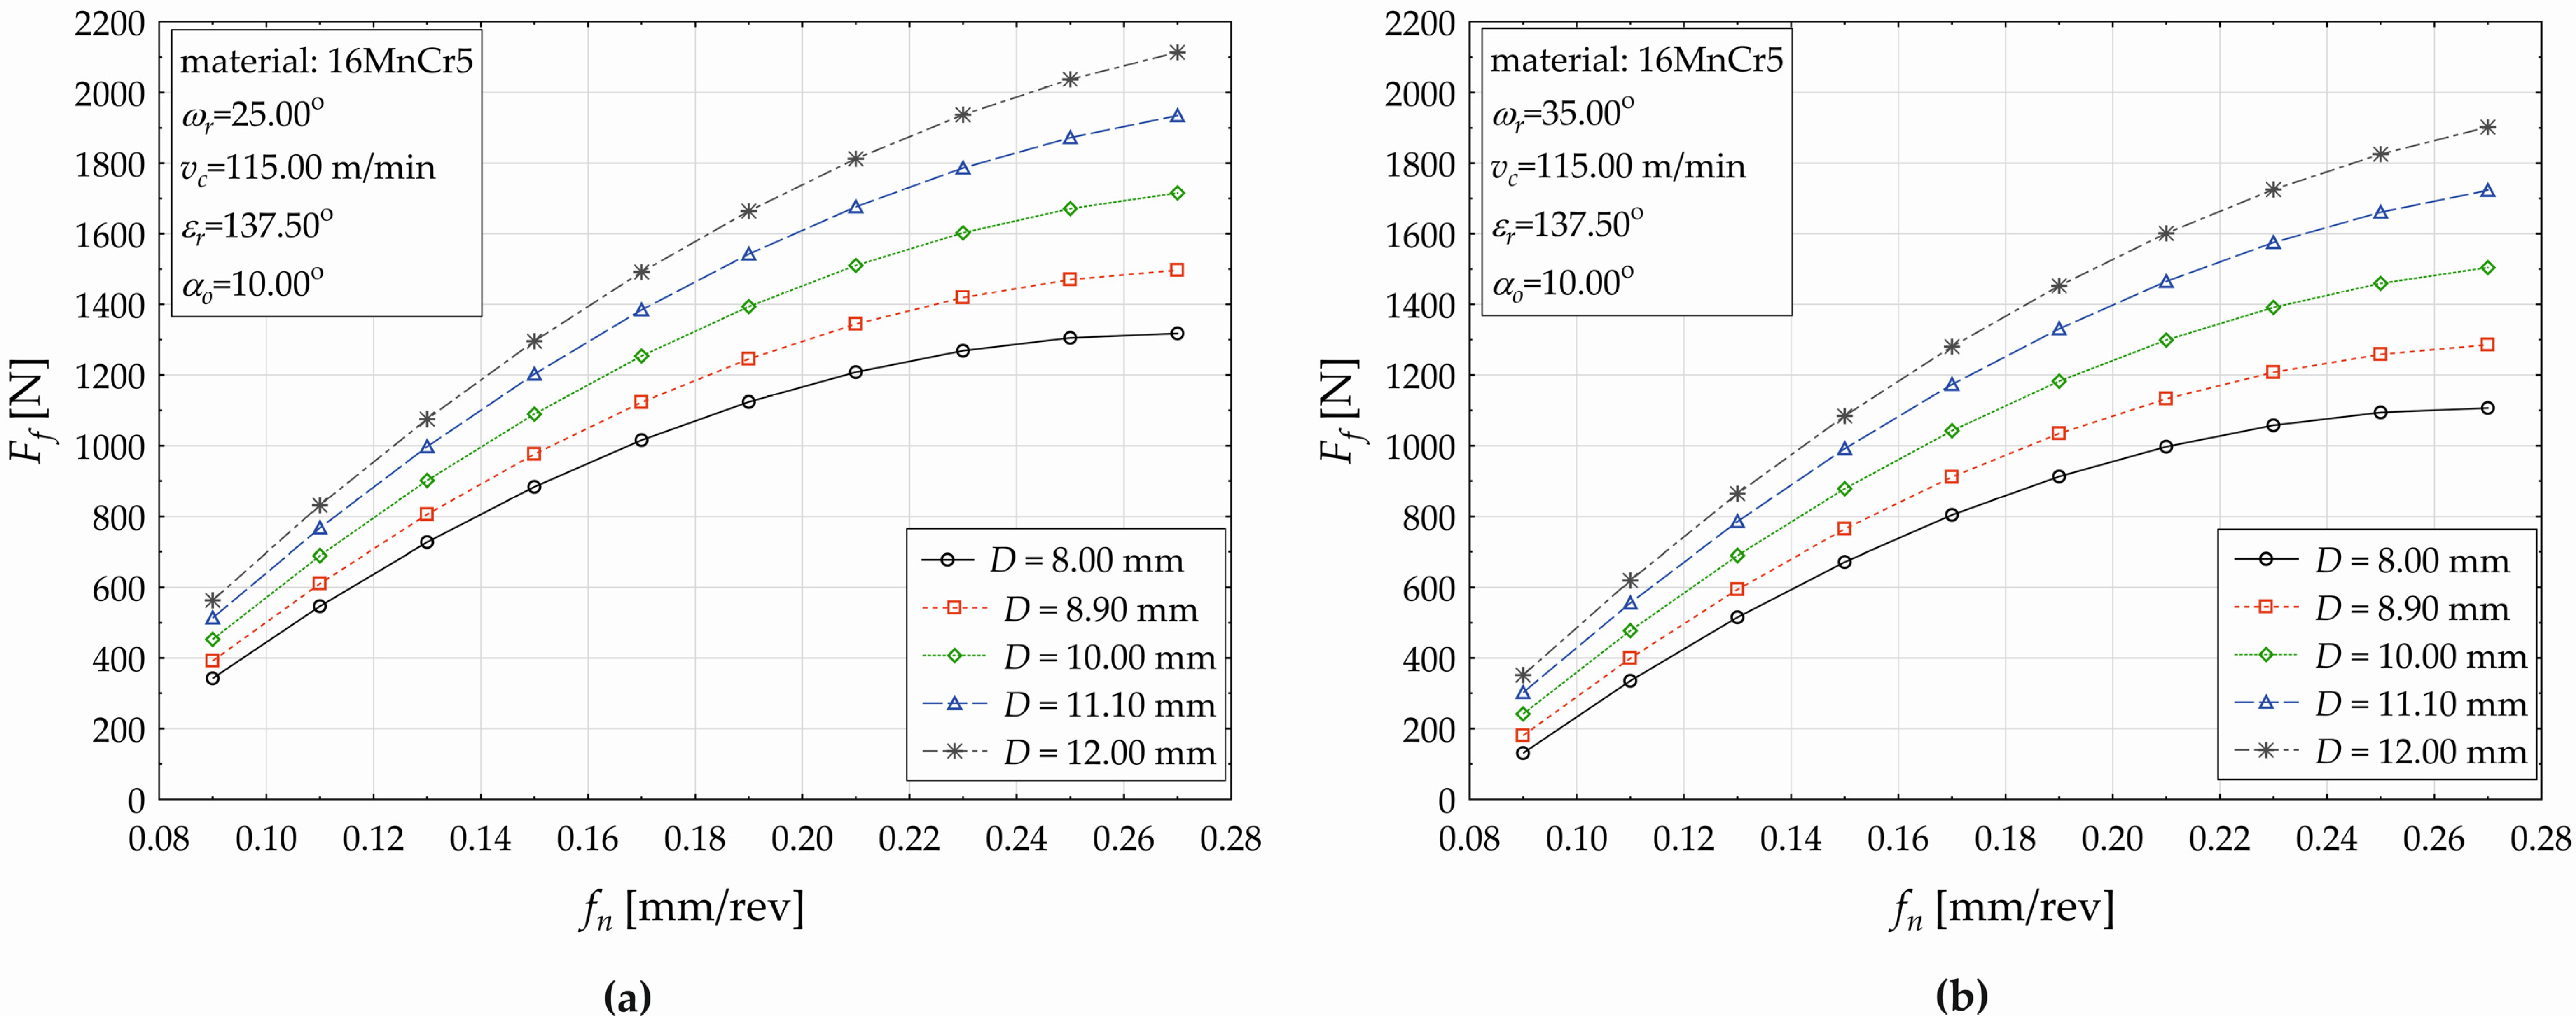
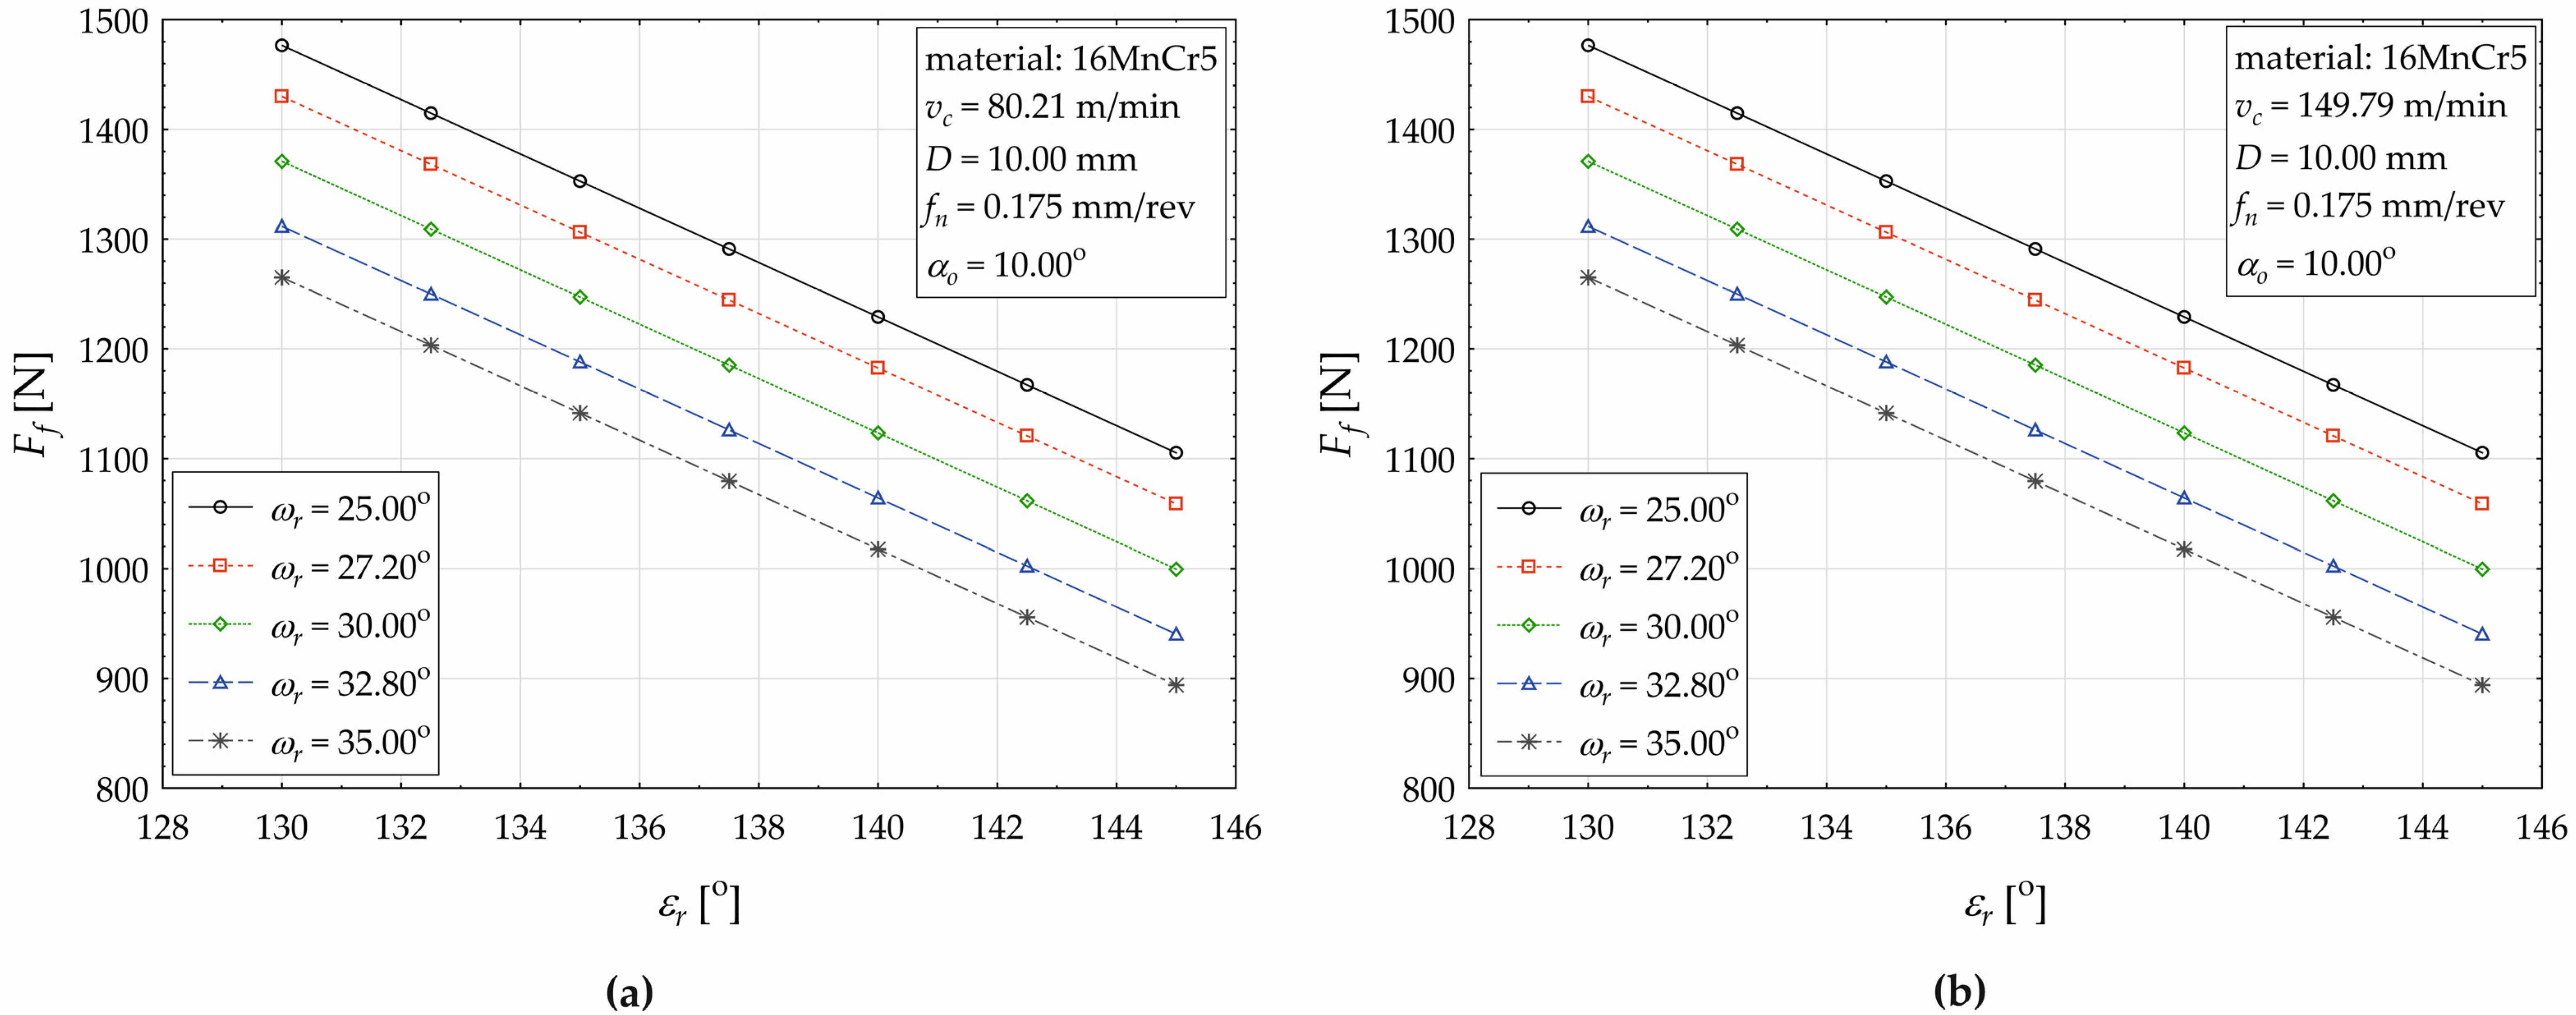
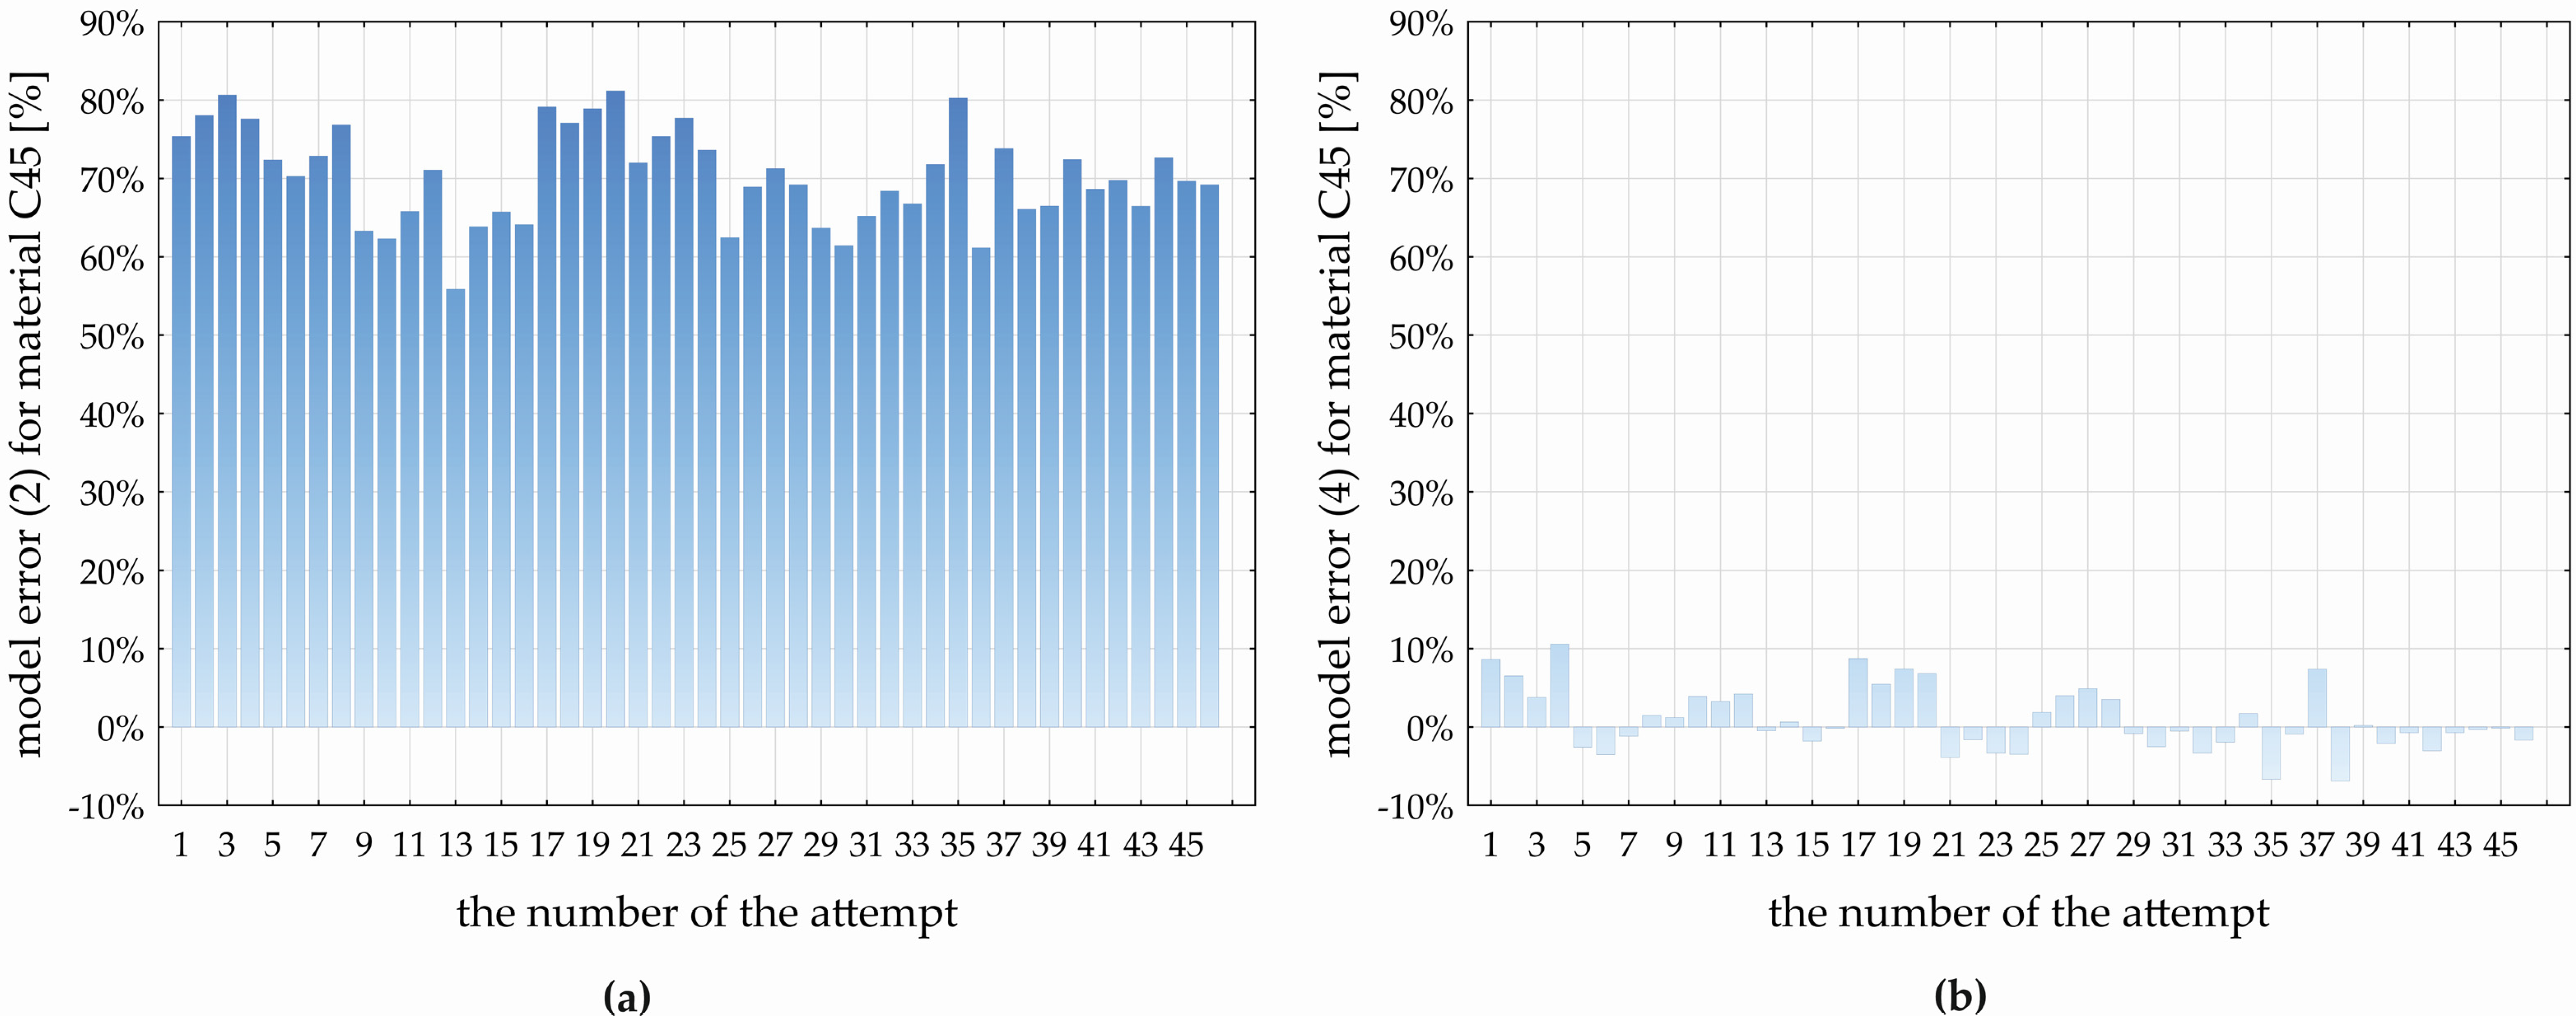
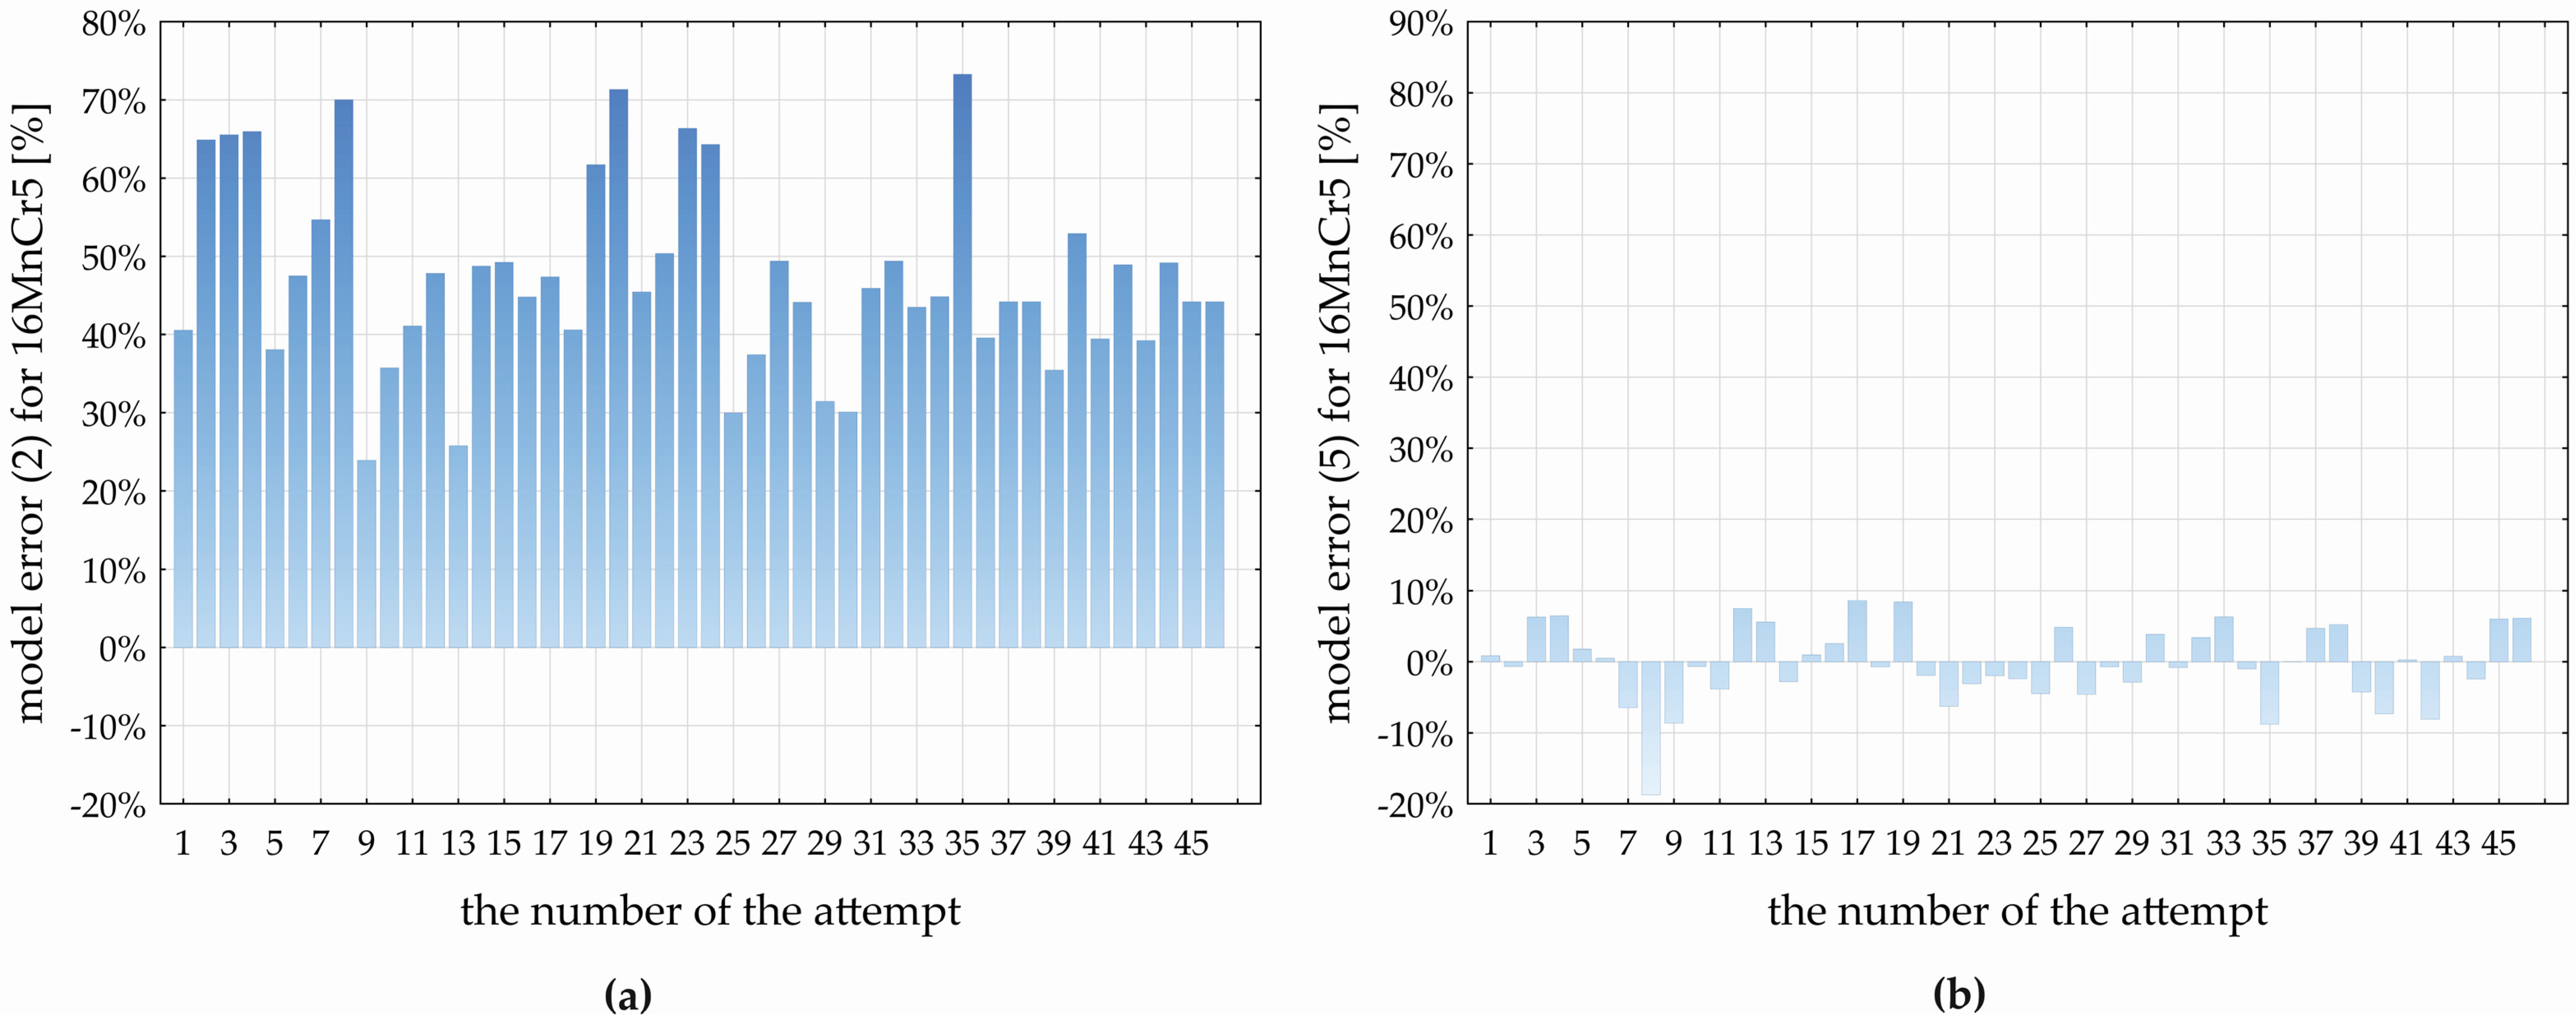
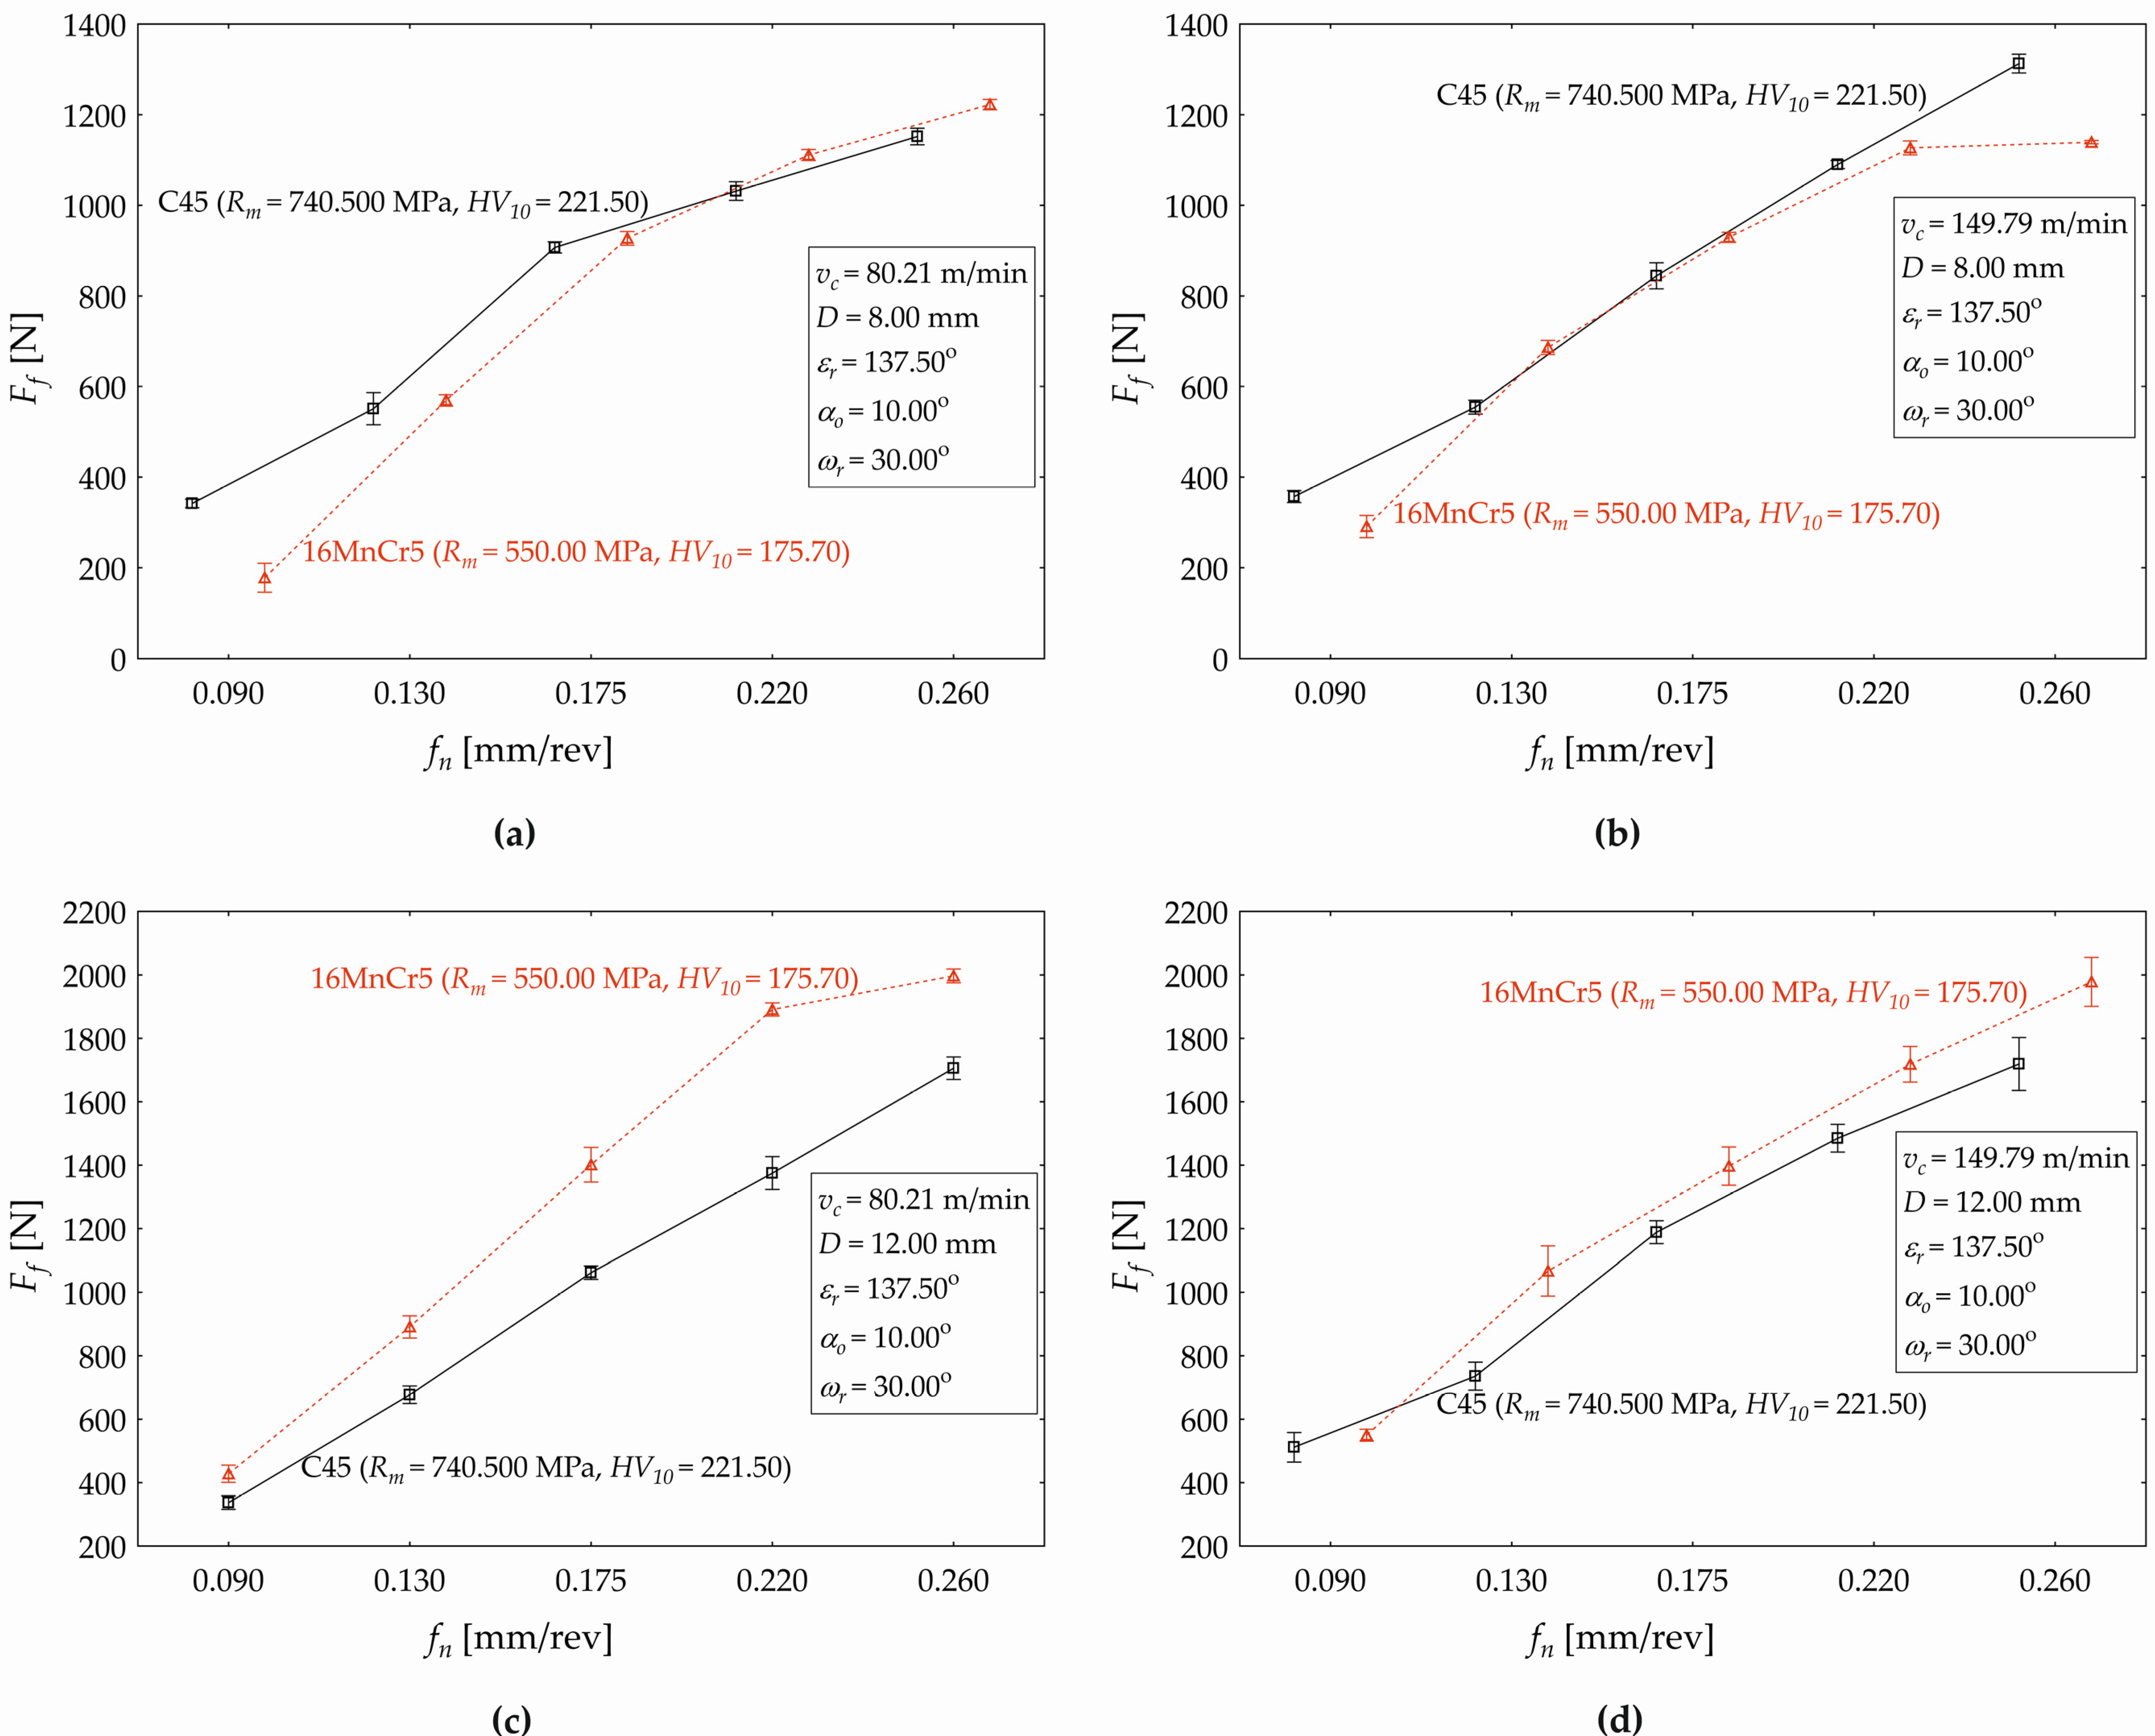
Disclaimer/Publisher’s Note: The statements, opinions and data contained in all publications are solely those of the individual author(s) and contributor(s) and not of MDPI and/or the editor(s). MDPI and/or the editor(s) disclaim responsibility for any injury to people or property resulting from any ideas, methods, instructions or products referred to in the content. |
© 2024 by the authors. Licensee MDPI, Basel, Switzerland. This article is an open access article distributed under the terms and conditions of the Creative Commons Attribution (CC BY) license (https://creativecommons.org/licenses/by/4.0/).