


Study on the Influence of Calcination Temperature of Iron Vitriol on the Coloration of Ancient Chinese Traditional Iron Red Overglaze Color

 , , ,
, , ,
Abstract
1. Introduction
2. Samples and Methods
2.1. Experimental Sample Processing and Results
2.2. Test Methods
2.2.1. Differential Scanning Calorimetry-Thermogravimetric Analysis (DSC-TG)
2.2.2. Phase Analysis
2.2.3. Microstructure Observations and Chemical Compositions
2.2.4. Colorimetric Analysis
3. Experimental Results
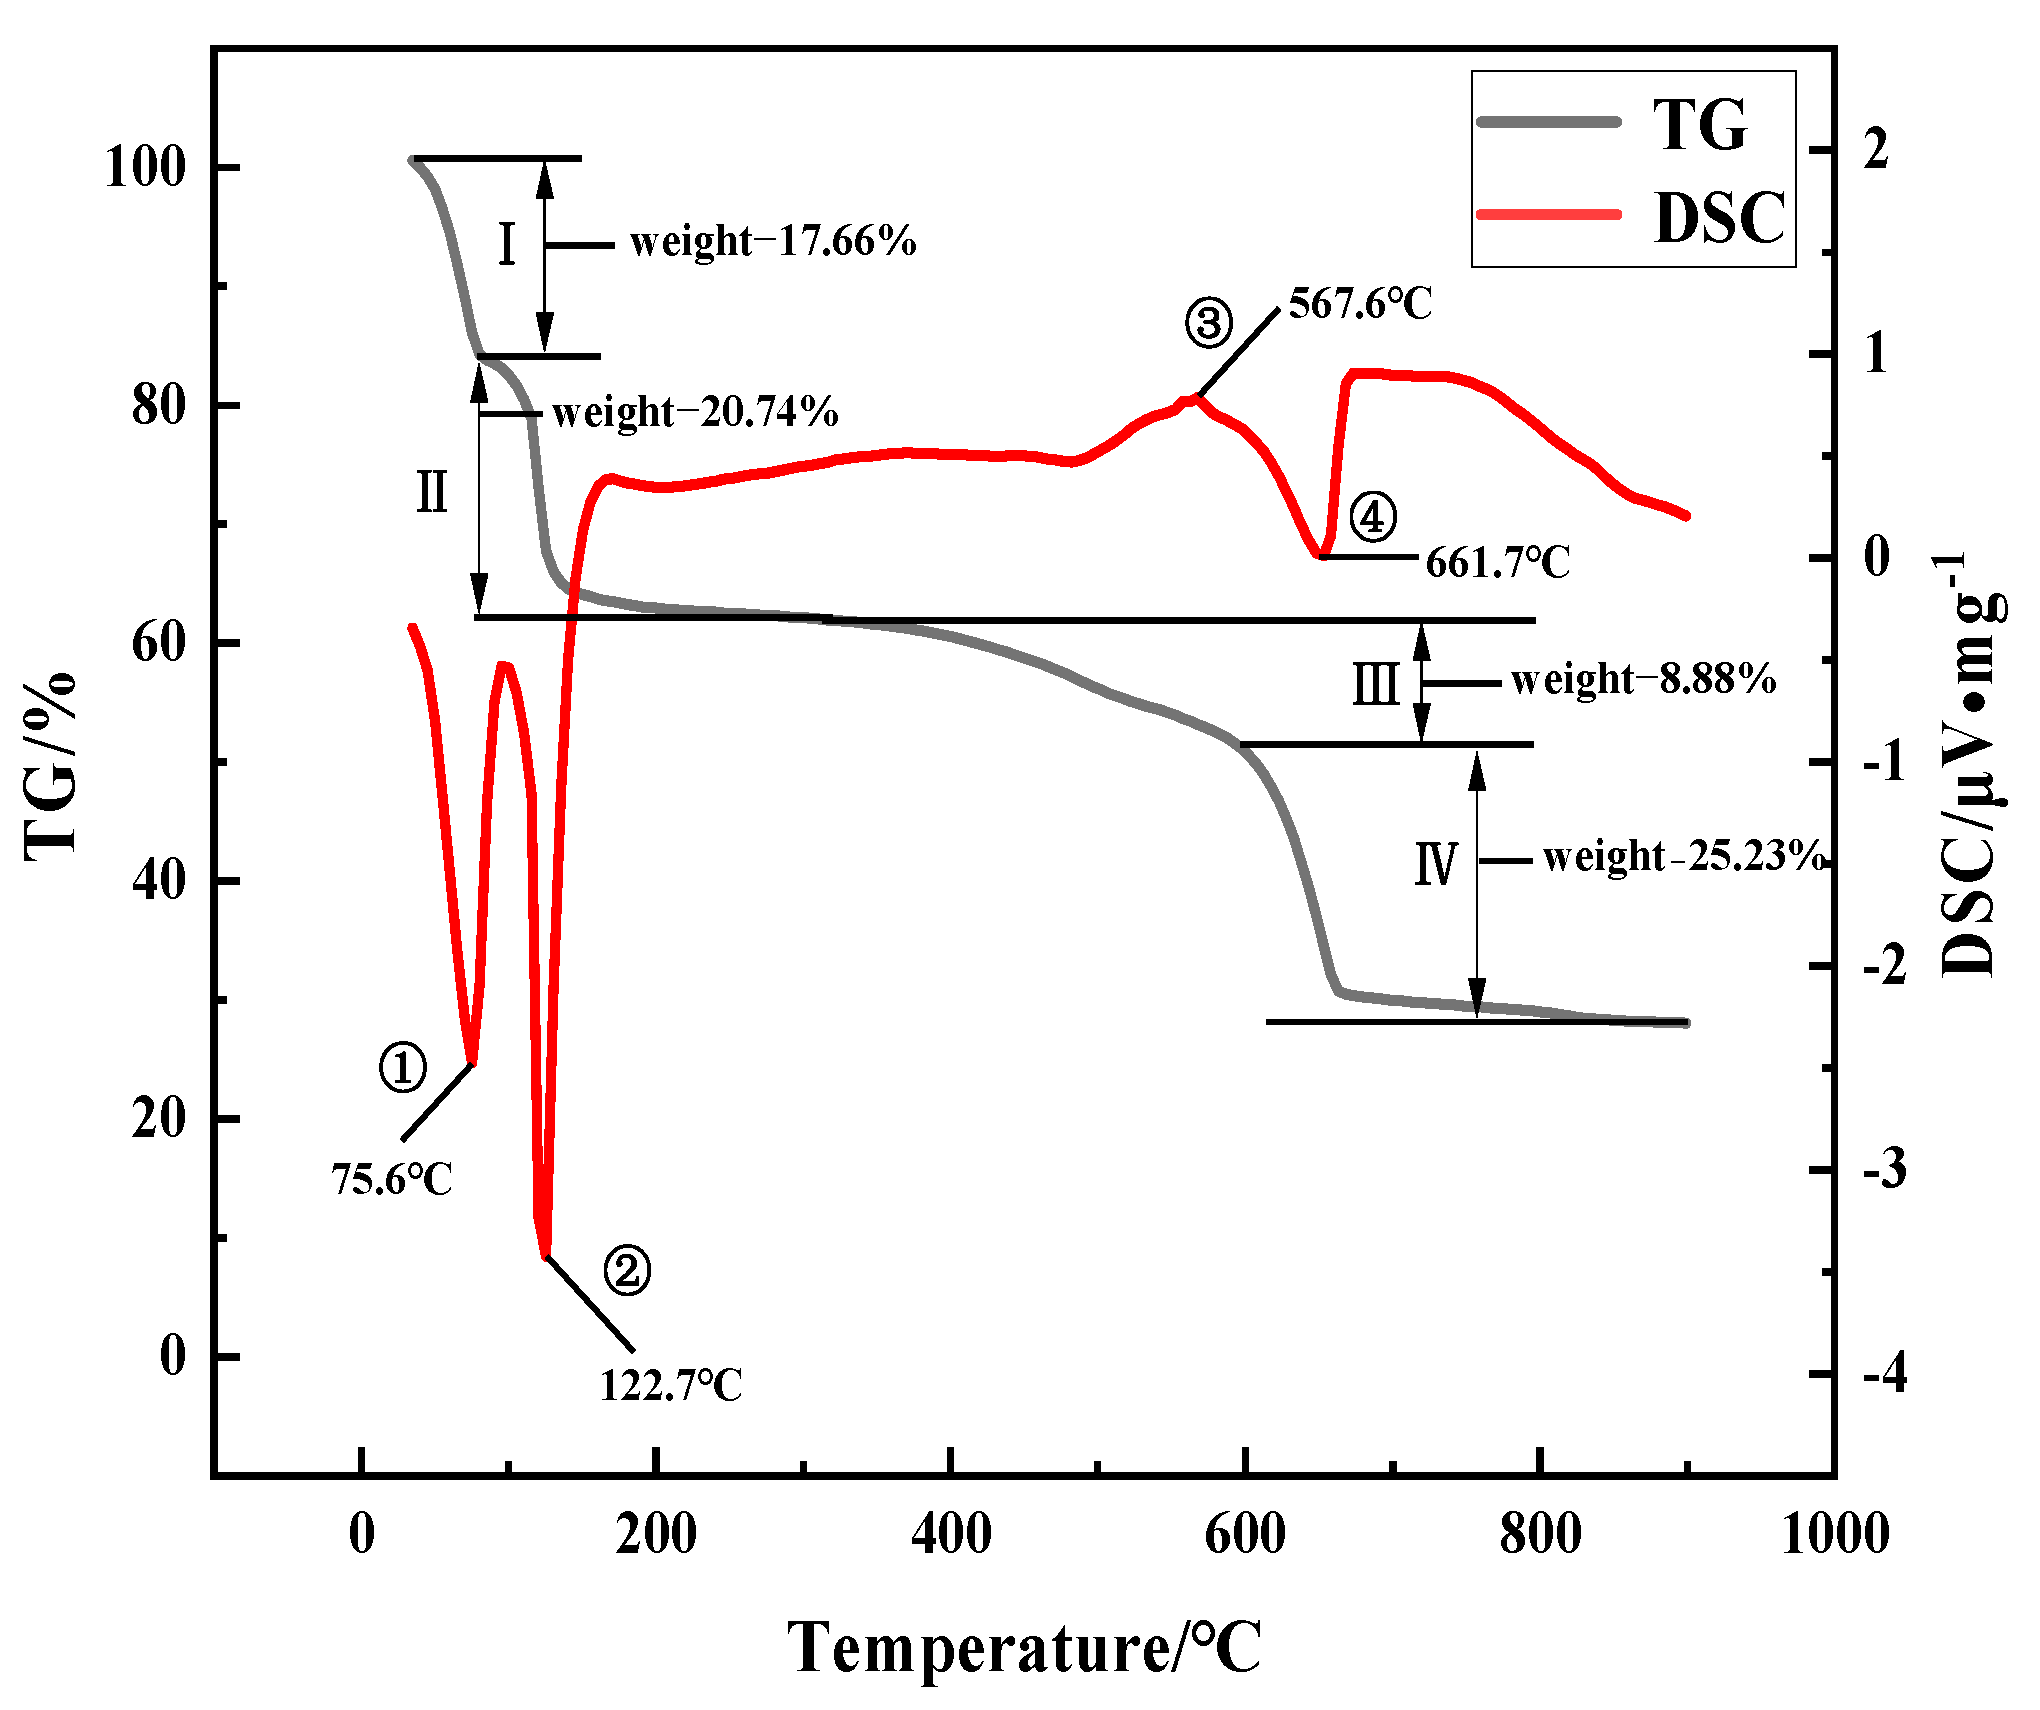
3.1. The Heating Process of Iron Vitriol
3.2. Phase Variations of Iron Vitriol at Different Calcination Temperatures
3.2.1. XRD
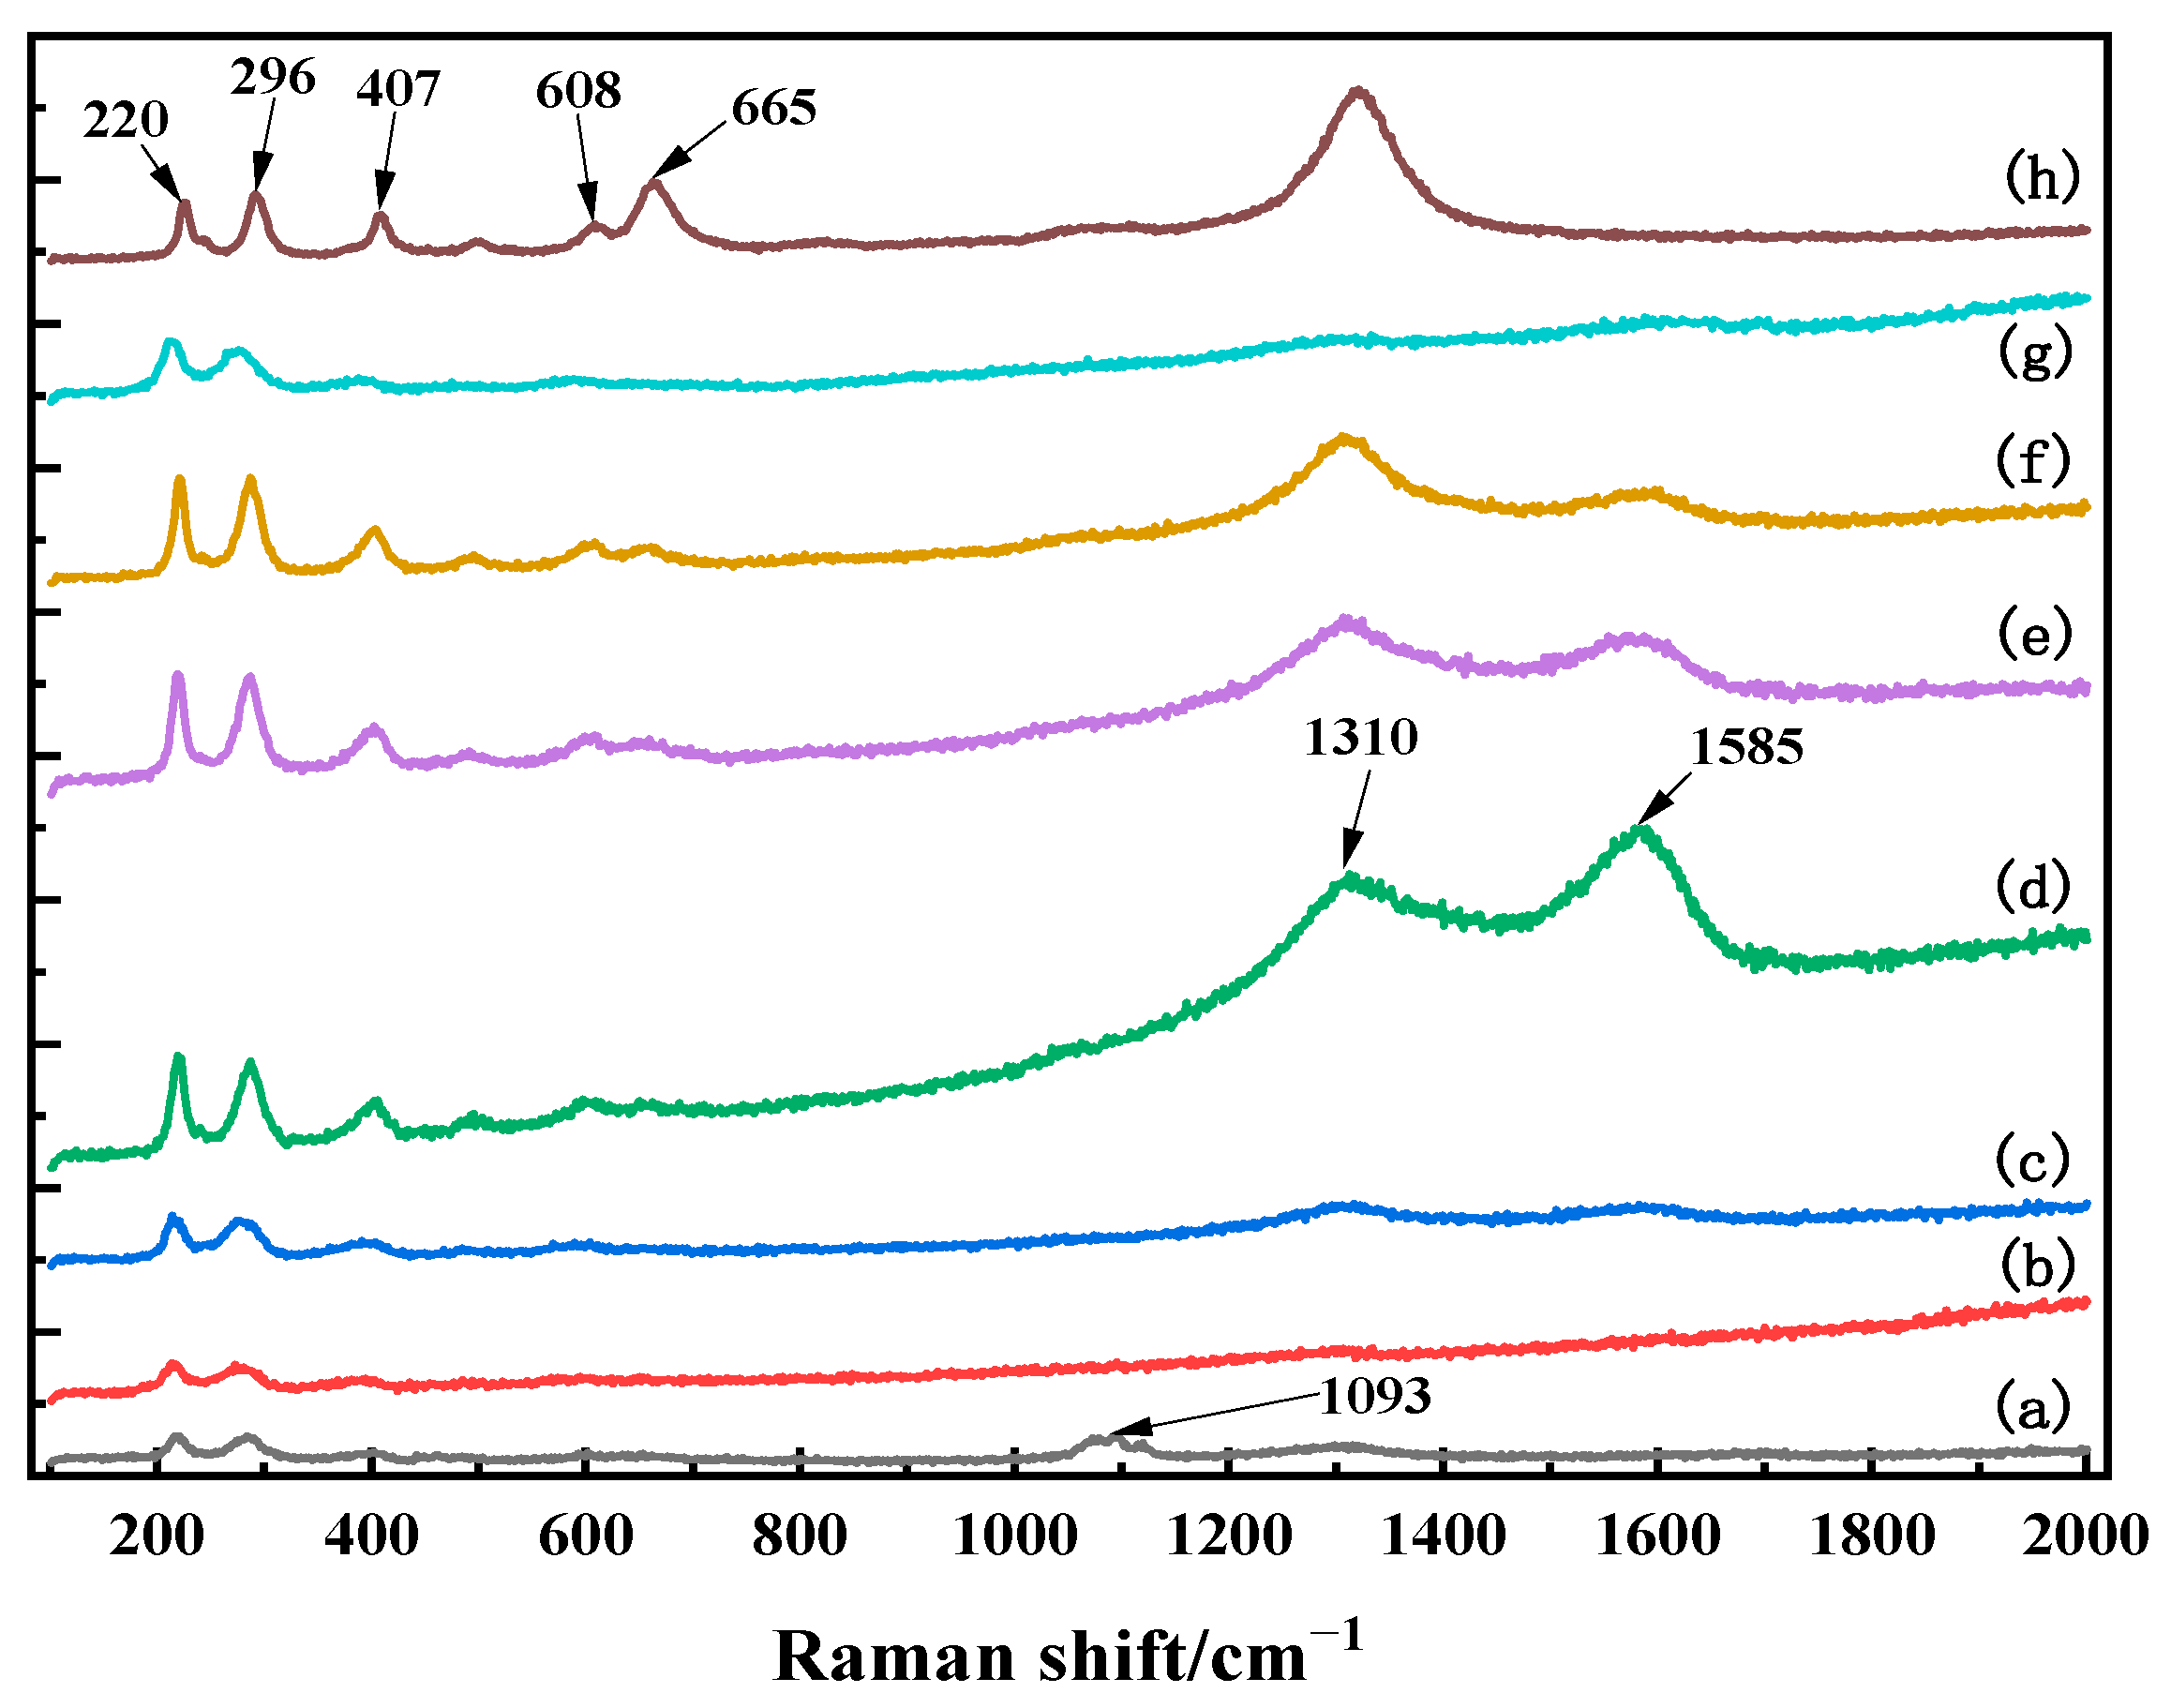
3.2.2. Raman
3.3. The Color of Samples
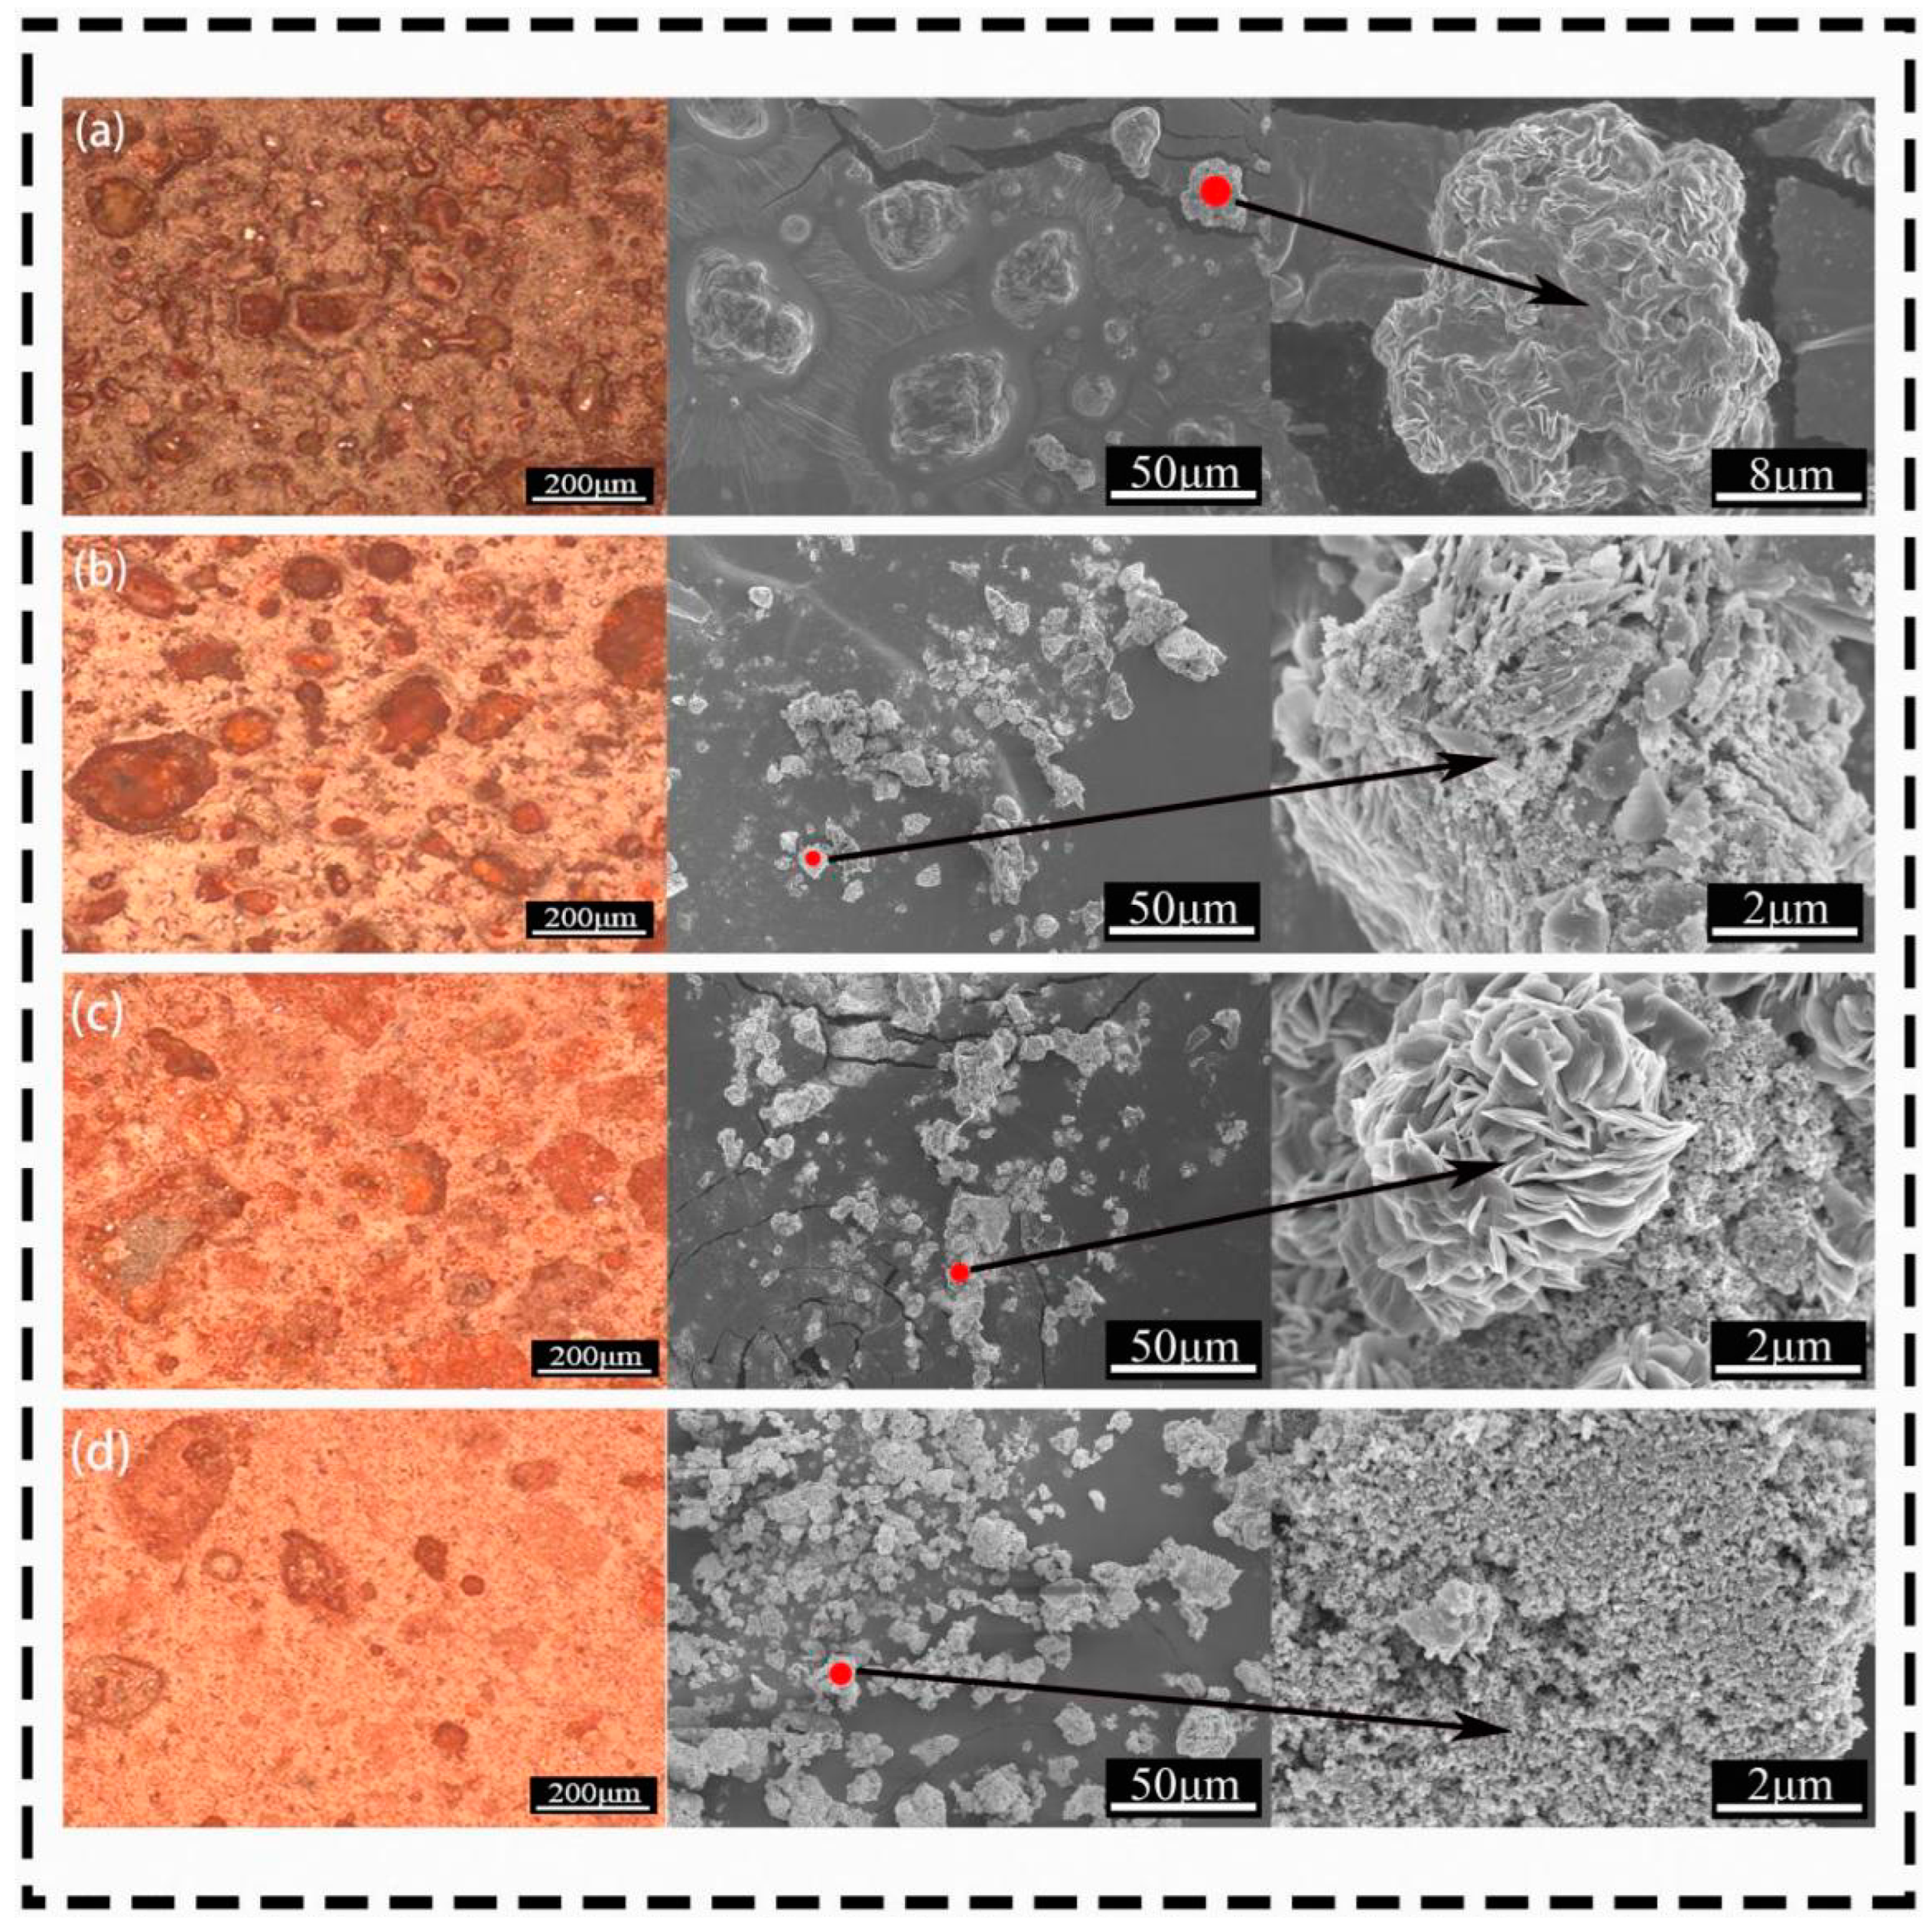
3.4. Microstructure Analysis
4. Discussion
4.1. Phase Variations of Iron Vitriol at Different Calcination Temperatures
4.2. Relationship between Sample Color and Microstructure
4.3. The Heating Process of Iron Vitriol
5. Conclusions
- (1)
- The phase composition is the key to the coloration of raw iron red during the thermal calcination (550–900 °C), with α-Fe2O3 particles being the main colorants. The presence of Fe2(SO4)3 crystals directly affects the coloration of the iron red overglaze color.
- (2)
- The size of α-Fe2O3 particles plays a crucial role in determining the brightness of the iron red overglaze color.
- (3)
- The variation in calcination temperature of raw iron red emerges as a significant factor contributing to the diverse colorations of iron red overglaze color in various periods of ancient China.
Author Contributions
Funding
Institutional Review Board Statement
Informed Consent Statement
Data Availability Statement
Conflicts of Interest
References
- Li, J. History of Science in China (Volume on Ceramics); China Science Publishing & Media: Beijing, China, 1998. [Google Scholar]
- Qiu, G. Ceramic Firing; China Elephant Press: Zhengzhou, China, 2010. [Google Scholar]
- Wei, Z. Ceramic Decorative Materials Science; Jiangxi Science and Technology Press: Nanchang, China, 1985. [Google Scholar]
- Zhang, F. The Science of Ancient Chinese Ceramics. Bull. Chin. Ceram. Soc. 1983, 03, 72–73. [Google Scholar]
- Zhang, F.; Zhang, Z. Research on Ancient Glaze Colors in China. J. Chin. Ceram. Soc. 1980, 04, 339–350+445. [Google Scholar]
- Wang, Q. Research on ‘Doucai’ Porcelain in Chenghua’s Reigns. Master’s Thesis, University of Chinese Academy of Social Sciences, Beijing, China, 2021. [Google Scholar] [CrossRef]
- Wu, J.; Zhang, M.; Wu, J.; Li, Q. Raman and EDXRF Analysis of Jingdezhen Overglaze Painted Porcelain. Spectrosc. Spectr. Anal. 2015, 35, 1266–1270. [Google Scholar]
- Lin, J.; Guo, J. Decade progress in archaeometrical research of high temperature colour glazes and painted porcelain. J. Ceram. 2023, 44, 460–472. [Google Scholar] [CrossRef]
- Kajihara, S.; Hidaka, M.; Wijesundera, R.; Kumara, L.; Koga, M.; Kobayashi, S.; Tsuru, T.; Koga, K.; Shimomura, K.; Choi, J.; et al. Correlation between the Izumiyama Porcelain Ceramics and the Red-overglaze Enamels of the Kakiemon-style Porcelains. Ceram. Int. 2008, 34, 1681–1689. [Google Scholar] [CrossRef]
- Hashimoto, H.; Kawabe, D.; Terasawa, A.; Inada, H.; Takaishi, T.; Okura, T. Hematite Crystal Growth in High-temperature Lead-free Multicomponent Alkali Borosilicate Glass Frit for Red Overglaze Enamels. J. Eur. Ceram. Soc. 2021, 41, 7886–7892. [Google Scholar] [CrossRef]
- Inada, H.; Okazaki, Y.; Arakawa, Y.; Takaishi, T.; Hashimoto, H. Multinuclear Core/shell hematite/glass particles for Peeling-free Red Overglaze Enamels on Porcelain. J. Eur. Ceram. Soc. 2019, 39, 5096–5101. [Google Scholar] [CrossRef]
- Takada, T. On the Effects of Particle Size and Shape on the Colour of Ferric Oxide powders. J. Jpn. Soc. Powder Powder Metall. 1958, 4, 160–168. [Google Scholar] [CrossRef]
- Tahada, T.; Kiyama, M. Considerations on the Effects of their Particle Size and Shape on the Colour of Ferric Oxide Powders. J. Jpn. Soc. Powder Powder Metall. 1958, 4, 187–192. [Google Scholar] [CrossRef]
- Hashimoto, H.; Inada, H.; Okazaki, Y.; Takaishi, T.; Fujii, T.; Takada, T. Controlling the Color of Lead-Free Red Overglaze Enamels and a Process for Preparing High-Quality Red Paints. ACS Appl. Mater. Interfaces 2016, 8, 10918–10928. [Google Scholar] [CrossRef] [PubMed]
- Colomban, P.; Ambrosi, F.; Ngo, A.; Lu, T.; Feng, X.; Chen, S.; Choi, C. Comparative analysis of Wucai Chinese Porcelains Using Mobile and Fixed Raman Microspectrometers. Ceram. Int. 2017, 43, 14244–14256. [Google Scholar] [CrossRef]
- Singh, S.; Haskin, N.; Dastgheib, S. Coal-based graphene oxide-like materials: A comprehensive review. Carbon 2023, 215, 118447. [Google Scholar] [CrossRef]
- Colomban, P.; Sagon, G.; Faurel, X. Differentiation of Antique Ceramics from the Raman Spectra of their Coloured Glazes and Paintings. J. Raman Spectrosc. 2001, 32, 351–360. [Google Scholar] [CrossRef]
- Froment, F.; Tournié, A.; Colomban, P. Raman Identification of Natural Red to Yellow Pigments: Ochre and Iron-containing Ores. J. Raman Spectrosc. 2008, 39, 560–568. [Google Scholar] [CrossRef]
- Faria, D.; Silva, S.; Oliveira, M. Raman microspectroscopy of some iron oxides and oxyhydroxides. J. Raman Spectrosc. 1997, 28, 873–878. [Google Scholar] [CrossRef]
- McCarty, K. Inelastic Light Scattering in α-Fe2O3: Phonon vs Magnon Scattering. Solid State Commun. 1988, 68, 799–802. [Google Scholar] [CrossRef]
- Singh, S.; De, M. Thermally exfoliated graphene oxide for hydrogen storage. Mater. Chem. Phys. 2020, 239, 122102. [Google Scholar] [CrossRef]
- Zhou, X.; Chen, T.; Liu, H.; Chen, D.; Zhang, P.; Xie, Q. Structure and Color Evolution of Heat treated Goethite. J. Chin. Ceram. Soc. 2013, 41, 669–673. [Google Scholar]
- Asaoka, H.; Nakanishi, M.; Fujii, T.; Takada, J.; Kusano, Y.; Murakami, R. Reproduction of Japanese Traditional Pigment Based on Iron Oxide Powders with Yellowish Red Color. MRS Online Proceeding Libr. Arch. 2011, 712, II8.2.1–II8.2.6. [Google Scholar] [CrossRef]
- Gallagher, P.; Johnson, D.; Schery, F. Thermal Decomposition of Iron(II) Sulfates. J. Am. Ceram. Soc. 1970, 53, 666–670. [Google Scholar] [CrossRef]


| O | Fe | S | |
|---|---|---|---|
| 550 °C | 76.363 | 9.026 | 14.611 |
| 600 °C | 52.304 | 24.444 | 23.251 |
| 650 °C | 67.687 | 14.098 | 18.215 |
| 700 °C | 63.952 | 32.409 | 3.639 |
| 750 °C | 62.758 | 37.242 | - |
| 800 °C | 64.368 | 35.632 | - |
| 850 °C | 56.280 | 43.720 | - |
| 900 °C | 54.855 | 45.145 | - |
Disclaimer/Publisher’s Note: The statements, opinions and data contained in all publications are solely those of the individual author(s) and contributor(s) and not of MDPI and/or the editor(s). MDPI and/or the editor(s) disclaim responsibility for any injury to people or property resulting from any ideas, methods, instructions or products referred to in the content. |
© 2024 by the authors. Licensee MDPI, Basel, Switzerland. This article is an open access article distributed under the terms and conditions of the Creative Commons Attribution (CC BY) license (https://creativecommons.org/licenses/by/4.0/).
Share and Cite
Li, Q.; Wu, A.; Zhang, M.; Li, J.; Cao, J.; Li, H.; Jiang, Y. Study on the Influence of Calcination Temperature of Iron Vitriol on the Coloration of Ancient Chinese Traditional Iron Red Overglaze Color. Materials 2024, 17, 2800. https://doi.org/10.3390/ma17122800
Li Q, Wu A, Zhang M, Li J, Cao J, Li H, Jiang Y. Study on the Influence of Calcination Temperature of Iron Vitriol on the Coloration of Ancient Chinese Traditional Iron Red Overglaze Color. Materials. 2024; 17(12):2800. https://doi.org/10.3390/ma17122800
Chicago/Turabian StyleLi, Qijiang, Anjian Wu, Maolin Zhang, Jinwei Li, Jianwen Cao, Haorui Li, and Yimei Jiang. 2024. "Study on the Influence of Calcination Temperature of Iron Vitriol on the Coloration of Ancient Chinese Traditional Iron Red Overglaze Color" Materials 17, no. 12: 2800. https://doi.org/10.3390/ma17122800
APA StyleLi, Q., Wu, A., Zhang, M., Li, J., Cao, J., Li, H., & Jiang, Y. (2024). Study on the Influence of Calcination Temperature of Iron Vitriol on the Coloration of Ancient Chinese Traditional Iron Red Overglaze Color. Materials, 17(12), 2800. https://doi.org/10.3390/ma17122800