
Effect of Water to Cement Ratio on Properties of Calcium Sulfoaluminate Cement Mortars

Abstract
:1. Introduction
2. Materials and Methods
3. Results and Discussion
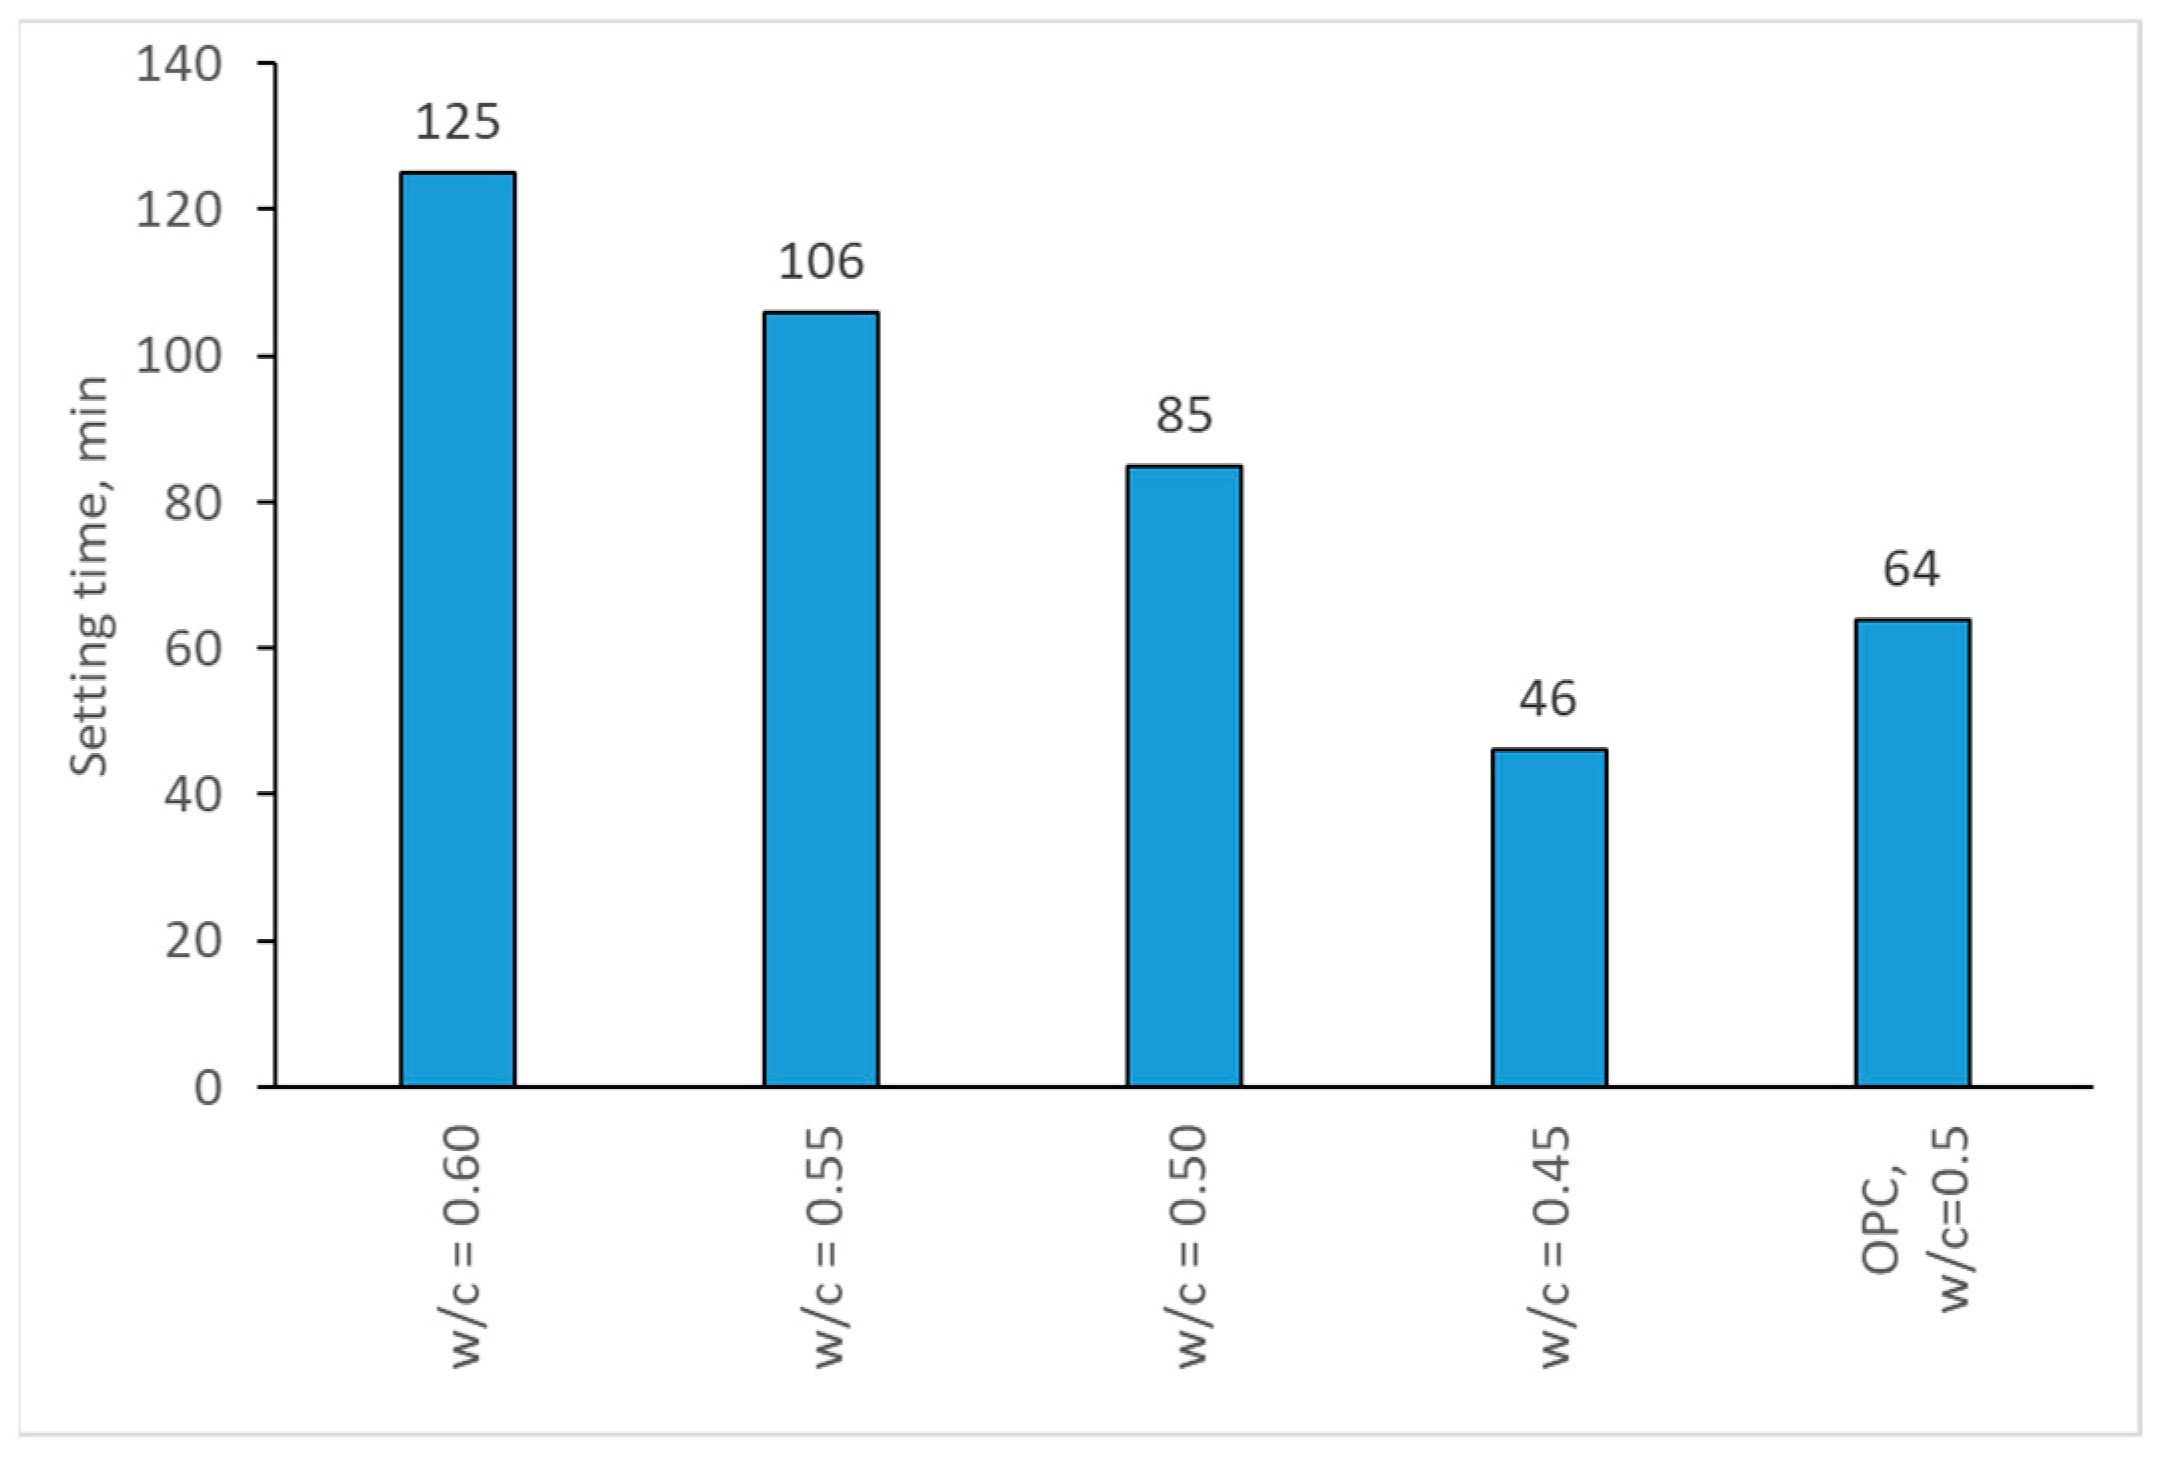
3.1. Setting Time
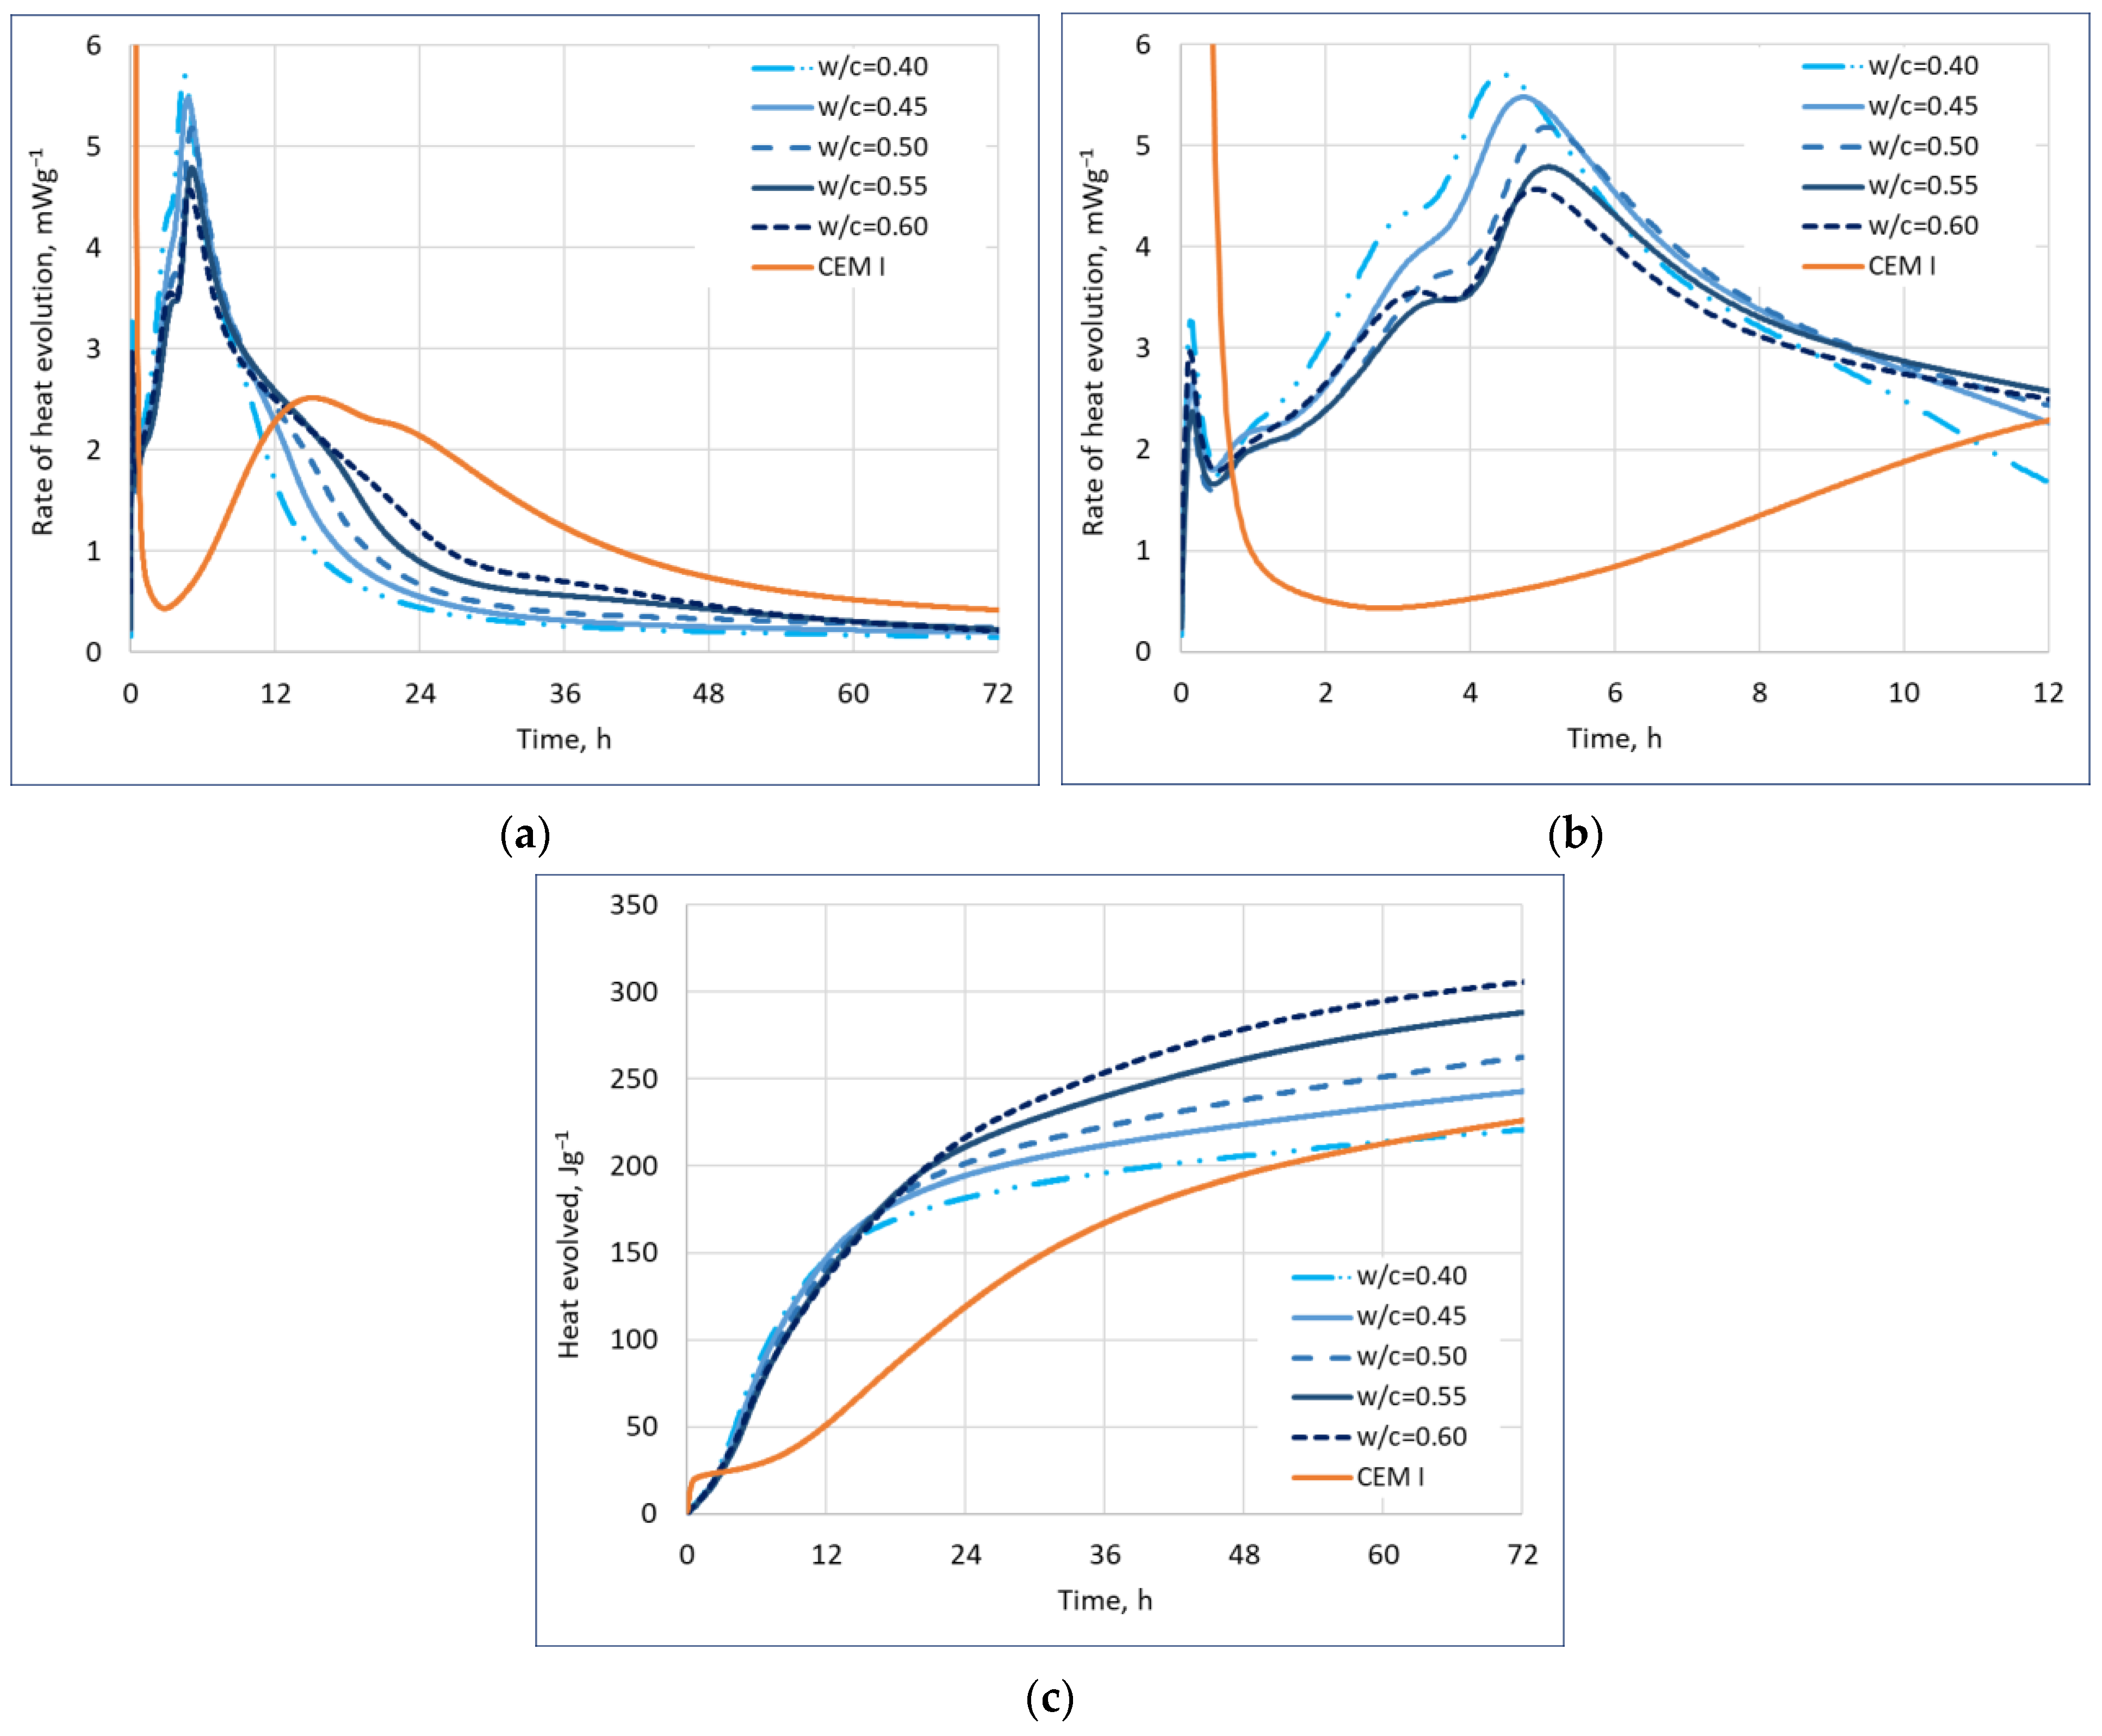
3.2. Hydration Heat
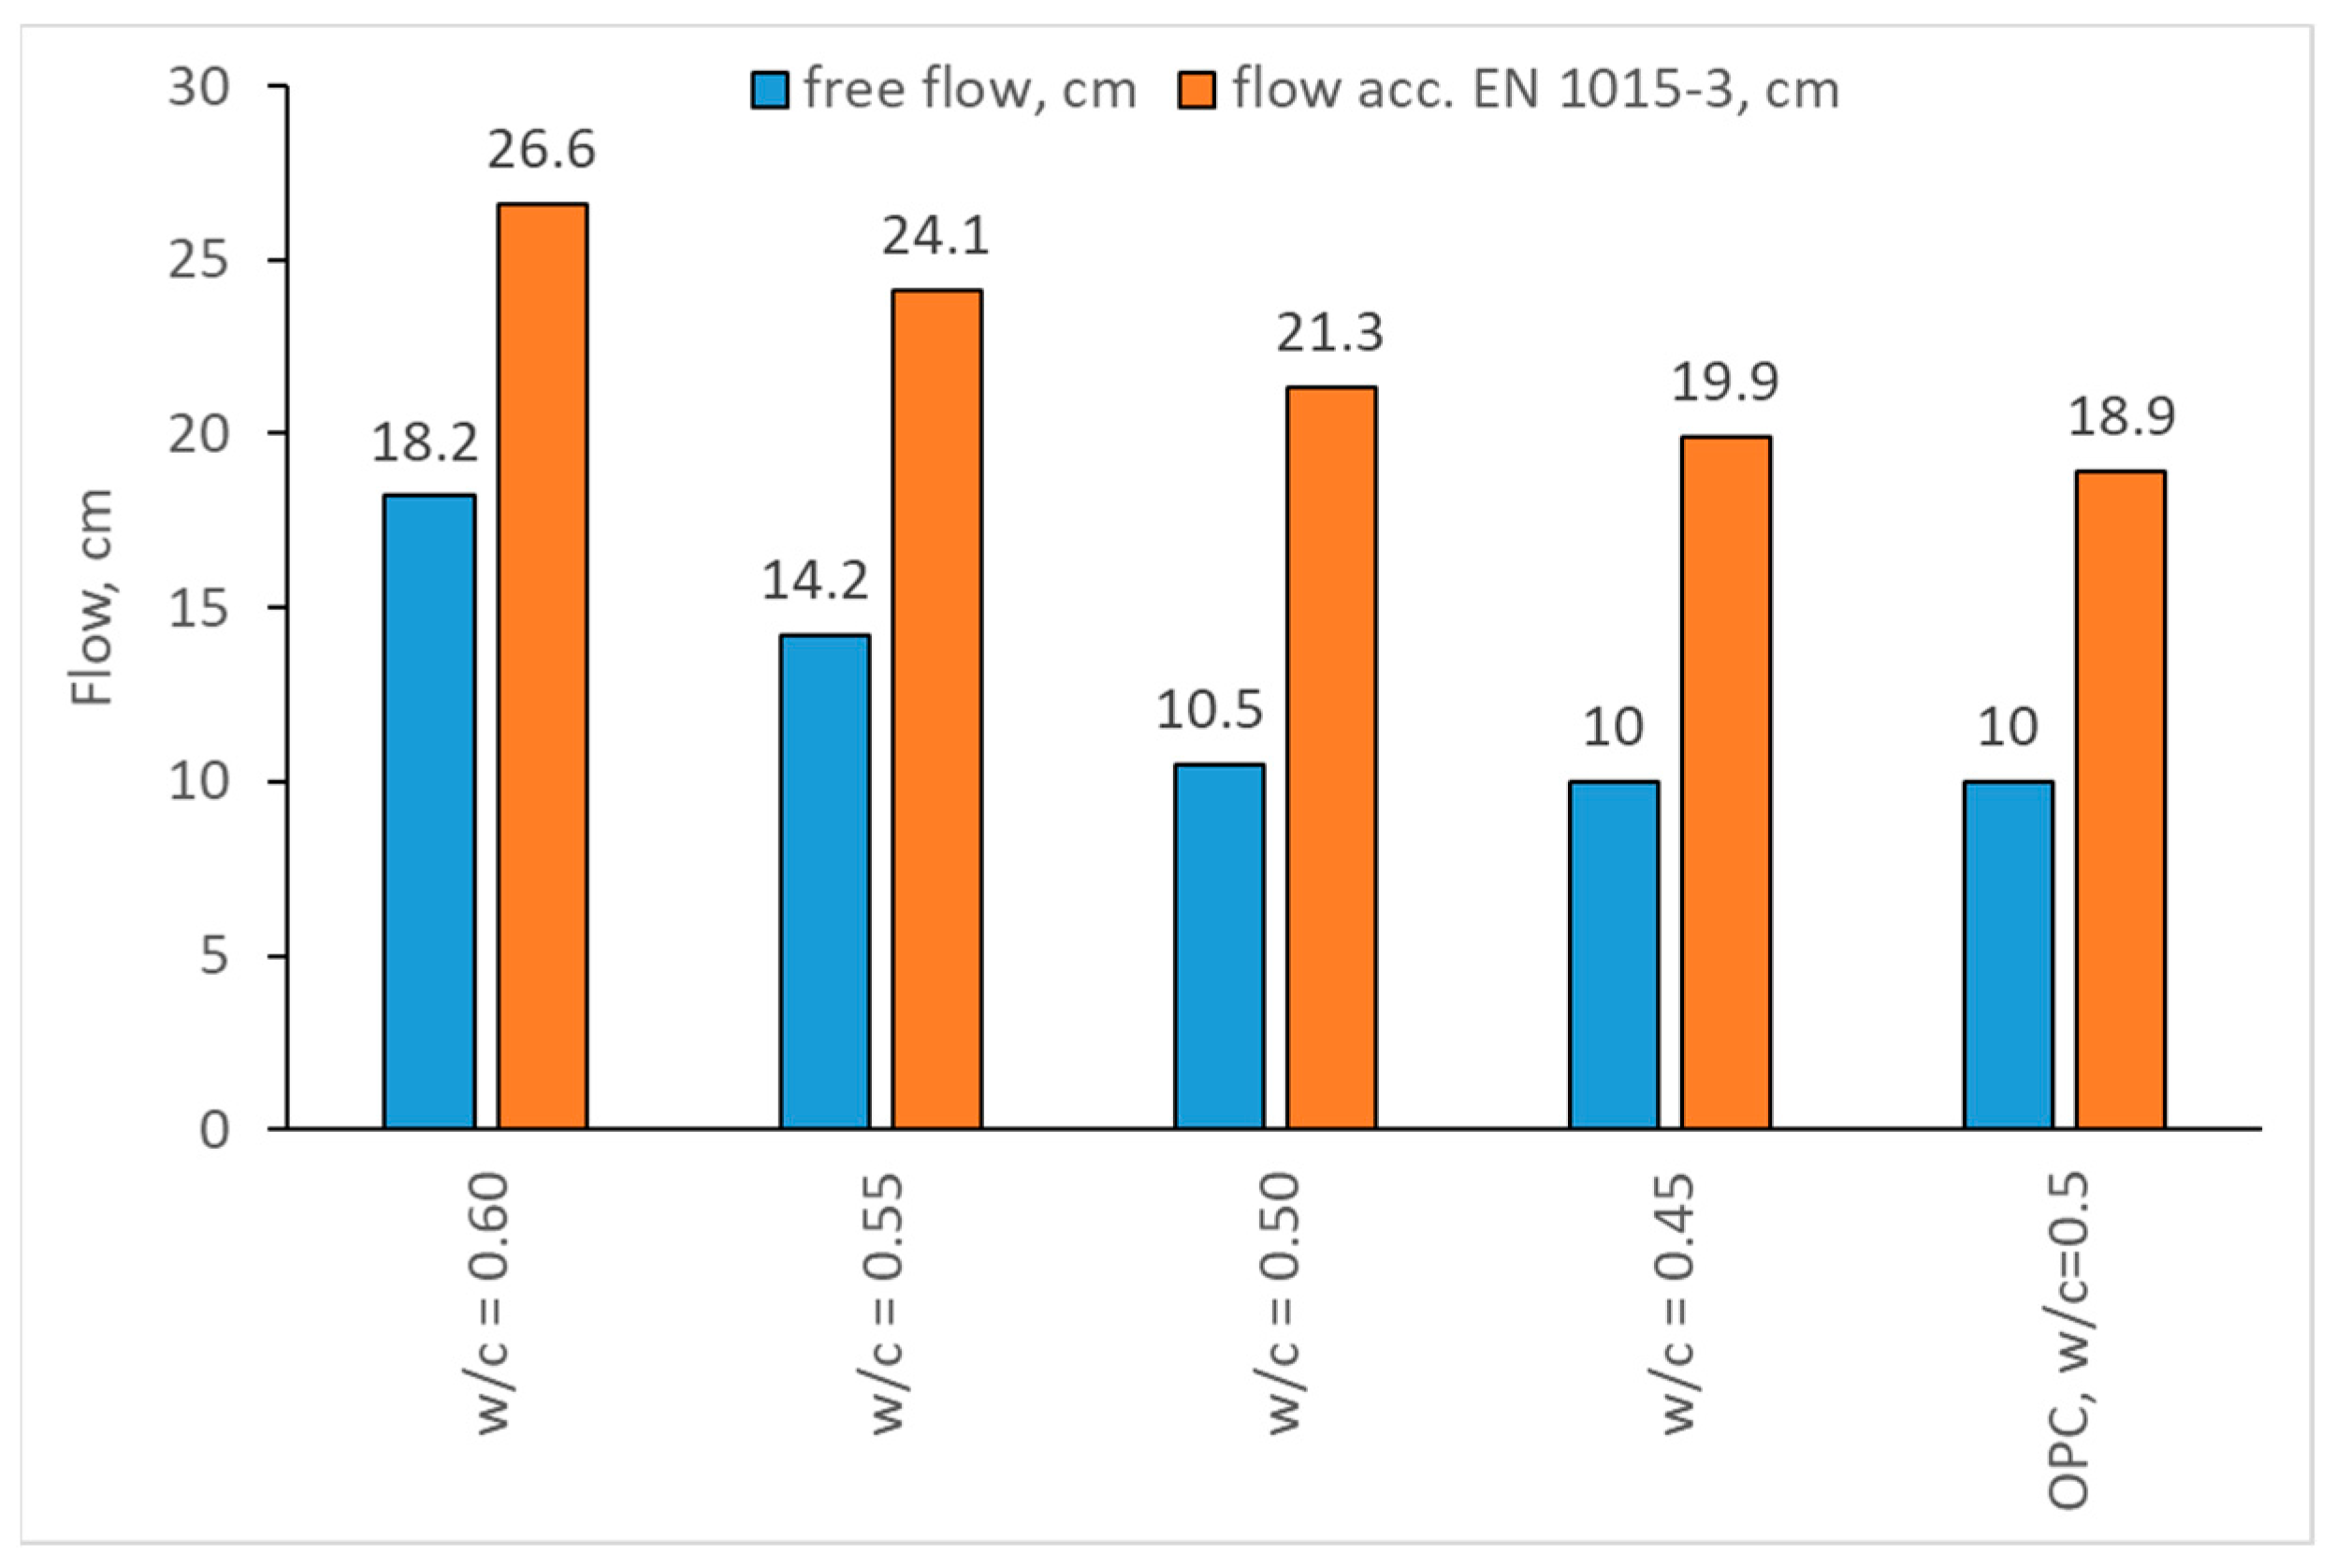
3.3. Consistency
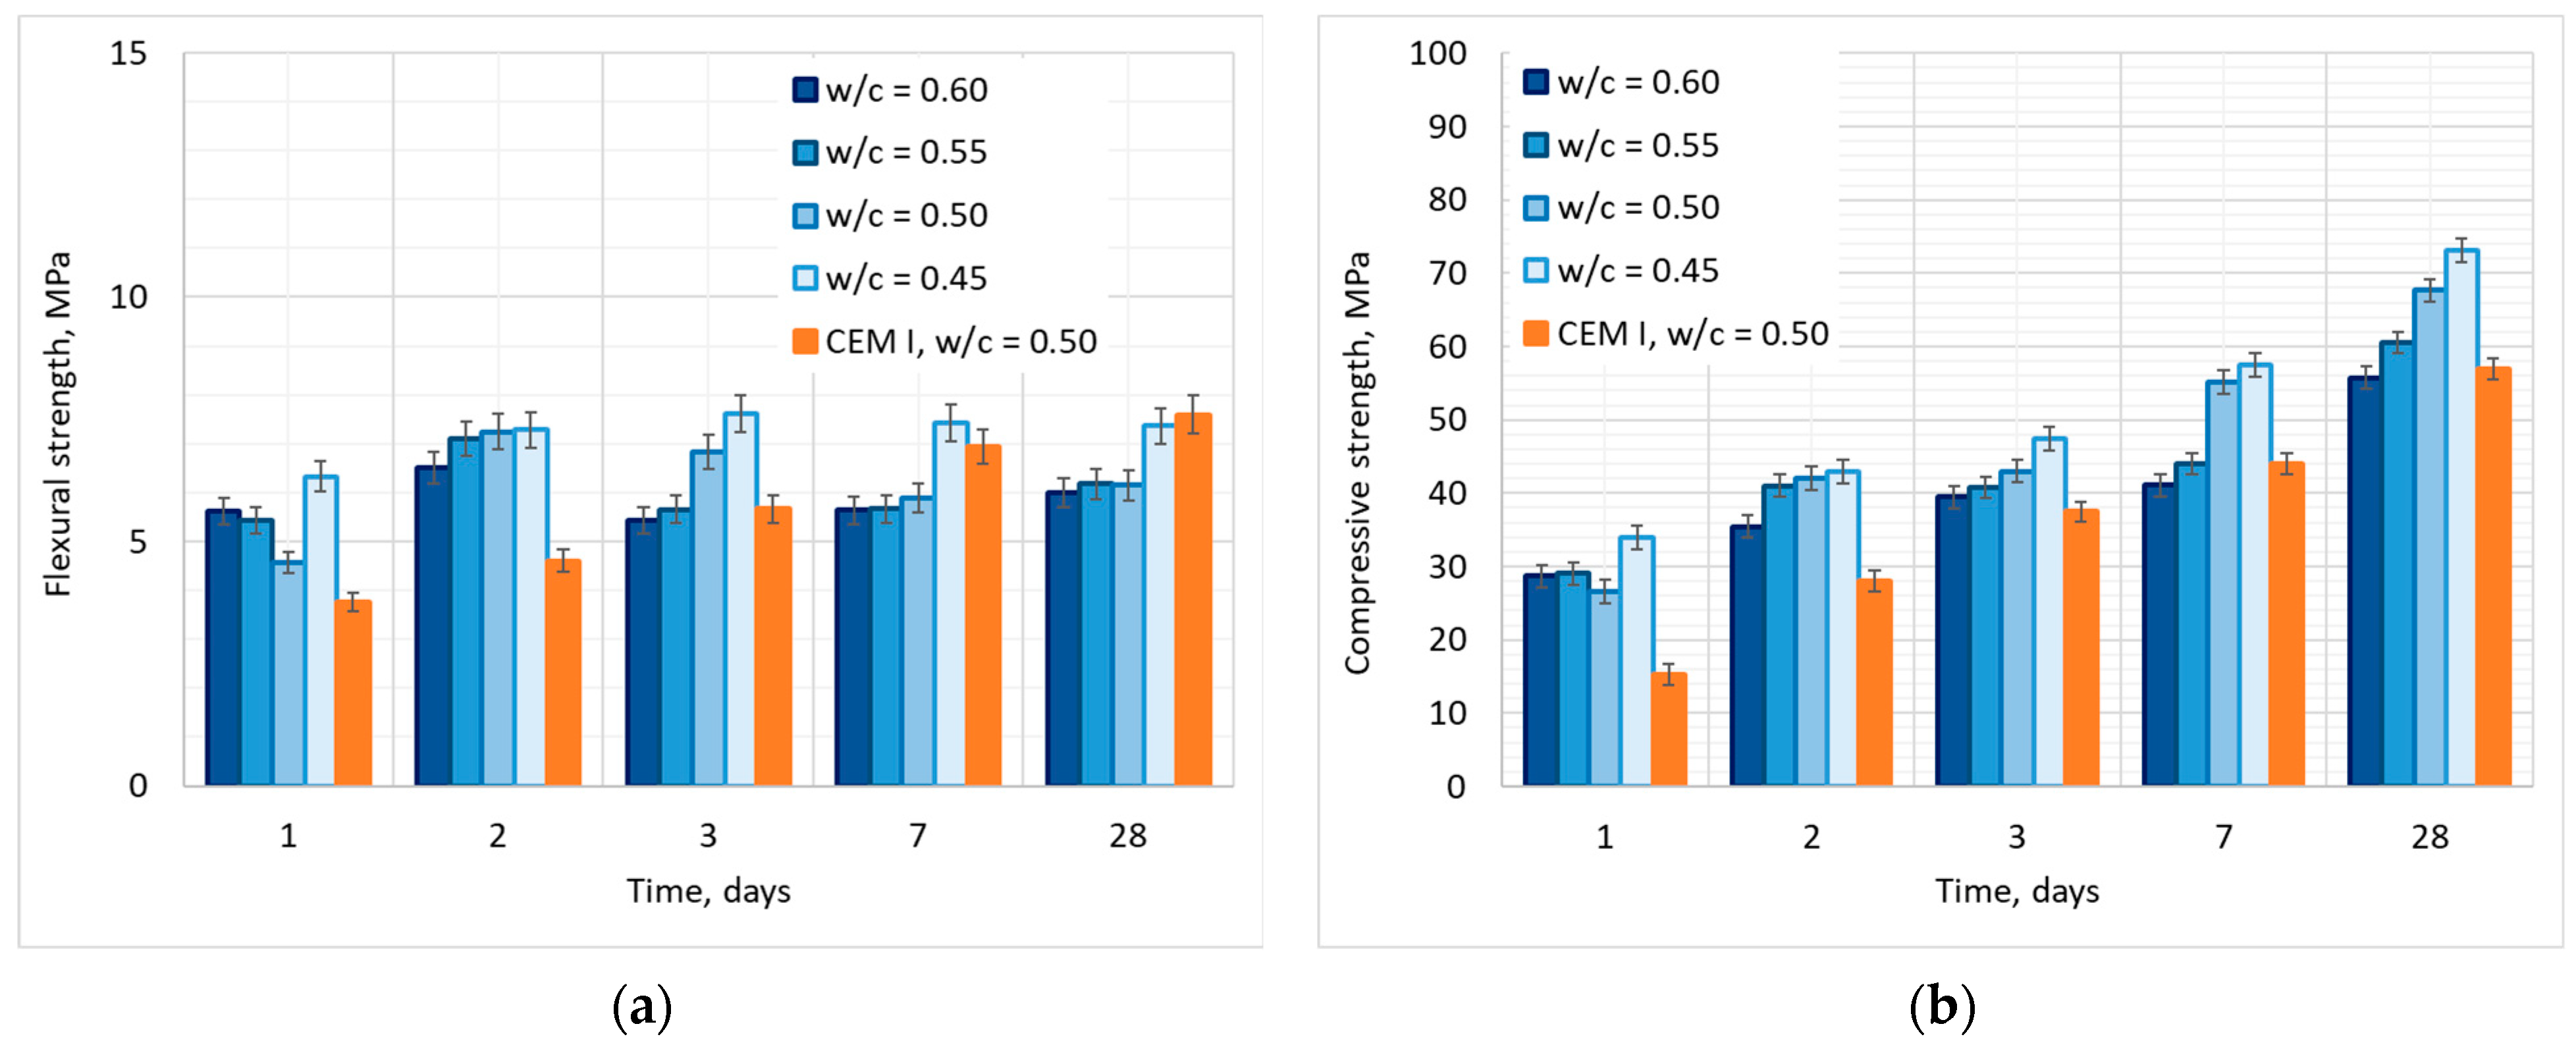
3.4. Flexural and Compressive Strength of CSA Mortars
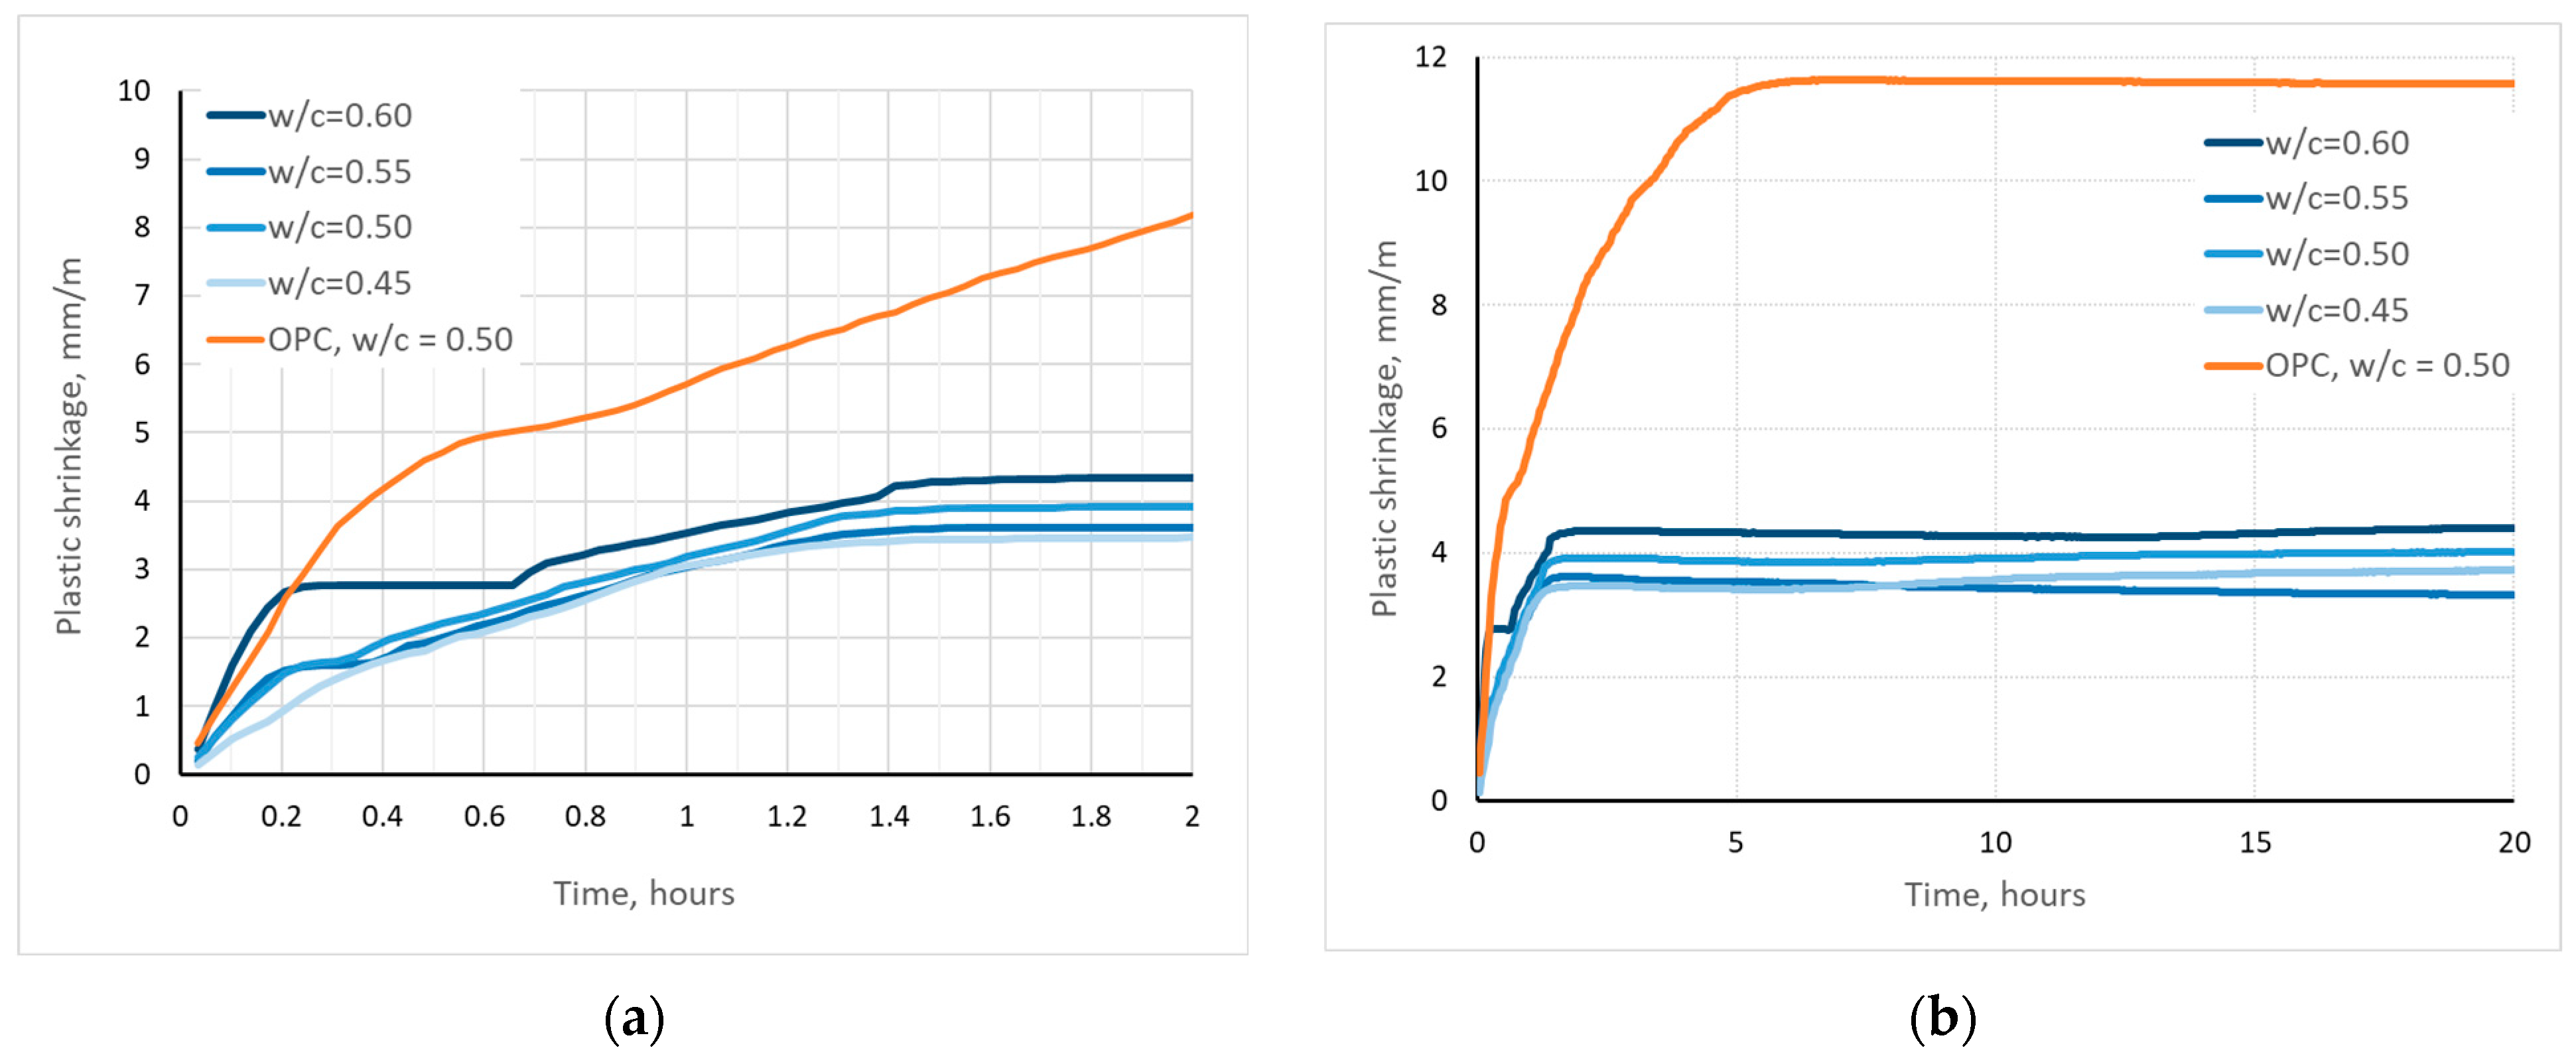
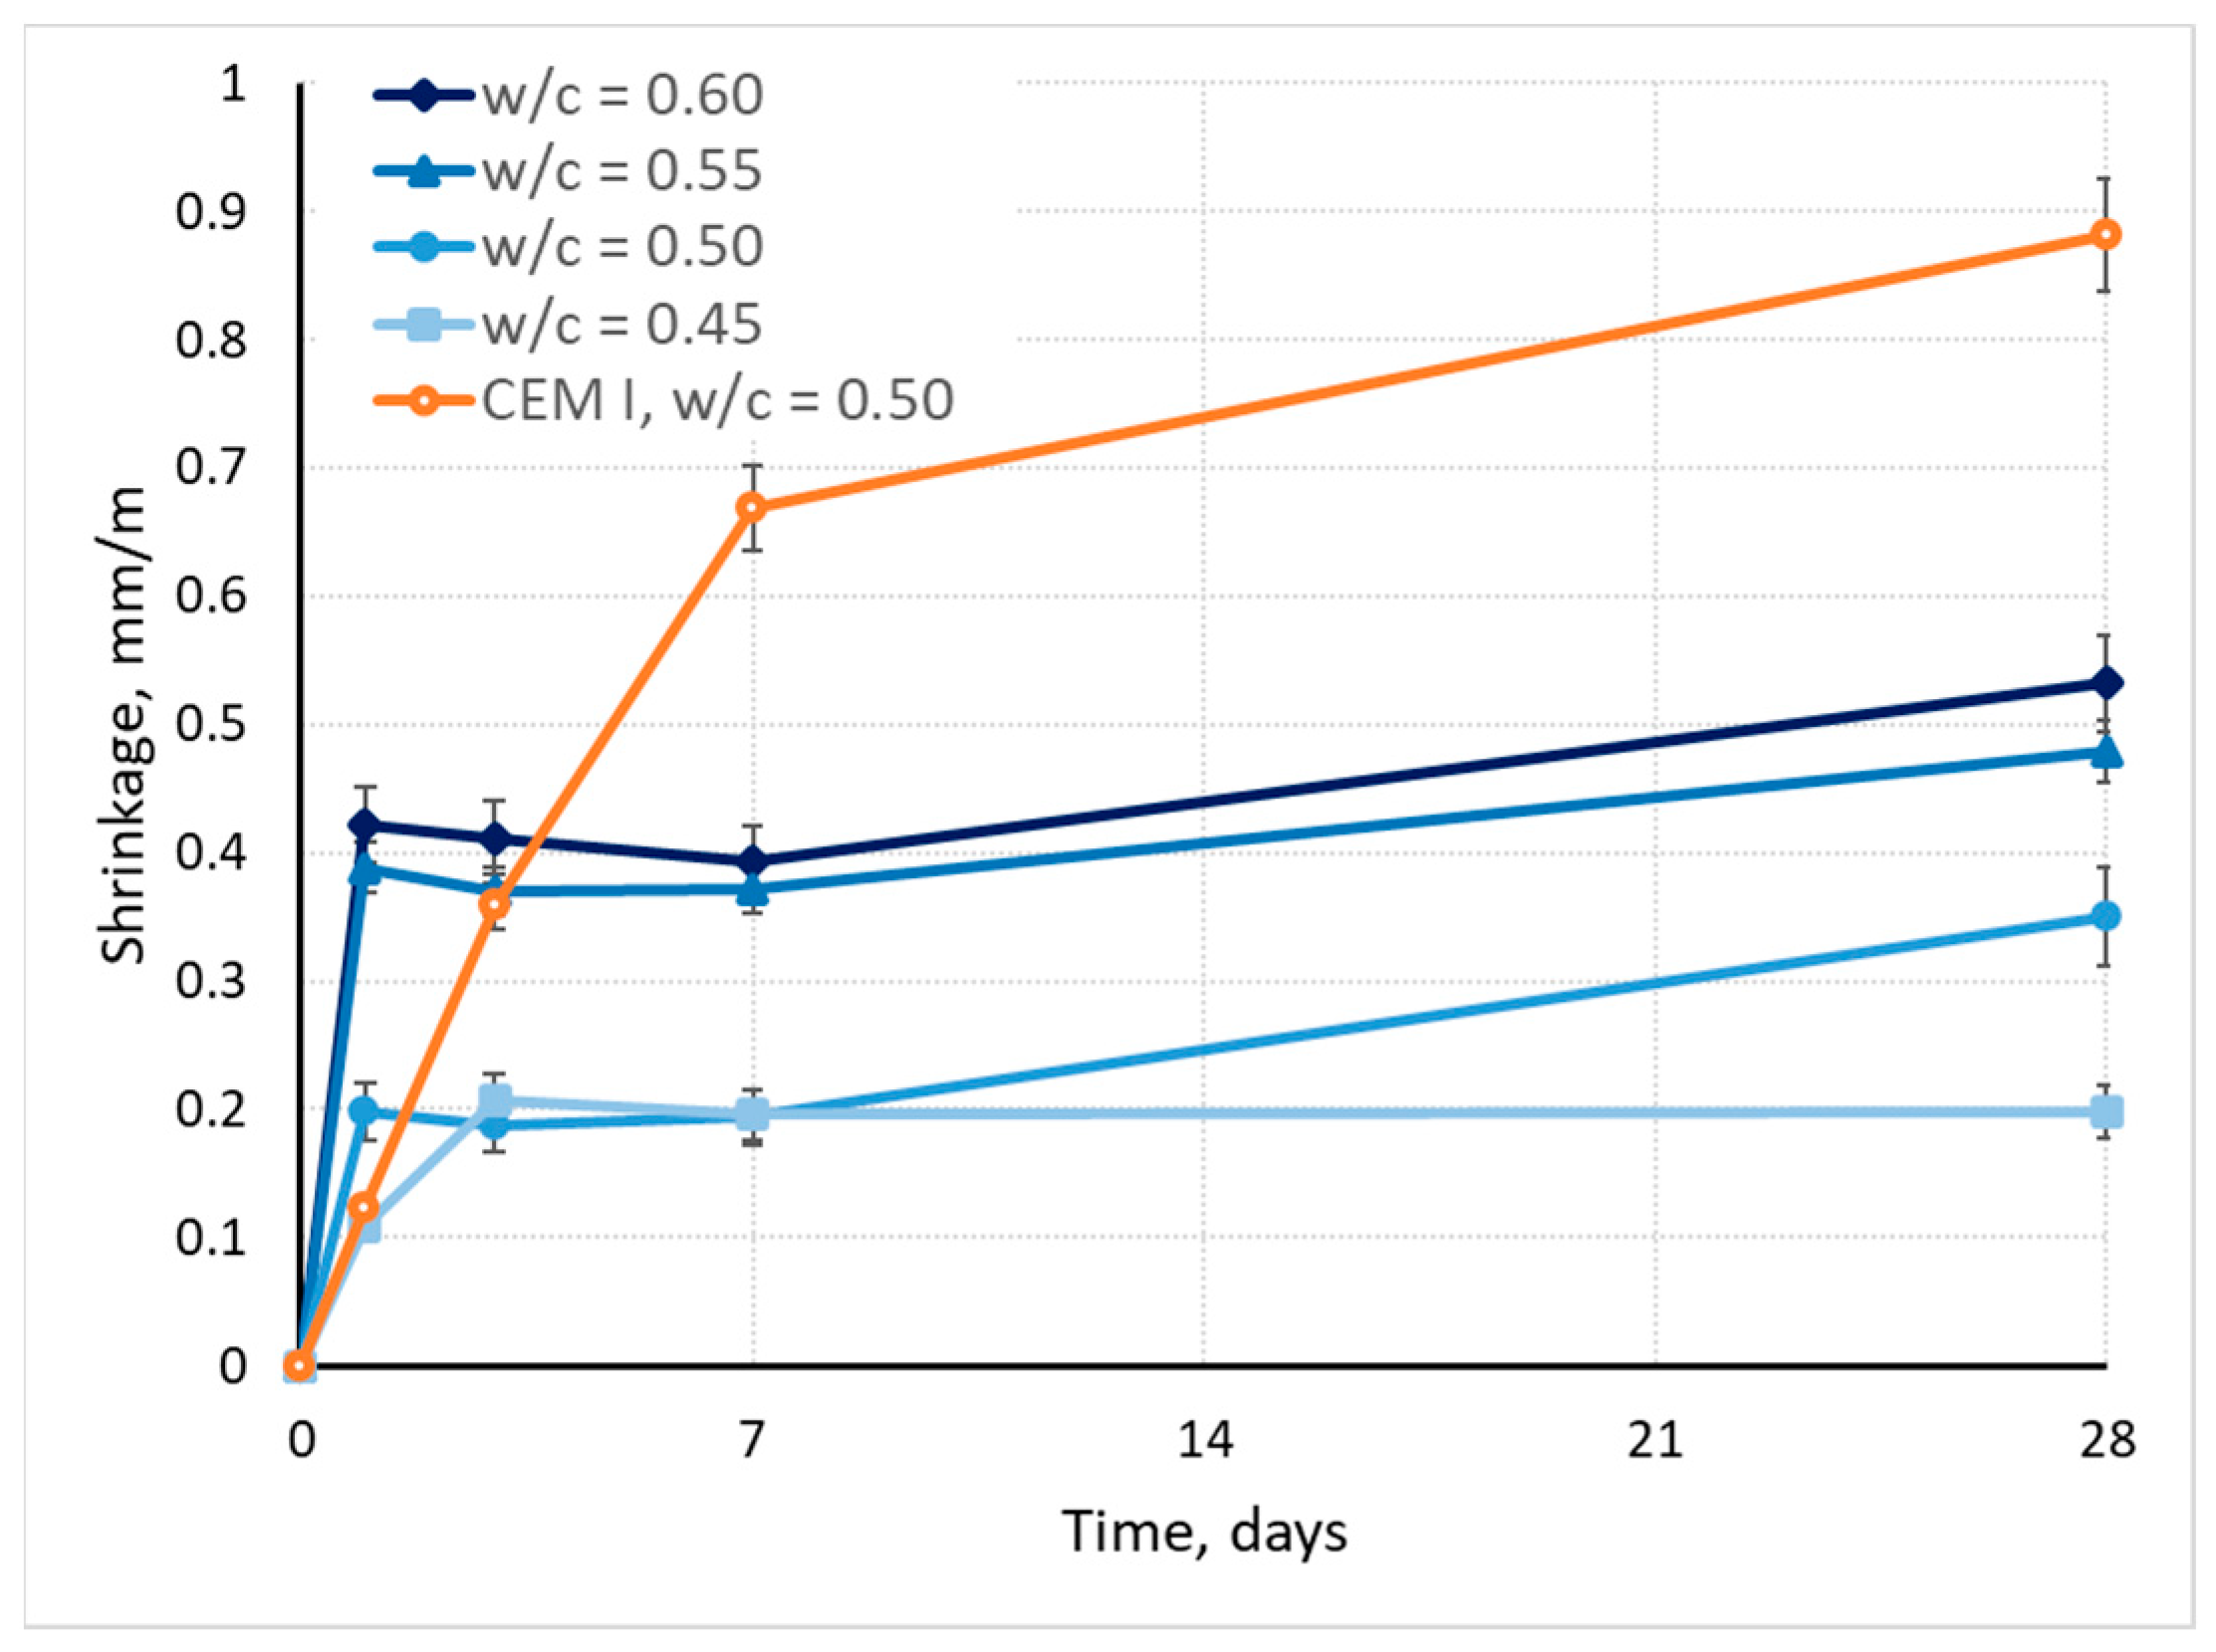
3.5. Shrinkage
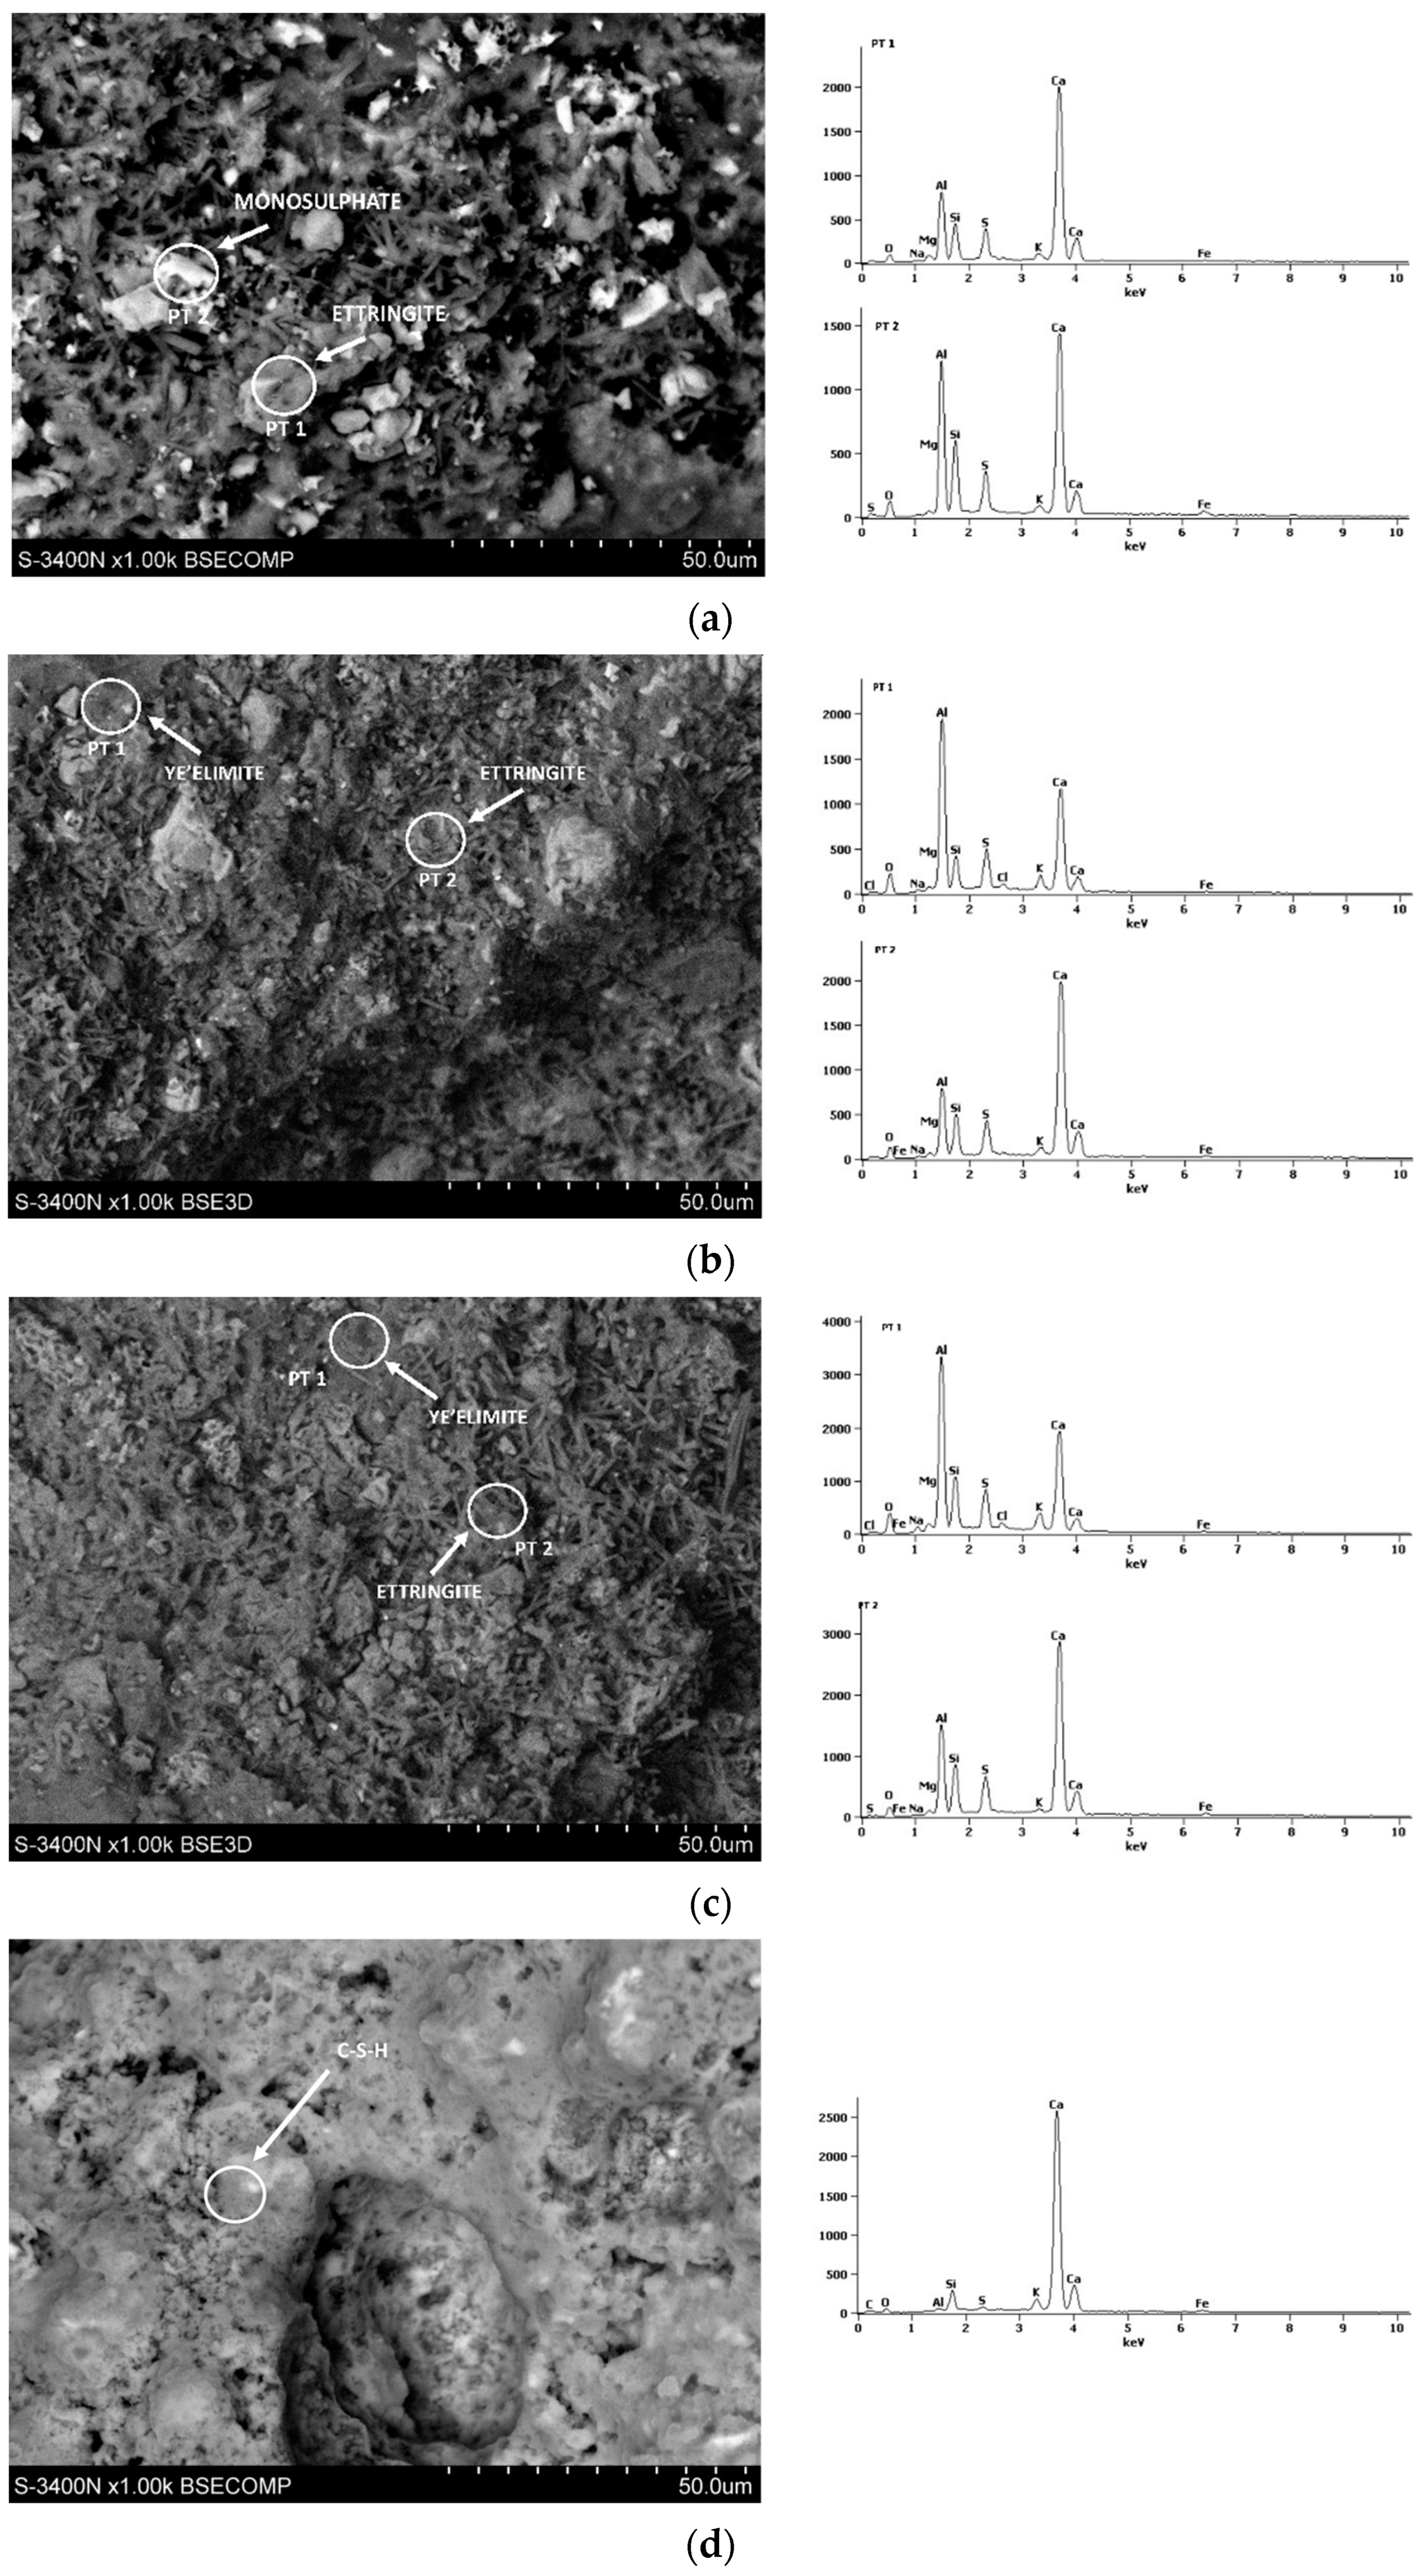
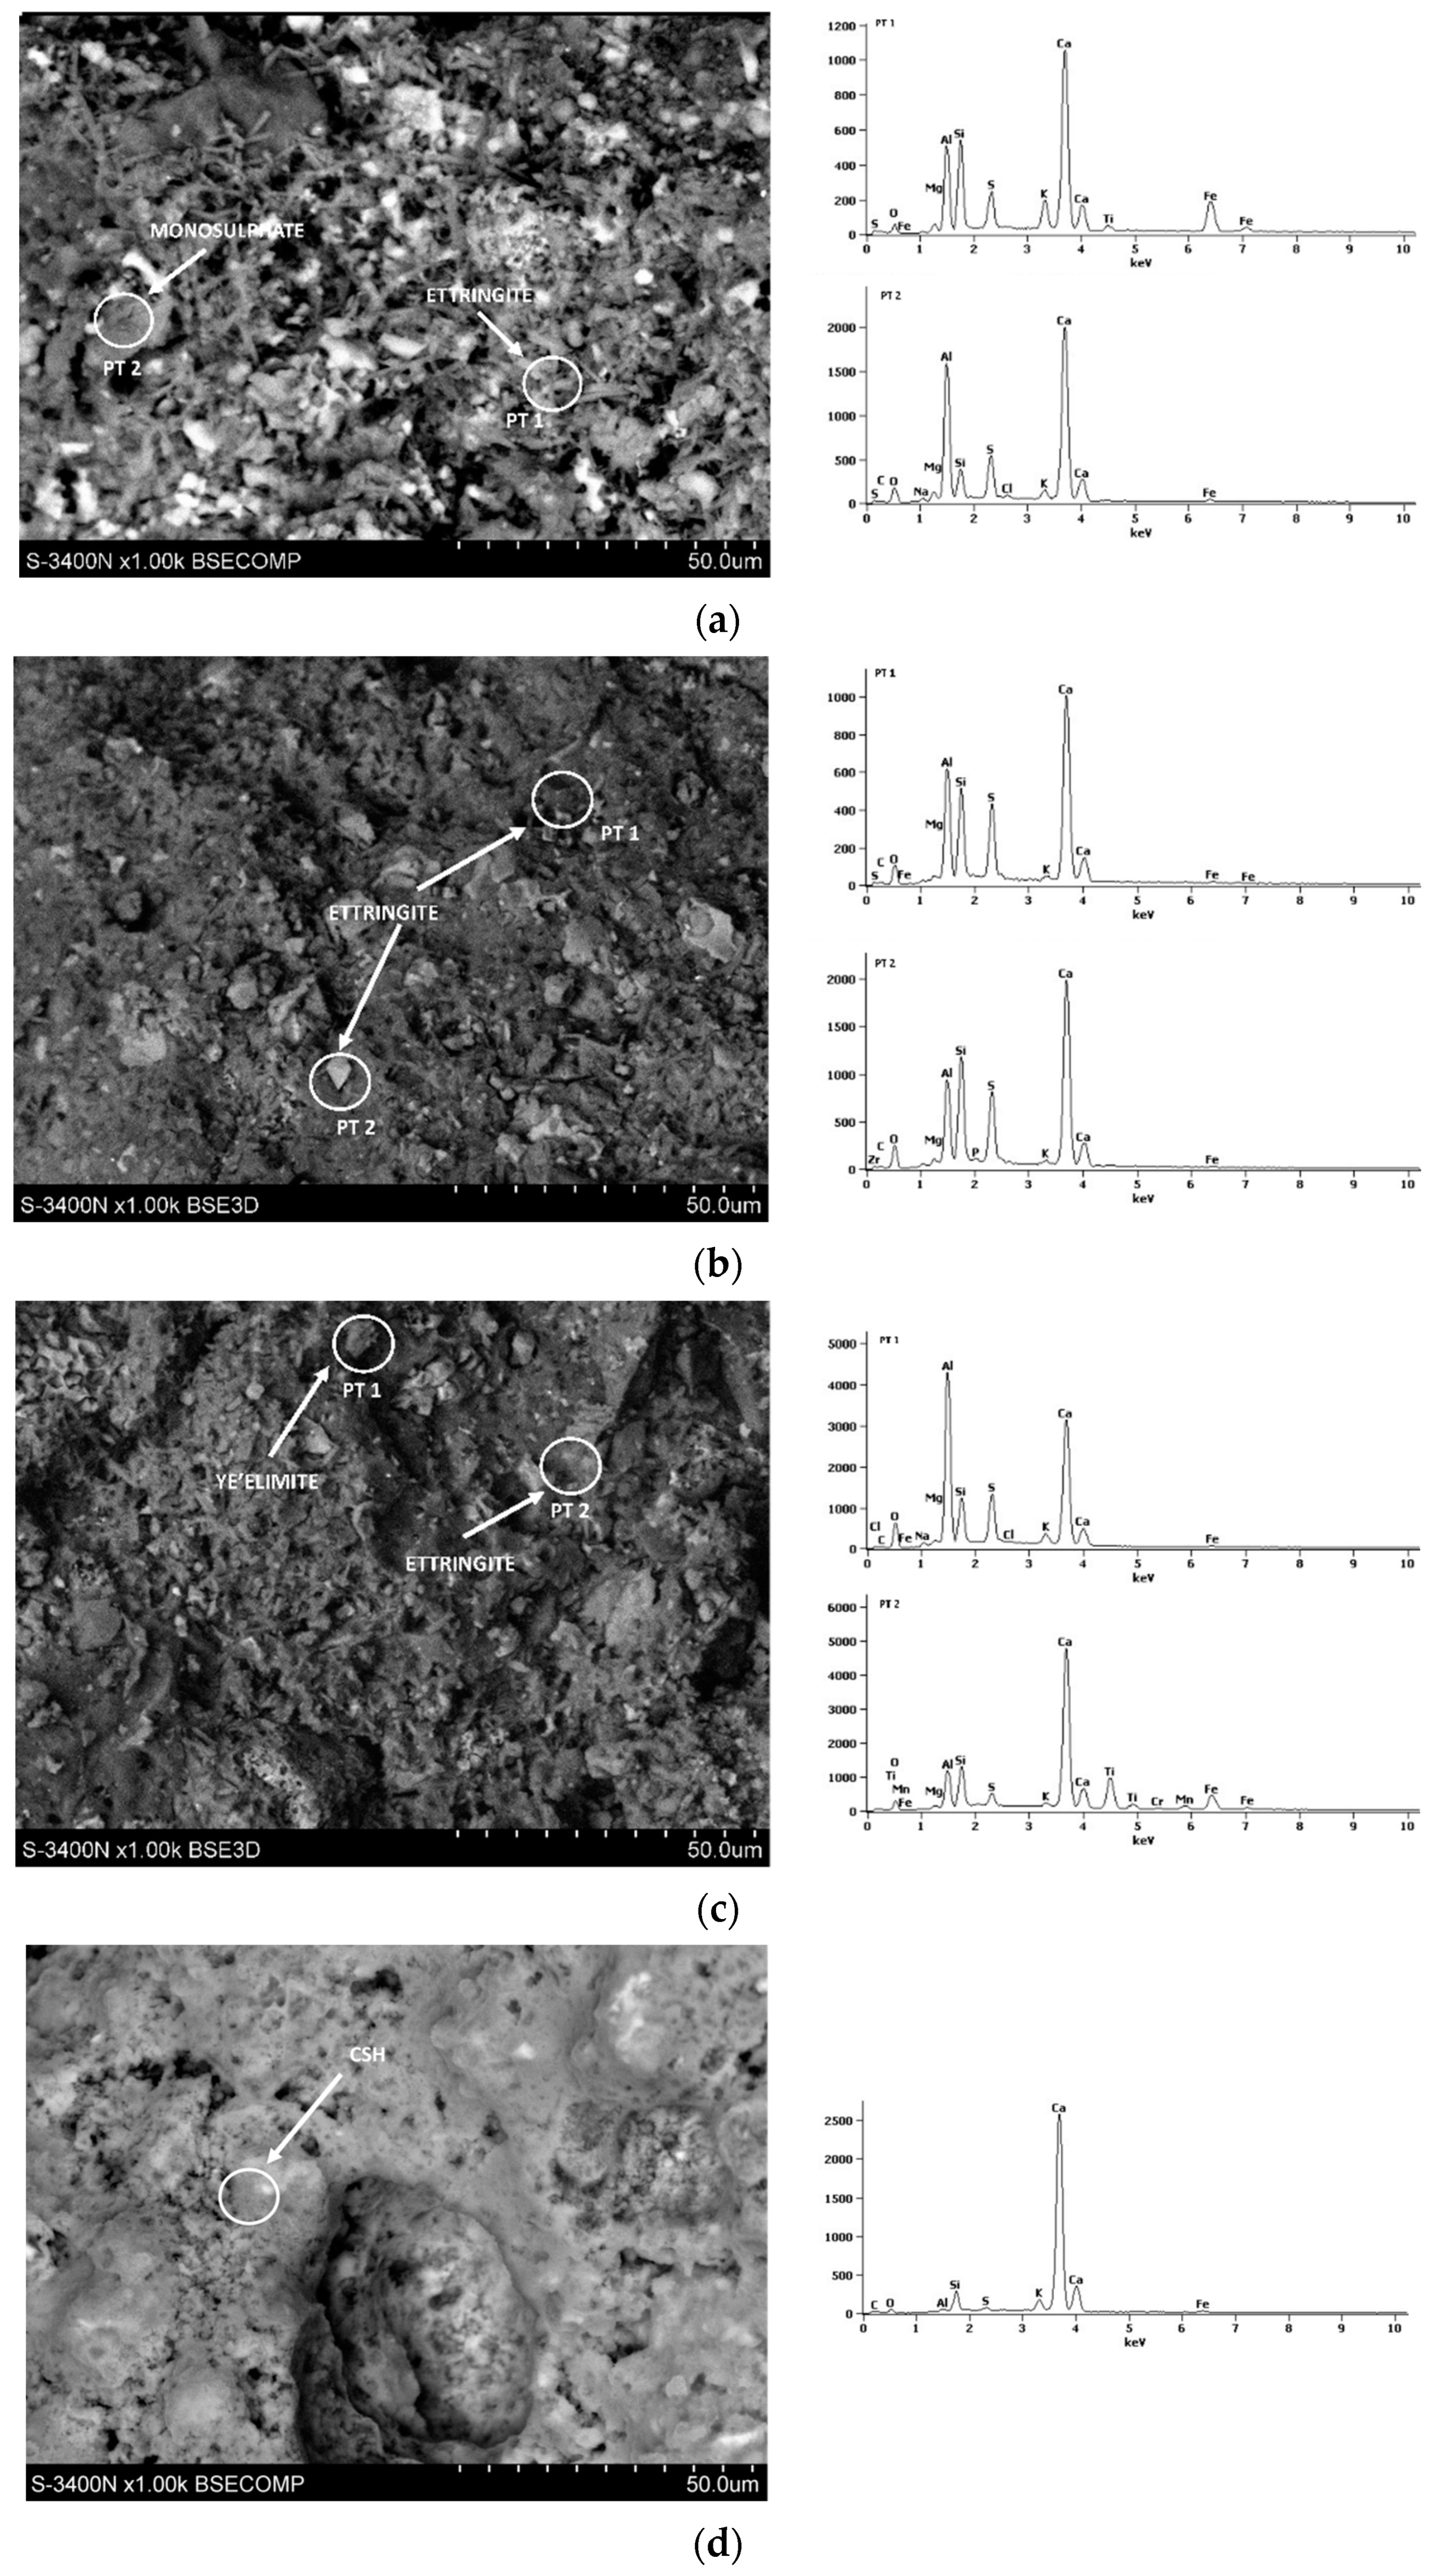
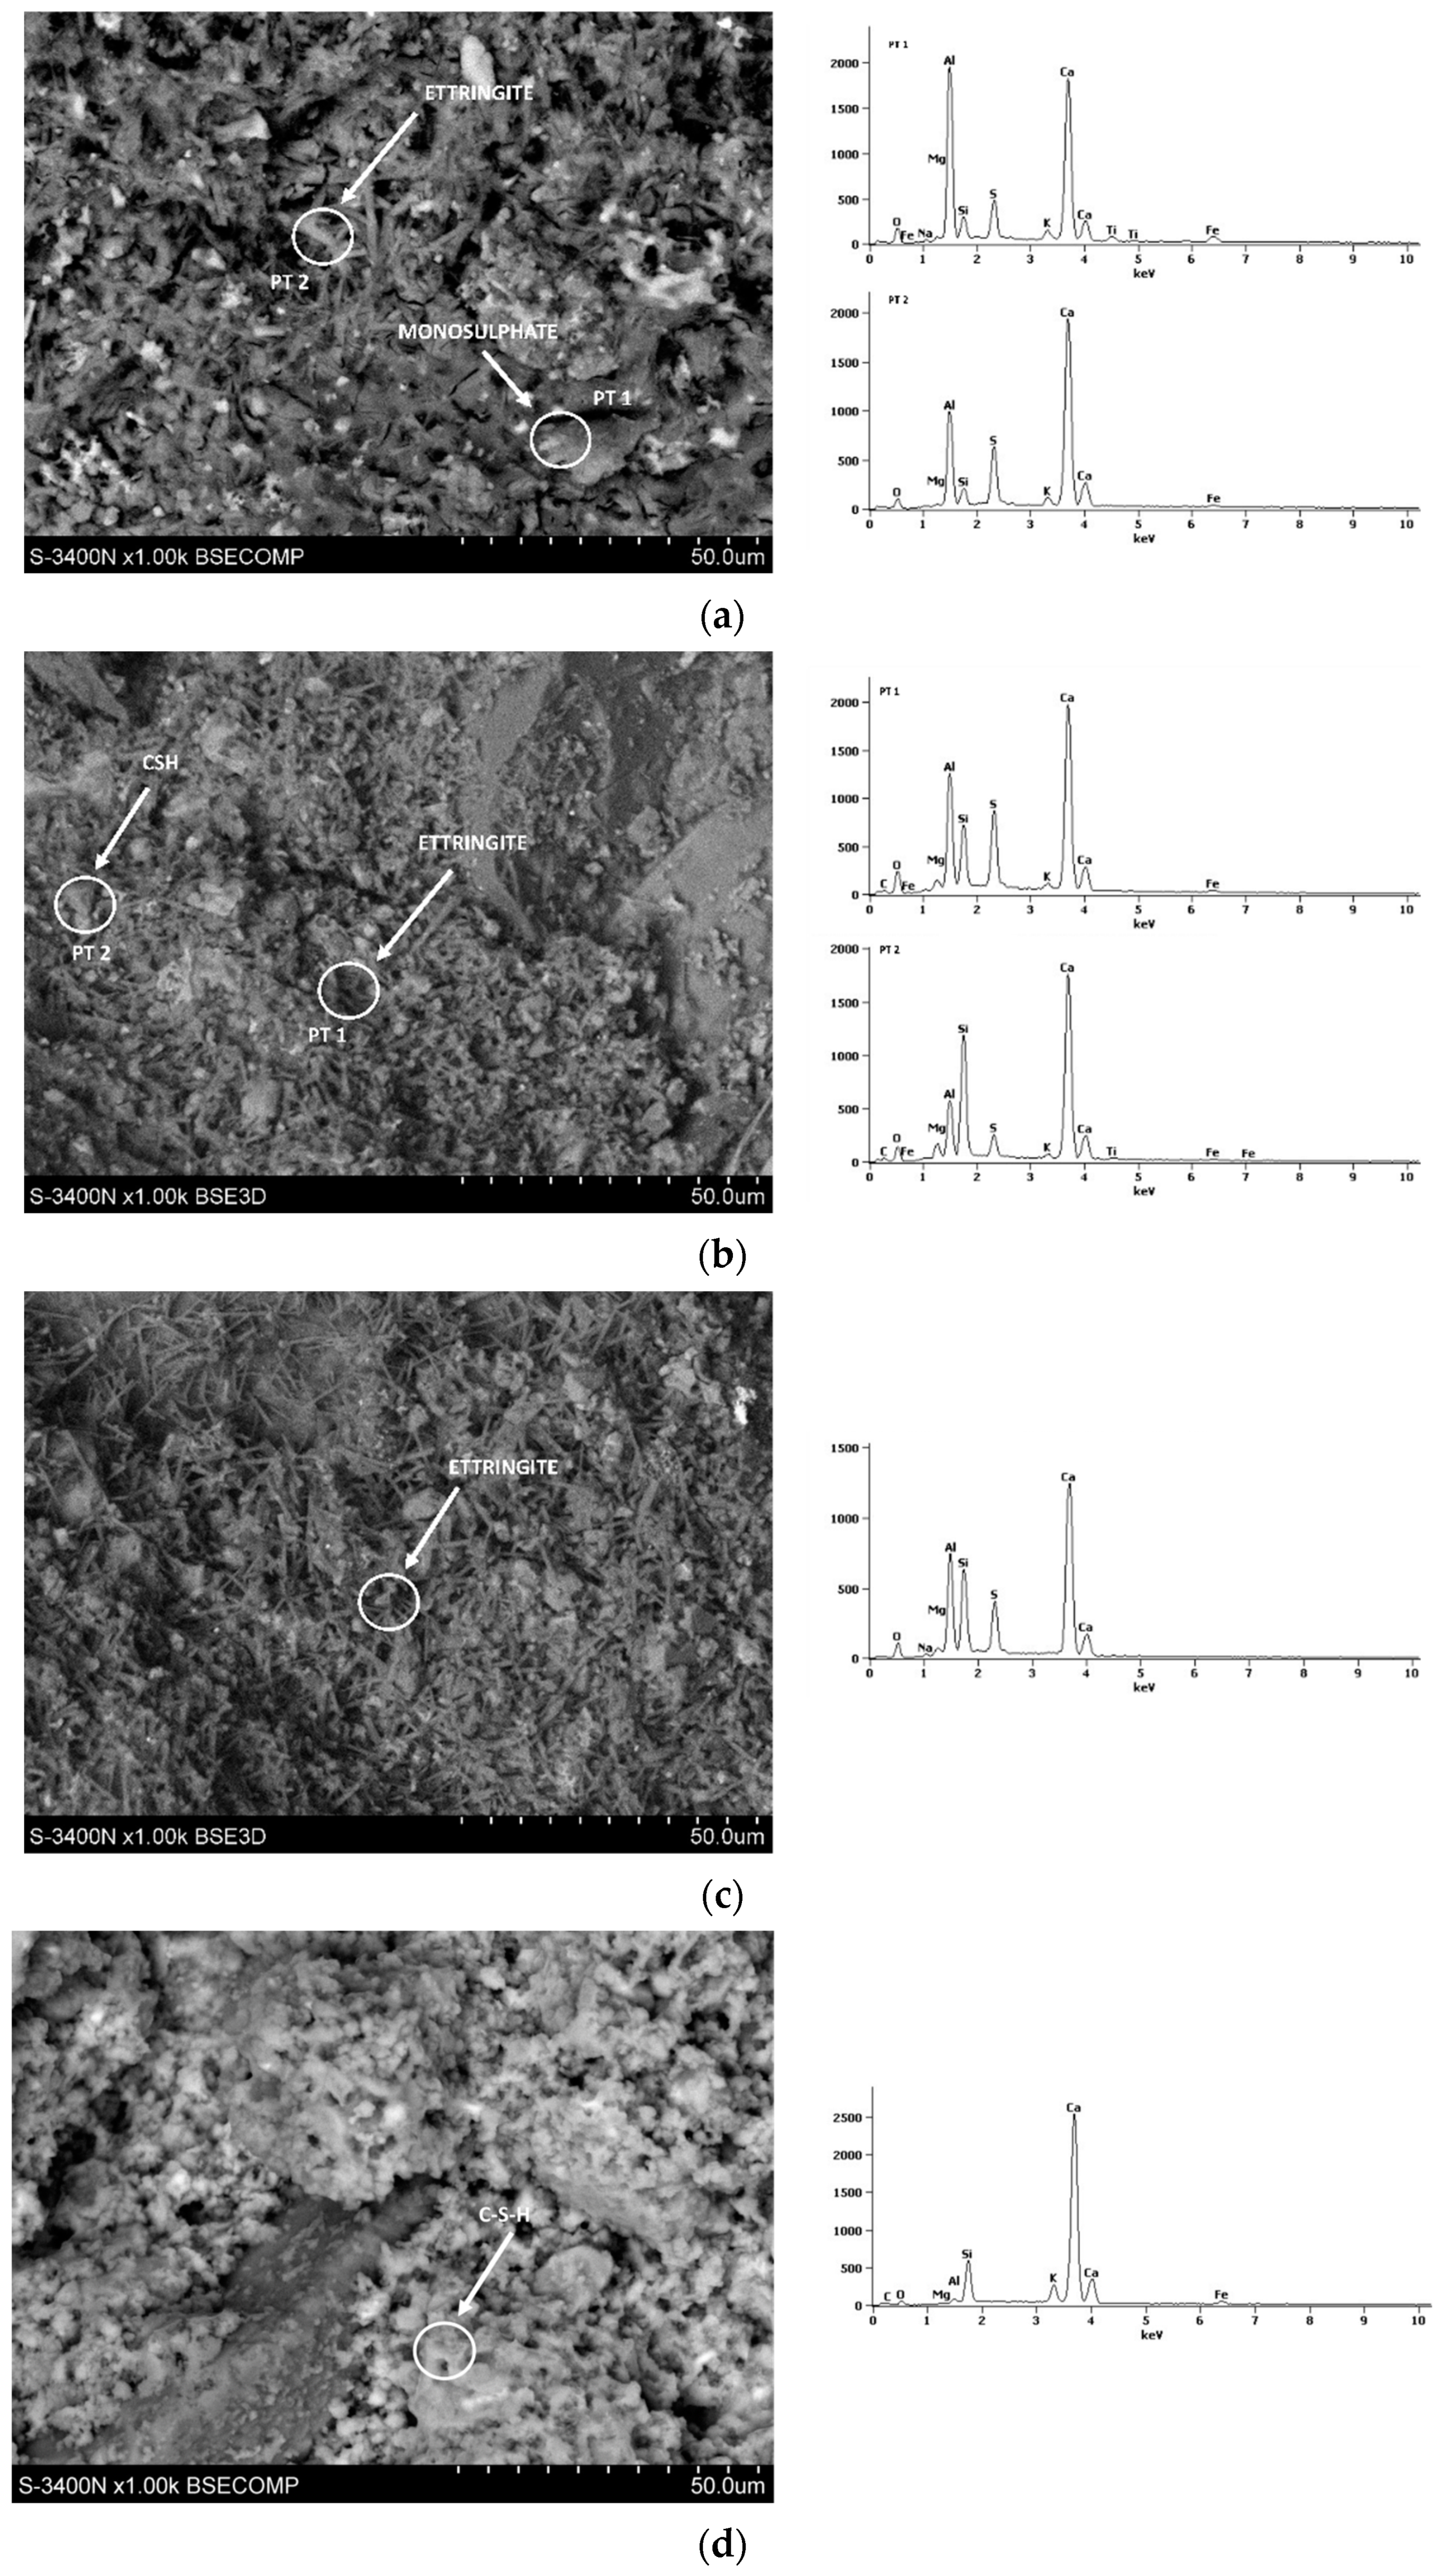
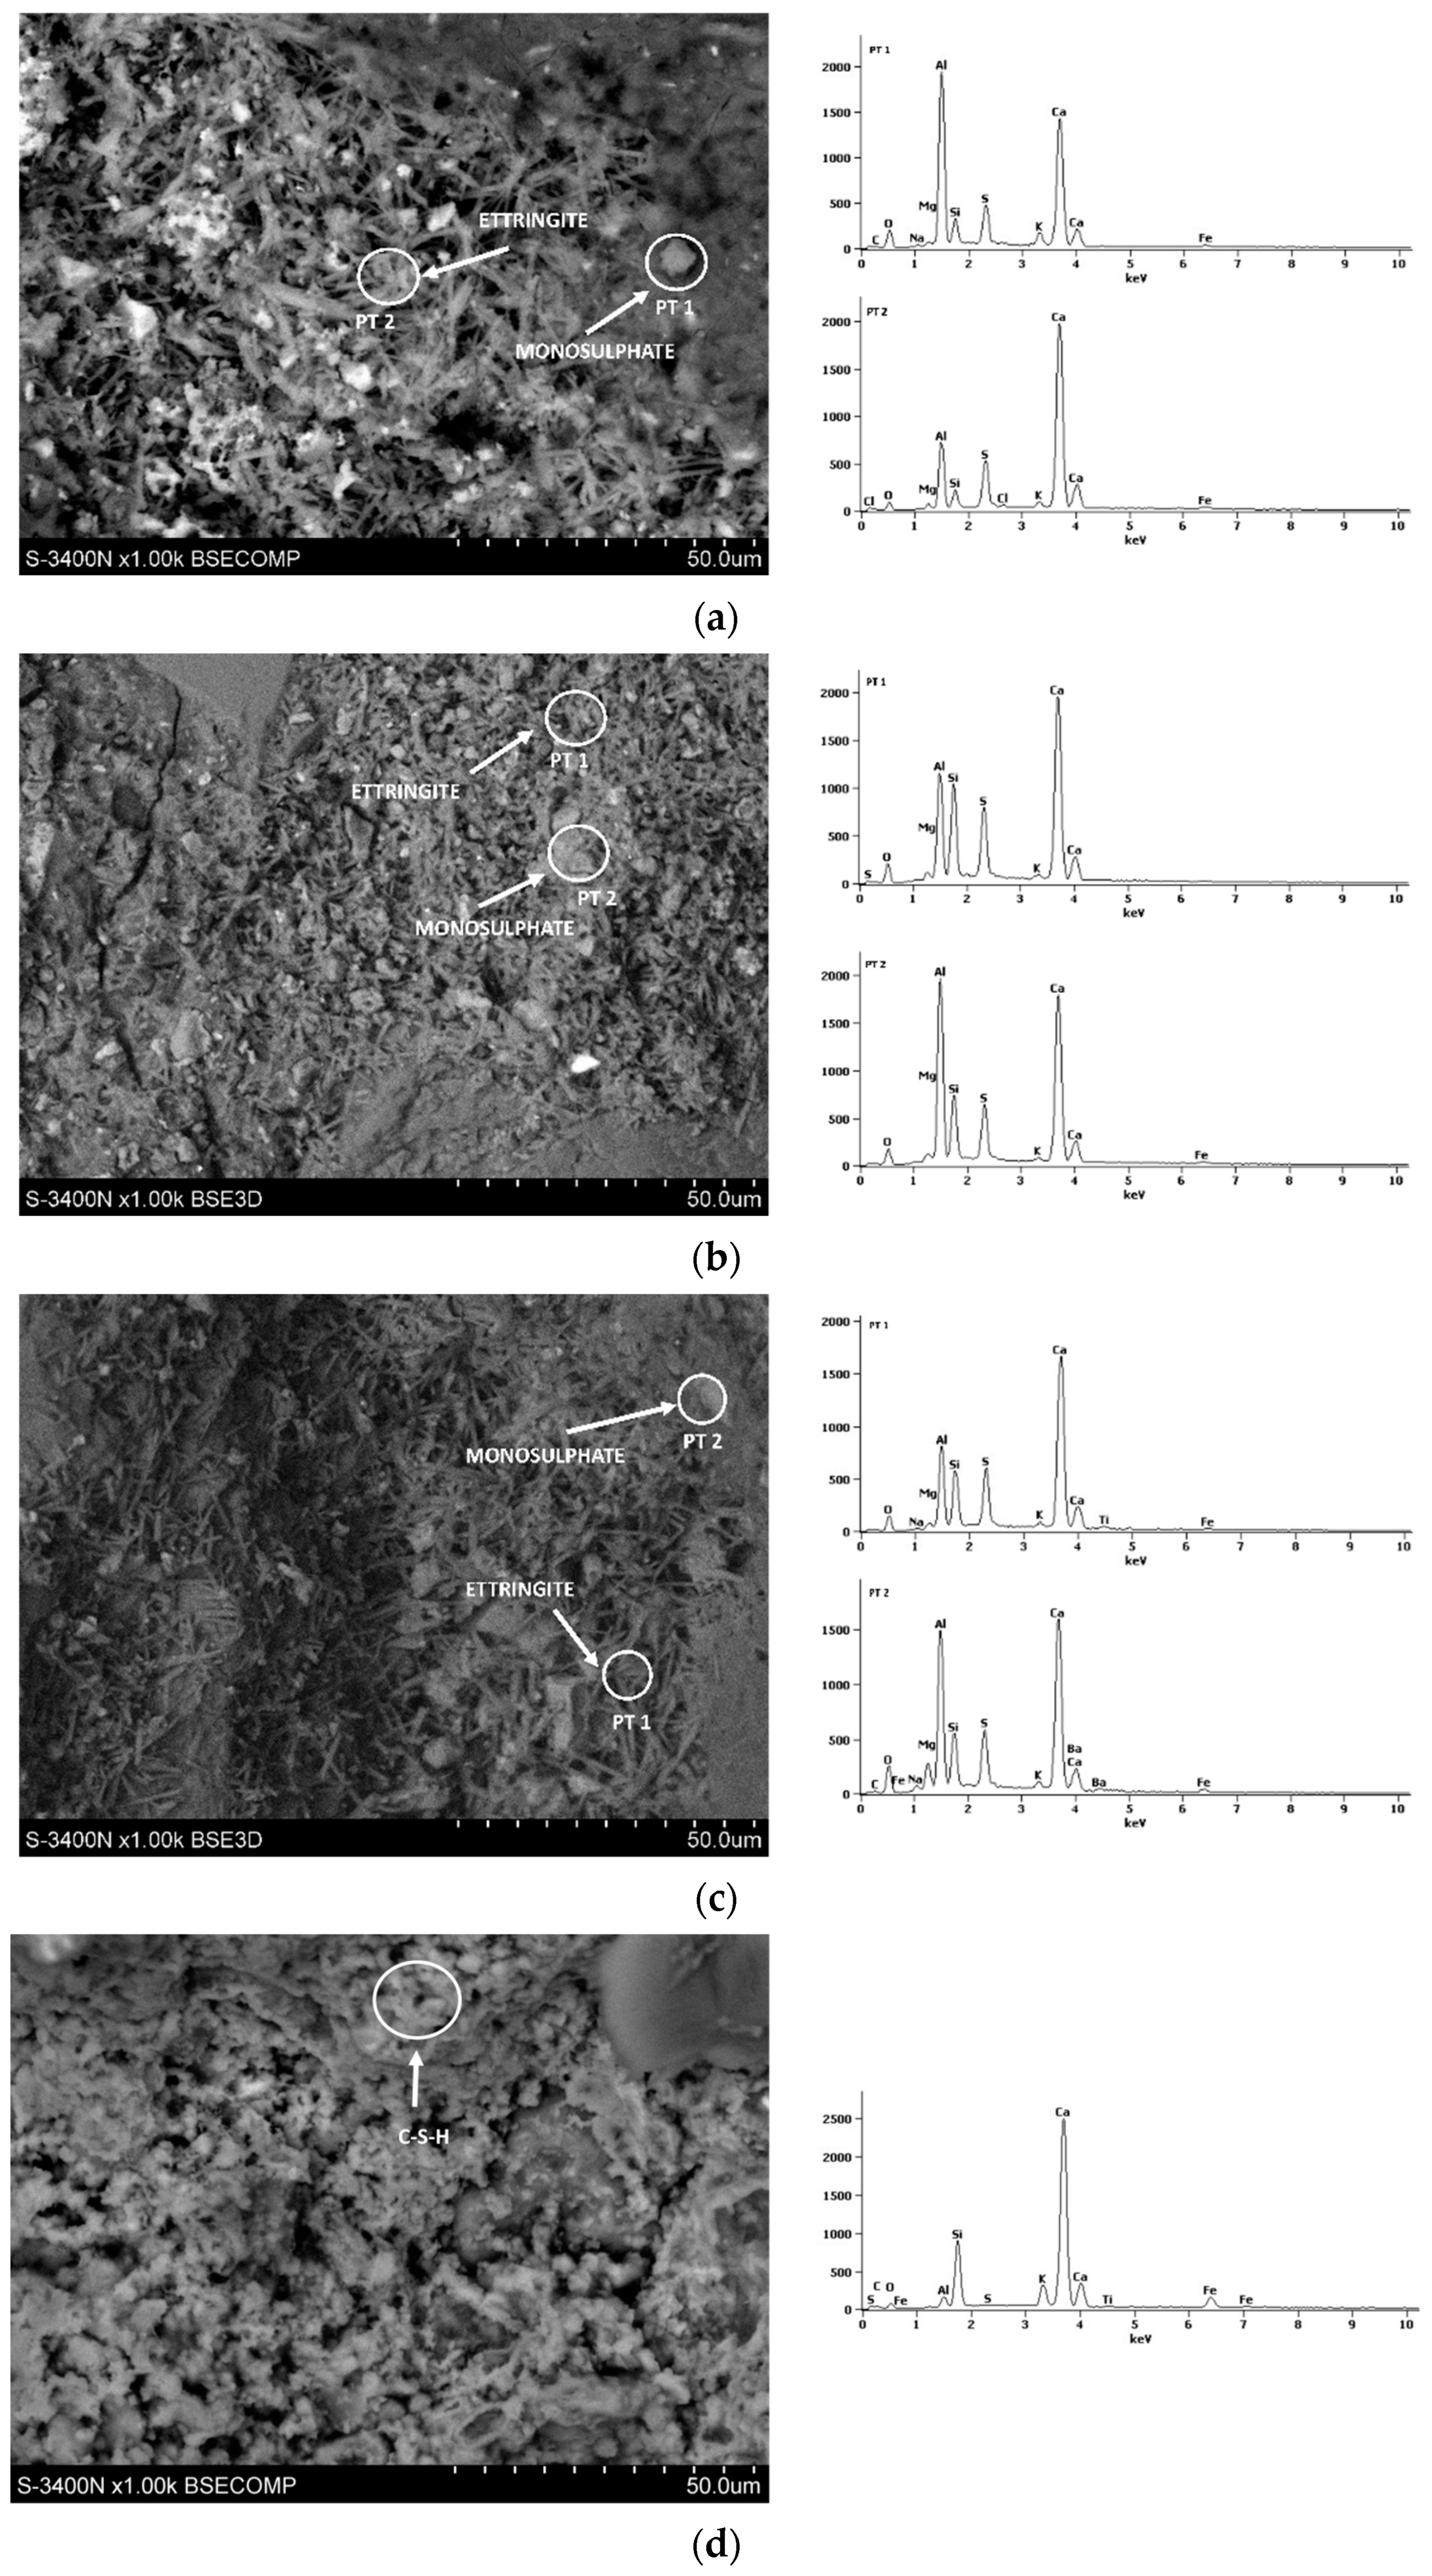
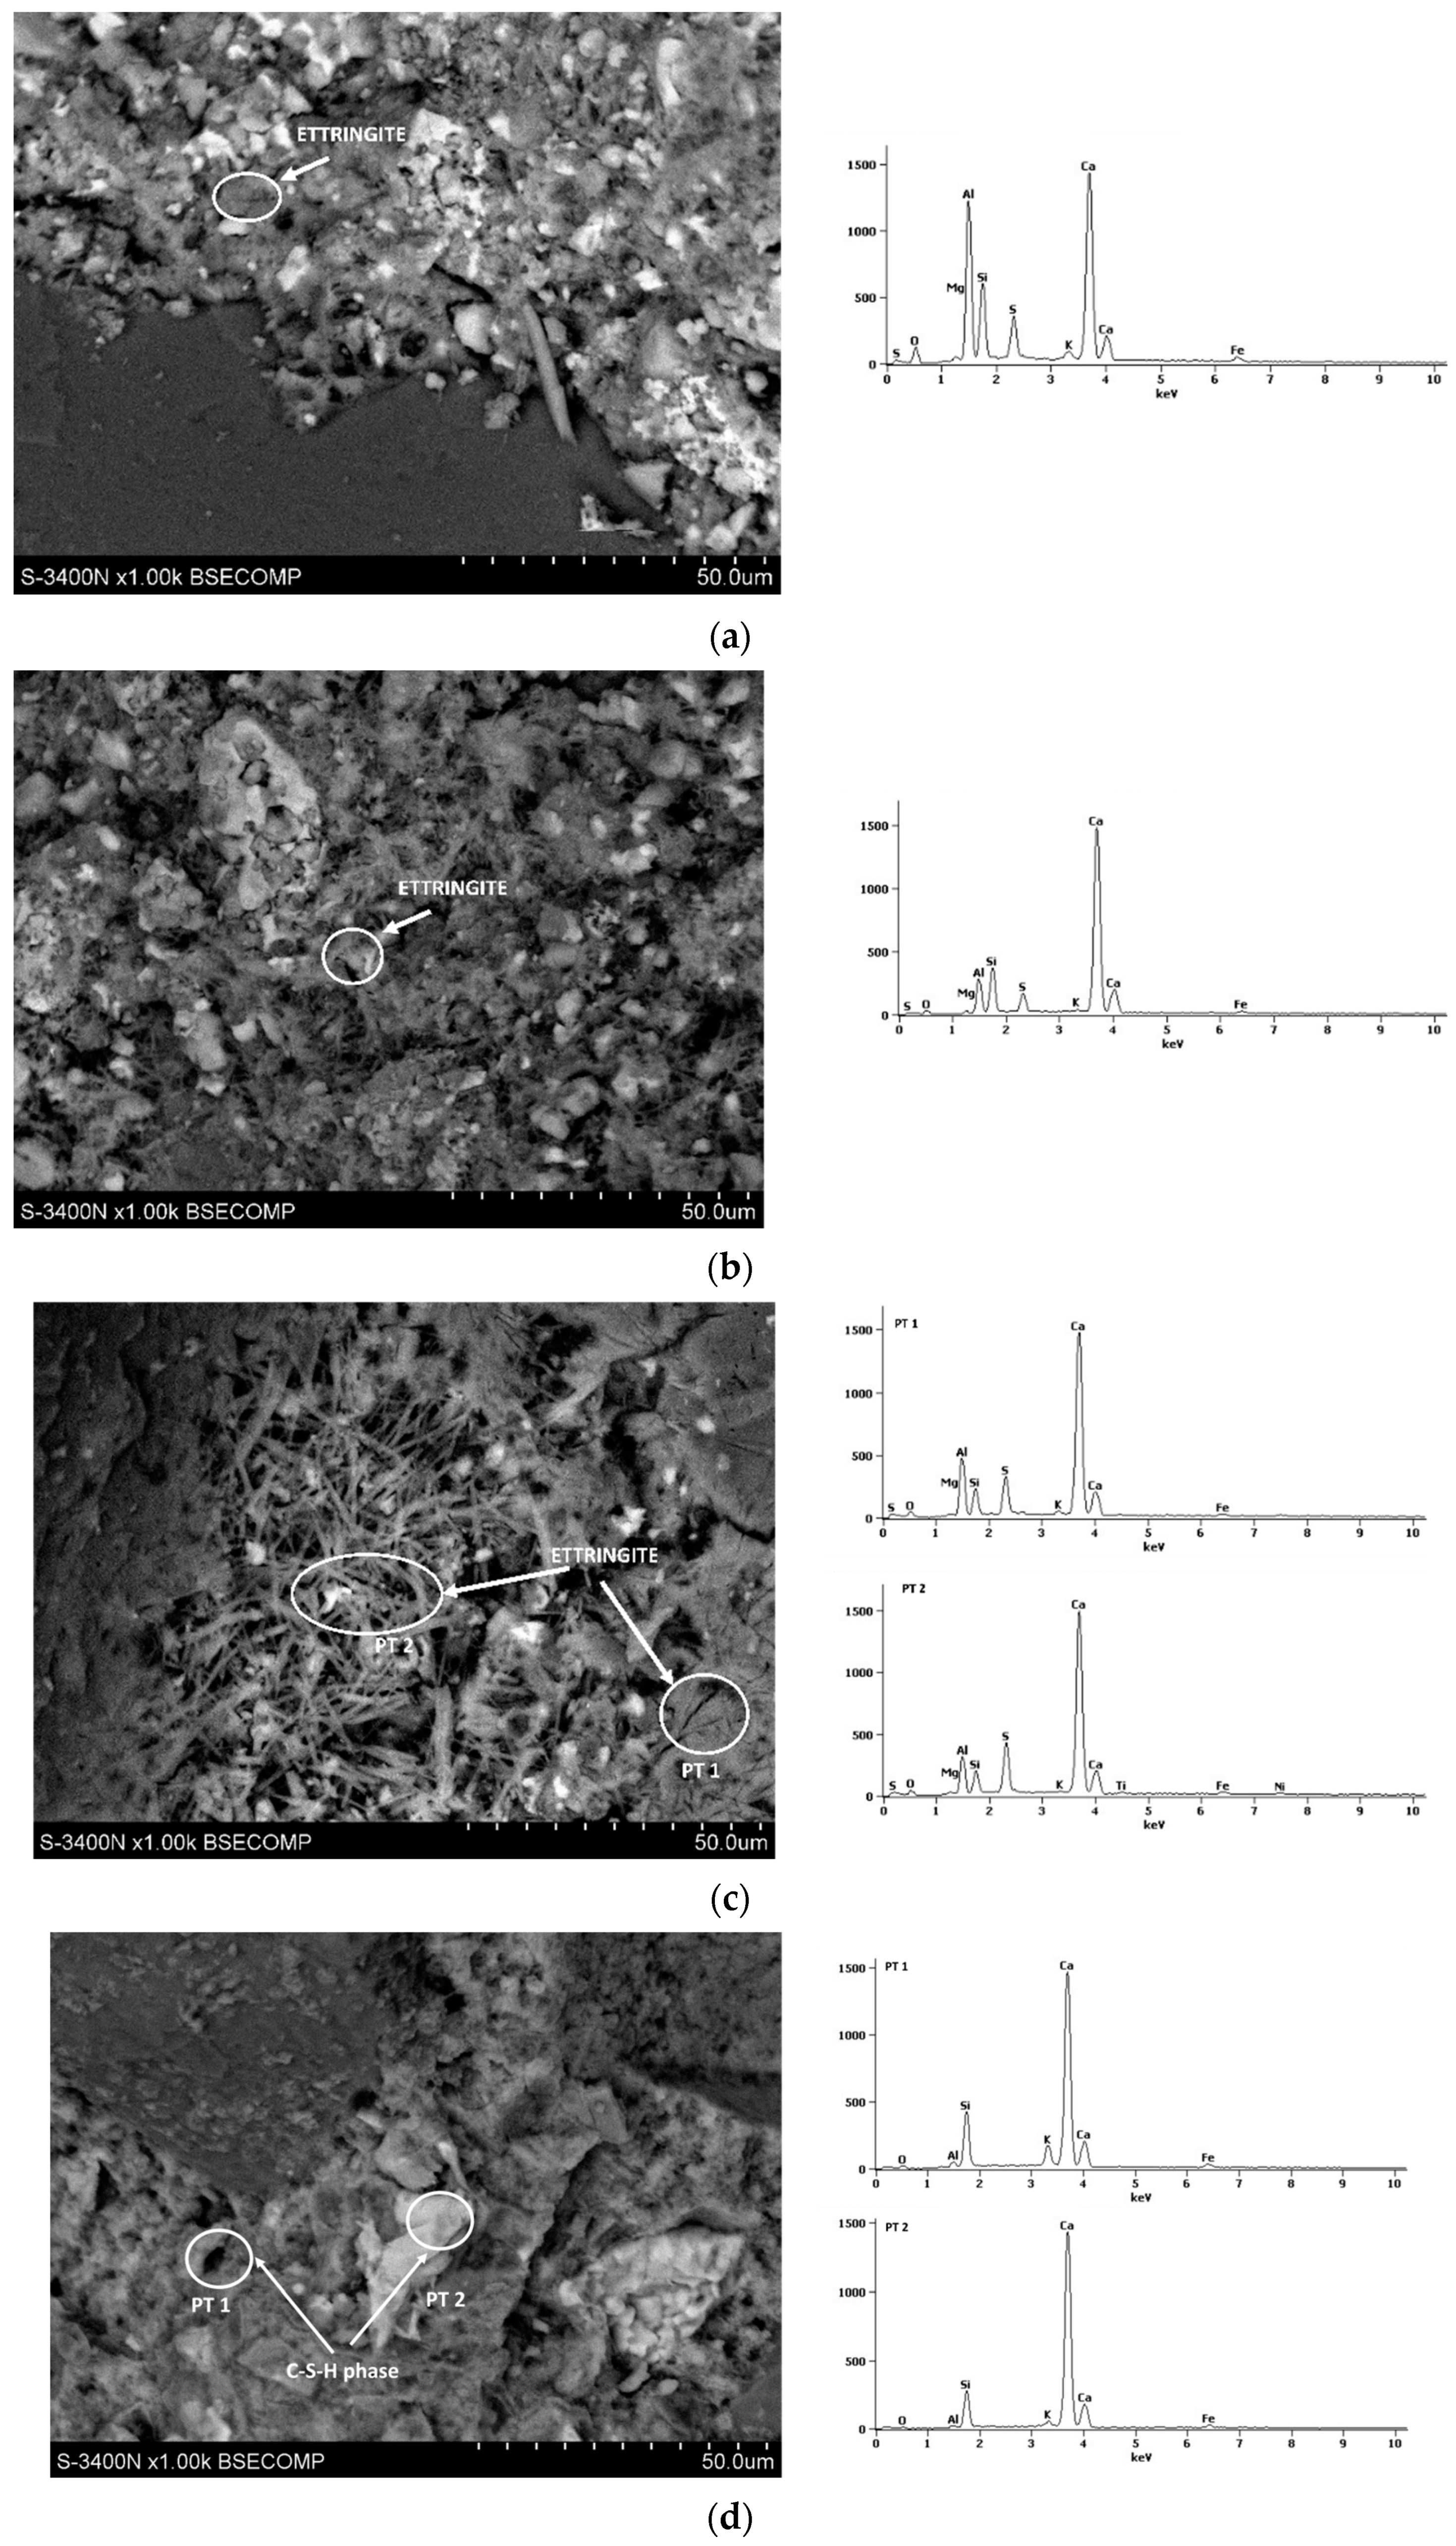
3.6. Microstructure of CSA Mortars
4. Conclusions
- Similarly to the OPC mortars, with the increase in w/c ratio, the initial setting time of CSA mortars increases due to the increased distance between cement particles.
- With the increase in the w/c ratio, the heat evolved also increases due to the higher rate of hydration. It must be noted, however, that a lower w/c ratio in CSA pastes leads to faster hydration and a higher main hydration peak; however, the induction phase is similar for all mortars, indicating that the difference in initial setting time observed during the Vicat test was based more on physical effects, rather than the hydration speed.
- An increase in water content in CSA mortar leads to a proportional increase in consistency.
- Both flexural and compressive strength are affected by w/c ratio, and, with the higher w/c ratio, a lower 28-day strength can be expected.
- A decrease in compressive and flexural strength was observed after 3 and 7 days, which may be linked to the phase change from the AFt to the AFm phase.
- CSA cements are characterized by a lower plastic and drying shrinkage than OPC cement due to the differences in their composition.
- The w/c ratio affects both plastic and drying shrinkage of CSA cements, and, with the increase in w/c ratio, the shrinkage also increases due to the higher water content.
- Differences were observed in the microstructure of CSA mortars with different w/c ratios, confirming that, after 3 and 7 days, the structures of CSA pastes with high amounts of water are less dense than those with a lower w/c ratio.
Author Contributions
Funding
Institutional Review Board Statement
Informed Consent Statement
Data Availability Statement
Conflicts of Interest
References
- van Ruijven, B.J.; van Vuuren, D.P.; Boskaljon, W.; Neelis, M.L.; Saygin, D.; Patel, M.K. Long-Term Model-Based Projections of Energy Use and CO2 Emissions from the Global Steel and Cement Industries. Resour. Conserv. Recycl. 2016, 112, 15–36. [Google Scholar] [CrossRef]
- Cc, I.E. Energy Technology Perspectives 2023; IEA: Amsterdam, The Netherlands, 2023. [Google Scholar]
- Scrivener, K.L.; John, V.M.; Gartner, E.M. Eco-Efficient Cements: Potential Economically Viable Solutions for a Low-CO2 Cement-Based Materials Industry. Cem. Concr. Res. 2018, 114, 2–26. [Google Scholar] [CrossRef]
- Habert, G. Assessing the Environmental Impact of Conventional and “green” Cement Production. In Eco-Efficient Construction and Building Materials: Life Cycle Assessment (LCA), Eco-Labelling and Case Studies; Elsevier Inc.: Amsterdam, The Netherlands, 2013; pp. 199–238. ISBN 978-0-85709-767-5. [Google Scholar]
- Naqi, A.; Jang, J.G. Recent Progress in Green Cement Technology Utilizing Low-Carbon Emission Fuels and Raw Materials: A Review. Sustainability 2019, 11, 537. [Google Scholar] [CrossRef]
- Aïtcin, P.-C. 4—Supplementary Cementitious Materials and Blended Cements. In Science and Technology of Concrete Admixtures; Aïtcin, P.-C., Flatt, R.J., Eds.; Woodhead Publishing: Cambridge, UK, 2016; pp. 53–73. ISBN 978-0-08-100693-1. [Google Scholar]
- Ramachandran, V.S.; Paroli, R.M.; Beaudoin, J.J.; Delgado, A.H. 8—Supplementary Cementing Materials and Other Additions. In Handbook of Thermal Analysis of Construction Materials; Ramachandran, V.S., Paroli, R.M., Beaudoin, J.J., Delgado, A.H., Eds.; William Andrew Publishing: Norwich, NY, USA, 2002; pp. 293–353. ISBN 978-0-8155-1487-9. [Google Scholar]
- Snellings, R.; Mertens, G.; Elsen, J. Supplementary Cementitious Materials. Rev. Mineral. Geochem. 2012, 74, 211–278. [Google Scholar] [CrossRef]
- Hooton, R.D.; Ramezanianpour, A.; Schutz, U. Decreasing the Clinker Component in Cementing Materials: Performance of Portland-Limestone Cements in Concrete in Combination with Supplementary Cementing Materials. In Proceedings of the NRMCA Concrete Sustainability Conference, Tempe, AZ, USA, 13–15 April 2010. [Google Scholar]
- Juenger, M.C.G.; Snellings, R.; Bernal, S.A. Supplementary Cementitious Materials: New Sources, Characterization, and Performance Insights. Cem. Concr. Res. 2019, 122, 257–273. [Google Scholar] [CrossRef]
- Coppola, L.; Bellezze, T.; Belli, A.; Bignozzi, M.C.; Bolzoni, F.; Brenna, A.; Cabrini, M.; Candamano, S.; Cappai, M.; Caputo, D.; et al. Binders Alternative to Portland Cement and Waste Management for Sustainable Construction—Part 1. J. Appl. Biomater. Funct. Mater. 2018, 16, 186–202. [Google Scholar] [CrossRef]
- Miller, S.A.; Horvath, A.; Monteiro, P.J.M. Readily Implementable Techniques Can Cut Annual CO2 Emissions from the Production of Concrete by over 20%. Environ. Res. Lett. 2016, 11, 074029. [Google Scholar] [CrossRef]
- Pacheco-Torgal, F.; Jalali, S.; Labrincha, J.; John, V.M. Eco-Efficient Concrete; Woodhead Publishing Series in Civil and Structural Engineering; Elsevier Science: Amsterdam, The Netherlands, 2013; ISBN 978-0-85709-899-3. [Google Scholar]
- Tao, Y.; Rahul, A.V.; Mohan, M.K.; De Schutter, G.; Van Tittelboom, K. Recent Progress and Technical Challenges in Using Calcium Sulfoaluminate (CSA) Cement. Cem. Concr. Compos. 2023, 137, 104908. [Google Scholar] [CrossRef]
- Nguyen, K.-S.; Nguyen-Ngoc, T.H.; Nguyen-Phung, A.T.; Do, Q.M. Preparation of Calcium Sulfoaluminate Cement from Bauxite/Red Mud of Tan Rai—Lam Dong. In Proceedings of the 7th International Conference of Asian Concrete Federation (ACF 2016), Hanoi, Vietnam, 30 October–2 November 2016. [Google Scholar]
- Taylor, H.F.W. Cement Chemistry, 2nd ed.; Academic Press: London, UK, 1990; ISBN 012683900X. [Google Scholar]
- Neville, A.M.; Brooks, J.J. Concrete Technology; Prentice Hall: Upper Saddle River, NJ, USA, 2010; ISBN 9780273755807. [Google Scholar]
- Chen, I.A.; Hargis, C.W.; Juenger, M.C.G.G. Understanding Expansion in Calcium Sulfoaluminate-Belite Cements. Cem. Concr. Res. 2012, 42, 51–60. [Google Scholar] [CrossRef]
- Aranda, M.A.G.; De la Torre, A.G. Sulfoaluminate Cement. In Eco-Efficient Concrete; Woodhead Publishing Limited: Cambridge, UK, 2013; pp. 488–522. ISBN 9780857094247. [Google Scholar]
- Wang, P.; Li, N.; Xu, L. Hydration Evolution and Compressive Strength of Calcium Sulphoaluminate Cement Constantly Cured over the Temperature Range of 0 to 80 °C. Cem. Concr. Res. 2017, 100, 203–213. [Google Scholar] [CrossRef]
- Bernardo, G.; Telesca, A.; Valenti, G.L. A Porosimetric Study of Calcium Sulfoaluminate Cement Pastes Cured at Early Ages. Cem. Concr. Res. 2006, 36, 1042–1047. [Google Scholar] [CrossRef]
- Pelletier-Chaignat, L.; Winnefeld, F.; Lothenbach, B.; Müller, C.J. Beneficial Use of Limestone Filler with Calcium Sulphoaluminate Cement. Constr. Build. Mater. 2012, 26, 619–627. [Google Scholar] [CrossRef]
- Sirtoli, D.; Wyrzykowski, M.; Riva, P.; Lura, P. Autogenous and Drying Shrinkage of Mortars Based on Portland and Calcium Sulfoaluminate Cements. Mater. Struct./Mater. Constr. 2020, 53, 126. [Google Scholar] [CrossRef]
- Chaunsali, P.; Mondal, P. Influence of Calcium Sulfoaluminate (CSA) Cement Content on Expansion and Hydration Behavior of Various Ordinary Portland Cement-CSA Blends. J. Am. Ceram. Soc. 2015, 98, 2617–2624. [Google Scholar] [CrossRef]
- Herrmann, P. Investigation of Fresh and Hardened Properties of Calcium Sulfoaluminate (CSA) Cement Blends. Mag. Civ. Eng. 2014, 47, 63–70. [Google Scholar] [CrossRef]
- García-Maté, M.; De La Torre, A.G.; León-Reina, L.; Aranda, M.A.G.; Santacruz, I. Hydration Studies of Calcium Sulfoaluminate Cements Blended with Fly Ash. Cem. Concr. Res. 2013, 54, 12–20. [Google Scholar] [CrossRef]
- Lea, F.M. The Chemistry of Cement and Concrete; Chemical Publishing Co.: New York, NY, USA, 1971. [Google Scholar]
- Mather, B.; Hime, W.G. Amount of Water Required for Complete Hydration of Portland Cement. Concr. Int. 2002, 24, 56–58. [Google Scholar]
- Dachtar, J. Calcium Sulfoaluminate Cement as Binder for Structural Concrete. Ph.D. Thesis, University of Sherffiled, Sherffiled, UK, 2004. [Google Scholar]
- Dovál, M.; Palou, M.; Kovár, V. Heat Evolution and Mechanism of Hydration in CaO-Al2O3-SO3 System. Ceram. Silik. 2005, 49, 104–108. [Google Scholar]
- Zhang, Y.; Chang, J.; Ji, J. AH3 Phase in the Hydration Product System of AFt-AFm-AH3 in Calcium Sulfoaluminate Cements: A Microstructural Study. Constr. Build. Mater. 2018, 167, 587–596. [Google Scholar] [CrossRef]
- Wang, C.; Song, M. Influence of Water-Cement Ratio and Type of Mixing Water on the Early Hydration Performance of Calcium Sulphoaluminate (CSA) Cement. Adv. Mater. Sci. Eng. 2021, 2021, 5557763. [Google Scholar] [CrossRef]
- Gołaszewska, M.; Klemczak, B.; Gołaszewski, J. Thermal Properties of Calcium Sulphoaluminate Cement as an Alternative to Ordinary Portland Cement. Materials 2021, 14, 7011. [Google Scholar] [CrossRef]
- Tang, S.W.; Zhu, H.G.; Li, Z.J.; Chen, E.; Shao, H.Y. Hydration Stage Identification and Phase Transformation of Calcium Sulfoaluminate Cement at Early Age. Constr. Build. Mater. 2015, 75, 11–18. [Google Scholar] [CrossRef]
- Tang, S.W.; He, Z.; Cai, X.H.; Cai, R.J.; Zhou, W.; Li, Z.J.; Shao, H.Y.; Wu, T.; Chen, E. Volume and Surface Fractal Dimensions of Pore Structure by NAD and LT-DSC in Calcium Sulfoaluminate Cement Pastes. Constr. Build. Mater. 2017, 143, 395–418. [Google Scholar] [CrossRef]
- Tang, S.W.; Cai, X.H.; Zhou, W.; Shao, H.Y.; He, Z.; Li, Z.J.; Ji, W.M.; Chen, E. In-Situ and Continuous Monitoring of Pore Evolution of Calcium Sulfoaluminate Cement at Early Age by Electrical Impedance Measurement. Constr. Build. Mater. 2016, 117, 8–19. [Google Scholar] [CrossRef]
- Zhang, J.; Ke, G.; Liu, Y. Early Hydration Heat of Calcium Sulfoaluminate Cement with Influences of Supplementary Cementitious Materials and Water to Binder Ratio. Materials 2021, 14, 642. [Google Scholar] [CrossRef]
- Burris, L.E.; Kurtis, K.E. Water-to-Cement Ratio of Calcium Sulfoaluminate Belite Cements: Hydration, Setting Time, and Strength Development. Cement 2022, 8, 100032. [Google Scholar] [CrossRef]
- Koga, G.Y.; Albert, B.; Nogueira, R.P. On the Hydration of Belite-Ye’elimite-Ferrite (BYF) Cement Pastes: Effect of the Water-to-Cement Ratio and Presence of Fly Ash. Cem. Concr. Res. 2020, 137, 106215. [Google Scholar] [CrossRef]
- Pérez-Bravo, R.; Morales-Cantero, A.; Bruscolini, M.; Aranda, M.A.G.; Santacruz, I.; De la Torre, A.G. Effect of Boron and Water-to-Cement Ratio on the Performances of Laboratory Prepared Belite-Ye’elimite-Ferrite (BYF) Cements. Materials 2021, 14, 4862. [Google Scholar] [CrossRef]
- EN 196-1:2016; Methods of Testing Cement. Determination of Strength. European Standards: Brussels, Belgium, 2016.
- EN 196-3:2016; Methods of Testing Cement. Determination of Setting Times and Soundness. European Standards: Brussels, Belgium, 2016.
- EN 196-11; Methods of Testing Cement. Heat of Hydration. Isothermal Conduction Calorimetry Method. European Standards: Brussels, Belgium, 2019.
- Greim, M.; Teubert, O. Appliance for Detecting Initial Expansion and Shrinkage Behavior of Building Materials Based on Contactless Measurement of Change in Filling Level of Container of Fresh Material Specimens until Set. 2011. Patent DE10046284 (B4), 22 November 2011. [Google Scholar]
- Kucharczyková, B.; Kocáb, D.; Rozsypalová, I.; Karel, O.; Misák, P.; Vymazal, T. Measurement and Evaluation Proposal of Early Age Shrinkage of Cement Composites Using Shrinkage-Cone. In IOP Conference Series: Materials Science and Engineering; IOP Publishing: Bristol, UK, 2018; Volume 379. [Google Scholar]
- EN 12617-4:2004; Products and Systems for the Protection and Repair of Concrete Struc-Tures—Test Methods—Part 4: Determination of Shrinkage and Expansion. European Standards: Brussels, Belgium, 2004.
- Stefanou, G.D.; Larsinos, C. Influence of Mixing Water on the Setting Time of Concrete. Int. J. Cem. Compos. Lightweight Concr. 1981, 3, 45–48. [Google Scholar] [CrossRef]
- Sant, G.; Ferraris, C.F.; Weiss, J. Rheological Properties of Cement Pastes: A Discussion of Structure Formation and Mechanical Property Development. Cem. Concr. Res. 2008, 38, 1286–1296. [Google Scholar] [CrossRef]
- Bobrowski, A.; Nocuń-Wczelik, W.; Gawlicki, M.; Lagosz, A.; Kazimierz; Lój, G. Cement: Metody Badań, Wybrane Kierunki Stosowania; Wydawnictwa AGH: Kraków, Poland, 2015; ISBN 978-83-7464-809-7. [Google Scholar]
- Hu, J.; Ge, Z.; Wang, K. Influence of Cement Fineness and Water-to-Cement Ratio on Mortar Early-Age Heat of Hydration and Set Times. Constr. Build. Mater. 2014, 50, 657–663. [Google Scholar] [CrossRef]
- Berger, S.; Coumes, C.C.D.; Le Bescop, P.; Damidot, D. Influence of a Thermal Cycle at Early Age on the Hydration of Calcium Sulphoaluminate Cements with Variable Gypsum Contents. Cem. Concr. Res. 2011, 41, 149–160. [Google Scholar] [CrossRef]
- Winnefeld, F.; Lothenbach, B. Hydration of Calcium Sulfoaluminate Cements—Experimental Findings and Thermodynamic Modelling. Cem. Concr. Res. 2010, 40, 1239–1247. [Google Scholar] [CrossRef]
- EN 1015-3; Methods of Test for Mortar for Masonry—Part 3: Determination of Consistence of Fresh Mortar (by Flow Table). European Standards: Brussels, Belgium, 1999.
- Brien, J.V.; Henke, K.R.; Mahboub, K.C. Observations of Peak Strength Behavior in CSA Cement Mortars. J. Green Build. 2013, 8, 97–115. [Google Scholar] [CrossRef]
- Skoblinskaya, N.N.; Krasilnikov, K.G.; Nikitina, L.V.; Varlamov, V.P. Changes in Crystal Structure of Ettringite on Dehydration. 2. Cem. Concr. Res. 1975, 5, 419–431. [Google Scholar] [CrossRef]
- Skoblinskaya, N.N.; Krasilnikov, K.G. Changes in Crystal Structure of Ettringite on Dehydration. 1. Cem. Concr. Res. 1975, 5, 381–393. [Google Scholar] [CrossRef]
- Zhou, Q.; Lachowski, E.E.; Glasser, F.P. Metaettringite, a Decomposition Product of Ettringite. Cem. Concr. Res. 2004, 34, 703–710. [Google Scholar] [CrossRef]
- Pourchez, J.; Valdivieso, F.; Grosseau, P.; Guyonnet, R.; Guilhot, B. Kinetic Modelling of the Thermal Decomposition of Ettringite into Metaettringite. Cem. Concr. Res. 2006, 36, 2054–2060. [Google Scholar] [CrossRef]
- Zhou, Q.; Glasser, F.P. Thermal Stability and Decomposition Mechanisms of Ettringite at <120°C. Cem. Concr. Res. 2001, 31, 1333–1339. [Google Scholar] [CrossRef]
- Fridrichová, M.; Dvořák, K.; Gazdič, D.; Mokrá, J.; Kulísek, K. Thermodynamic Stability of Ettringite Formed by Hydration of Ye’elimite Clinker. Adv. Mater. Sci. Eng. 2016, 2016, 9280131. [Google Scholar] [CrossRef]
- Mehta, P.K. Mechanism of Expansion Associated with Ettringite Formation. Cem. Concr. Res. 1973, 3, 1–6. [Google Scholar] [CrossRef]
- Xie, Y.; Qian, C. Improved Ettringite Stabilization by Calcium Carbonate and Calcium Nitrate Additions in Ternary PC-CSA-C$ Systems. Cem. Concr. Res. 2024, 175, 107383. [Google Scholar] [CrossRef]
- Trauchessec, R.; Mechling, J.-M.; Lecomte, A.; Roux, A.; Le Rolland, B. Hydration of Ordinary Portland Cement and Calcium Sulfoaluminate Cement Blends. Cem. Concr. Compos. 2015, 56, 106–114. [Google Scholar] [CrossRef]
- Rüsch, H.; Jungwirth, D.; Hilsdorf, H.K.; Rüsch, H.; Jungwirth, D.; Hilsdorf, H.K. Creep and Shrinkage; Springer: New York, NY, USA, 1983. [Google Scholar]


| Cement | Constituent [%] | |||||||||
|---|---|---|---|---|---|---|---|---|---|---|
| LOI | SiO2 | Al2O3 | Fe2O3 | CaO | MgO | SO3 | Na2O | K2O | Na2Oeq | |
| CSA | 0.46 | 9.2 | 28.1 | 1.52 | 39.2 | 3.5 | 11.4 | 0.08 | 0.35 | - |
| OPC | 2.44 | 20.6 | 4.7 | 2.8 | 64.4 | 1.2 | 2.8 | 0.2 | 0.4 | 0.46 |
| Cement Property | Unit | Value for | |
|---|---|---|---|
| CSA | OPC | ||
| Initial setting time | min | 45 | 185 |
| Soundness of cement, by Le Chatelier’s method | mm | 1 | 0.3 |
| Compressive strength: | |||
| at 2 days | MPa | 42.0 | 28.06 |
| at 28 days | MPa | 67.7 | 57 |
| Specific surface area | cm2/g | 5500 | 4250 |
| Mortar Type | Cement [g] | Water [g] | Sand [g] |
|---|---|---|---|
| OPC w/c = 0.5 | 450 | 225 | 1350 |
| CSA w/c = 0.60 | 270 | ||
| CSA w/c = 0.55 | 247.5 | ||
| CSA w/c = 0.50 | 225 | ||
| CSA w/c = 0.45 | 202.5 | ||
| CSA w/c = 0.40 | 180 |
| Time | Flexural Strength | Compressive Strength | ||
|---|---|---|---|---|
| F | p | F | p | |
| 1 day | 34.81 | 0.000 | 21.20 | 0.000 |
| 2 days | 1.579 | 0.000 | 14.64 | 0.000 |
| 3 days | 47.35 | 0.269 | 20.93 | 0.000 |
| 7 days | 89.11 | 0.000 | 66.04 | 0.000 |
| 28 days | 10.74 | 0.004 | 52.71 | 0.000 |
Disclaimer/Publisher’s Note: The statements, opinions and data contained in all publications are solely those of the individual author(s) and contributor(s) and not of MDPI and/or the editor(s). MDPI and/or the editor(s) disclaim responsibility for any injury to people or property resulting from any ideas, methods, instructions or products referred to in the content. |
© 2024 by the authors. Licensee MDPI, Basel, Switzerland. This article is an open access article distributed under the terms and conditions of the Creative Commons Attribution (CC BY) license (https://creativecommons.org/licenses/by/4.0/).
Share and Cite
Gołaszewska, M.; Gołaszewski, J.; Chmiela, B. Effect of Water to Cement Ratio on Properties of Calcium Sulfoaluminate Cement Mortars. Materials 2024, 17, 2806. https://doi.org/10.3390/ma17122806
Gołaszewska M, Gołaszewski J, Chmiela B. Effect of Water to Cement Ratio on Properties of Calcium Sulfoaluminate Cement Mortars. Materials. 2024; 17(12):2806. https://doi.org/10.3390/ma17122806
Chicago/Turabian StyleGołaszewska, Małgorzata, Jacek Gołaszewski, and Bartosz Chmiela. 2024. "Effect of Water to Cement Ratio on Properties of Calcium Sulfoaluminate Cement Mortars" Materials 17, no. 12: 2806. https://doi.org/10.3390/ma17122806