Article

Experimental Investigation on the Influence of Water on Rockburst in Rock-like Material with Voids and Multiple Fractures

1
School of Building Engineering, Hunan Institute of Engineering, Xiangtan 411104, China
2
School of Resource, Environment and Safety Engineering, Hunan University of Science and Technology, Xiangtan 411201, China
3
Innovation Institute of Advanced Functional Materials, Hunan Institute of Engineering, Xiangtan 411104, China
*
Author to whom correspondence should be addressed.
Materials 2024, 17(12), 2818; https://doi.org/10.3390/ma17122818
Submission received: 6 May 2024 / Revised: 1 June 2024 / Accepted: 4 June 2024 / Published: 10 June 2024

Abstract

:
To investigate the influence of water content on the rockburst phenomena in tunnels with horizontal joints, experiments were conducted on simulated rock specimens exhibiting five distinct levels of water absorption. Real-time monitoring of the entire blasting process was facilitated through a high-speed camera system, while the microscopic structure of the rockburst debris was analyzed using scanning electron microscopy (SEM) and a particle size analyzer. The experimental findings revealed that under varying degrees of water absorption, the specimens experienced three stages: debris ejection; rockburst; and debris spalling. As water content increased gradually, the intensity of rockburst in the specimens was mitigated. This was substantiated by a decline in peak stress intensity, a decrease in elastic modulus, delayed manifestation of pre-peak stress drop, enhanced amplitude, diminished elastic potential energy, and augmented dissipation energy, resulting in an expanded angle of rockburst debris ejection. With increasing water content, the bond strength between micro-particles was attenuated, resulting in the disintegration of the bonding material. Deformation failure was defined by the expansion of minuscule pores, gradual propagation of micro-cracks, augmentation of fluffy fine particles, exacerbation of structural surface damage akin to a honeycomb structure, diminishment of particle diameter, and a notable increase in quantity. Furthermore, the augmentation of secondary cracks and shear cracks, coupled with the enlargement of spalling areas, signified the escalation of deformation failure. Simultaneously, the total mass of rockburst debris gradually diminished, accompanied by a corresponding decrease in the proportion of micro and fine particles within the debris.

1. Introduction

To meet the increasing energy demand, energy extraction is moving toward deeper levels, posing new challenges [1,2,3,4,5]. Rockburst, an abrupt and instantaneous engineering disaster, is triggered by deep construction, releasing energy along the free face, causing severe brittle damage and deformation [6,7,8]. These disasters threaten the safety of construction personnel, disrupt construction progress, and shorten equipment lifespan, posing a significant limitation to deep tunnel construction [9]. Extensive engineering research shows that rockbursts happen in arid regions, while natural rock masses have joint fissures [10,11,12]. Understanding the deformation and failure traits of such rock masses’ underwater influence is crucial [12,13,14,15,16].
When encountering rockburst phenomena in nature, researchers have often simulated actual working conditions in laboratory experiments to study rockburst mechanisms and inducing factors. Thus, laboratory simulation of rockburst experiments has become the mainstream approach for exploring rockburst issues. In recent years, scholars worldwide have conducted extensive research through laboratory experiments and numerical simulations, achieving significant results.
By conducting indoor rockburst experiments with prefabricated hole defects to simulate natural tunnel conditions, Gong et al. [17] concluded that during rock fracture and bursting, the damage zones on both sidewalls form two symmetrical V-shaped notches. The line connecting the centers of these notches is perpendicular to the direction of the maximum principal stress. In simulating rockburst using rock-like materials, Klammer et al. [18] showed that both stiffness and shape at the grain scale significantly influenced the intrinsic proneness to strainburst in rocks. Elongated grain shape, specific grain boundary characteristics, and a high stiffness contrast within the sample promote early crack initiation and propagation. Researching rockburst in fractured or faulted rock masses around deep tunnels [19,20], Amin Manouchehrian et al. [21] showed that the presence of a fault near a tunnel could induce rockburst if the fault was positioned and oriented in such a way that it promoted high stress and low-mine system stiffness. Researching the impact of moisture content on rockburst in rock masses [22], S Luo et al. [23] concluded that under uniaxial compression, the presence of water greatly degraded the peak strength, peak strain, and elastic modulus of the red sandstone. S Akdag et al. [24] and Chen et al. [25] conducted true triaxial experiments on various hard brittle rocks combined with SEM, discussing how differences in the intrinsic microstructure and fracture evolution in rocks were the primary factors leading to various rockbursts. Lin et al. [26] analyzed rockburst fragments using electron microscopy scanning, noting that damage from splitting mode failure was less severe than that from shear mode failure, with the primary mode of damage varying across different loading gradients.
The aforementioned results are abundant and highly representative, playing a crucial role in revealing the mechanisms and influencing factors of rockburst. However, existing research lacks studies on rockbursts in tunnels with varying moisture levels, especially in deep tunnels with natural fractures or defects caused by artificial excavation. Therefore, this study uses the Central Depression Zone of the Songliao Basin as a case study to prepare specimens with different water absorption levels, with prefabricated holes simulating deep tunnels and multiple prefabricated cracks simulating fractures around the rock mass. Uniaxial compression failure tests were conducted, and a high-speed camera system was employed to capture the rockburst process. Scanning electron microscopy and particle analyzers were utilized to analyze the microstructure of the rockburst. This study examined the uniaxial compressive strength, energy change trends, microstructural damage, crack propagation characteristics, and variation in rockburst fragments in single-hole specimens with multiple fractures under different water absorption levels. The results provide valuable insights for disaster prevention and mitigation in water-bearing deep tunnels with fractures.

2. Materials and Methods

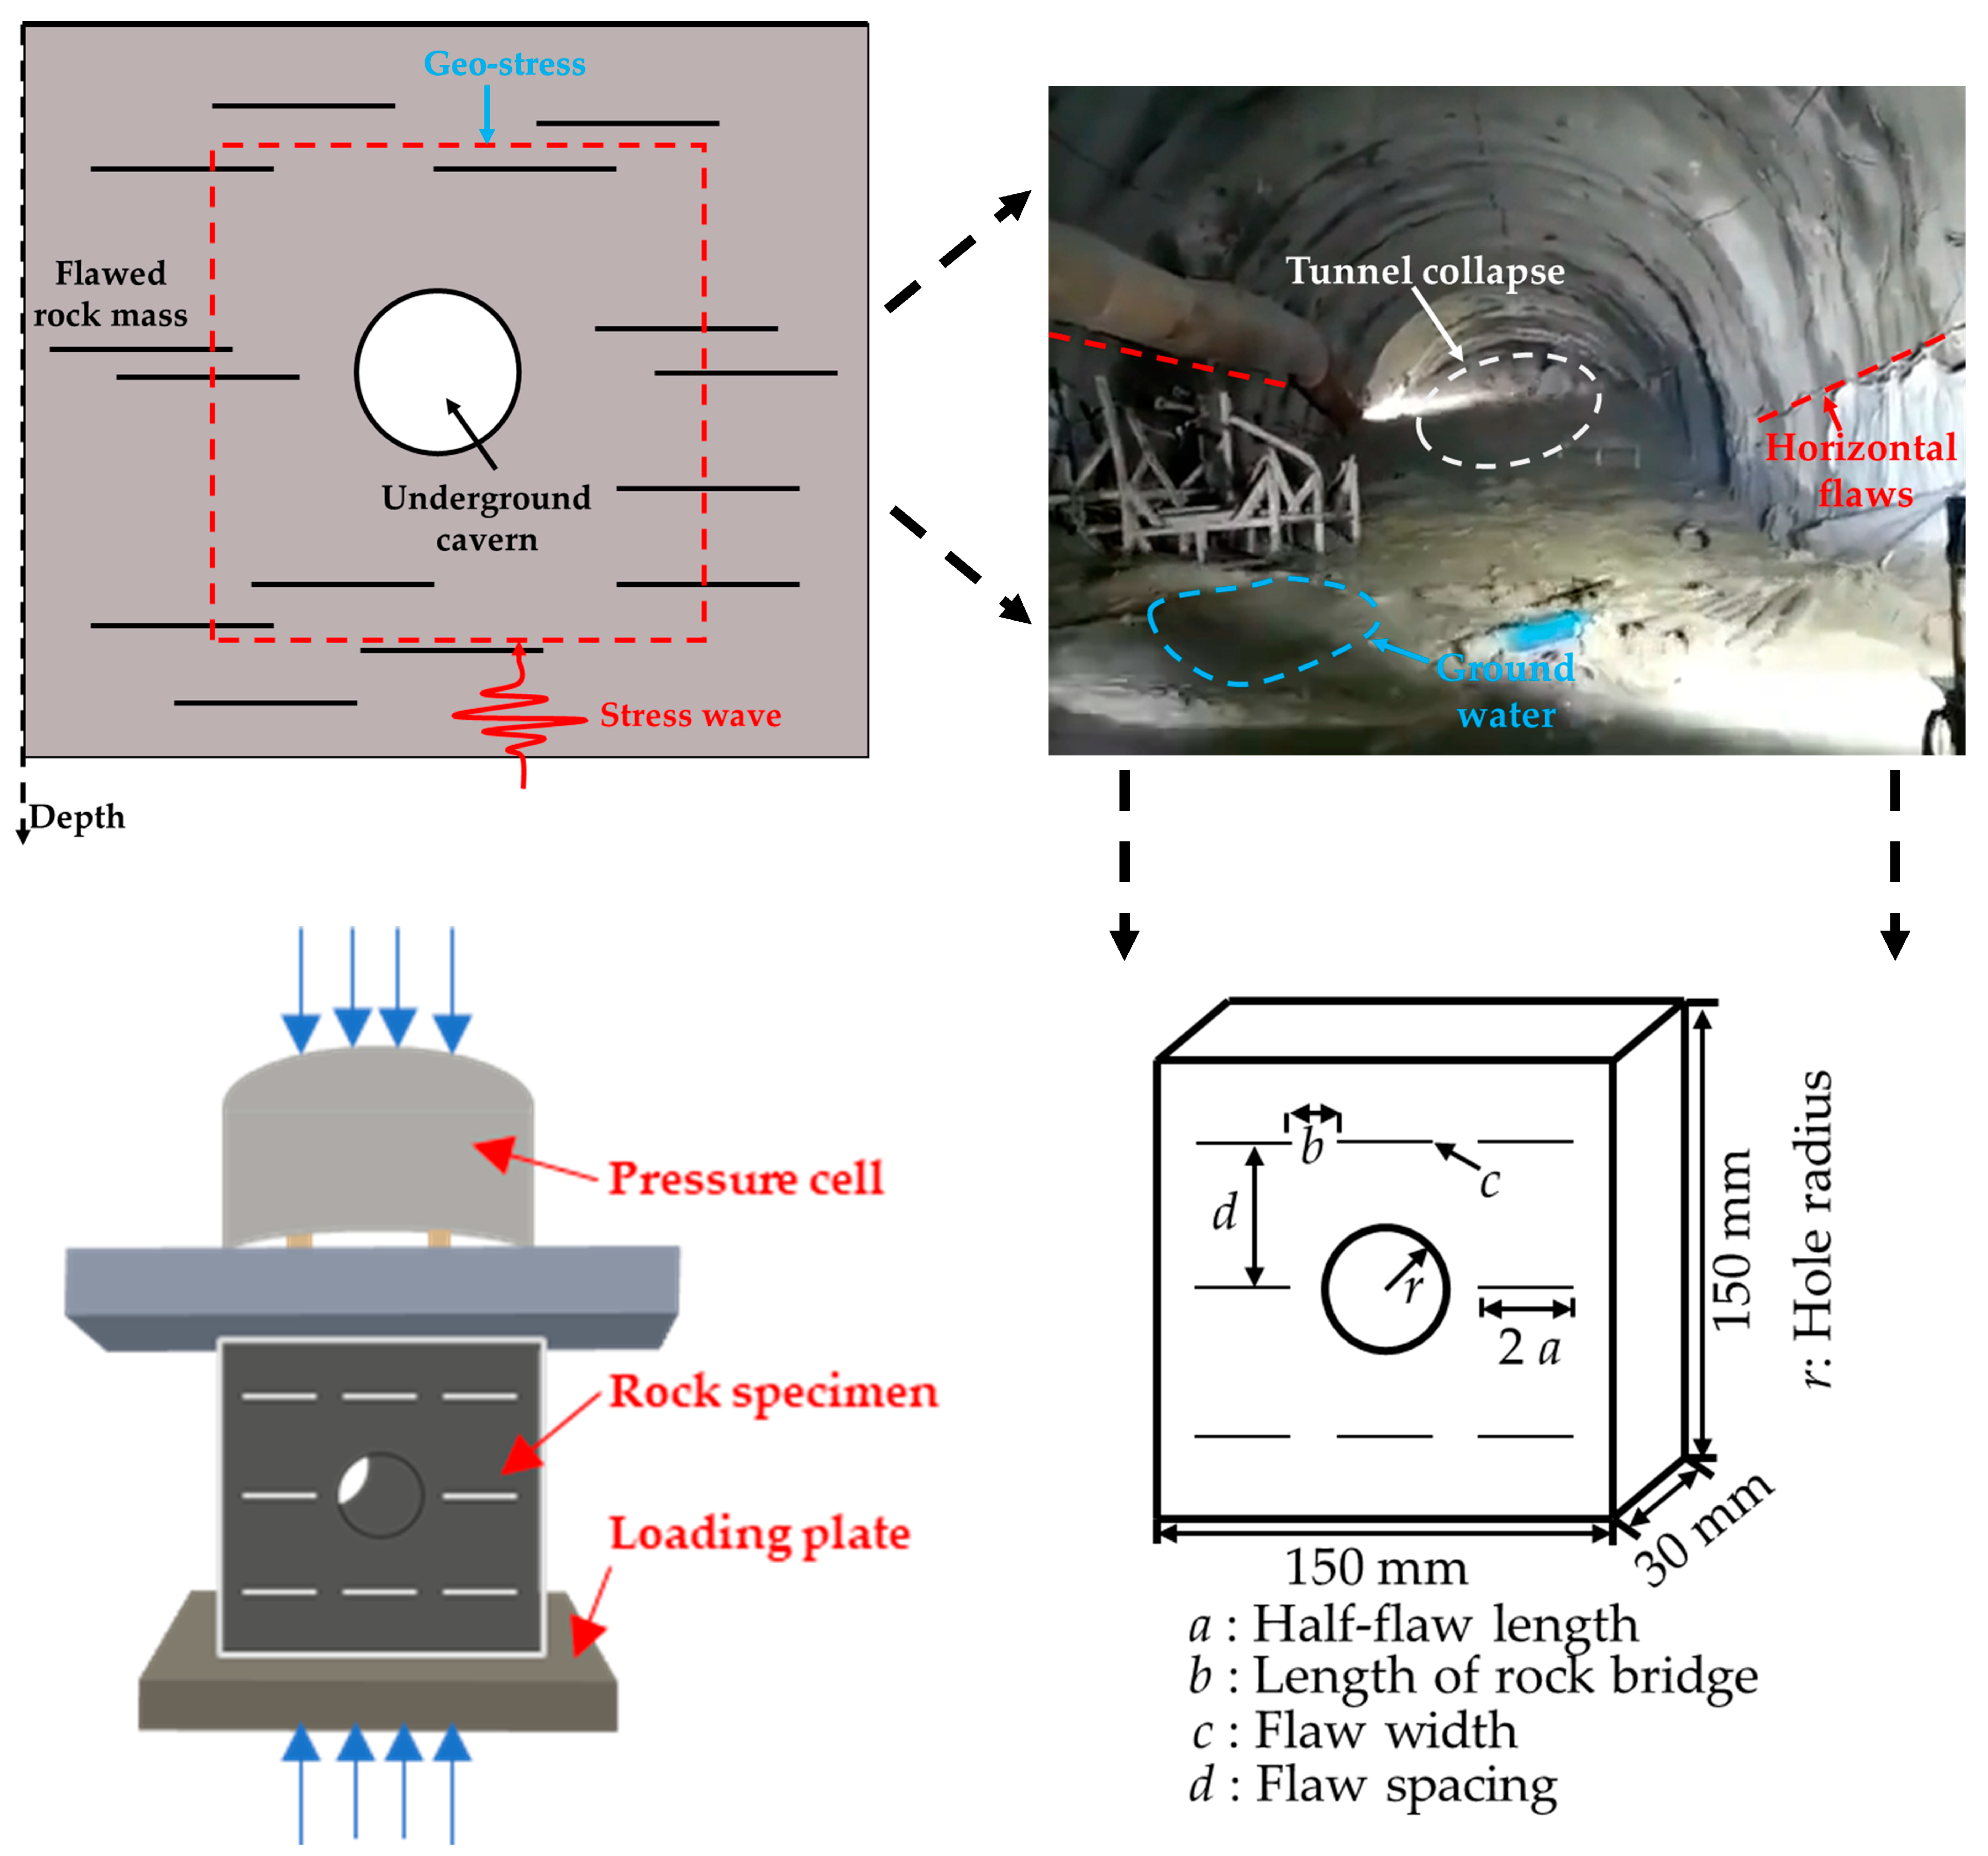
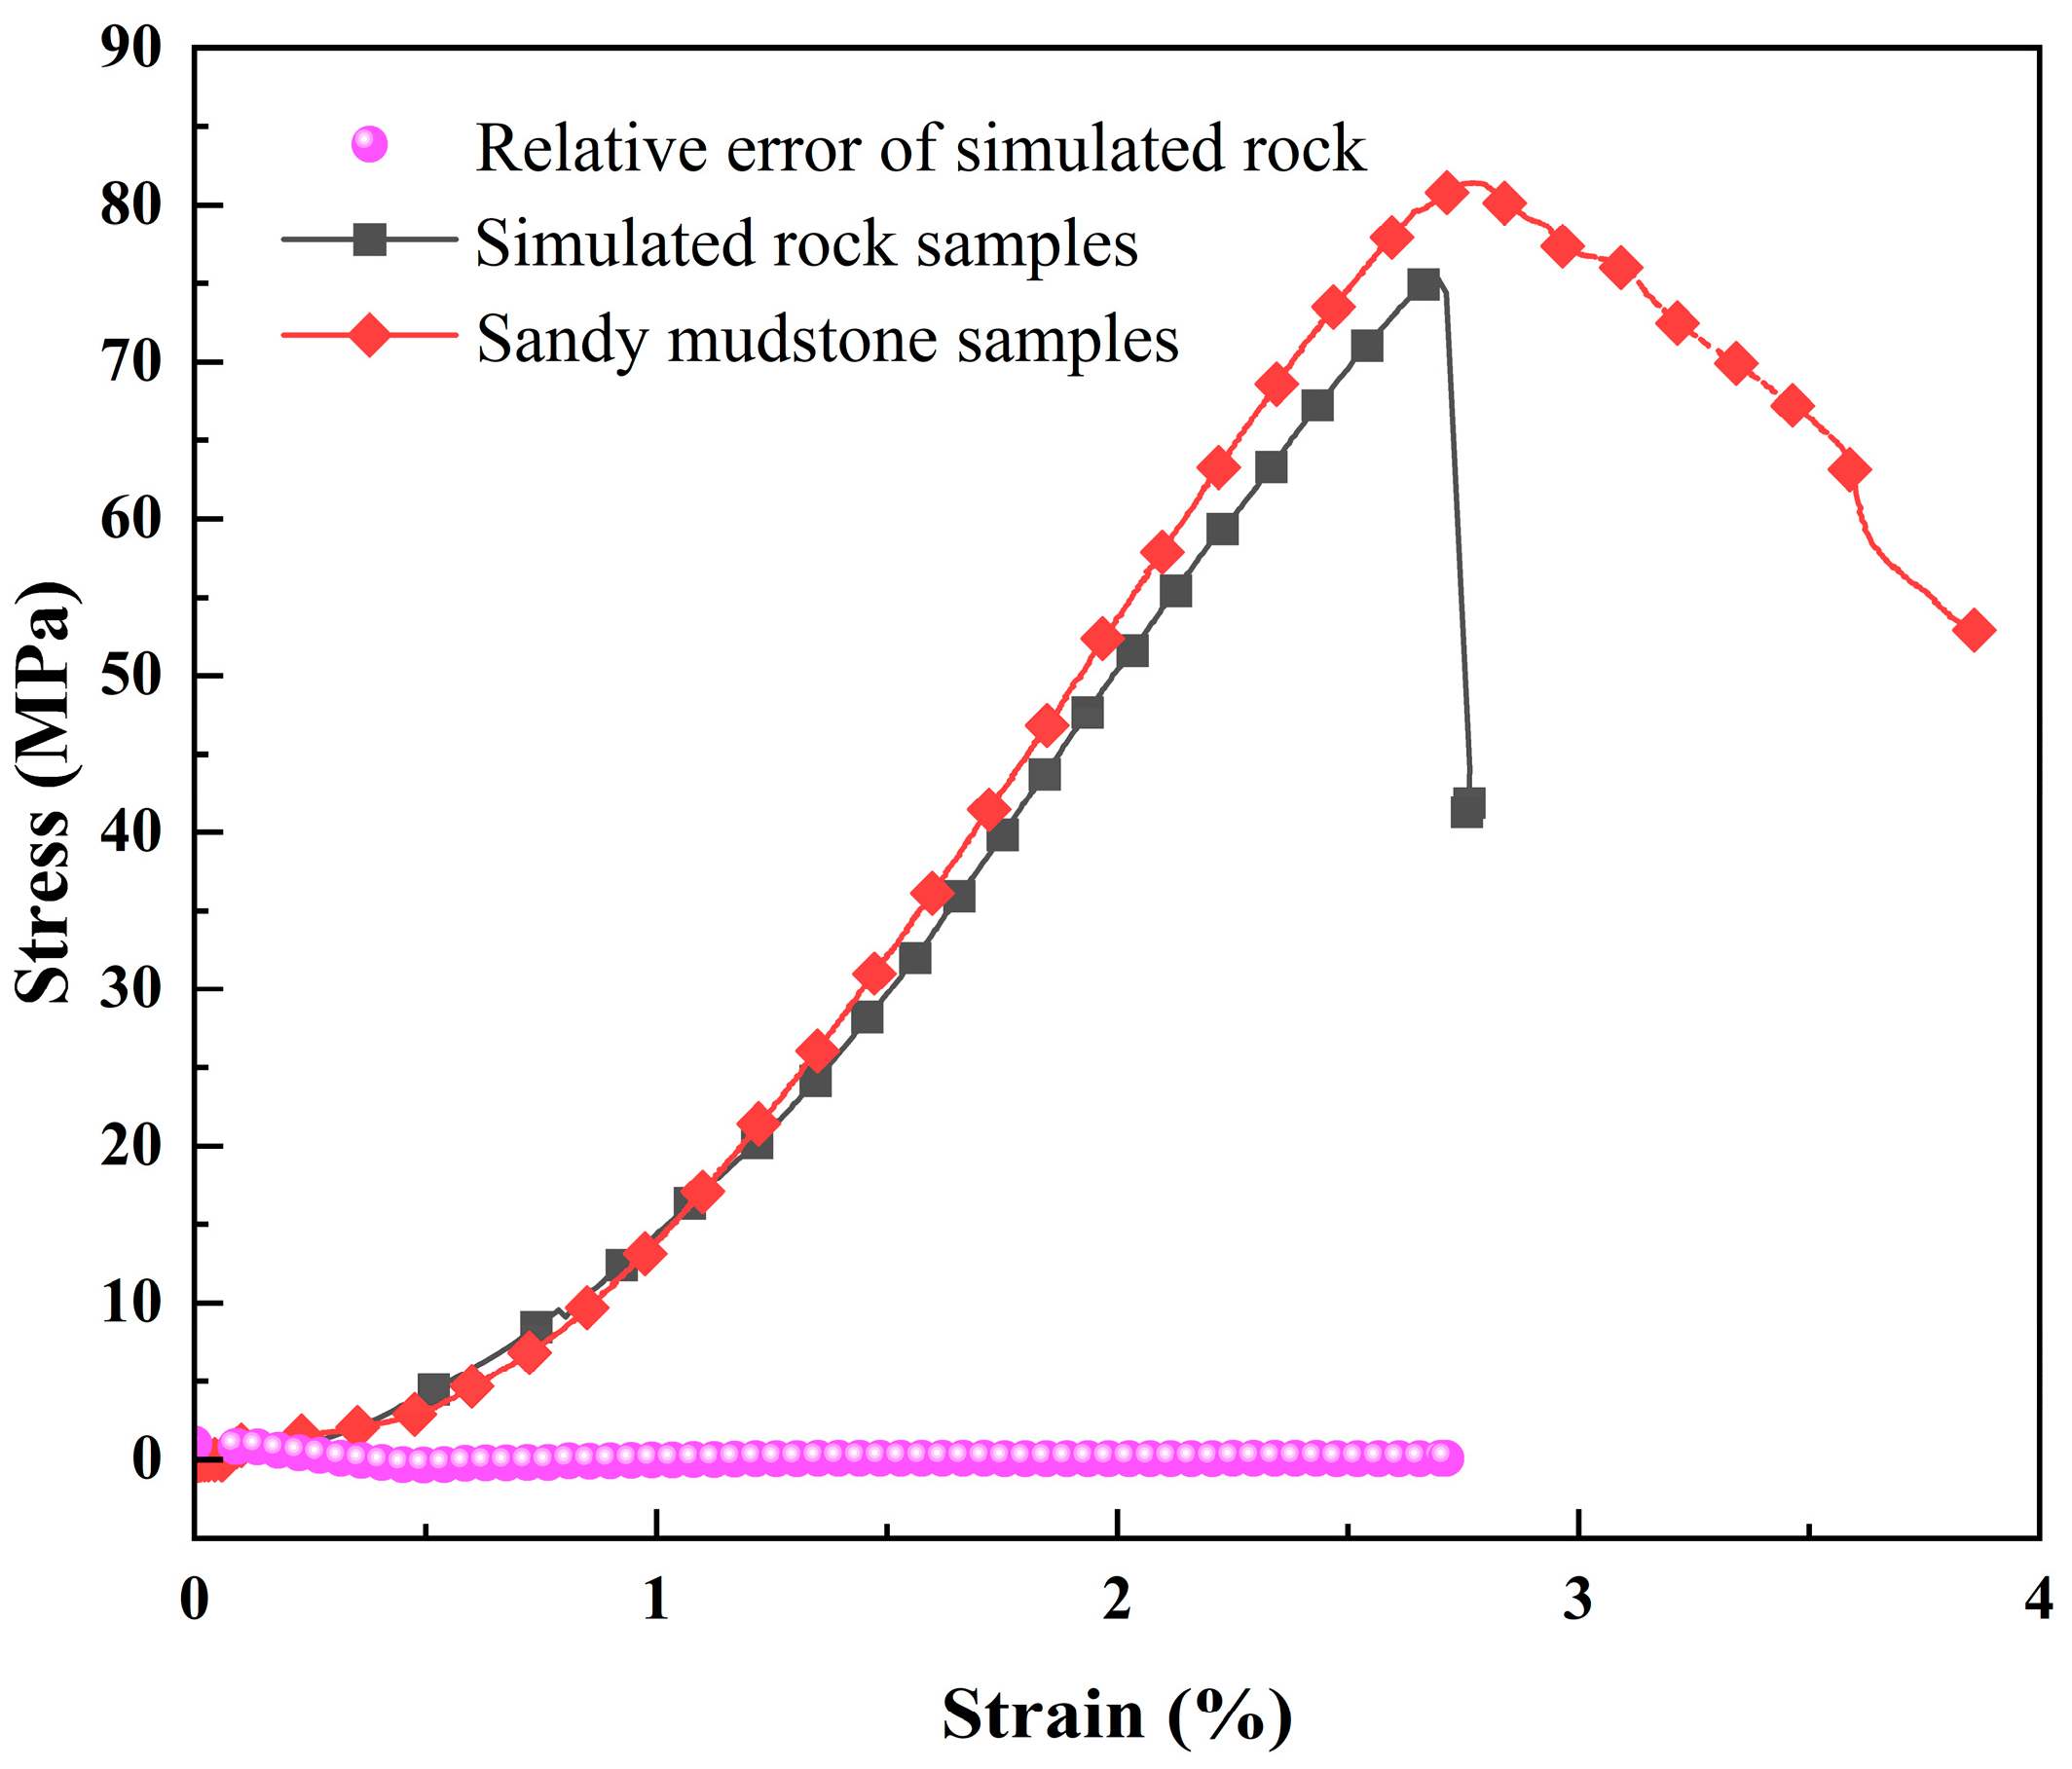
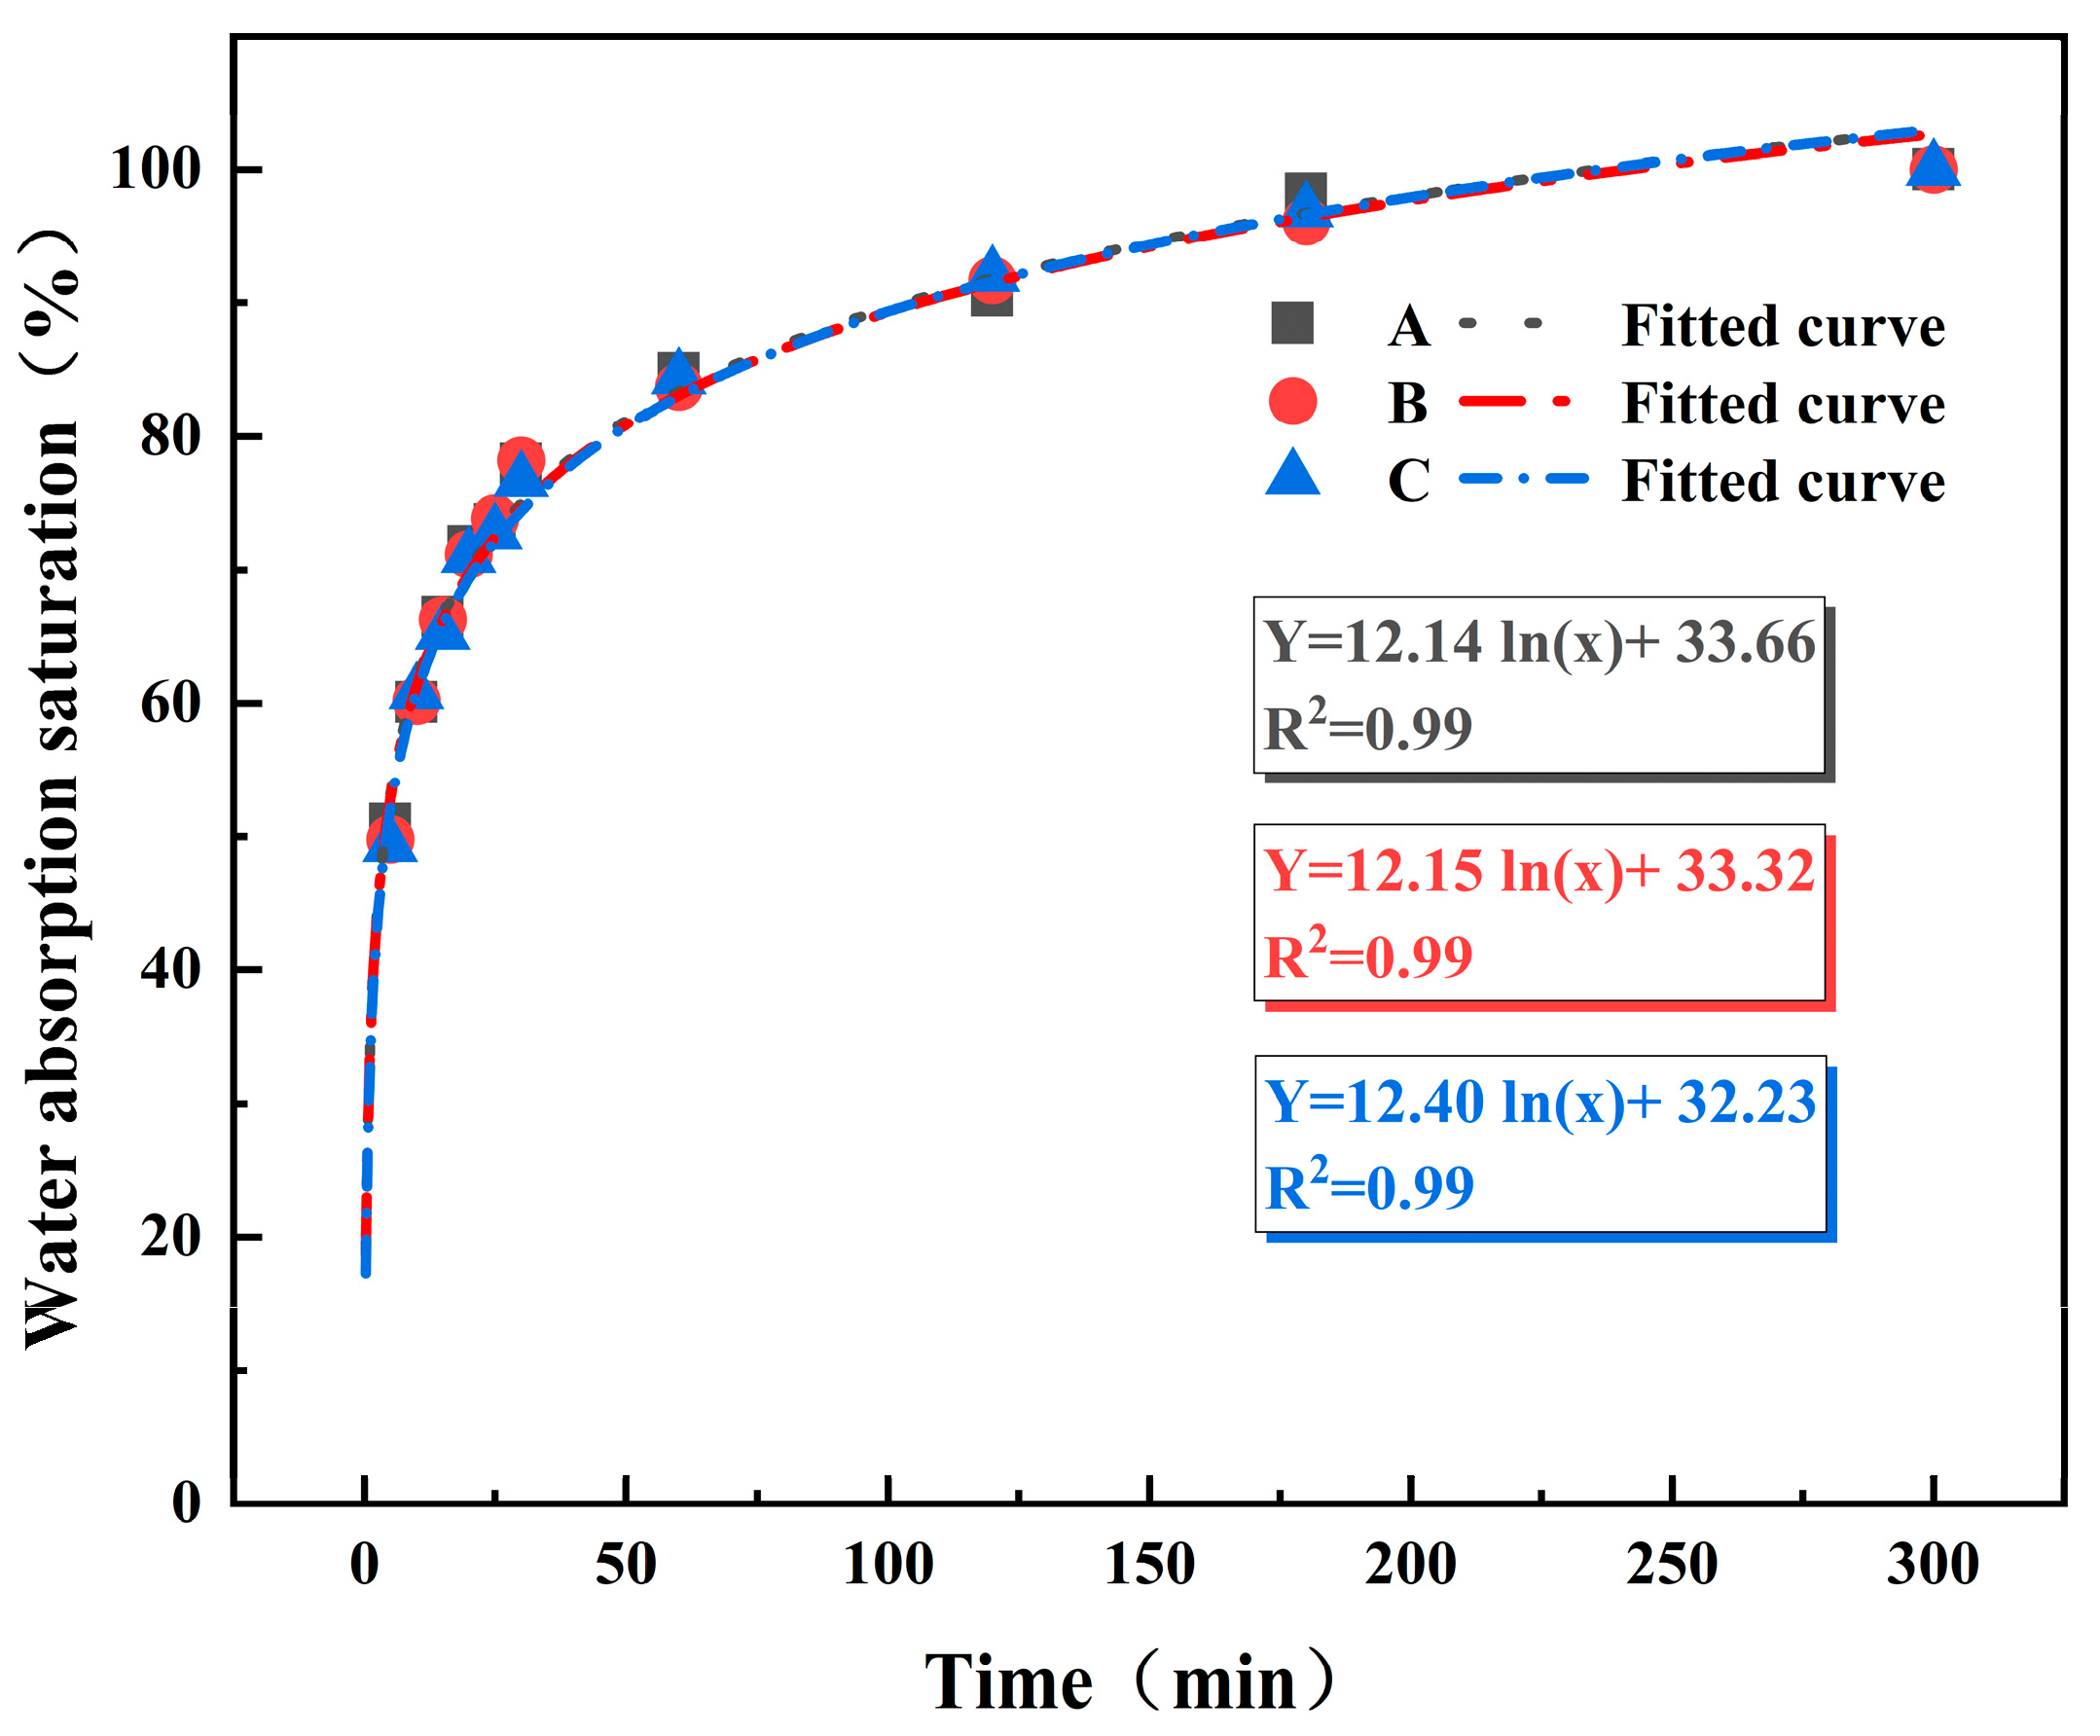
2.1. Preparation of Rock Analog Samples

As illustrated in Figure 1, Schematic Diagram of the Specimen, the actual conditions are based on the collapse that occurred in the Q1 section of the tunnel in the ancient Longkeng Depression, located in the central Songliao Basin. Samples were prepared from typical weak sandy mudstone extracted from the Q1 section of the tunnel. Due to the presence of primary fractures and joints in deep hard rock formations, coupled with the difficulty in sampling, ensuring identical rock sample structures is challenging. Moreover, the prefabrication of fractures adds complexity. Therefore, rock analog materials with multiple pores and fractures are employed [27,28,29].
Preparation of Rock Analog Specimens: The mass proportions of raw materials are as follows: Ordinary Portland Cement (OPC) PO 52.5:Quartz Sand:Silica Powder:Distilled Water:Water Reducer:Defoamer = 10:8.5:1.2:2.8:0.15:0.15 [30]. After calculating and precisely weighing the raw materials, the mixture is stirred uniformly, and the concrete is poured into iron molds and leveled to form rectangular specimens measuring 150 mm × 150 mm × 30 mm. The vibrating table is then opened, and a scraper is used to smooth the surface, ensuring the removal of air bubbles while maintaining the flatness of the specimens. After 2 h of initial setting, prefabricated molds are inserted into the specimens, with circular holes of 40 mm diameter pre-made on the 150 mm × 150 mm face to simulate circular tunnels. Mica sheets with a thickness of 1 mm are inserted into prefabricated cracks with a width of 30 mm. The specimens are left to stand for 24 h before demolding after initial setting. After demolding, the specimens are placed in a curing chamber for 28 days to ensure maximum compressive strength. According to the International Society for Rock Mechanics standards, the deviation of adjacent surfaces’ verticality is within ±0.25°. Following the recommended methods of the International Society for Rock Mechanics, each group utilizes three specimens for repeated testing to reduce experimental errors [31].
Prepare standard specimens for uniaxial compression testing to obtain the mechanical properties of rock analog materials and compare them with those of sandy mudstone (Figure 2). The stress–strain curves of rock-like materials and sandy mudstone are very similar. Table 1 compares four main parameters between rock-like materials and sandy mudstone. The composition of rock analog specimens appears reasonably appropriate.
To determine the time required to prepare rock analog specimens with different moisture contents, it is necessary to calibrate the water absorption curve before conducting the experiment. Initially, specimens are dried in a constant-temperature oven at 200 °C for 12 h to ensure complete loss of internal moisture. Subsequently, the specimens are immersed in ultrapure water, and regular measurements are taken and recorded. Experimental data analysis is conducted to plot the water absorption curve and calibrate it (using specimens labeled 1, 2, 3). The saturation water absorption rate of the specimens is determined to be 1.40%, with consistent measurements obtained after two hours [32,33,34,35]. The degree of water absorption is defined as the ratio of the water absorption rate at a certain time to the saturation water absorption rate, calculated using the following formula:
P = ω 1 ω 0  
where P represents the water saturation degree of the rock analog specimen [32,36,37]; ω1 denotes the water absorption rate at a certain time, and ω0 signifies the saturation water absorption rate of the rock analog specimen.
Figure 3 shows the water absorption calibration, with a gradient of 25%; rock analog specimens with water absorption degrees of 0%, 25%, 50%, 75%, and 100% are prepared. Combining the water absorption degree curve with actual measurement results, the required water absorption times for preparing specimens with water absorption degrees of 25%, 50%, 75%, and 100% are determined to be 21 s, 3.9 min, 44.3 min, and 515.2 min, respectively.

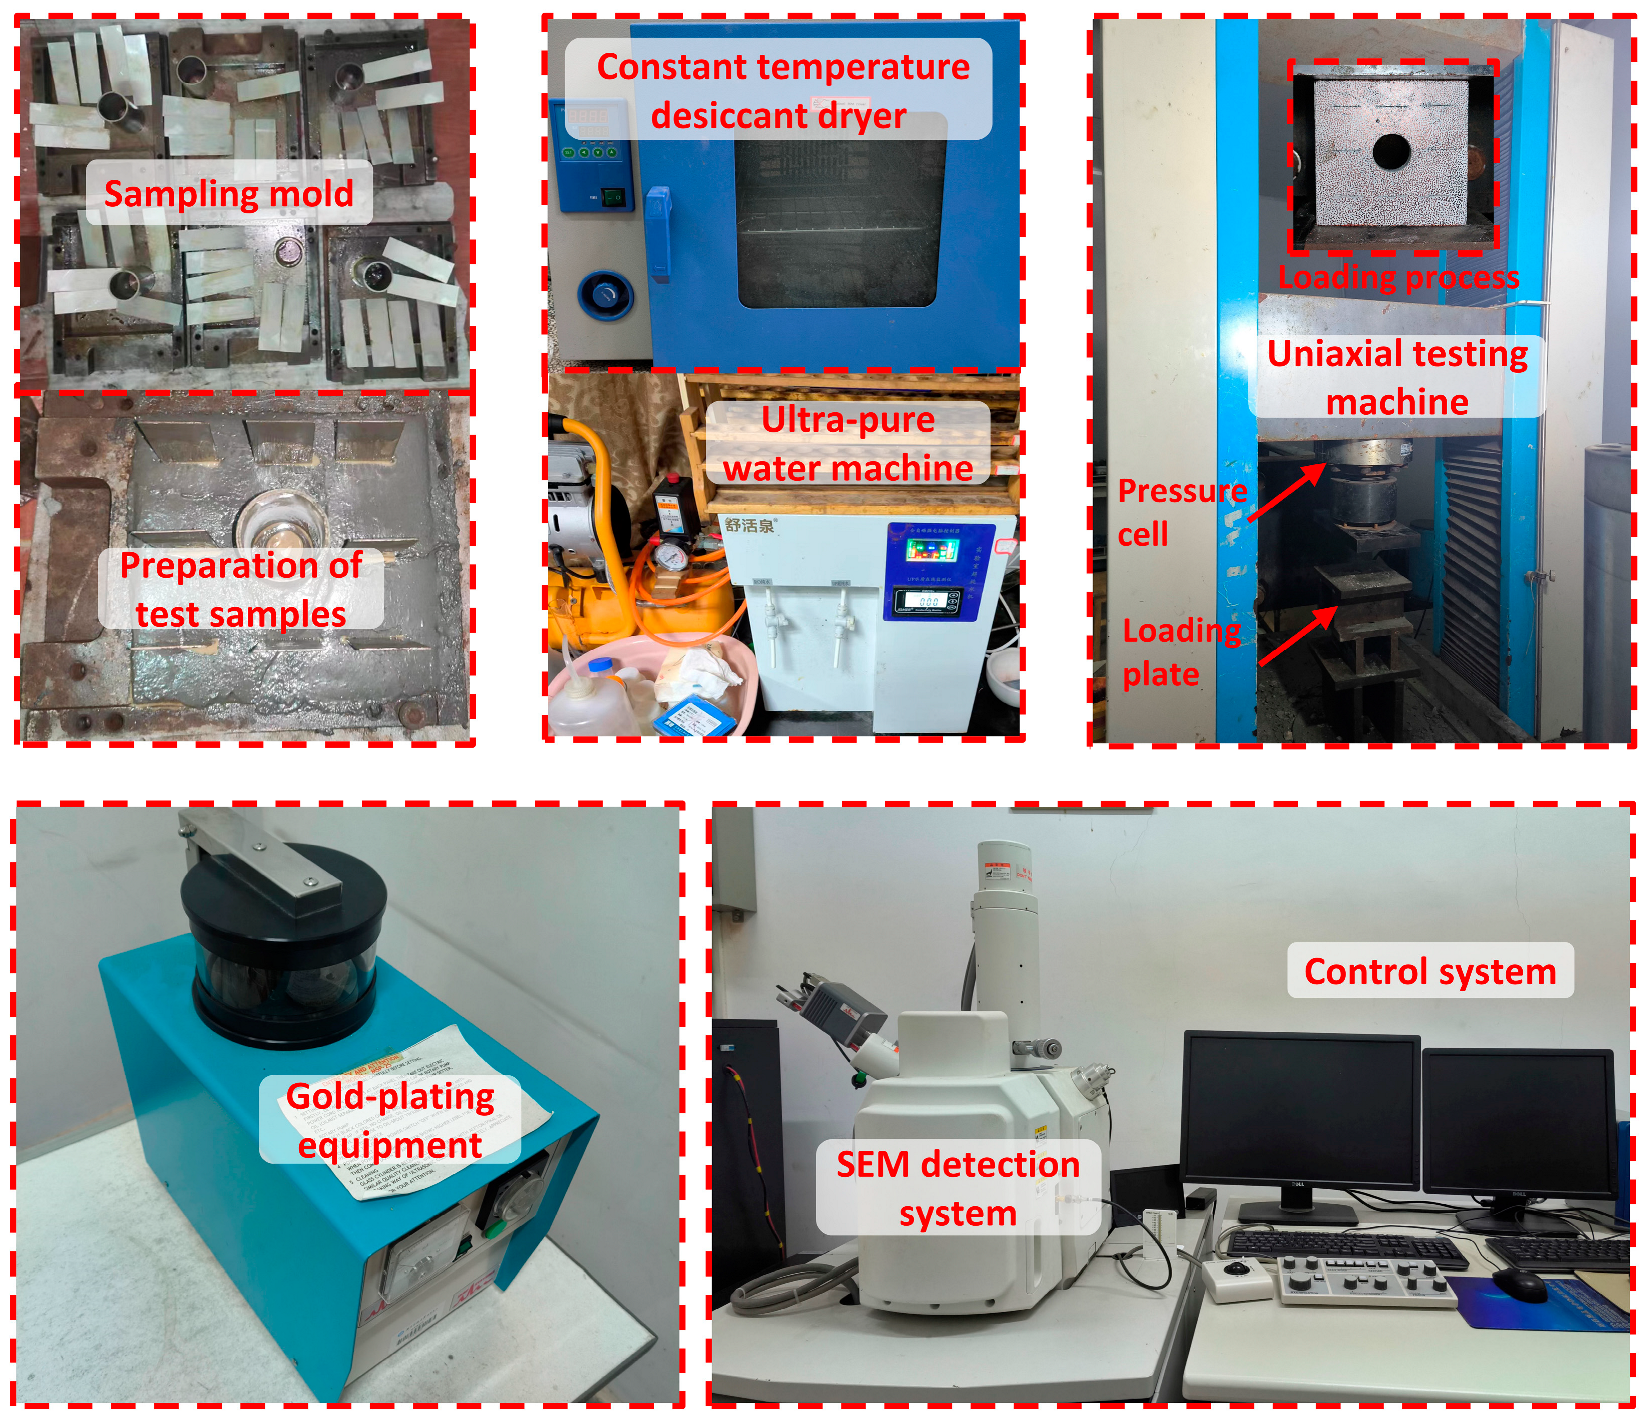
2.2. Experimental System

Figure 4 illustrates the specimen preparation process and the experimental loading system. The experimental setup utilizes the shear rheometer (RYL-600) produced by Changchun Chaoyang Instrument Co., Ltd. (Changchun, China) for uniaxial compression testing. It is employed for both uniaxial compression and transverse direct shear tests on rocks, as well as for uniaxial compression creep and transverse direct shear creep tests. These tests are capable of detecting the compressive strength and shear strength of rocks. Specimens are categorized into 5 gradients based on water absorption degree. Each group consists of 3 specimens to conduct repeated tests, aiming to reduce experimental errors and enhance accuracy. Prior to loading, a uniform coating of grease is applied to both the upper and lower loading surfaces of the specimens to minimize the influence of friction on the test results [38]. During the experiment, a consistent stress loading rate is set, with a displacement control velocity of 2 mm/min.
Throughout the loading process, an industrial camera focuses on the prefabricated holes of the specimens [39]. Real-time recording of the test process is conducted using an image sensor until the specimen reaches its peak value, upon which rockburst occurs, and recording is immediately halted.
SU3500 high resolution tungsten wire scanning electron microscope produced by Hitachi of Japan was adopted, specimens damaged by uniaxial loading were photographed at 500× and 1000× magnifications. According to the test platform specifications (Φ51 mm × 50 mm), samples with different water absorption levels were selected. Appropriately sized damaged fragments were screened for SEM analysis to identify microscopic deformation and damage characteristics. The fragments were cleaned with lint-free cloth and anhydrous ethanol, dried in an oven, and coated with a gold film before testing to enhance conductivity. This preparation ensured clear imaging of the microstructure for analysis and processing of representative data.
The Malvern laser particle size analyzer analyzes particles on microscopic damage structures. Debris from damaged specimens undergoes fractal statistical analysis to study how splashing characteristics vary with different water absorption levels.

3. Experimental Results and Discussion

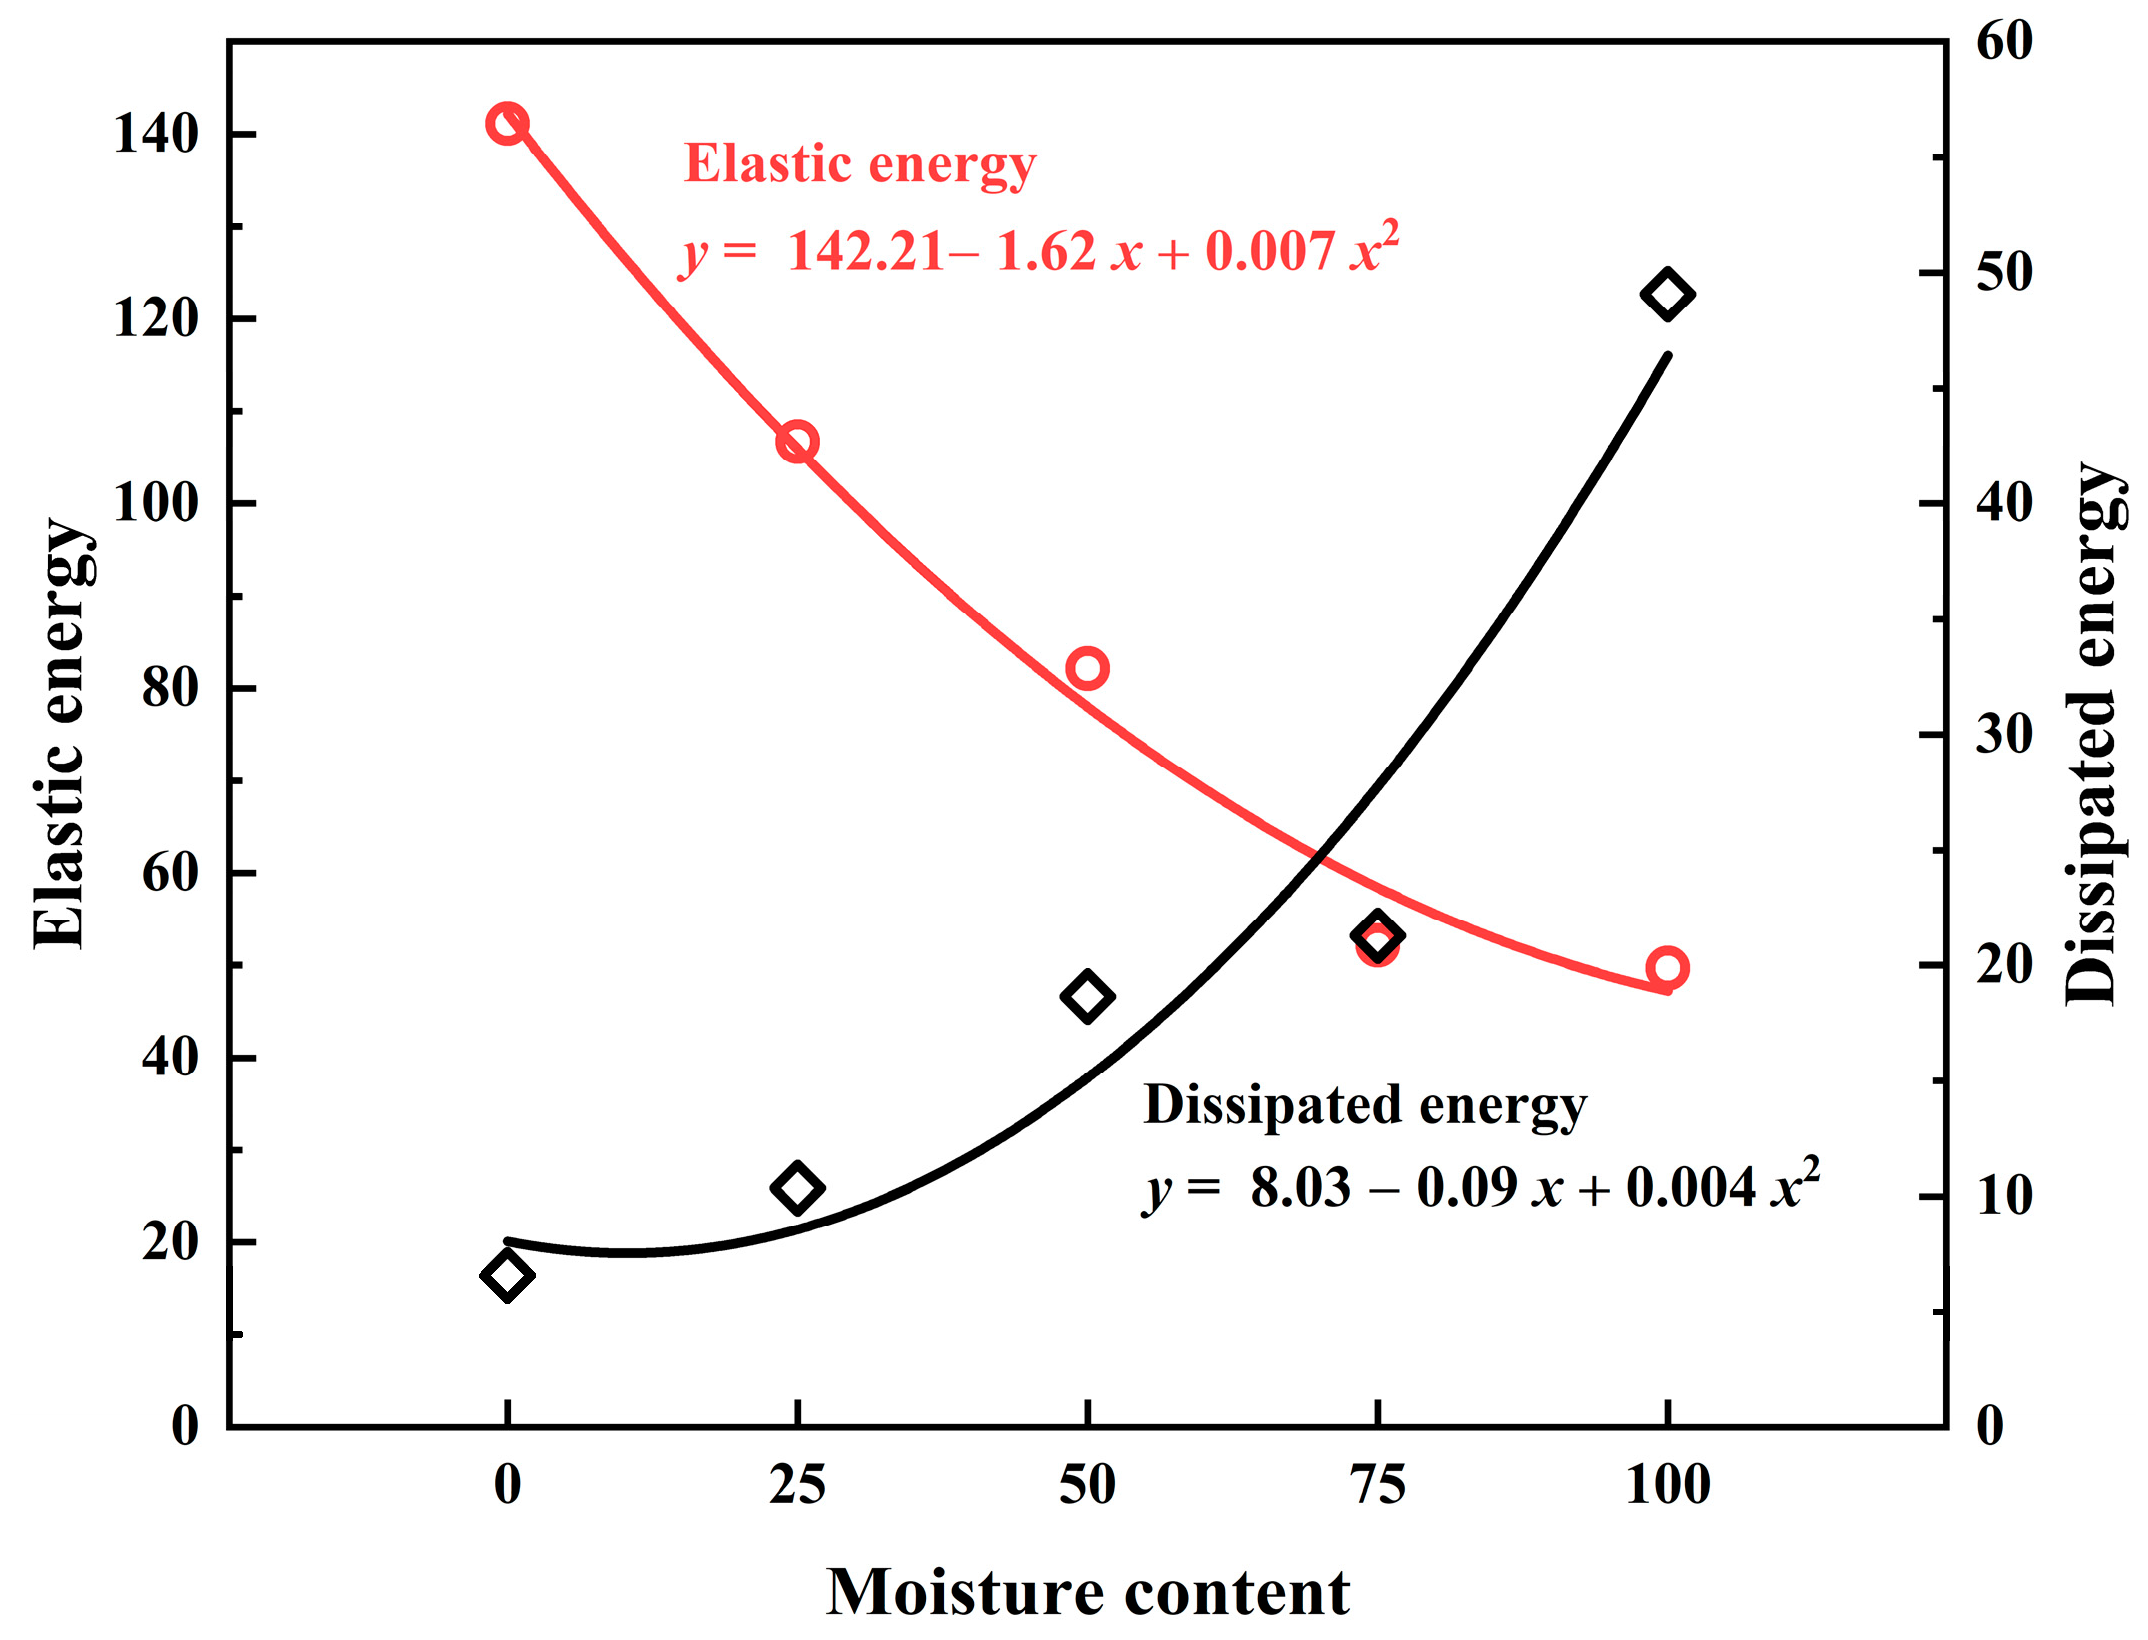
3.1. Rockburst Energy Characteristics

Figure 5 depicts the stress–strain curves and the evolution of strain field contours for samples with varying water absorption levels. The stress–strain curves undergo the following stages: compaction of pore and crack phase; elastic deformation stage; crack propagation stage; and strain softening stage [40].
Stage I: Compaction of the pore and crack phase (Stage I) is characterized by a concave upward curve. Compaction closes the original micro-cracks and micro-pores of the samples. The length and degree of concavity in the upper concave section indicate rock porosity development. Dry samples undergo a shorter compaction stage, whereas strain significantly increases during the compaction stage of saturated samples. Increased water absorption and soaking time deepen internal dissolution within the samples. The slope gradually increases from an initial value of 0 to the elastic modulus (E0). The greater the water absorption degree, the deeper the concavity of the curve. There is no significant difference in the concavity between specimens with water absorption degrees of 0% and 25%. However, for specimens with water absorption degrees of 50%, 75%, and 100%, the compaction phase noticeably elongates;
Stage II: The elastic deformation stage (Stage II) is characterized by an approximately linear curve, where stress and strain are linearly related with a slope equal to the elastic modulus (E0). As shown in Figure 6, with the increasing gradient of water absorption degree, the elastic modulus gradually decreases, indicating a stronger effect of water erosion on the specimens. Compared to specimens with a water absorption degree of 0%, the elastic modulus decreases by 18%, 29.46%, 50.33%, and 62.19% for specimens with water absorption degrees of 25%, 50%, 75%, and 100%, respectively. This analysis suggests that an increase in water absorption degree reduces the elastic modulus of the specimen, diminishes its ability to resist deformation, and weakens the severity of rockburst;
Stage III: The crack propagation stage (Stage III) is characterized by a convex-upward curve. The slope gradually decreases from (E0) to 0, reaching the peak compressive strength when the slope becomes 0. When the stress curve reaches its peak value, accompanied by a “bang” sound, the rockburst phenomenon occurs simultaneously, and the stress curve rapidly declines. The influence of water absorption degree on the peak value is discussed in Figure 6. Prior to the peak, a stress drop occurs, indicating the development of internal cracks and pore connectivity within the specimen, but the strength of the specimen has not yet failed;
Stage IV: The strain softening stage (Stage IV) is characterized by an upward concave curve before point D (the inflection point after the peak) and a downward concave curve after point D, where the slope changes from 0 to negative.
Figure 6 illustrates the linear correlation between peak stress and water saturation degree under uniaxial compression for 15 specimens with different water saturation degrees. With the increase in water saturation degree, there is a linear decreasing trend in peak stress. Compared to fully dried specimens, the peak stress intensity decreases by 12.21%, 29.42%, 37.49%, and 49.06% for specimens with other water saturation degrees. The reduction in peak stress indicates that water has a softening effect on the rock analog specimens, leading to damage to the internal stress structure and weakening the severity of the rockburst.
To further investigate the influence of water absorption degree on the severity of rockburst from an energy perspective, an analysis of the energy dissipation relationship before the occurrence of rockburst will be conducted [41,42,43]. Assuming the specimen is an isolated closed system with no heat exchange with the surroundings, and the total input energy derived from external work is denoted as U, according to the first law of thermodynamics, we have the following equation:
U = U e + U d
where Ue represents the elastic strain energy that the rock can release after being subjected to external forces and represents the Ud dissipated energy during the loading process of the rock.
Figure 7 depicts the energy diagram of the stress–strain curve, illustrating the total input energy U, the dissipated energy Ud during the loading process of the rock, and the elastic strain energy Ue that the rock can release after being subjected to external forces. These energies can be calculated according to the following equations:
U = 0 ε σ d ε
U e = 1 2 σ ε e = σ 2 2 E 0
U d = 0 ε σ d ε σ 2 2 E 0
Figure 8 shows the relationship between the elastic potential energy and the dissipated energy of the specimens for different water absorption levels. As the water absorption level increases, the elastic potential energy of the specimens gradually decreases, while the dissipated energy gradually increases.
The relationship between elastic energy and dissipated energy before rockburst for specimens with different degrees of water absorption is presented in Table 2. With the gradient increase in water absorption degree, the internal elastic strain energy gradually decreases, reducing by 24.40%, 41.80%, 63.08%, and 64.80%, respectively. Meanwhile, the dissipated energy gradually increases, with increments of 3.8, 12.1, 14.72, and 42.51 kJ·m−3. This indicates that the increase in water saturation degree leads to greater plastic deformation during the loading process of the rock analog specimens, weakening the ability of the specimens to store energy. The increase in porosity within the specimens leads to a reduction in elastic modulus and elastic strain energy, resulting in uneven stress distribution and the propagation and aggregation of microcracks within the specimens.

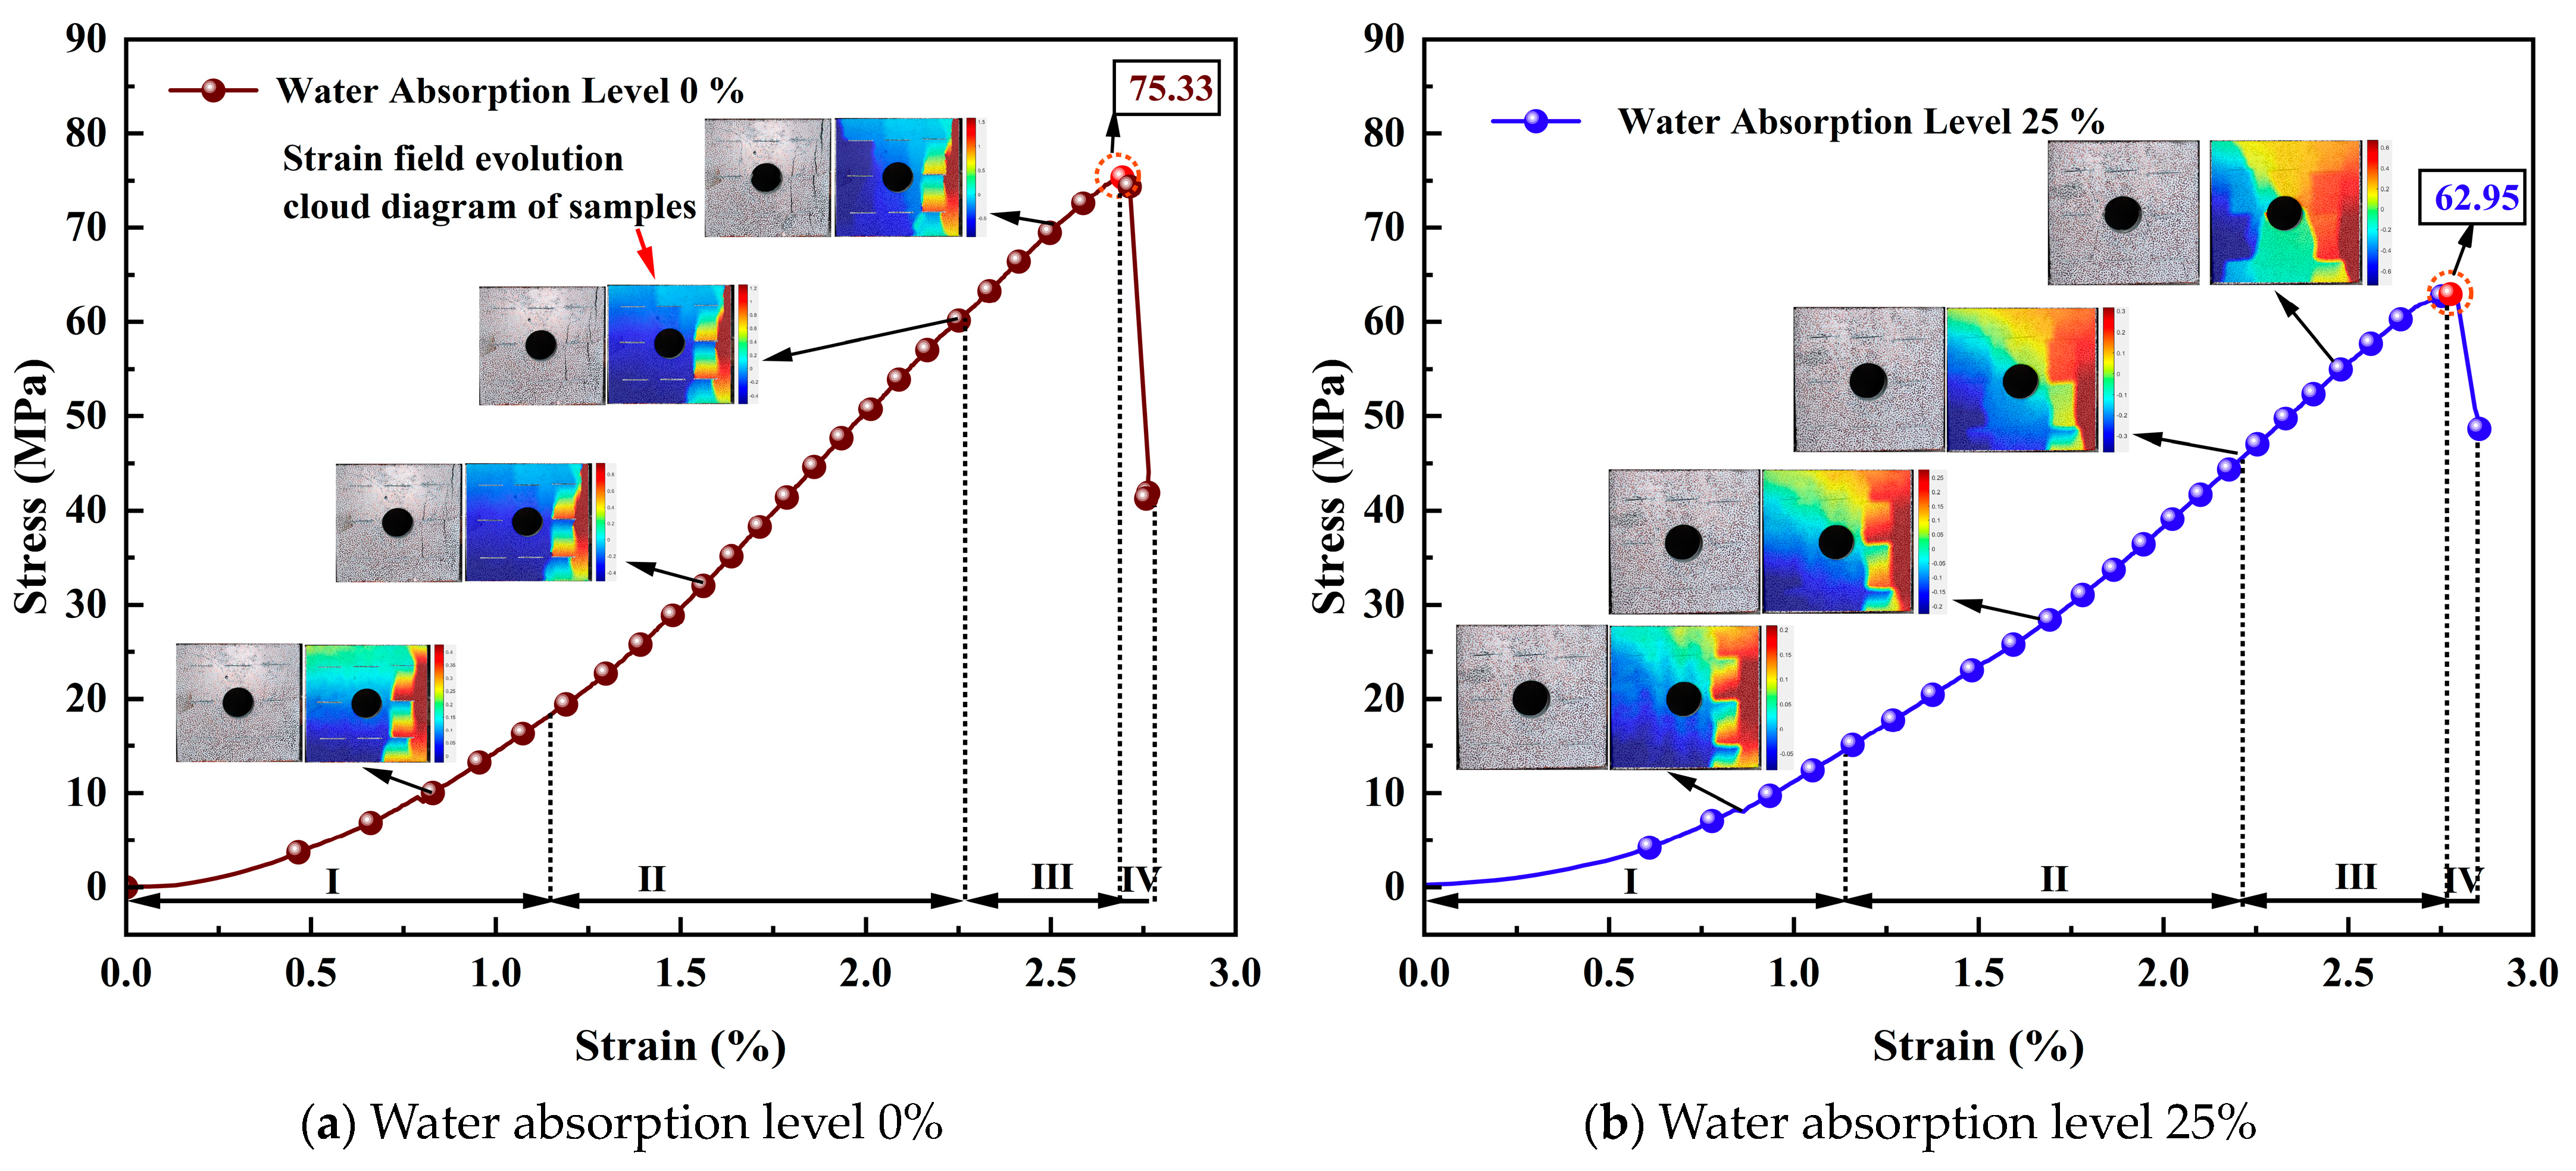
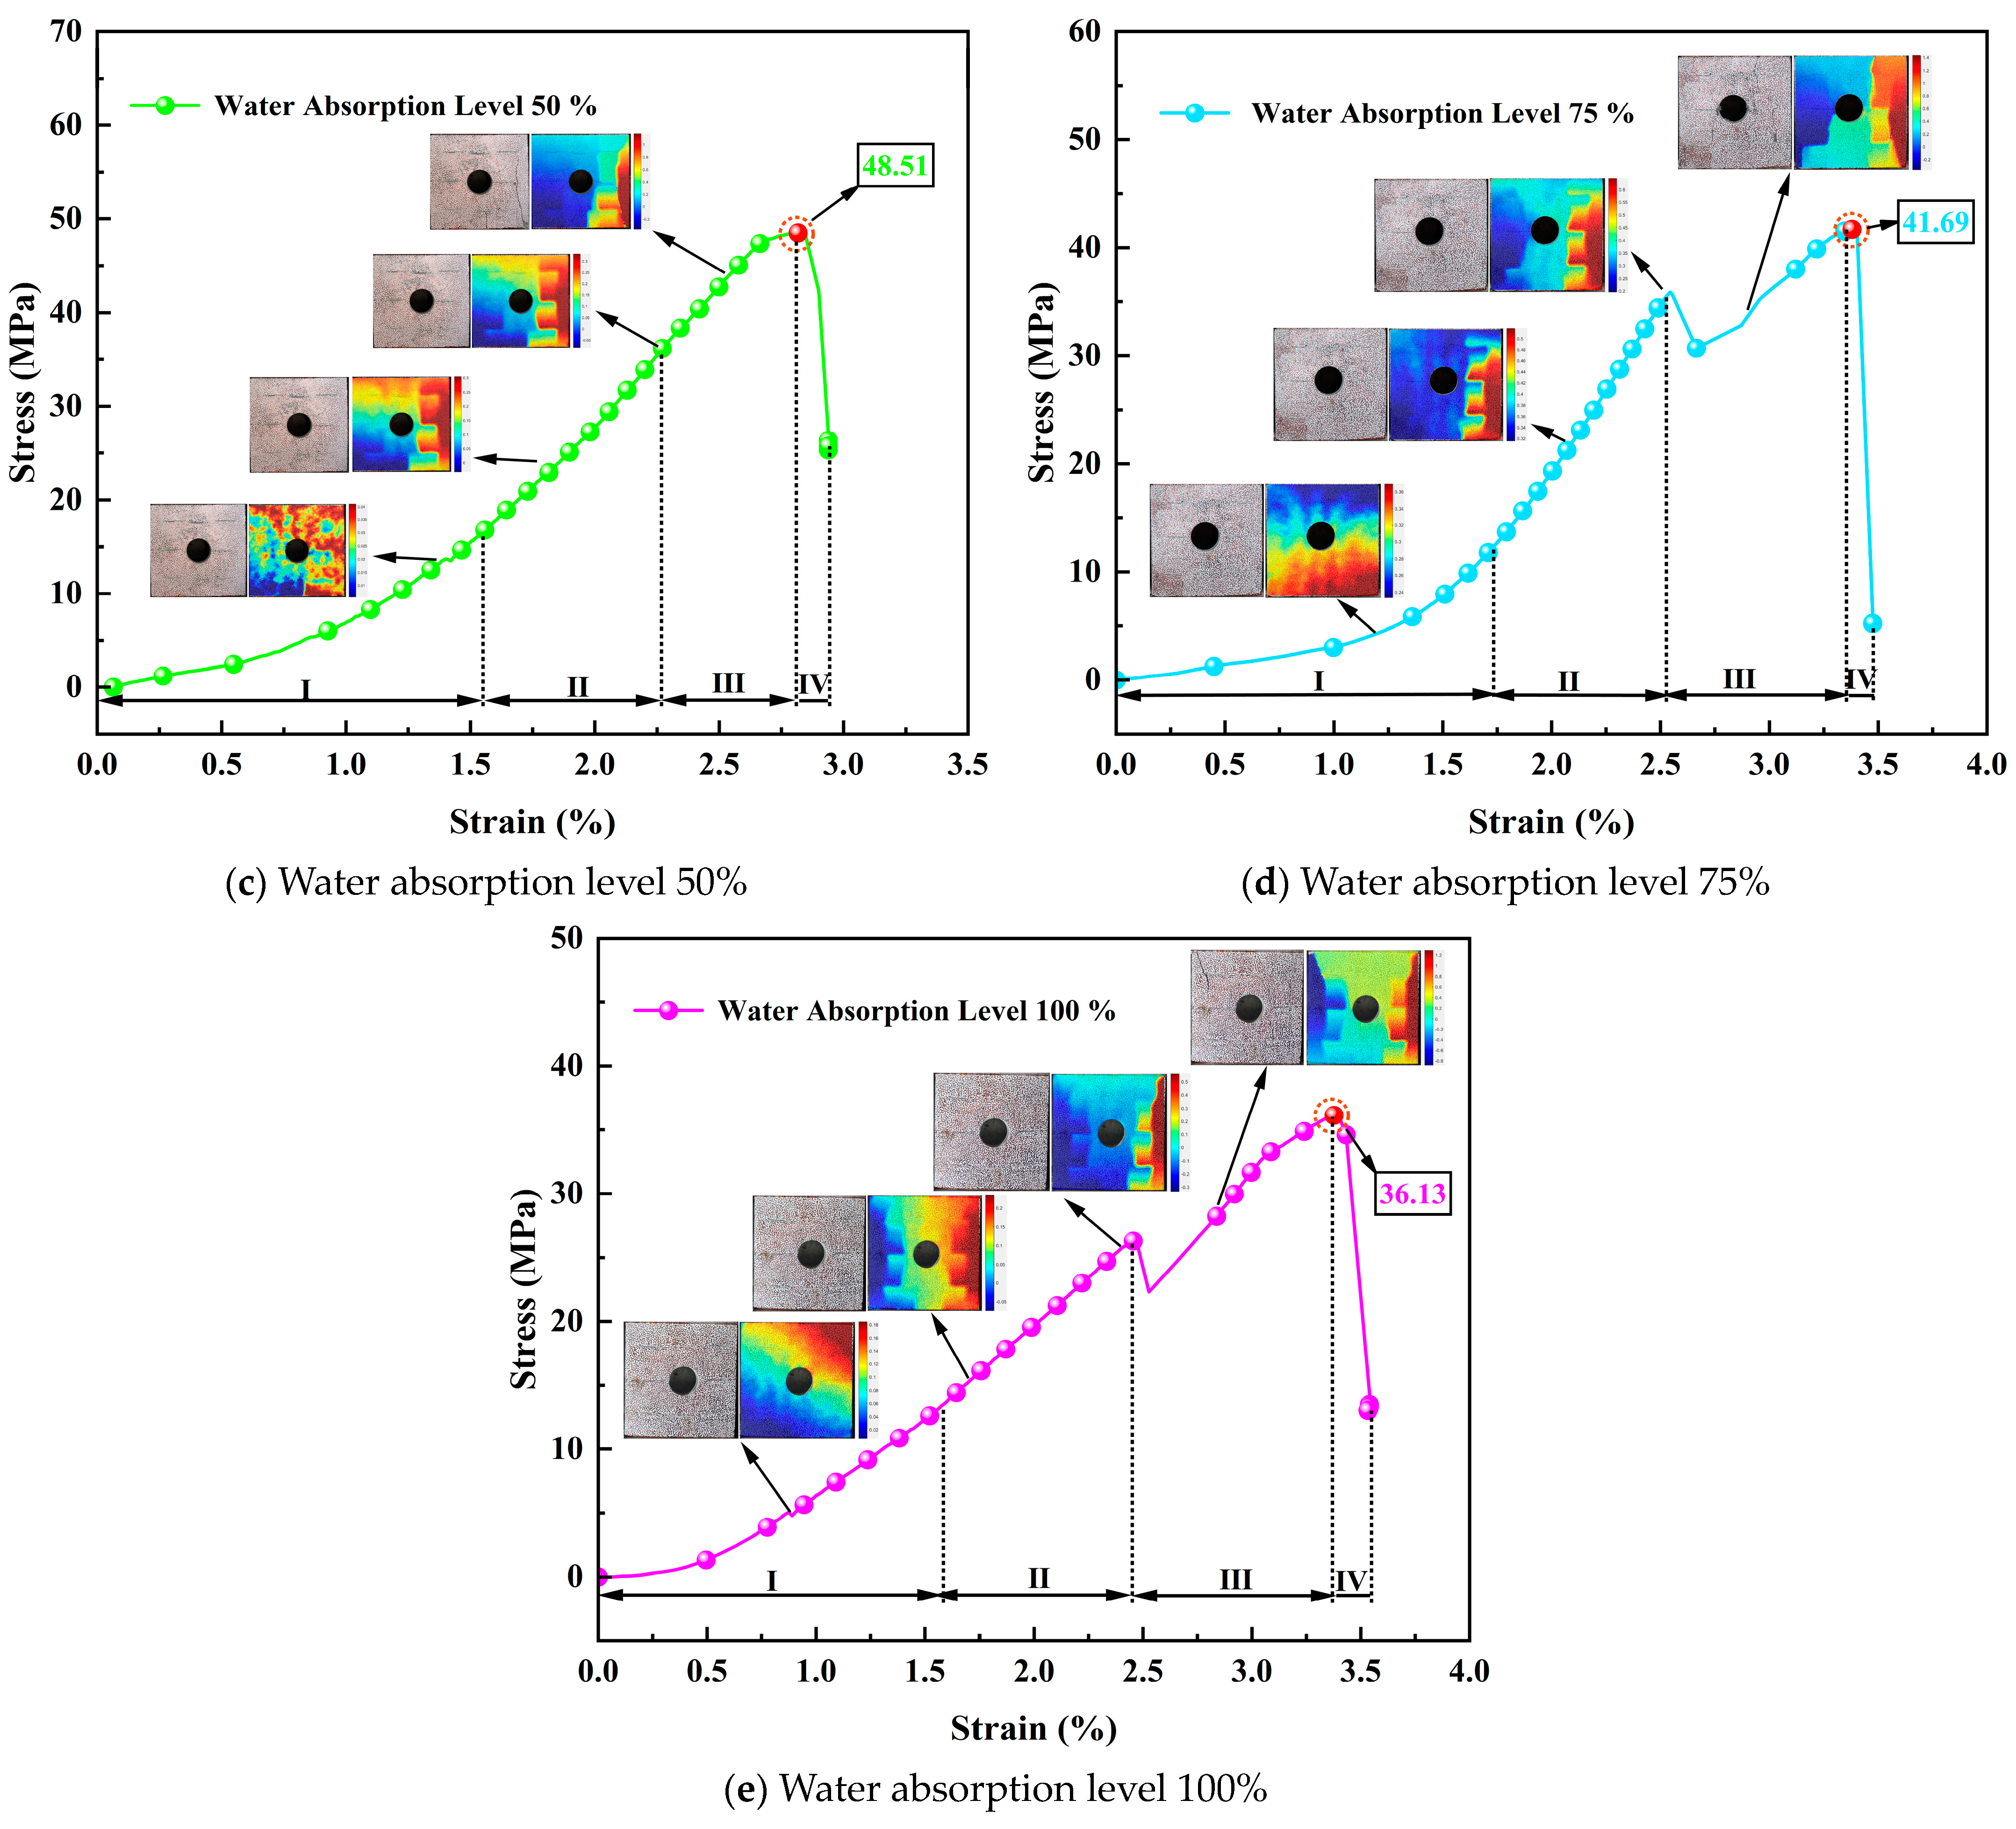
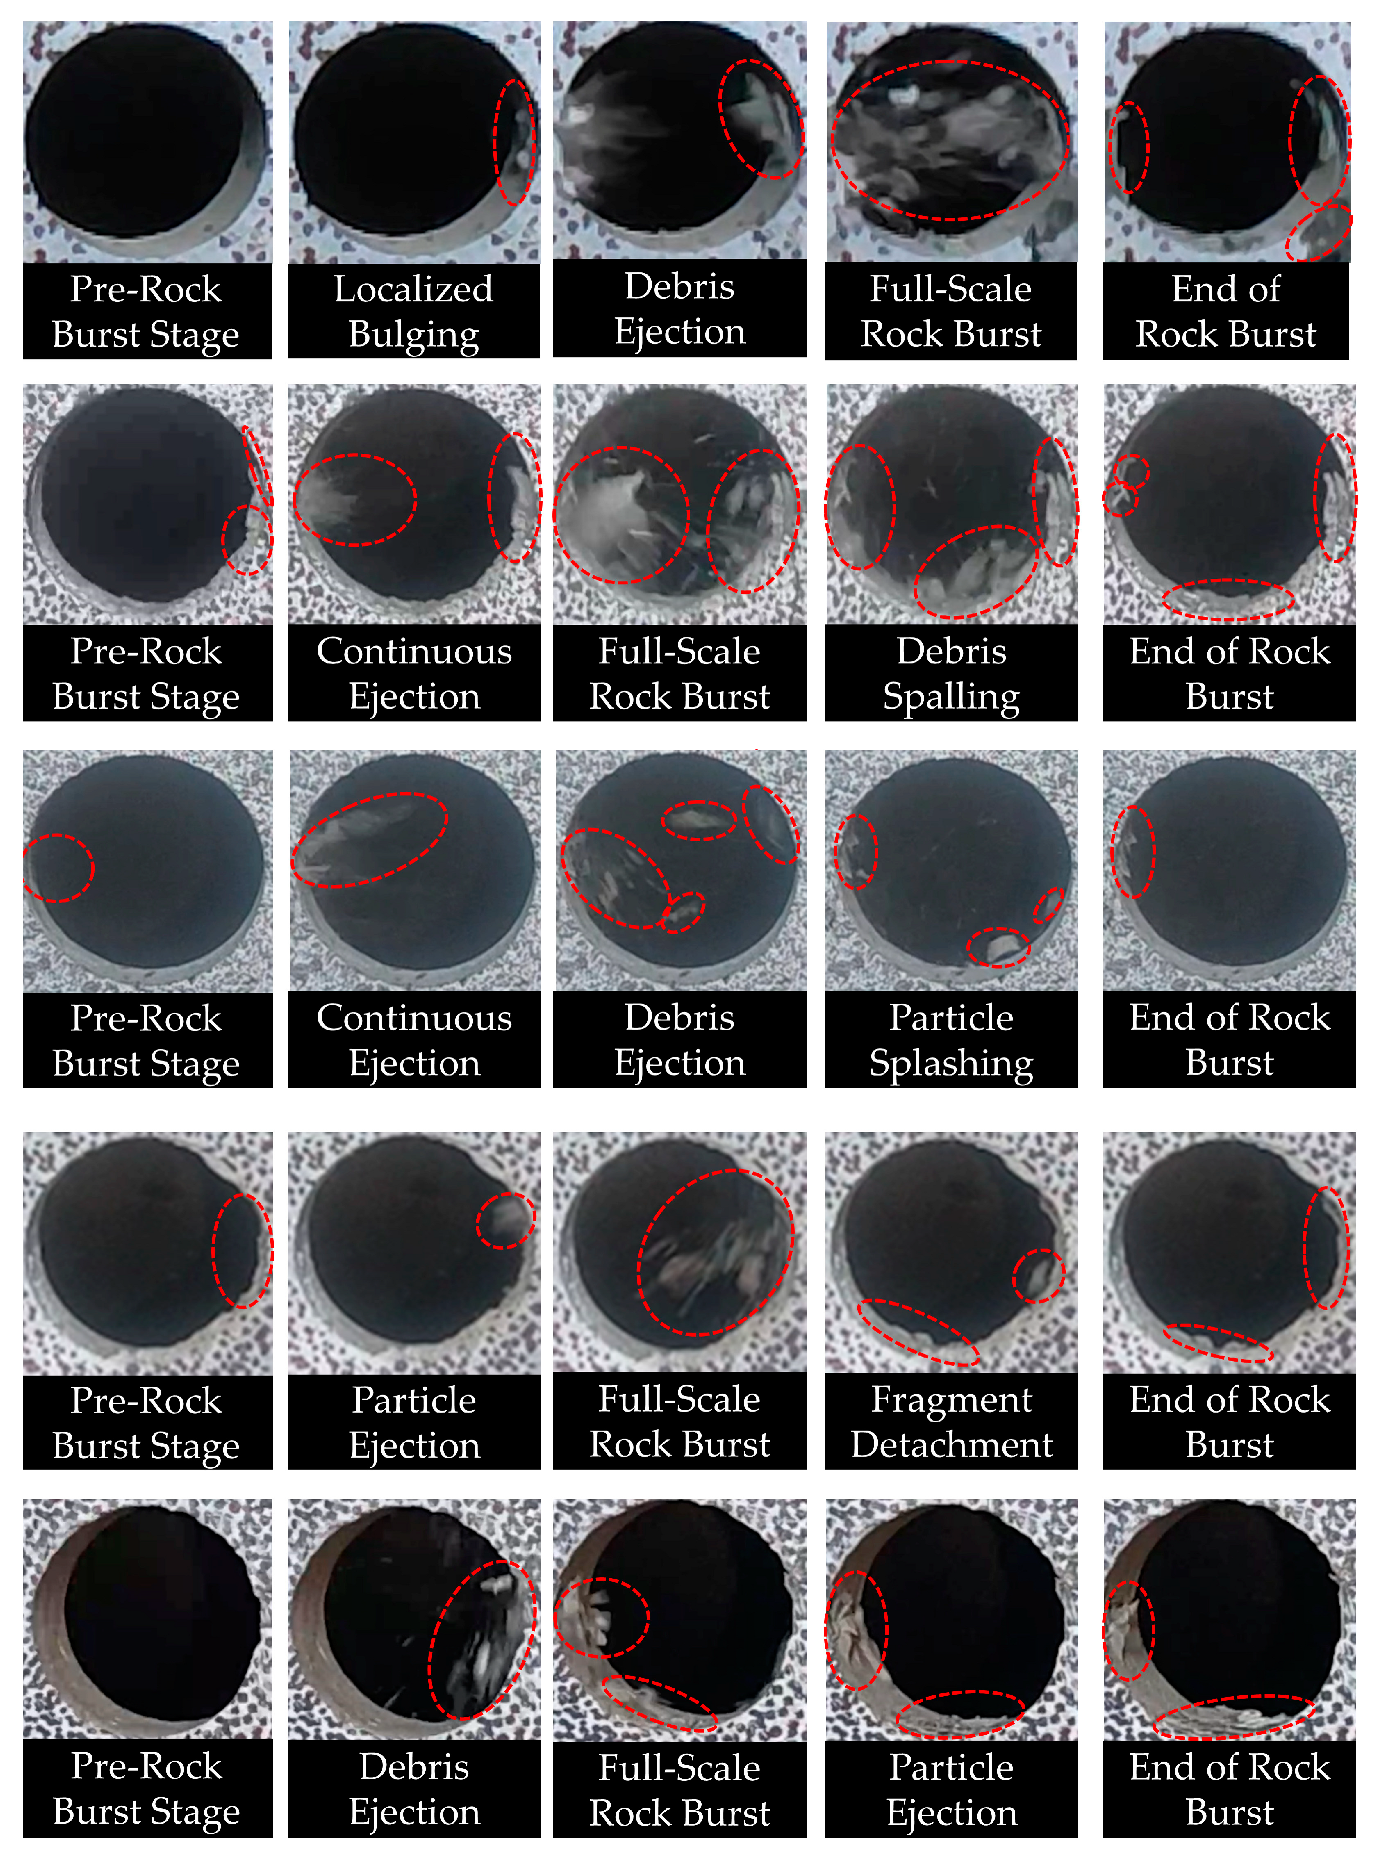
3.2. Rockburst Failure Process

Figure 9 illustrates the rockburst damage process under uniaxial loading for specimens with different water absorption degrees. Specimens with varying water absorption degrees all undergo the following stages: pre-rockburst stage, localized bulging, particle ejection, full-scale rockburst, particle spalling, and end of rockburst [44,45].
Taking the specimen with 0% water saturation as an example, the rockburst process under uniaxial compression loading is described as follows:
During loading under displacement control at a rate of 2 mm/min, localized bulging and flake spalling occur on the right side of the specimen’s prefabricated hole. Compared to other stages, the spalled debris particles have larger diameters. As the test progresses, extensive particle ejection occurs on both sides of the prefabricated hole, with ejection angles close to 0°. The diameter of the ejected particles is significantly smaller compared to the particle spalling stage. Cracks appear on both sides of the hole, leading to extensive damage. During the full-scale rockburst stage, widespread particle splashing and spalling occur on the inner walls of both sides of the hole. A large amount of fine particle debris mixed with dust is ejected from both sides of the prefabricated hole, forming a blockage in the middle of the tunnel. The ejection of debris is intense. After the rockburst, significant damage is observed on both sides of the hole, with some debris falling from the inner walls. By comparing specimens with different water saturation degrees and observing the deformation and failure phenomena at different stages of rockburst, the following effects of water saturation on the rockburst damage mechanism can be inferred: as the water saturation of the specimens increases, the ejection angle of debris decreases, transitioning from horizontal ejection to parabolic ejection trajectories. The severity of damage to the prefabricated hole gradually decreases, and the ejection angle of particles increases with increasing water saturation degree.
With higher water saturation degrees, the number of ejected debris particles during a rockburst decreases. The ejected particles change from blocky with dust to blocky only, and their size increases gradually. The length and width of cracks generated in the prefabricated hole decrease with increasing water saturation degree. Both the phenomenon of debris ejection and damage to the prefabricated hole indicate the severity of rockburst, which decreases with increasing water saturation degree in the rock analog specimens.

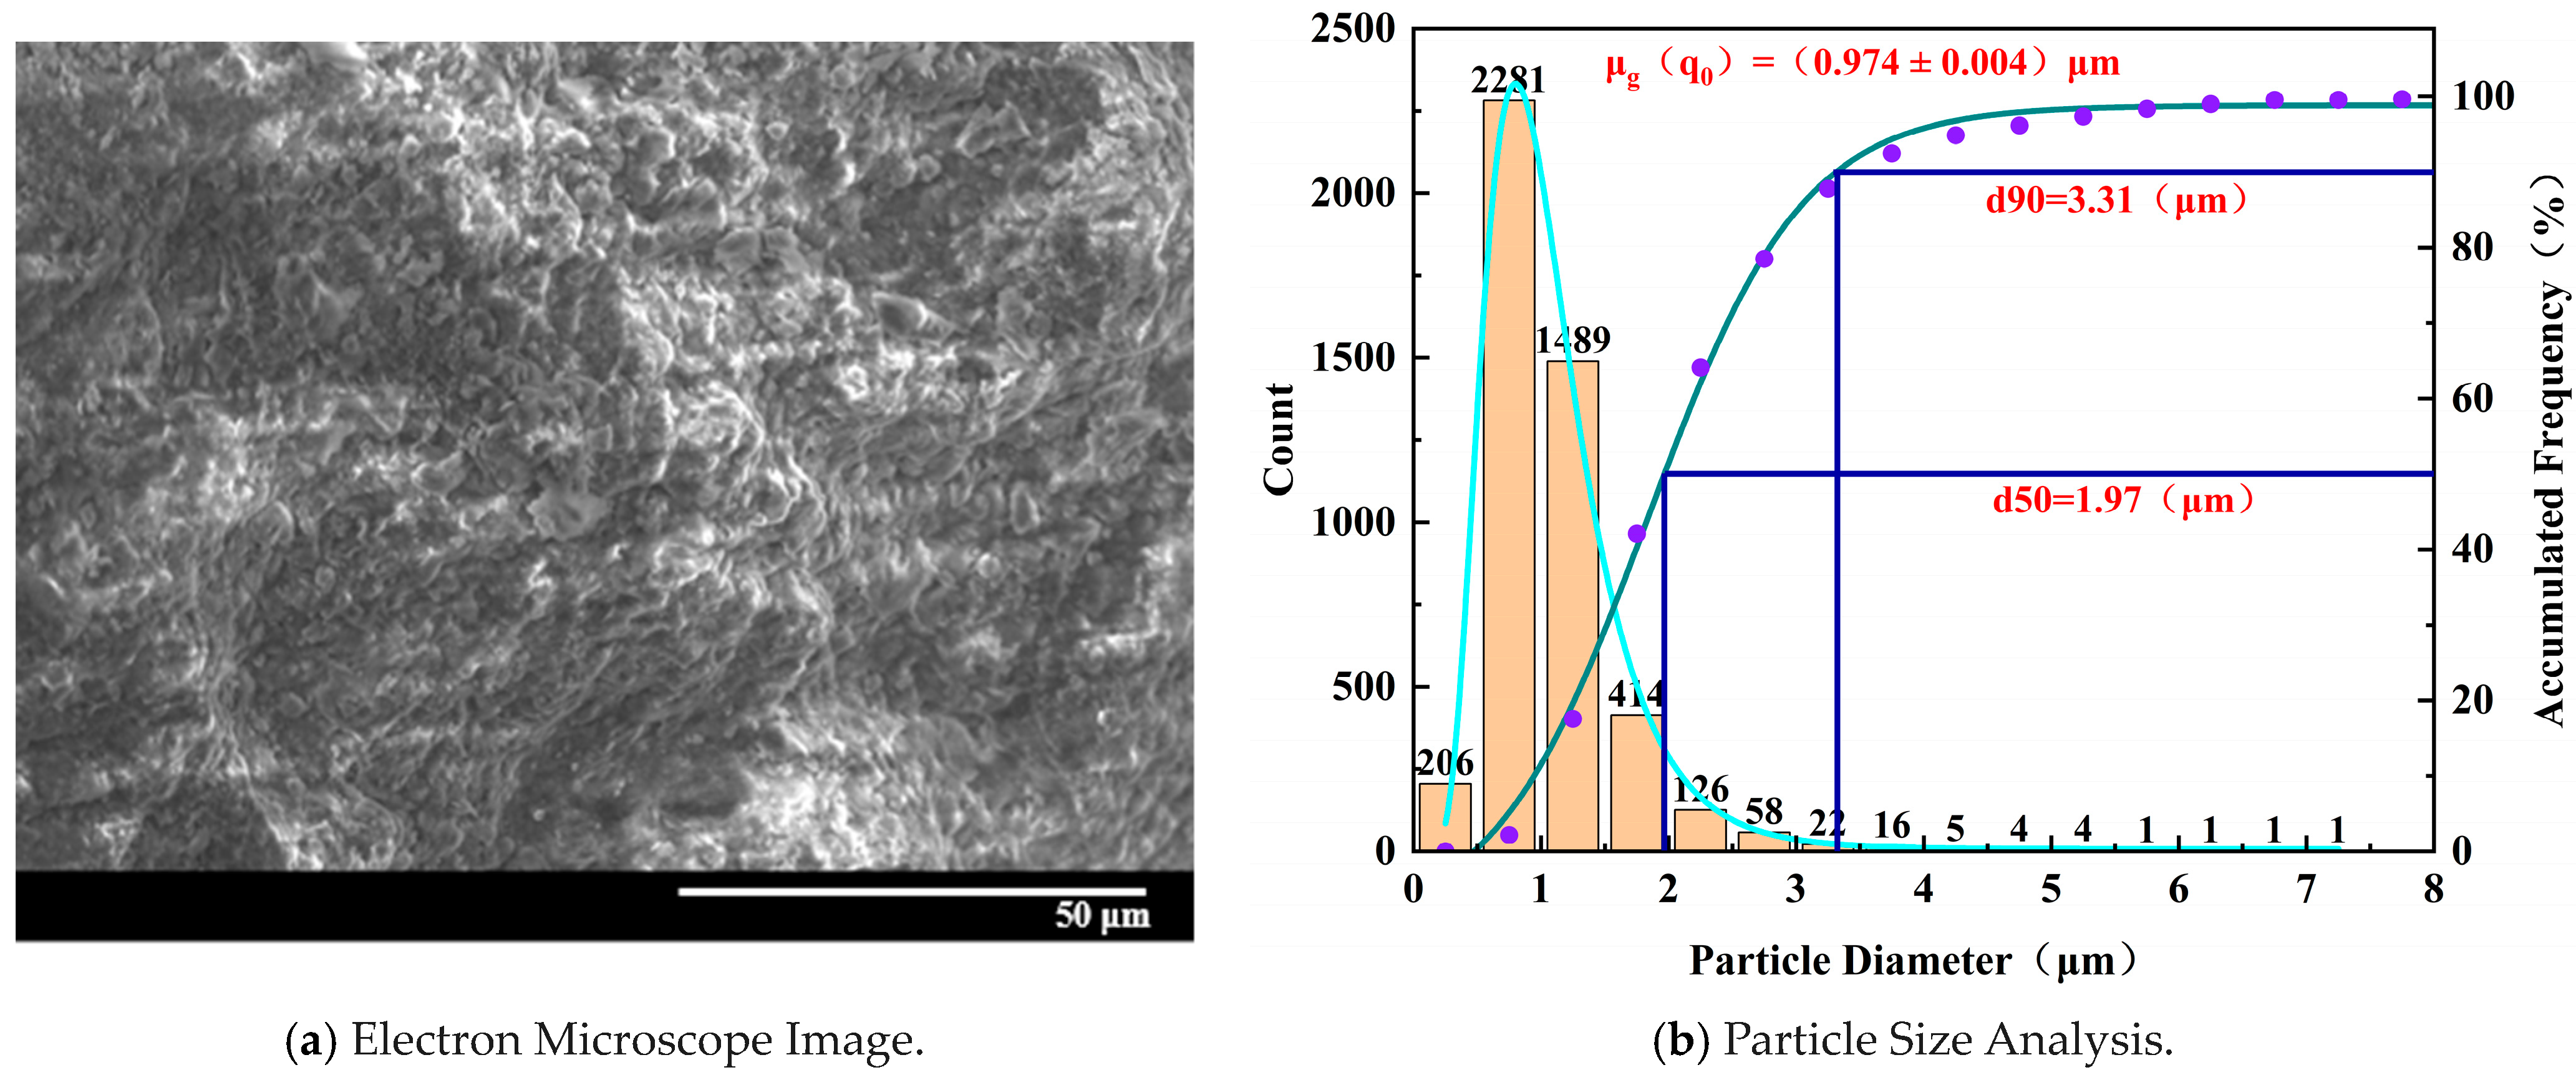
3.3. Microscopic Characteristics of Rockburst

Microscopic structural damage exists within specimens with different degrees of water absorption. As the water absorption degree increases gradually from 0% to 100%, it can be clearly observed from SEM images that the damaged surfaces transition from relatively smooth to fractured and uneven states, and there is a noticeable change in the diameter of the peeled-off particles due to compression. Gaps between particles gradually develop, with particle structures being denser at low water saturation degrees and gradually fracturing as the water absorption degree increases. Eventually, flocculent particles appear, and the binding material between particles decreases, leading to a looser structure. The number and size of pores increase gradually, indicating the damage pattern of the microscopic structure after stress-induced damage to the specimens.
Figure 10 shows that for the specimen with 0% water absorption, the electron microscope image reveals a fractured structure with significant cracks. The interconnected cracks exhibit shallow depths, and the peeled-off damaged particles are relatively large, maintaining overall integrity and regular shape. The particles are densely arranged and interconnected without significant pores observed. The distribution of pores is low. The scattered particles mainly consist of larger block-like particles, and there is tight binding between the particles without the presence of flocculent particles. Although there are smaller particles, their quantity is relatively small. Microscopic pores are observed along the crack regions, with particle sizes decreasing gradually from large to small.
Figure 11 shows that for the specimen with 25% water absorption, the electron microscope image depicts a more fragmented structure with multiple instances of peeling and larger voids. The density of distribution of tiny particles is higher, and the overall particle diameter decreases. The proportion of larger particles with regular shapes is smaller. Microscopic pores appear more frequently between the particles, and the gaps between particles become more apparent, indicating a progressively looser arrangement of particles. Smaller flocculent particles are observed, suggesting damage to the binding material due to water erosion, resulting in irregular flocculent particles.
Figure 12 demonstrates that for the specimen with 50% water absorption, the electron microscope image shows an overall fragmented and loose structure, resembling a honeycomb pattern. The cracks are interconnected and well-developed, with deeper depths. The larger-diameter particles on the structure surface are significantly reduced, and clear gaps appear between particles. The damaged particles exhibit irregular shapes and breakdowns, with a noticeable increase in flocculent particles and a higher proportion of small particle distribution.
Figure 13 demonstrates that for the specimen with 75% water absorption, the electron microscope image shows a transition from a relatively fragmented structure to a honeycomb-like structure with severe fragmentation. Microscopic pores between particles gradually connect to form distinct seams, and the number of cracks increases significantly. The pores enlarge, transforming from particle-bound structures to isolated distributions. The edges of microscopic particles on the structure surface become curled, forming numerous flocculent particles. The overall particle diameter on the fractured structure surface notably decreases, and the layered structure gradually disintegrates into tiny particles.
Figure 14 shows that for the specimen with 100% water absorption, the electron microscope image reveals a honeycomb-like structure with extensive fragmentation. Numerous irregular voids caused by peeling are evident, and the scattered particles are primarily tiny. The voids between particles are completely interconnected, forming micro-cracks, and the micro-pores develop into larger voids. The binding particle structure disintegrates, resulting in numerous flocculent particles. Compared to the specimen with 0% water absorption, significant changes in the microstructure are observed, including a notable decrease in overall particle diameter, a looser particle structure, a significant increase in pore/crack formation, and a transition from a compact structure to a honeycomb-like one. The appearance of numerous flocculent particles indicates significant damage due to water erosion.
To analyze the particle size distribution of samples with different water absorption levels, we sampled at various locations on the specimens to account for positional and characteristic variations. The results were then averaged to minimize random variability and ensure experimental reliability. Based on the normalized distribution of particle sizes on typical damaged surfaces of samples with different water absorption levels, it can be observed that as water absorption increases, the average particle size of microscopic particles gradually decreases. The overall slope of the normal distribution curve significantly increases, the particle diameter significantly shifts to the left, and the overall number of particles increases. This indicates that as water absorption increases, microstructural damage becomes more severe.
Summarizing the microstructural changes with varying degrees of water absorption, the dissolution and erosion of cementitious materials, along with the physical and chemical effects of water, lead to the development and interconnection of micro-pores and cracks in the rock-like material [46,47]. These structures become uniform in size; the particle structure gradually loosens and breaks, and the particle diameter decreases, resulting in the deterioration of the macroscopic strength of the rock-like material.

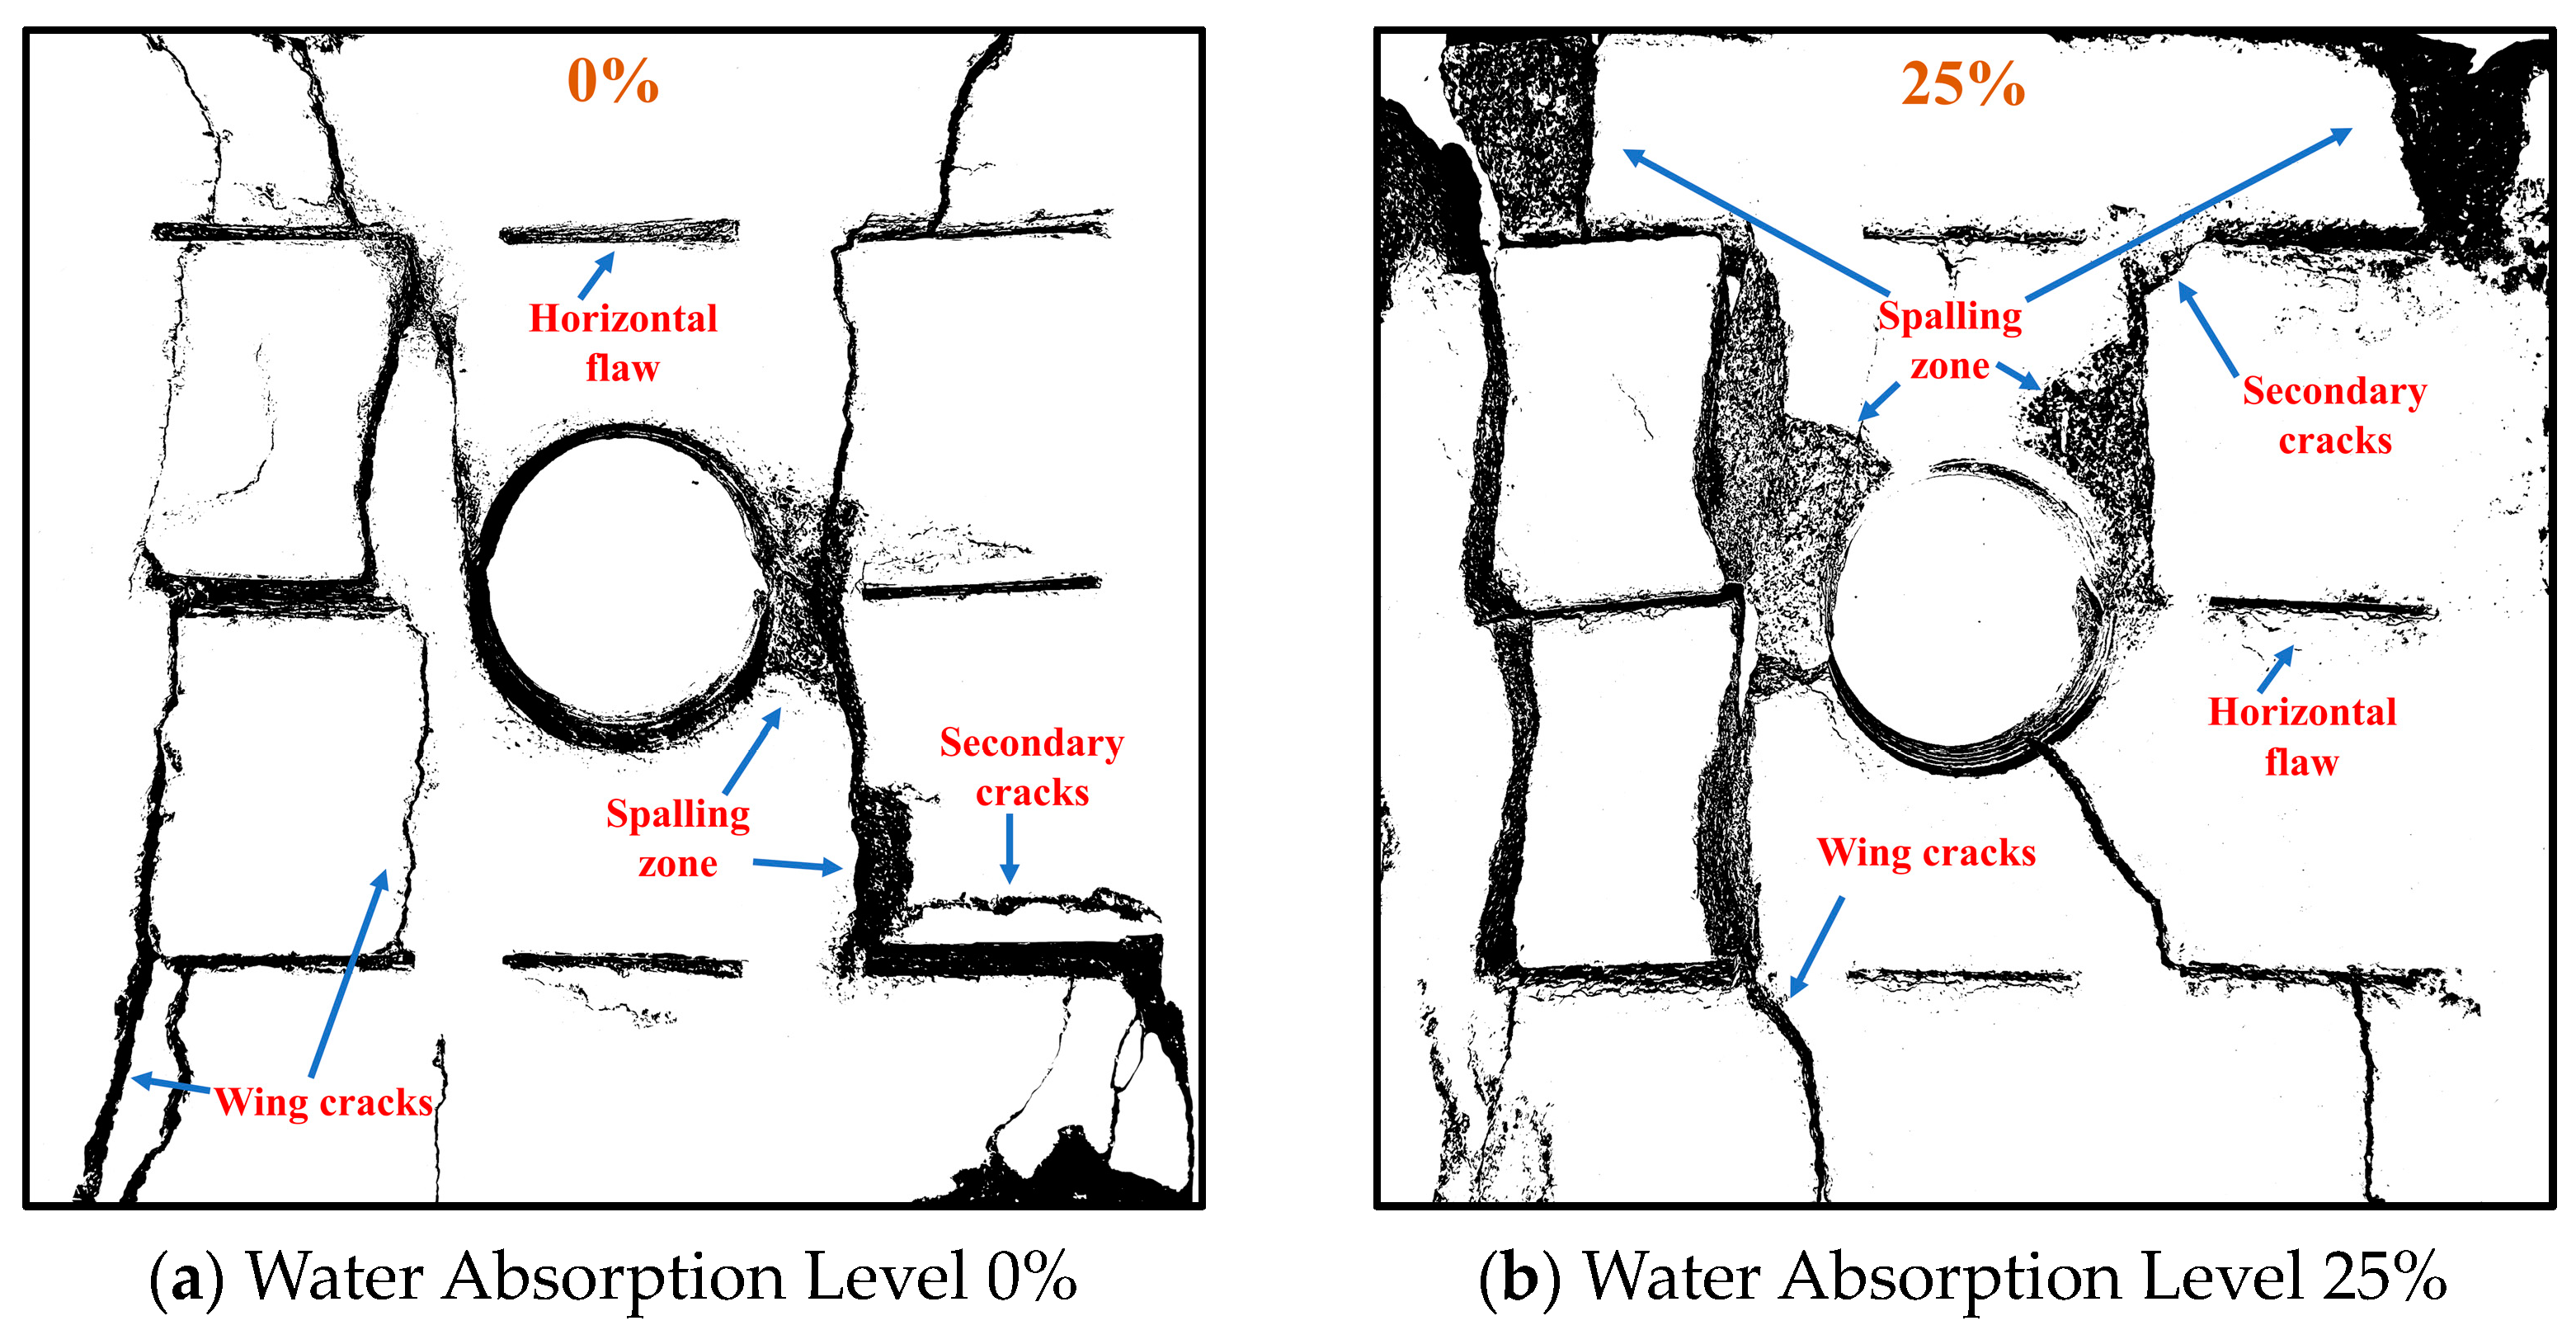
3.4. Crack Propagation Characteristics

The fracture patterns on the front and back sides of the specimens are essentially identical; thus, only the fracture patterns on the front side are analyzed. Figure 15 illustrates the complete fracture propagation patterns of specimens with varying degrees of water absorption [48,49,50,51,52]. Enhanced water absorption results in increased dissipation energy within the samples. Due to the effect of dissipation energy, the propagation of microcracks within the samples markedly diminishes the energy storage capacity, with elastic energy decreasing by 24.40%, 41.80%, 63.08%, and 64.80%, respectively. The substantial reduction in elastic energy results in increased macroscopic damage.
Analysis of the fracture propagation patterns reveals that cracks primarily originate from both ends of the horizontally pre-existing cracks [53], forming wing cracks that penetrate through the rock bridge. Simultaneously, tension cracks develop on both sides of the holes. Moreover, during the loading process, rockbursts occur, leading to debris ejection and stripping on both sides of the pre-existing holes. The V-shaped damage caused by debris ejection intersects with secondary shear cracks and wing cracks, forming main and sub-diagonal penetrating cracks. As water absorption increases, the number of wing cracks gradually increases, and secondary shear cracks penetrate the pre-existing holes from both sides of the cracks. Additional debris damage occurs on both sides of the specimen’s diagonal line. Thus, with the increase in water absorption, the deformation and damage severity of the specimens gradually intensify.

3.5. Characteristics of Rockburst Debris

Debris fragments following a rockburst can intuitively reflect the extent of damage and characteristics of the rock under uniaxial conditions [13,54,55]. The debris collected after the experiment is processed by sieving with calipers and a sieve. Figure 16 presents a schematic diagram of typical rockburst debris.
Based on the diameter of the debris, it can be classified into microscopic, fine, and medium debris. Mass statistics are conducted based on the particle size of the debris, and Figure 17 shows the mass percentage of medium, fine, and microscopic debris.
Plotting the proportion of fine, medium, and microscopic debris generated by specimens with different degrees of water absorption after stress loading. From Figure 17, it is evident that as the water absorption degree increases, the total mass of debris generated by the rockburst decreases. The mass percentage of fine and microscopic debris in simulated rock samples gradually decreases, while the mass percentage of medium-sized debris shows an increasing trend. The decrease in the proportion of fine and microscopic debris indicates that the particle diameter of debris generated by rockbursts is larger. The proportion of medium-sized debris gradually increases, indicating the presence of pore water pressure within the internal pores of the specimen, which reduces the strength of the specimen. The above analysis results indicate that the increase in water absorption degree leads to a gradual increase in the diameter of debris particles, a decrease in fine and microscopic debris particles, a decrease in the energy released by rockbursts, and a weakening of the intensity of rockbursts.

4. Conclusions

In this study, uniaxial compression tests, a high-speed camera system, SEM tests, and particle size analysis were used to conduct simulated rockburst experiments on multi-defect specimens with varying water absorption levels. The impact of water on rockburst in multi-defect specimens was comprehensively analyzed. The main conclusions of this study are as follows:
  • The rockburst damage process remains consistent across different water absorption levels. Higher water absorption results in decreased mass of rockburst debris, reduced proportion of fine particles, lower elastic potential energy, and increased dissipation energy, resulting in reduced severity of rockburst;
  • Increasing water absorption reduces the diameter of microscopic structural particles, increases their quantity, and fragments the structure. Additionally, it leads to more wing cracks and secondary cracks penetrating pores, forming diagonal damage patterns. This reduces specimen energy storage capacity and rockburst severity.

Author Contributions

Conceptualization, G.L. and X.L.; data curation, G.L., W.C. and Z.P.; formal analysis, X.L., G.L. and W.C.; funding acquisition, G.L.; investigation, G.L.; project administration, G.L.; resources, G.L. and W.C.; software, G.L., X.L. and W.C.; writing—original draft, G.L.; writing—review, G.L. and W.C. All authors have read and agreed to the published version of the manuscript.

Funding

This research was funded by the Scientific Research Foundation of Hunan Provincial Education Department (22B0737), the Scientific Research Foundation of Hunan Provincial Education Department (22B0732), the Natural Science Foundation of Hunan Province (2023JJ40212; 2023JJ30191).

Institutional Review Board Statement

Not applicable.

Informed Consent Statement

Not applicable.

Data Availability Statement

The data are not publicly available due to privacy.

Conflicts of Interest

The authors declare no conflicts of interest.

References

  1. Chen, Z.; Zhou, Y.-J.; Zhang, L.-M.; Xu, Y.-N. Study on Seepage Characteristics of Grouting Slurry for Water-Absorbing Mudstone with Rough Fissure. Materials 2024, 17, 784. [Google Scholar] [CrossRef] [PubMed]
  2. Wang, T.; Liu, Z.; Liu, L.; Feng, X. Numerical Study on the Impact of Locked-In Stress on Rock Failure Processes and Energy Evolutions. Materials 2023, 16, 7519. [Google Scholar] [CrossRef]
  3. Wang, Y.; Xia, J.; Li, P.; Yu, L.; Yang, H.; Chen, Y. Experimental Study and Analytical Modeling on Properties of Freeze–Thaw Durability of Coal Gangue Pervious Concrete. Materials 2023, 16, 7104. [Google Scholar] [CrossRef] [PubMed]
  4. Wagner, H. Deep mining: A rock engineering challenge. Rock Mech. Rock Eng. 2019, 52, 1417–1446. [Google Scholar] [CrossRef]
  5. Shirani Faradonbeh, R.; Taheri, A. Long-term prediction of rockburst hazard in deep underground openings using three robust data mining techniques. Eng. Comput. 2019, 35, 659–675. [Google Scholar] [CrossRef]
  6. Li, J.; Liu, D.; He, M.; Guo, Y. True triaxial experimental study on the variation characteristics of rockburst with the number of fast unloading surfaces. Rock Mech. Rock Eng. 2023, 56, 5585–5606. [Google Scholar] [CrossRef]
  7. Askaripour, M.; Saeidi, A.; Rouleau, A.; Mercier-Langevin, P. Rockburst in underground excavations: A review of mechanism, classification, and prediction methods. Undergr. Space 2022, 7, 577–607. [Google Scholar] [CrossRef]
  8. Diederichs, M. Early assessment of dynamic rupture hazard for rockburst risk management in deep tunnel projects. J. S. Afr. Inst. Min. Metall. 2018, 118, 193–204. [Google Scholar] [CrossRef]
  9. Li, P.; Zhao, J.; Bu, W.; Niu, W.; Liu, P.; Sun, M. Optimization of Rockburst Risk Control Measures for Deeply Buried TBM Tunnels: A Case Study. Buildings 2023, 13, 1440. [Google Scholar] [CrossRef]
  10. Chen, W.; Liu, J.; Liu, W.; Peng, W.; Zhao, Y.; Wu, Q.; Wang, Y.; Wan, W.; Li, S.; Peng, H. Lateral deformation and acoustic emission characteristics of dam bedrock under various river flow scouring rates. J. Mater. Res. Technol. 2023, 26, 3245–3271. [Google Scholar] [CrossRef]
  11. Chen, W.; Wan, W.; Zhao, Y.; He, H.; Wu, Q.; Zhou, Y.; Xie, S. Mechanical damage evolution and mechanism of sandstone with prefabricated parallel double fissures under high-humidity condition. Bull. Eng. Geol. Environ. 2022, 81, 245. [Google Scholar] [CrossRef]
  12. Batugin, A.; Kolikov, K.; Ivannikov, A.; Ignatov, Y.; Krasnoshtanov, D. Transformation of the geodynamic hazard manifestation forms in mining areas. In Proceedings of the 19th SGEM International Multidisciplinary Scientific GeoConference EXPO, Albena, Bulgaria, 30 June–6 July 2019; 19, pp. 717–724. [Google Scholar]
  13. He, M.; Cheng, T.; Qiao, Y.; Li, H. A review of rockburst: Experiments, theories, and simulations. J. Rock Mech. Geotech. Eng. 2023, 15, 1312–1353. [Google Scholar] [CrossRef]
  14. Zhai, S.; Su, G.; Yin, S.; Zhao, B.; Yan, L. Rockburst characteristics of several hard brittle rocks: A true triaxial experimental study. J. Rock Mech. Geotech. Eng. 2020, 12, 279–296. [Google Scholar] [CrossRef]
  15. Wu, G.-s.; Yu, W.-j.; Zuo, J.-p.; Li, C.-y.; Li, J.-h.; Du, S.-h. Experimental investigation on rockburst behavior of the rock-coal-bolt specimen under different stress conditions. Sci. Rep. 2020, 10, 7556. [Google Scholar] [CrossRef] [PubMed]
  16. Luo, Y.; Liao, P.; Pan, R.; Zou, J.; Zhou, X. Effect of bar diameter on bond performance of helically ribbed GFRP bar to UHPC. J. Build. Eng. 2024, 91, 109577. [Google Scholar] [CrossRef]
  17. Gong, F.-q.; Si, X.-f.; Li, X.-b.; Wang, S.-y. Experimental investigation of strain rockburst in circular caverns under deep three-dimensional high-stress conditions. Rock Mech. Rock Eng. 2019, 52, 1459–1474. [Google Scholar] [CrossRef]
  18. Klammer, A.; Peintner, C.; Gottsbacher, L.; Biermann, J.; Blümel, M.; Schubert, W.; Marcher, T. Investigation of the influence of grain-scale heterogeneity on strainburst proneness using rock-like material. Rock Mech. Rock Eng. 2023, 56, 407–425. [Google Scholar] [CrossRef]
  19. Dyskin, A.; Germanovich, L. Model of rockburst caused by cracks growing near free surface. Rockbursts Seism. Mines 2022, 93, 169–175. [Google Scholar]
  20. Liu, H.; Yu, B.; Liu, J.; Wang, T. Investigation of impact rock burst induced by energy released from hard rock fractures. Arab. J. Geosci. 2019, 12, 381. [Google Scholar] [CrossRef]
  21. Manouchehrian, A.; Cai, M. Numerical modeling of rockburst near fault zones in deep tunnels. Tunn. Undergr. Space Technol. 2018, 80, 164–180. [Google Scholar] [CrossRef]
  22. Chen, W.; Liu, J.; Peng, W.; Zhao, Y.; Luo, S.; Wan, W.; Wu, Q.; Wang, Y.; Li, S.; Tang, X. Aging deterioration of mechanical properties on coal-rock combinations considering hydro-chemical corrosion. Energy 2023, 282, 128770. [Google Scholar] [CrossRef]
  23. Luo, S.; Gong, F.; Peng, K.; Liu, Z. Influence of water on rockburst proneness of sandstone: Insights from relative and absolute energy storage. Eng. Geol. 2023, 323, 107172. [Google Scholar] [CrossRef]
  24. Akdag, S.; Karakus, M.; Taheri, A.; Nguyen, G.; Manchao, H. Effects of thermal damage on strain burst mechanism for brittle rocks under true-triaxial loading conditions. Rock Mech. Rock Eng. 2018, 51, 1657–1682. [Google Scholar] [CrossRef]
  25. Chen, W.; Wan, W.; He, H.; Liao, D.; Liu, J. Temperature Field Distribution and Numerical Simulation of Improved Freezing Scheme for Shafts in Loose and Soft Stratum. Rock Mech. Rock Eng. 2024, 57, 2695–2725. [Google Scholar] [CrossRef]
  26. Lin, M.; Zhang, L.; Liu, X.; Xia, Y.; He, J.; Ke, X. The meso-analysis of the rock-burst debris of rock similar material based on SEM. Adv. Civ. Engineering. 2020, 2020, 9168908. [Google Scholar] [CrossRef]
  27. Ma, C.; Zhu, Z.; Fang, Z.; Li, Z.; Liu, L. Optimal proportion of similar materials and rockburst tendency of white sandstone. Adv. Mater. Sci. Eng. 2021, 2021, 6590779. [Google Scholar] [CrossRef]
  28. Bi, J.; Zhou, X.-P.; Xu, X.-M. Numerical simulation of failure process of rock-like materials subjected to impact loads. Int. J. Geomech. 2017, 17, 04016073. [Google Scholar] [CrossRef]
  29. Tang, X.; Tao, S.; Li, P.; Rutqvist, J.; Hu, M.; Sun, L. The propagation and interaction of cracks under freeze-thaw cycling in rock-like material. Int. J. Rock Mech. Min. Sci. 2022, 154, 105112. [Google Scholar] [CrossRef]
  30. Gao, Y.; Luo, J.; Yuan, S.; Zhang, J.; Gao, S.; Zhu, M.; Li, Z.; Zhou, X. Fabrication of graphene oxide/fiber reinforced polymer cement mortar with remarkable repair and bonding properties. J. Mater. Res. Technol. 2023, 24, 9413–9433. [Google Scholar] [CrossRef]
  31. Shi, Y.; Long, G.; Ma, C.; Xie, Y.; He, J. Design and preparation of ultra-high performance concrete with low environmental impact. J. Clean. Prod. 2019, 214, 633–643. [Google Scholar] [CrossRef]
  32. Shen, R.; Li, H.; Wang, E.; Chen, T.; Li, T.; Tian, H.; Hou, Z. Infrared radiation characteristics and fracture precursor information extraction of loaded sandstone samples with varying moisture contents. Int. J. Rock Mech. Min. Sci. 2020, 130, 104344. [Google Scholar] [CrossRef]
  33. Du, B.; Bai, H.; Wu, G. Dynamic compression properties and deterioration of red-sandstone subject to cyclic wet-dry treatment. Adv. Civ. Eng. 2019, 2019, 1487156. [Google Scholar] [CrossRef]
  34. Huang, S.; He, Y.; Liu, G.; Lu, Z.; Xin, Z. Effect of water content on the mechanical properties and deformation characteristics of the clay-bearing red sandstone. Bull. Eng. Geol. Environ. 2021, 80, 1767–1790. [Google Scholar] [CrossRef]
  35. Jiang, L.; Xu, Y.; Chen, B.; Wu, B. Effect of water content on the mechanical properties of an artificial porous rock. Bull. Eng. Geol. Environ. 2021, 80, 7669–7681. [Google Scholar] [CrossRef]
  36. Yao, Q.; Chen, T.; Tang, C.; Sedighi, M.; Wang, S.; Huang, Q. Influence of moisture on crack propagation in coal and its failure modes. Eng. Geol. 2019, 258, 105156. [Google Scholar] [CrossRef]
  37. Yao, Q.; Zheng, C.; Tang, C.; Xu, Q.; Chong, Z.; Li, X. Experimental investigation of the mechanical failure behavior of coal specimens with water intrusion. Front. Earth Sci. 2020, 7, 348. [Google Scholar] [CrossRef]
  38. Lin, Q.; Cao, P.; Wen, G.; Meng, J.; Cao, R.; Zhao, Z. Crack coalescence in rock-like specimens with two dissimilar layers and pre-existing double parallel joints under uniaxial compression. Int. J. Rock Mech. Min. Sci. 2021, 139, 104621. [Google Scholar] [CrossRef]
  39. Xin, J.; Jiang, Q.; Li, S.; Chen, P.; Zhao, H. Fracturing and energy evolution of rock around prefabricated rectangular and circular tunnels under shearing load: A comparative analysis. Rock Mech. Rock Eng. 2023, 56, 9057–9084. [Google Scholar] [CrossRef]
  40. Fu, B.; Hu, L. Experimental and numerical investigations on crack development and mechanical behavior of marble under uniaxial cyclic loading compression. Int. J. Rock Mech. Min. Sci. 2020, 130, 104289. [Google Scholar] [CrossRef]
  41. Chen, Z.; Su, G.; Ju, J.W.; Jiang, J. Experimental study on energy dissipation of fragments during rockburst. Bull. Eng. Geol. Environ. 2019, 78, 5369–5386. [Google Scholar] [CrossRef]
  42. Zhang, R.; Liu, Y.; Hou, S. Evaluation of rockburst risk in deep tunnels considering structural planes based on energy dissipation rate criterion and numerical simulation. Tunn. Undergr. Space Technol. 2023, 137, 105128. [Google Scholar] [CrossRef]
  43. Hu, L.; Li, Y.; Liang, X.; Tang, C.a.; Yan, L. Rock damage and energy balance of strainbursts induced by low frequency seismic disturbance at high static stress. Rock Mech. Rock Eng. 2020, 53, 4857–4872. [Google Scholar] [CrossRef]
  44. Liu, S.; Wang, J.; Chen, G.; Meng, K.; Zhang, Y. Thermal Infrared Precursor Information of Rock Surface during Failure Considering Different Intermediate Principal Stresses. Sustainability 2023, 15, 8877. [Google Scholar] [CrossRef]
  45. Ortlepp, W.; Stacey, T. Rockburst mechanisms in tunnels and shafts. Tunn. Undergr. Space Technol. 1994, 9, 59–65. [Google Scholar] [CrossRef]
  46. Han, P.; Zhang, C.; Wang, X.; Wang, L. Study of mechanical characteristics and damage mechanism of sandstone under long-term immersion. Eng. Geol. 2023, 315, 107020. [Google Scholar] [CrossRef]
  47. Niu, Q.; Wang, Q.; Wang, W.; Chang, J.; Chen, M.; Wang, H.; Cai, N.; Fan, L. Responses of multi-scale microstructures, physical-mechanical and hydraulic characteristics of roof rocks caused by the supercritical CO2-water-rock reaction. Energy 2022, 238, 121727. [Google Scholar] [CrossRef]
  48. Wang, H. Hydraulic fracture propagation in naturally fractured reservoirs: Complex fracture or fracture networks. J. Nat. Gas Sci. Eng. 2019, 68, 102911. [Google Scholar] [CrossRef]
  49. Tan, P.; Jin, Y.; Yuan, L.; Xiong, Z.-Y.; Hou, B.; Chen, M.; Wan, L.-M. Understanding hydraulic fracture propagation behavior in tight sandstone–coal interbedded formations: An experimental investigation. Pet. Sci. 2019, 16, 148–160. [Google Scholar] [CrossRef]
  50. Ham, S.-M.; Kwon, T.-H. Photoelastic observation of toughness-dominant hydraulic fracture propagation across an orthogonal discontinuity in soft, viscoelastic layered formations. Int. J. Rock Mech. Min. Sci. 2020, 134, 104438. [Google Scholar] [CrossRef]
  51. Hamdia, K.M.; Ghasemi, H. Reliability analysis of the stress intensity factor using multilevel Monte Carlo methods. Probabilistic Eng. Mech. 2023, 74, 103497. [Google Scholar] [CrossRef]
  52. Innaurato, N.; Oggeri, C.; Oreste, P.; Vinai, R. Laboratory tests to study the influence of rock stress confinement on the performances of TBM discs in tunnels. Int. J. Miner. Metall. Mater. 2011, 18, 253–259. [Google Scholar] [CrossRef]
  53. Luo, Y.; Liu, X.; Chen, F.; Zhang, H.; Xiao, X. Numerical simulation on crack–inclusion interaction for rib-to-deck welded joints in orthotropic steel deck. Metals 2023, 13, 1402. [Google Scholar] [CrossRef]
  54. Fan, J.; Guo, P.; Kong, F.; Shi, X. Experimental study on rock failure characteristics of ejective rock burst based on energy compensation. Geotech. Geol. Eng. 2022, 40, 5547–5564. [Google Scholar] [CrossRef]
  55. Li, Y.; Su, G.; Pang, J.; Liu, C.; Zhang, Q.; Yang, X. Mechanism of structural–slip rockbursts in civil tunnels: An experimental investigation. Rock Mech. Rock Eng. 2021, 54, 2763–2790. [Google Scholar] [CrossRef]
Figure 1. Indoor simulation of loading conditions for tunnels with groundwater and rock defects in underground engineering.
Materials 17 02818 g001
Figure 2. Comparison of experimental results between rock analog materials and original rock samples.
Materials 17 02818 g002
Figure 3. Curve of water absorption over time for simulated rock samples.
Materials 17 02818 g003
Figure 4. Rock-like specimen preparation process, experimental loading device, and SEM (Scanning Electron Microscope) detection system.
Materials 17 02818 g004
Figure 5. Different water absorption levels, typical stress–strain curves, and strain-field evolution cloud diagram of samples.
Materials 17 02818 g005aMaterials 17 02818 g005b
Figure 6. Trend diagram of peak stress variation with water content.
Materials 17 02818 g006
Figure 7. Schematic diagram of elastic energy and dissipation energy.
Materials 17 02818 g007
Figure 8. Influence of water content on elastic potential energy and dissipated energy.
Materials 17 02818 g008
Figure 9. Different water absorption levels rockburst process diagram.
Materials 17 02818 g009
Figure 10. Microscopic characteristics of 0% water absorption degree specimen.
Materials 17 02818 g010
Figure 11. Microscopic characteristics of 25% water absorption degree specimen.
Materials 17 02818 g011
Figure 12. Microscopic characteristics of 50% water absorption degree specimen.
Materials 17 02818 g012
Figure 13. Microscopic characteristics of 75% water absorption degree specimen.
Materials 17 02818 g013
Figure 14. Microscopic Characteristics of 100% Water Absorption Degree Specimen.
Materials 17 02818 g014
Figure 15. Crack Propagation Diagram at Various Levels of Water Absorption.
Materials 17 02818 g015aMaterials 17 02818 g015b
Figure 16. Typical Fractal Distribution Diagram of Detrital Particles.
Materials 17 02818 g016
Figure 17. Mass distribution characteristics of fragments with varying water content.
Materials 17 02818 g017
Table 1. Comparison of parameters between standard samples of artificial rock and sandy mudstone.
Types of SamplesUniaxial Compressive Strength
MPa
Elastic Properties
Ue/(kJ·m−3)
Poisson’s RatioSaturation Water Absorption Rate
%
Rock-like material75.3468.920.231.4
Sandy mudstone81.4278.970.212.3
Table 2. Relationship between Elastic Energy and Dissipation Energy of Specimens with Different Water Absorption Degrees before Rockburst.
Water Absorption Level/%NumberElastic Properties
Ue/(kJ·m−3)
Mean Value
/(kJ·m−3)
Dissipation Energy
Ud/(kJ·m−3)
Mean Value
/(kJ·m−3)
0%1185.37141.134.896.55
2113.576.35
3124.468.42
25%4102.55106.691.1710.35
5100.0325.53
6117.494.34
50%7103.8382.1412.4118.65
884.1031.78
958.4911.75
75%1042.8652.1139.0521.27
1154.8212.38
1258.6612.39
100%1349.1849.6829.7449.06
1440.2821.23
1559.6096.22
Disclaimer/Publisher’s Note: The statements, opinions and data contained in all publications are solely those of the individual author(s) and contributor(s) and not of MDPI and/or the editor(s). MDPI and/or the editor(s) disclaim responsibility for any injury to people or property resulting from any ideas, methods, instructions or products referred to in the content.

