
Microhardness and Tensile Strength Analysis of SS316L/CuCrZr Interface by Laser Powder Bed Fusion


Abstract
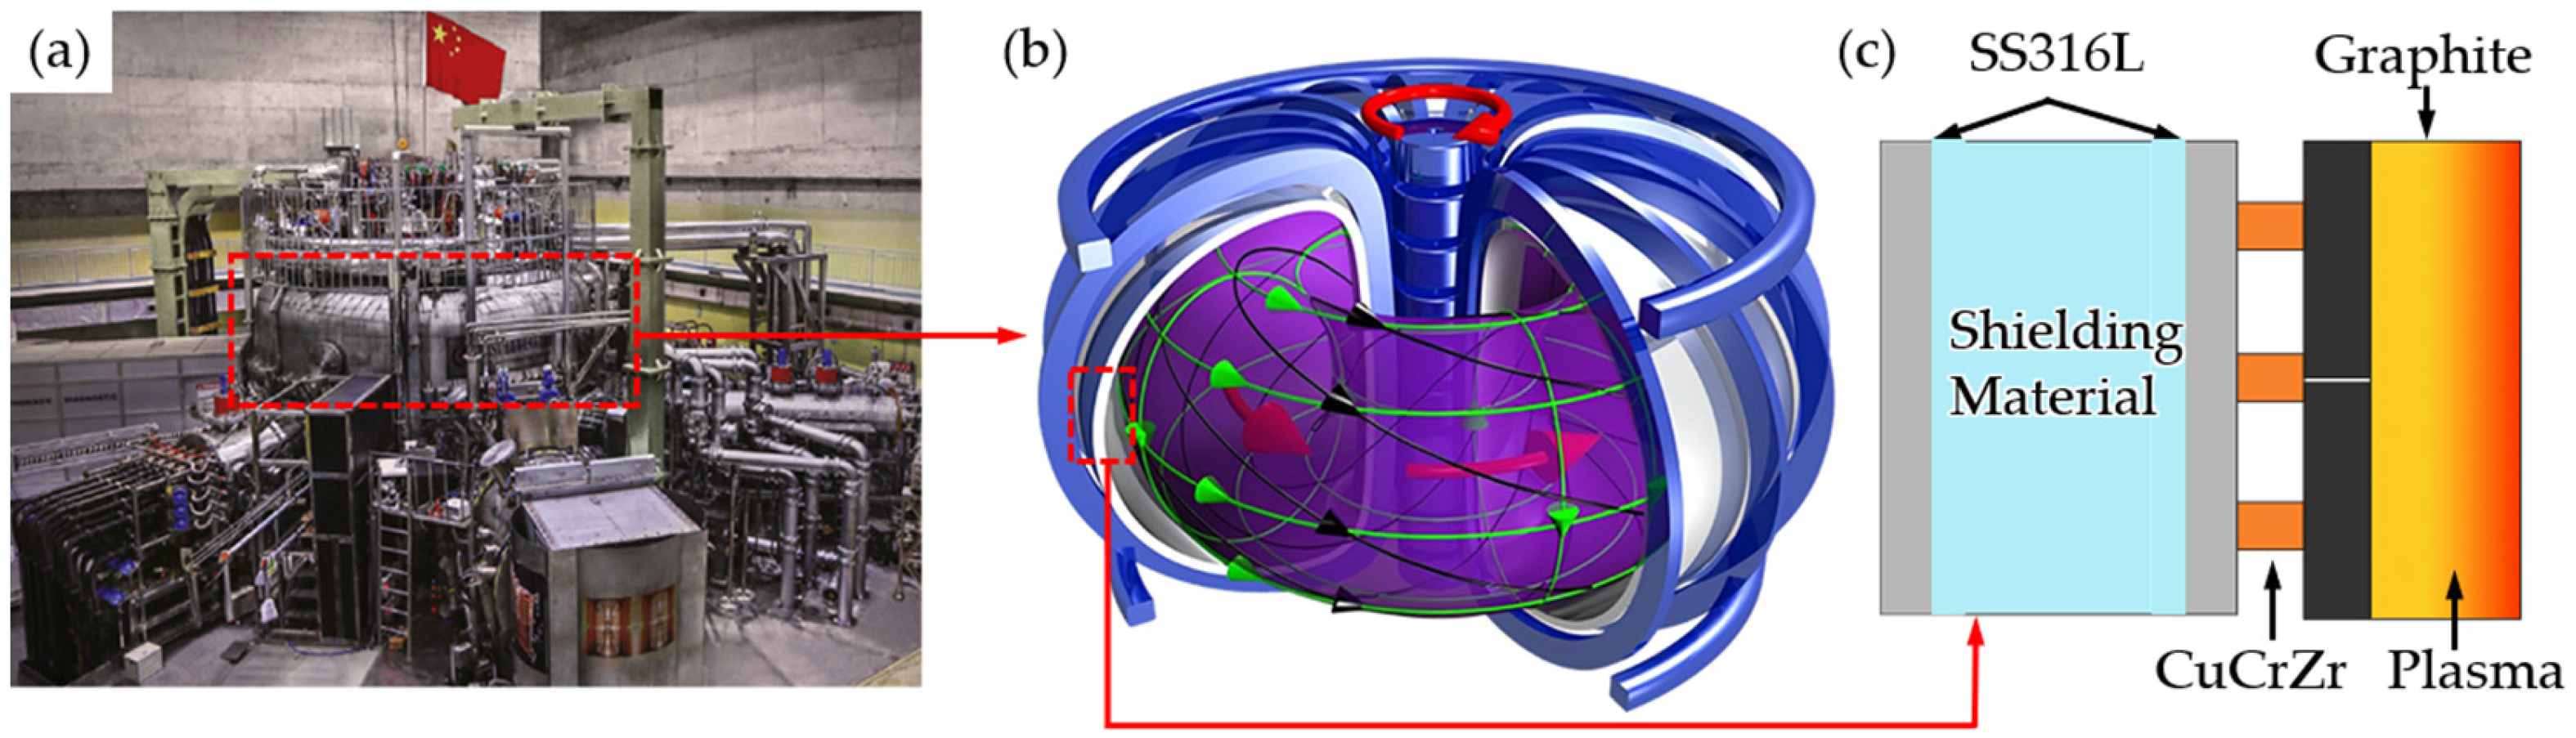
1. Introduction
2. Materials and Methods
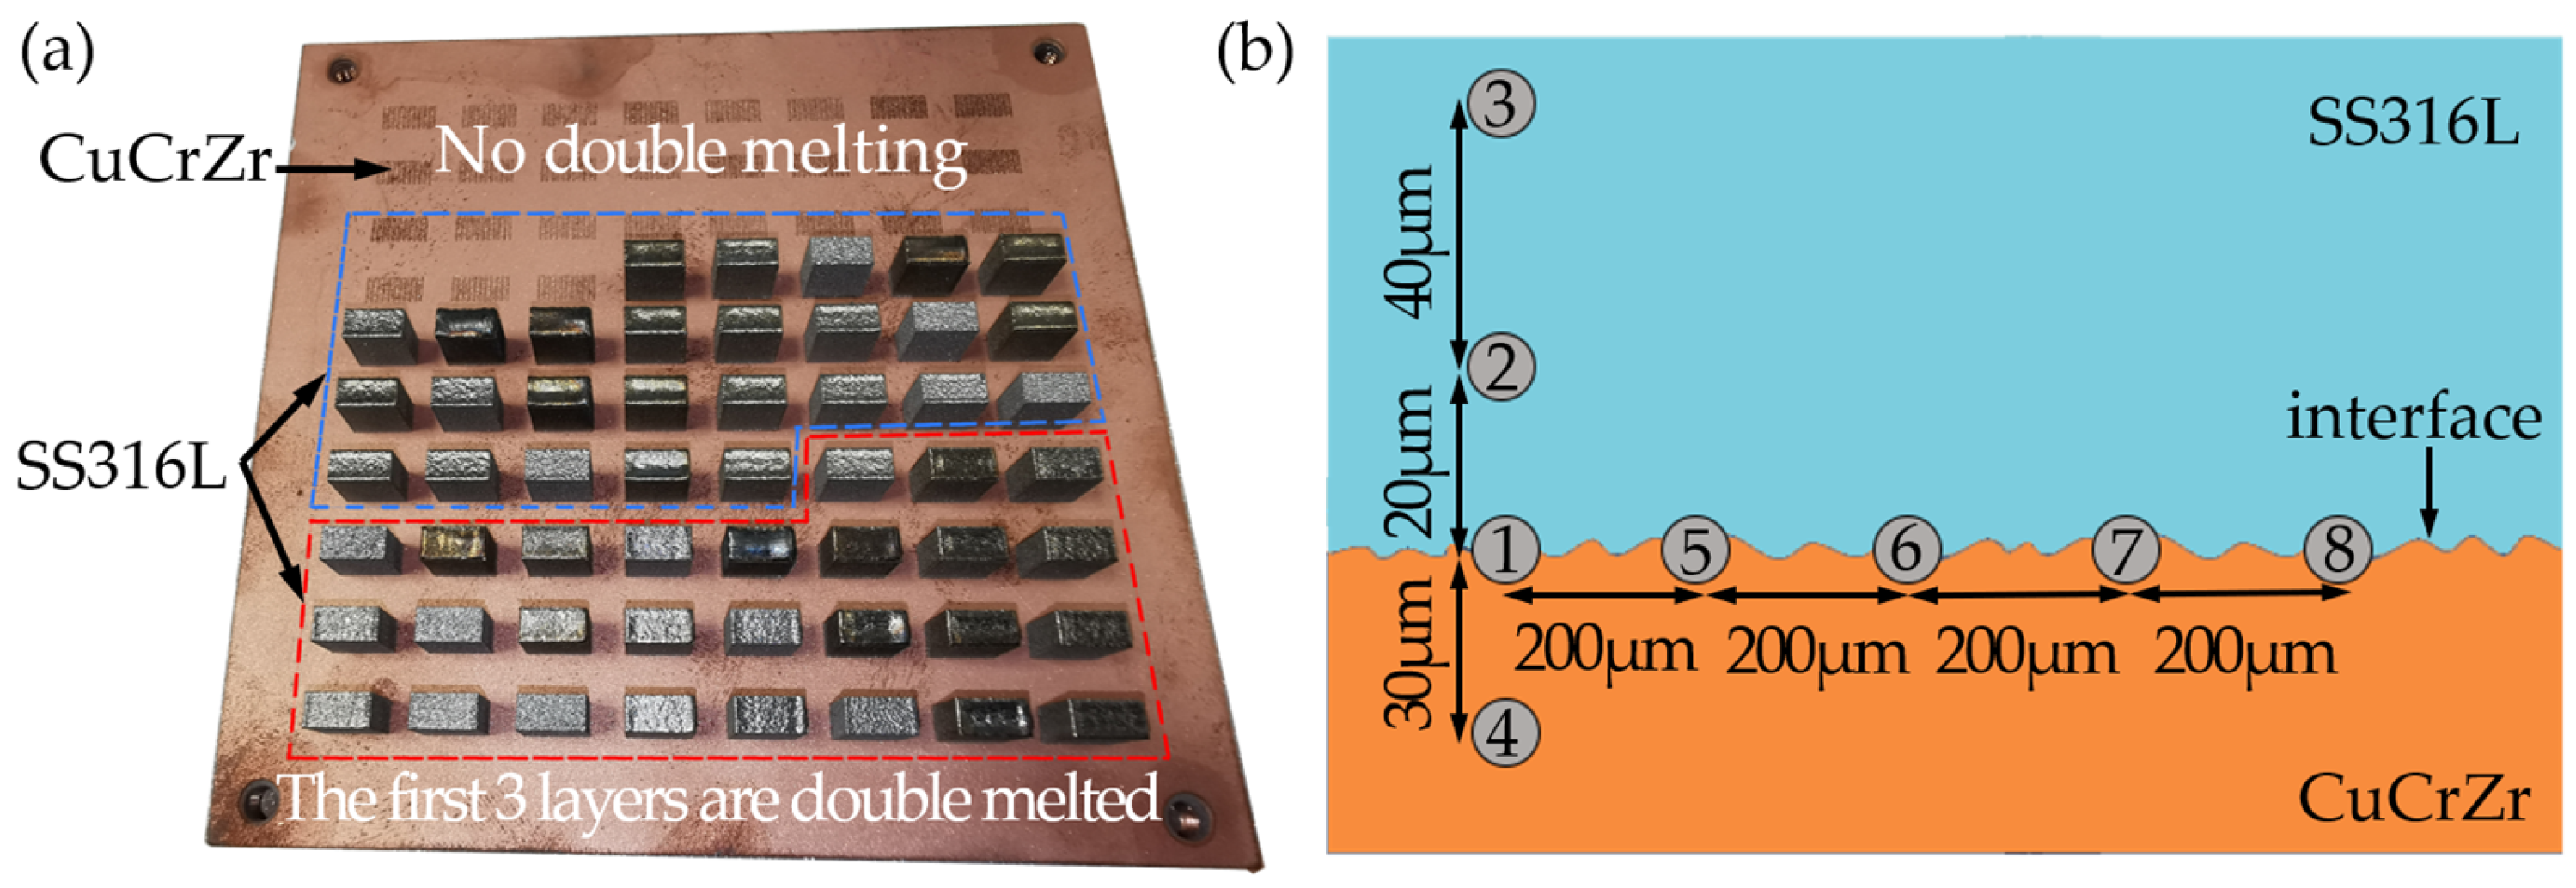
2.1. Sample Printing Process
2.2. Microhardness Test
2.3. Microhardness Test Uncertainty Analysis Method
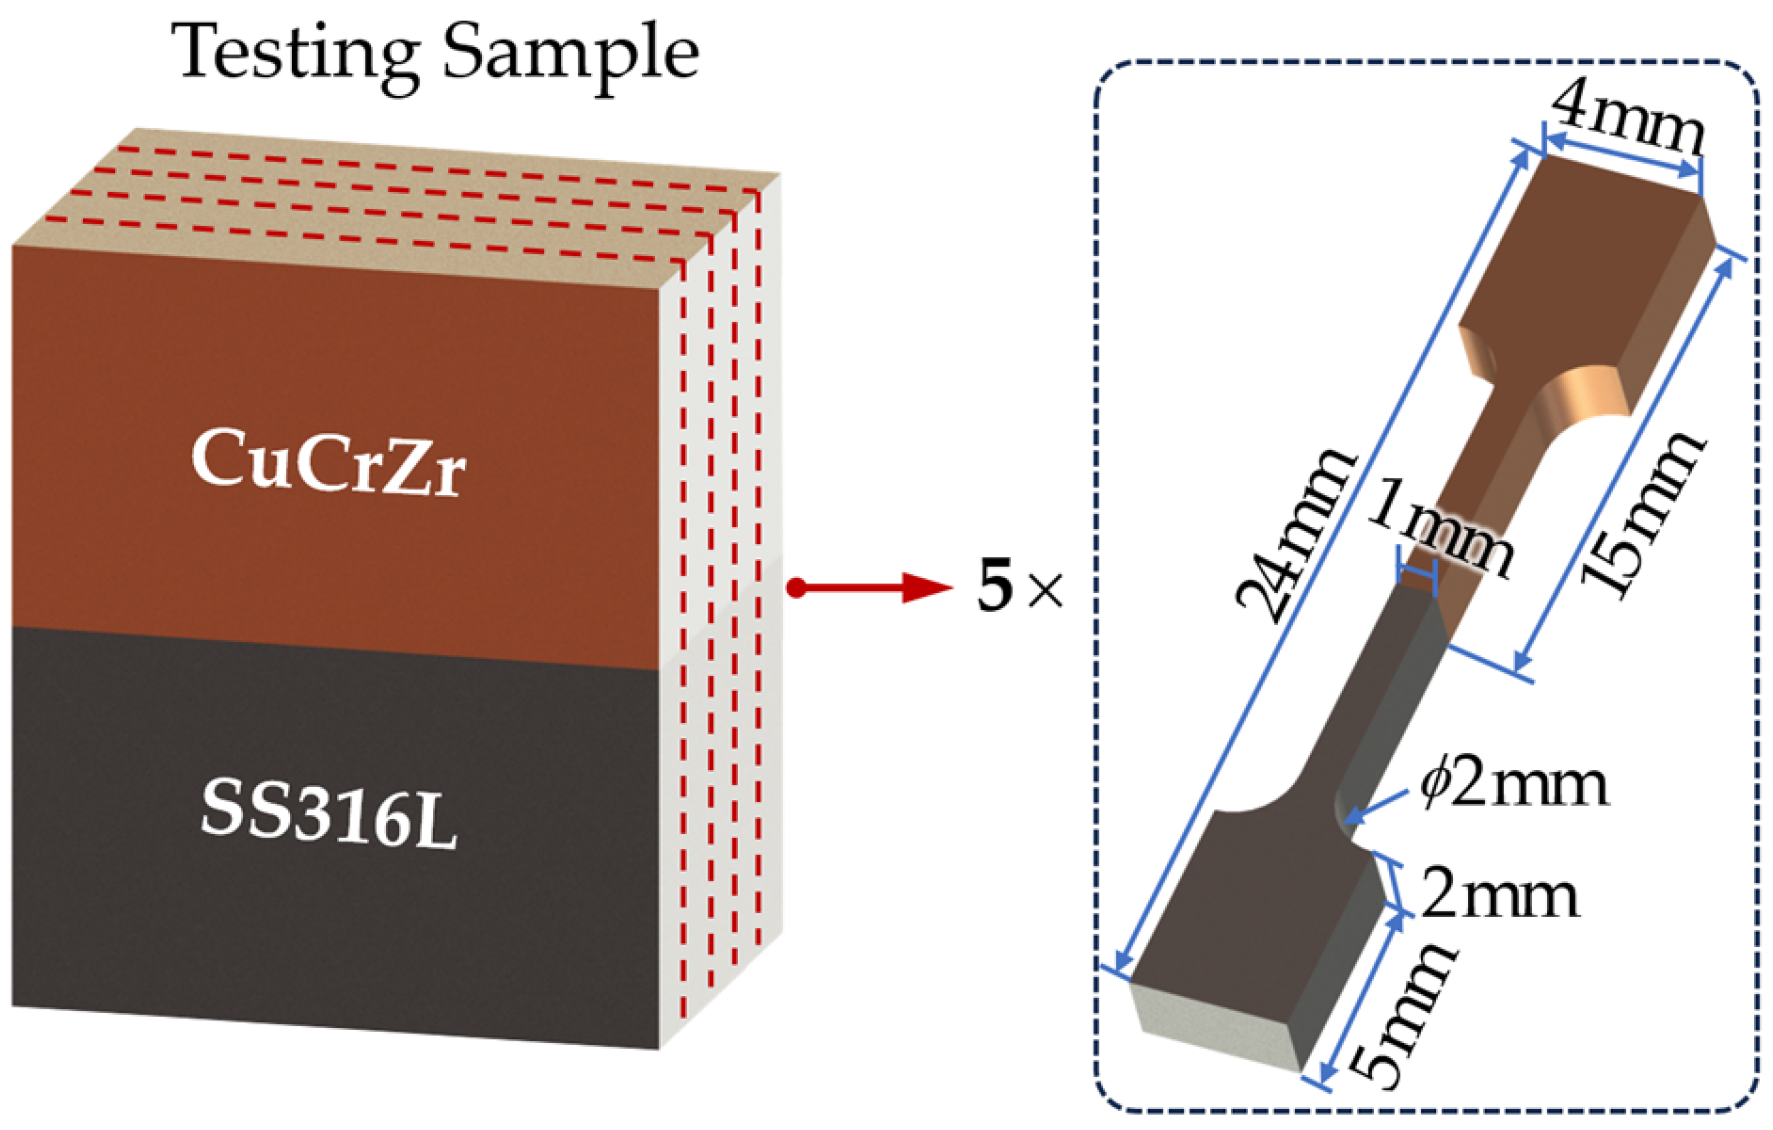
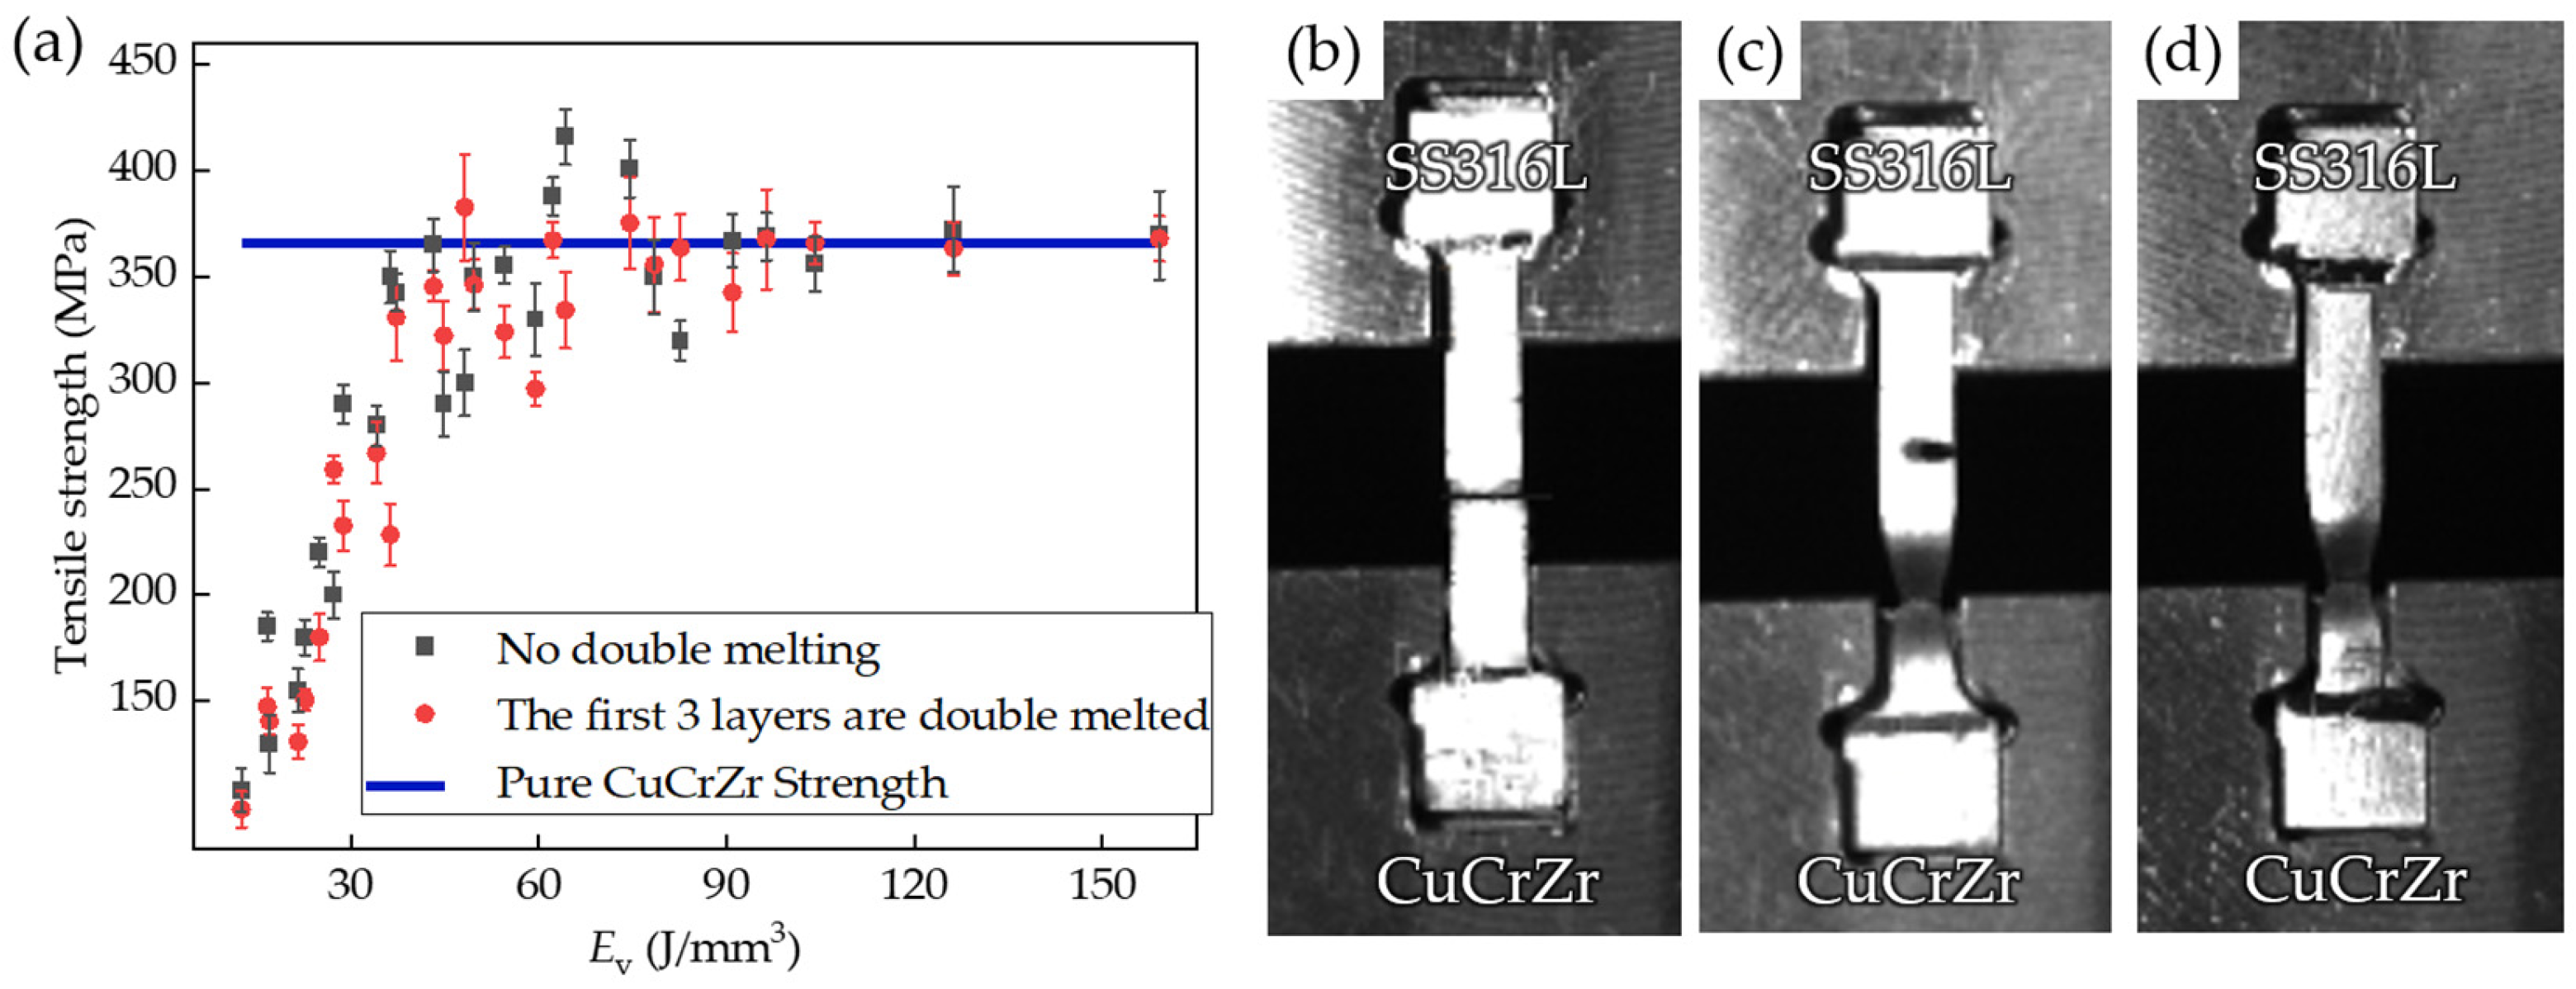
2.4. Tensile Strength Test
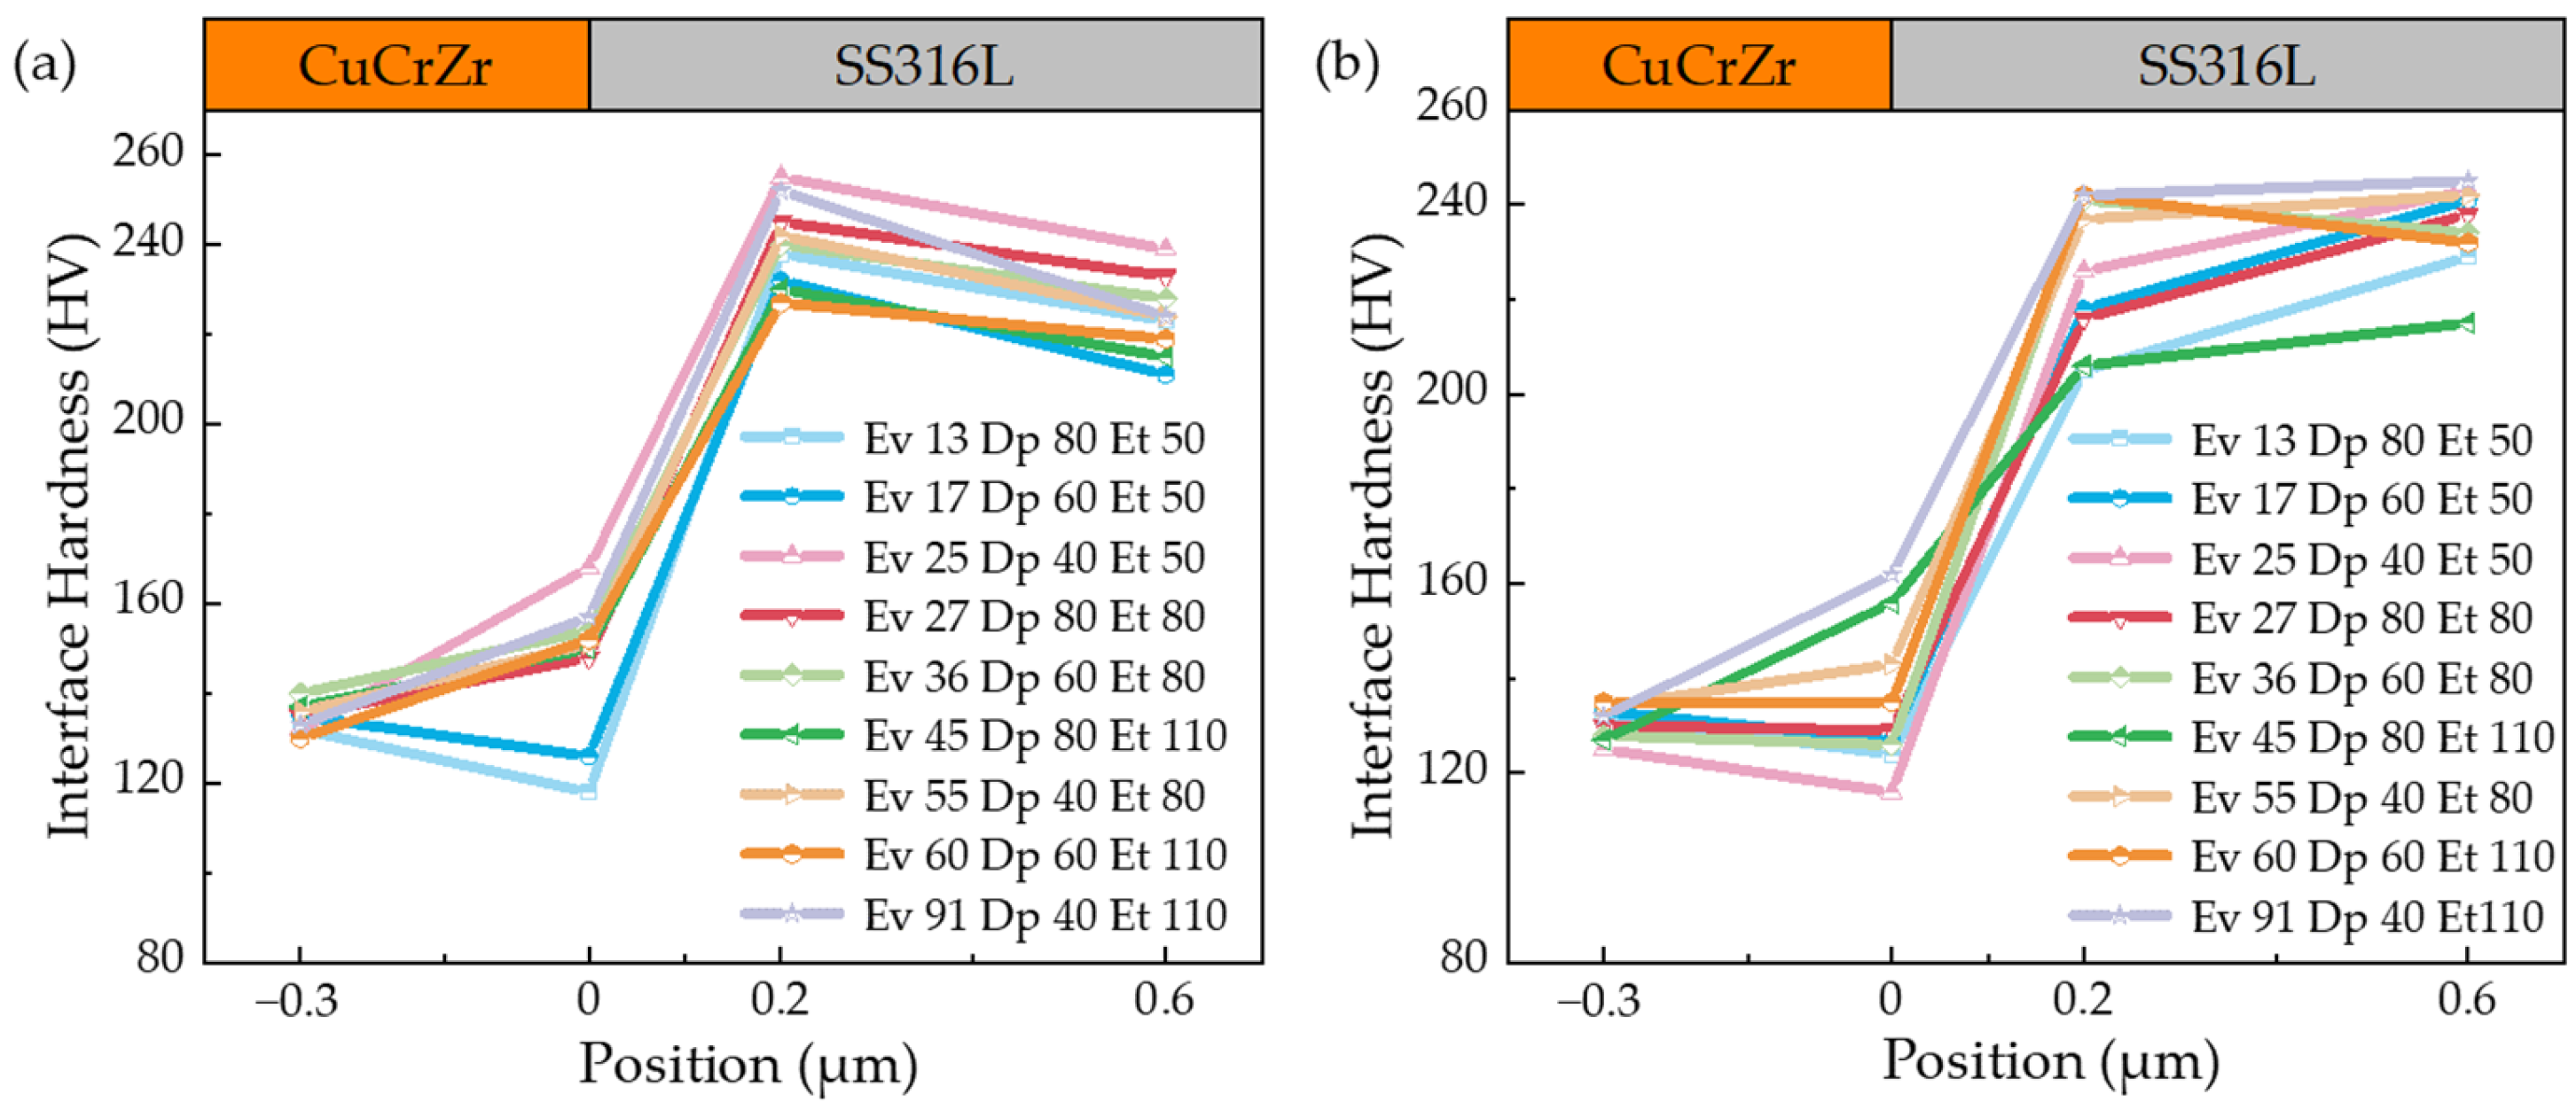
3. Results and Discussion
4. Conclusions
Author Contributions
Funding
Institutional Review Board Statement
Informed Consent Statement
Data Availability Statement
Acknowledgments
Conflicts of Interest
Abbreviations
| HIP | Hot isostatic pressing |
| LPBF | Laser powder bed fusion |
| SEM | Scanning electron microscopy |
| AM | Additive manufacturing |
| CW | Continuous wave |
| PW | Pulsed wave |
| Symbols and units | |
| Scanning power: P | W |
| Spot distance: Dp | μm |
| Hatch spacing: Hs | μm |
| Powder layer thickness: T | μm |
| Exposure time: Et | μs |
| Scanning speed: V | m/s |
| Volumetric energy density: Ev | J/mm3 |
| Duty cycle: δ | dimensionless |
| Uncertainty of indentation diagonal measurement error: | mm |
| Measurement error: | mm |
| Systematic error: | mm |
| Loading error: | N |
| Numerical trimming error: | N/mm2 |
| Synthetic uncertainty: | N/mm2 |
| Extended uncertainty: | N/mm2 |
References
- Hu, J.S.; Li, L.; Zuo, G.Z.; Sun, Z.; Xu, W.; Meng, X.C.; Li, C.L.; Tang, Z.L.; Sun, J.Z. A review of lithium application for the plasma-facing material in EAST Tokamak. Rev. Mod. Plasma Phys. 2023, 7, 9. [Google Scholar] [CrossRef]
- Sukegawa, A.M.; Okuno, K.; Tanaka, S. Estimation of neutron yields produced from SS316L, CuCrZr, and graphite targets for MeV-energy electrons toward JT-60 Tokamak fusion device. Fusion Eng. Des. 2018, 136, 1653–1657. [Google Scholar] [CrossRef]
- Yu, L.; Cao, R.; Ma, J.; Yan, Y.; Dong, H.; Wang, C.; Wang, X.; Zhou, S.; Wang, T.; Jiang, Z. Mechanical properties and joining mechanism of hot isostatic pressing (HIP) diffusion bonded Ni60A-0Cr18Ni10Ti heterogeneous joint. Mater. Charact. 2024, 209, 113748. [Google Scholar] [CrossRef]
- Wang, X.; Zhu, L.; Yu, W.; Ding, X.; Nan, H. Research Progress of Powder Hot Isostatic Pressing for Intermetallic Titanium Aluminide. Rare Met. Mater. Eng. 2021, 50, 3797–3808. [Google Scholar]
- Song, F.; Zhang, J.; Guo, H.; Zhang, M.; Zhao, Y.; Sha, J. Research on application of hot isostatic pressing technology in the field of nickel-based cast superalloys. Cailiao Gongcheng-J. Mater. Eng. 2021, 49, 65–74. [Google Scholar]
- Ji, S.; Sun, X.; Ma, Z.; Gong, P.; Wen, Q. Friction stir diffusion welding realized by a novel tool with turbo-like pin. Mater. Sci. Eng. A 2020, 800, 140369. [Google Scholar] [CrossRef]
- Atasoy, E.; Kahraman, N. Diffusion bonding of commercially pure titanium to low carbon steel using a silver interlayer. Mater. Charact. 2008, 59, 1481–1490. [Google Scholar] [CrossRef]
- Xuan, W.; Zhang, X.; Zhao, Y.; Li, J.; Wang, B.; Ren, X.; Ren, Z. Mechanism of improved intermediate temperature plasticity of nickel-base single crystal superalloy with hot isostatic pressing. J. Mater. Res. Technol. 2021, 14, 1609–1617. [Google Scholar] [CrossRef]
- Ye, Z.; Su, Z.; Zhao, K.; Wang, X.; Cao, W.; Dai, B.; Yan, N.; Xu, S.; Wang, Z.; Zhu, J. Preparation of high thermal conductivity shaped diamond/copper composites by isostatic pressing. Mater. Lett. 2023, 336, 133894. [Google Scholar] [CrossRef]
- Singh, K.; Patel, A.; Bhope, K.; Khirwadkar, S.; Mehta, M. Optimization of the diffusion bonding parameters for SS316L/CuCrZr with and without Nickel interlayer. Fusion Eng. Des. 2016, 112, 274–282. [Google Scholar] [CrossRef]
- Singh, K.P.; Khirwadkar, S.; Bhope, K.; Patel, N.; Mokaria, P. Feasibility study on joining of multi-layered W/Cu-CuCrZr-SS316L-SS316L materials using vacuum brazing. Fusion Eng. Des. 2018, 127, 73–82. [Google Scholar] [CrossRef]
- Derekar, K.S. A review of wire arc additive manufacturing and advances in wire arc additive manufacturing of aluminium. Mater. Sci. Technol. 2018, 34, 895–916. [Google Scholar] [CrossRef]
- Lindsay, C.; Ruppert, D.; Abumoussa, S.; Dahners, L.; Weinhold, P. Benefits of additive manufacturing and micro and nano surface texture modifications on mechanical strength and infection resistance of skin–implant interfaces in rats. J. Biomater. Appl. 2020, 34, 1193–1200. [Google Scholar] [CrossRef] [PubMed]
- Krawiec, P.; Czarnecka-Komorowska, D.; Warguła, Ł.; Wojciechowski, S. Geometric Specification of Non-Circular Pulleys Made with Various Additive Manufacturing Techniques. Materials 2021, 14, 1682. [Google Scholar] [CrossRef] [PubMed]
- Khaimovich, A.; Erisov, Y.; Smelov, V.; Agapovichev, A.; Petrov, I.; Razhivin, V.; Bobrovskij, I.; Kokareva, V.; Kuzin, A. Interface Quality Indices of Al–10Si–Mg Aluminum Alloy and Cr18–Ni10–Ti Stainless-Steel Bimetal Fabricated via Selective Laser Melting. Metals 2021, 11, 172. [Google Scholar] [CrossRef]
- Kumar, G.R.; Sathishkumar, M.; Vignesh, M.; Manikandan, M.; Rajyalakshmi, G.; Ramanujam, R.; Arivazhagan, N. Metal additive manufacturing of commercial aerospace components—A comprehensive review. Proc. Inst. Mech. Eng. Part E J. Process. Mech. Eng. 2022, 237, 441–454. [Google Scholar] [CrossRef]
- Gu, D.; Shi, X.; Poprawe, R.; Bourell, D.L.; Setchi, R.; Zhu, J. Material-structure-performance integrated laser-metal additive manufacturing. Science 2021, 372, eabg1487. [Google Scholar] [CrossRef] [PubMed]
- Delic, M.; Eyers, D.R. The effect of additive manufacturing adoption on supply chain flexibility and performance: An empirical analysis from the automotive industry. Int. J. Prod. Econ. 2020, 228, 107689. [Google Scholar] [CrossRef]
- Bartolomeu, F.; Costa, M.; Alves, N.; Miranda, G.; Silva, F. Additive manufacturing of NiTi-Ti6Al4V multi-material cellular structures targeting orthopedic implants. Opt. Lasers Eng. 2020, 134, 106208. [Google Scholar] [CrossRef]
- Mace, A.; Gilbert, J.L. Low cycle fretting and fretting corrosion properties of low carbon CoCrMo and additively manufactured CoCrMoW alloys for dental and orthopedic applications. J. Biomed. Mater. Res. Part B Appl. Biomater. 2023, 111, 1600–1613. [Google Scholar] [CrossRef]
- Betzler, B.R.; Ade, B.J.; Jain, P.K.; Wysocki, A.J.; Chesser, P.C.; Kirkland, W.M.; Cetiner, M.S.; Bergeron, A.; Heidet, F.; Terrani, K.A. Conceptual Design of the Transformational Challenge Reactor. Nucl. Sci. Eng. 2022, 196, 1399–1424. [Google Scholar] [CrossRef]
- Wang, J.; Chen, K.; Zeng, M.; Ma, T.; Wang, Q.; Cheng, Z. Investigation on flow and heat transfer in various channels based on triply periodic minimal surfaces (TPMS). Energy Convers. Manag. 2023, 283, 116955. [Google Scholar] [CrossRef]
- Neuberger, H.; Hernandez, F.; Rieth, M.; Bonnekoh, C.; Stratil, L.; Dlouhy, I.; Dymacek, P.; Müller, O.; Adler, L.; Kunert, U. Cold Spray metal powder deposition with 9%Cr-steel applied for the HCPB First Wall fabrication: Proof of concept and options for ODS steel processing. Nucl. Mater. Energy 2023, 35, 101427. [Google Scholar] [CrossRef]
- Sun, C.; Wang, Y.; McMurtrey, M.D.; Jerred, N.D.; Liou, F.; Li, J. Additive manufacturing for energy: A review. Appl. Energy 2020, 282, 116041. [Google Scholar] [CrossRef]
- Mally, L.; Werz, M.; Weihe, S. Feasibility Study on Additive Manufacturing of Ferritic Steels to Meet Mechanical Properties of Safety Relevant Forged Parts. Materials 2022, 15, 383. [Google Scholar] [CrossRef] [PubMed]
- Bergeron, A.; Crigger, J. Early progress on additive manufacturing of nuclear fuel materials. J. Nucl. Mater. 2018, 508, 344–347. [Google Scholar] [CrossRef]
- Koyanagi, T.; Terrani, K.; Harrison, S.; Liu, J.; Katoh, Y. Additive manufacturing of silicon carbide for nuclear applications. J. Nucl. Mater. 2020, 543, 152577. [Google Scholar] [CrossRef]
- Veeman, D.; Subramaniyan, M.K.; Kumar, R.; Sriram, G.; Browne, M.A.; Guo, L.; Nallathambhi, S.S. Additive manufacturing and characterization of titanium wall used in nuclear application. Proc. Inst. Mech. Eng. Part L J. Mater. Des. Appl. 2023, 237, 1814–1825. [Google Scholar] [CrossRef]
- Gussev, M.; Sridharan, N.; Babu, S.; Terrani, K. Influence of neutron irradiation on Al-6061 alloy produced via ultrasonic additive manufacturing. J. Nucl. Mater. 2021, 550, 152939. [Google Scholar] [CrossRef]
- Nycz, A.; Lee, Y.; Noakes, M.; Ankit, D.; Masuo, C.; Simunovic, S.; Bunn, J.; Love, L.; Oancea, V.; Payzant, A.; et al. Effective residual stress prediction validated with neutron diffraction method for metal large-scale additive manufacturing. Mater. Des. 2021, 205, 109751. [Google Scholar] [CrossRef]
- Barreiro-Fidalgo, A.; Roth, O.; Evins, L.Z.; Spahiu, K. Aqueous leaching of Cr2O3-doped UO2 spent nuclear fuel under oxidizing conditions. MRS Adv. 2021, 6, 103–106. [Google Scholar] [CrossRef]
- Jones, S. Advanced manufacturing applied to nuclear fusion—Challenges and solutions. J. Phys. Energy 2023, 5, 042001. [Google Scholar] [CrossRef]
- Santos, E.C.; Shiomi, M.; Osakada, K.; Laoui, T. Rapid manufacturing of metal components by laser forming. Int. J. Mach. Tools Manuf. 2006, 46, 1459–1468. [Google Scholar] [CrossRef]
- Olakanmi, E.O.T.; Cochrane, R.F.; Dalgarno, K.W. A review on selective laser sintering/melting (SLS/SLM) of aluminium alloy powders: Processing, microstructure, and properties. Prog. Mater. Sci. 2015, 74, 401–477. [Google Scholar] [CrossRef]
- Statnik, E.S.; Somov, P.A.; Zherebtsov, D.D.; Saprykin, D.L.; Saprykin, L.G.; Chernovolov, V.V.; Polozov, N.A.; Salimon, A.I. Micro-scale residual stress and deformation analysis in bimetal bronze-stainless steel samples produced by laser powder bed fusion technology. Materials 2022, 858, 144110. [Google Scholar] [CrossRef]
- Brown, B.; Newkirk, J.; Liou, F. Absorption of Nitrogen during Pulsed Wave L-PBF of 17-4 PH Steel. Materials 2021, 14, 560. [Google Scholar] [CrossRef] [PubMed]
- Luo, J.; Wang, H.; Xi, C.; Zhai, H.; Gu, Y.; Zhang, C. Indentation size effect–crack propagation model and finite element simulation verification for microhardness test of ceramic materials. Ceram. Int. 2020, 47, 4914–4924. [Google Scholar] [CrossRef]
- ASTM E92-23; Standard Test Methods for Vickers Hardness and Knoop Hardness of Metallic Materials. ASTM International: West Conshohocken, PA, USA, 2023.
- EURAMET. Guidelines on the Estimation of Uncertainty in Hardness Measurements; EURAMET: Braunschweig, Germany, 2011; ISBN 978-3-942992-13-8. [Google Scholar]
- ISO 6507-2:2018; Metallic Materials—Vickers Hardness Test—Part 2: Verification and Calibration of Testing Machines. International Organization for Standardization: Geneva, Switzerland, 2018.
- Rehman, A.U.; Mahmood, M.A.; Ansari, P.; Pitir, F.; Salamci, M.U.; Popescu, A.C.; Mihailescu, I.N. Spatter Formation and Splashing Induced Defects in Laser-Based Powder Bed Fusion of AlSi10Mg Alloy: A Novel Hydrodynamics Modelling with Empirical Testing. Metals 2021, 11, 2023. [Google Scholar] [CrossRef]
- Ge, F.; Yuan, H.; Gao, Q.; Peng, T.; Guo, S.; Lyu, P.; Guan, Q.; Liu, H.; Liu, X.; Guan, J. Microstructure, hardness and wear resistance of AlCoCrFeNiTax (x = 0, 0.1, 0.3) high-entropy alloys enhanced by laser remelting and Ta addition. J. Alloys Compd. 2023, 949, 169741. [Google Scholar] [CrossRef]
- Lyu, P.; Gao, Q.; Peng, T.; Yuan, H.; Guan, Q.; Cai, J.; Liu, H.; Liu, X. Microstructure and properties of CoCrFeNiAlx (x = 0.1, 0.5, 1) high-entropy alloys enhanced by laser surface remelting. Mater. Charact. 2022, 185, 111717. [Google Scholar] [CrossRef]
- Xiong, Z.; Zhang, P.; Tan, C.; Dong, D.; Ma, W.; Yu, K. Selective Laser Melting and Remelting of Pure Tungsten. Adv. Eng. Mater. 2020, 22, 1352. [Google Scholar] [CrossRef]


| P (W) | Dp (μm) | Et (μs) | V (m/s) | Ev (J/mm3) |
|---|---|---|---|---|
| 200 | 80 | 110 | 0.73 | 45 |
| 80 | 1.00 | 27 | ||
| 50 | 1.60 | 13 | ||
| 60 | 110 | 0.55 | 60 | |
| 80 | 0.75 | 36 | ||
| 50 | 1.20 | 17 | ||
| 40 | 110 | 0.36 | 91 | |
| 80 | 0.50 | 55 | ||
| 50 | 0.80 | 25 | ||
| 275 | 80 | 110 | 0.73 | 62 |
| 80 | 1.00 | 37 | ||
| 50 | 1.60 | 17 | ||
| 60 | 110 | 0.55 | 83 | |
| 80 | 0.75 | 50 | ||
| 50 | 1.20 | 23 | ||
| 40 | 110 | 0.36 | 126 | |
| 80 | 0.50 | 75 | ||
| 50 | 0.80 | 34 | ||
| 350 | 80 | 110 | 0.73 | 78 |
| 80 | 1.00 | 48 | ||
| 50 | 1.60 | 22 | ||
| 60 | 110 | 0.55 | 104 | |
| 80 | 0.75 | 64 | ||
| 50 | 1.20 | 29 | ||
| 40 | 110 | 0.36 | 159 | |
| 80 | 0.50 | 96 | ||
| 50 | 0.80 | 43 |
| Sensitivity Factors | Methods or Values |
|---|---|
| 1 |
| Manufacturing Method | Process Parameters | HV | Uncertainty Calculation | |||
|---|---|---|---|---|---|---|
| (μm) | (μm) | |||||
| Without remelting | P = 200 W Dp = 80 μm Et = 50 μs | 118 | 68.664 | 1.113 | 3.943 | 7.885 |
| P = 275 W Dp = 80 μm Et = 50μs | 131 | 65.168 | 0.89 | 3.665 | 7.329 | |
| P = 275 W Dp = 40 μm Et = 50 μs | 147 | 61.512 | 0.68 | 3.355 | 6.711 | |
| P = 275 W Dp = 40 μm Et = 80 μs | 155 | 59.91 | 0.93 | 4.889 | 9.779 | |
| P = 350 W Dp = 40 μm Et = 110 μs | 146 | 61.729 | 0.76 | 3.7 | 7.4 | |
| The first 3 layers are remelted | P = 200 W Dp = 80 μm Et = 50 μs | 124 | 66.981 | 1.14 | 4.289 | 8.577 |
| P = 275 W Dp = 80 μm Et = 50 μs | 146 | 61.729 | 1.01 | 4.874 | 9.747 | |
| P = 275 W Dp = 40 μm Et = 50 μs | 163 | 58.422 | 0.97 | 5.511 | 11.023 | |
| P = 275 W Dp = 40 μm Et = 80 μs | 146 | 61.729 | 0.83 | 4.024 | 8.048 | |
| P = 350 W Dp = 40 μm Et = 110 μs | 142 | 62.593 | 1.04 | 4.803 | 9.607 | |
Disclaimer/Publisher’s Note: The statements, opinions and data contained in all publications are solely those of the individual author(s) and contributor(s) and not of MDPI and/or the editor(s). MDPI and/or the editor(s) disclaim responsibility for any injury to people or property resulting from any ideas, methods, instructions or products referred to in the content. |
© 2024 by the authors. Licensee MDPI, Basel, Switzerland. This article is an open access article distributed under the terms and conditions of the Creative Commons Attribution (CC BY) license (https://creativecommons.org/licenses/by/4.0/).
Share and Cite
Jin, X.; Hoo, Z.S.; Jin, C.; Xiao, Z.; Yao, L. Microhardness and Tensile Strength Analysis of SS316L/CuCrZr Interface by Laser Powder Bed Fusion. Materials 2024, 17, 2836. https://doi.org/10.3390/ma17122836
Jin X, Hoo ZS, Jin C, Xiao Z, Yao L. Microhardness and Tensile Strength Analysis of SS316L/CuCrZr Interface by Laser Powder Bed Fusion. Materials. 2024; 17(12):2836. https://doi.org/10.3390/ma17122836
Chicago/Turabian StyleJin, Xiang, Zhiong Sheng Hoo, Chuanjie Jin, Zhongmin Xiao, and Liming Yao. 2024. "Microhardness and Tensile Strength Analysis of SS316L/CuCrZr Interface by Laser Powder Bed Fusion" Materials 17, no. 12: 2836. https://doi.org/10.3390/ma17122836
APA StyleJin, X., Hoo, Z. S., Jin, C., Xiao, Z., & Yao, L. (2024). Microhardness and Tensile Strength Analysis of SS316L/CuCrZr Interface by Laser Powder Bed Fusion. Materials, 17(12), 2836. https://doi.org/10.3390/ma17122836