
Laboratory Tests on the Possibility of Using Flax Fibers as a Plant-Origin Reinforcement Component in Composite Friction Materials for Vehicle Braking Systems


Abstract
1. Introduction
2. Materials and Methods
- -
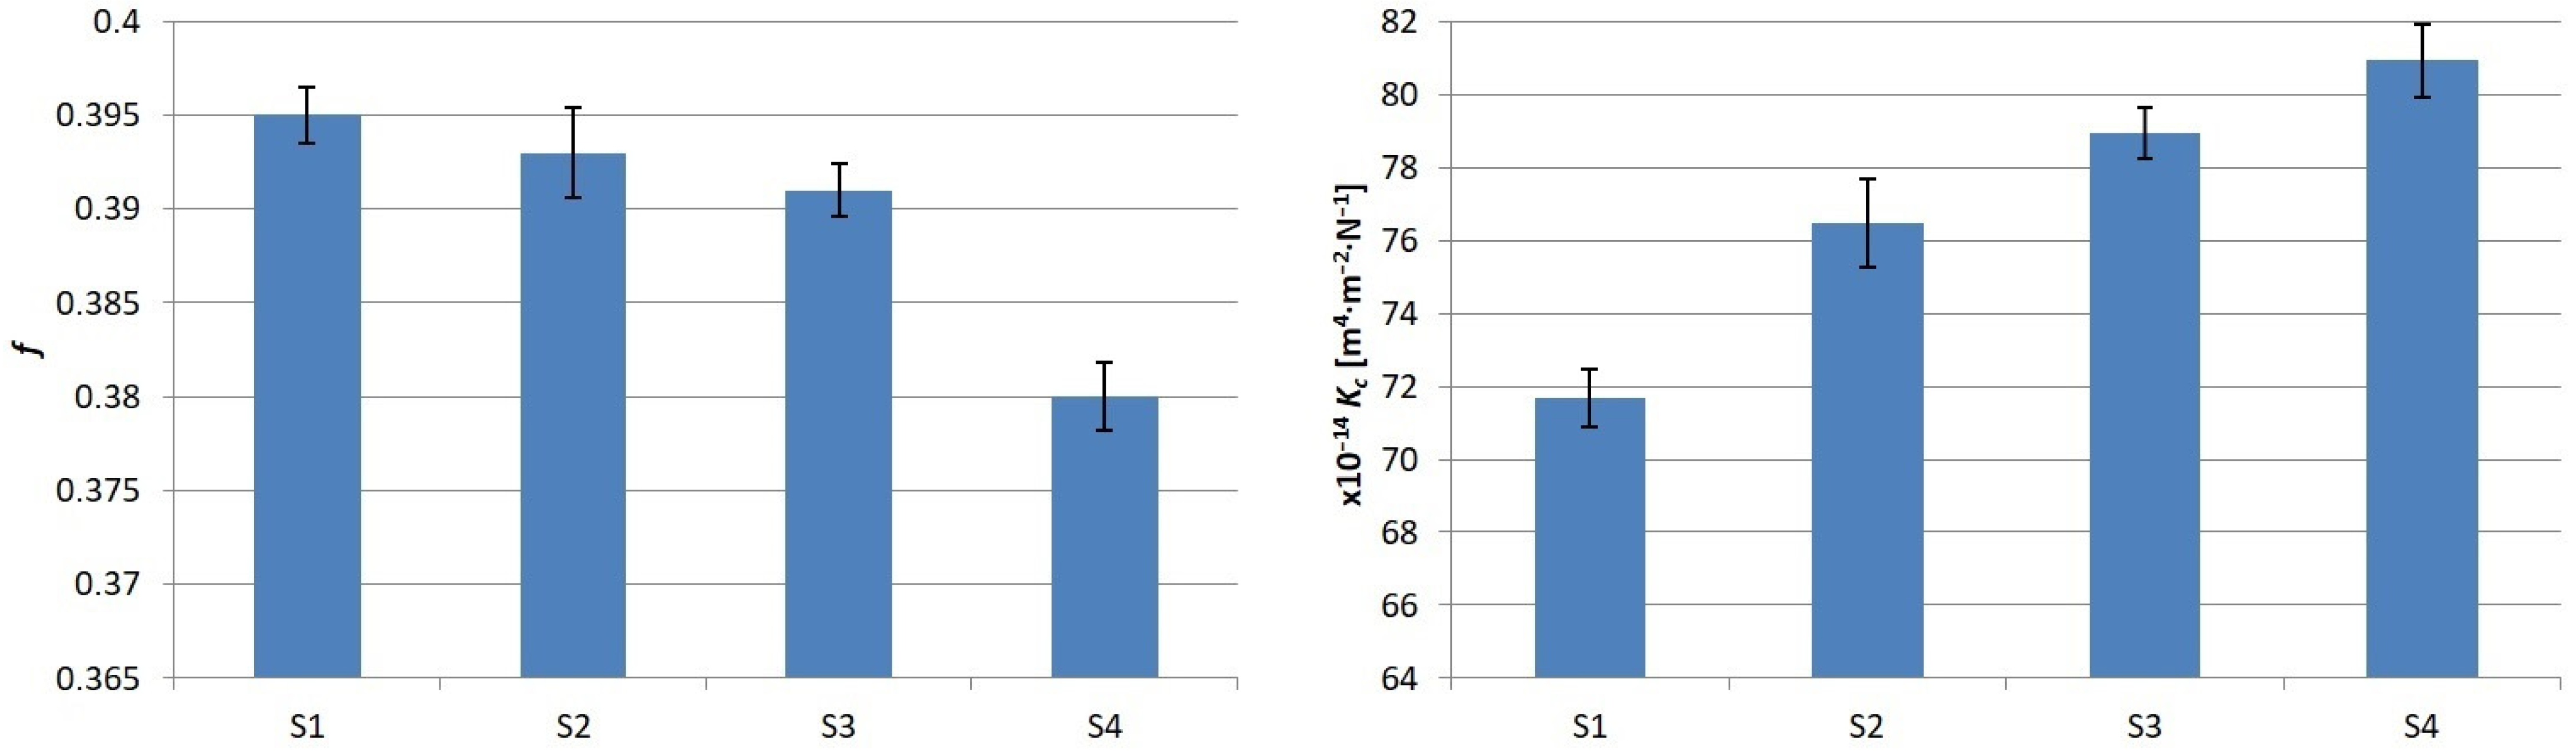
- S1: Aramid reinforcement only—reference sample;
- -
- S2: Approximately 33% of aramid was replaced with flax fibers;
- -
- S3: Approximately 66% of aramid was replaced with flax fibers;
- -
- S4: Only flax reinforcement was used, completely eliminating aramid.

| Component | Contents, wt. % | |||
|---|---|---|---|---|
| S1 | S2 | S3 | S4 | |
| Brass powder, diameter < 0.1 mm (CuZn20) | 12 | 12 | 12 | 12 |
| Cooper powder, diameter < 0.2 mm (Cu) | 25 | 25 | 25 | 25 |
| Steel chips, 0.5 < length < 5 mm (0.18% C, 0.5% Si, 1.65% Mn, 0.05% P, 0.02% S, 0.08% Mo) | 7 | 7 | 7 | 7 |
| Aramid fibers, 3 < length < 5 mm | 12 | 8 | 4 | 0 |
| Flax fibers, 3 < length < 5 mm | 0 | 4 | 8 | 12 |
| Resin | 17 | 17 | 17 | 17 |
| Graphite powder, diameter < 0.5 mm (C) | 5 | 5 | 5 | 5 |
| Fly ash powder, diameter < 0.2 mm | 18 | 18 | 18 | 18 |
| Cast iron chips, 0.5 < length < 5 mm EN-GJS-400-12 | 4 | 4 | 4 | 4 |
- -
- Load: L = 2 N;
- -
- Distance: S = 50 m;
- -
- Rotation speed: n = 38 RPM.
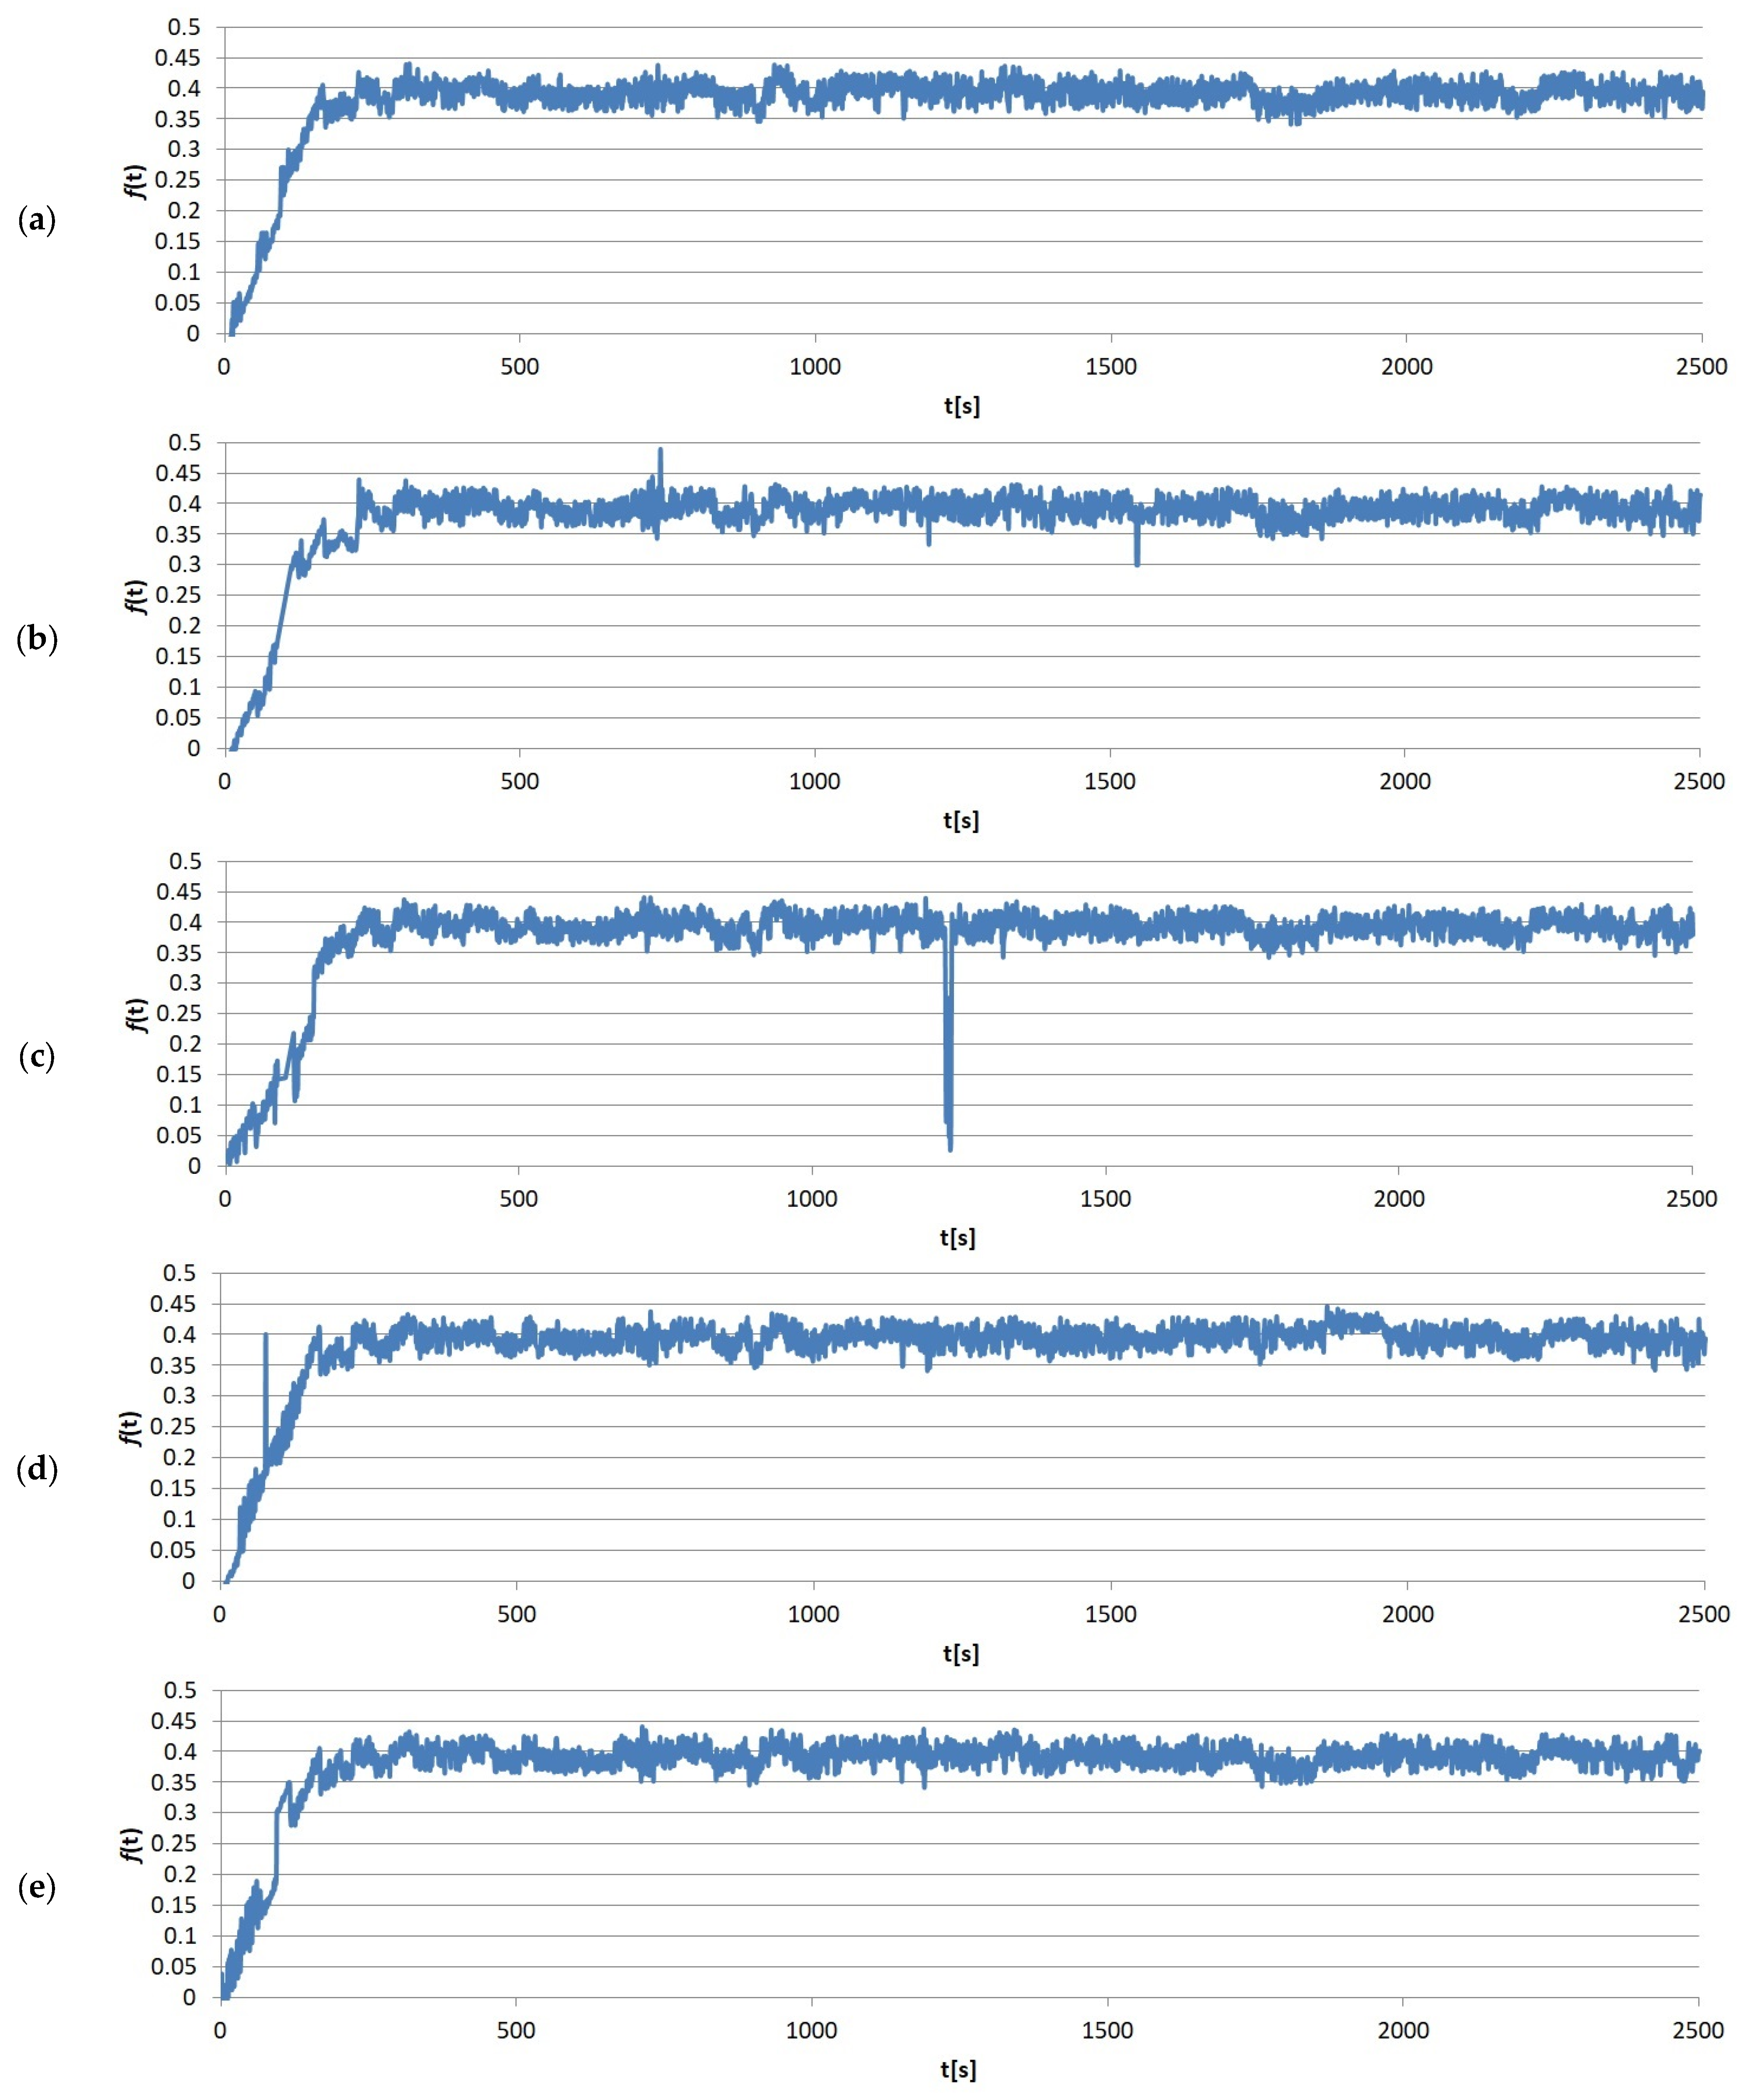
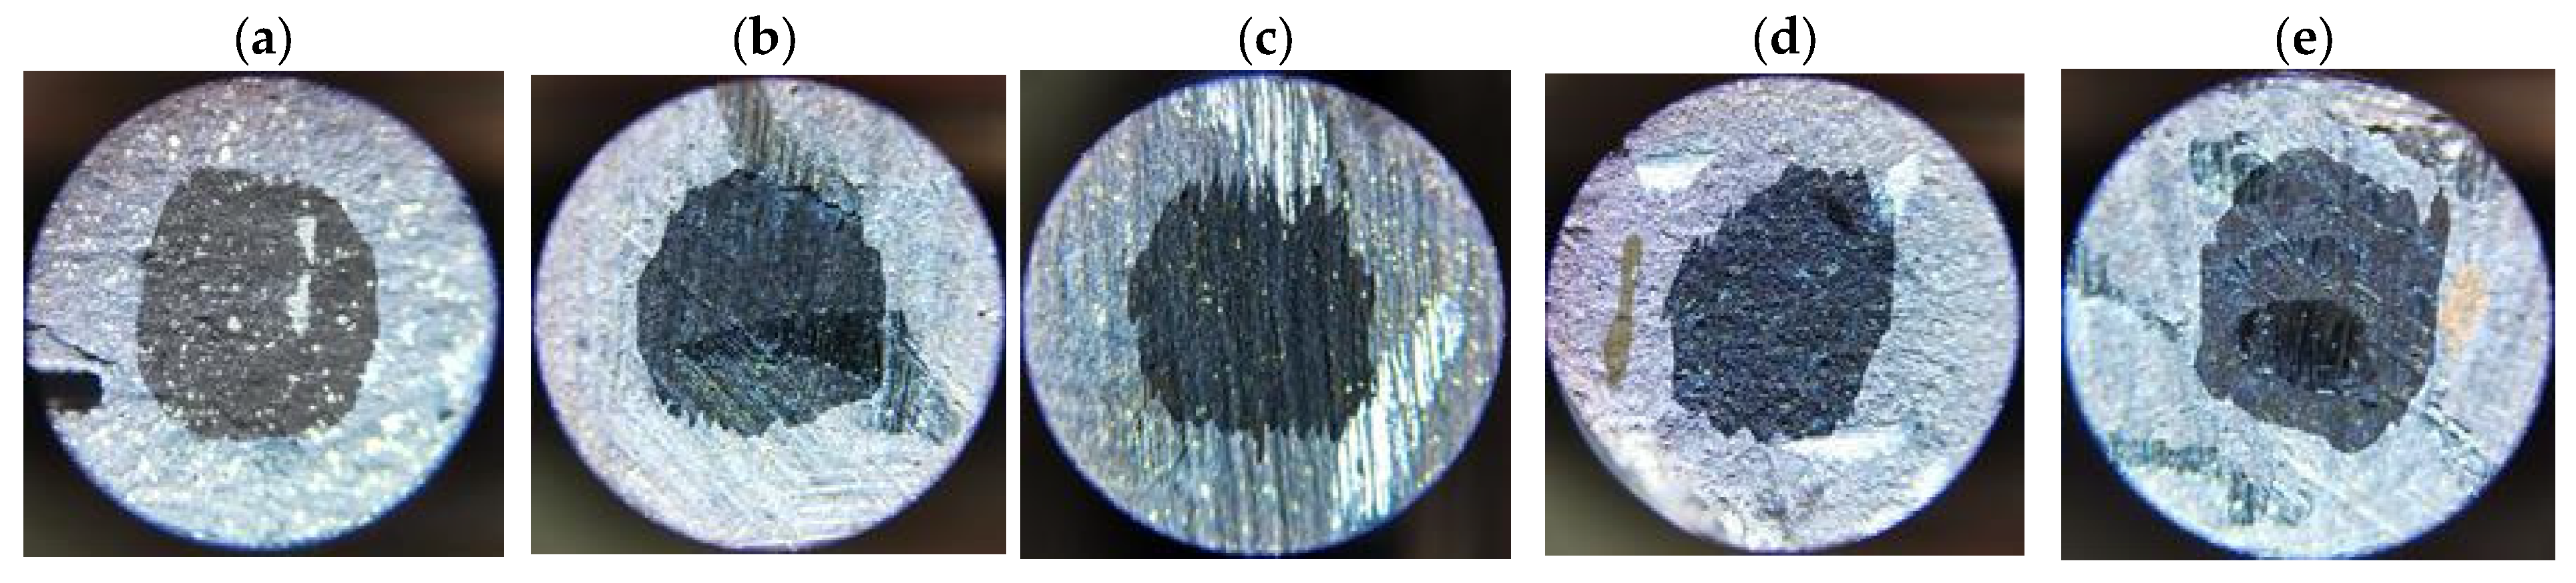
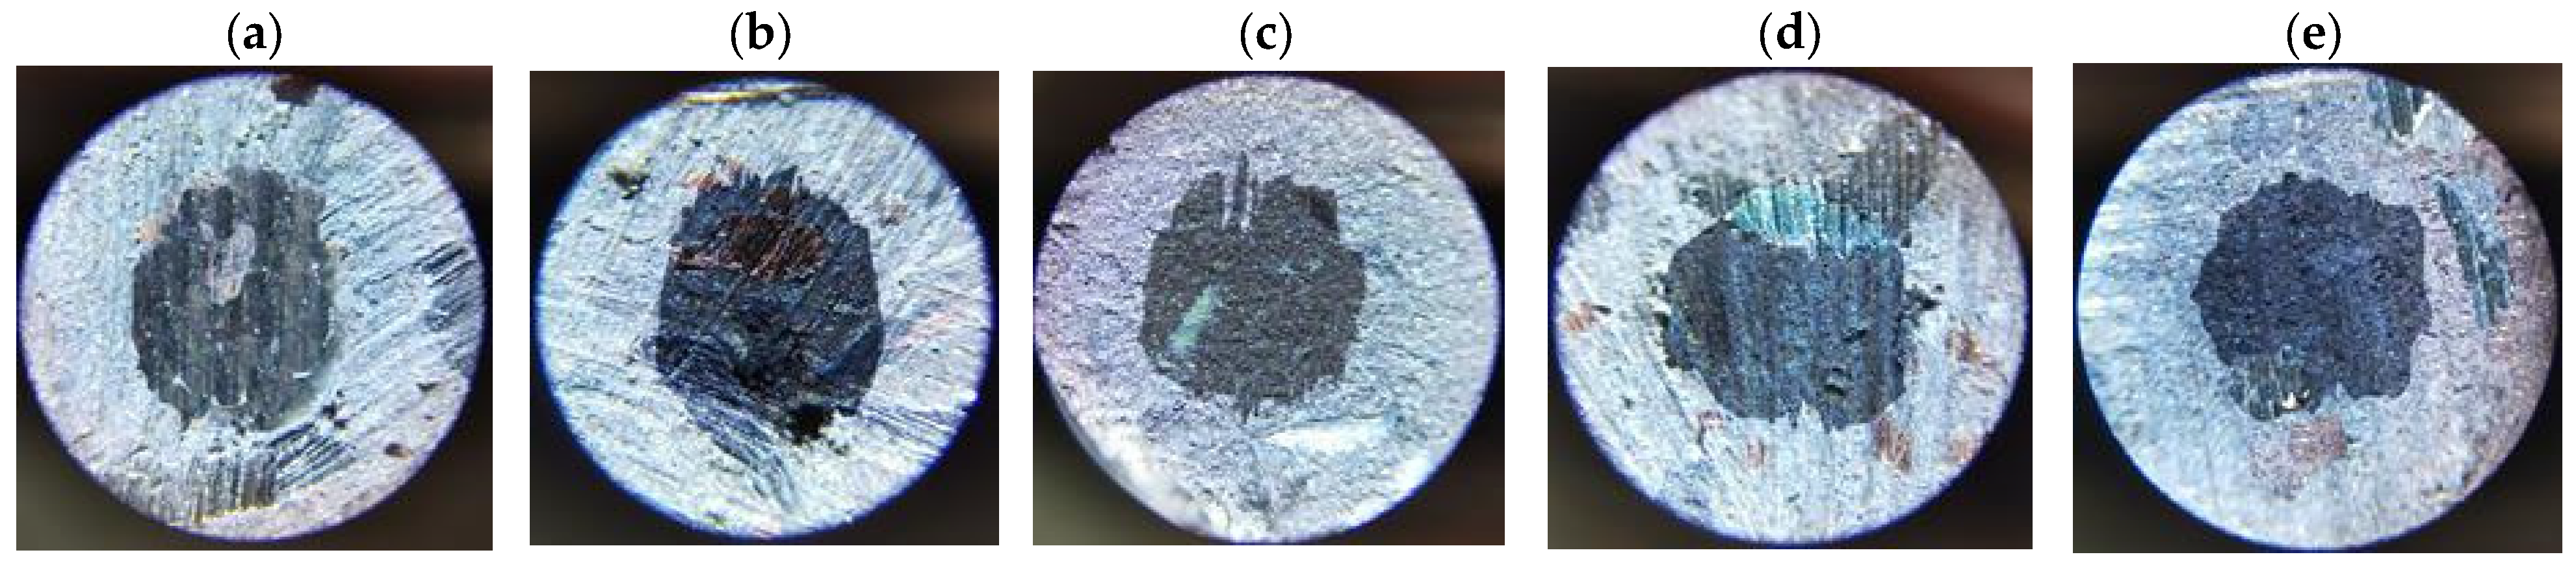
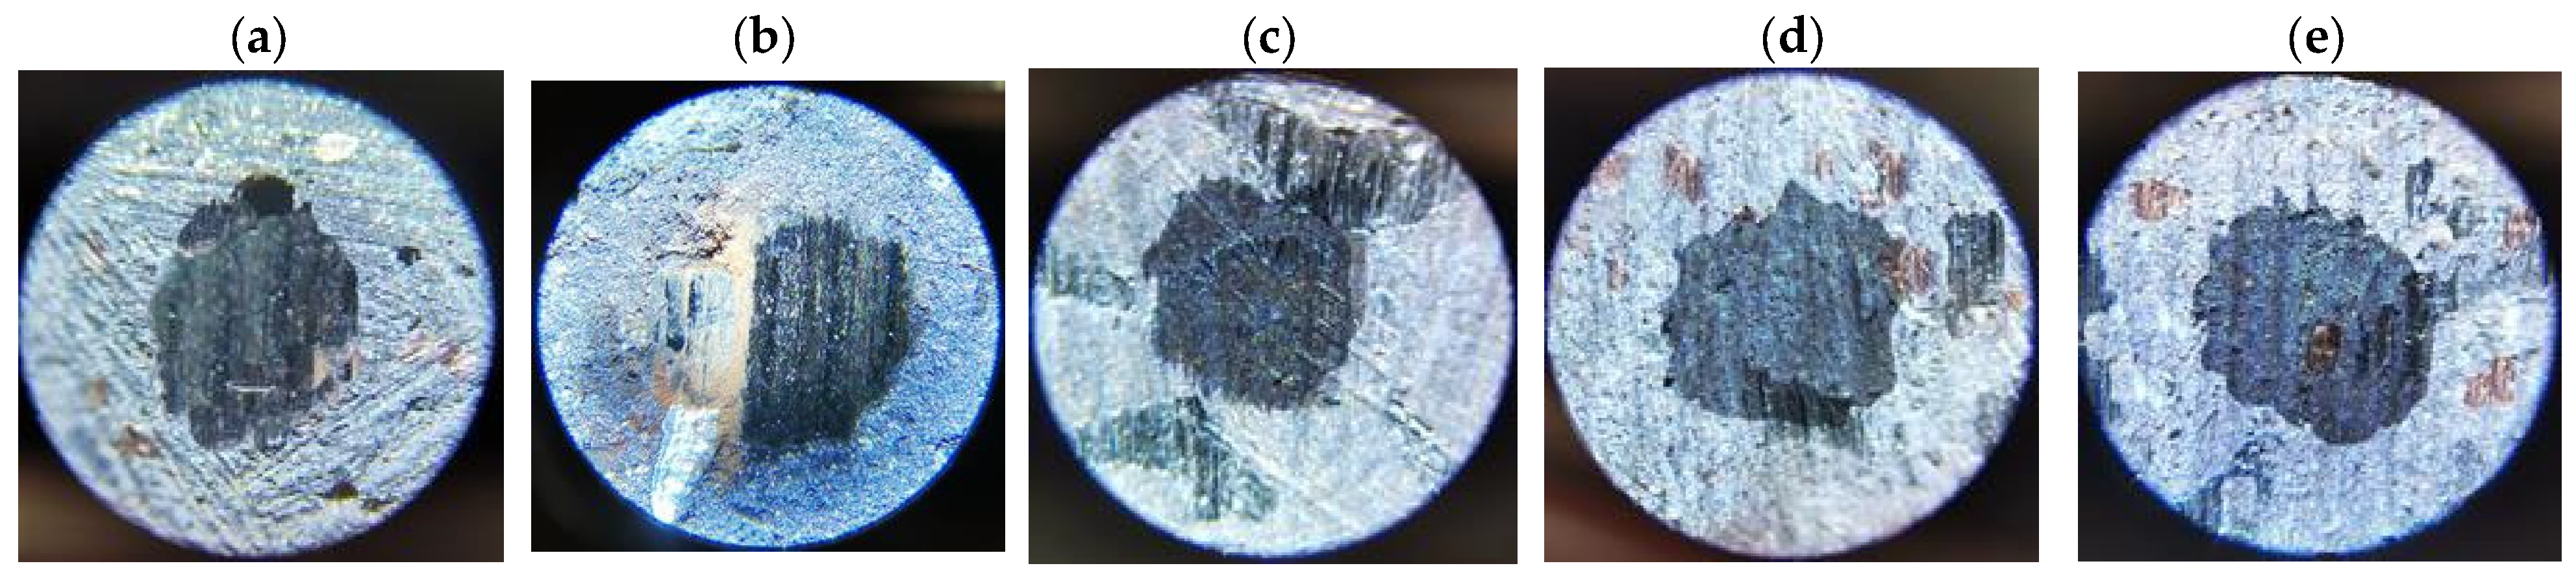
3. Results
4. Discussion
5. Conclusions
- -
- There was a negligible effect of changing the reinforcement material, both in proportions (S2 and S3) and in the complete replacement of aramid by flax (S4);
- -
- There was small effect, around 10%, of the change in reinforcement on the abrasive wear rate, which increased when flax was used as reinforcement.
Author Contributions
Funding
Institutional Review Board Statement
Informed Consent Statement
Data Availability Statement
Acknowledgments
Conflicts of Interest
References
- Skorupka, Z. Braking moment comparison and analysis for various brake designs using results from sample and full scale friction material tests. J. KONES Powertrain Transp. 2013, 20, 303–308. [Google Scholar] [CrossRef]
- Rashid, A. Overview of Disc Brakes and Related Phenomena—A review. Int. J. Veh. Noise Vib. 2014, 10, 257–301. [Google Scholar] [CrossRef]
- Parashar, S. A Study of Various types of the Braking System. J. Emerg. Technol. Innov. Res. 2018, 5, 532–539. [Google Scholar]
- Kim, D.M.; Viskanta, R. Heat transfer by conduction, natural convection and radiation across a rectangular cellular structure. Int. J. Heat Fluid Flow 1984, 5, 205–213. [Google Scholar] [CrossRef]
- Borawski, A. Study of the influence of the shape of the copper component on the properties of the friction material used in brakes. Part III: Heating process during braking. Heat Transf. Res. 2023, 54, 1–13. [Google Scholar] [CrossRef]
- Borawski, A.; Szpica, D.; Mieczkowski, G.; Awad, M.M.; Shalaby, R.M.; Sallah, M. Simulation study of the vehicle braking process with temperature-dependent coefficient of friction between brake pad and disc. Heat Transf. Res. 2021, 52, 1–11. [Google Scholar] [CrossRef]
- Xiao, X.; Yin, Y.; Bao, J.; Lu, L.; Feng, X. Review on the friction and wear of brake materials. Adv. Mech. Eng. 2016, 8, 1687814016647300. [Google Scholar] [CrossRef]
- Gujrathi, T.V.; Damale, A.V. A review on friction materials of automobile disc brake pad. J. Educ. Technol. Health Sci. 2015, 3, 1–4. [Google Scholar]
- Ganguly, A.; George, R. Asbestos free friction composition for brake linings. Bull. Mater. Sci. 2008, 31, 19–22. [Google Scholar] [CrossRef]
- Park, J.H.; Chung, J.O.; Kim, H.R. Friction characteristics of brake pads with aramid fiber and acrylic fiber. Ind. Lubr. Tribol. 2010, 62, 91–98. [Google Scholar] [CrossRef]
- Ahmadijokani, F.; Shojaei, A.; Arjmand, M.; Alaei, Y.; Yan, N. Effect of short carbon fiber on thermal mechanical and tribological behavior of phenolic-based brake friction materials. Compos. Part B Eng. 2019, 168, 98–105. [Google Scholar] [CrossRef]
- Okoroigwe, E.C.; Saffron, C.M.; Kamdem, P.D. Characterization of palm kernel shell for materials reinforcement and water treatment. J. Chem. Eng. Mater. Sci. 2014, 5, 1–6. [Google Scholar] [CrossRef]
- Zhang, P.; Whistler, R.L.; BeMiller, J.N.; Hamaker, B.R. Banana starch: Production physicochemical properties and digestibility. Carbohydr. Polym. 2005, 59, 443–458. [Google Scholar] [CrossRef]
- Aku, S.Y.; Yawas, D.S.; Madakson, P.B. Characterization of periwinkle shell as asbestos-free brake pad materials. Pac. J. Sci. Technol. 2012, 13, 57–63. [Google Scholar]
- Olabisi, A.I.; Adam, A.N.; Okechukwu, O.M. Development and Assessment of Composite Brake Pad Using Pulverized Cocoa Beans Shells Filler. Int. J. Mater. Sci. Appl. 2016, 5, 66–78. [Google Scholar] [CrossRef]
- Gautier di Confiengo, G.; Faga, M.G. Ecological Transition in the Field of Brake Pad Manufacturing: An Overview of the Potential Green Constituents. Sustainability 2022, 14, 2508. [Google Scholar] [CrossRef]
- Yokura, M.; Inoue, T. Aramid Paper. Method of Manufacturing the Same and Aramid-Polyester Laminate. U.S. Patent No. EP1873307A2, 2 January 2008. [Google Scholar]
- Vara Prasad, V.; Talupula, S. A Review on Reinforcement of Basalt and Aramid (Kevlar 129) fibers. Mater. Today Proc. 2018, 5, 5993–5998. [Google Scholar] [CrossRef]
- Song, W.; Gu, A.; Liang, G.; Yuan, L. Effect of the surface roughness on interfacial properties of carbon fibers reinforced epoxy resin composites. Appl. Surf. Sci. 2011, 257, 4069–4074. [Google Scholar] [CrossRef]
- Kim, S.Y.; Baek, S.J.; Youn, J.R. New hybrid method for simultaneous improvement of tensile and impact properties of carbon fiber reinforced composites. Carbon 2011, 49, 5329–5338. [Google Scholar] [CrossRef]
- Borawski, A.; Mieczkowski, G.; Szpica, D.; Pilkaite, T.; Leisis, V.; Diliunas, S. Composite friction materials with reinforcement of ecological origin. In Proceedings of the 27th International Scientific Conference Mechanika-2023 (Mechanika 2023), Online, 26 May 2023; pp. 66–69. [Google Scholar]
- Borawski, A. Suggested research method for testing selected tribological properties of friction components in vehicle braking systems. Acta Mech. Autom. 2016, 10, 223–226. [Google Scholar] [CrossRef]
- Osuch-Słomka, E. Abrasive Wear Testing of Antiwear Coatings by Ball-Cratering-Method. Tribologia 2012, 2, 59–68. [Google Scholar]
- Osuch-Słomka, E.; Ruta, R.; Słomka, Z. The use of a modern method of designing experiments in ball-cratering abrasive wear testing. J. Eng. Tribol. 2013, 227, 1177–1187. [Google Scholar] [CrossRef]
- Mitra, A. Fundamentals of Quality Control and Improvement, 3rd ed.; Wiley: Hoboken, NJ, USA, 2008. [Google Scholar]
- Osuch-Słomka, E. Proposed method for determining the values of tests for the ball-cratering metod. Tribologia 2011, 240, 161–171. [Google Scholar]
- ISO 1071-6:2008; Advanced Technical Ceramics—Methods of Test for Ceramic Coatings—Part 6: Determination of the Abrasion Resistance of Coatings by a Micro-Abrasion Wear Test. ISO: Genève, Switzerland, 2008; 14p.
- Yan, W.; O’Dowd, N.P.; Busso, E.P. Numerical study of sliding wear caused by a loaded pin on a rotating disc. J. Mech. Phys. Solids 2002, 50, 449–470. [Google Scholar] [CrossRef]
- Karwowska, E.; Simiński, P. Analysis of the influence of perception time on stopping distance from the angle of psychophysical factors. Arch. Motoryz. 2015, 70, 59–74. [Google Scholar]
- Allam, S.; Nader, F.; Abdelwahed, K. Vehicle Braking Distance Characterization using Different Brake Types. Int. Res. J. Eng. Technol. 2022, 9, 1096–1108. [Google Scholar]
- Labuda, R.; Toporcer, E.; Hlavna, V. Vehicle braking parameters influencing factors. J. KONES Powertrain Transp. 2009, 16, 257–264. [Google Scholar]
- Šarkan, B.; Holeša, L.; Ivánek, P. Measurement of the Braking Distance in Dependence on the Momentary Vehicle Weight. Transp. Commun. 2013, 1, 29–32. [Google Scholar] [CrossRef]
- Yevtushenko, A.A.; Grzes, P.; Adamowicz, A. The Temperature Mode of the Carbon-Carbon Multi-Disc Brake in the View of the Interrelations of Its Operating Characteristics. Materials 2020, 13, 1878. [Google Scholar] [CrossRef]
- Yevtushenko, A.; Kuciej, M.; Grzes, P.; Wasilewski, P. Comparative Analysis of Temperature Fields in Railway Solid and Ventilated Brake Discs. Materials 2021, 14, 7804. [Google Scholar] [CrossRef] [PubMed]
- Kim, T.K. Understanding one-way ANOVA using conceptual figures. Korean J. Anesthesiol. 2017, 70, 22–26. [Google Scholar] [CrossRef] [PubMed]
- Ostertagová, E.; Ostertag, O. Methodology and Application of One-way ANOVA. Am. J. Mech. Eng. 2013, 1, 256–261. [Google Scholar] [CrossRef]
- Gastwirth, J.; Gel, Y.R.; Miao, W. The Impact of Levene’s Test of Equality of Variances on Statistical Theory and Practice. Stat. Sci. 2010, 24, 343–360. [Google Scholar] [CrossRef]
- Qipeng, L.; Wen, L.; Lei, Z.; Yuehua, G.; Li, X.; Yaxiong, D.; Liming, K. Temperature-dependent friction coefficient and its effect on modeling friction stir welding for aluminum alloys. J. Manuf. Process. 2022, 84, 1054–1063. [Google Scholar] [CrossRef]


| Preliminary Test No | Load [N] | Distance [m] | Rotation Speed [RPM] |
|---|---|---|---|
| 1 | 2 | 50 | 38 |
| 2 | 2 | 100 | 80 |
| 3 | 2 | 150 | 150 |
| 4 | 4 | 50 | 80 |
| 5 | 4 | 100 | 150 |
| 6 | 4 | 150 | 38 |
| 7 | 6 | 50 | 38 |
| 8 | 6 | 100 | 150 |
| 9 | 6 | 150 | 80 |
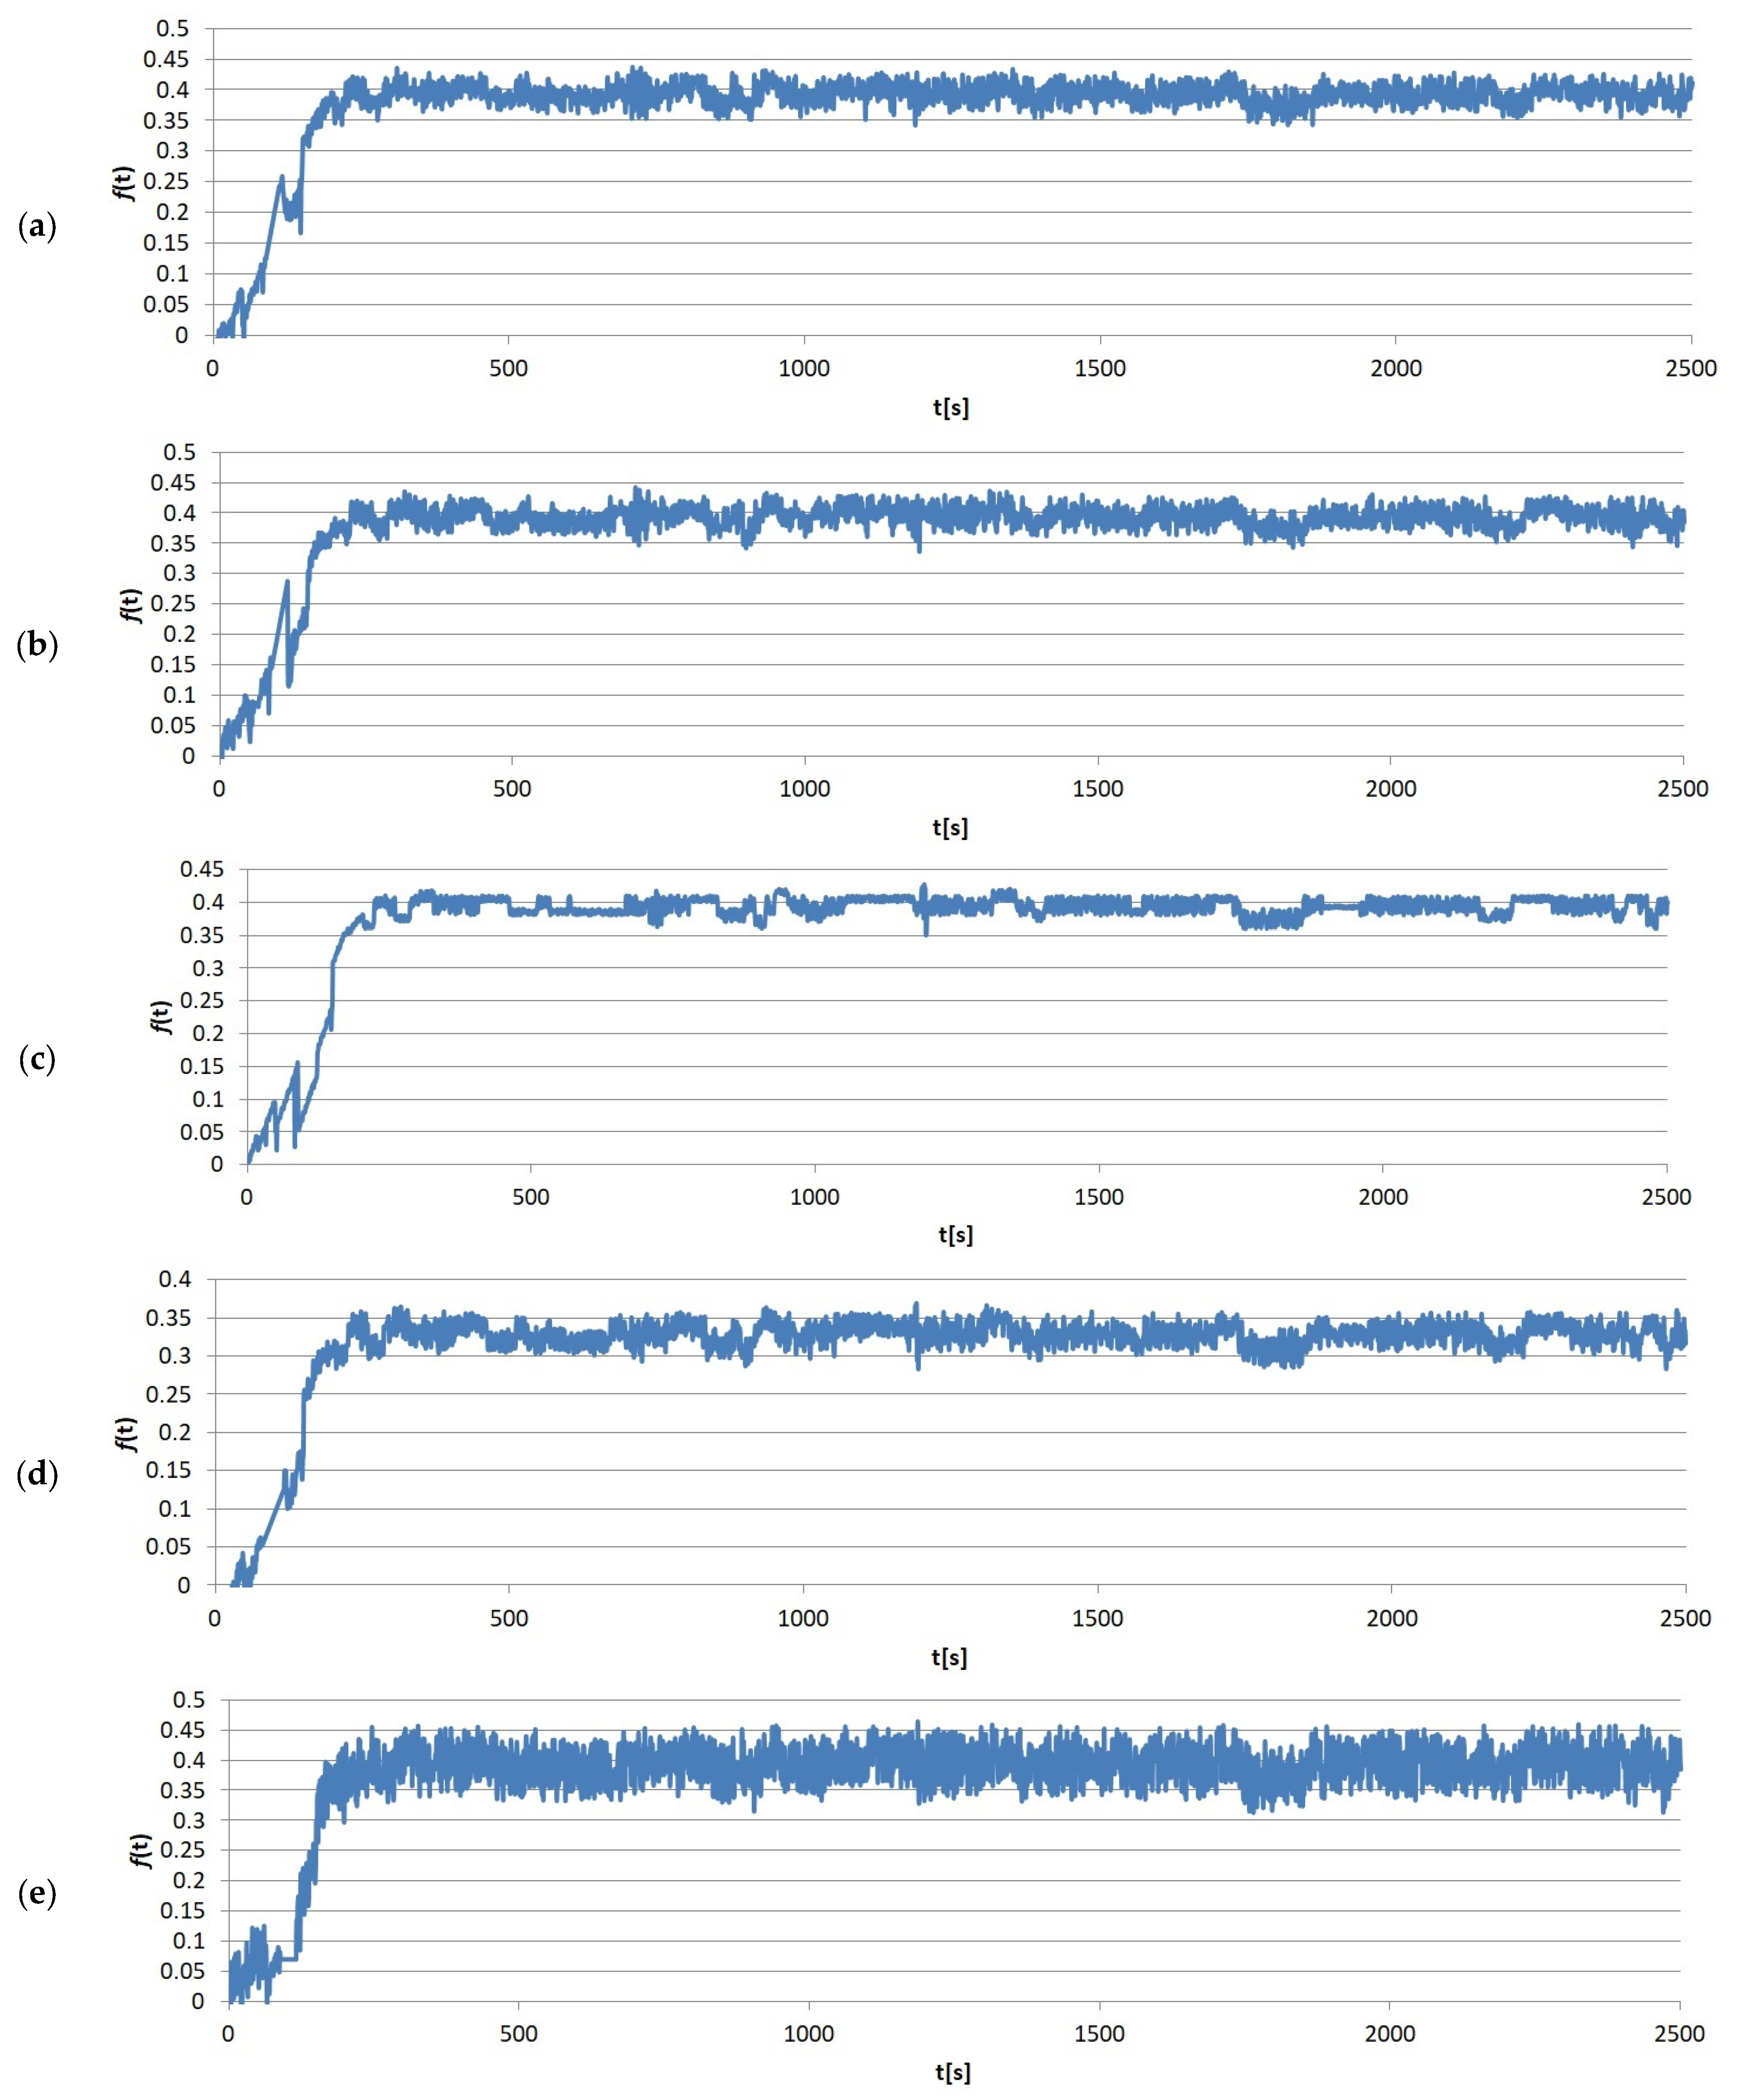
| Preliminary Test No | Average Friction Force Value [N]: | ||||
|---|---|---|---|---|---|
| 1 | 2 | 3 | 4 | 5 | |
| 1 | 0.37 | 0.38 | 0.36 | 0.37 | 0.42 |
| 2 | 0.54 | 0.55 | 0.58 | 0.51 | 0.54 |
| 3 | 1.01 | 0.96 | 0.96 | 1.13 | 1.04 |
| 4 | 1.09 | 1.14 | 1.14 | 1.25 | 1.28 |
| 5 | 1.51 | 1.49 | 1.43 | 1.39 | 1.47 |
| 6 | 1.14 | 1.46 | 1.17 | 1.13 | 1.37 |
| 7 | 1.12 | 1.05 | 0.82 | 1.04 | 1.14 |
| 8 | 0.76 | 1.09 | 1.07 | 0.82 | 0.81 |
| 9 | 1.91 | 1.80 | 1.81 | 1.83 | 1.90 |
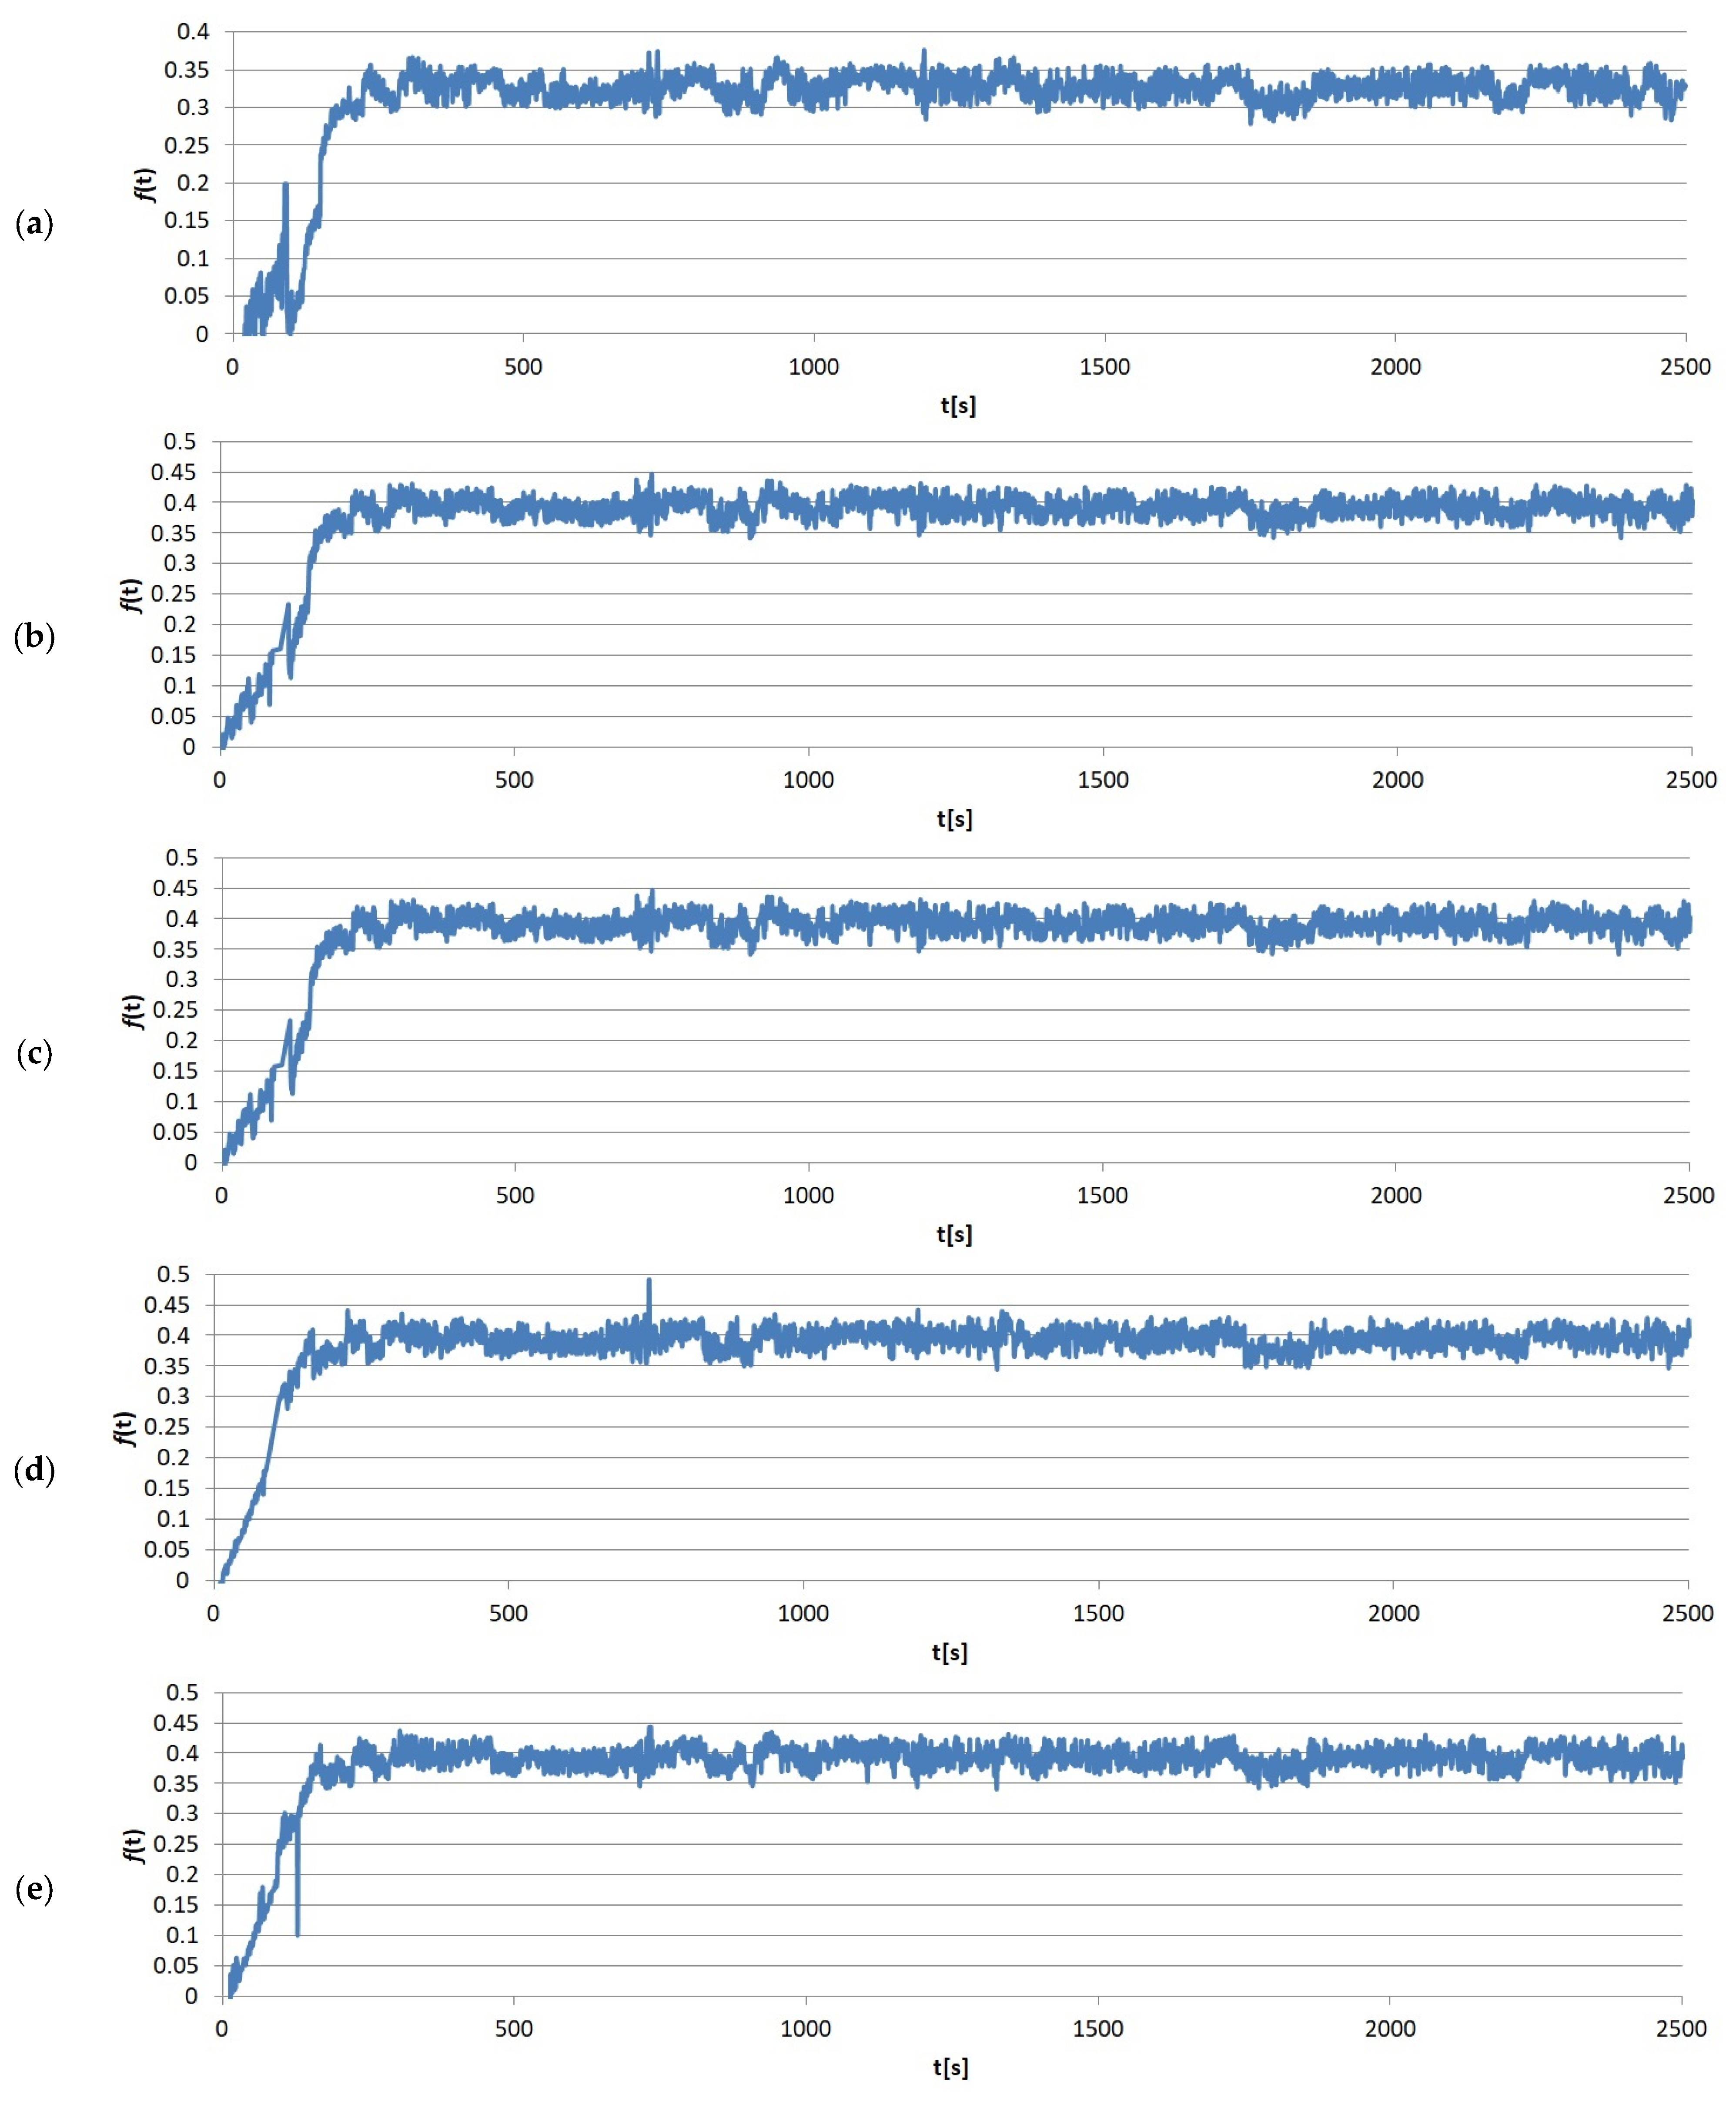
| Group No | Sample No | COF Value | Average | Standard Deviation | ||||
|---|---|---|---|---|---|---|---|---|
| Run No 1 | Run No 2 | Run No 3 | Run No 4 | Run No 5 | ||||
| S1 | 1 | 0.42 | 0.40 | 0.37 | 0.38 | 0.39 | 0.396 | ±0.015 |
| 2 | 0.39 | 0.39 | 0.42 | 0.41 | 0.38 | |||
| 3 | 0.39 | 0.39 | 0.39 | 0.41 | 0.38 | |||
| S2 | 1 | 0.41 | 0.38 | 0.41 | 0.39 | 0.43 | 0.393 | ±0.024 |
| 2 | 0.41 | 0.41 | 0.37 | 0.38 | 0.42 | |||
| 3 | 0.35 | 0.37 | 0.42 | 0.35 | 0.38 | |||
| S3 | 1 | 0.40 | 0.38 | 0.41 | 0.41 | 0.41 | 0.391 | ±0.014 |
| 2 | 0.39 | 0.39 | 0.40 | 0.39 | 0.36 | |||
| 3 | 0.37 | 0.39 | 0.41 | 0.38 | 0.38 | |||
| S4 | 1 | 0.39 | 0.38 | 0.39 | 0.37 | 0.38 | 0.379 | ±0.018 |
| 2 | 0.38 | 0.38 | 0.40 | 0.35 | 0.39 | |||
| 3 | 0.36 | 0.42 | 0.38 | 0.38 | 0.36 | |||
| Group No | Sample No | Crater Diameters [mm] | Average Diameter [mm] | kc [m4·m−2·N−1] | |
|---|---|---|---|---|---|
| In the Direction of Friction | Perpendicular to the Direction of Friction | ||||
| S1 | 1 | 1.95 | 1.78 | 1.842 | 71.68 × 10⁻¹⁴ |
| 2 | 1.84 | 1.88 | |||
| 3 | 1.81 | 1.79 | |||
| S2 | 1 | 1.91 | 1.82 | 1.871 | 76.46 × 10⁻¹⁴ |
| 2 | 1.94 | 1.91 | |||
| 3 | 1.8 | 1.85 | |||
| S3 | 1 | 1.79 | 1.88 | 1.886 | 78.94 × 10⁻¹⁴ |
| 2 | 1.82 | 1.91 | |||
| 3 | 1.93 | 1.99 | |||
| S4 | 1 | 1.87 | 1.94 | 1.898 | 80.92 × 10⁻¹⁴ |
| 2 | 1.91 | 1.85 | |||
| 3 | 1.96 | 1.86 | |||
| Source of Variation | Df | SS | MS | Ff | p |
|---|---|---|---|---|---|
| qualitative factor | 3 | 2.32 × 10⁻³ | 7.73 × 10⁻³ | 2.25 | 93.22 × 10⁻³ |
| random error | 54 | 18.56 × 10⁻³ | 0.34 × 10⁻⁴ | ||
| total | 57 | 20.88 × 10⁻³ |
| Samples Group | ||||
|---|---|---|---|---|
| S1 | S2 | S3 | S4 | |
| FLev | 2.007 | 3.409 | 5.352 | 0.865 |
| p | 0.177 | 0.052 | 0.014 | 0.865 |
Disclaimer/Publisher’s Note: The statements, opinions and data contained in all publications are solely those of the individual author(s) and contributor(s) and not of MDPI and/or the editor(s). MDPI and/or the editor(s) disclaim responsibility for any injury to people or property resulting from any ideas, methods, instructions or products referred to in the content. |
© 2024 by the authors. Licensee MDPI, Basel, Switzerland. This article is an open access article distributed under the terms and conditions of the Creative Commons Attribution (CC BY) license (https://creativecommons.org/licenses/by/4.0/).
Share and Cite
Borawski, A.; Szpica, D.; Mieczkowski, G. Laboratory Tests on the Possibility of Using Flax Fibers as a Plant-Origin Reinforcement Component in Composite Friction Materials for Vehicle Braking Systems. Materials 2024, 17, 2861. https://doi.org/10.3390/ma17122861
Borawski A, Szpica D, Mieczkowski G. Laboratory Tests on the Possibility of Using Flax Fibers as a Plant-Origin Reinforcement Component in Composite Friction Materials for Vehicle Braking Systems. Materials. 2024; 17(12):2861. https://doi.org/10.3390/ma17122861
Chicago/Turabian StyleBorawski, Andrzej, Dariusz Szpica, and Grzegorz Mieczkowski. 2024. "Laboratory Tests on the Possibility of Using Flax Fibers as a Plant-Origin Reinforcement Component in Composite Friction Materials for Vehicle Braking Systems" Materials 17, no. 12: 2861. https://doi.org/10.3390/ma17122861
APA StyleBorawski, A., Szpica, D., & Mieczkowski, G. (2024). Laboratory Tests on the Possibility of Using Flax Fibers as a Plant-Origin Reinforcement Component in Composite Friction Materials for Vehicle Braking Systems. Materials, 17(12), 2861. https://doi.org/10.3390/ma17122861