


Odors Adsorption in Zeolites Including Natural Clinoptilolite: Theoretical and Experimental Studies


Abstract
1. Introduction
1.1. Odorous Substances
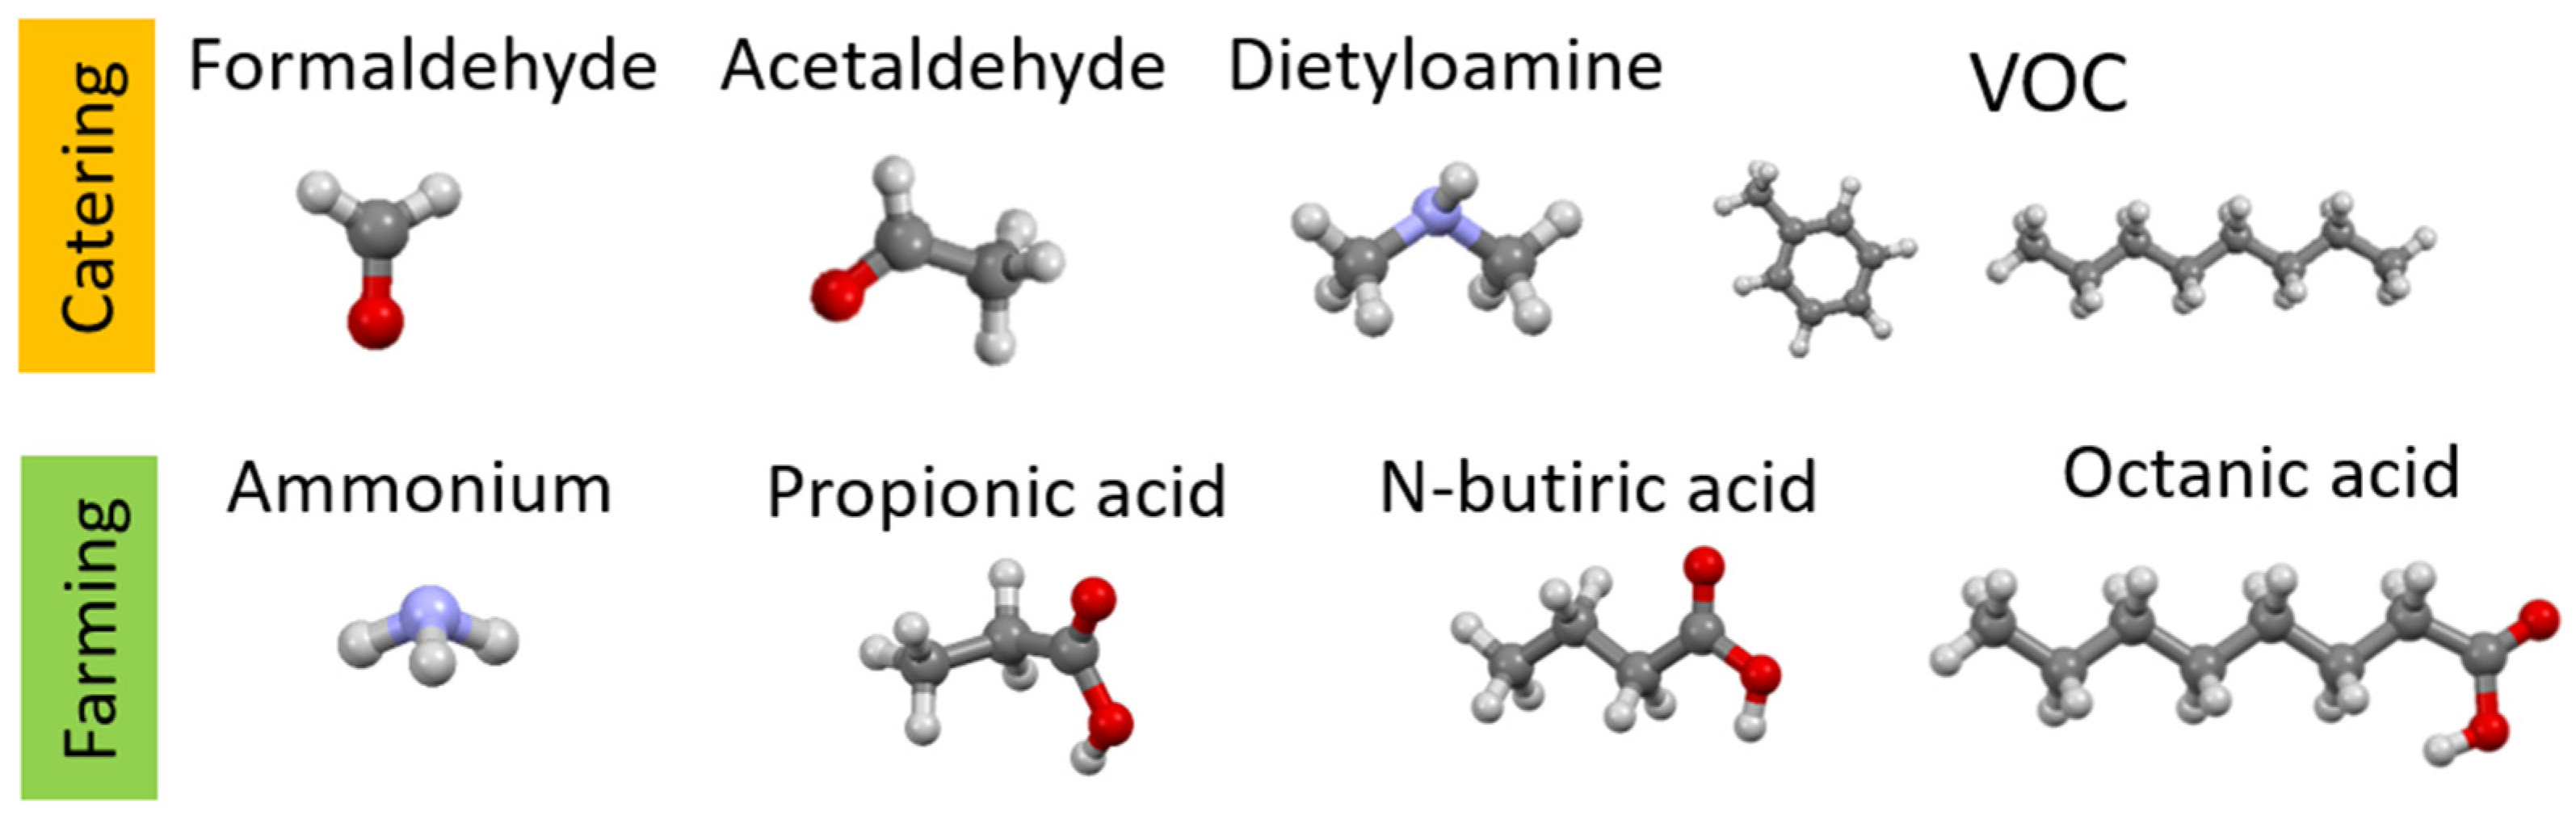
1.1.1. Odors in Catering
1.1.2. Odors in Breeding
2. Materials and Methods
2.1. Zeolites Preparation
2.2. Characterization
3. Results and Discussion
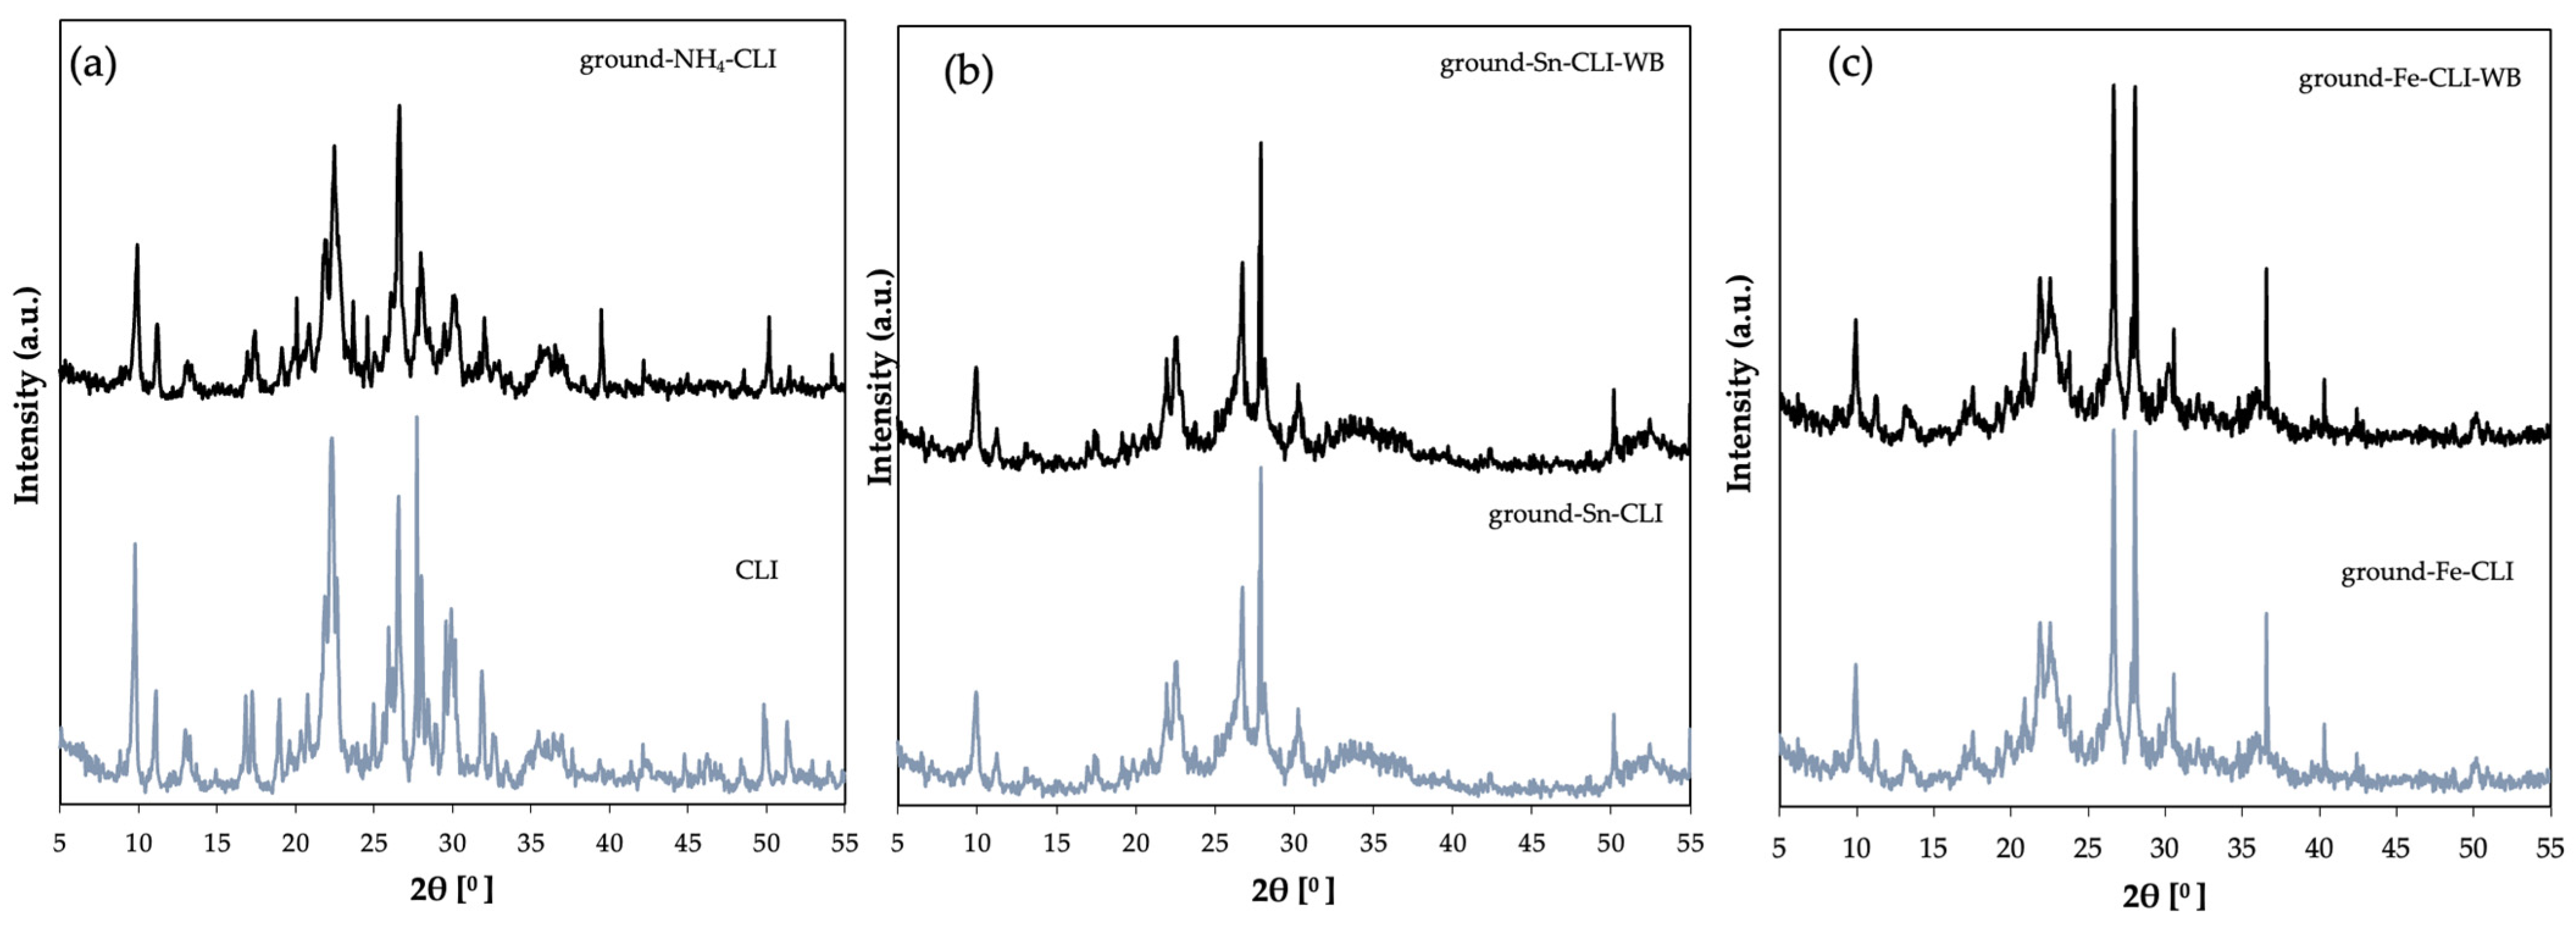
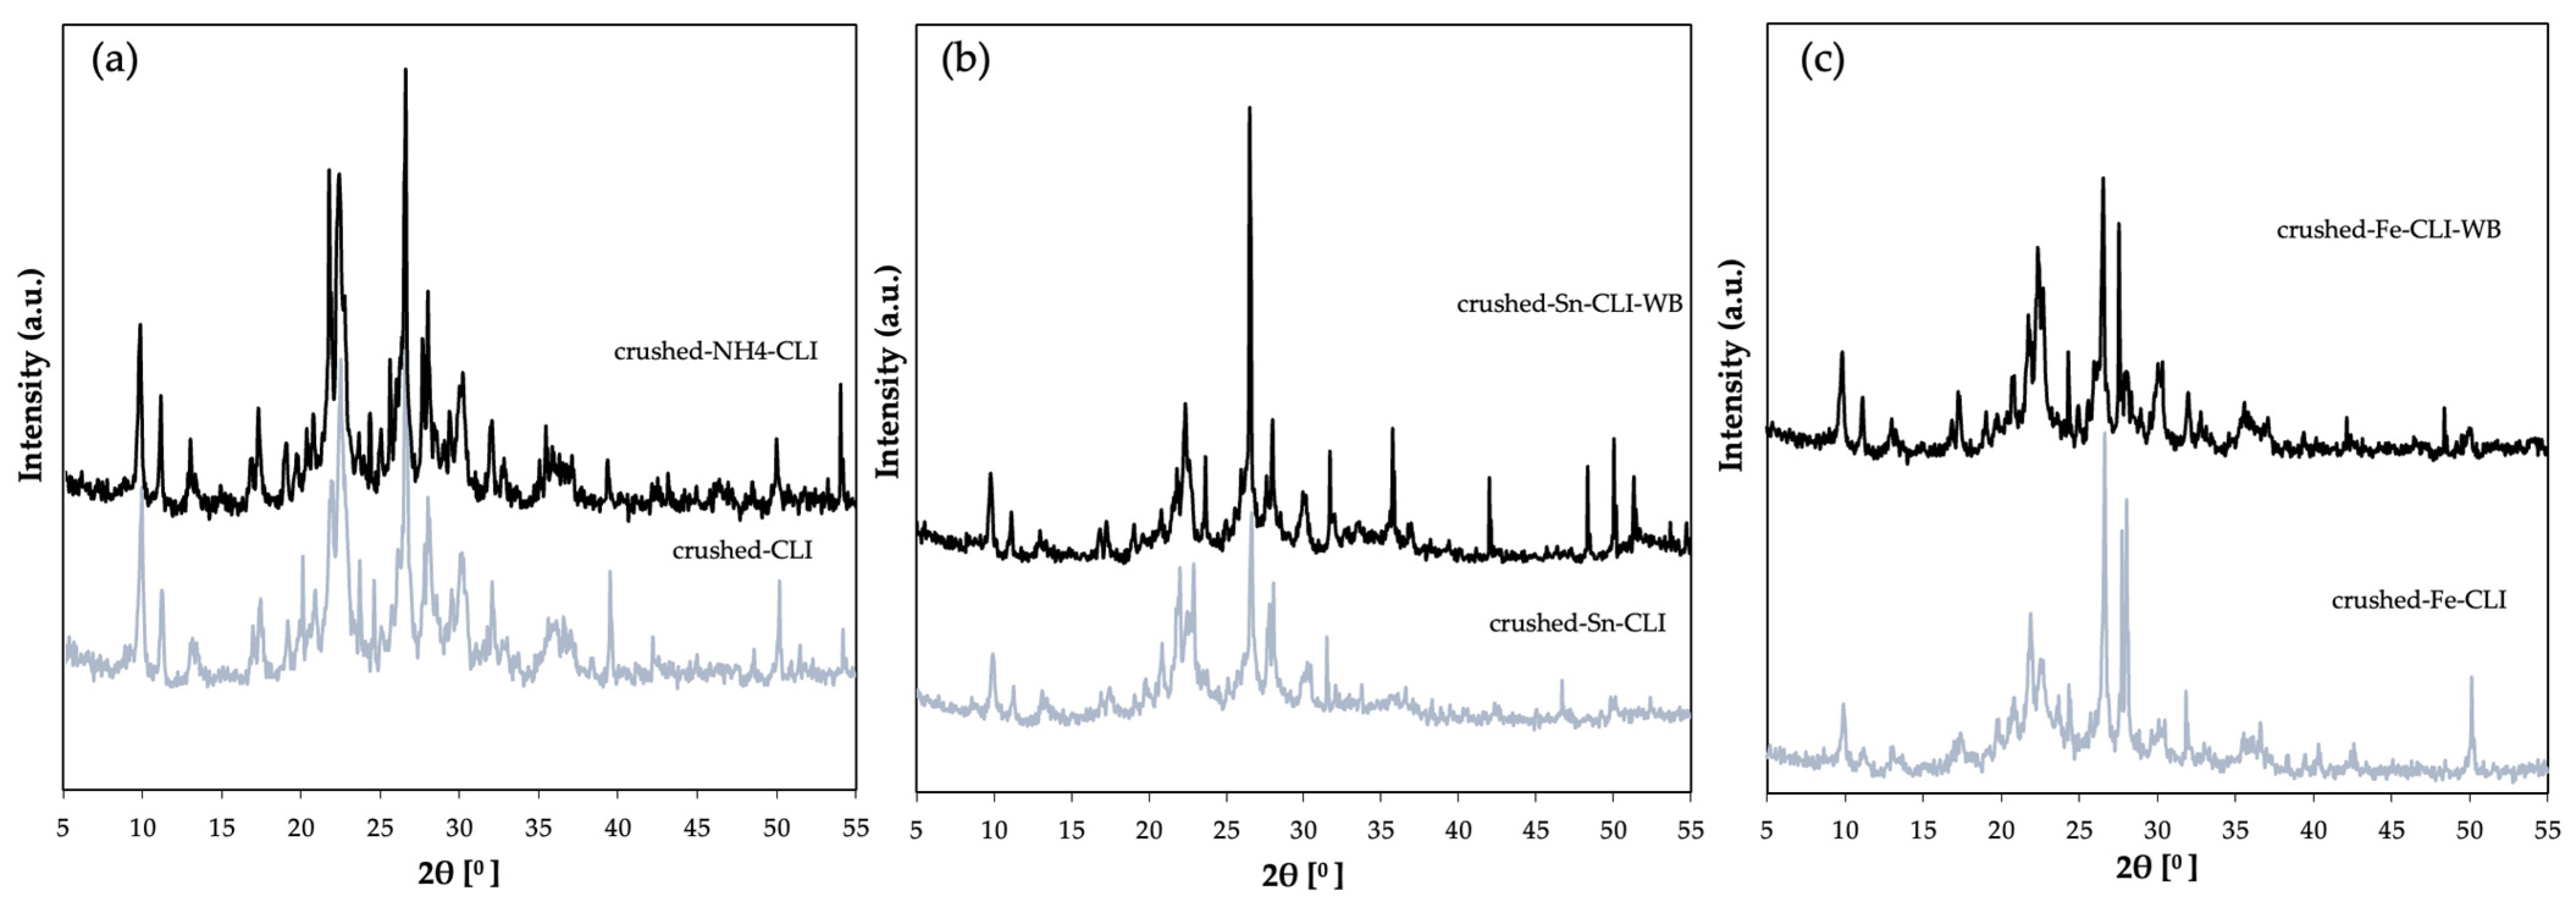
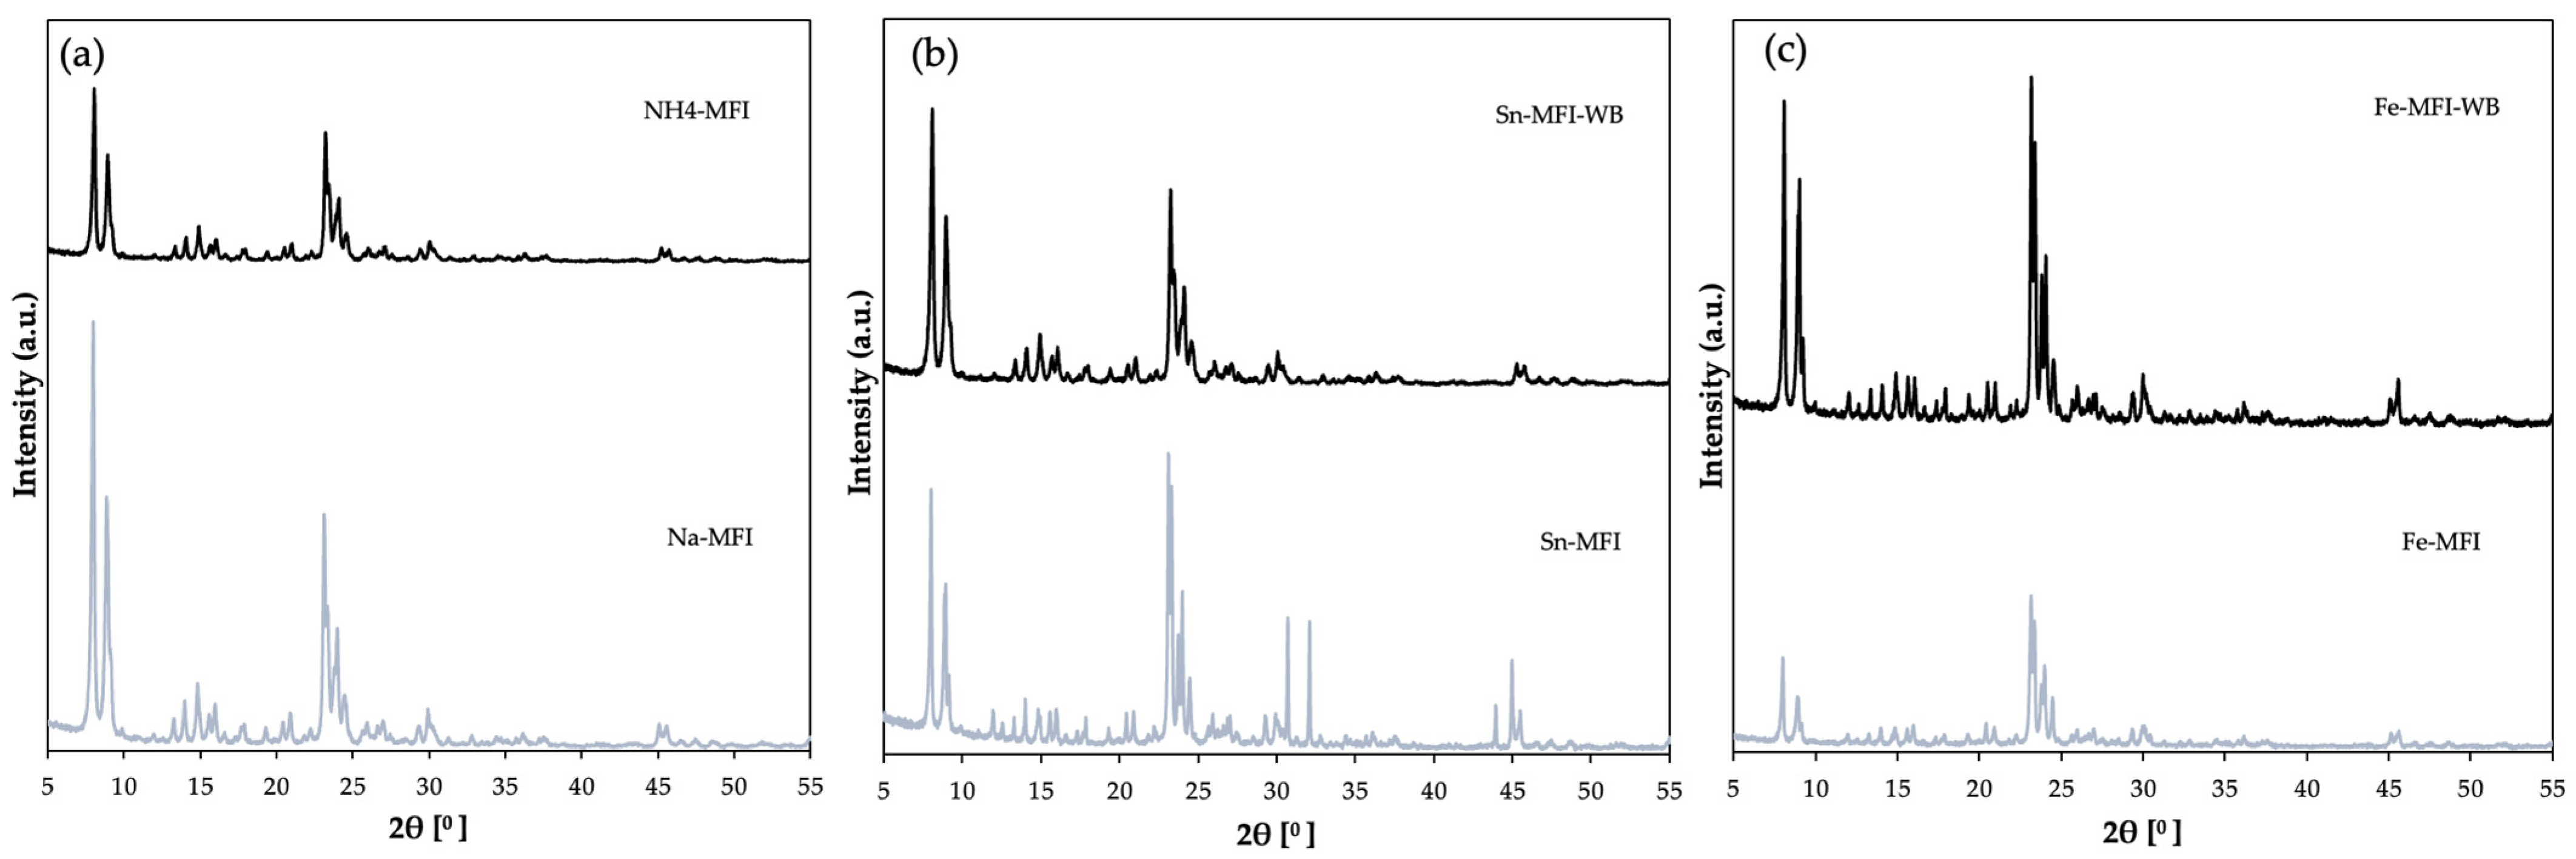
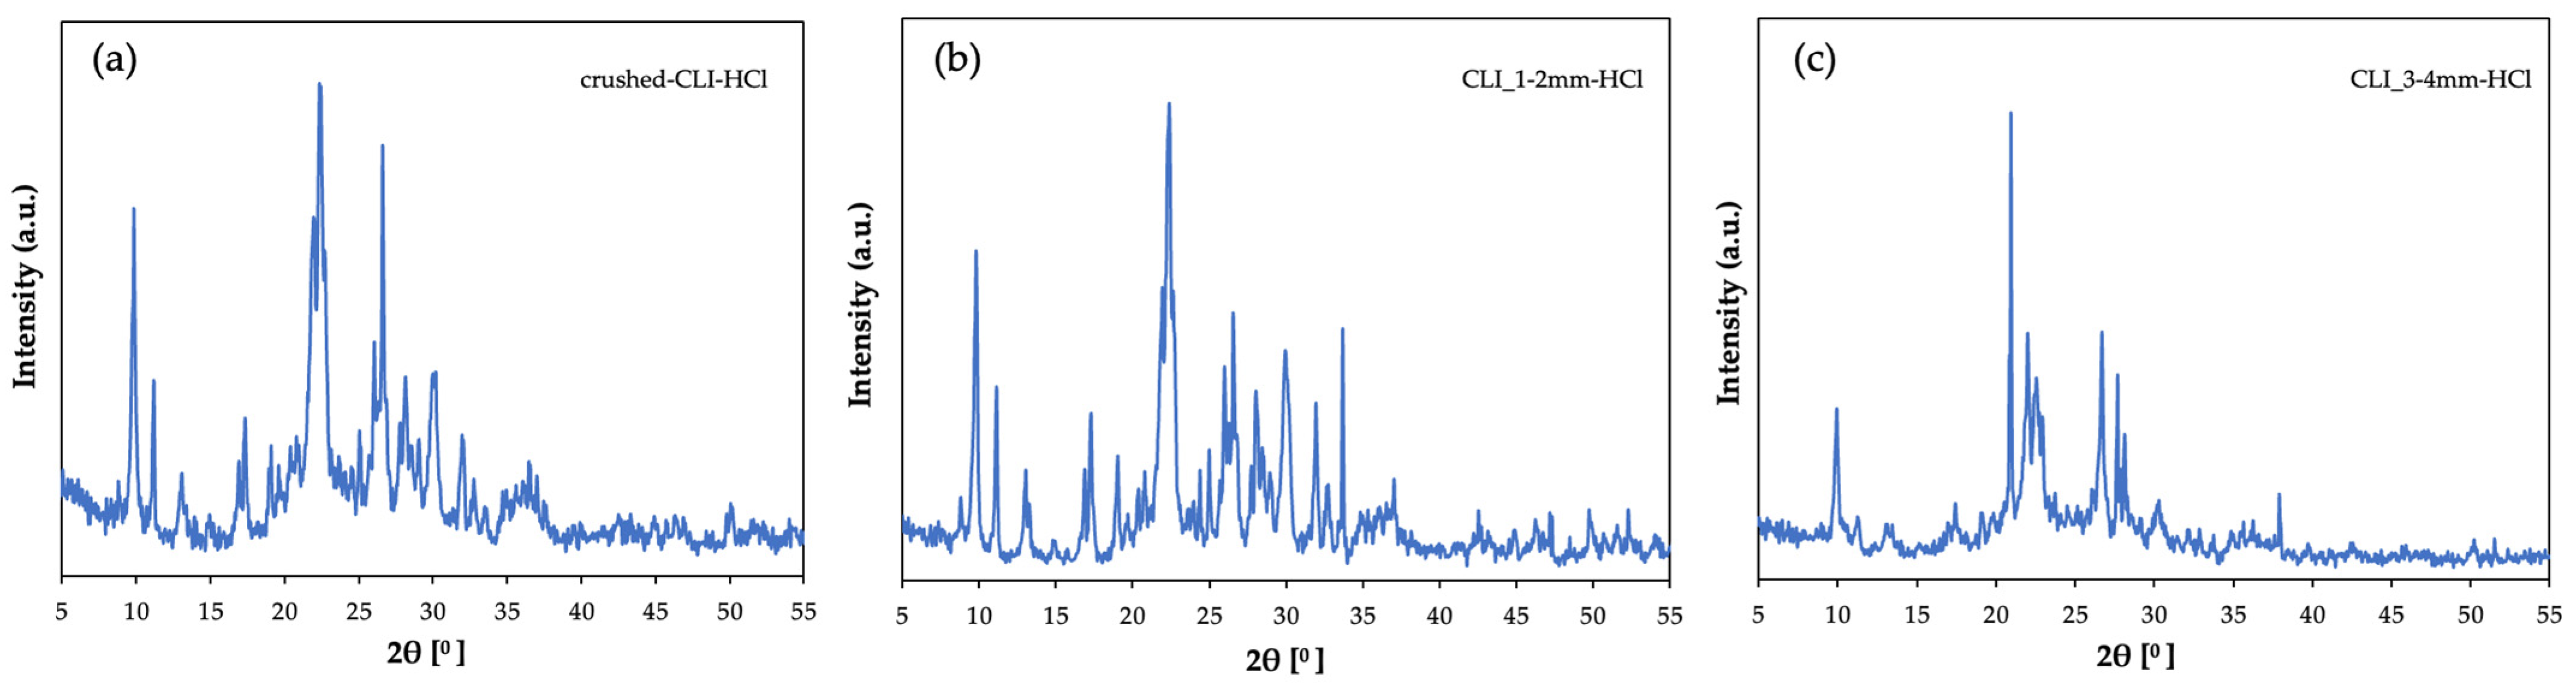
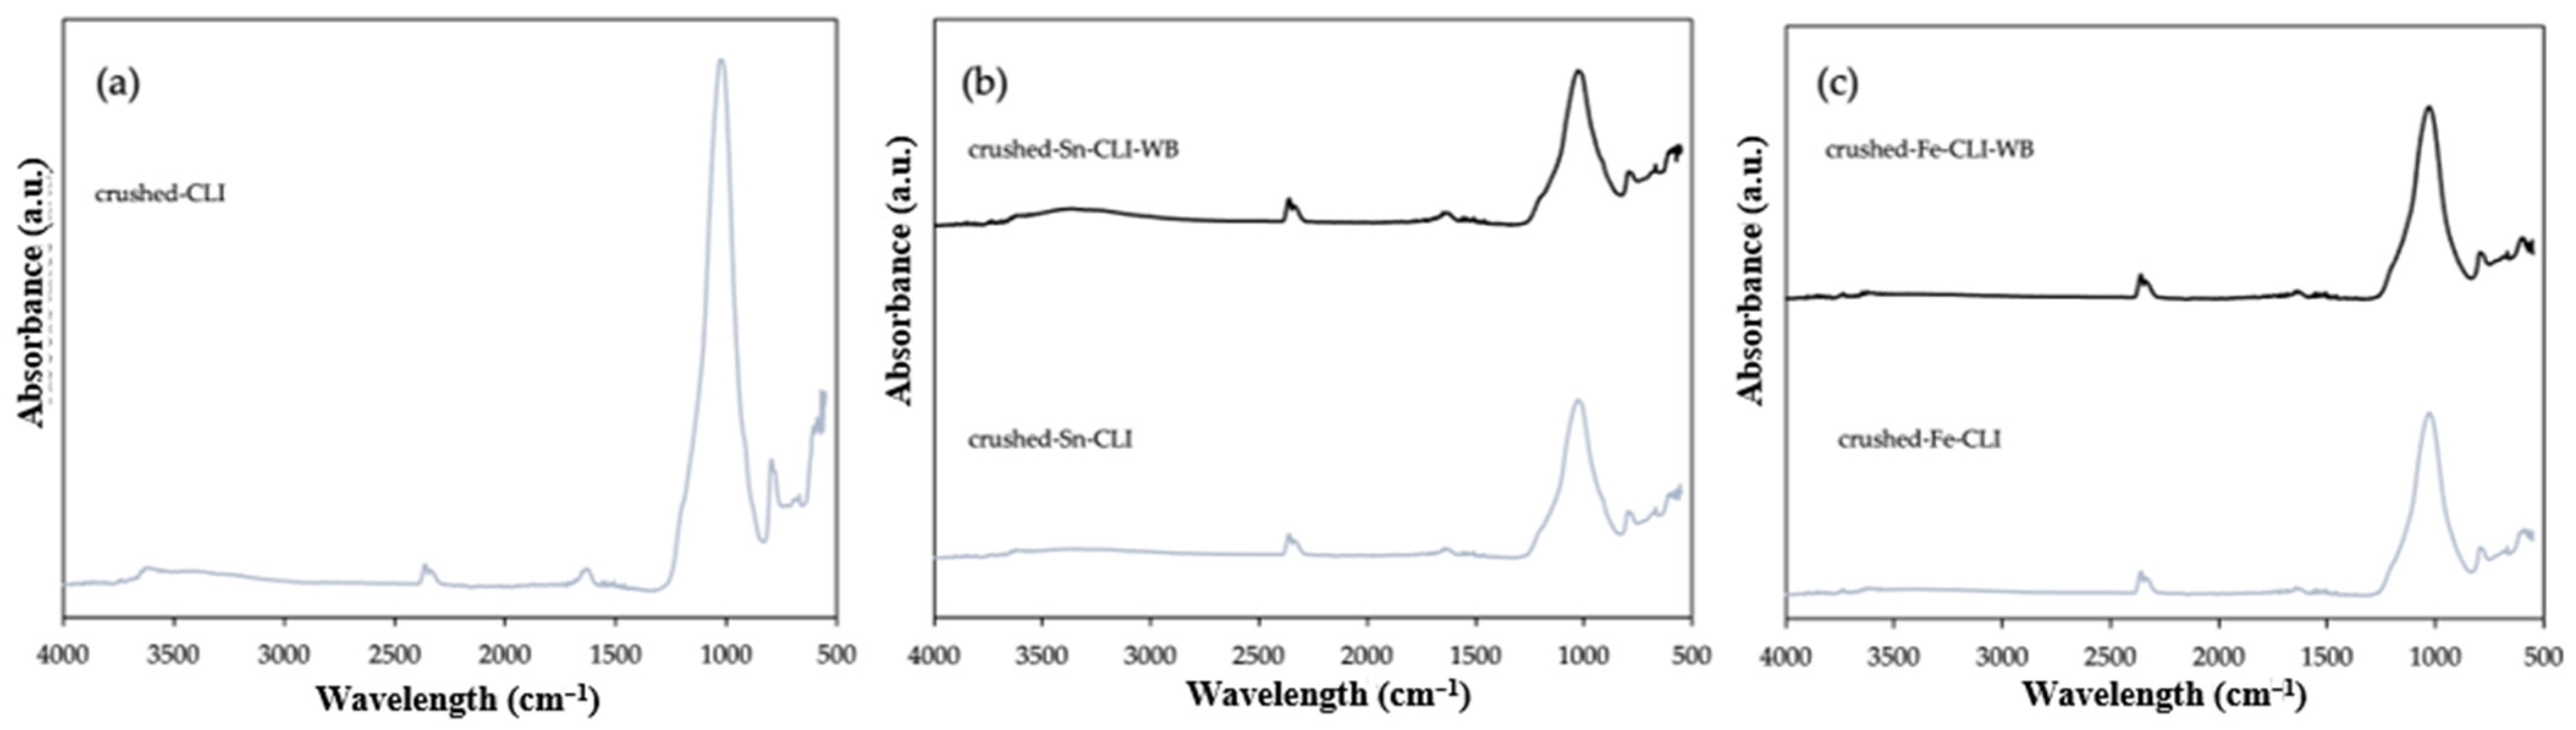
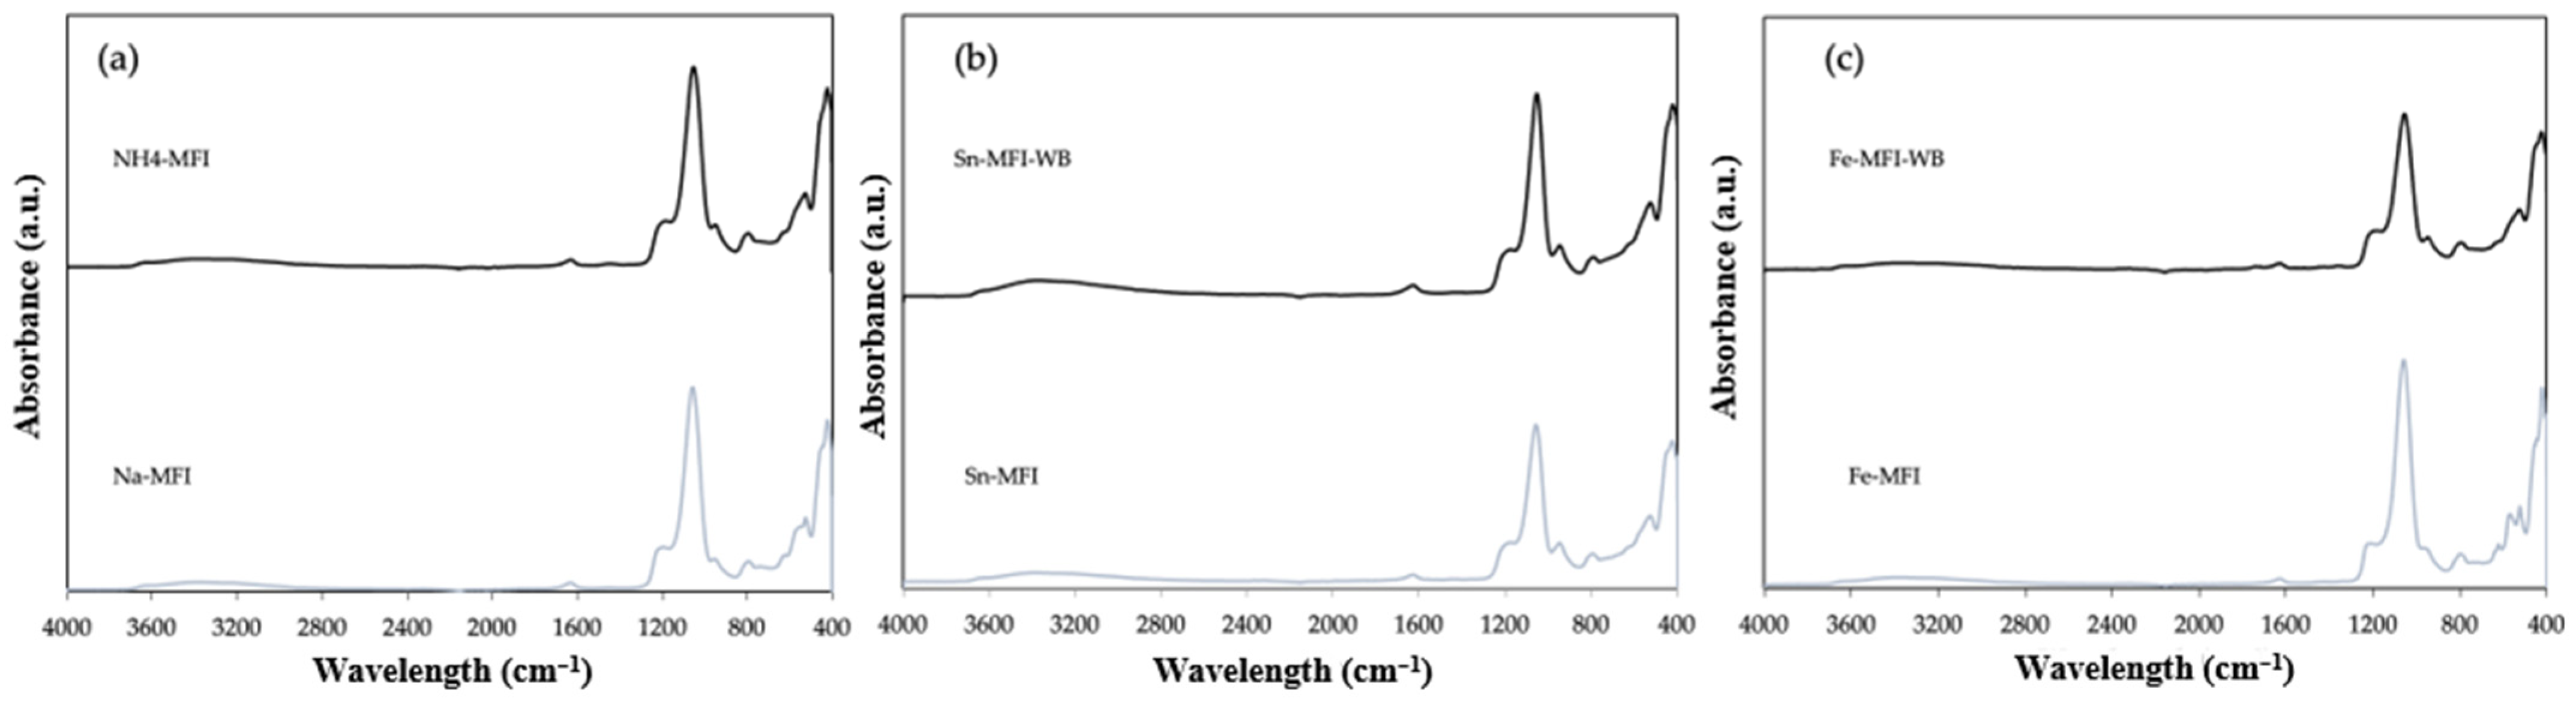
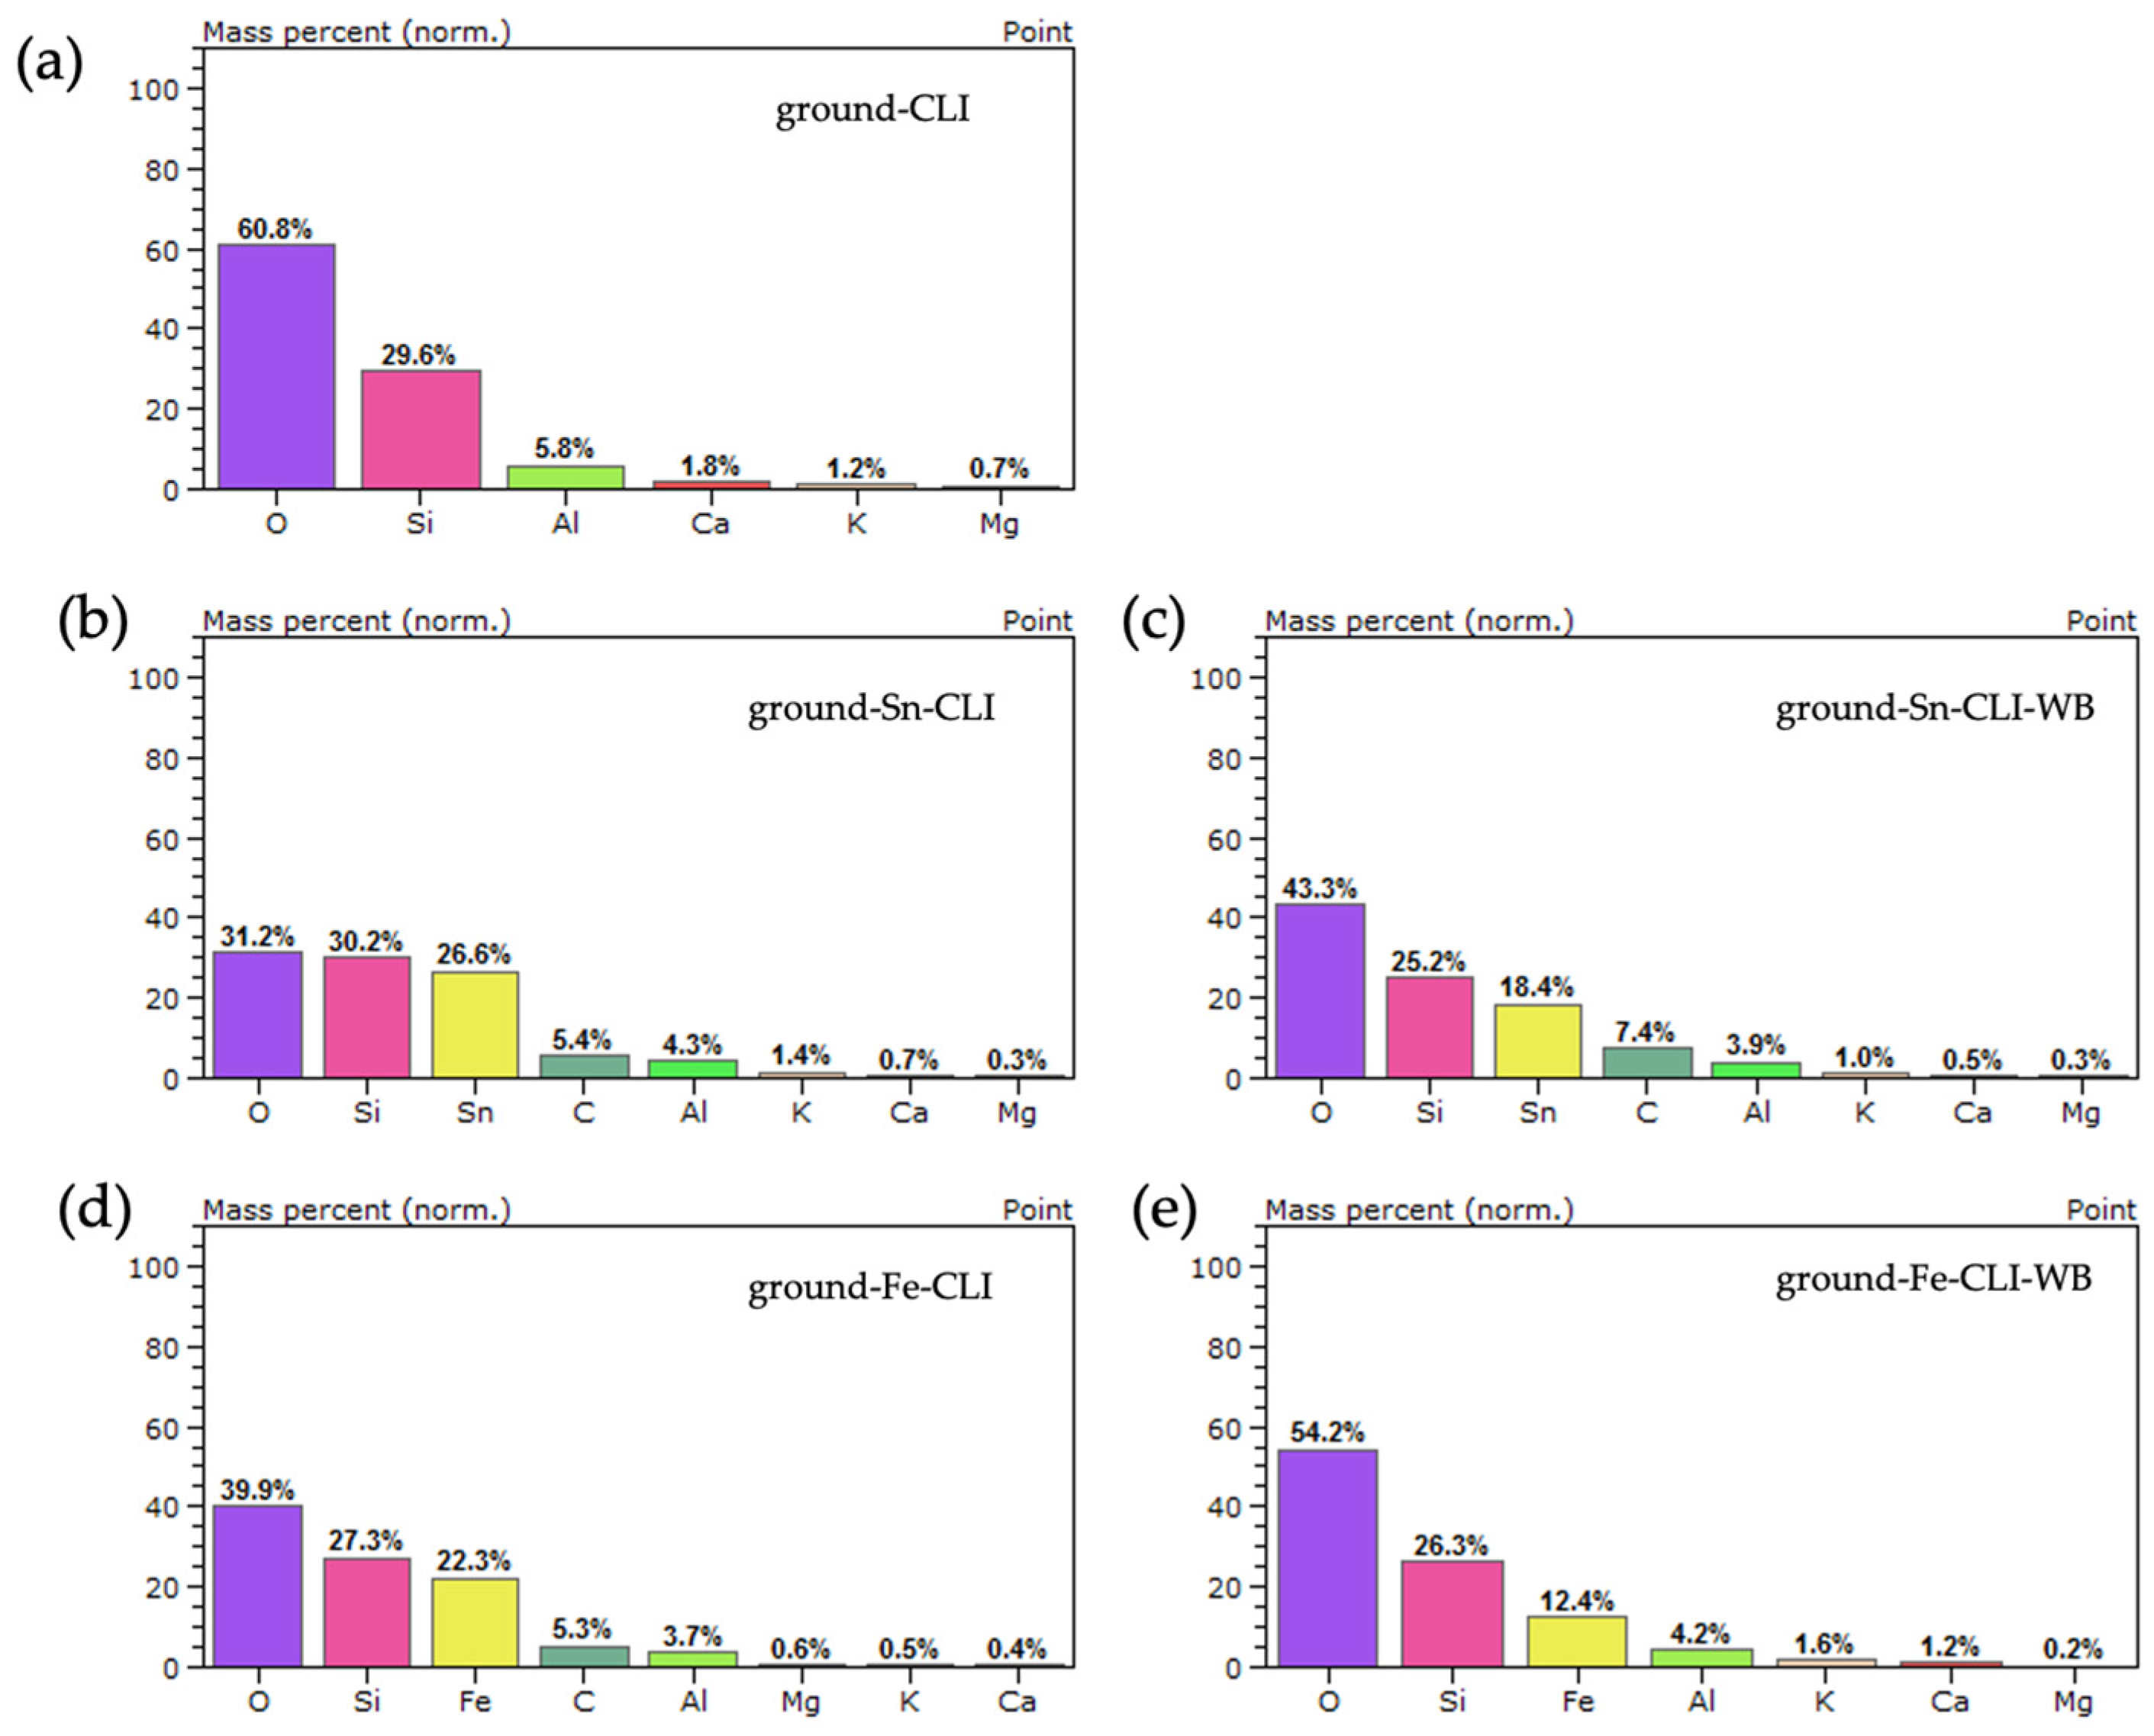
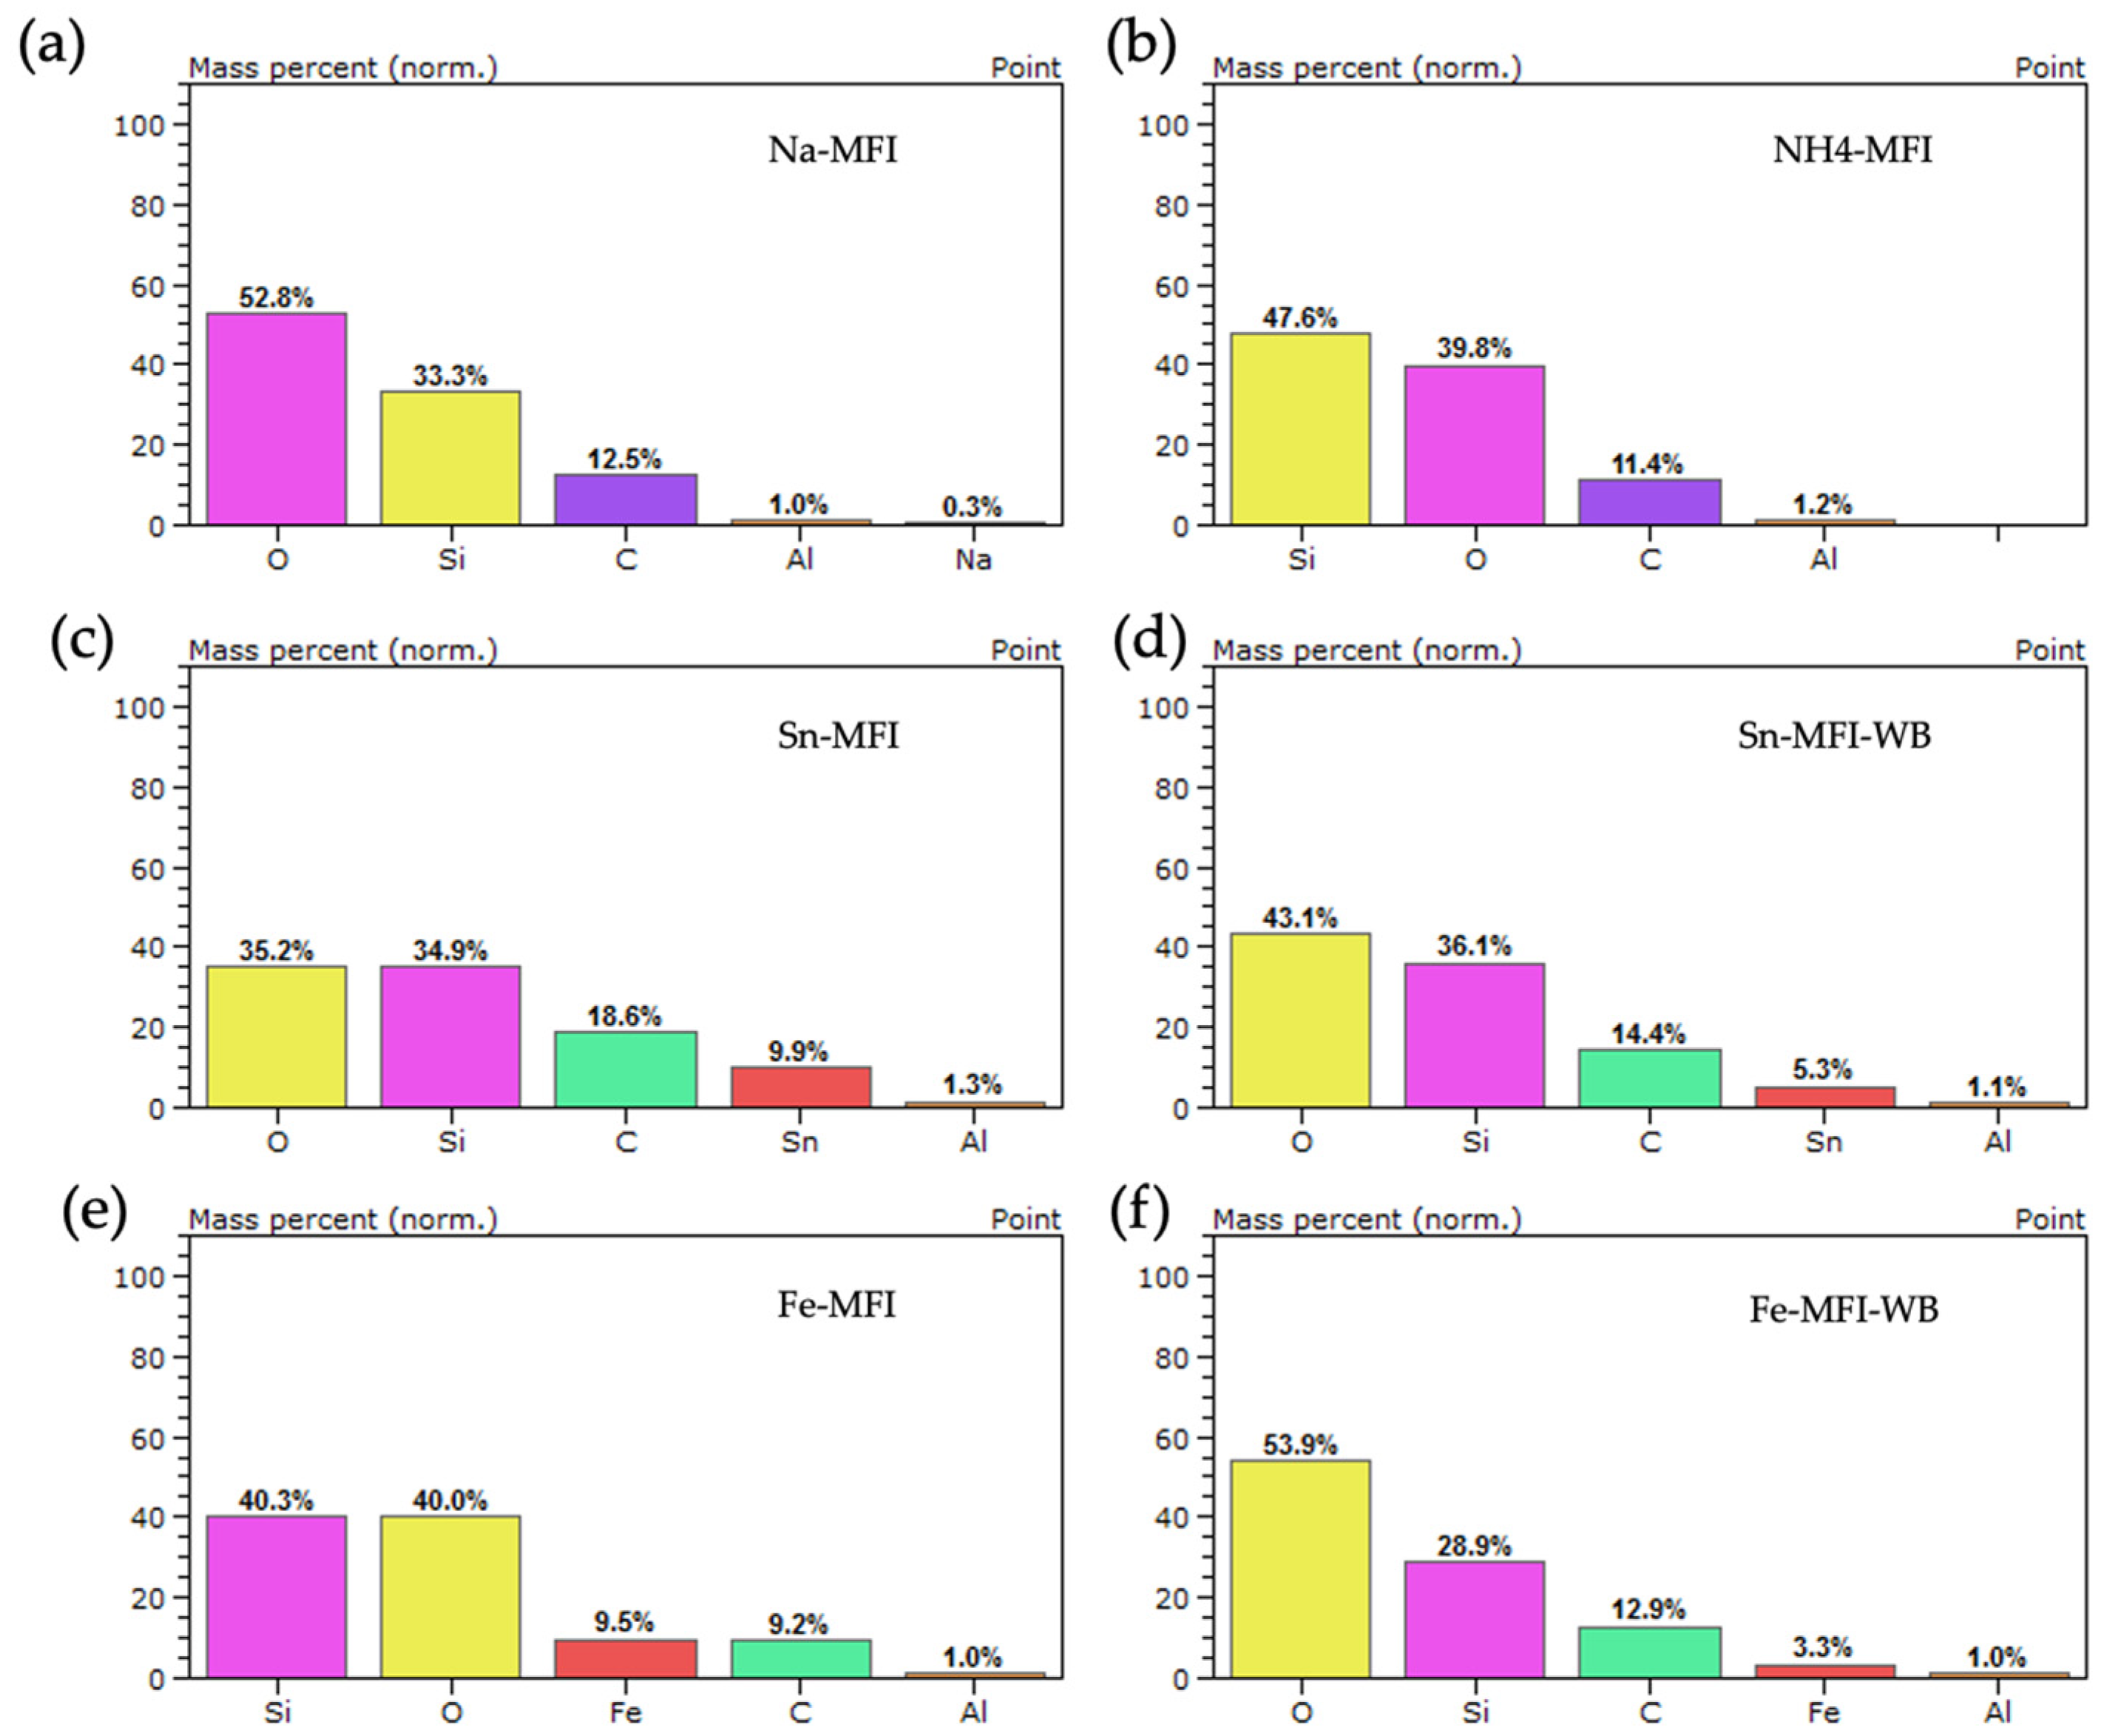
3.1. Characteristics of Zeolite Materials
3.2. Zeolites Adsorption Tests
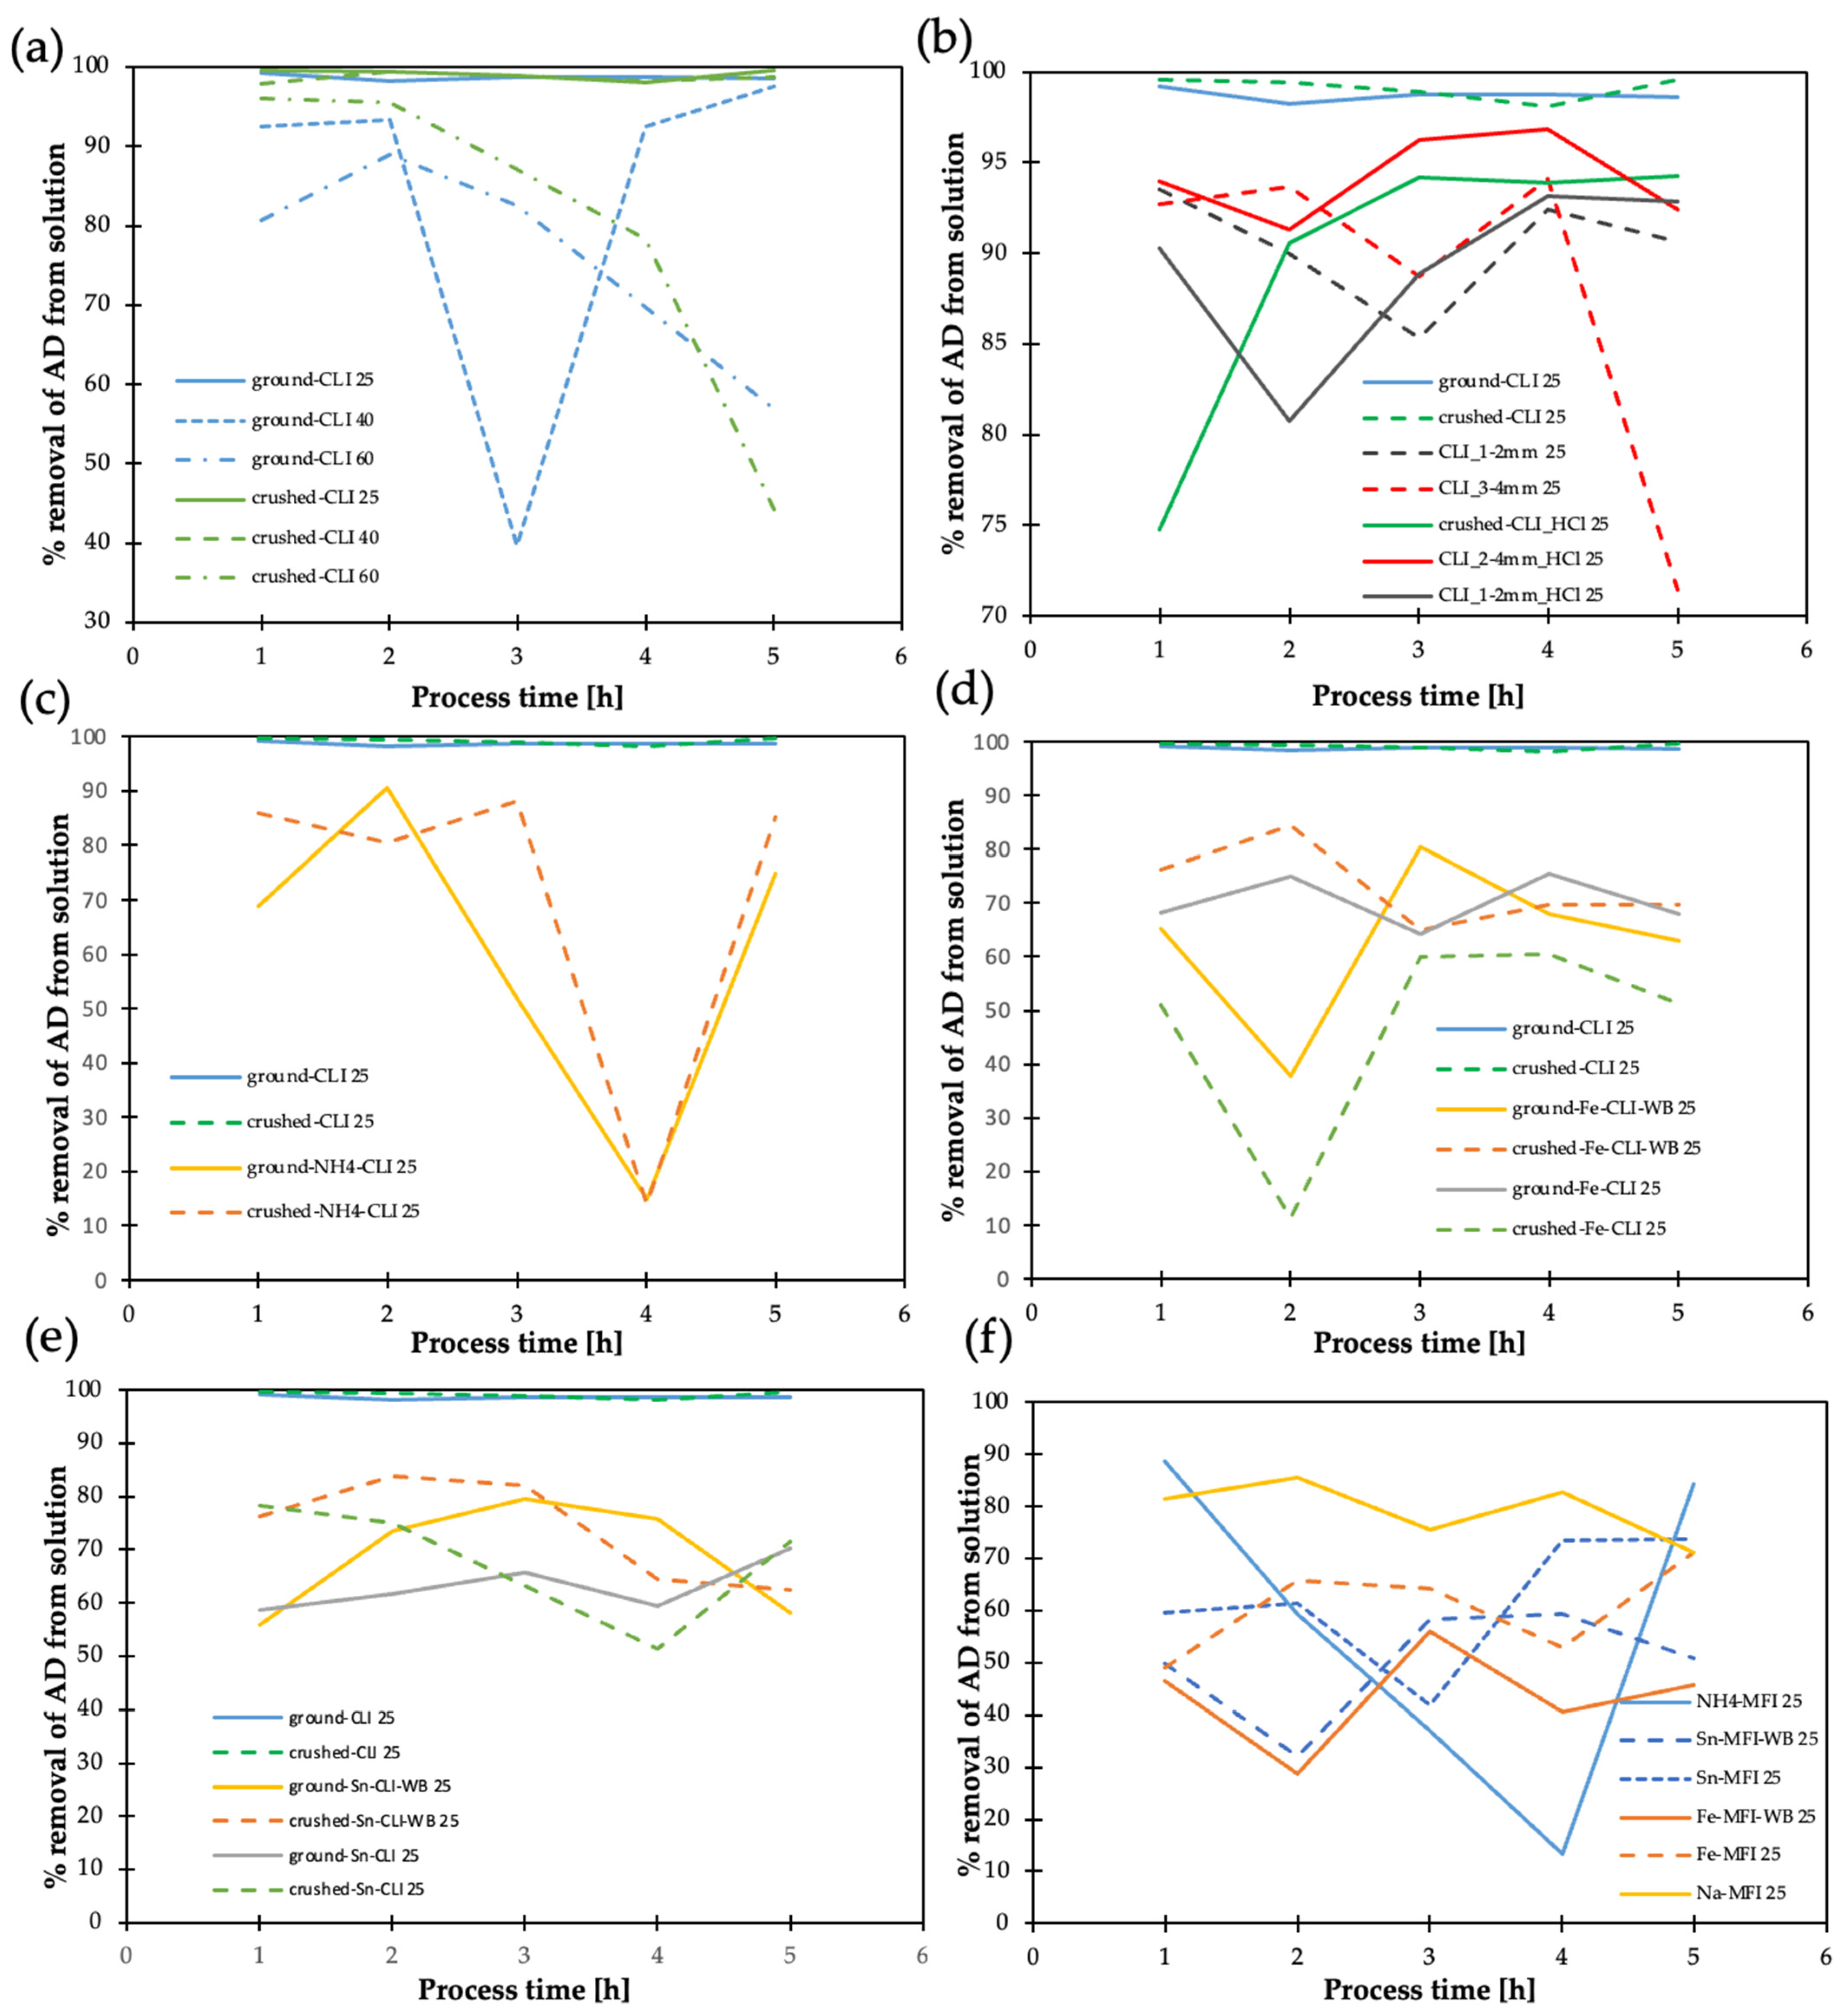
3.2.1. Adsorption of Acetaldehyde (AD)
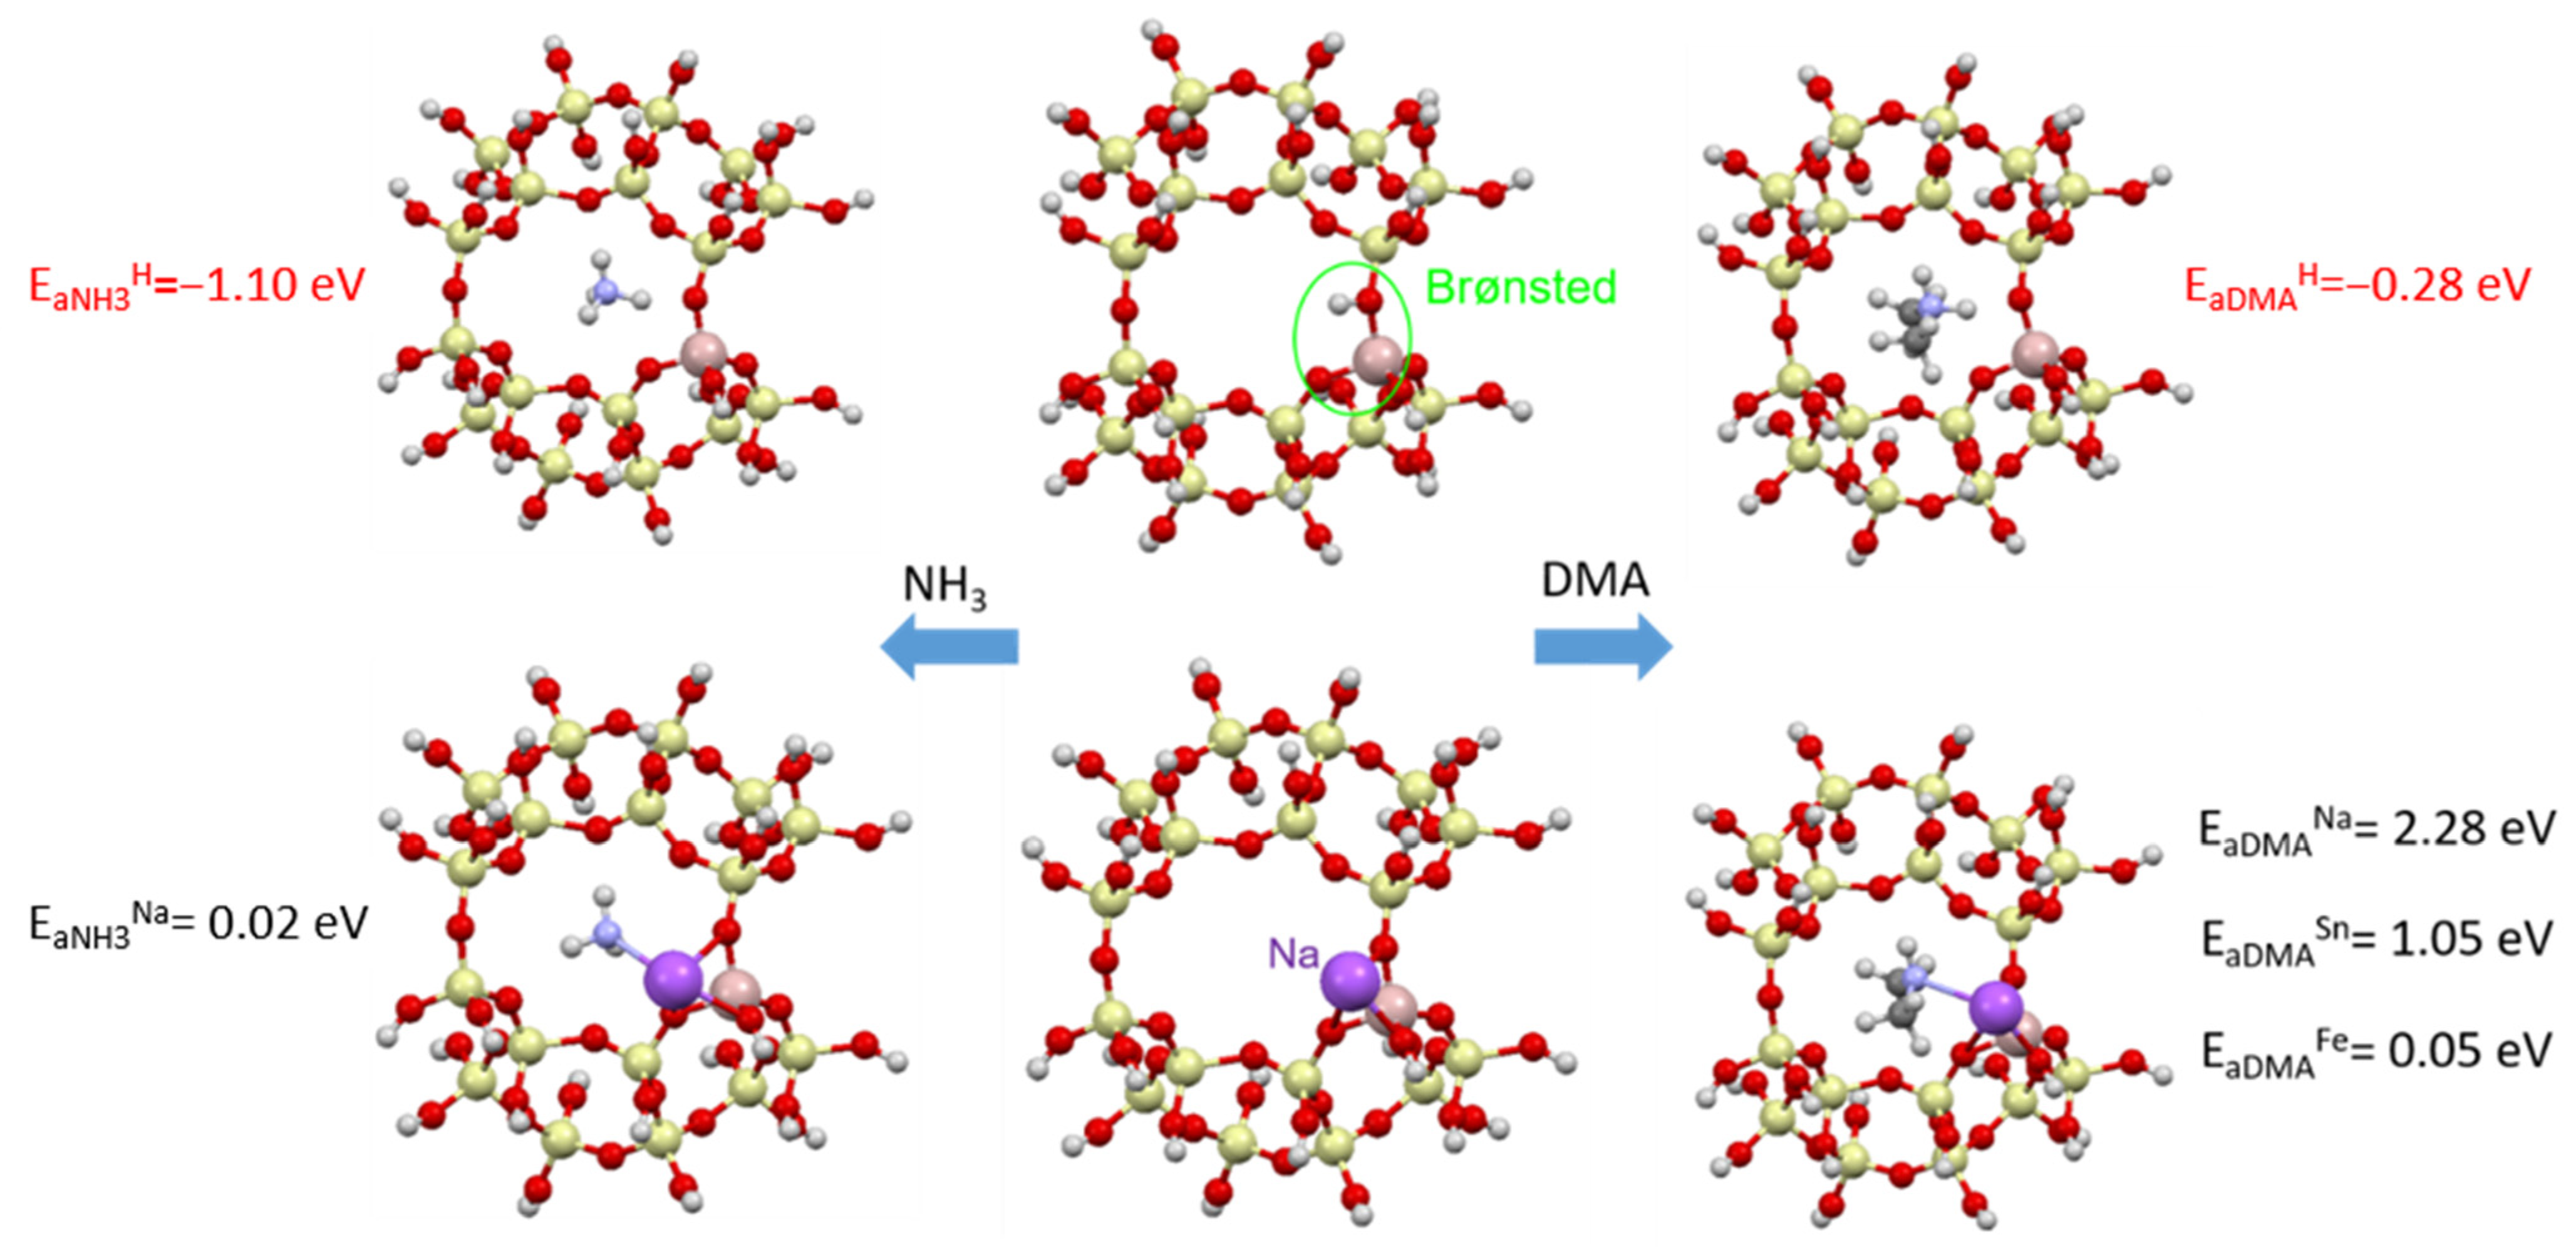
3.2.2. Adsorption of Dimethylamine (DMA)
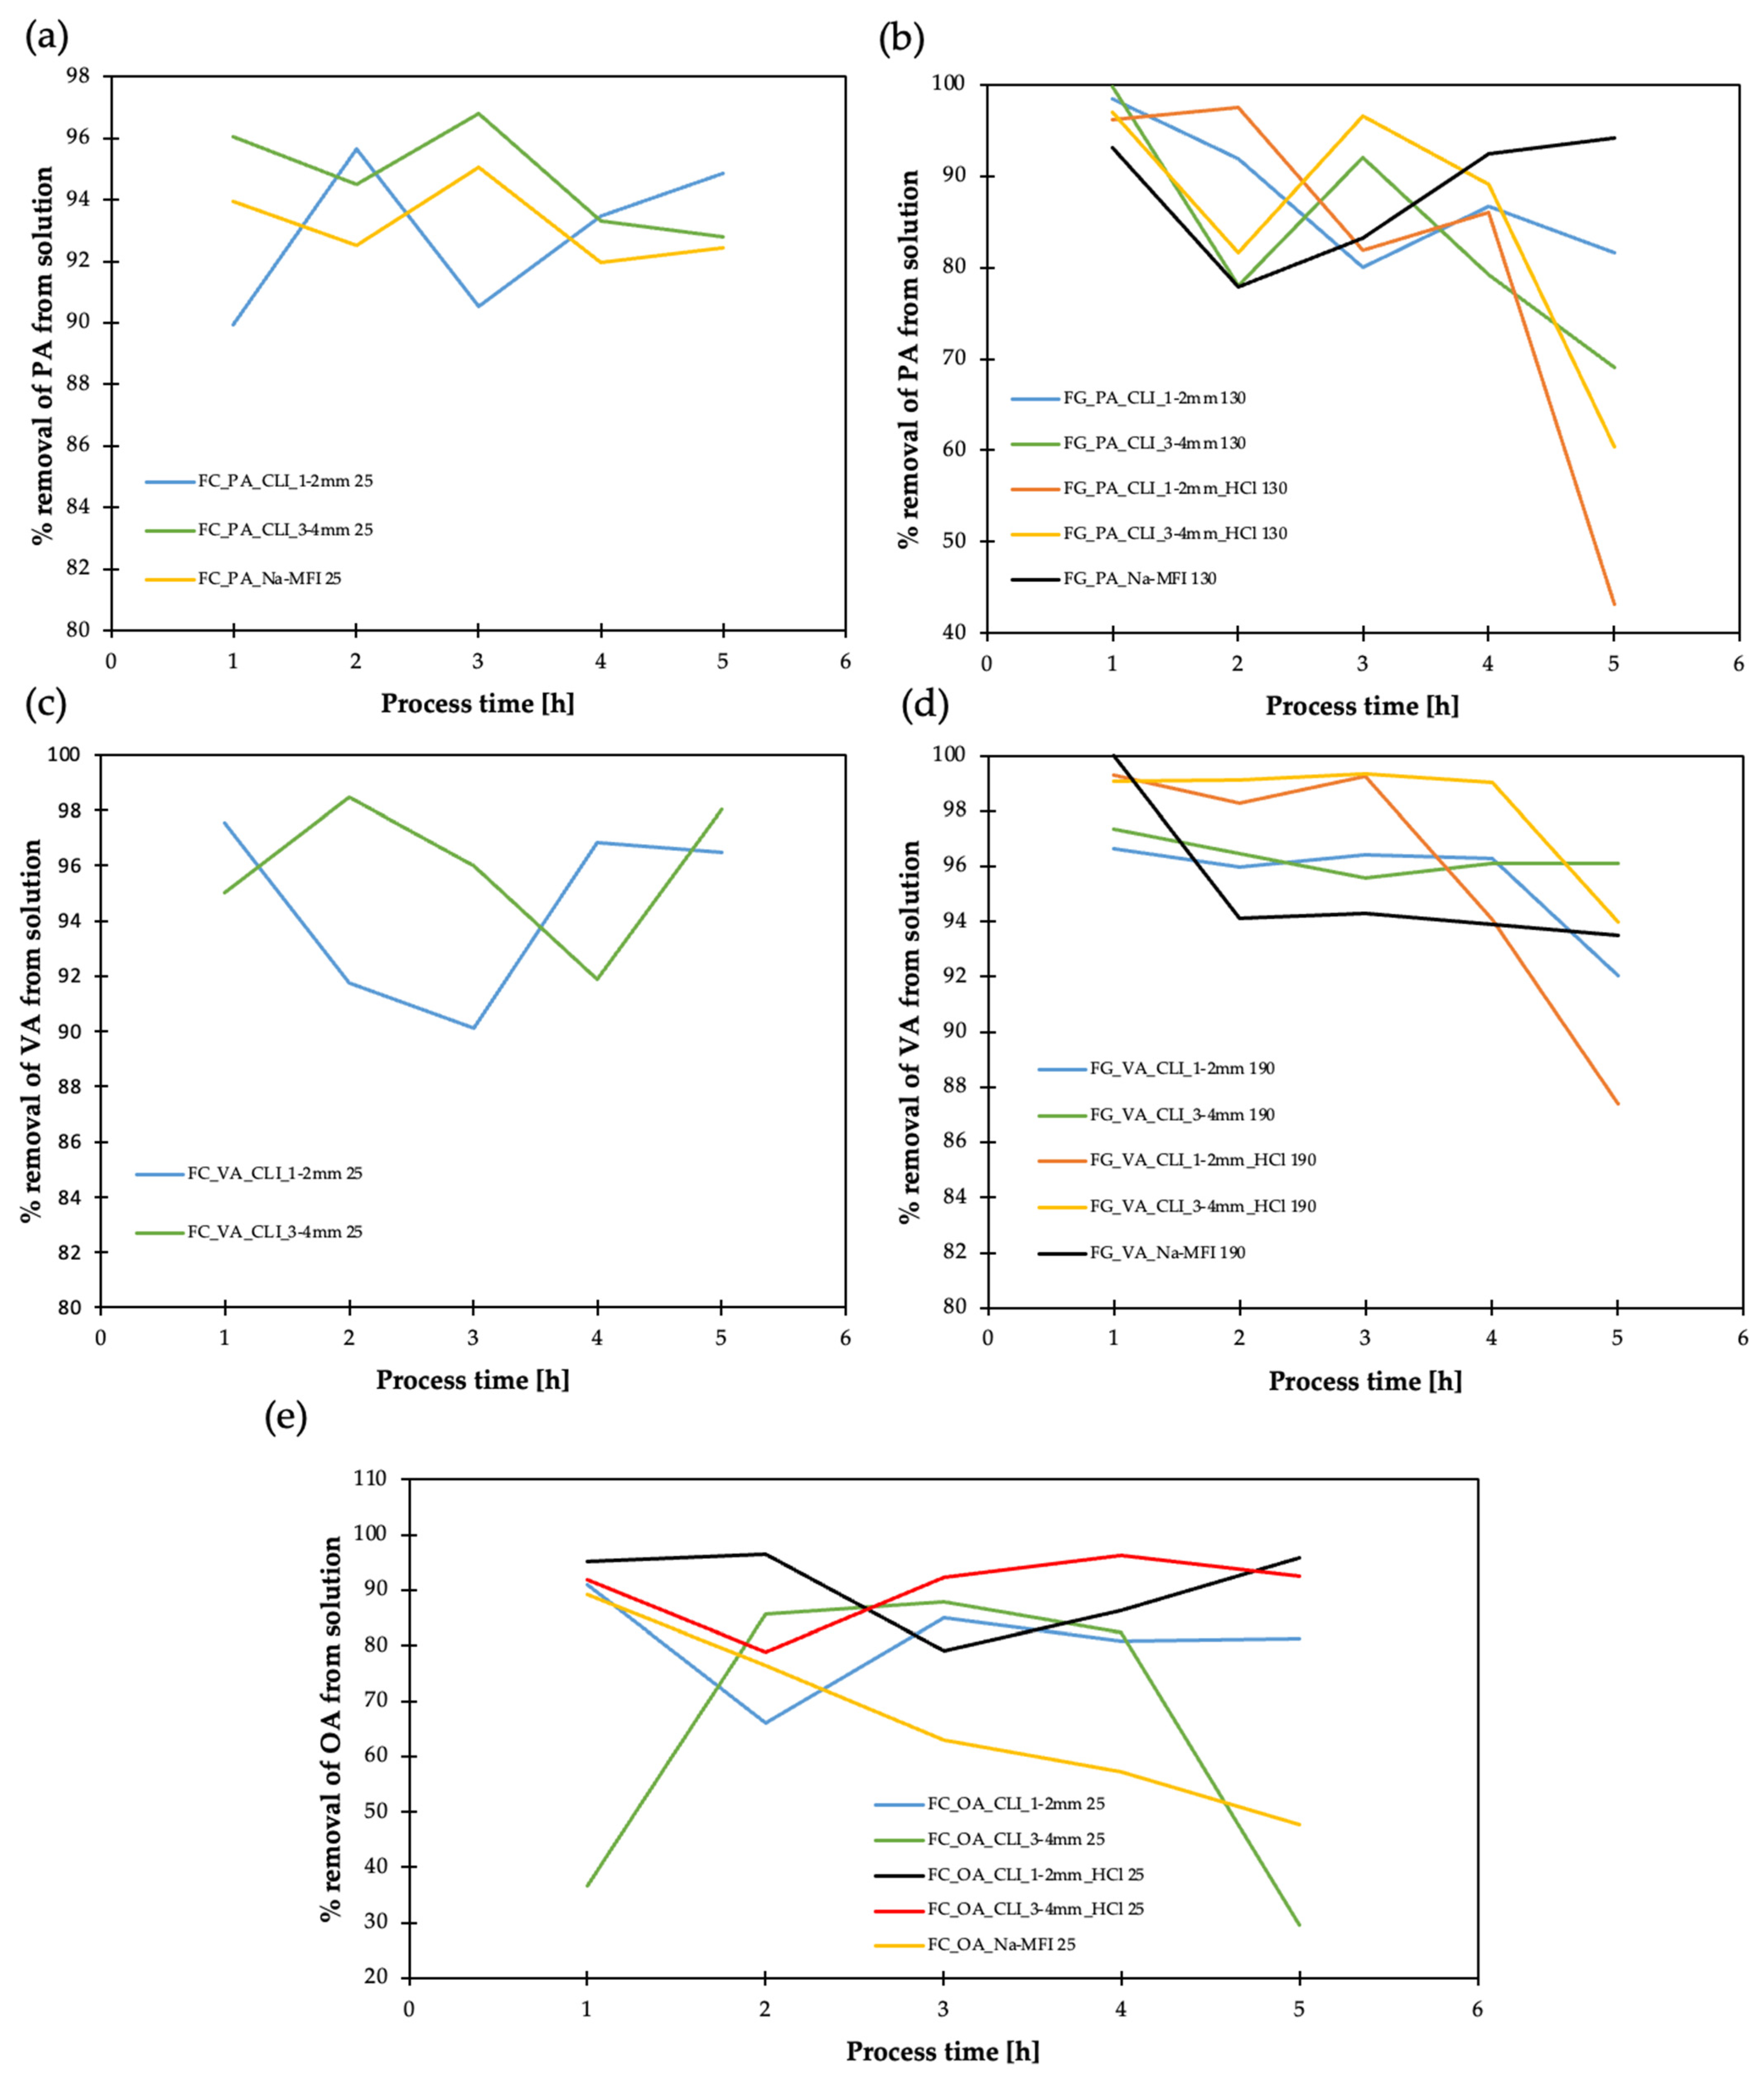
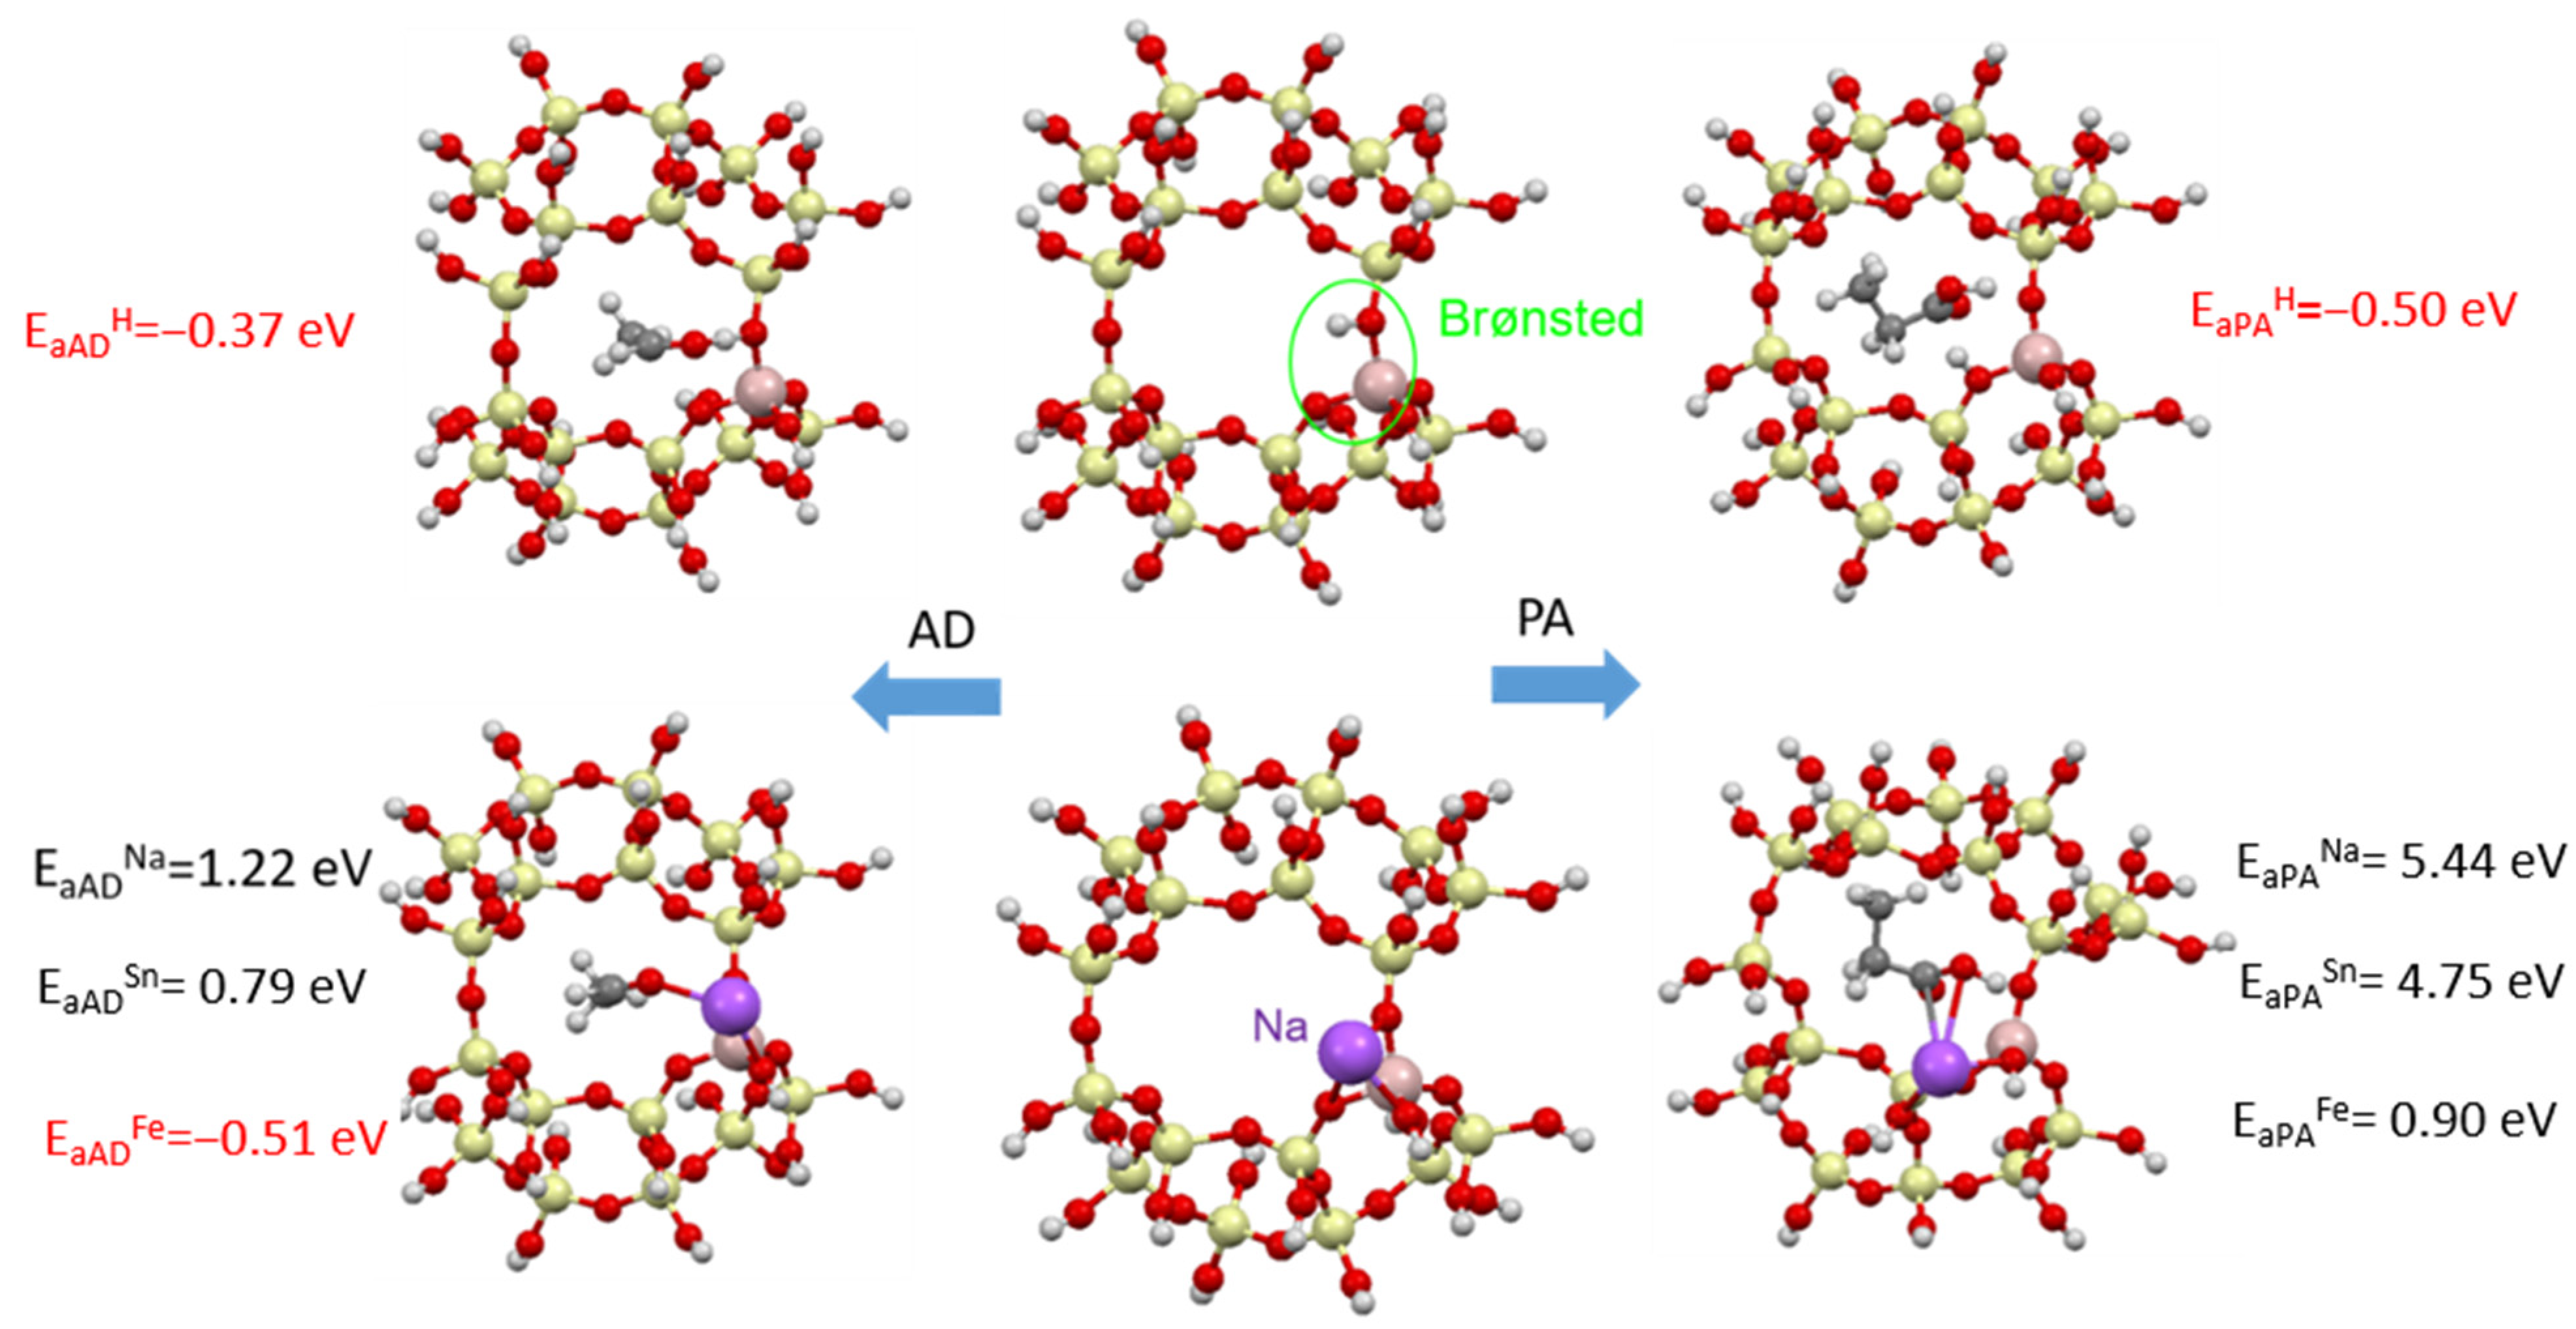
3.2.3. Adsorption of Propionic Acid (PA), Pentanoic Acid (VA) and Octanoic Acid (OA)
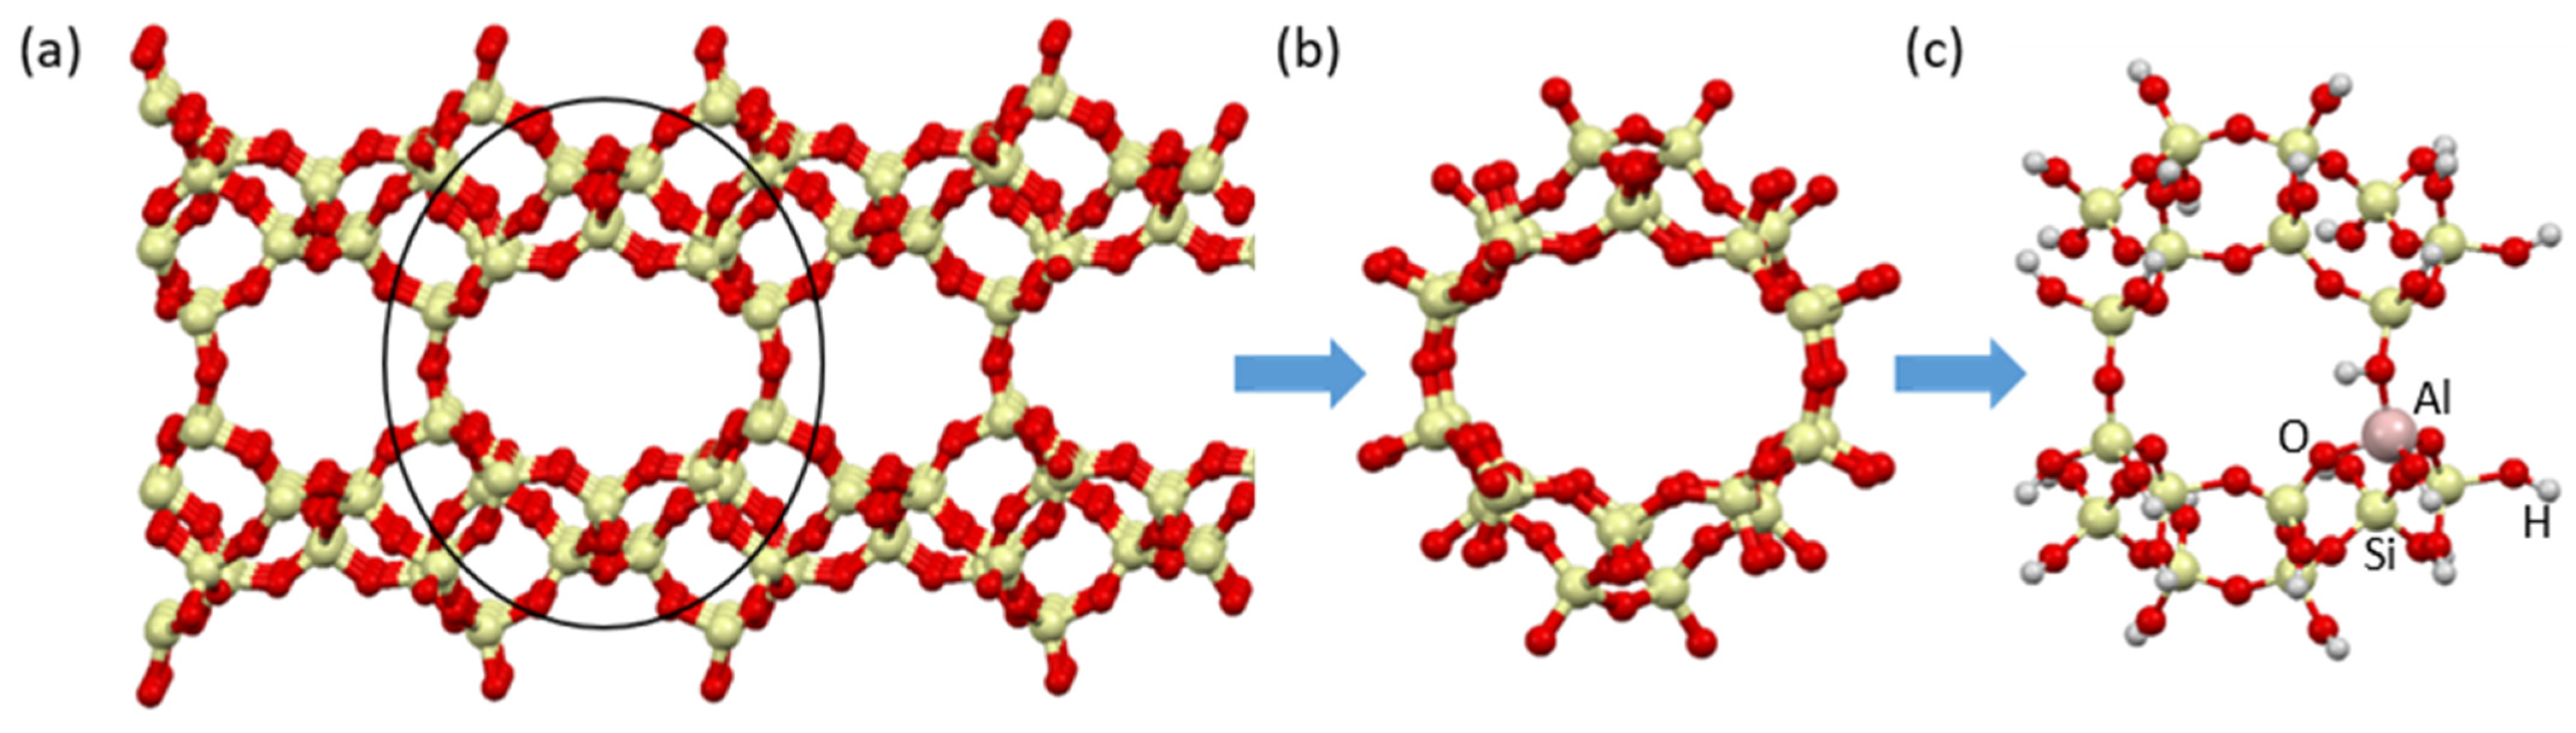
3.3. Theoretical Modelling
3.3.1. Modeling the Odors Adsorption Process
Summary
- -
- Stabilization of all groups of odorous substances on clinoptilolite supercell walls occurs near Brønsted-type acid centers (-Al-OH), so increasing the number of acid centers will increase the sorption properties of clinoptilolite (Ea < 0)
- -
- The presence of alkali metals and transition metals (Sn or Fe) does not favor the adsorption of most odorous substances (Ea > 0)
- -
- It is possible to trap long odorants (e.g., octanoic acid with a chain length of 11.1 Å) in clinoptilolite supercells (about 12 Å in size).
4. Conclusions
- -
- A fraction of 3–4 mm CLI most favorable for removal of VA and PA.
- -
- Hierarchization of 3–4 mm CLI with hydrochloric acid is favorable for the removal efficiency of AD and OA only.
- -
- Fractions of 1–2 mm and 3–4 mm CLI have sufficient stability for dimethylamine removal.
- -
- Transition metals and modified synthetic zeolite should absolutely not be introduced into the zeolite mixture for odor adsorption purposes. This is because they deteriorate the removal efficiency of most of the tested odorous substances and may cause unfavorable processes (e.g., catalytic), which may lead to the formation of new unfavorable substances (including odorous substances).
- -
- The use of a fine clinoptilolite fraction (less than 0.2 mm, 80%) with the addition of aluminosilicate-based binders (20%) granulated to a grain size of 3–5 mm shows promising adsorption properties. When choosing between pure clinoptilolite and granule fractions, economic factors (price of formulation) should be taken into account, as there is little difference in efficiency of 5–10% for AD adsorption.
Author Contributions
Funding
Institutional Review Board Statement
Informed Consent Statement
Data Availability Statement
Conflicts of Interest
References
- Bilgin, O. Natural Zeolite Sample and Investigation Its Use in Oil Bleaching Sector. IOP Conf. Ser. Earth Environ. Sci. 2017, 95, 042067. [Google Scholar] [CrossRef]
- Delkash, M.; Ebrazi Bakhshayesh, B.; Kazemian, H. Using zeolitic adsorbents to cleanup special wastewater streams: A review. Microporous Mesoporous Mater. 2015, 214, 224–241. [Google Scholar] [CrossRef]
- Ates, A.; Hardacre, C. The effect of various treatment conditions on natural zeolites: Ion exchange, acidic, thermal and steam treatments. J. Colloid Interface Sci. 2012, 372, 130–140. [Google Scholar] [CrossRef]
- Tišler, Z.; Hrachovcová, K.; Svobodová, E.; Šafář, J.; Pelíšková, L. Acid and Thermal Treatment of Alkali-Activated Zeolite Foams. Minerals 2019, 9, 719. [Google Scholar] [CrossRef]
- Russo, A.V.; Andrade, C.V.; De Angelis, L.E.; Jacobo, S.E. Adsorption and catalytic oxidation of organic pollutants using Fe-zeolite. Water Sci. Technol. 2018, 77, 939–947. [Google Scholar] [CrossRef]
- Uçar, S.; Evcin, A.; Uçar, M.; Alibeyli, R.; Majdan, M. Removal of Phenol and Chlorophenols from Aquatic System Using Activated Clinoptilolite. HJBC 2015, 43, 235–249. [Google Scholar]
- Fuss, V.L.B.; Bruj, G.; Dordai, L.; Roman, M.; Cadar, O.; Becze, A. Evaluation of the Impact of Different Natural Zeolite Treatments on the Capacity of Eliminating/Reducing Odors and Toxic Compounds. Materials 2021, 14, 3724. [Google Scholar] [CrossRef]
- Kowalska, J. Szkodliwe czynniki chemiczne w placówkach gastronomicznych. Bezpieczeństwo Pr. 2009, 5, 14–16. [Google Scholar]
- Vainiotalo, S.; Matveinen, K. Cooking fumes as a hygienic problem in the food and catering industries. Am. Ind. Hyg. Assoc. J. 1993, 54, 376–382. [Google Scholar] [CrossRef]
- Zapór, L.; Kowalska, J. Zagrożenia Biologiczne i Chemiczne w Małych Zakładach Gastronomicznych; Centralny Instytut Ochrony Pracy—Państwowy Instytut Badawczy: Warszawa, Poland, 2010; ISBN 978-83-7373-093-9. [Google Scholar]
- Kośmider, J.; Mazur-Chrzanowska, B.; Wyszyński, B. Odory; Wydawnictwo Naukowe PWN: Warszawa, Poland, 2012; ISBN 978-83-01-13744-1. [Google Scholar]
- Huang, Y.; Wang, W.; Feng, Q.; Dong, F. Preparation of magnetic clinoptilolite/CoFe2O4 composites for removal of Sr2+ from aqueous solutions: Kinetic, equilibrium, and thermodynamic studies. J. Saudi Chem. Soc. 2017, 21, 58–66. [Google Scholar] [CrossRef]
- Chang, C.C.; Cho, H.J.; Wang, Z.; Wang, X.; Fan, W. Fluoride-free synthesis of a Sn-BEA catalyst by dry gel conversion. Green Chem. 2015, 17, 2943. [Google Scholar] [CrossRef]
- Cho, H.J.; Gould, N.S.; Vattipalli, V.; Sabnis, S.; Chaikittisilp, W.; Okubo, T.; Xu, B.; Fan, W. Fabrication of hierarchical Lewis acid Sn-BEA with tunable hydrophobicity for cellulosic sugar isomerization. Microporous Mesoporous Mater. 2019, 278, 387–396. [Google Scholar] [CrossRef]
- Saramok, M.; Inger, M.; Antoniak-Jurak, K.; Szymaszek-Wawryca, A.; Samojeden, B.; Motak, M. Physicochemical Features and NH3-SCR Catalytic Performance of Natural Zeolite Modified with Iron—The Effect of Fe Loading. Catalysts 2022, 12, 731. [Google Scholar] [CrossRef]
- Vimont, A.; Thibault-Starzyk, F.; Lavalley, J.C. Structural Lewis sites in zeolite beta-role on coking of the catalyst. J. Phys. Chem. B 2000, 104, 286. [Google Scholar] [CrossRef]
- Sobuś, N.; Czekaj, I. Lactic acid conversion into acrylic acid and other products over natural and synthetic zeolite catalysts: Theoretical and experimental studies. Catal. Today 2021, 387, 172–185. [Google Scholar] [CrossRef]
- Sobuś, N.; Król, M.; Piotrowski, M.; Michorczyk, B.; Czekaj, I.; Kornaus, K.; Trenczek-Zając, A.; Komarek, S. Conversion of dihydroxyacetone to carboxylic acids on pretreated clinoptilolite modified with iron, copper, and cobalt. Catal. Commun. 2022, 171, 106509. [Google Scholar] [CrossRef]
- Sobuś, N.; Łabaj, I.; Król, M. Organic Acids from Glucose—Heterogeneous Catalysis with the Participation of Natural Zeolite. Catalysts 2023, 13, 1202. [Google Scholar] [CrossRef]
- Sobuś, N.; Król, M.; Drożdż, E.; Piotrowski, M.; Yoney, B.; Kornaus, K.; Komarek, S. Sn-MFI and Fe-MFI zeolites for fructose conversion to levulinic and lactic acids by the one-pot method. Biofuels Bioprod. Bioref. 2024. [Google Scholar] [CrossRef]
- Czekaj, I.; Brandenberger, S.; Kröcher, O. Theoretical studies of HNCO adsorption at stabilized iron complexes in the ZSM-5 framework. Microporous Mesoporous Mater. 2013, 169, 97–102. [Google Scholar] [CrossRef]
- Kurzydym, I.; Czekaj, I. Theoretical Studies on the Mechanism of deNOx Process in Cu-Zn Bimetallic System-Comparison of FAU and MFI Zeolites. Molecules 2022, 27, 300. [Google Scholar] [CrossRef]
- Kurzydym, I.; Czekaj, I. Theoretical studies of deNOx SCR over Cu-, Fe- and Mn-FAU catalysts. Chem. Chem. Technol. 2021, 15, 16–25. [Google Scholar] [CrossRef]
- Database of Zeolite Structure. International Zeolite Association (IZA). Available online: http://www.iza-structure.org/databases/ (accessed on 29 March 2023).
- Hermann, K.; Pettersson, L.G.M.; Casida, M.E.; Daul, C.; Goursot, A.; Koester, A.; Proynov, E.; St-Amant, A.; Salahub, D.R.; Carravetta, V.; et al. StoBe-deMon; deMon Software: Stockholm, Berlin, 2005. [Google Scholar]
- Perdew, J.P.; Burke, K.; Ernzerhof, M. Generalized Gradient Approximation Made Simple. Phys. Rev. Lett. 1996, 77, 3865–3868. [Google Scholar] [CrossRef]
- Hammer, B.; Hansen, L.B.; Nørskov, J.K. Improved Adsorption Energetics within Density-Functional Theory using Revised Perdew-Burke-Ernzerhof Functionals. Phys. Rev. B 1999, 59, 7413–7421. [Google Scholar] [CrossRef]
- Broclawik, E.; Salahub, D.R. Density Functional Theory and Quantum Chemistry: Metals and Metal Oxides. J. Mol. Catal. 1993, 82, 117–129. [Google Scholar] [CrossRef]


| Pollutant | Source of Emissions | MCL [mg/m3] |
|---|---|---|
| Formaldehyde | Grills | 0.5 |
| NO2 | Gas cookers and burners | 0.7 |
| CO | Cookers and burners. Fireplaces | 25 |
| CO2 | Cookers and burners. Fireplaces | 9000 |
| PAH | Wood and coal burning | 0.002 |
| HAA | Frying, toasting, grilling meat | 0.002 |
| Acroleine | Frying in fat | 0.05 |
| Acetaldehyde | Baking | 5 |
| VOC | Cooking | 0.7 |
| Dimetyloamine | Grill and grill cleaner | 9 |
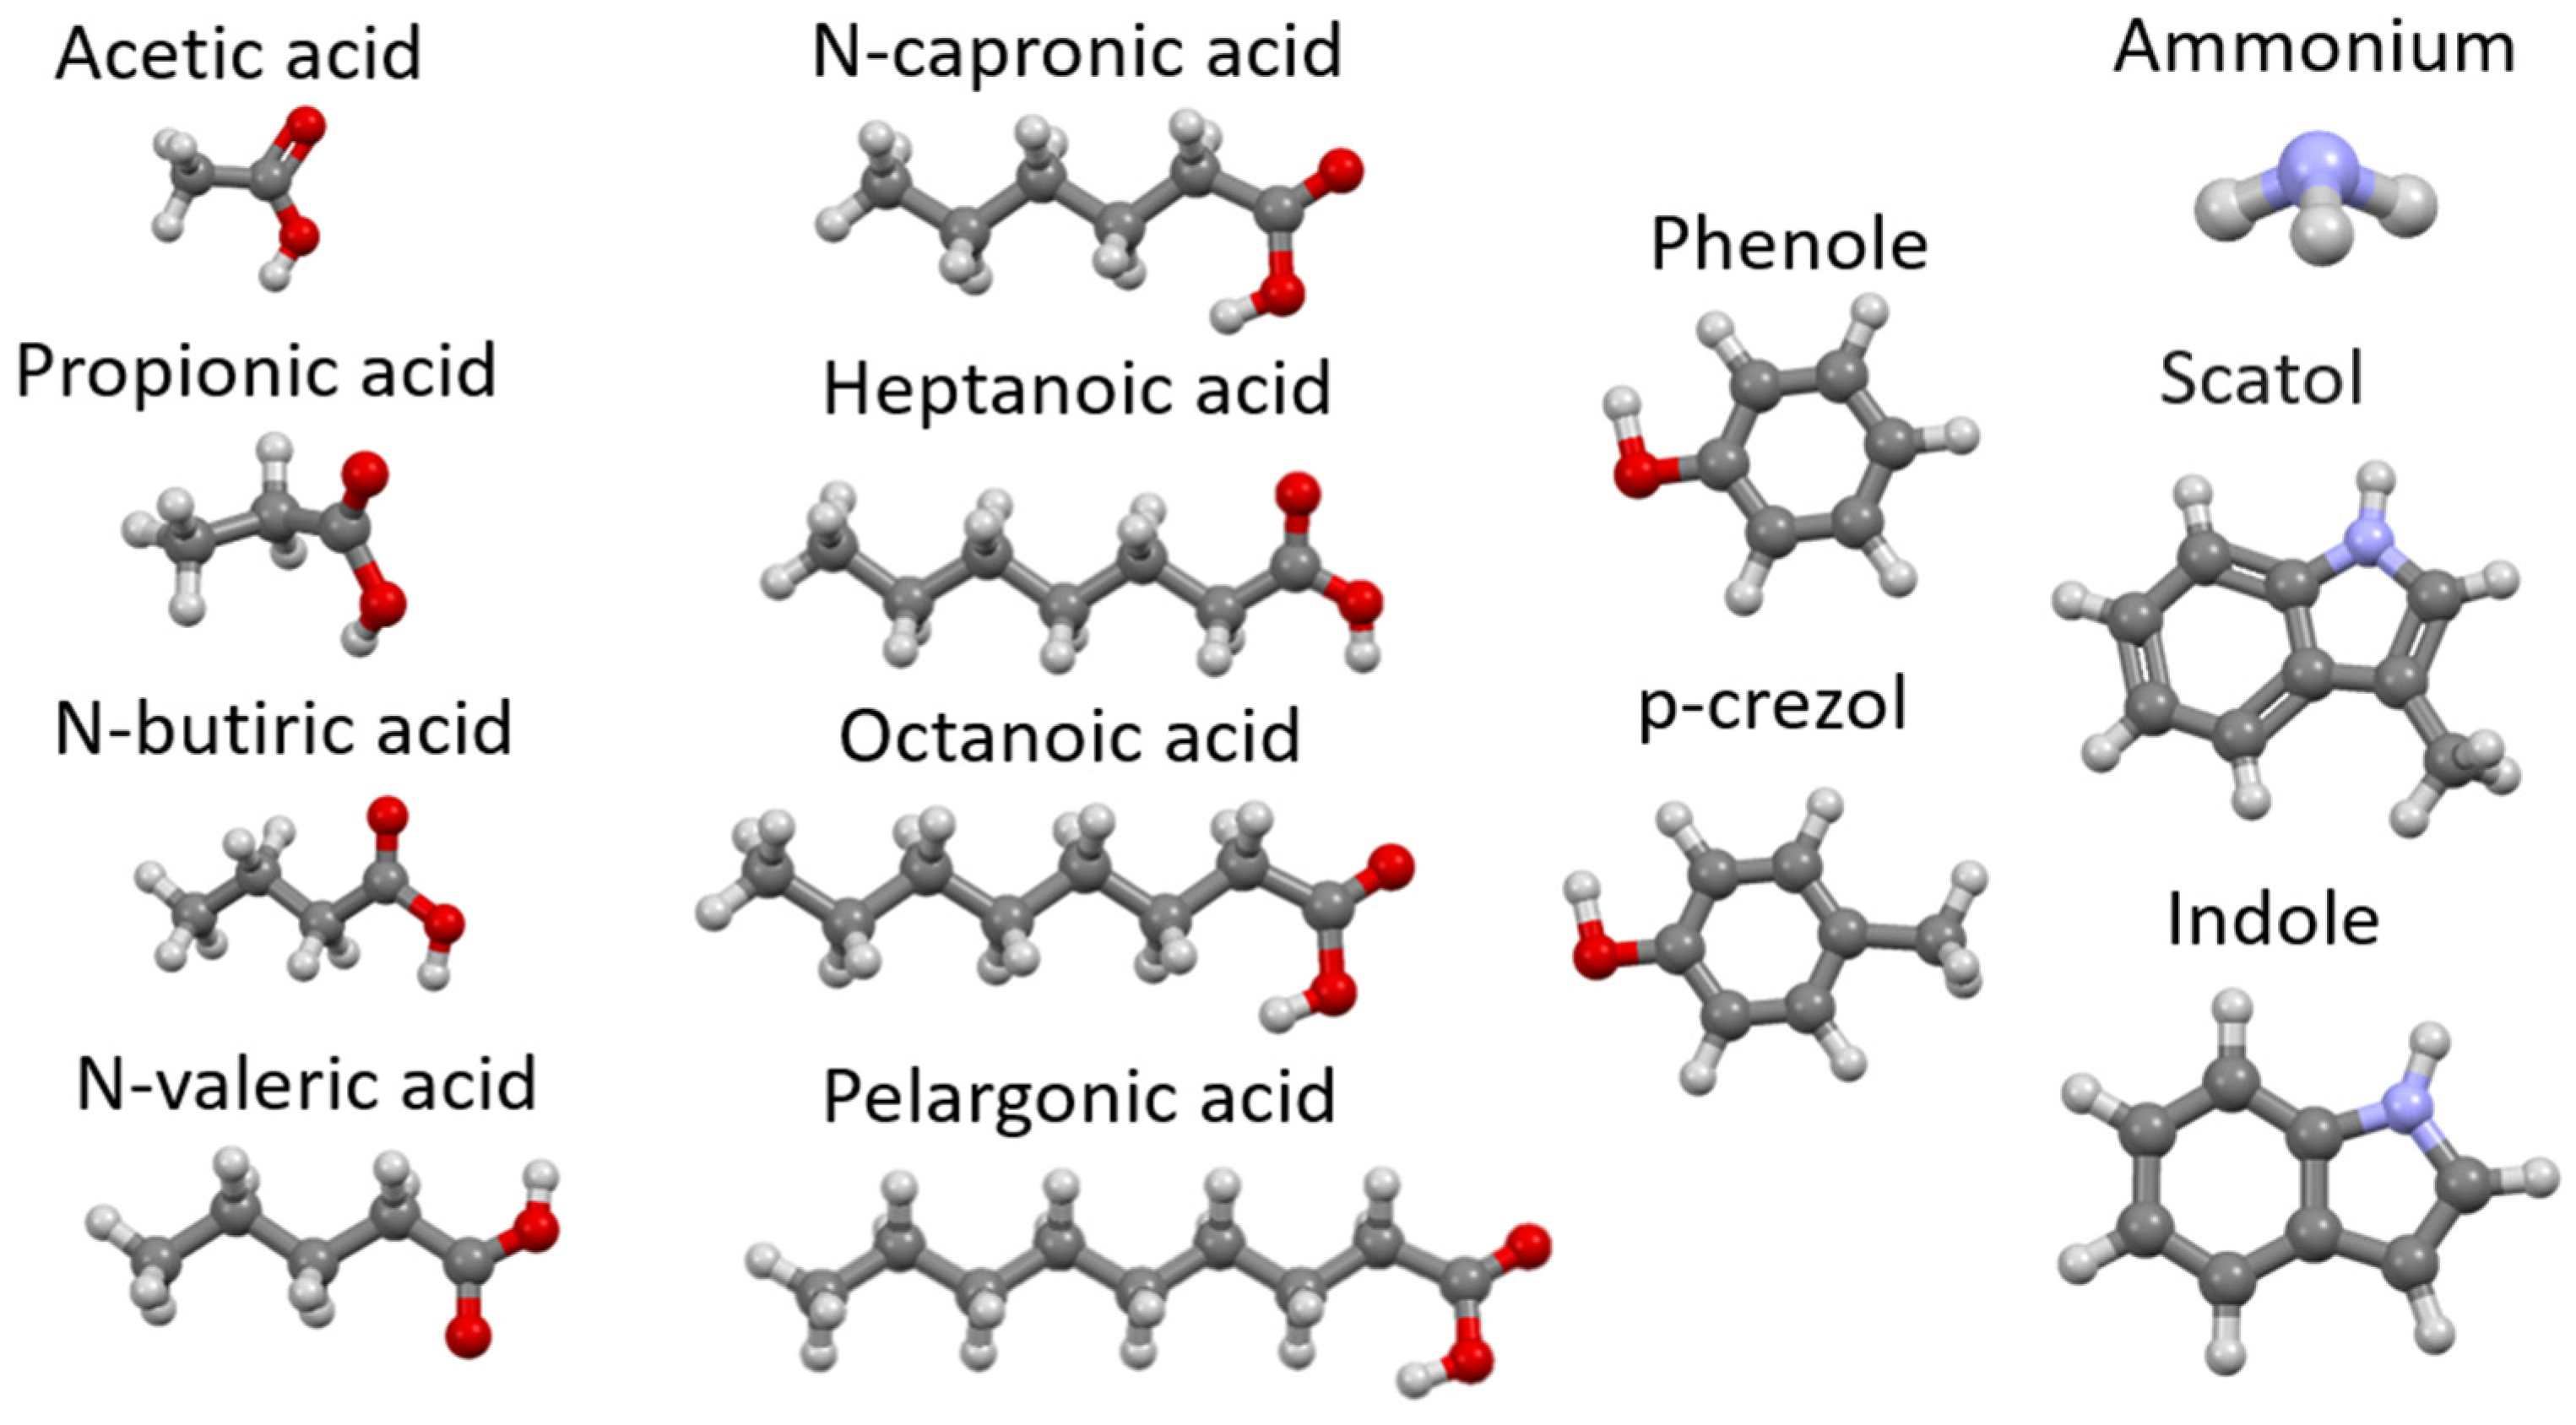
| Pollution | Concentration [mg/m3] |
|---|---|
| Ammonia | 18 |
| Hydrogen sulfide | 0.004 |
| Skatol | 0.003 |
| Indole | 0.003 |
| Phenol | 0.005 |
| p-Cresol | 0.04 |
| Acetic acid | 6.7 |
| Propionic acid | 1.1 |
| N-Butyric acid | 0.7 |
| Isobutyric acid | 0.16 |
| N-Valeric acid | 0.08 |
| Isovaleric acid | 0.21 |
| N-caproic acid | 0.01 |
| Isocaproic acid | 0.004 |
| Heptanoic acid | 0.003 |
| Octanoic acid | 0.005 |
| Pelargonic acid | 0.004 |
| Material | SBET [m2/g] | SBJH [m2/g] | Vp total BET [cm3/g] | Vp mikro [cm3/g] |
|---|---|---|---|---|
| CLI | 29 | 16 | 0.06 | 0.006 |
| ground-NH4-CLI | 30 | 17 | 0.07 | 0.006 |
| ground-Sn-CLI | 165 | 110 | 0.15 | 0.025 |
| ground-Fe-CLI | 85 | 42 | 0.11 | 0.02 |
| Na-MFI | 396 | 209 | 0.56 | 0.116 |
| Sn-MFI | 368 | 187 | 0.55 | 0.099 |
| Sn-MFI-WB | 314 | 178 | 0.53 | 0.074 |
| Fe-MFI | 311 | 132 | 0.53 | 0.097 |
| Fe-MFI-WB | 284 | 121 | 0.23 | 0.09 |
| Adsorption in the Liquid Phase | Adsorption in the Gas Phase |
|---|---|
| The process conditions were established and standardized for all odorants: duration (5 h), temperature (25–60 °C), solvent (ethanol), adsorbent mass (1 g). Every hour, samples are taken to measure the adsorption capacity. The apparatus does not require continuous supervision. For 1 zeolite + 1 odorant sample, a time of 1–5 h is allocated. Then, collected samples are subjected to gas chromatographic analysis. | The reaction charge is, for example, a 5% solution of odorant at a flow rate of 2 mL/h, injected by an infusion pump. The adsorbant then enters a mixer where it mixes with the inert gas (nitrogen) and is converted to the gas phase. Driven by the gas stream (nitrogen, 50 mL/min), the odorant vapors wash over the adsorbent bed (mass 0.5 g), where the adsorption process takes place. Then, collected samples are subjected to gas chromatographic analysis. |
Disclaimer/Publisher’s Note: The statements, opinions and data contained in all publications are solely those of the individual author(s) and contributor(s) and not of MDPI and/or the editor(s). MDPI and/or the editor(s) disclaim responsibility for any injury to people or property resulting from any ideas, methods, instructions or products referred to in the content. |
© 2024 by the authors. Licensee MDPI, Basel, Switzerland. This article is an open access article distributed under the terms and conditions of the Creative Commons Attribution (CC BY) license (https://creativecommons.org/licenses/by/4.0/).
Share and Cite
Czekaj, I.; Sobuś, N. Odors Adsorption in Zeolites Including Natural Clinoptilolite: Theoretical and Experimental Studies. Materials 2024, 17, 3088. https://doi.org/10.3390/ma17133088
Czekaj I, Sobuś N. Odors Adsorption in Zeolites Including Natural Clinoptilolite: Theoretical and Experimental Studies. Materials. 2024; 17(13):3088. https://doi.org/10.3390/ma17133088
Chicago/Turabian StyleCzekaj, Izabela, and Natalia Sobuś. 2024. "Odors Adsorption in Zeolites Including Natural Clinoptilolite: Theoretical and Experimental Studies" Materials 17, no. 13: 3088. https://doi.org/10.3390/ma17133088
APA StyleCzekaj, I., & Sobuś, N. (2024). Odors Adsorption in Zeolites Including Natural Clinoptilolite: Theoretical and Experimental Studies. Materials, 17(13), 3088. https://doi.org/10.3390/ma17133088