
Development of Negative-Temperature Cement Emulsified Asphalt Spraying Materials Based on Spraying Performance and Rheological Parameters
Abstract
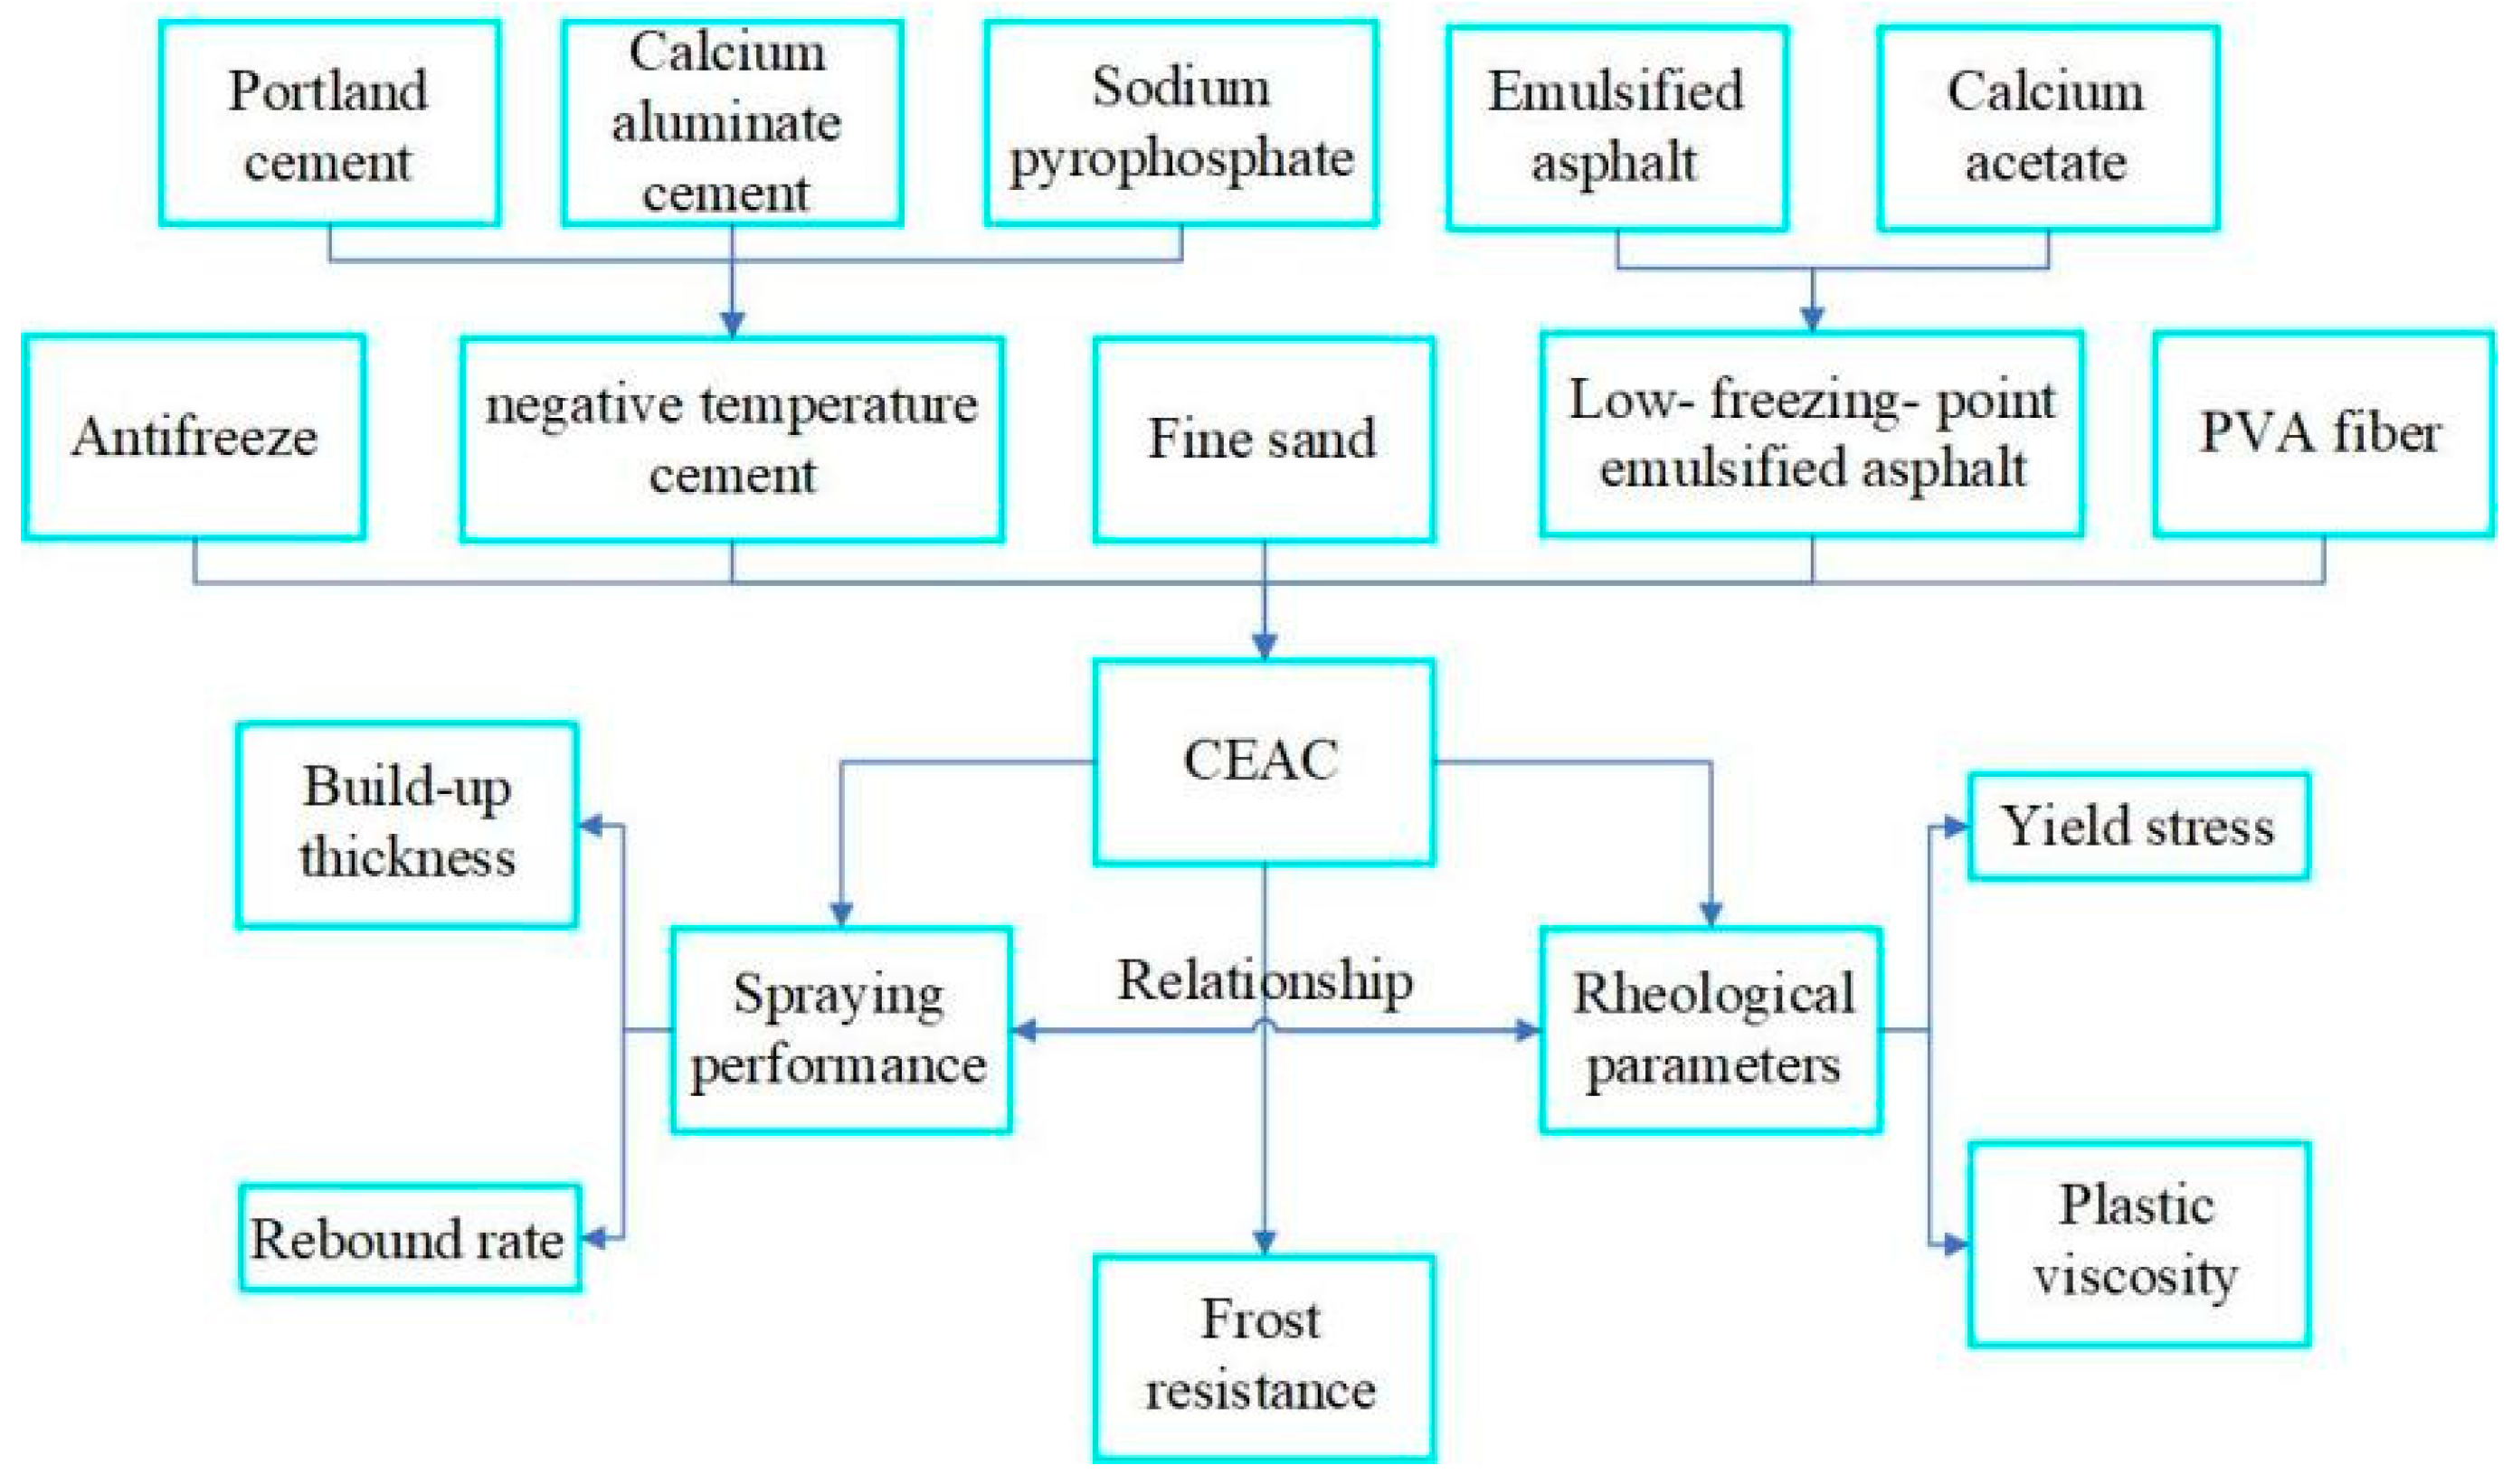
:1. Introduction
2. Experimental Program
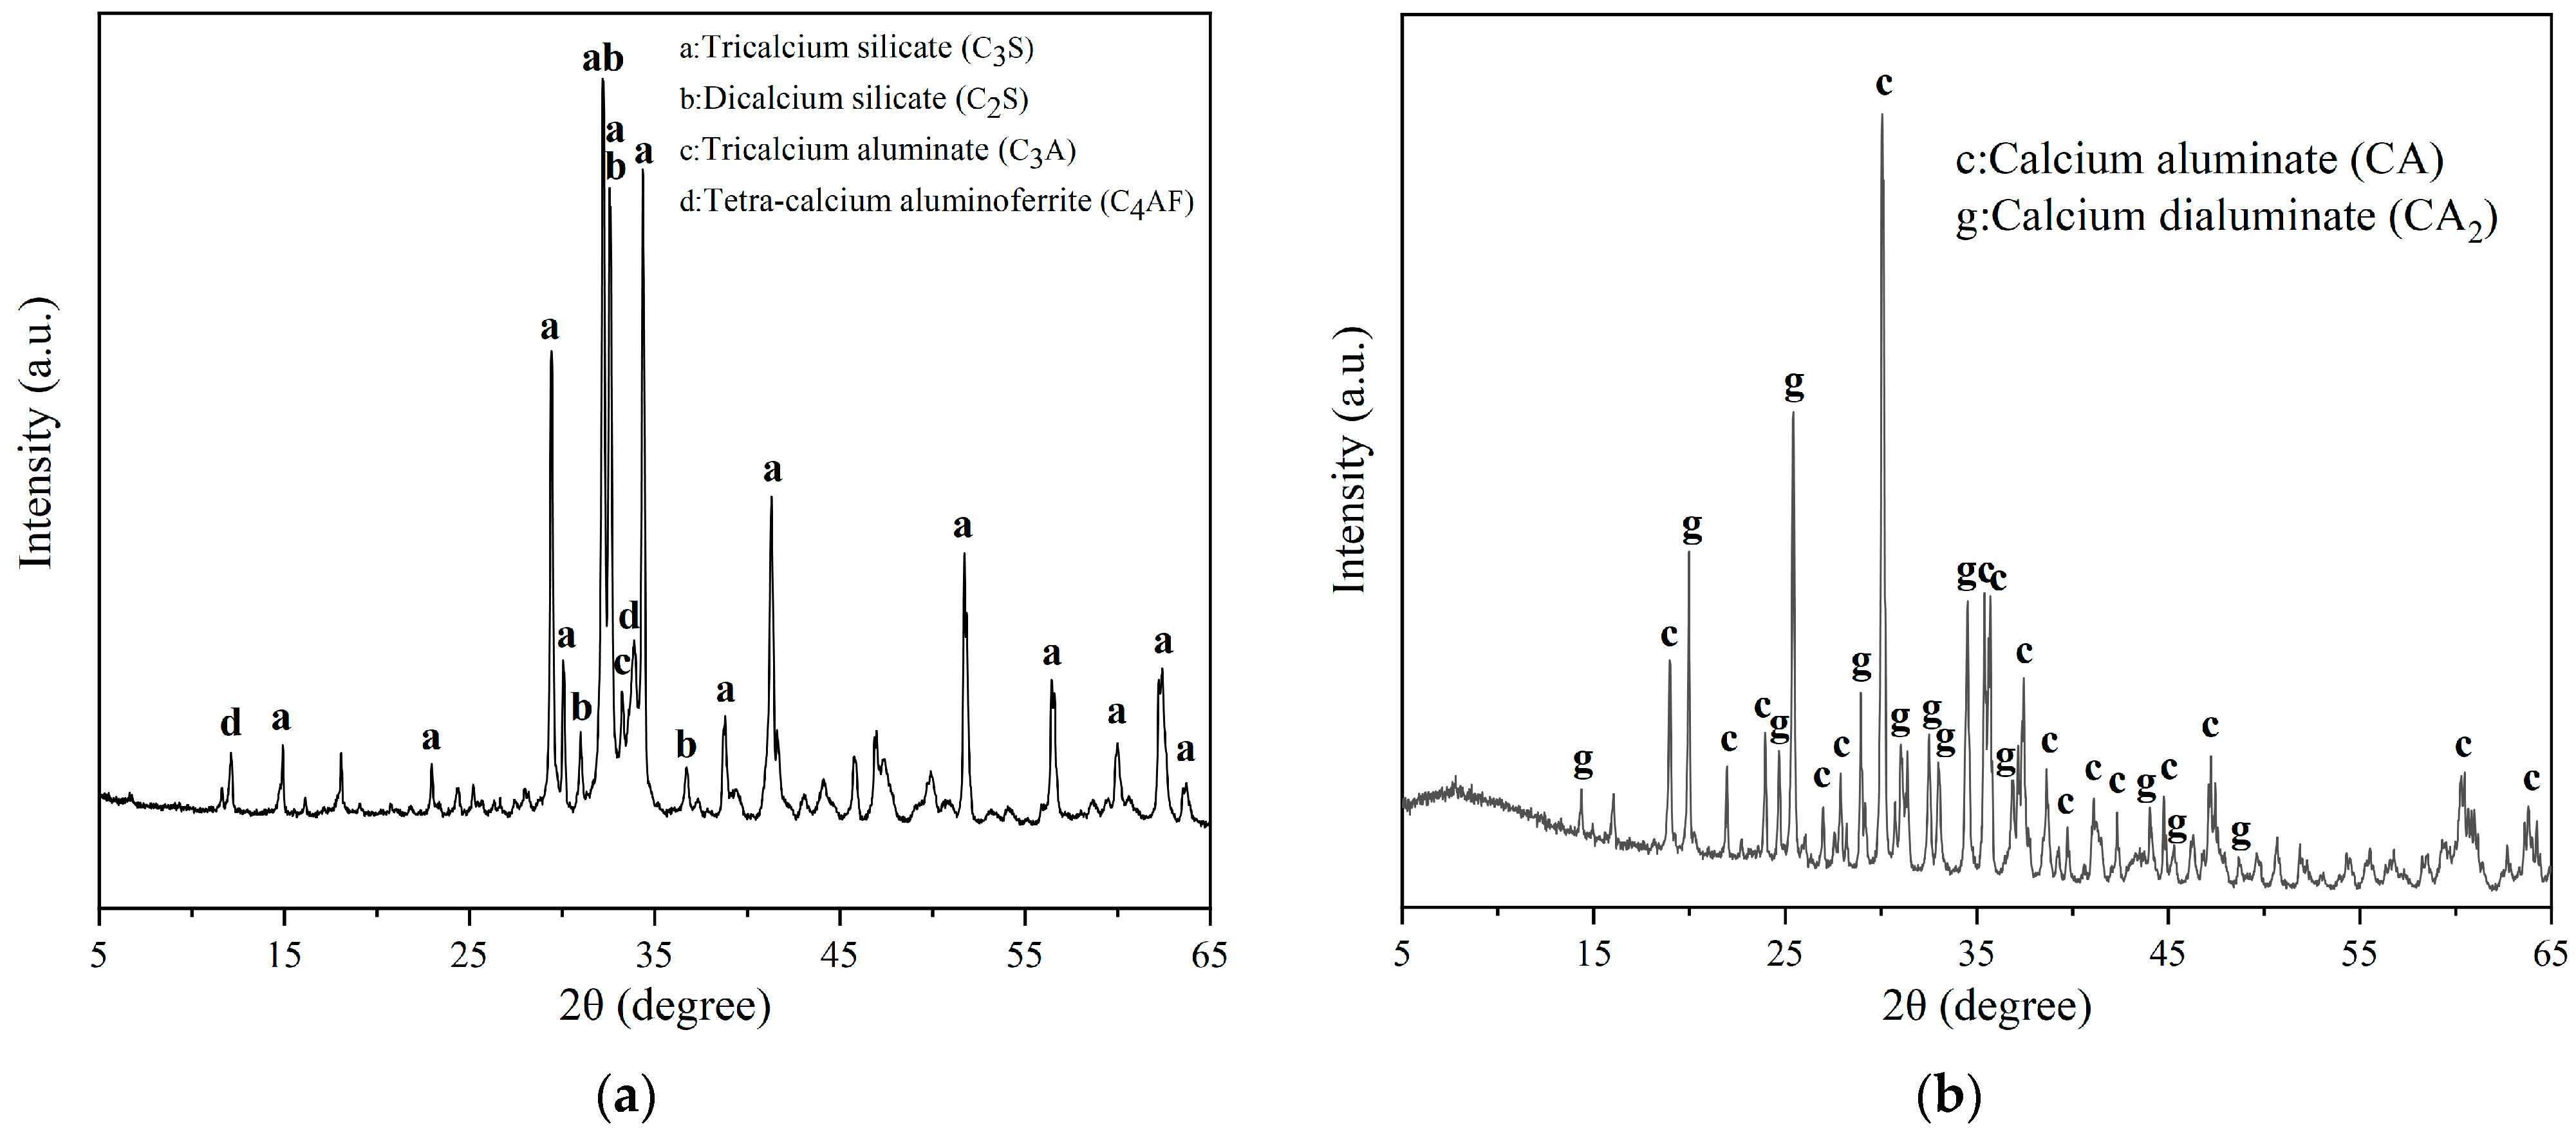
2.1. Materials
2.2. Mixing Ratio of CEAC
2.3. Experiment Methods
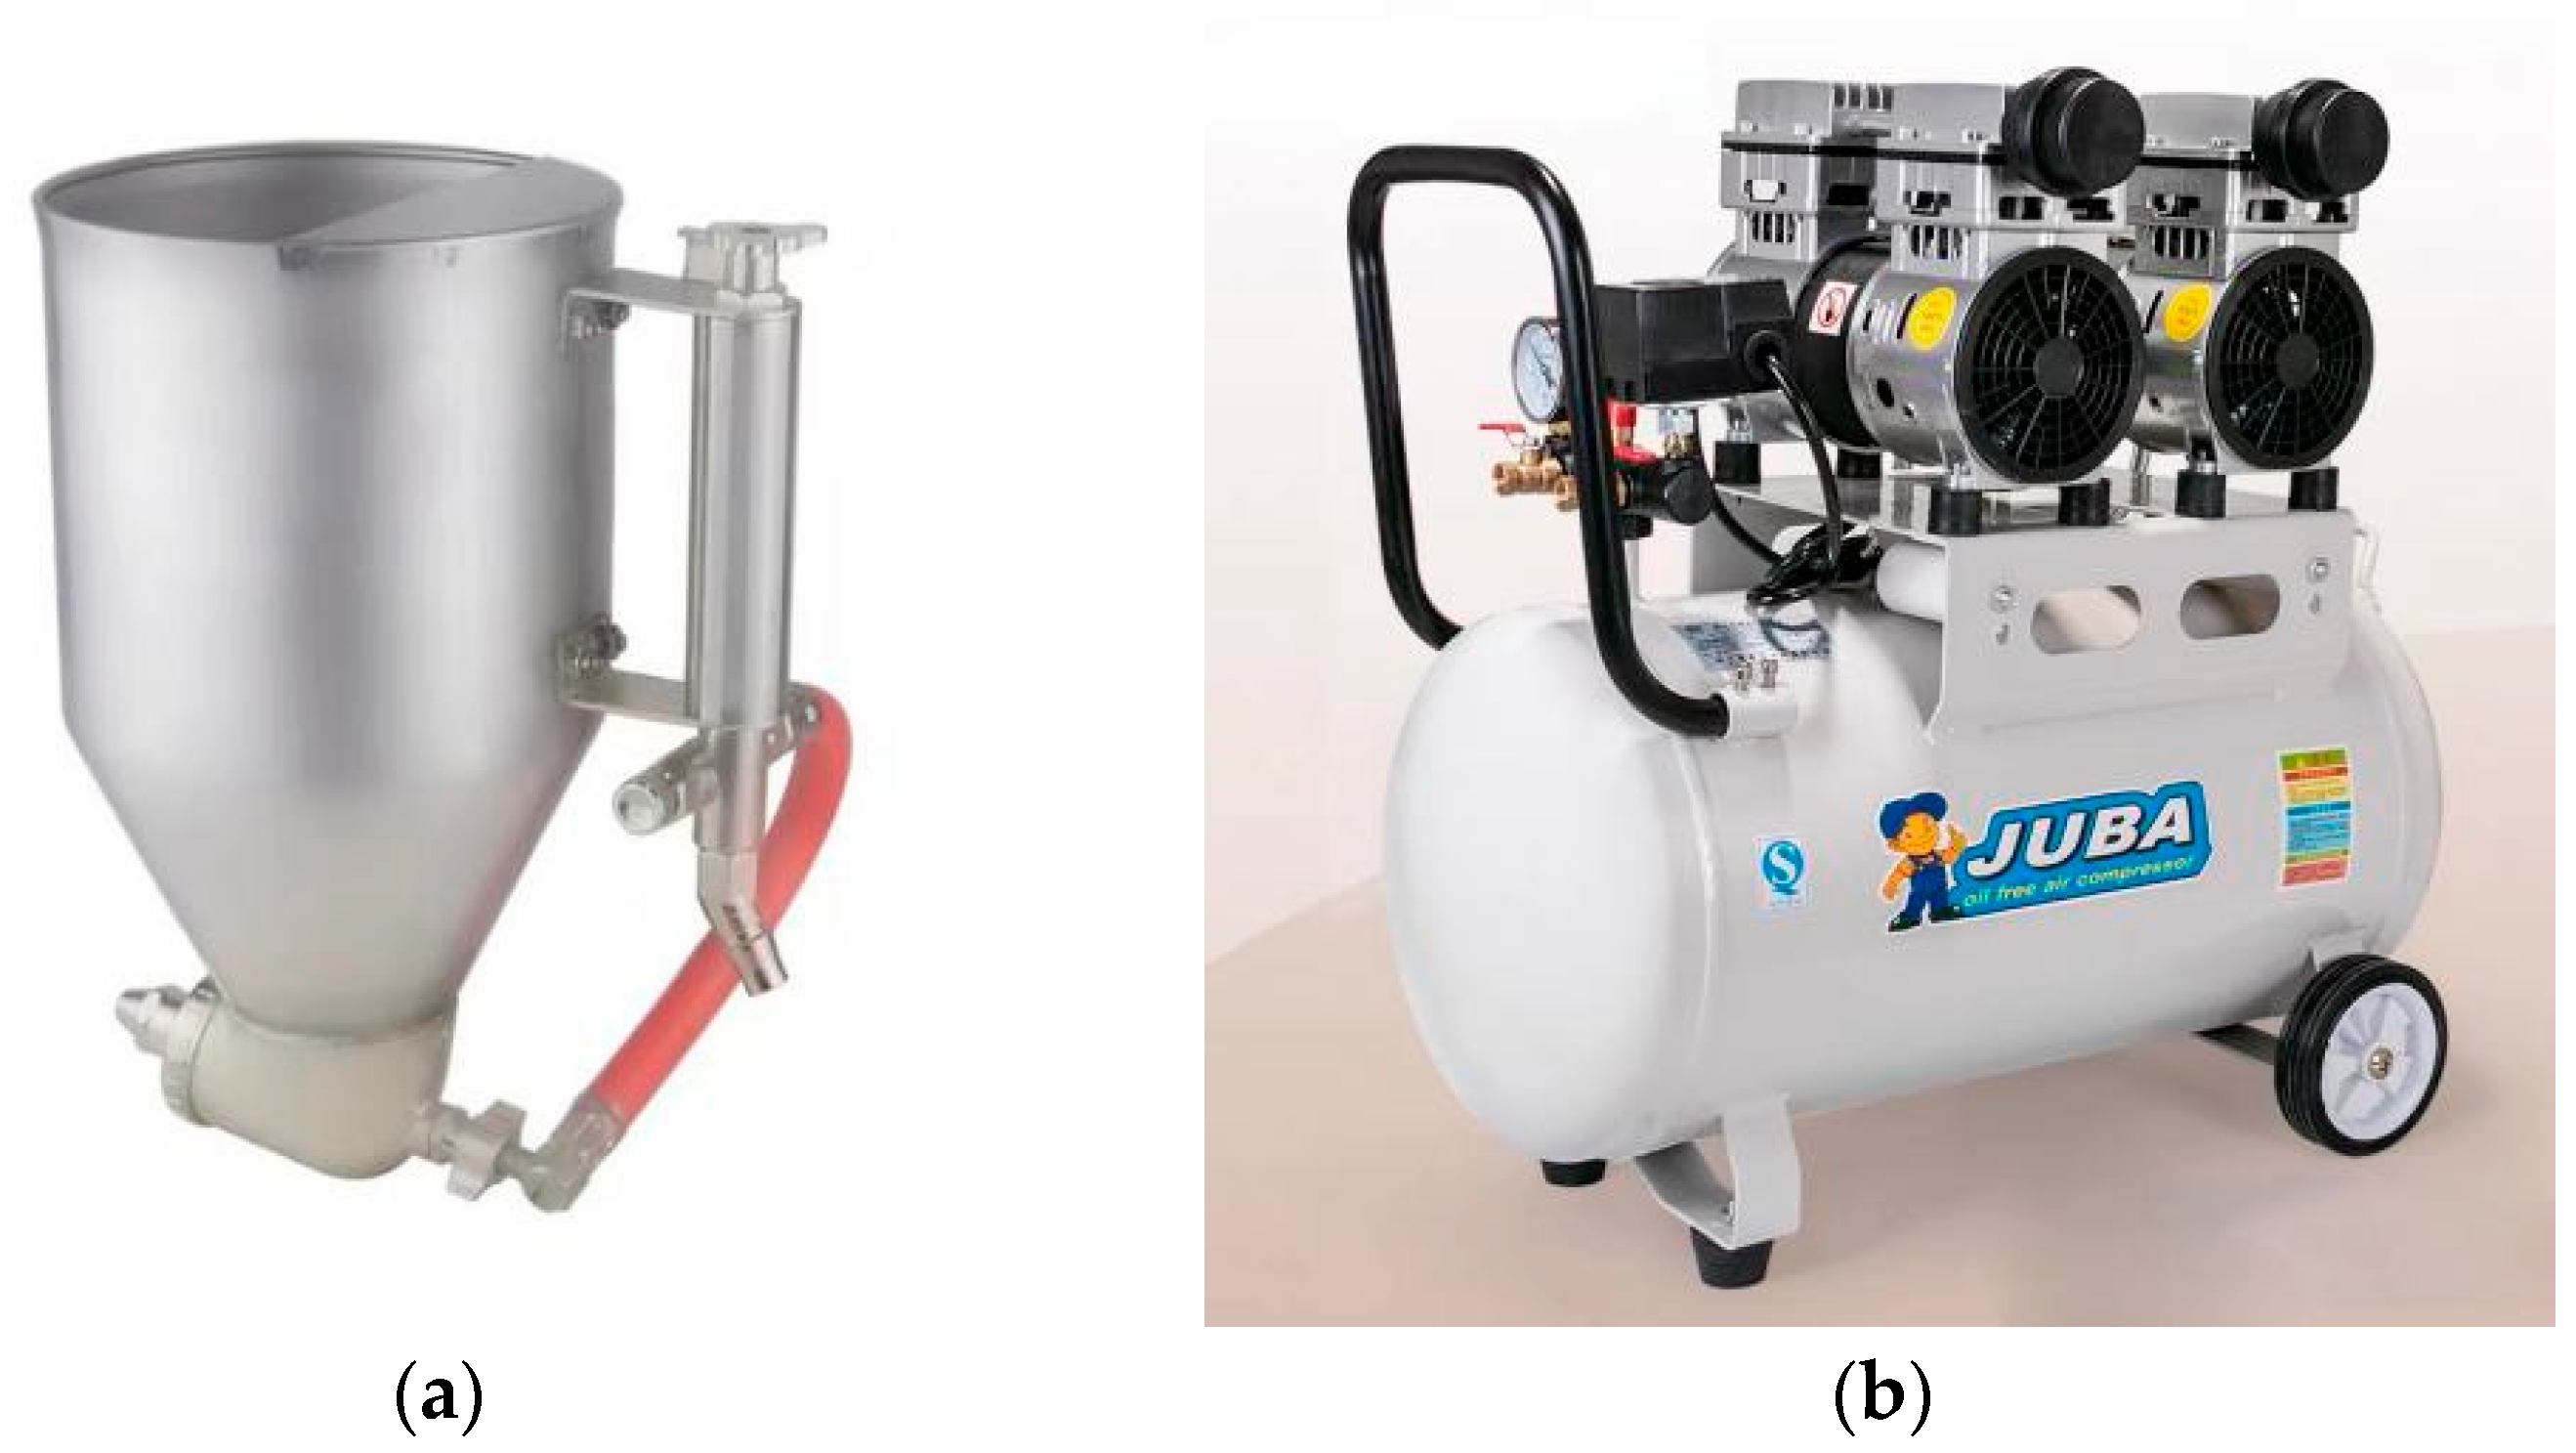
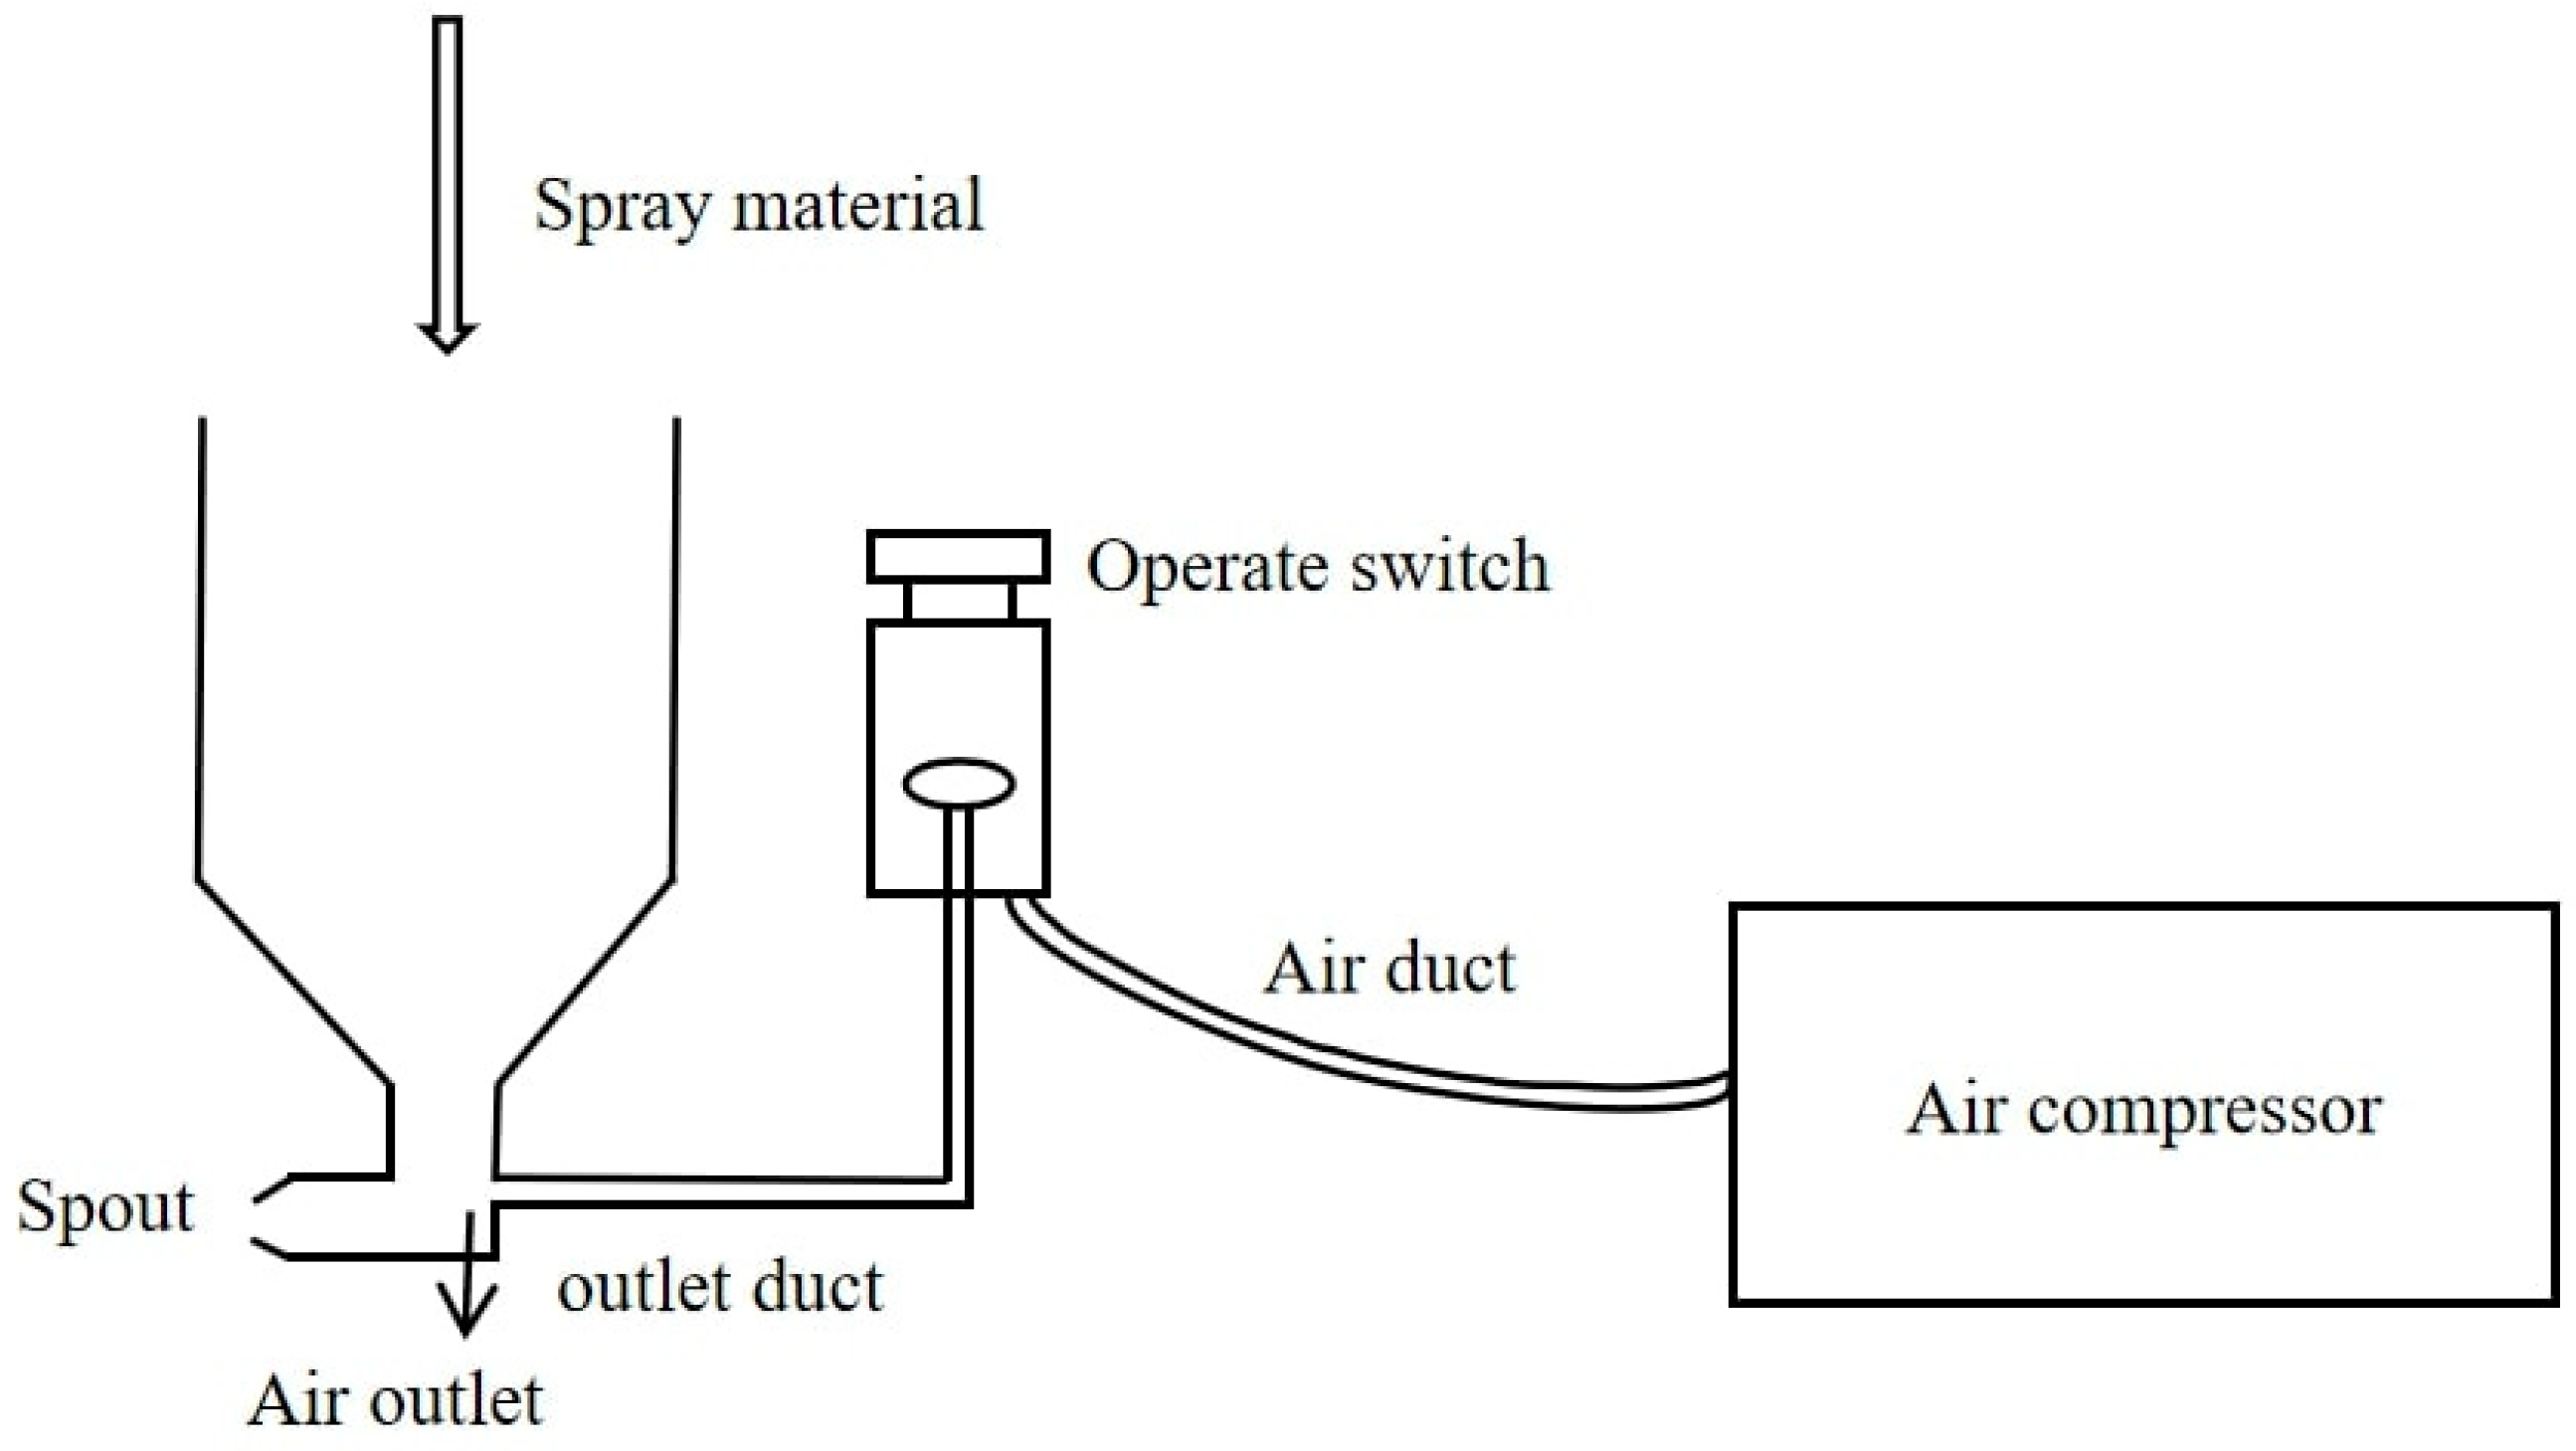
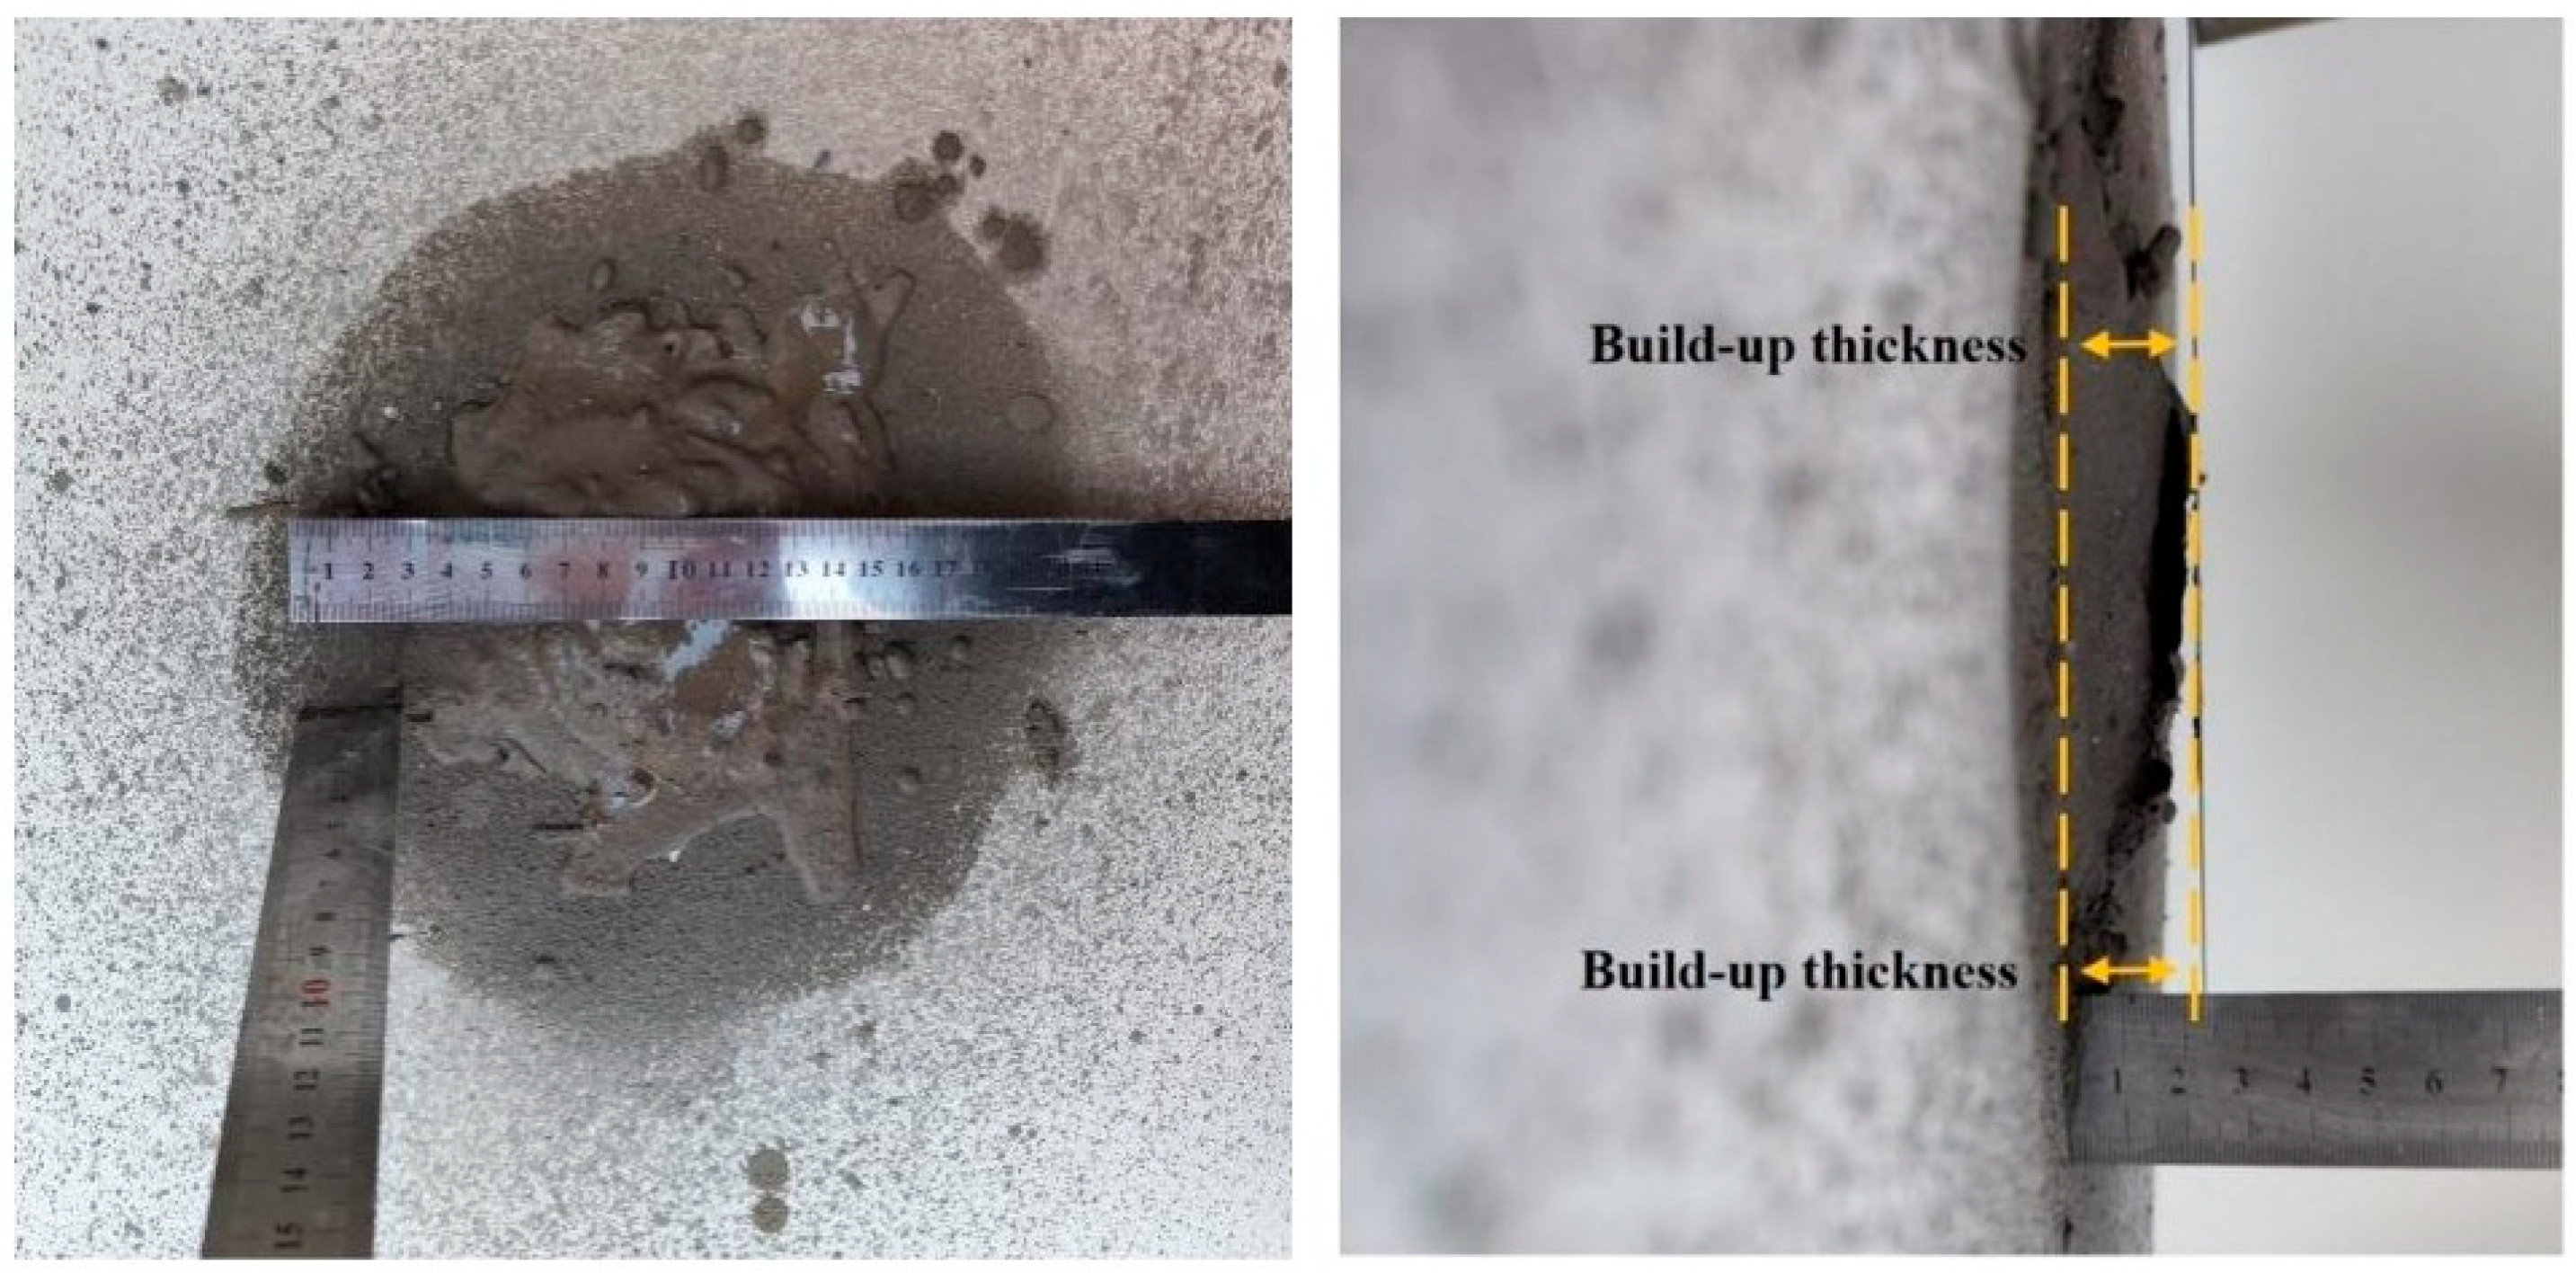
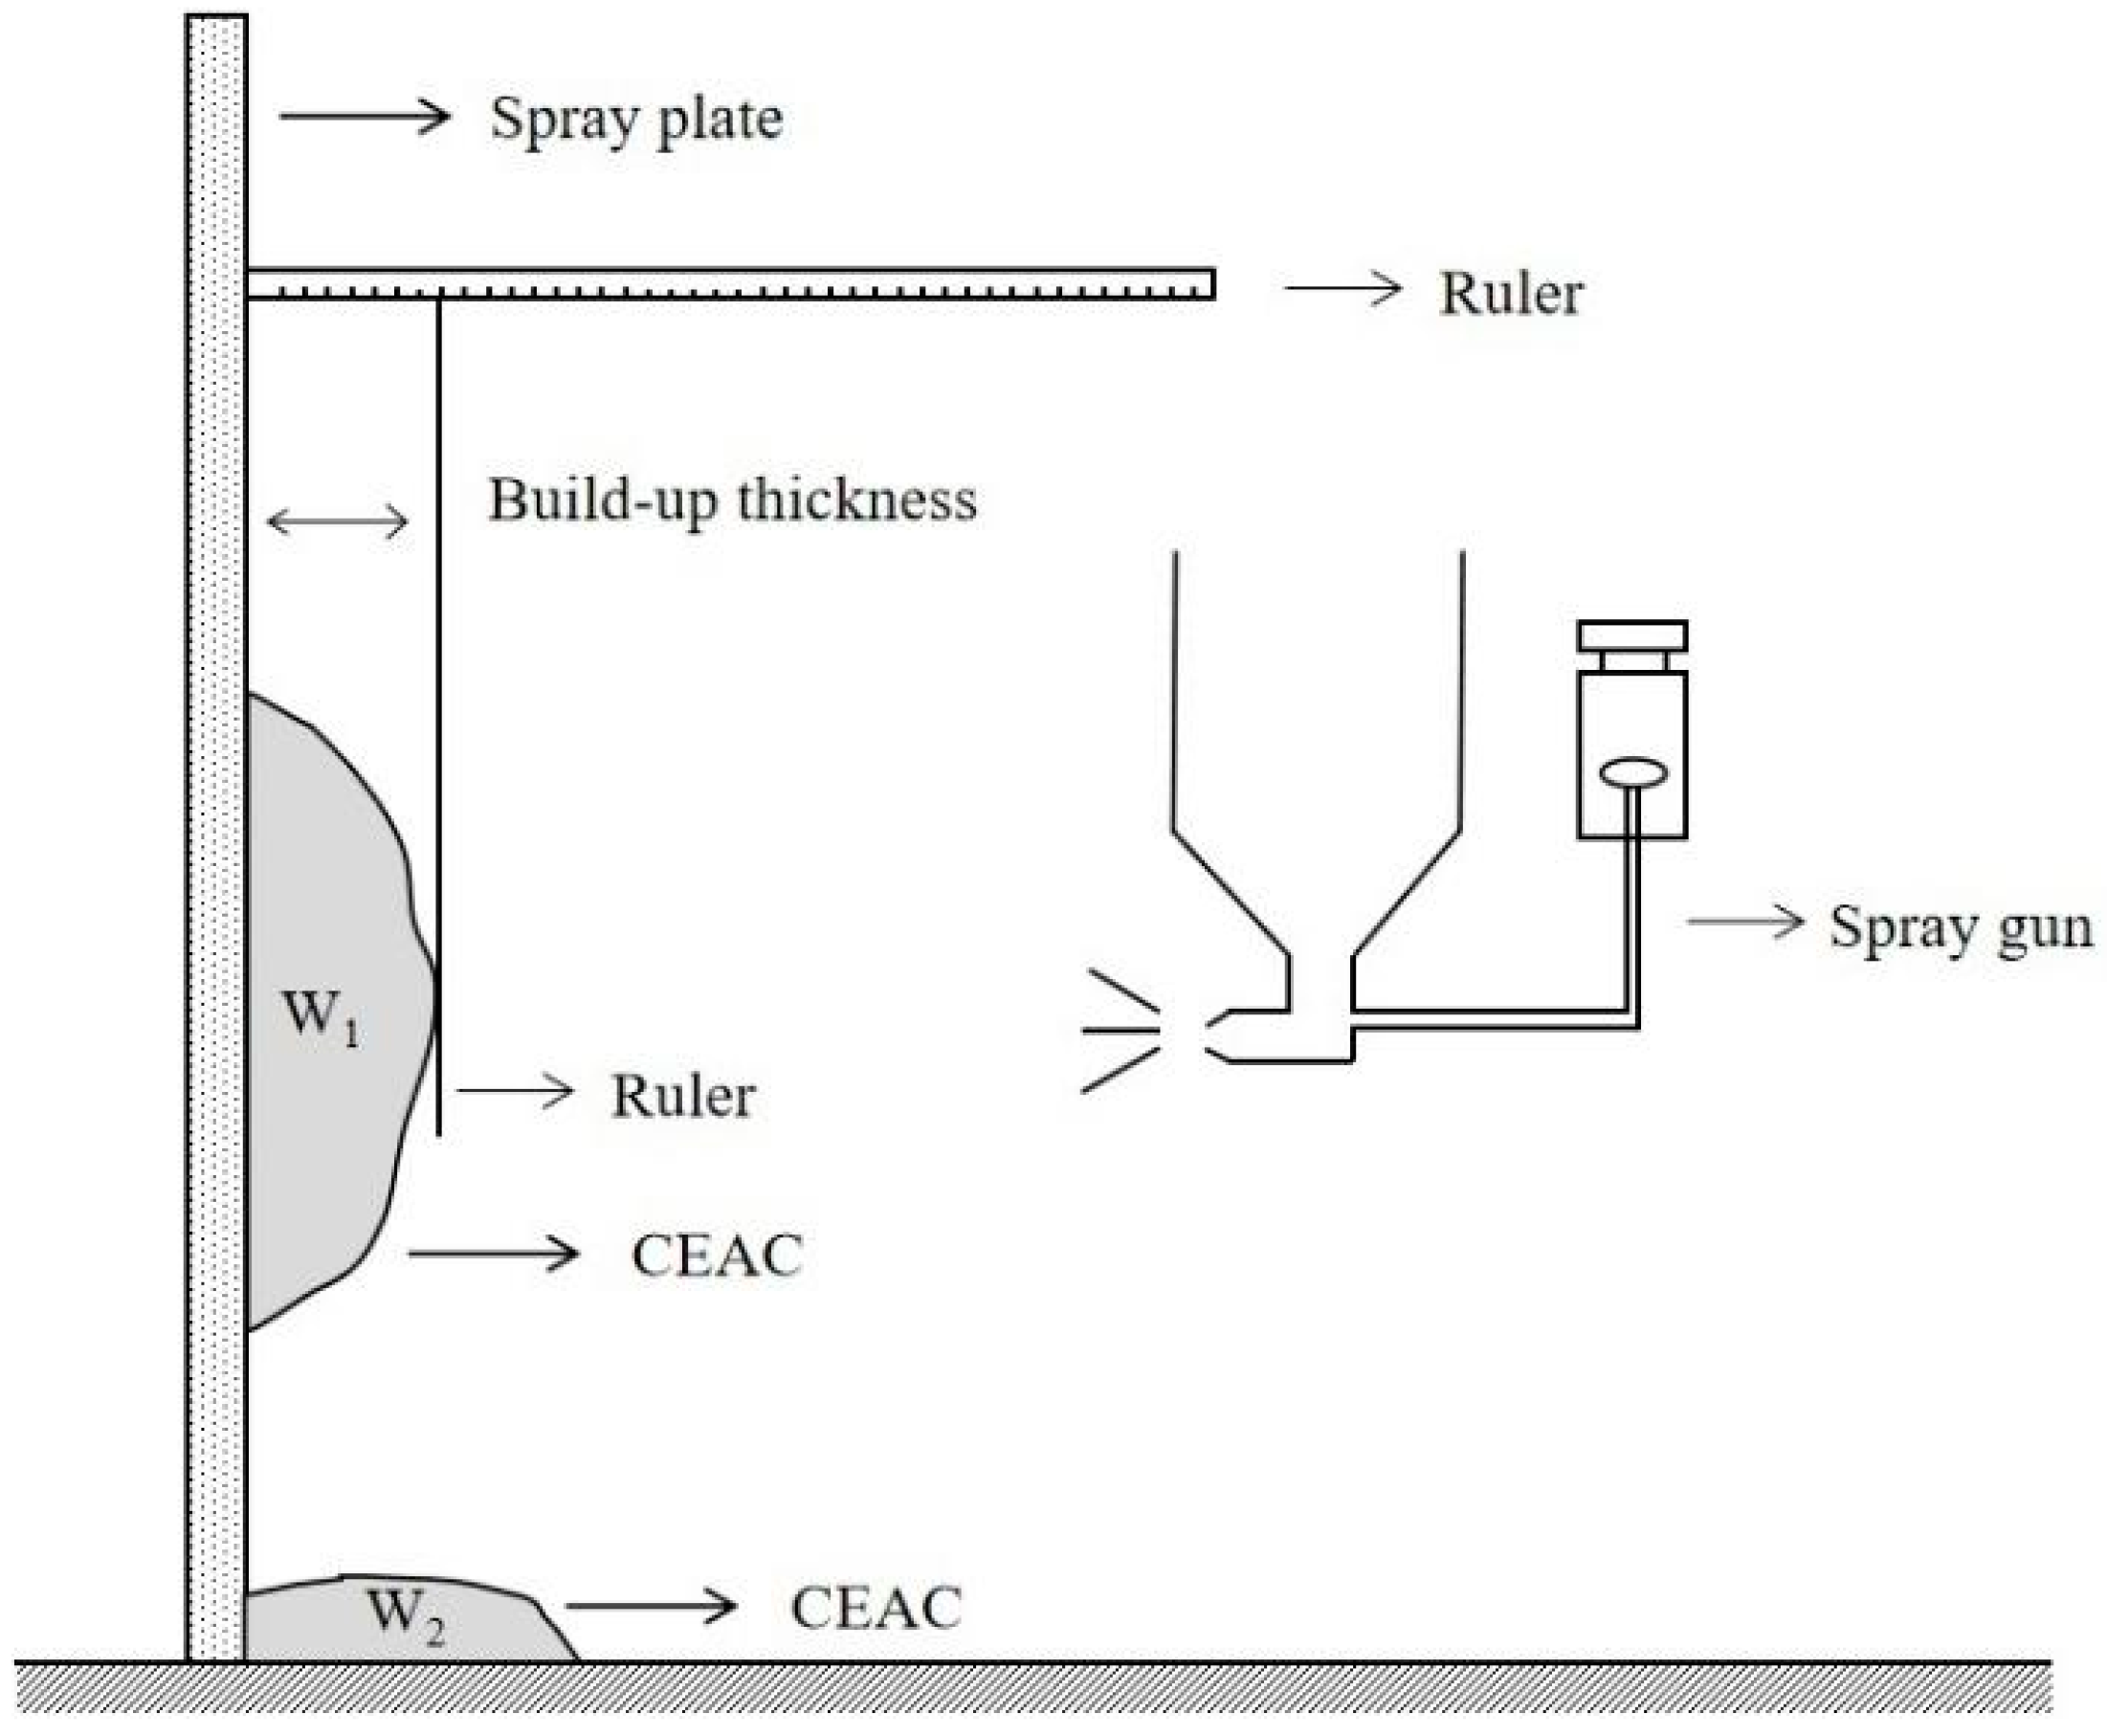
2.3.1. Spraying Test
2.3.2. Spraying Performance Test
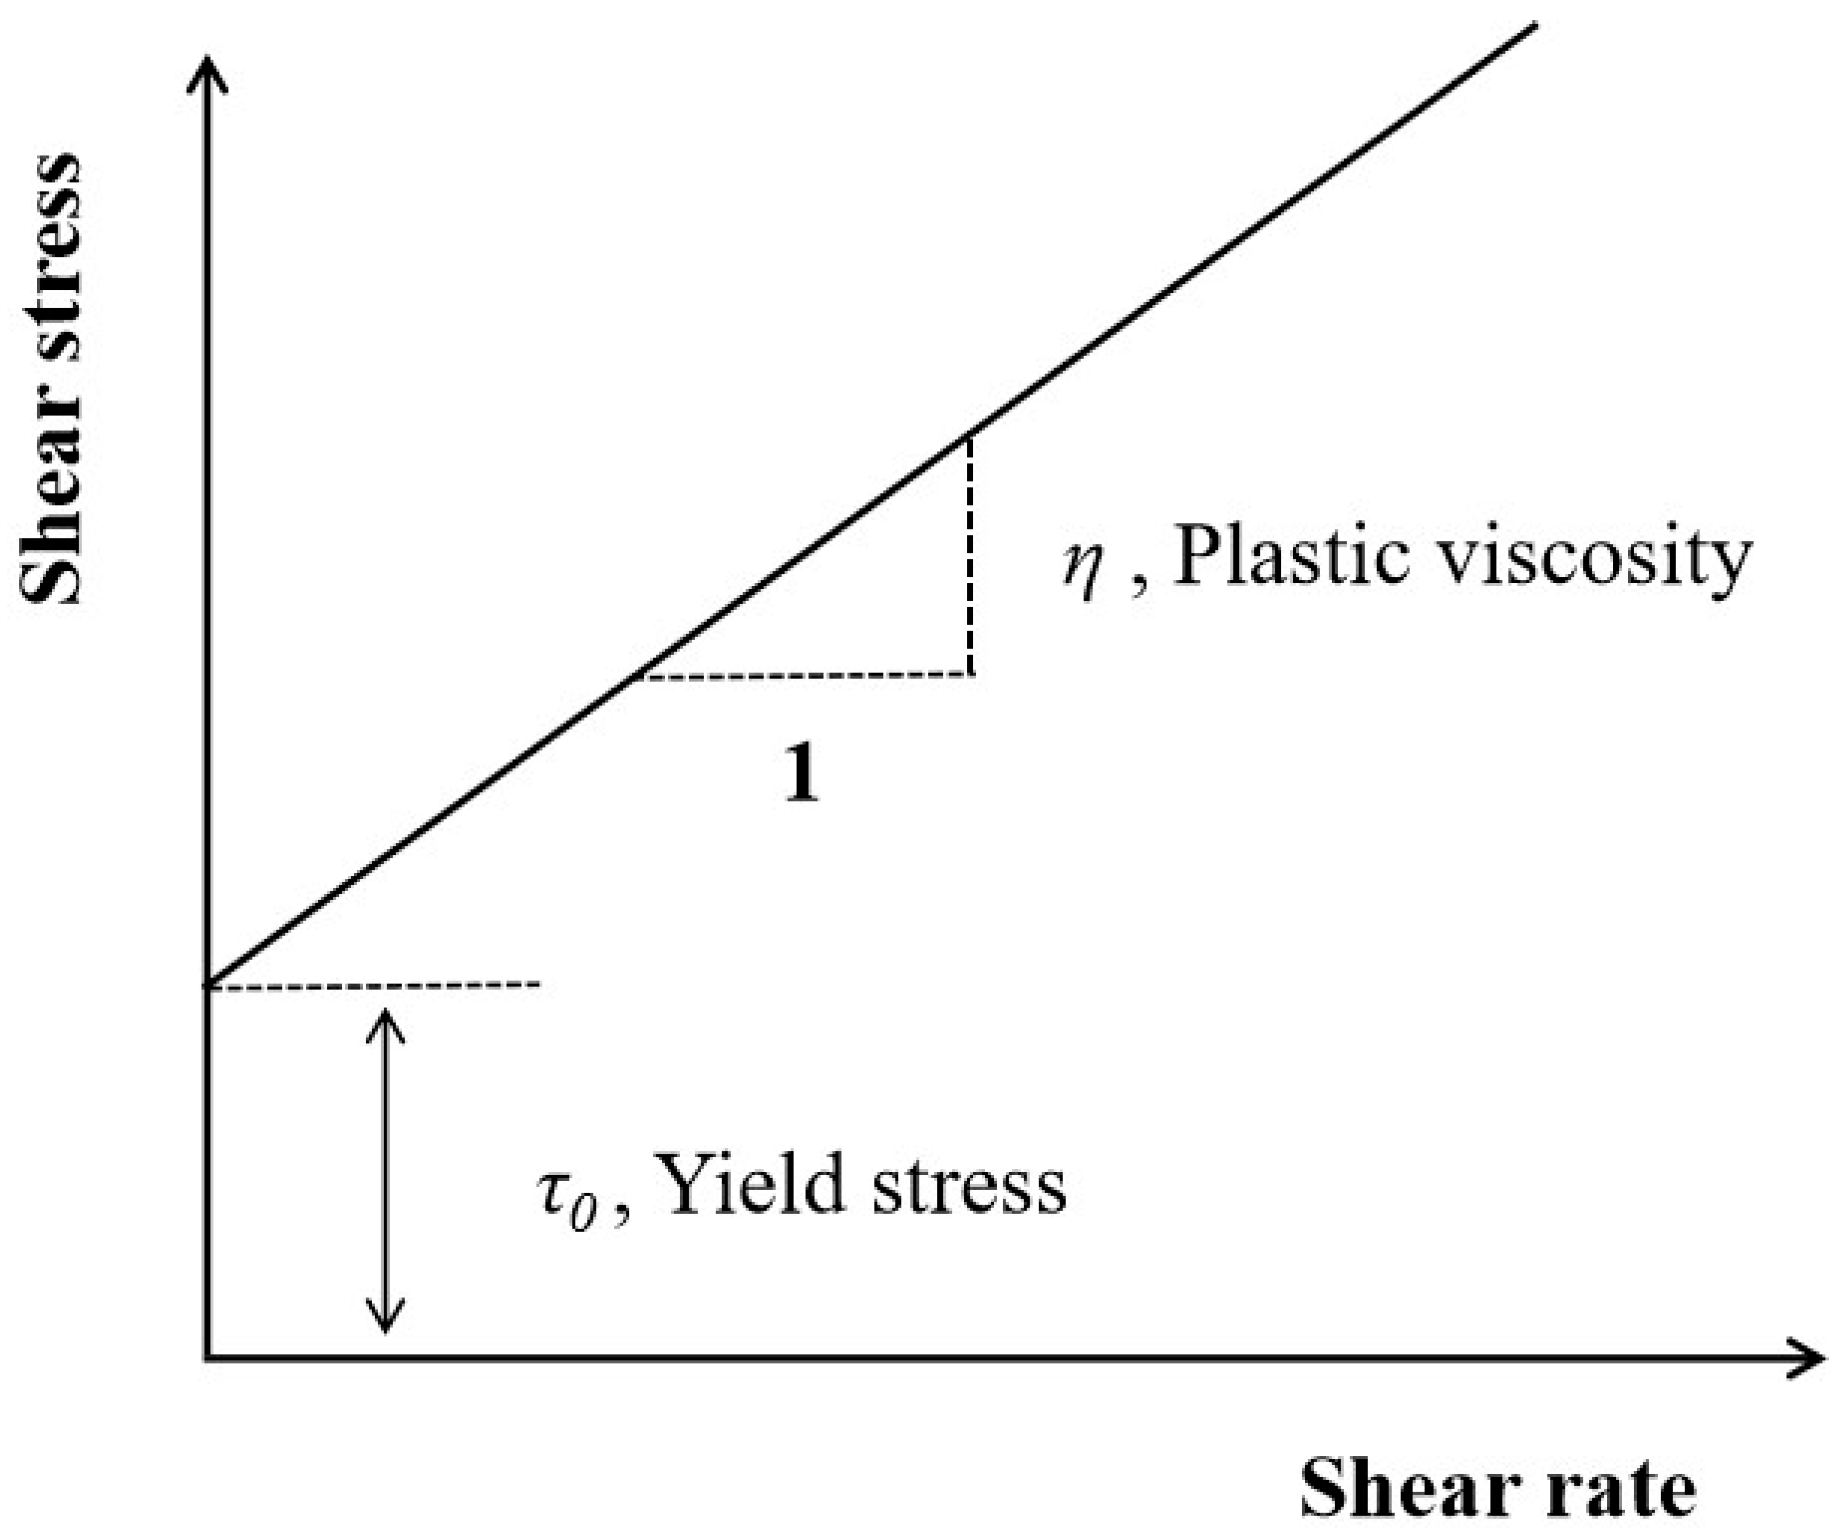
2.3.3. Rheological Test
2.3.4. Frost Resistance Test
2.3.5. Mercury Intrusion Porosimetry (MIP) Test
3. Results and Discussion
3.1. Factors Affecting Spraying Performance and Rheological Parameters
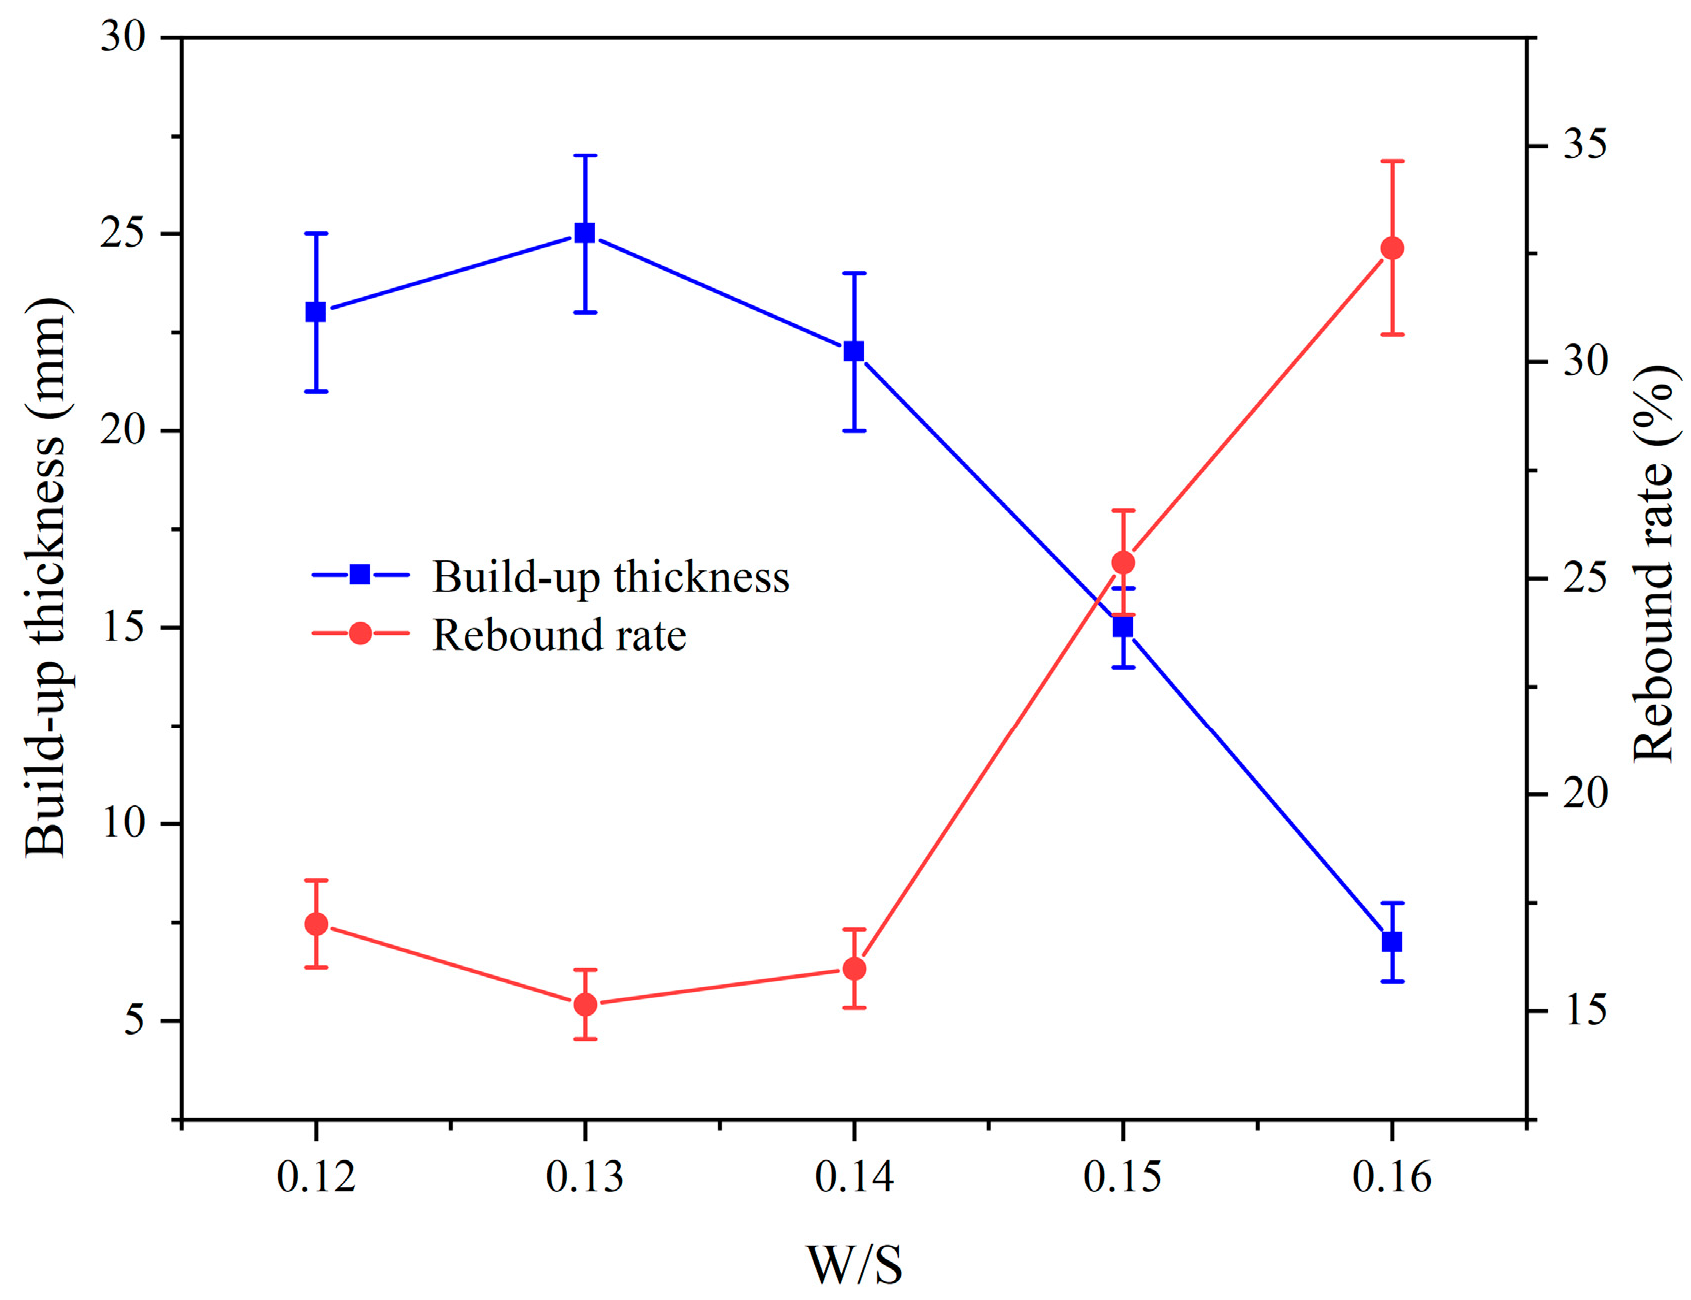
3.1.1. Effect of the Water–Solid Ratio (W/S)
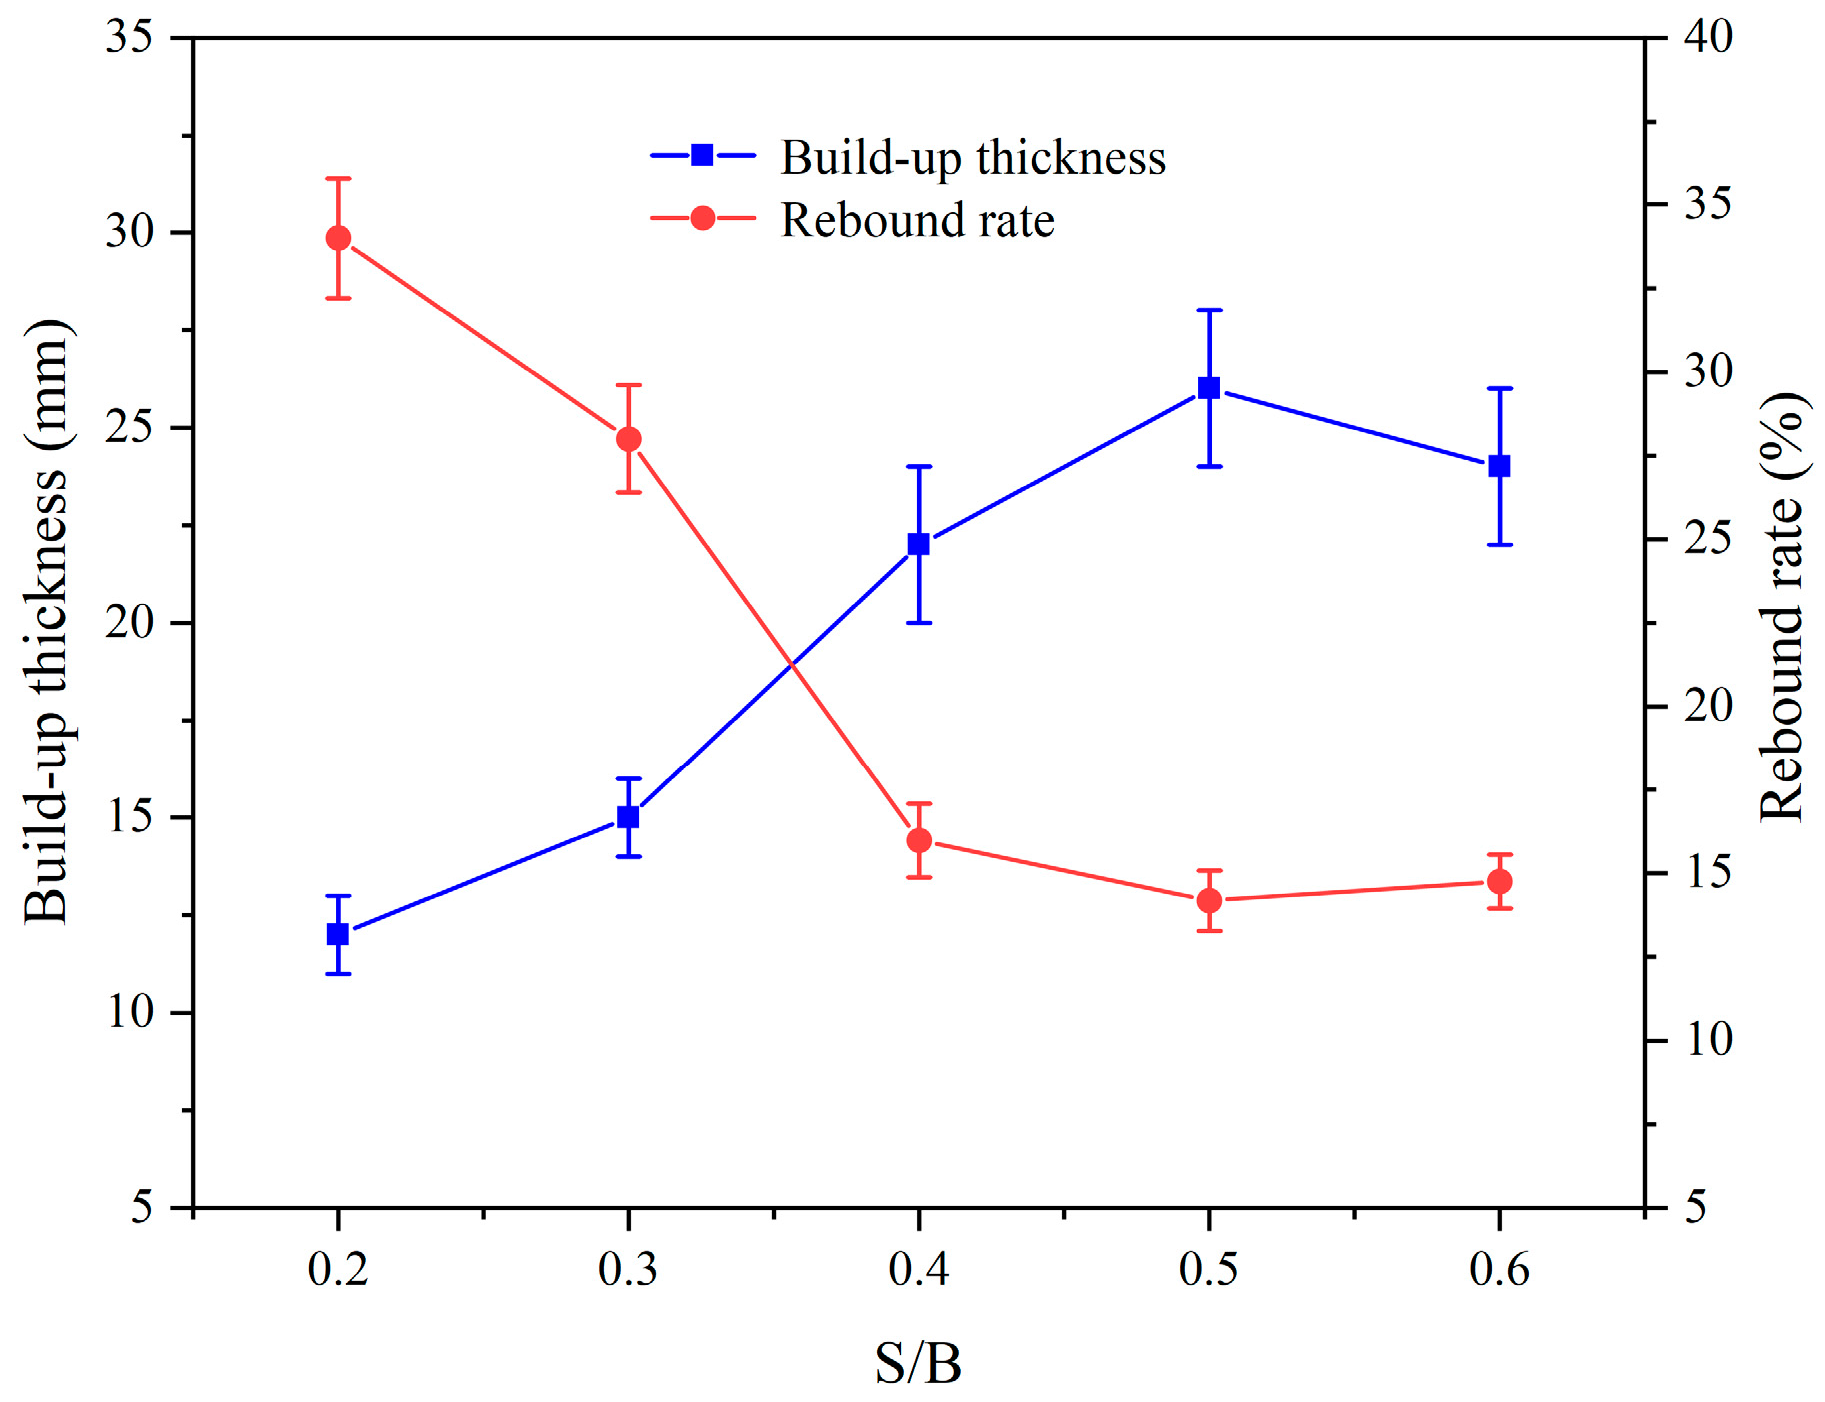
3.1.2. Effect of the Sand–Binder Ratio (S/B)
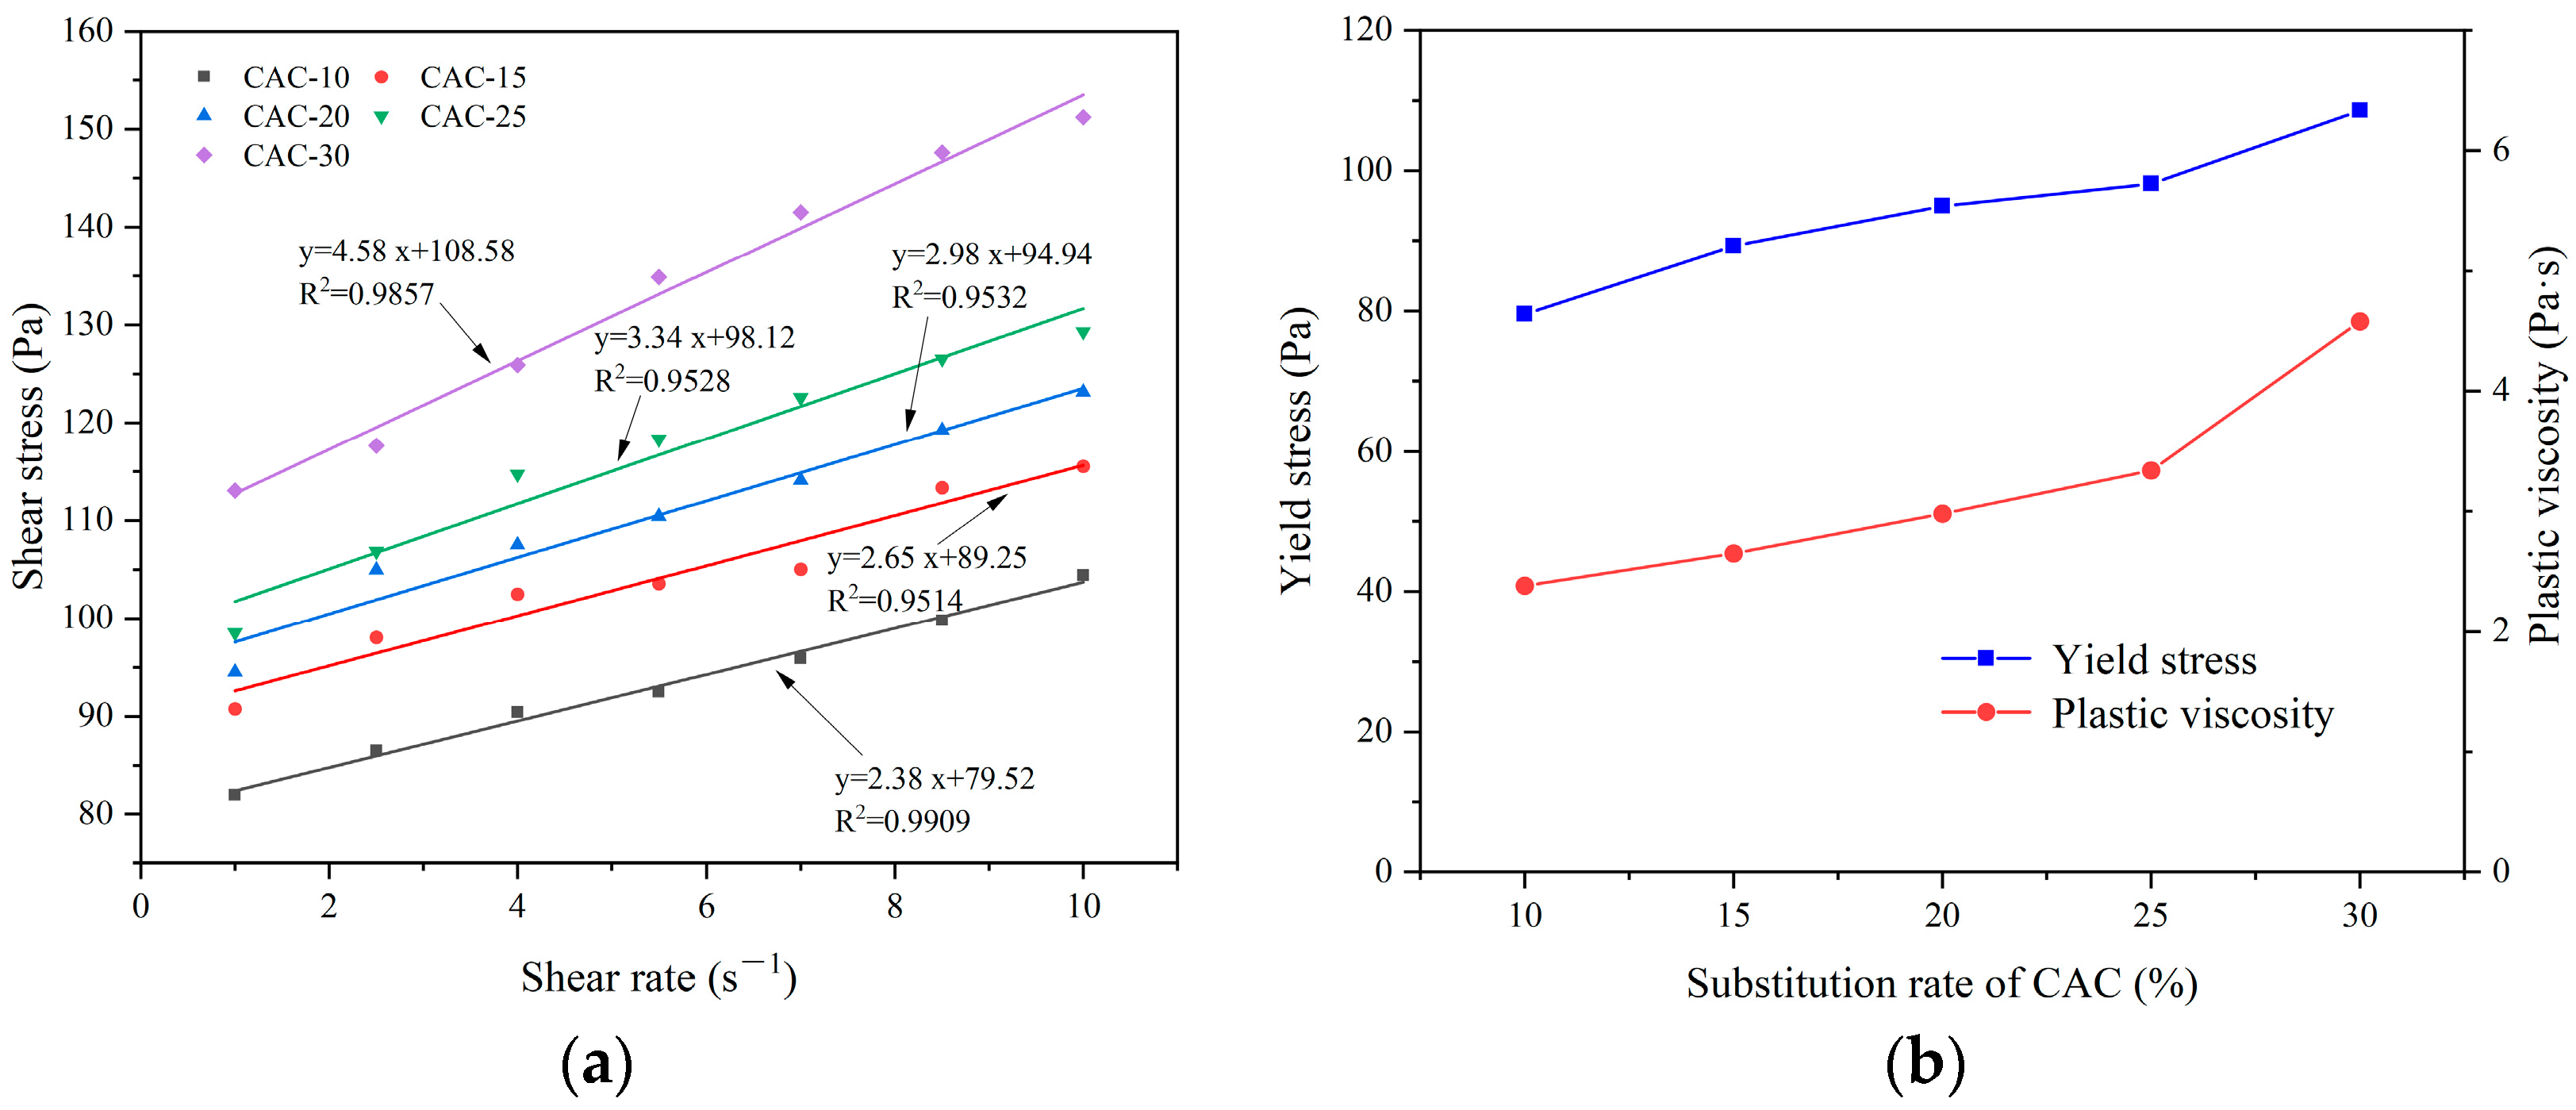
3.1.3. Effect of the Substitution Rate of Calcium Aluminate Cement(CAC)
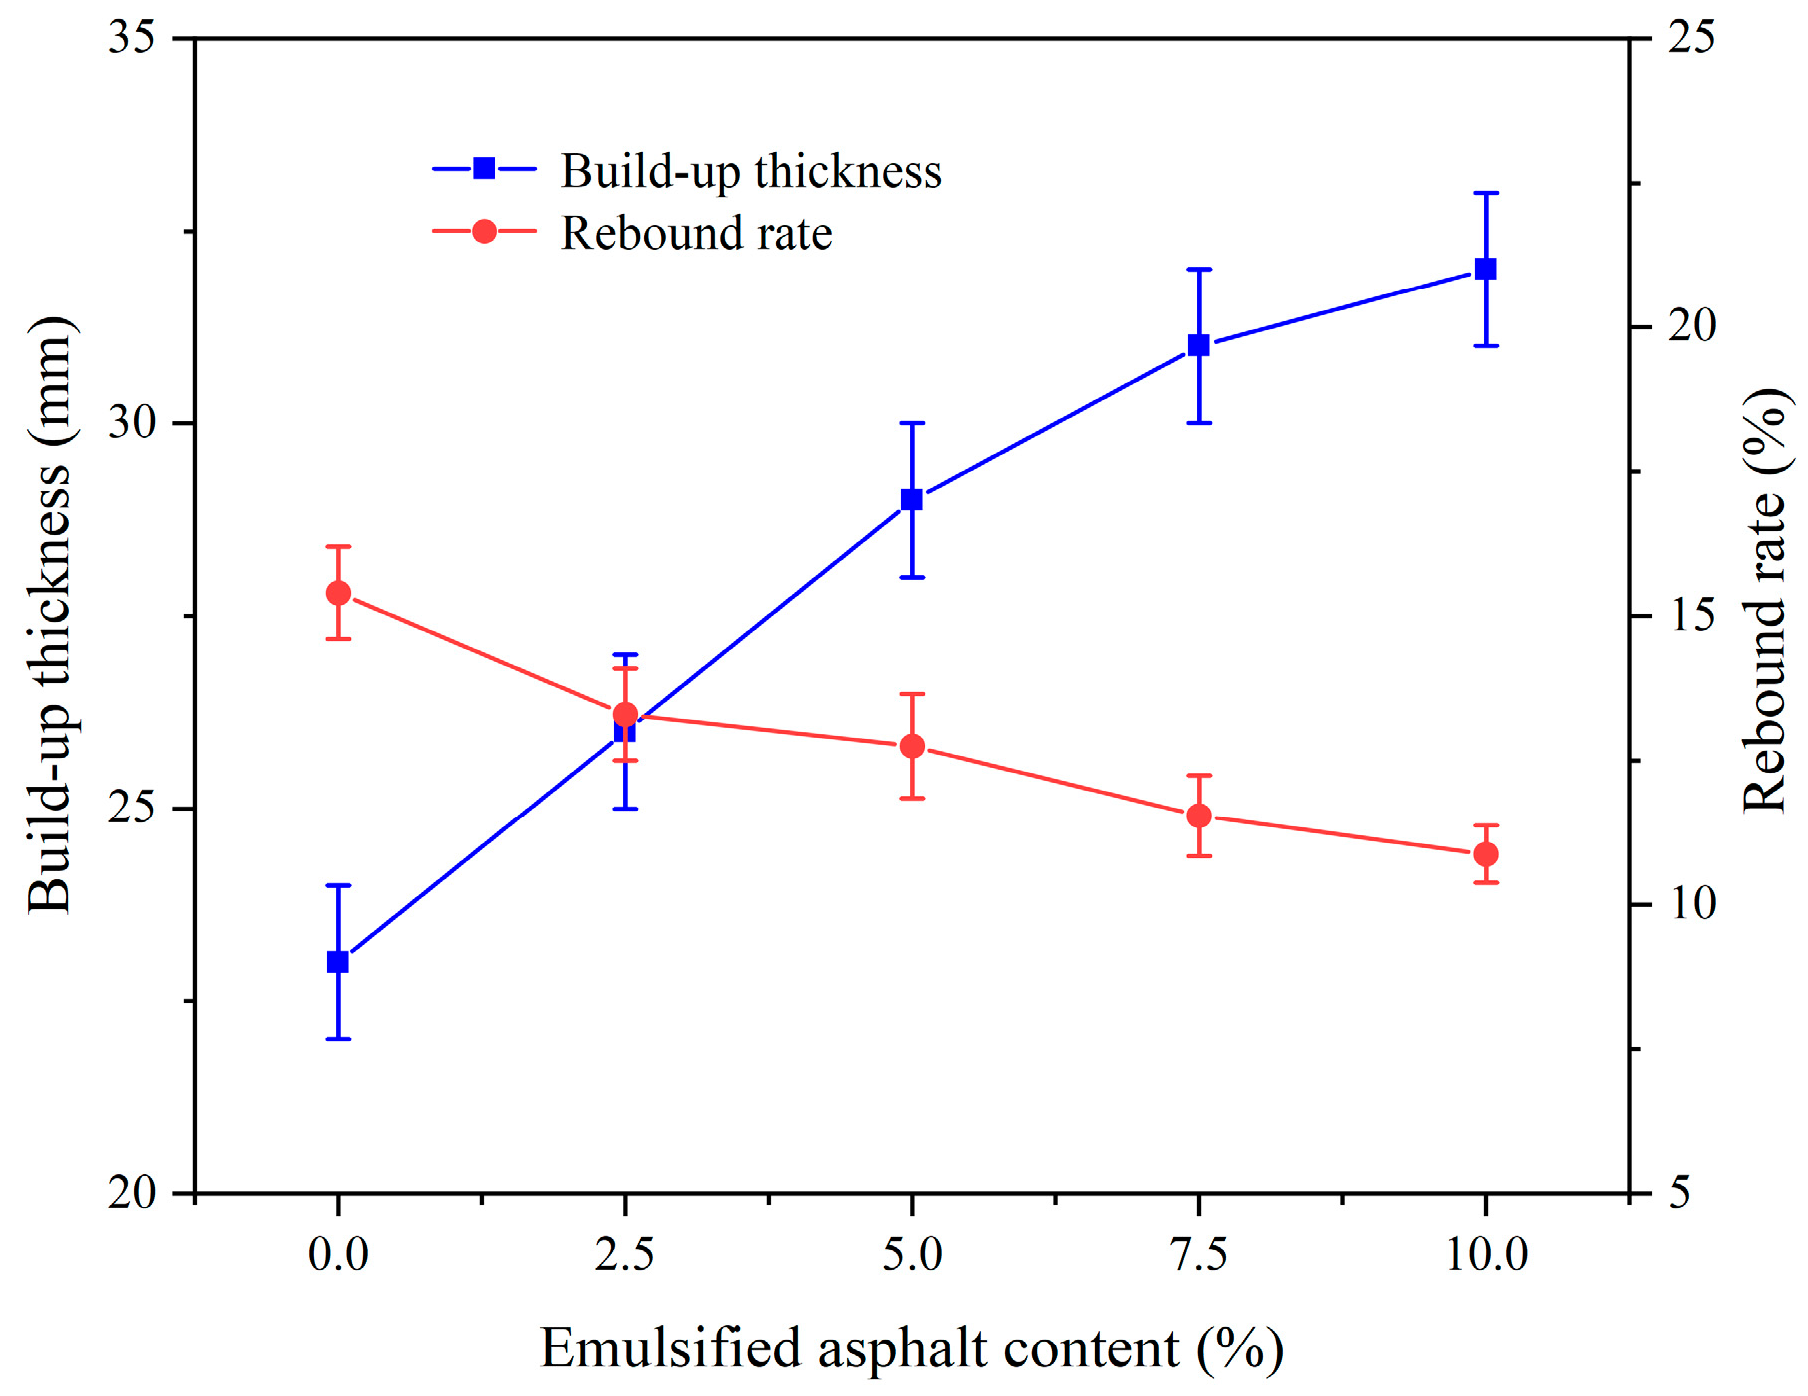
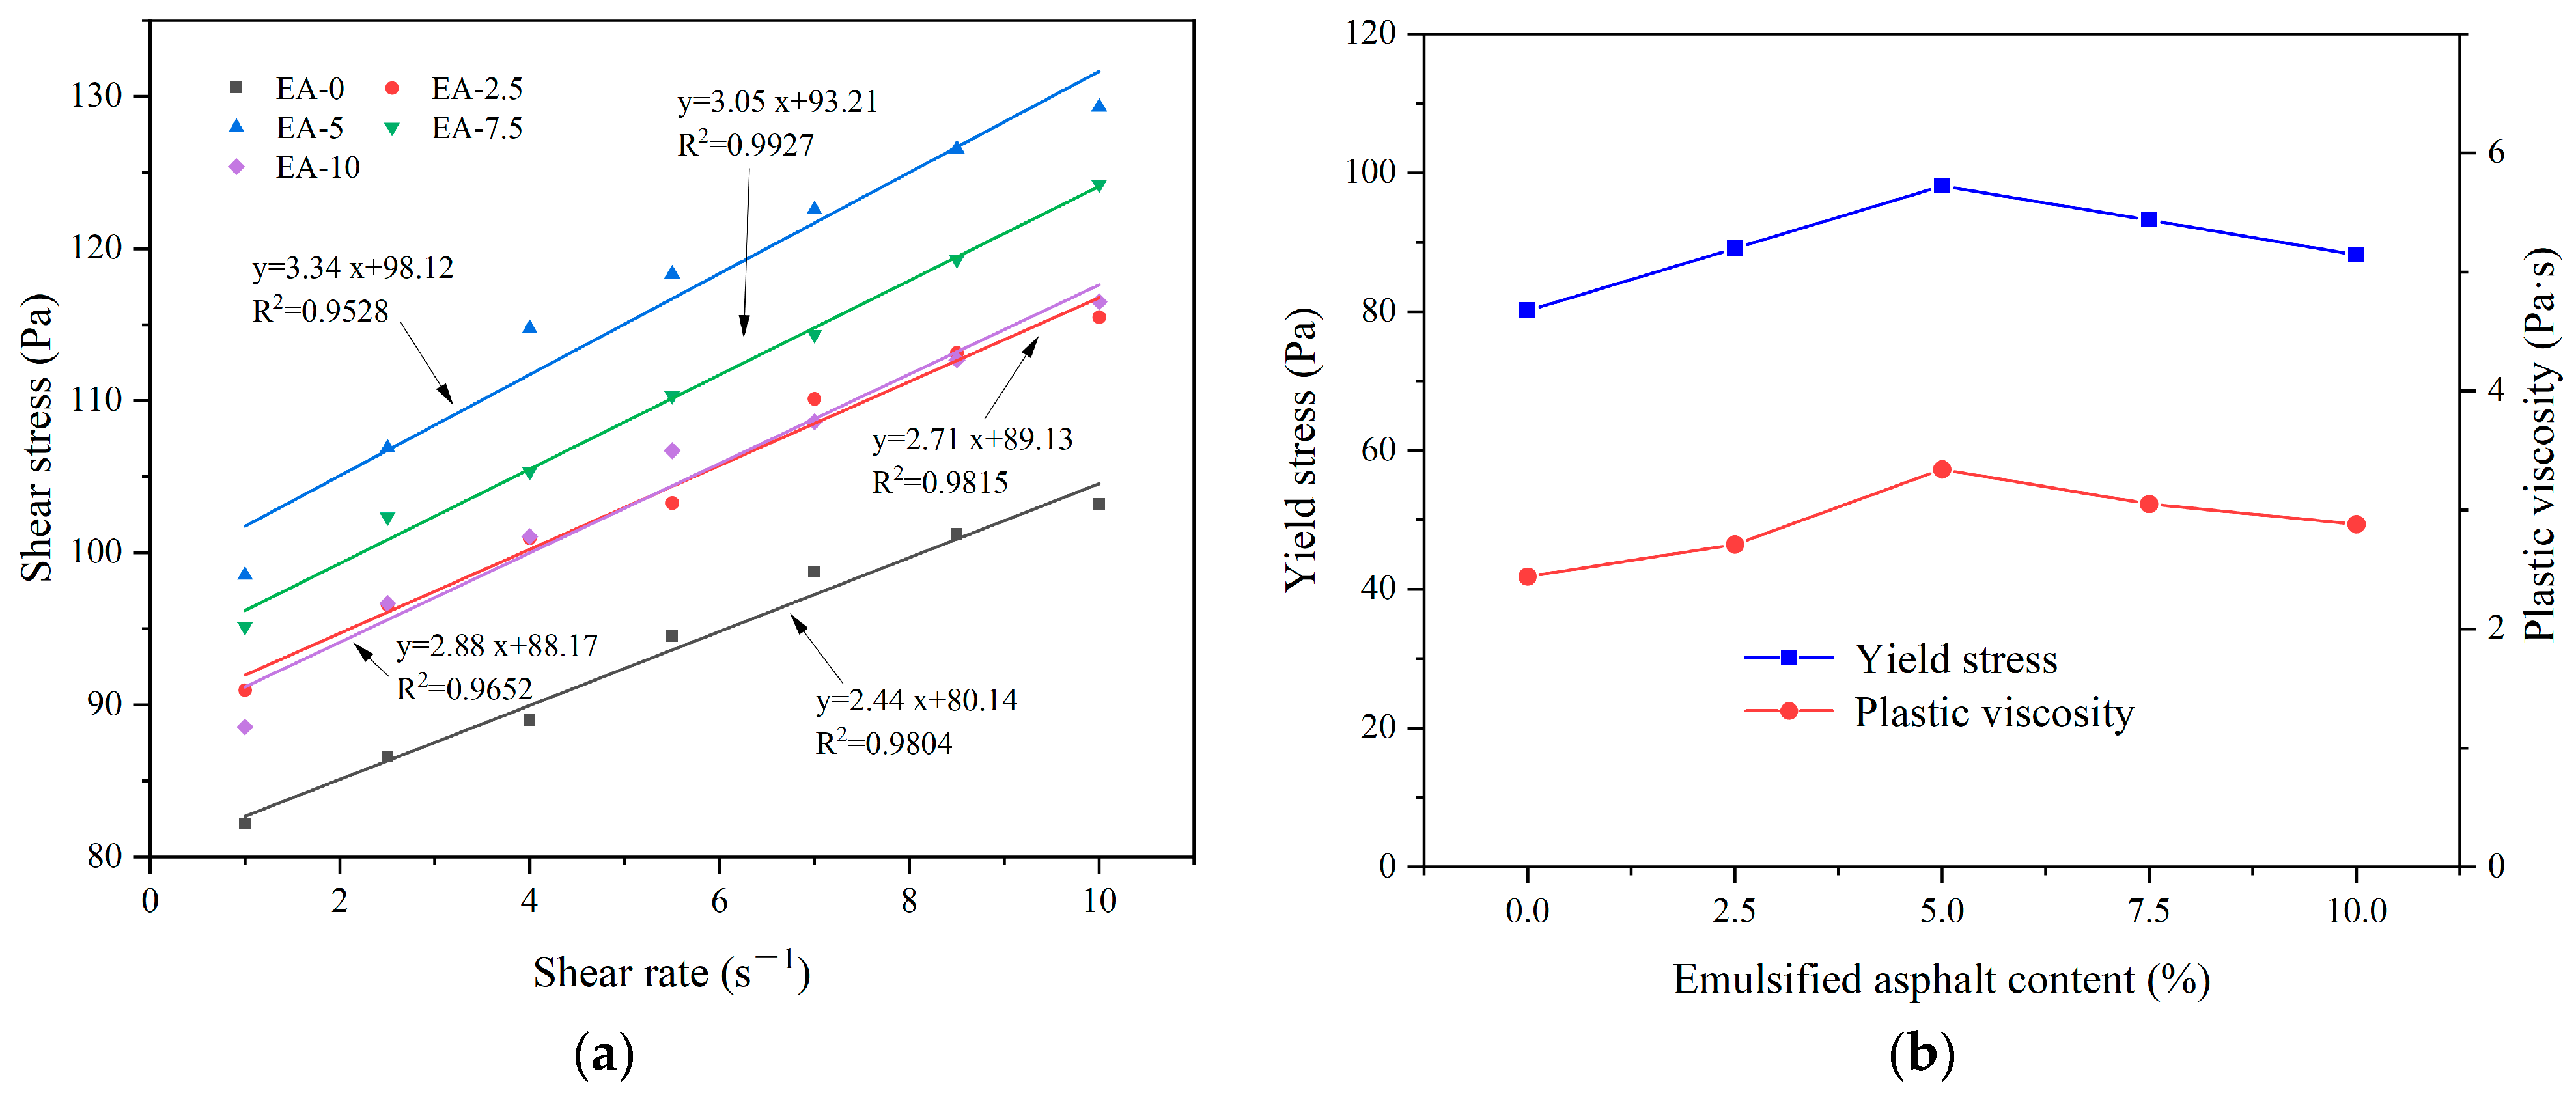
3.1.4. Effect of the Emulsified Asphalt Content
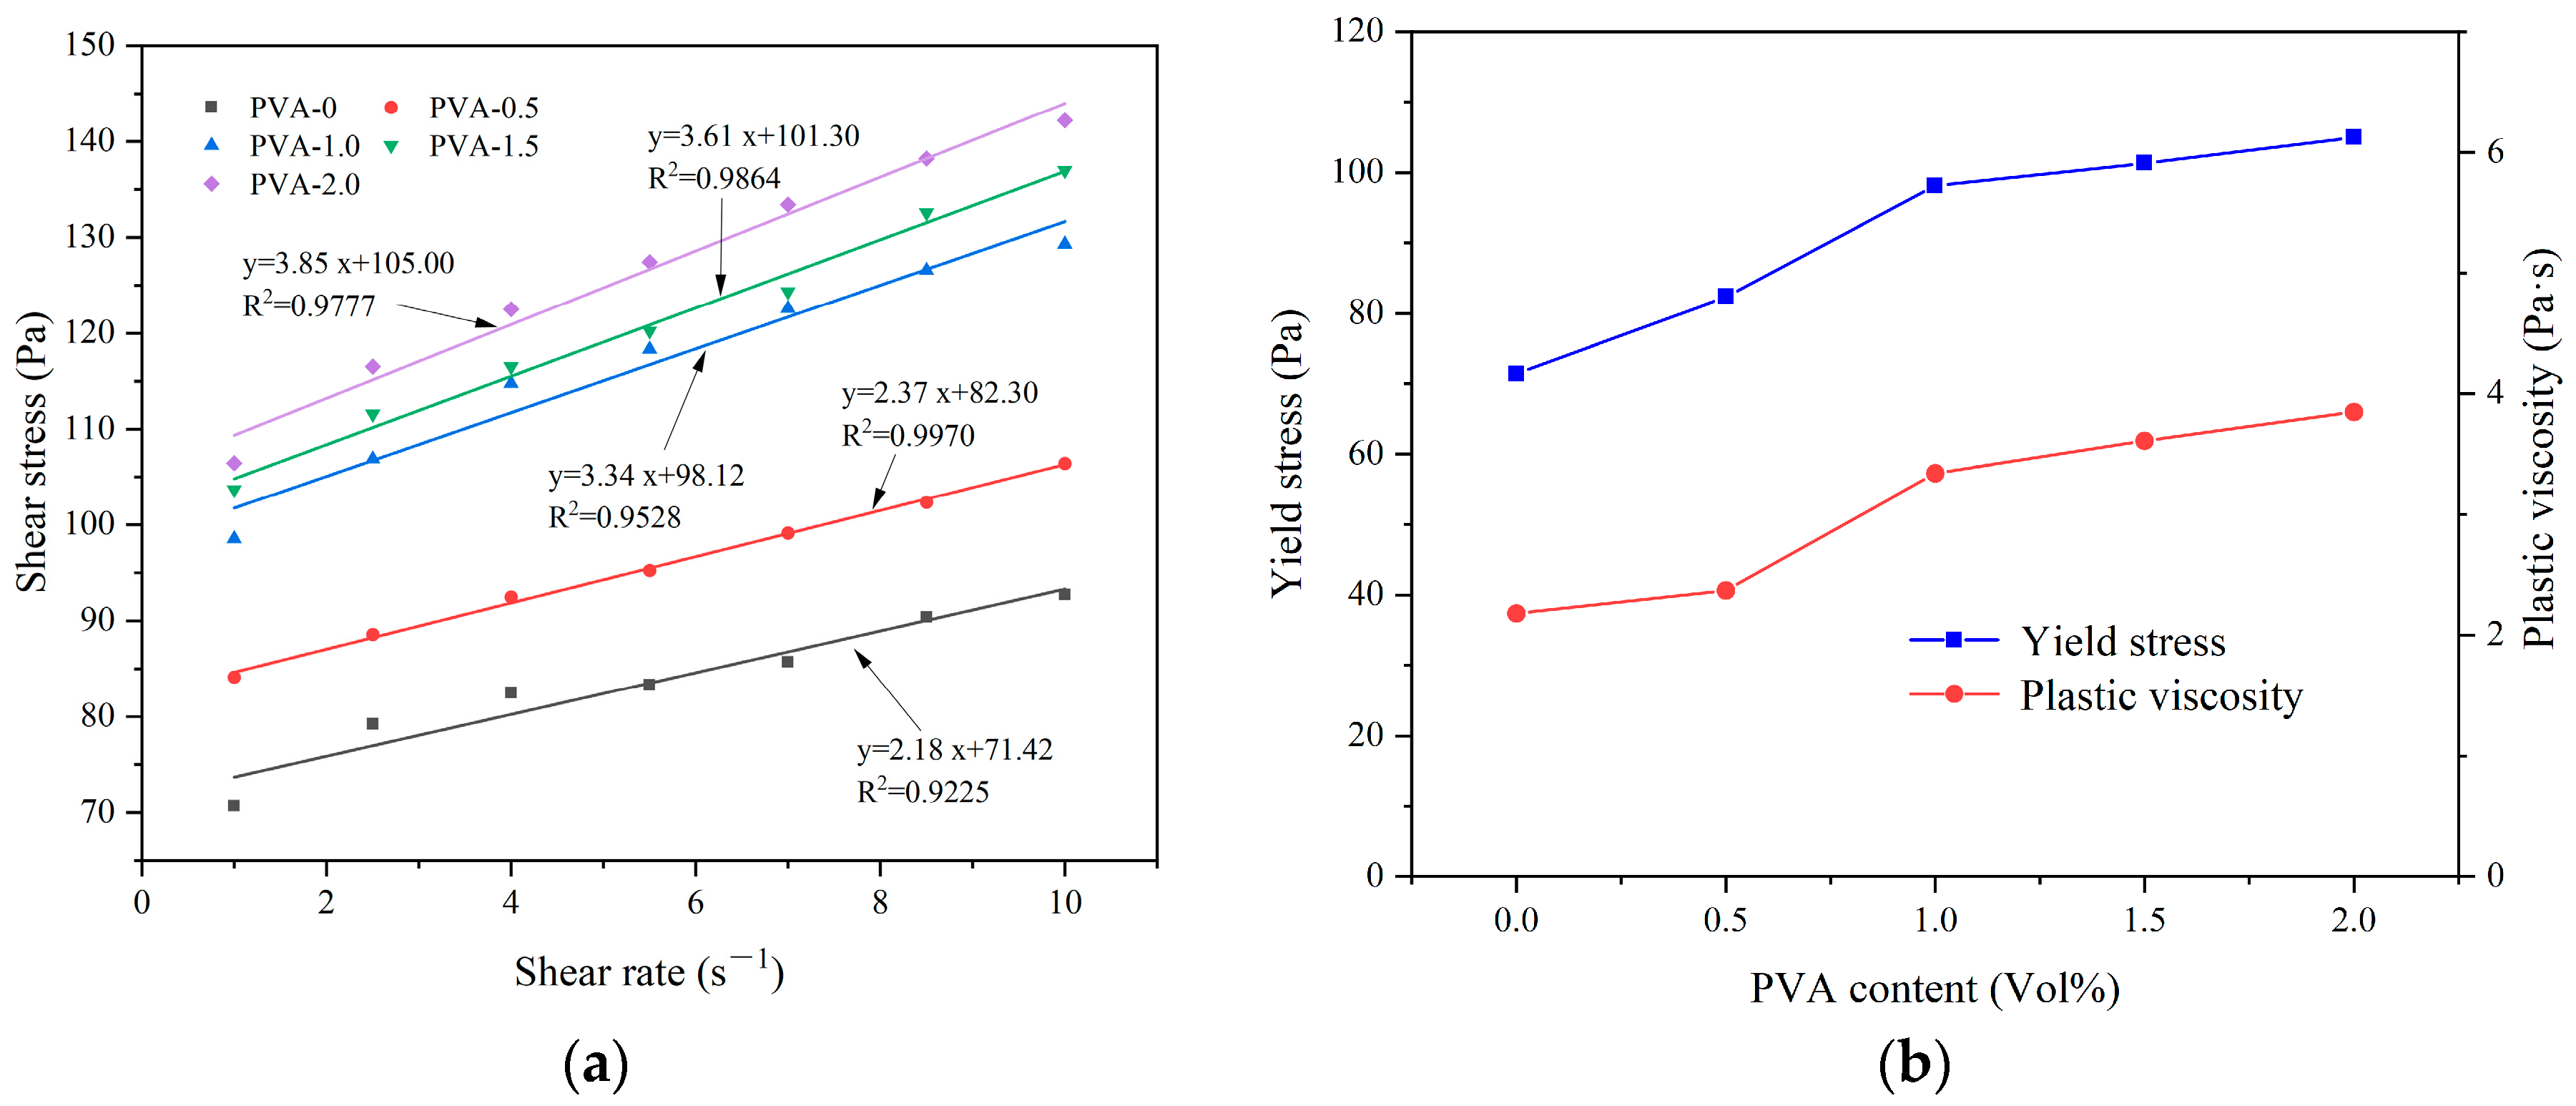
3.1.5. Effect of PVA Content
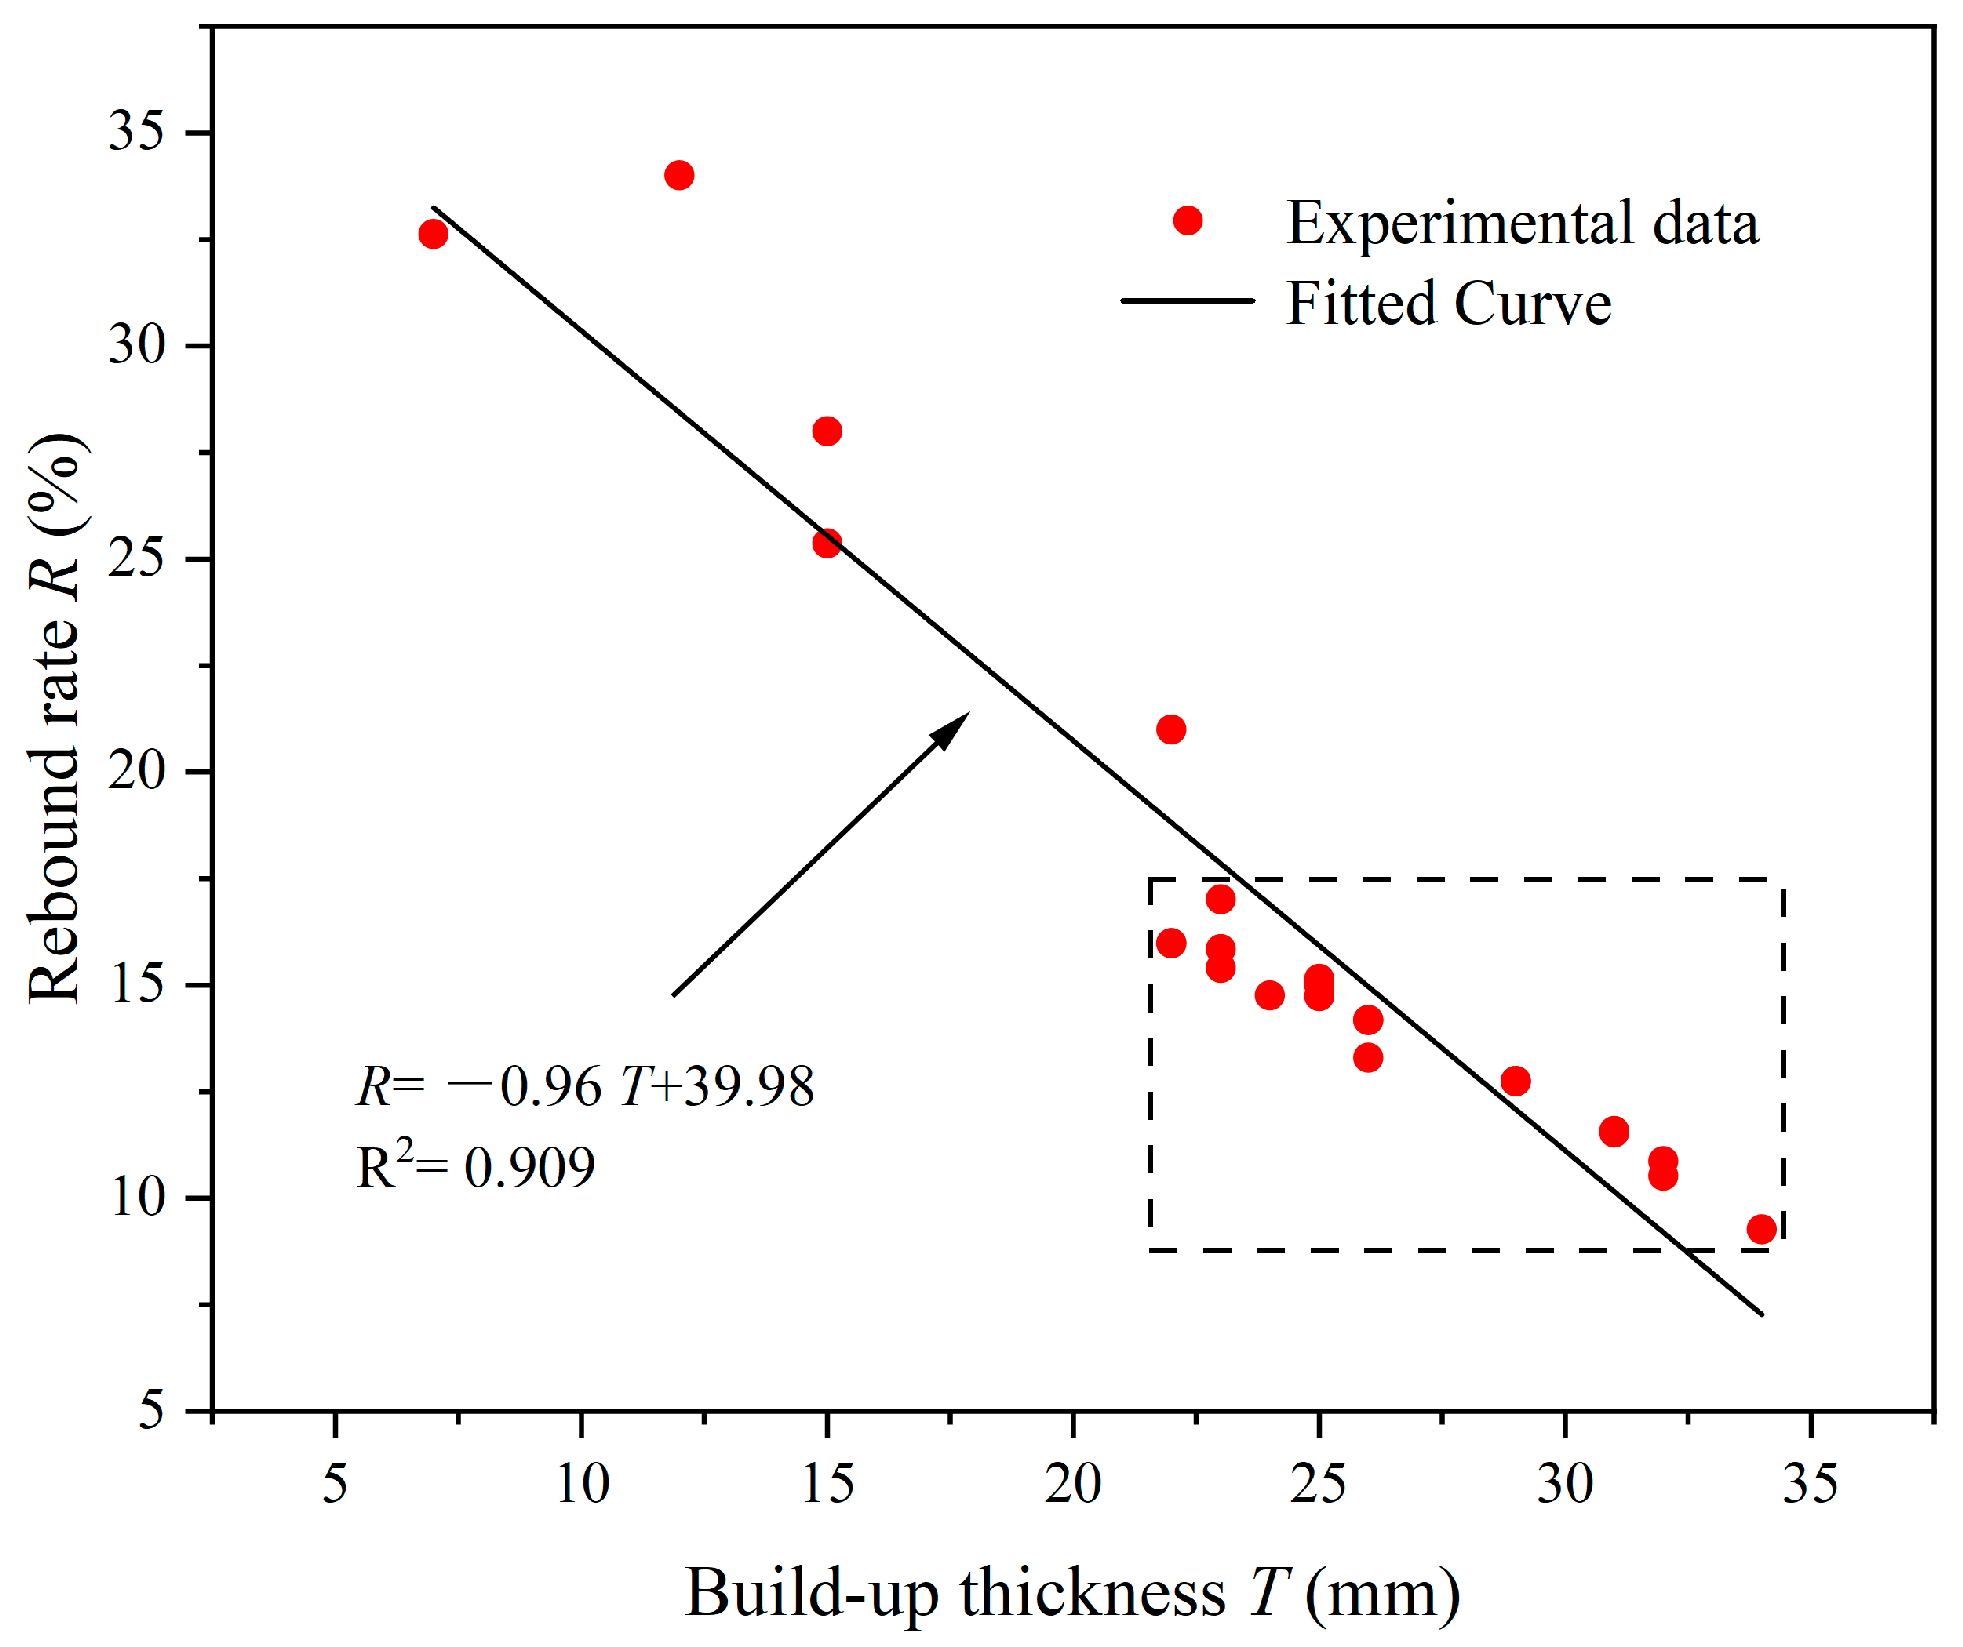
3.2. Correlation between Spraying Performance and Rheological Parameters
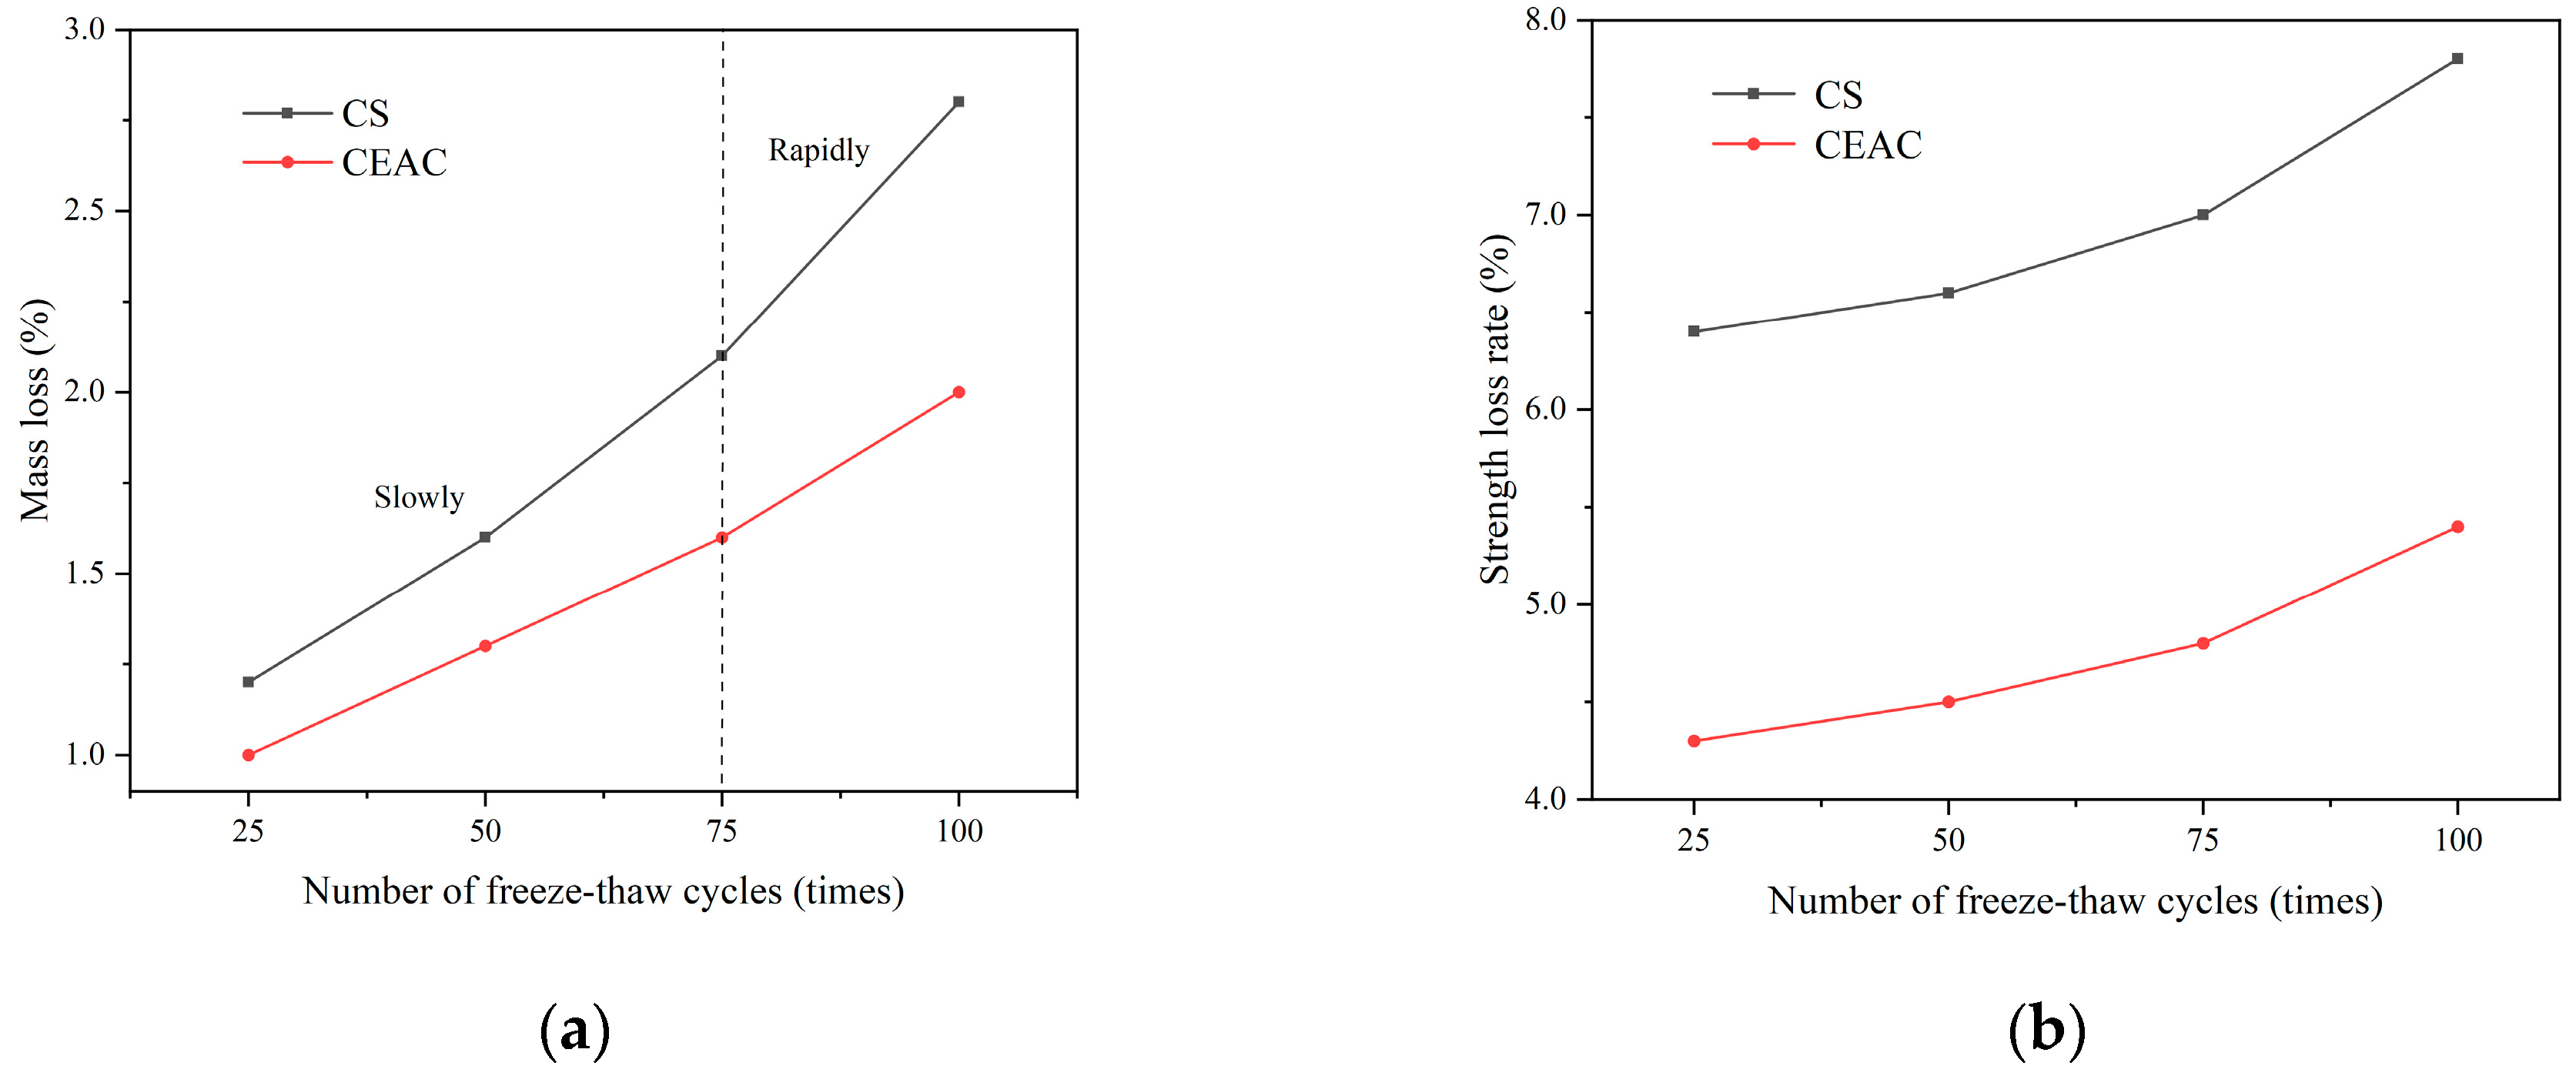
3.3. Frost Resistance
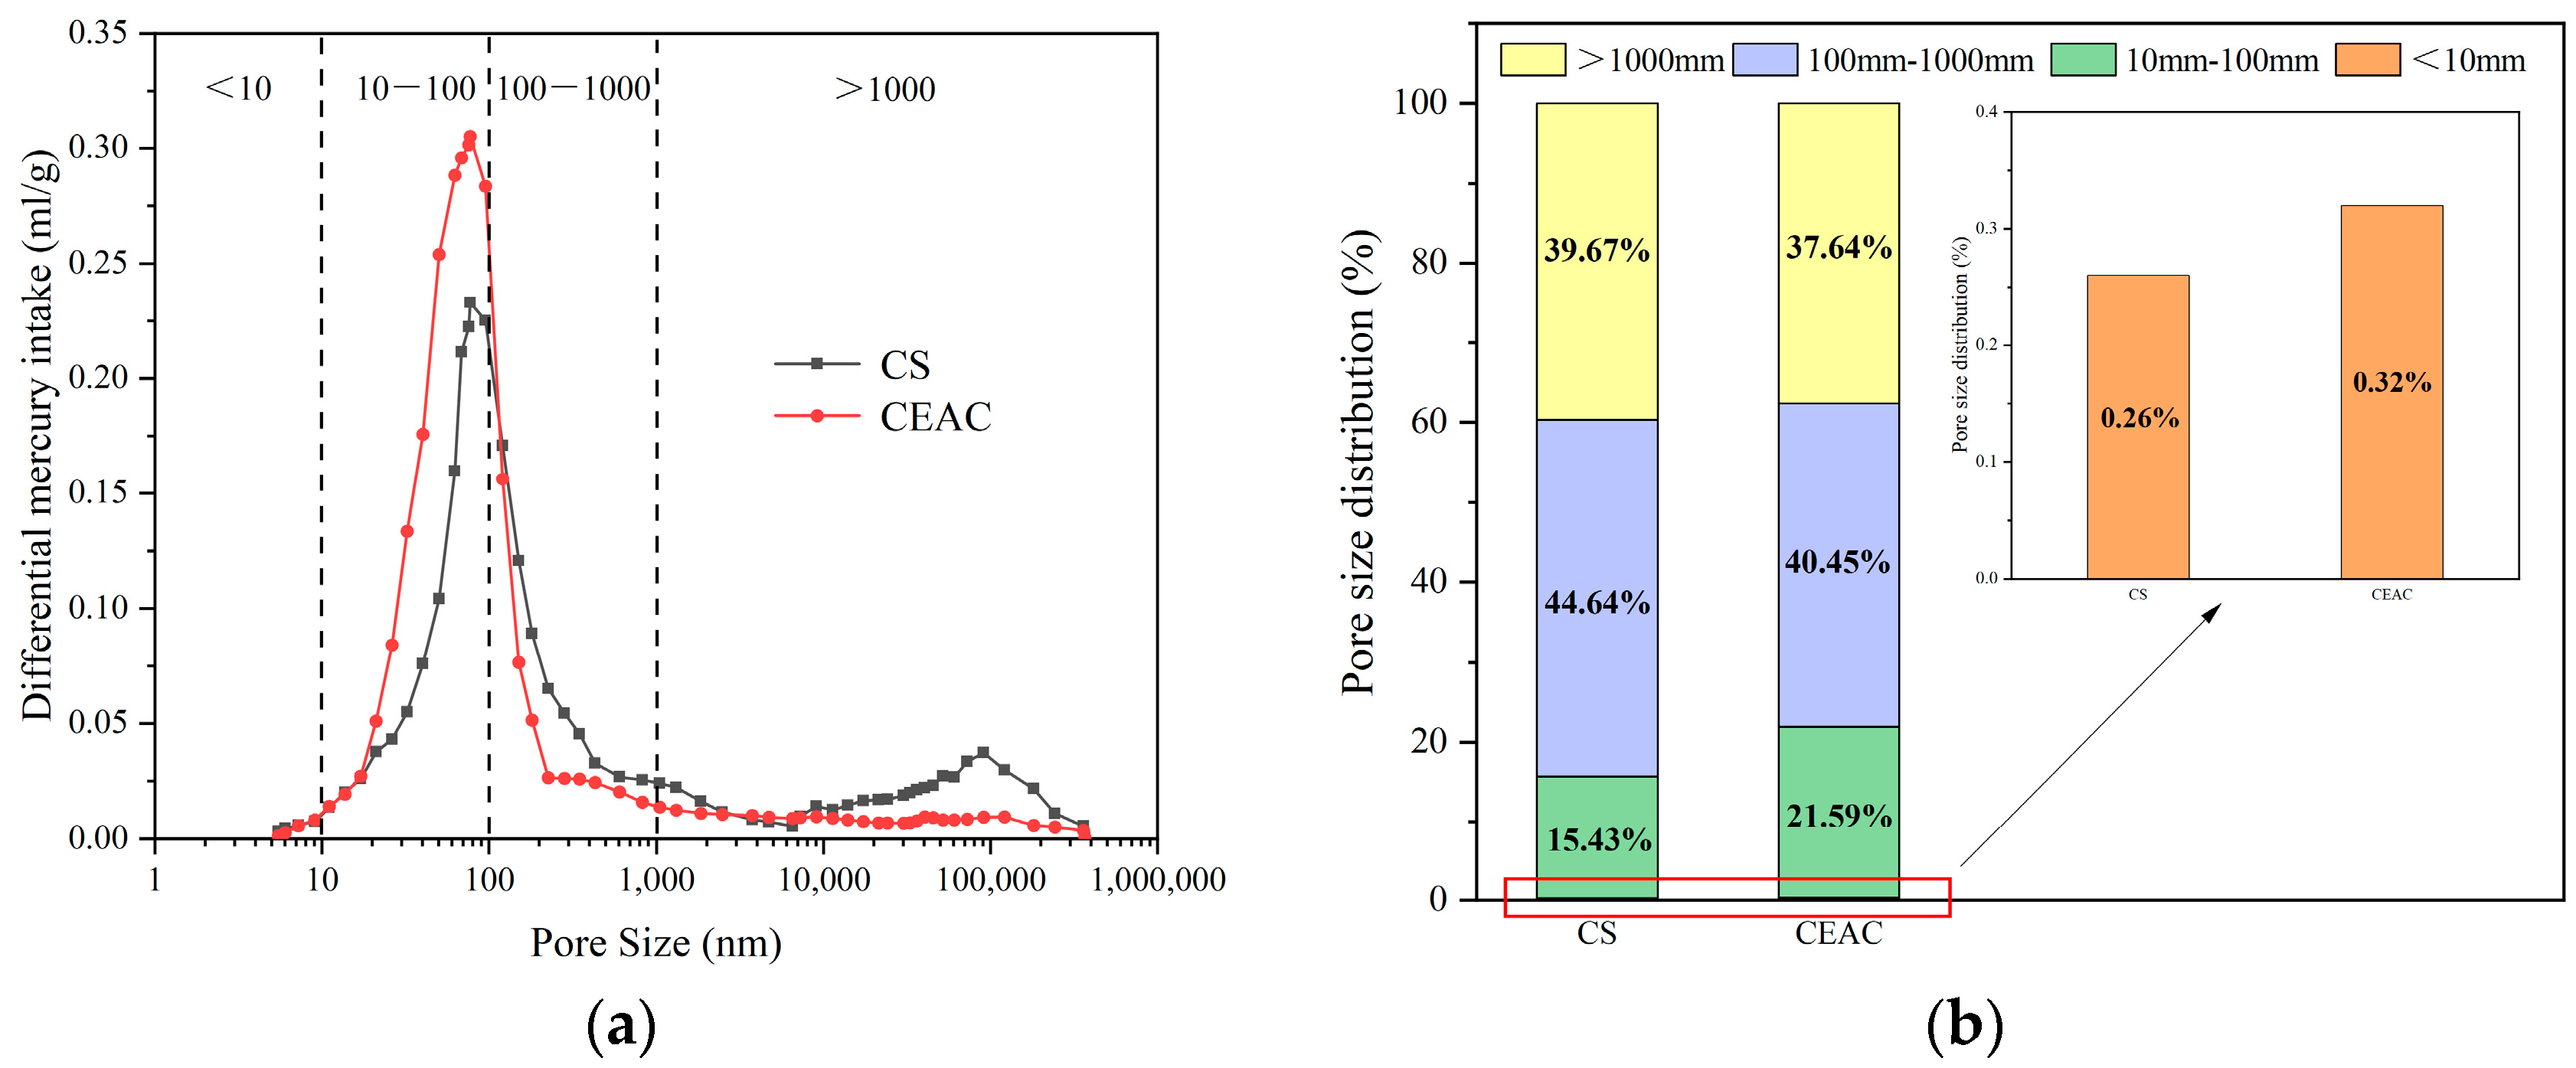
3.4. Hole Structure Analysis
4. Conclusions
- (1)
- Based on the spray performance and rheological parameters, the optimal mix ratio for CEAC was determined using the control variable method: a water–solid ratio of 0.14, a sand–binder ratio of 0.5, a calcium aluminate cement substitution rate of 25%, an emulsified asphalt dosage of 5%, and a PVA fiber volume content of 1.5%.
- (2)
- Utilizing the correlation between spraying performance and rheological parameters, this study determined the ranges of spraying performance and rheological parameters for CEAC suitable for spraying in cold environments. Specifically, the yield stress ranged from 79.52 to 108.58 Pa, the plastic viscosity varied between 2.37 and 3.95 Pa·s, the build-up thickness was between 22 and 34 mm, and the rebound rate ranged from 9.27 to 17.01%. These ranges provide valuable guidance for the application of CEAC spraying in negative-temperature environments.
- (3)
- The build-up thickness of CEAC was positively correlated with yield stress and plastic viscosity, and the rebound rate was negatively correlated with yield stress and plastic viscosity. The rheological performance parameters of CEAC can be used to characterize its spraying performance within a specific range.
- (4)
- The results of frost resistance testing conducted on CS and CEAC, both prepared using the optimal mix ratio for CEAC spraying in cold environments, revealed that CEAC exhibited lower mass loss and strength loss rates compared to CS after an equal number of freezing and thawing cycles. This indicates that CEAC possesses superior frost resistance properties compared to CS.
- (5)
- The results of the MIP test show that the content of capillary pores and macropores mainly affects the freezing resistance of CEAC, and the smaller their content was, the better the freezing resistance of CEAC was.
Author Contributions
Funding
Institutional Review Board Statement
Informed Consent Statement
Data Availability Statement
Conflicts of Interest
References
- Choi, P.; Yeon, J.H.; Yun, K.-K. Air-void structure, strength, and permeability of wet-mix shotcrete before and after shotcreting operation: The influences of silica fume and air-entraining agent. Cem. Concr. Compos. 2016, 70, 69–77. [Google Scholar] [CrossRef]
- Galan, I.; Baldermann, A.; Kusterle, W.; Dietzel, M.; Mittermayr, F. Durability of shotcrete for underground support—Review and update. Constr. Build. Mater. 2019, 202, 465–493. [Google Scholar] [CrossRef]
- He, S.; Lai, J.; Wang, L.; Wang, K. A literature review on properties and applications of grouts for shield tunnel. Constr. Build. Mater. 2020, 239, 468–482. [Google Scholar] [CrossRef]
- Steindl, F.R.; Galan, I.; Baldermann, A.; Sakoparnig, M.; Briendl, L.; Juhart, J.; Thumann, M.; Dietzel, M.; Röck, R.; Kusterle, W.; et al. Sulfate durability and leaching behaviour of dry- and wet-mix shotcrete mixes. Cem. Concr. Res. 2020, 137, 106180. [Google Scholar] [CrossRef]
- Chen, L.; Ma, G.; Liu, G.; Liu, Z. Effect of pumping and spraying processes on the rheological properties and air content of wet-mix shotcrete with various admixtures. Constr. Build. Mater. 2019, 225, 311–323. [Google Scholar] [CrossRef]
- Li, P.; Zhou, Z.; Chen, L.; Liu, G.; Xiao, W. Research on Dust Suppression Technology of Shotcrete Based on New Spray Equipment and Process Optimization. Adv. Civ. Eng. 2019, 2019, 4831215. [Google Scholar] [CrossRef]
- Liu, G.; Cheng, W.; Chen, L. Investigating and optimizing the mix proportion of pumping wet-mix shotcrete with polypropylene fiber. Constr. Build. Mater. 2017, 150, 14–23. [Google Scholar] [CrossRef]
- Cui, S.; Liu, P.; Li, Z.; Xu, X.; Ju, J.W. Shotcrete performance-loss due to seepage and temperature coupling in cold-region tunnels. Constr. Build. Mater. 2020, 246, 118488. [Google Scholar] [CrossRef]
- Ning, F.W.; Cai, Y.B.; Bai, Y.; Ding, J.T.; Zhang, F. Research on rebound rate of nanoscale admixture wet-mix shotcrete. IOP Conf. Ser. Mater. Sci. Eng. 2019, 678, 012109. [Google Scholar] [CrossRef]
- Fu, Z.; Li, T.; Jiang, Y. Shotcrete and rock bolt support technique used in construction of Beijing Badaling Tunnel under cold weather Condition. Railw. Constr. Technol. 2001, 2, 15–17. (In Chinese) [Google Scholar]
- Zhang, D.; Wang, M. New technique for construction of Fenghuoshan Tunnel the highest tunnel in the world of Qinghai-Tibet Railway. J. Eng. Geol. 2003, 11, 213–216. (In Chinese) [Google Scholar]
- Yang, A.; Zhou, D. Tunnel wet concrete-shot technology in permafrost region. China Railw. Sci. 2004, 25, 141–144. (In Chinese) [Google Scholar]
- Kim, D.; Lee, G.; Bae, G. Compressive and adhesive strengths of shotcrete deteriorated by hazardous components in the groundwater. Tunn. Uudergr. Space Technol. 2006, 21, 323–332. [Google Scholar] [CrossRef]
- Haldane, J. Heythrop, Copleston, and the Jesuit Contribution to Philosophy. Philosophy 2016, 91, 559–589. [Google Scholar] [CrossRef]
- Wan, Z.; He, T.; Chang, N.; He, S.; Shao, Z.; Ma, X.; Yang, R. Study on frost resistance of shotcrete by micro-nano bubble water and admixture. Ceram. Int. 2023, 49, 11123–11139. [Google Scholar] [CrossRef]
- Hu, Z.; Ding, H.; Lai, J.; Wang, H.; Wang, X.; He, S. The durability of shotcrete in cold region tunnel: A review. Constr. Build. Mater. 2018, 185, 670–683. [Google Scholar] [CrossRef]
- Holter, K.G.; Smeplass, S.; Jacobsen, S. Freeze-thaw resistance of sprayed concrete in tunnel linings. Mater. Struct. 2015, 49, 3075–3093. [Google Scholar] [CrossRef]
- Kalhori, H.; Bagherzadeh, B.; Bagherpour, R.; Akhlaghi, M.A. Experimental study on the influence of the different percentage of nanoparticles on strength and freeze-thaw durability of shotcrete. Constr. Build. Mater. 2020, 256, 119470. [Google Scholar] [CrossRef]
- Yun, K.K.; Choi, P.; Yeon, J.H. Correlating rheological properties to the pumpability and shootability of wet-mix shotcrete mixtures. Constr. Build. Mater. 2015, 98, 884–891. [Google Scholar] [CrossRef]
- Pan, G.; Li, P.; Chen, L.; Liu, G. A study of the effect of rheological properties of fresh concrete on shotcrete-rebound based on different additive components. Constr. Build. Mater. 2019, 224, 1069–1080. [Google Scholar] [CrossRef]
- Feng, H.; Zheng, X.; Yu, Z.; Chen, B.; Zhu, P.; Yu, J.; Luo, Z. Development of sprayable ultra-high ductility magnesium phosphate cement-based composites based on the rheological properties. Constr. Build. Mater. 2023, 377, 131113. [Google Scholar] [CrossRef]
- Li, Z.; Tian, B.; Li, L.; Quan, L.; Li, D. Effect of phosphates on early-age hydration process and products of calcium aluminate cement at –10 °C. Constr. Build. Mater. 2022, 346, 128405. [Google Scholar] [CrossRef]
- JGJT 372-2016; Technical Specification for Application of Sprayed Concrete. Ministry of Housing and Urban-Rural Development of the People’s Republic of China: Beijing, China, 2016.
- JSCE-F 563-2005; Test Method for Rebound Percentage of Sprayed Concrete (Mortar). The Concrete Committee of Japan Society of Civil Engineers: Tokyo, Japan, 2005.
- Yun, K.K.; Kim, J.B.; Song, C.S.; Hossain, M.S.; Han, S. Rheological behavior of high-performance shotcrete mixtures containing colloidal silica and silica fume using the Bingham model. Materials 2022, 15, 428. [Google Scholar] [CrossRef] [PubMed]
- Papo, A.; Piani, L. Effect of various superplasticizers on the rheological properties of Portland cement pastes. Cem. Concr. Res. 2004, 34, 2097–2101. [Google Scholar] [CrossRef]
- JGJT 70-2009; Standard for Test Methods of Basic Properties of Construction Mortar. Ministry of Housing and Urban-Rural Development of the People’s Republic of China: Beijing, China, 2009.
- Zhao, Z.; Chen, J.; Zhang, Y.; Jiang, T.; Wang, W. Study on preparation and performance of foamed lightweight soil grouting material for goaf treatment. Materials 2023, 16, 4325. [Google Scholar] [CrossRef] [PubMed]
- Ren, Q.; Tao, Y.; Jiao, D.; Jiang, Z.; Ye, G.; Schutter, D.D. Plastic viscosity of cement mortar with manufactured sand as influenced by geometric features and particle size. Cem. Concr. Compos. 2021, 122, 104163. [Google Scholar] [CrossRef]
- Gu, P.; Fu, Y.; Xie, P.; Beaudoin, J.J. A study of the hydration and setting behaviour of OPC-HAC pastes. Cem. Concr. Res. 1994, 24, 682–694. [Google Scholar] [CrossRef]
- Morris, E.F. Evaluation of cement systems for permafrost. In Annual Meeting of the American Institute of Mining, Metallurgical, and Petroleum Engineers; SPE: Denver, CO, USA, 1970. [Google Scholar]
- Zhang, P.; Hou, Y.; Niu, K.; Tian, B.; Wang, H. Effects of Anionic Emulsifiers and Emulsified Asphalt on Hydration and Microstructure of Cement. Materials 2024, 17, 36. [Google Scholar] [CrossRef] [PubMed]
- Li, W.; Mao, Z.; Xu, G.; Chang, H.; Hong, J.; Zhao, H.; Xu, J.; Liu, Z. Study on the early cement hydration process in the presence of cationic asphalt emulsion. Constr. Build. Mater. 2020, 261, 120025. [Google Scholar] [CrossRef]
- Li, W.; Zhu, X.; Hong, J.; She, W.; Wang, P.; Zuo, W. Effect of anionic emulsifier on cement hydration and its interaction mechanism. Constr. Build. Mater. 2015, 93, 1003–1011. [Google Scholar] [CrossRef]
- Xin, Q.; Gao, R.; Shao, P.; Lyu, W.; Wei, H. Effect of Different Water-Binder Ratios and Fiber Contents on the Fluidity and Mechanical Properties of PVA-ECC Materials. Teh. Vjesn. 2023, 30, 1366–1372. [Google Scholar]
- Zhang, W.; Yin, C.; Ma, F.; Huang, Z. Mechanical properties and carbonation durability of engineered cementitious composites reinforced by polypropylene and hydrophilic polyvinyl alcohol fibers. Materials 2024, 11, 1147. [Google Scholar] [CrossRef] [PubMed]
- Kaufmann, J.; Frech, K.; Schuetz, P.; Münch, B. Rebound and orientation of fibers in wet sprayed concrete applications. Constr. Build. Mater. 2013, 49, 15–22. [Google Scholar] [CrossRef]
- Martinie, L.; Rossi, P.; Roussel, N. Rheology of fiber reinforced cementitious materials: Classification and prediction. Cem. Concr. Res. 2010, 40, 226–234. [Google Scholar] [CrossRef]
- Zhang, S.; Zhao, B. Research on the performance of concrete materials under the condition of freeze-thaw cycles. Eur. J. Environ. Civ. Eng. 2013, 17, 860–871. [Google Scholar] [CrossRef]
- Łaźniewska-Piekarczyk, B. The type of air-entraining and viscosity modifying admixtures and porosity and frost durability of high performance self-compacting concrete. Constr. Build. Mater. 2013, 40, 659–671. [Google Scholar] [CrossRef]
- Odler, I.; Rößler, M. Investigations on the relationship between porosity, structure and strength of hydrated Portland cement pastes. II. Effect of pore structure and of degree of hydration. Cem. Concr. Res. 1985, 15, 401–410. [Google Scholar] [CrossRef]
- Hover, K. Why is there air in concrete? Concr. Constr. 1993, 38, 11–15. [Google Scholar]


| Type of Cement | Mass Fraction (wt.%) | |||||||||
|---|---|---|---|---|---|---|---|---|---|---|
| SiO2 | CaO | Al2O3 | SO3 | MgO | Fe2O3 | KO2 | Na2O | TiO2 | LOI | |
| Portland cement | 21.50 | 64.20 | 4.14 | 2.89 | 2.57 | 2.40 | 0.84 | 0.67 | 0.32 | 0.40 |
| Calcium aluminate cement | 0.68 | 26.80 | 71.30 | 0.04 | 0.46 | 0.09 | 0.02 | 0.37 | 0.11 | 0.07 |
| Diameter (μm) | Length (mm) | Tensile Strength (MPa) | Young’s Modulus (Gpa) | Elongation (%) | Density (g/cm3) |
|---|---|---|---|---|---|
| 31 | 6 | 1500 | 40 | 6 | 1.28 |
| Group | W/S | S/B | CAC (%) | EA (%) | PVA (%) |
|---|---|---|---|---|---|
| W/S-0.12 | 0.12 | 0.4 | 20 | 5 | 1.0 |
| W/S-0.13 | 0.13 | ||||
| W/S-0.14 | 0.14 | ||||
| W/S-0.15 | 0.15 | ||||
| W/S-0.16 | 0.16 | ||||
| S/B-0.2 | 0.14 | 0.2 | 20 | 5 | 1.0 |
| S/B-0.3 | 0.3 | ||||
| S/B-0.4 | 0.4 | ||||
| S/B-0.5 | 0.5 | ||||
| S/B-0.6 | 0.6 | ||||
| CAC-10 | 0.14 | 0.5 | 10 | 5 | 1.0 |
| CAC-15 | 15 | ||||
| CAC-20 | 20 | ||||
| CAC-25 | 25 | ||||
| CAC-30 | 30 | ||||
| EA-0.0 | 0.14 | 0.5 | 25 | 0.0 | 1.0 |
| EA-2.5 | 2.5 | ||||
| EA-5.0 | 5.0 | ||||
| EA-7.5 | 7.5 | ||||
| EA-10.0 | 10.0 | ||||
| PVA-0.0 | 0.14 | 0.5 | 25 | 5 | 0.0 |
| PVA-0.5 | 0.5 | ||||
| PVA-1.0 | 1.0 | ||||
| PVA-1.5 | 1.5 | ||||
| PVA-2.0 | 2.0 |
Disclaimer/Publisher’s Note: The statements, opinions and data contained in all publications are solely those of the individual author(s) and contributor(s) and not of MDPI and/or the editor(s). MDPI and/or the editor(s) disclaim responsibility for any injury to people or property resulting from any ideas, methods, instructions or products referred to in the content. |
© 2024 by the authors. Licensee MDPI, Basel, Switzerland. This article is an open access article distributed under the terms and conditions of the Creative Commons Attribution (CC BY) license (https://creativecommons.org/licenses/by/4.0/).
Share and Cite
Hou, Y.; Niu, K.; Tian, B.; Chen, J.; Li, X. Development of Negative-Temperature Cement Emulsified Asphalt Spraying Materials Based on Spraying Performance and Rheological Parameters. Materials 2024, 17, 3137. https://doi.org/10.3390/ma17133137
Hou Y, Niu K, Tian B, Chen J, Li X. Development of Negative-Temperature Cement Emulsified Asphalt Spraying Materials Based on Spraying Performance and Rheological Parameters. Materials. 2024; 17(13):3137. https://doi.org/10.3390/ma17133137
Chicago/Turabian StyleHou, Yitong, Kaimin Niu, Bo Tian, Junli Chen, and Xueyang Li. 2024. "Development of Negative-Temperature Cement Emulsified Asphalt Spraying Materials Based on Spraying Performance and Rheological Parameters" Materials 17, no. 13: 3137. https://doi.org/10.3390/ma17133137