Article

Experimental Study of the Flexural Performance of GFRP-Reinforced Seawater Sea Sand Concrete Beams with Built-In GFRP Tubes

College of Engineering, Ocean University of China, Qingdao 266100, China
*
Authors to whom correspondence should be addressed.
Materials 2024, 17(13), 3221; https://doi.org/10.3390/ma17133221
Submission received: 29 April 2024 / Revised: 26 June 2024 / Accepted: 28 June 2024 / Published: 1 July 2024

Abstract

:
The use of seawater sea sand concrete (SSSC) and fiber-reinforced polymer (FRP) has broad application prospect in island and coastal areas. However, the elastic modulus of FRP reinforcement is obviously lower than that of ordinary steel reinforcement, and the properties of SSSC are different from that of ordinary concrete, which results in a limit in the bearing capacity and stiffness of structures. In order to improve the flexural performance of FRP-reinforced SSSC beams, a novel SSSC beam with built-in glass FRP (GFRP) tubes was proposed in this study. Referring to many large-scale beam experiments, one specimen was used for one situation to illustrate the study considering costs and feasibility. Firstly, flexural performance tests of SSSC beams with GFRP tubes were conducted. Then, the effects of the GFRP tubes’ height, the strength grades of concrete inside and outside the GFRP tubes, and the GFRP reinforcement ratio on the flexural behaviors of the beams were investigated. In addition, the concept of capacity reserve was proposed to assess the ductility of the beams, and the interaction between the concrete outside the GFRP tube, the GFRP tube and concrete inside the tube was discussed. Finally, the formulas for the normal section bearing capacity of beams with built-in GFRP tubes were derived and verified. Compared to the beam without GFRP tubes, under the same conditions, the ultimate bearing capacities of the SSSC beam with 80 mm, 100, and 200 mm height GFRP tubes were increased by 17.67 kN, 24.52 kN, and 144.42 kN, respectively.

1. Introduction

Seawater sea sand concrete (SSSC) has been widely applied in civil engineering [1,2,3] due to its environmental friendliness, freezing resistance, and low cost. However, seawater and sea sand contain high salt contents, leading to the chloride ion corrosion of steel bars in practical engineering, which severely affects the durability of SSSC structures [4,5]. Fiber reinforced polymer (FRP) has strong corrosion resistance, high tensile strength, light weight, and good fatigue resistance. It can replace corrosion-prone steel bars in structures [6,7,8]. However, FRP bars have some disadvantages, such as low shear strength and low elastic modulus, resulting in the brittle failure of FRP-reinforced concrete beams [9,10,11], which contradicts the ductility design of concrete structures. China’s national standards [12] and design guidelines generally recommend designing FRP-reinforced concrete beams as over-reinforced beams, and it utilizes the plastic deformation of the compressed concrete zone to improve the ductility of the components. However, the failure mode of over-reinforced beams manifests as the crushing of the compressed concrete zone, which is still classified as brittle failure.
Moreover, the replacement of seawater and sea sand further reduces the ductility of concrete beams [13,14]. An experiment by Chen et al. [15] showed that the stress–strain curves of seawater sea sand concrete were steeper than that of ordinary concrete. Pan et al. [16] observed that the utilization of seawater and sea sand enhanced the early compressive strength of concrete but led to a slight decrease in strength. Younis et al. [17] compared the performance of seawater and freshwater concrete and observed a significant reduction in workability when seawater was used. Due to the abovementioned reasons, the study on improving ductility of FRP-reinforced SSSC beams is of great significance.
Currently, there are various methods of improving the ductility of FRP-reinforced concrete structures. Li et al. [18] found that mixed FRP constraint effectively improved the bearing capacity and ductility of concrete columns. Won et al. [19] proved the resistance of hybrid FRP bars to aggressive environments. You et al. [20] investigated the tensile property of hybrid FRP bars, revealing a 33% increase in ultimate strain for hybrid FRP bars compared to non-hybrid FRP bars. Ge et al. [21] studied steel–FRP hybrid reinforcement for concrete beams, and the hybrid reinforcement demonstrated higher stiffness, smaller crack widths, and greater bending resistance. Wang et al. [22] found that steel–carbon fiber-composite-bar-reinforced beams performed better than CFRP-reinforced beams under the same reinforcement ratio conditions. Yun et al. [23] suggested that the performance of the steel-fiber-reinforced concrete containing high-strength steel fiber was superior to that containing normal-strength steel fiber. Haktanir et al. [24] discovered that steel fiber concrete pipes were mechanically and physically superior to reinforced concrete pipes. An experiment by Bencardino et al. [25] showed that fibers greatly improved concrete durable service life. A study by Iqbal et al. [26] indicated an increase in tensile strength and flexural strength of concrete using closed steel fibers compared to that using straight steel fibers. Qeshta et al. [27] found that the wire mesh–epoxy composite could effectively enhance the performance of concrete beams and increase structural ductility.
Previous studies proved that utilizing FRP-reinforced stirrups to confine the compressed concrete zone significantly improved the shear resistance [28,29,30], flexural performance [31,32], and ductility [33,34,35] of the concrete structures. Hadi et al. [36] discovered that locally confining stirrups significantly increased the compressive strain of the confined concrete through experiment, thereby improving the overall performance of the beam. Priastiw et al. [37] observed that hoop confinement had a minor impact on flexural strength but increased the curvature ductility of the beam through bending tests. According to the theoretical analysis results of Renic et al. [38], confining the compressive area of concrete beams with FRP reinforcement greatly improved their ductility and load bearing capacity, and it had been experimentally verified [39]. Michael et al. [40] proposed a novel approach to improving the flexural capacity of over-reinforced concrete members by using carbon-fiber-reinforced polymer grid tubes for concrete confinement in the compression zone. The test results from Mohamed et al. [41] indicated that compared to beams reinforced with spiral steel, beams confined with FRP tubes exhibited higher stiffness and ductility. Huang et al. [42] conducted experiments on GFRP-confined compressed concrete of pure bending sections, and the results indicated that the failure of the beams did not occur suddenly but rather exhibited a premonitory ductile failure.
From previous research, it is suggested that FRP tubes may enhance the ductility of beams, but research on using FRP tubes to confine the compressed concrete in beams is relatively scarce. Therefore, in this study, glass FRP (GFRP) tubes were employed to confine the compressed zone of the SSSC along the entire length of the beam. Researchers have extensively studied large-scale beam reinforcement by experiments [43,44,45,46,47,48,49], but there was only one specimen for each case. Performance tests of GFRP-reinforced SSSC beams with built-in GFRP tubes were conducted, and the test results were comprehensively analyzed. The results of this test represented mean values. The study would provide references for the improvement of the flexural performance of SSSC beams. This research is beneficial to alleviating the pressure on freshwater resources and improving the stability of coastal structures.

2. Experiment Design

2.1. Beam

A total of 10 SSSC beams were designed to investigate the effects of the GFRP tubes’ height, the strength grades of concrete inside and outside the tubes, and the GFRP reinforcement ratio on the flexural performance of the beams. Among them, nine beams had GFRP tubes for confining the compressed zone of SSSC, and the remaining one beam was served for comparison. The specific parameters of the beams are listed in Table 1. The length of the beams was 2100 mm, and the bending–shear section was densely reinforced with GFRP stirrups. The beam’s cross section was 220 mm × 320 mm, with a protective layer thickness of 25 mm, stirrup diameter of 8 mm, and tube thickness of 8 mm. The GFRP reinforcement and tube height varied based on the research variables. Considering the construction, the distance between the upper surface of concrete and the GFRP tube was 40 mm. The schematic diagram of the test beams is shown in Figure 1, and Figure 2 shows the fabrication process of the specimens.

2.2. Materials

2.2.1. Concrete

The seawater used in this study was artificially prepared according to ASTM D1141-98 (2013) [50]. The chemical composition of the artificial seawater is presented in Table 2. The PO.42.5 cement was utilized. River sand with an apparent density of 2494 kg/m3 and bulk density of 1560 kg/m3 was used as fine aggregate, and its fineness modulus was 2.8, which was classified as medium sand. The coarse aggregate was granite-crushed stone with a continuous size range of 5–10 mm, the apparent density and bulk density of which were 2713 kg/m3 and 1495 kg/m3, respectively. The water reducer was polycarboxylate superplasticizer with a 32% reduction rate. The concrete proportioning design is listed in Table 3.
The seawater sea sand concrete was poured in three batches, and concrete test blocks were reserved for each batch. In the first batch, the concrete was poured in the GFRP tubes. When pouring in the GFRP tube, the GFRP tube was vertically placed. During the pouring process, the concrete was compacted and the tube wall was vibrated to ensure that the concrete completely filled the GFRP tube. After curing the concrete in the tube for 7 days, the 10 concrete beams were poured in the last 2 batches. The test blocks were cured for 28 days under the same condition. The test results of concrete test blocks are illustrated in Table 4. It can be seen that the concrete properties of different batches are close.

2.2.2. GFRP

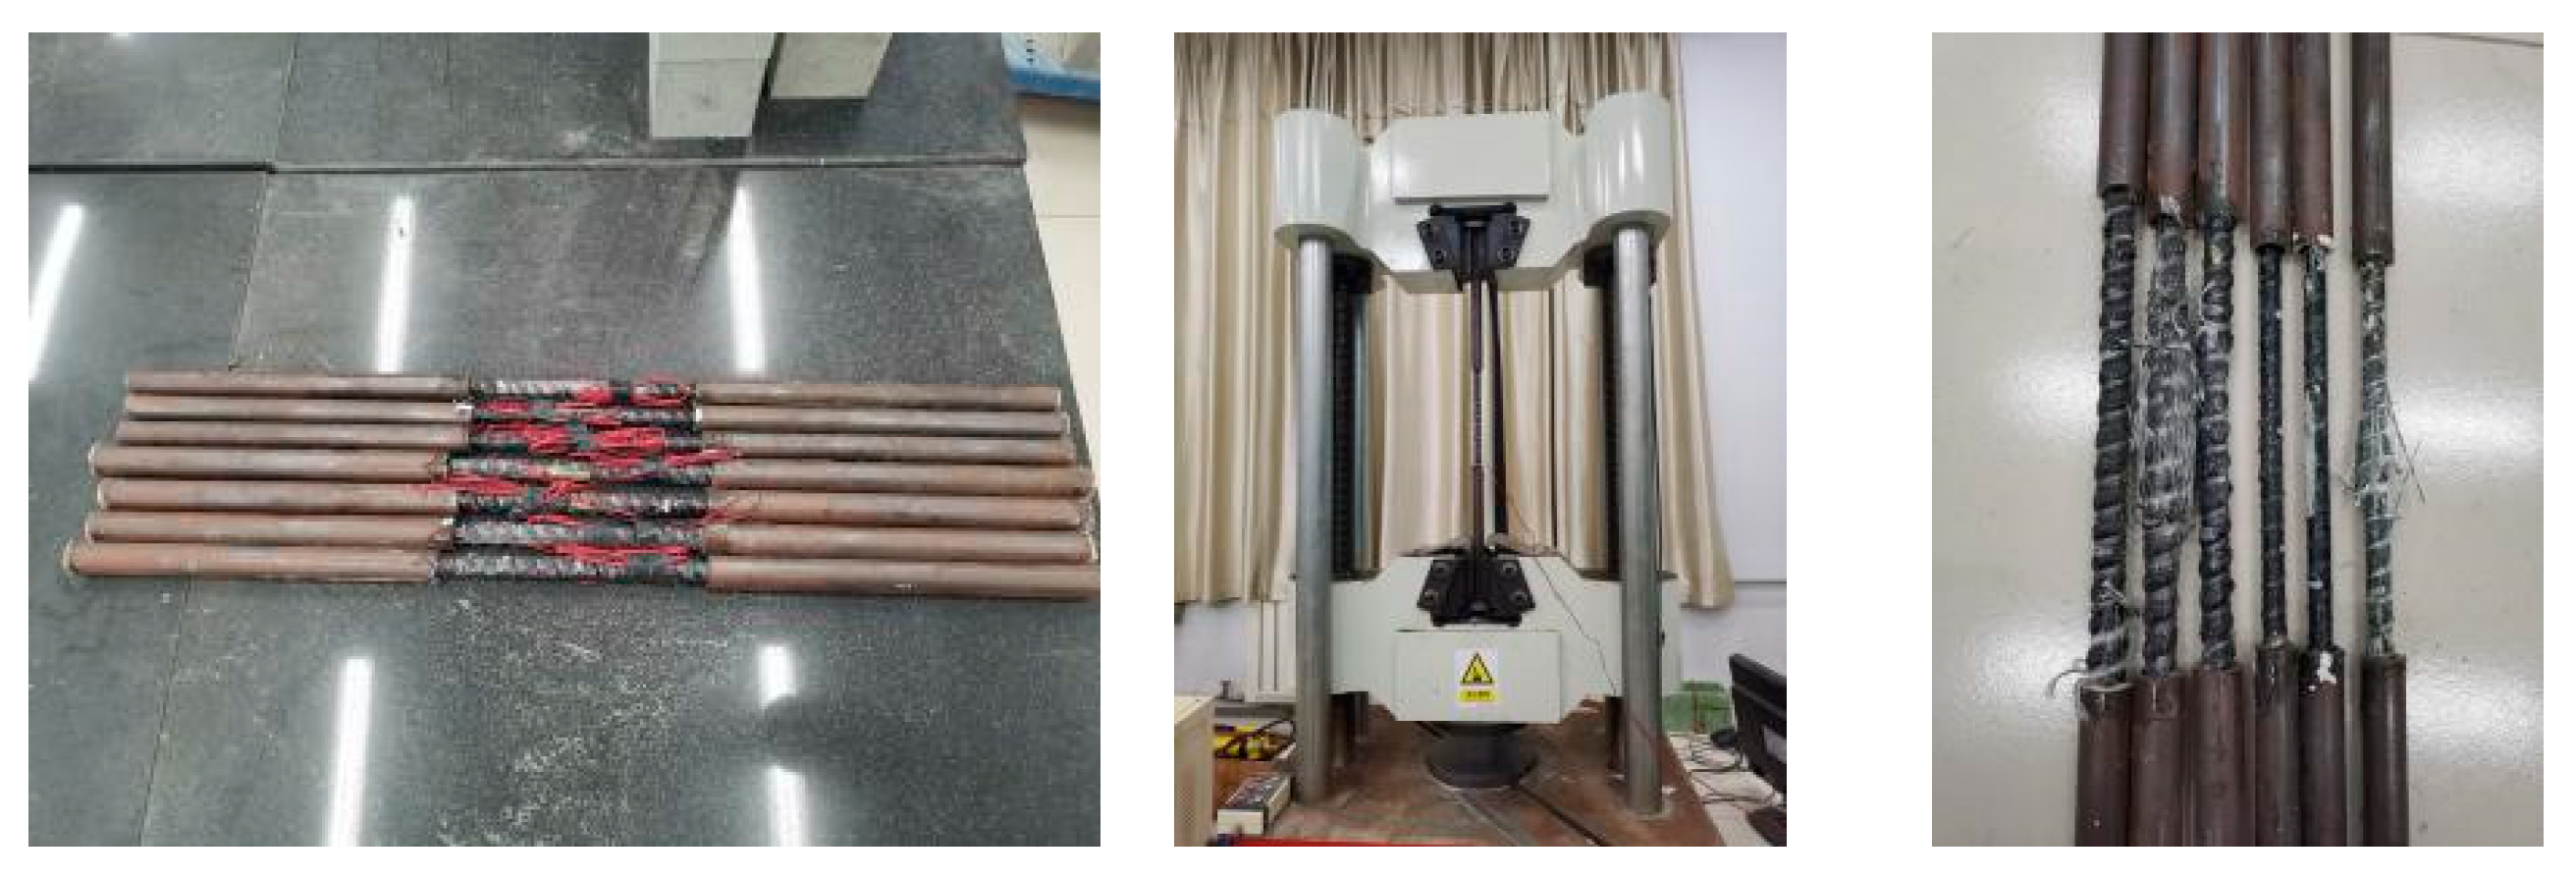
The 12 mm and 16 mm GFRP bars were used. The GFRP bars were tested according to the Test Method for Basic Mechanical Properties of Fiber Reinforced Polymer Bar [51]. The length of the GFRP bars for the performance test was 800 mm. The strain gauges were placed at the middle of the bars. The two ends of the bars were anchored with 300 mm long steel sleeves. Subsequently, the bars were put on the universal testing machine to carry out the tensile test at a loading speed of 1 kN/s. The elastic modulus was taken as the slope between the stress–strain points corresponding to 20% and 50% of the peak load.
Based on the Test Method for Tensile Properties of Orientation Fibre Reinforced Polymer Matrix Composite Materials [52], the GFRP tubes were cut in the axial and circumferential directions into long strips with dimensions of 25 mm × 250 mm and 12.5 mm × 250 mm, respectively, and strain gauges were attached at the middle. The GFRP strips were subjected to tensile testing on the universal testing machine. The cyclic tensile elastic modulus was taken as the slope between the strain points of 0.001 and 0.003, and the axial tensile elastic modulus was taken as the slope between the strain points of 0.0005 and 0.0015.
The tensile tests of GFRP bars and tubes are shown in Figure 3 and Figure 4, respectively, and the specific performance parameters of GFRP bars and tubes are provided in Table 5.

2.3. Test Loading

The YHD-50 displacement sensors were arranged at the beam supports, and two YWD-100 displacement sensors were set up at the mid-span position. The force sensor was a YBY-2000kN spoke type sensor which was manufactured by Kefa Testing Instrument Factory in Liyang City, Jiangsu Province, China. In the early stage of the test, force-controlled graded loading was used, with 10 kN per stage, and the load was held for 2–5 min each time. When cracks appeared, the load was held and the cracks were recorded. When no new cracks appeared, displacement control grading loading was used, 1 mm per level, holding load for 2–5 min, until the beam was damaged. The load, displacement, and strain data were collected by the DH3816 static strain test system which was produced by Jiangsu Donghua Testing Technology Co., Ltd. in China. The loading device and layout of measuring points are shown in Figure 5 and Figure 6, respectively.

3. Test Process

3.1. Destruction Process

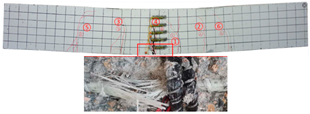
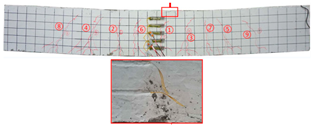
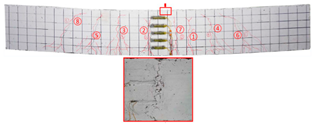
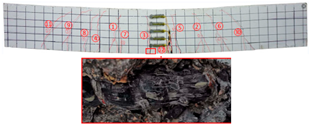
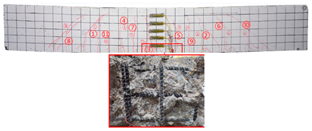
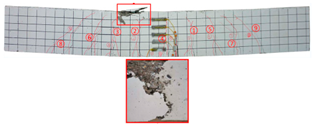
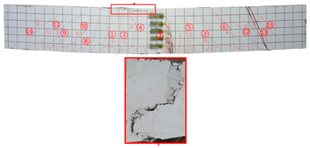
Most of the tensile cracks at the pure bending section of the specimens were generated at the early stage of loading, while the diagonal shear cracks at the shear bending section were less. As the loading increased, the original cracks continued to develop and extended to branch, and eventually reached about 5/6 beam height. Overall, the specimens showed rare-reinforced damage and over-reinforced damage modes. It should be pointed out that since the computer system was not used to control the loading process, the load decayed rapidly after the specimens reached the ultimate load, and the curves at this stage were not very satisfactory. By analyzing the P–w curve, the ultimate load capacity of the specimens can be achieved. The crack development sequences, damage characteristics and the corresponding relationships between crack development and load for each specimen are displayed in Table 6. NT-2GR16-C30, GT80-2GR12-C30, and GT80-2GR16-C50/30 showed rare-reinforced damage, and the GFRP fiber broke at the late stage of loading. Finally, the tensile GFRP bars fractured with a loud noise. NT-2GR16-C30 broke in half with the fracture of the GFRP bars.
It should be noted that when the specimens reached the ultimate load capacity, the tiny cracks that originally appeared at the upper flange of the midspan suddenly enlarged and extended along the horizontal direction. This is due to the fact that the elastic modulus of the GFRP stirrups was small, which could not provide strong restraint on the concrete outside the tube.

3.2. Damage Patterns

Through comparing the crack development in Table 6, it can be seen that NT-2GR16-C30, GT80-2GR16-C30/30, and GT100-2GR16-C30/30 had 9 main cracks, while GT200-2GR16-C30/30 had 15 main cracks, and the cracks were intensive, especially at the lower edge of the tube. It is demonstrated that the arrangement of GFRP tubes with heights of 80 mm and 100 mm in the SSSC beams had little influence on crack development.
NT-2GR16-C30 showed rare-reinforcement damage, and the beam was overall fractured. GT80-2GR16-C30/30, GT100-2GR16-C30/30, and GT200-2GR16-C30/30—the GFRP tubes of which were set in the compression zone—also showed the features of rare-reinforcement damage, and the tensile reinforcement failed, but the overall fracture phenomenon did not emerge.
The 80 mm height GFRP tubes were arranged in Beams 2, 3, and 7. The crack distribution of the GT80-2GR12-C30/30 beam sparser, and that of GT80-3GR16-C30/30 was denser. The 100 mm height GFRP tubes were arranged in Beams 8 and 9. Similarly, the crack distribution of GT100-3GR16-C30/30 was denser. Therefore, it can be inferred that the crack number of GFRP-reinforced SSSC beams with built-in GFRP tubes increased with the increase in reinforcement ratio under the same conditions.
According to the Technical Standard for Fiber Reinforced Polymer in Construction GB50608-2020 [12], the critical reinforcement ratios 1.5ρb of C30 and C50 concrete beams are 0.823% and 1.371%, respectively. Generally, rare-reinforced damage occurs in GFRP-reinforced concrete beams when ρ < ρb; rare-reinforced or over-reinforced damage may occur when ρb < ρ < 1.5ρb; over-reinforced damage occurs when ρρb. Most of the test beams complied to the damage modes.
Comparing GT80-2GR16-C30/30, GT80-2GR16-C30/50, GT80-2GR16-C50/30, and GT80-2GR16-C50/50, the strength grades of concrete inside the tubes of which increased from C30 to C50, it can be found that the number of the main cracks increased slightly with the increasing the strength grade of the concrete outside the tube, but the crack branches decreased with the cracks being more sparsely distributed. In addition, GT80-2GR16-C30/30 and GT80-2GR16-C30/50 displayed more intensive tension cracks at the tension reinforcement due to the low strength of the exterior concrete.

4. Test Analysis

4.1. Effects of GFRP Tube

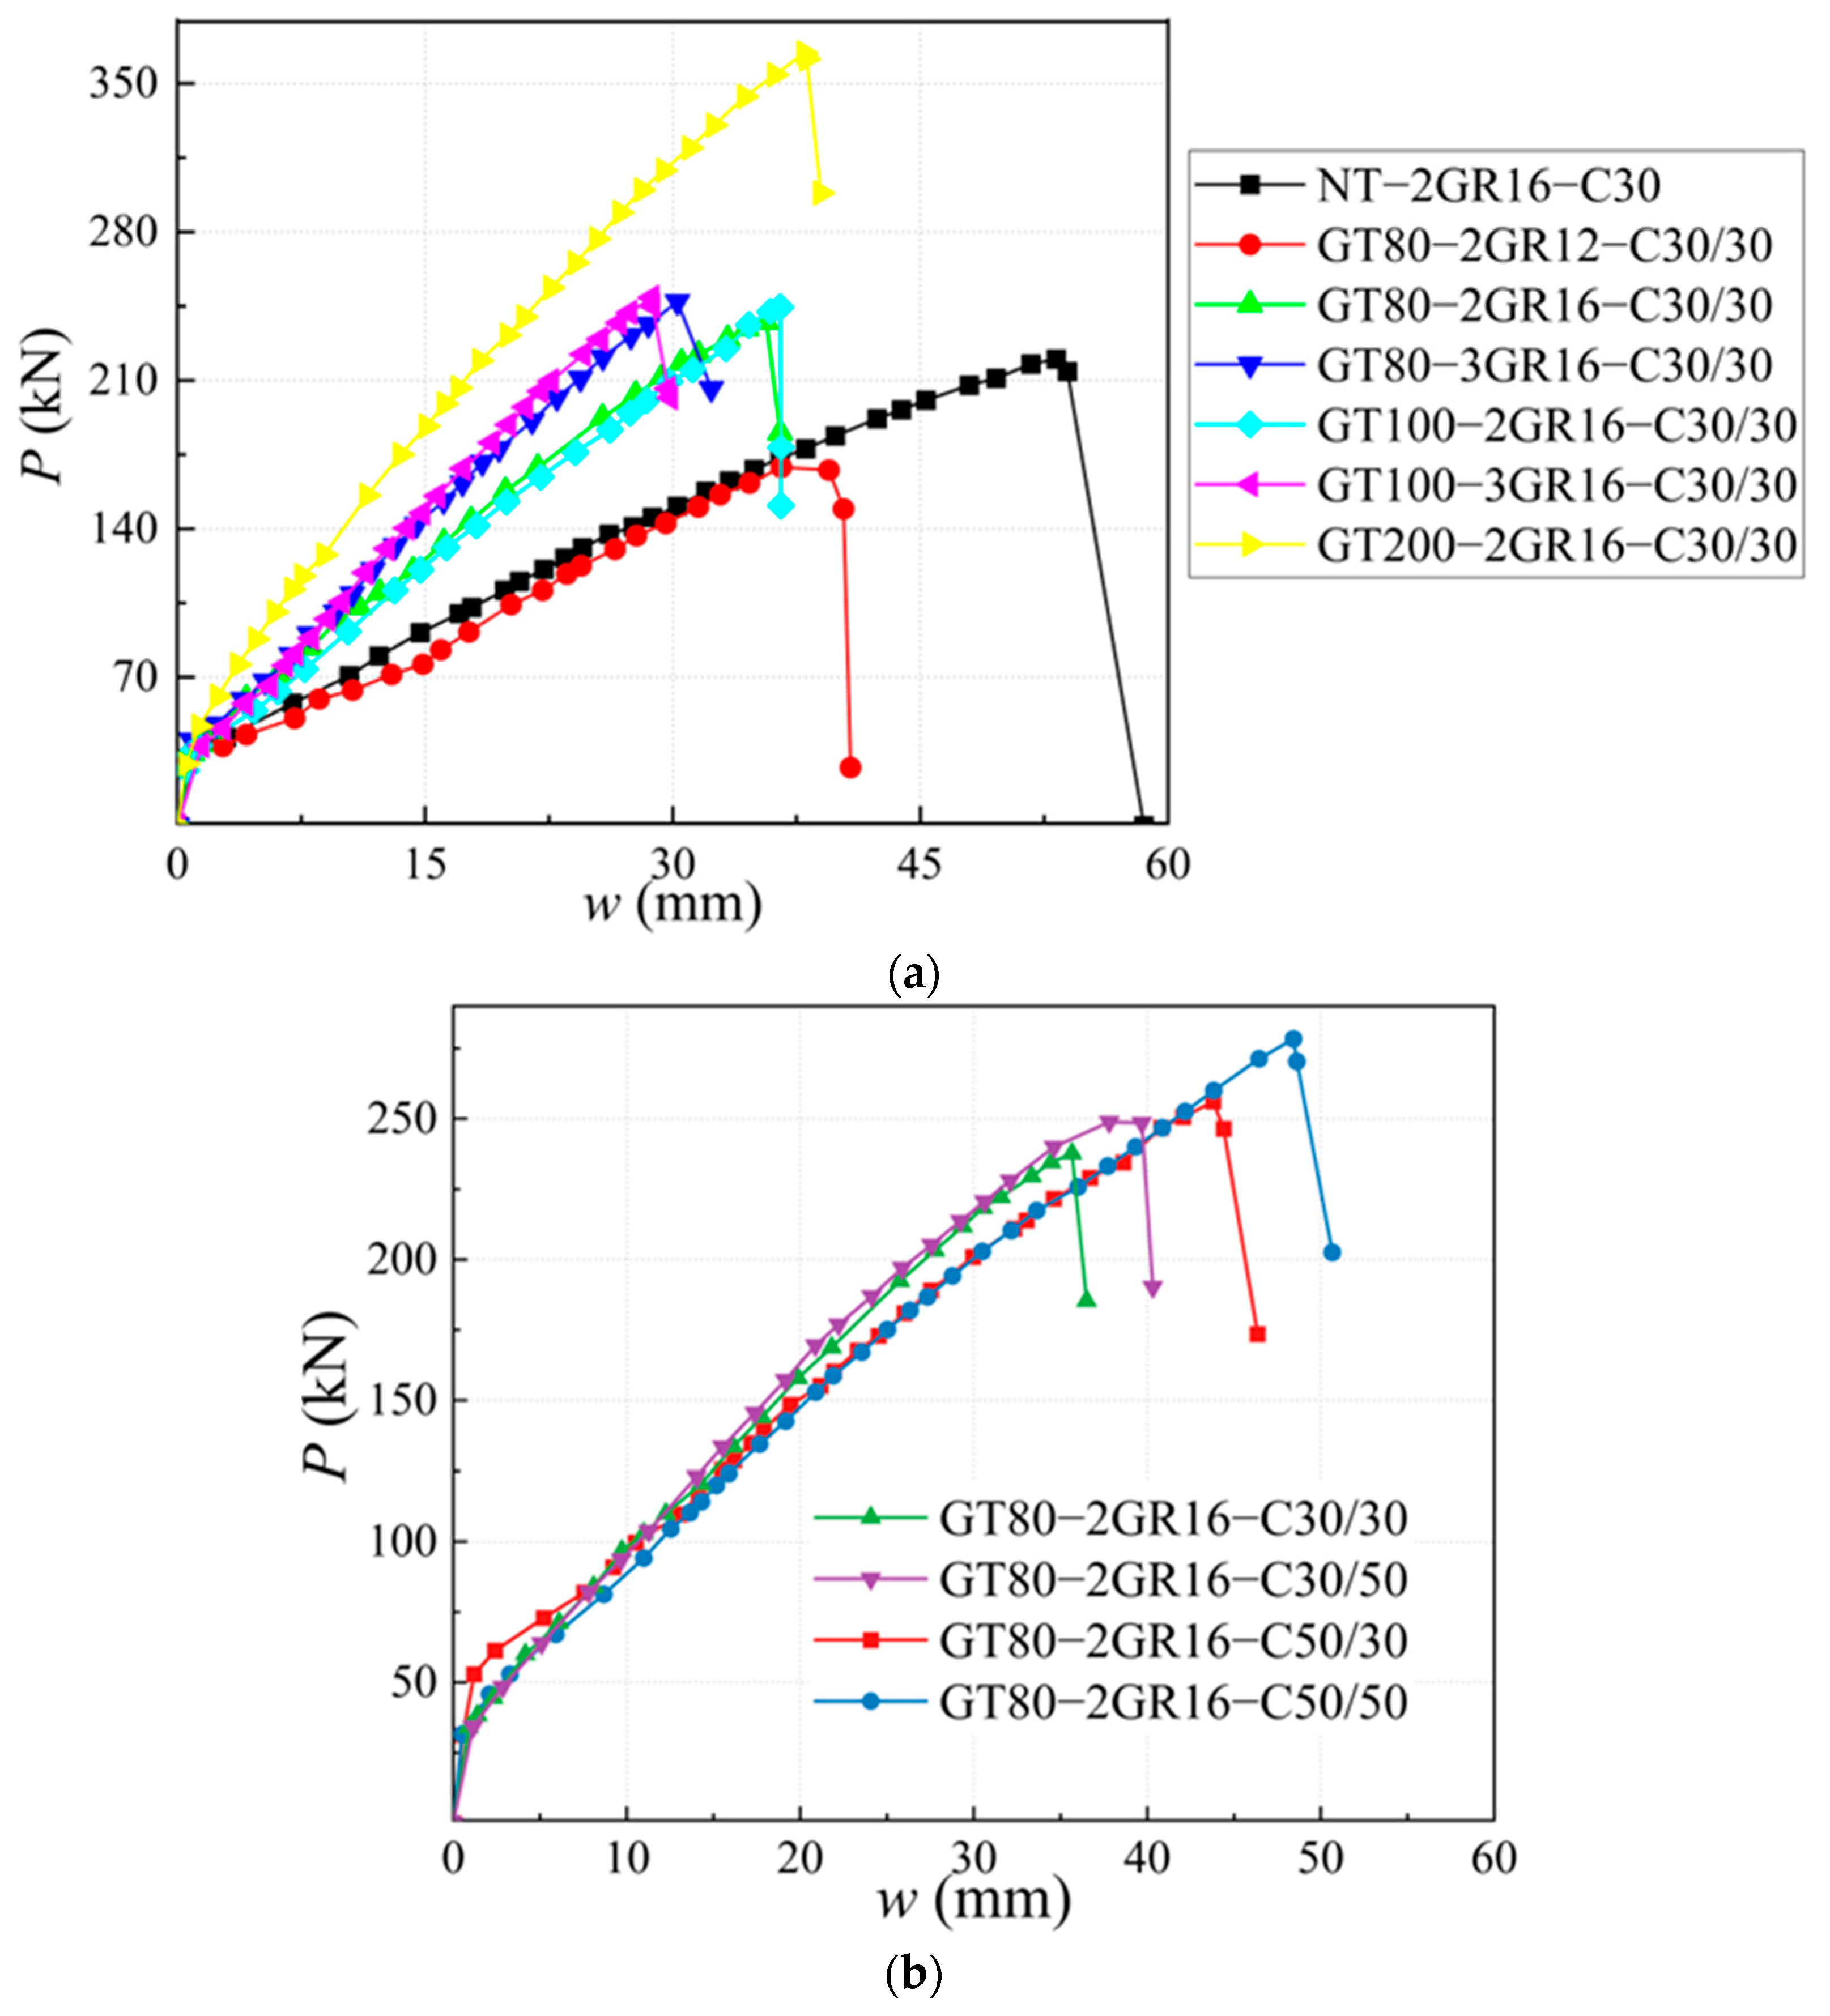
To study the effects of GFRP tubes on the mechanical behavior of the SSSC beams, the load–deflection (P–w) curves of three specimens with 80 mm height GFRP tubes (GT80-2GR12-C30/30, GT80-2GR16-C30/30, and GT80-3GR16-C30/30); two specimens with 100 mm height GFRP tube (GT100-2GR16-C30/30 and GT100-3GR16-C30/30); and the specimen with 200 mm height GFRP tube (GT200-2GR16-C30/30) are compared to that of the specimen NT-2GR16-C30, as shown in Figure 7a.
As can be seen from Figure 7a, the ultimate load capacities of NT-2GR16-C30, GT80-2GR16-C30/30, GT100-2GR16-C30/30, and GT200-2GR16-C30/30 were 220 kN, 237.67 kN, 244.52 kN, and 364.42 kN, respectively. Furthermore, the displacements corresponding to the ultimate load capacity of the specimens were significantly reduced from 53.23 mm (NT-2GR16-C30) to 35.66 mm (GT80-2GR16-C30/30), 36.50 mm (GT100-2GR16-C30/30), and 37.97mm (GT200-2GR16-C30/30). In general, compared to NT-2GR16-C30, the ultimate load capacity of SSSC beam was significantly enhanced by the arrangement of GFRP tube, and it raised with the increase in the tube height.
The P–w curves of GT80-3GR16-C30/30 and GT100-3GR16-C30/30 were basically identical. Compared to GT80-2GR16-C30/30 and GT100-2GR16-C30/30, the slope of the P–w curves of GT80-3GR16-C30/30 and GT100-3GR16-C30/30 grew remarkably, with increased ultimate loads and decreased corresponding deflections.
The slopes of the P–w curves of all specimens were similar before the concrete cracked. After concrete cracked, the P–w curve of GR80-2GR12-C30/30 was approximately the same as that of NT-2GR16-C30; the slopes of P–w curves of the other specimens were weakened to a relatively small extent. The P–w curves of GT80-2GR16-C30/30 and GT100-2GR16-C30/30 were basically same, and the P–w curves of GT80-3GR16-C30/30 and GT100-3GR16-C30/30 were also identical. Hence, the impacts of tube height on the P–w curves were limited, while that of the reinforcement ratio was critical.

4.2. Effects of Reinforcement Ratio

GT80-2GR12-C30/30, GT80-2GR16-C30/30, and GT80-3GR16-C30/30 had 80 mm height GFRP tubes. GT100-2GR16-C30/30 and GT100-3GR16-C30/30 had 100 mm height GFRP tubes. Thus, the effects of reinforcement ratio are investigated through comparing the P–w curves of the specimens with the same tube height.
When the height of the GFRP tube was same, the slopes of the P–w curves displayed significant growth with the increase in the reinforcement ratio, the ultimate load capacity of the beams significantly increased and the corresponding displacement was reduced. The ultimate load capacities of GT80-2GR12-C30/30, GT80-2GR16-C30/30, and GT80-3GR16-C30/30 were 169.03 kN, 237.67 kN, and 247.10 kN, respectively, with the deflection gradually becoming smaller.
By increasing the tube height from 80 mm to 100 mm with the same reinforcement, the P–w curves of GT80-2GR16-C30/30 and GT100-2GR16-C30/30 were almost overlapped, and similar rules can be found in GT80-3GR16-C30/30 and GT100-3GR16-C30/30.

4.3. Effects of the Strengths Grade of Concrete inside and outside Tube

The P–w curves of GT80-2GR16-C30/30, GT80-2GR16-C30/50, GT80-2GR16-C50/30, and GT80-2GR16-C50/50 are shown in Figure 7b, and the differences between the specimens are the strengths of concrete inside and outside the GFRP tube.
The P–w curves of GT80-2GR16-C30/30 and GT80-2GR16-C30/50 were consistent until reaching the ultimate load. The ultimate load capacities of GT80-2GR16-C30/30 and GT80-2GR16-C30/50 were 237.67 kN and 248.90 kN, respectively, and the deflection corresponding to the ultimate load capacity of GT80-2GR16-C30/50 was 37.81 mm, which was increased by 2.15 mm compared to GT80-2GR16-C30/30. In addition, GT80-2GR16-C30/50 presented obvious plastic characteristics when approaching the ultimate load capacity. GT80-2GR16-C50/30 and GT80-2GR16-C50/50 had similar characteristics. Increasing the strength grade of the concrete inside the tube resulted in a growth of 22.26 kN in the ultimate load capacity and 4.62 mm in the corresponding deflection, respectively. Therefore, it can be concluded that increasing the strength grade of the concrete inside tube did not affect the slope of the P–w curve, but it improved the ultimate load and deformation capacities of the specimens.
The slopes of the P–w curves of GT80-2GR16-C50/30 and GT80-2GR16-C30/30 were roughly coincident at the early loading stage (deflection < 15 mm), and the difference between the two P–w curves gradually increased. The P–w curve’s slope of GT80-2GR16-C30/30 was slightly larger than that of GT80-2GR16-C50/30.

4.4. Ductility Analysis

According to Jaeger et al. [53] and Spadea et al. [54], the deformation capacity reserve factor DR, the load capacity reserve factor CR, and the overall performance factor J are used to measure the specimen ductility. The DR, CR, and J can be obtained as follows:
D R = 1 ϕ 0.001 ϕ u × 100 %
C R = 1 M 0.001 M u × 100 %
J = 1 1 D R 1 C R
where M0.001 and ϕ 0.001 are the bending moment and curvature when the compressive strain of the compressed concrete reaches 0.001, respectively; Mu and ϕ u are the ultimate bending moment and ultimate curvature, respectively. The 0.001 compressive strain is taken as the criterion of serviceability limit state [53,54]. The curvature values ϕ 0.001 and ϕ u are calculated based on the deflection data at the two ends of the beam and the mid-span.
Table 7 lists the ductility parameters of the specimens. NT-2GR16-C30 presented the highest ductility, and the ductility of GT200-2GR16-C30/30 was also relatively high. In addition, it can be concluded from Table 7 that increasing the reinforcement ratio and the concrete strength would lead to a decrease in the ductility. The strength of the concrete outside the tube being less than that of the concrete inside of the tube was beneficial to the ductility of the beam.

5. Ultimate Capacity

5.1. Strain

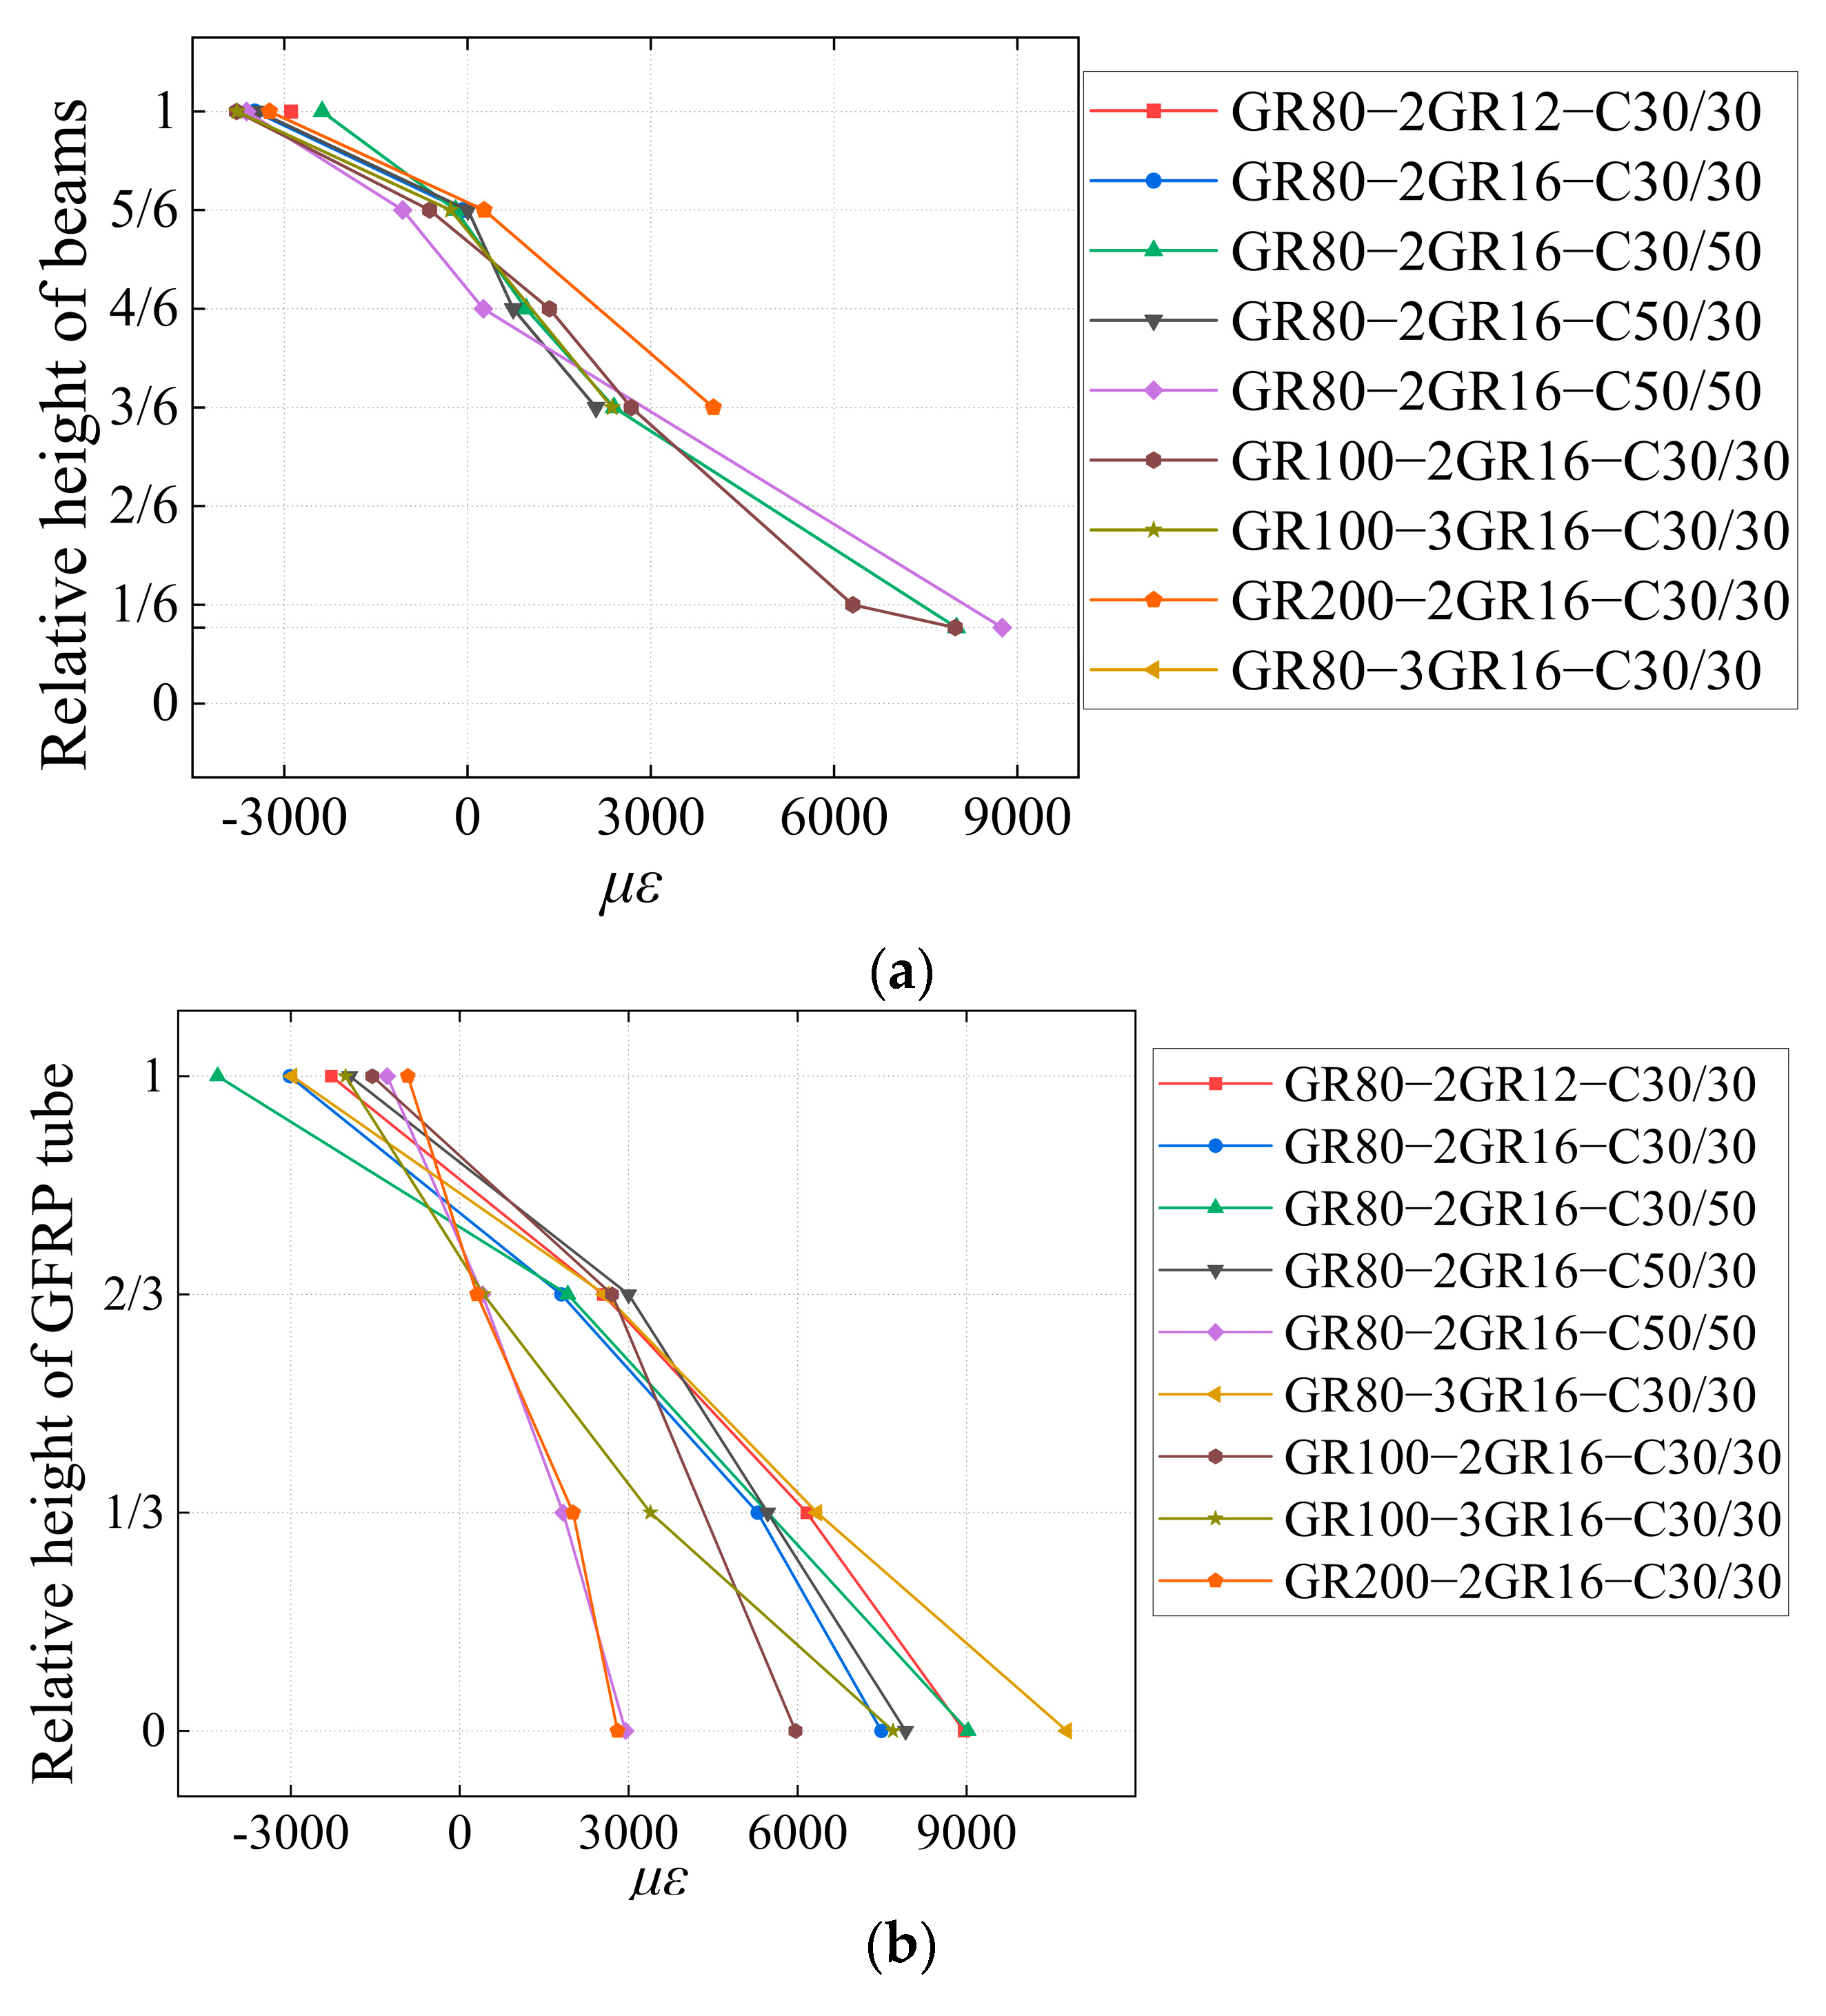
To obtain the flexural behavior of the beams, the strain distribution laws of concrete, GFRP bars, and tubes are summarized when the specimen reaches the ultimate load capacity, and the role of the GFRP tube in influencing the stress state of the specimen is analyzed. Figure 8 shows the strain of concrete, GFRP bars and tubes.
According to Figure 8a, it can be seen that the tensile reinforcement could work together with the concrete outside the GFRP tube, and the section formed by them basically conformed to the flat cross section assumption. The neutral axis of the concrete was mostly at a distance of about 53 mm from the edge of the compressed concrete. From Figure 8b, the GFRP tube strain also basically conformed to the flat section assumption. The distance between the neutral axis and the edge of the compressed concrete for the three types of GFRP tubes was roughly 67–93 mm (80 mm height tube), 73–107 mm (100 mm height tube), and 107–173 mm (200 mm height tube), respectively. In fact, the neutral axis of the tube was near the central axis of the tube cross section. As the tube cross section increased in height and the central axis moved down, the neutral axis of the tube naturally moved down. Thus, the distance of the neutral axis from the edge of the compression zone increased with the increase of the tube height. Therefore, under the ultimate load capacity stage, the restraining effects of the concrete outside the GFRP tube on the GFRP tube, and the interaction between them should be considered.

5.2. Interaction

The SSSC beams with built-in GFRP tubes are divided into two parts: concrete outside the GFRP tube, GFRP tube and concrete inside the tube. The interaction between the two parts is achieved through chemical bonding and friction, and the strength of the interaction depends on the relative position between the GFRP tube and the external concrete, the strengths of the concrete inside and outside the tube, and the height of the GFRP tube. To simplify the calculation of the complex interaction, the relationship between the compressive strains at the top edge of the GFRP tube and at the edge of the compressed concrete outside the tube is used to quantify the interaction.
The strain 40 mm from the edge of the compressed concrete of NT-2GR16-C30 is firstly calculated as the basic strain reference. According to the Technical Standard for Fiber Reinforced Polymer in Construction GB50608-2020 [12], the height of the relative compression zone of NT-2GR16-C30 can be expressed as follows:
x = 0.14 1 + 400 f G R E G R + ρ f G R f c h 0
where fc, fGR, and EGR, ρ are the concrete compressive strength, GFRP bar tensile strength, elastic modulus, and reinforcement ratio, respectively.
The height of the compression zone is taken as follows:
x c = x β 1
where β1 is the height conversion factor of equivalent rectangular stress. As the concrete grade used for the test did not exceed C50, β1 was taken as 0.8 [55].
NT-2GR16-C30 exhibited rare-reinforced damage, and the ultimate strain of the compressed concrete was measured to be −3466 × 10−6 in the test, and εcu = −0.0033 is taken.
Assuming that the concrete strain distribution in the compression zone under the ultimate stage is triangular, the following formula can be obtained:
ε r = x c a G T x c ε c u
where aGT is the distance between the upper wall of the GFRP tube and the edge of the compressed concrete.
Taking NT-2GR16-C30 as reference, the basic strain reference is calculated from Equations (4)–(6):
ε r = 0.273 ε c u
The εr is equal to −911 × 10−6. Based on the εr and the measured strain data, the effects of each factor are analyzed by least squares fitting.

5.2.1. Impact Factor of Tube Height ψG

The impact factor of GFRP tube height ψG reflects the changing rules between the ratio of εG1 (the upper compressive strain of GFRP tube) to εr and the tube height hG. The ψG is fitted by the strain data of GT80-2GR16-C30/30, GT100-2GR16-C30/30, and GT200-2GR16-C30/30, and the data are listed in Table 8. The fitted mean square deviation R is 0.993, which displays a good fit. The ψG is expressed as follows:
ψ G = 0.796 + 0.012 h G

5.2.2. Impact Factor of Reinforcement Ratio ψρ

GT80-2GR16-C30/30 and GT100-2GR16-C30/30 are used as references, and the upper wall compressive strains of the two GFRP tubes are defined as εr1 and εr2, respectively. The ψρ represents the relationship between the ratio of the upper wall compressive strain εG1 to εr1 (or εr2) and the reinforcement ratio ρ. The ψρ is fitted through the data in Table 9 with R = 0.922. The ψρ is expressed as follows:
ψ ρ = 2.815 235.5 ρ

5.2.3. Impact Factor of the Strength of Concrete outside Tube ψco

GT80-2GR16-C30/30 and GT80-2GR16-C30/50 are used as references, and the upper wall compressive strain of the GFRP tube in GT80-2GR16-C30/50 is defined as εr3.
The ψco denotes the rules between the ratio of εG1 to εr1 (or εr3) and the strength of concrete outside the tube. The ψco is fitted by the data in Table 10 with R = 0.999. The expression of ψco is as follows:
ψ c o = 0.281 + 0.024 f c 1
where fc1 is the strength of concrete outside the GFRP tube.

5.2.4. Impact Factor of the Strength of Concrete inside Tube ψci

The GT80-2GR16-C30/30 and GT80-2GR16-C50/30 are used as references, and the upper wall compressive strain of the tube in GT80-2GR16-C50/30 is defined as εr4. The ψci reflects the relationship between the ratio of εG1 to εr1 (or εr4) and the strength of concrete inside the tube. The data in Table 11 is used for the fitting of ψci with R = 0.999. The ψci is as follows:
ψ c i = 0.527 + 0.016 f c 2
where fc2 is the strength of concrete inside the GFRP tube.

5.2.5. Equation of the Interaction

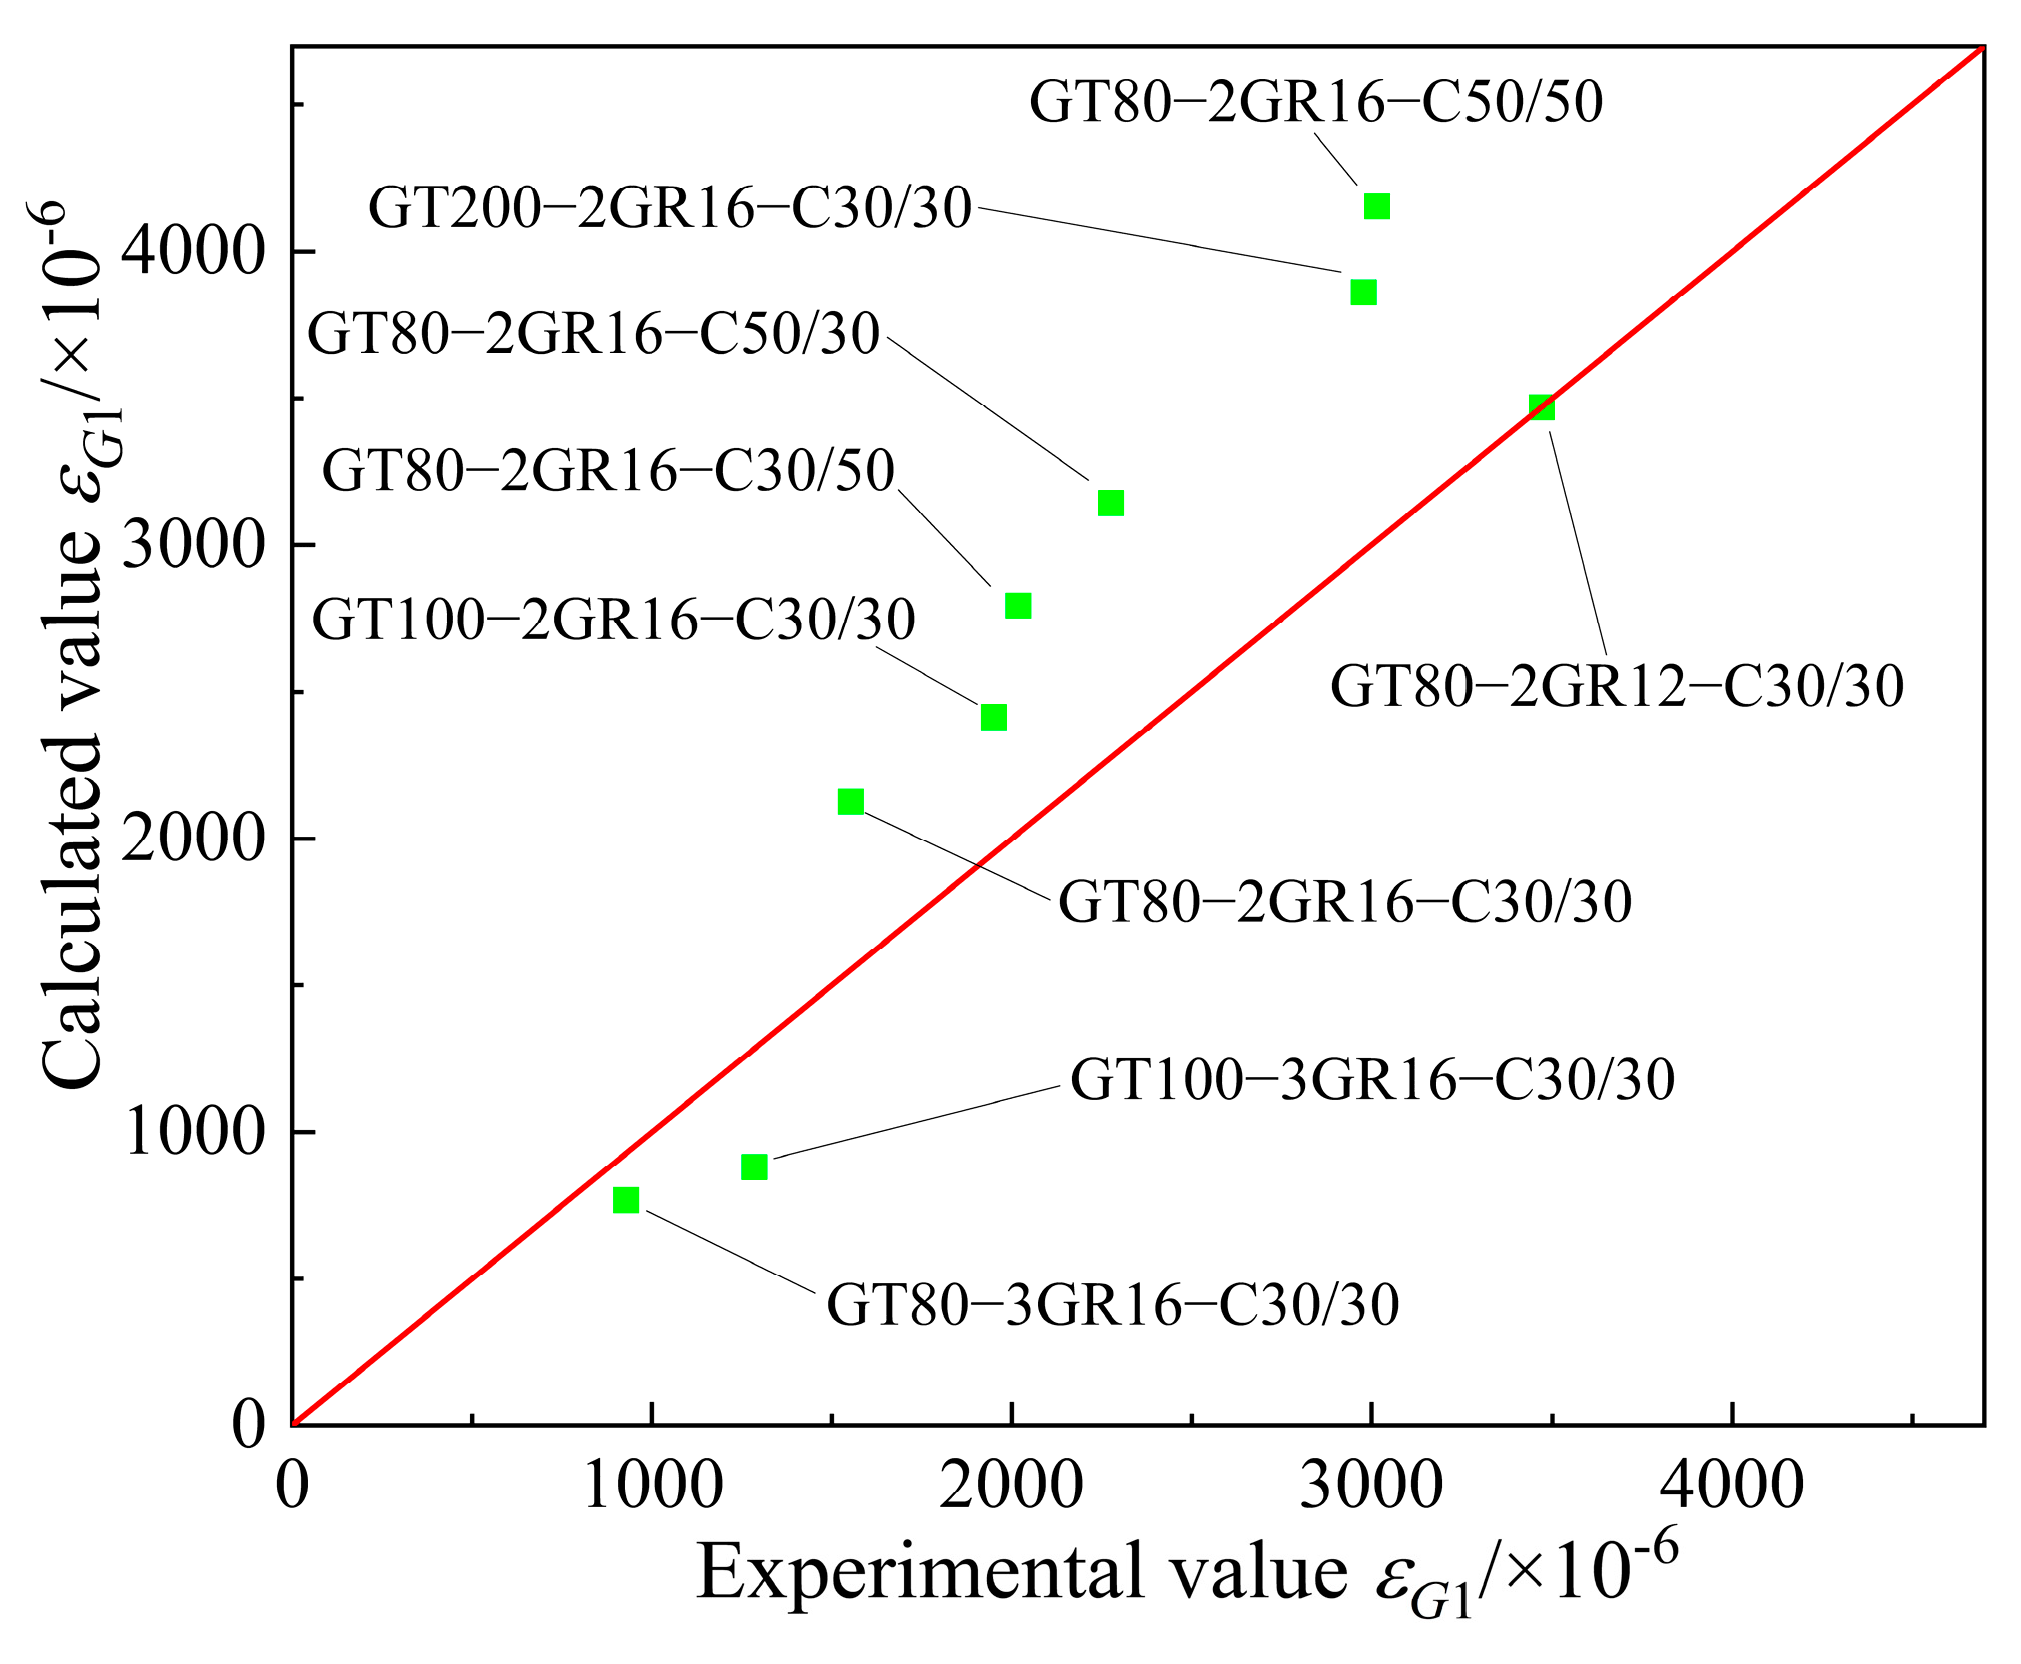
Considering the above impact factors, the fitting equation for quantifying the interaction between the GFRP tube and the concrete is given in Equation (12). The comparison of the calculated and test values of εG1 is shown in Figure 9.
ε G 1 = 0.276 ψ G ψ ρ ψ c o ψ c i ε c u

5.3. Flexural Capacity

5.3.1. Assumption

The following assumptions are used to calculate the normal section flexural capacity of GFRP-reinforced SSSC beam with built-in GFRP tube: (1) the beam’s cross section is divided into two parts along the outer edge of the tube, and both parts conform to the flat section assumption; (2) the compressive stress of the concrete at the two sides of the GFRP tube is simplified to equivalent rectangular stress in accordance with the Code for Design of Concrete Structures GB50010-2010 [55], and the compressed concrete on the upper side of the GFRP tube is under the ultimate state; (3) the GFRP tube and the concrete inside the tube are elastic; (4) the concrete constitutive relationship comes from the Code for Design of Concrete Structures GB50010-2010 [55]; (5) the tensile strength of the concrete and the effects of the GFRP bars in the compression zone are ignored; (6) the constitutive relationship of GFRP adopts linear elastic model, and it is ensured that its strength is not greater than the measured value from material property test. The calculating sketch is exhibited in Figure 10.

5.3.2. Ultimate Capacity of Part I

Based on the reinforcement, the SSSC beams with GFRP tubes are classified into three cases for calculating the ultimate capacity of part I. The first case is the beam that rare-reinforced damage should have occurred and the damage changed to over-reinforced damage after GFRP tube was equipped. In this case, the ultimate compressive strain was reached at the edge of the compressed concrete. Although the tensile reinforcement did not break due to the constraint of GFRP tubes, its strain was close to its limit. Therefore, the tensile reinforcement is under the ultimate state. According to the equilibrium relationship of the cross section, the height of the equivalent pressure zone is calculated as follows:
x = A G R f G R f c b G a G T α 1 f c b b G
where AGR, bG, α1, and b are the area of the tension reinforcement, the width of the GFRP tube, the strength conversion factor for the equivalent rectangular stress, and the beam width, respectively.
Since it is assumed that all the concrete compressive strains on the upper side of the GFRP tube are under ultimate state, it should be ensured that the height of the equivalent compression zone x is greater than the distance aGT between the edge of the GFRP tube upper wall and the edge of the compressed concrete, the minimum reinforcement ratio is calculated:
ρ min = a G T f c [ α 1 + 1 α 1 b G b ] h 0 f G R
The second case is that the beam without GFRP tubes was over-reinforced, and it was also considered an over-reinforced beam after the GFRP tubes were installed. The formula for the bounding reinforcement ratio of over-reinforced beam is as follows:
ρ b = A G R b h 0
The height of equivalent compression zone is calculated as follows:
x = ρ b b h 0 f G R f c b G a G T α 1 f c b b G
For the above two cases, the bending capacity of the first part is obtained:
M 1 = α 1 f c b b G x h 0 x 2 + f c b a G T h 0 a G T 2
The third case is that the reinforcement ratio is less than ρmin. At this time, the first part of the ultimate capacity should be calculated in accordance with the Technical Standard for Fiber Reinforced Polymer in Construction GB50608-2020 [12].

5.3.3. Ultimate Capacity of Part II

The calculation sketch of the ultimate capacity of the GFRP tube and concrete inside the tube is shown in Figure 10b. This part is assumed to be elastic. The combined force in the compression zone consists of the upper wall force C1, the side wall force C2, and the compressive force of the internal concrete C3. The combined force in the tension zone can be divided into the lower wall force T1 and the side wall force T2. The tensile strength of the concrete in the tube is ignored. The formulas for calculating the forces are given as follows:
C 1 = x G t 2 x G ε G 1 E G T t b G 2 t
C 2 = ε G 1 E G T t x G
C 3 = ε c E c b G 2 t x G t
T 1 = h G x G t 2 x G ε G 2 E G T t b G 2 t
T 2 = ε G 2 E G T t h G x G
where εG1, εG2, EGT, and t are the upper wall compressive strain, the lower wall compressive strain, the axial elastic modulus and the thickness of the GFRP tube, respectively. The xG is the distance from the neutral axis of the GFRP tube to the edge of the compression zone of the tube.
Based on the flat section assumption, it can be found that:
ε c = x G t x G ε G 1
ε G 2 = h G x G x G ε G 1
According to the equilibrium condition of the cross section:
F = C 1 + C 2 + C 3 T 1 T 2 = 0
xG is only related to the material properties and geometry, and εG1 is also required for the calculation of the bending capacity of Part II. Bringing the value of εG1 in Equation (12) into Equations (23) and (24), the values of εc and εG2 can be obtained. Substitute εc, εG2, and xG back into Equations (18)–(22); the values of C1, C2, C3, T1, and T2 are obtained. The bending capacity of Part II is calculated as:
M 2 = x G t 2 C 1 + 2 3 x G C 2 + 2 3 x G t C 3 + h G x G t 2 T 1 + 2 3 h G x G T 2
The total bending capacity is shown as follows:
M = M 1 + M 2

5.4. Verification

The calculated load capacity Pc can be obtained using the bending capacity M:
P c = 6 M l
where l is the beam length.
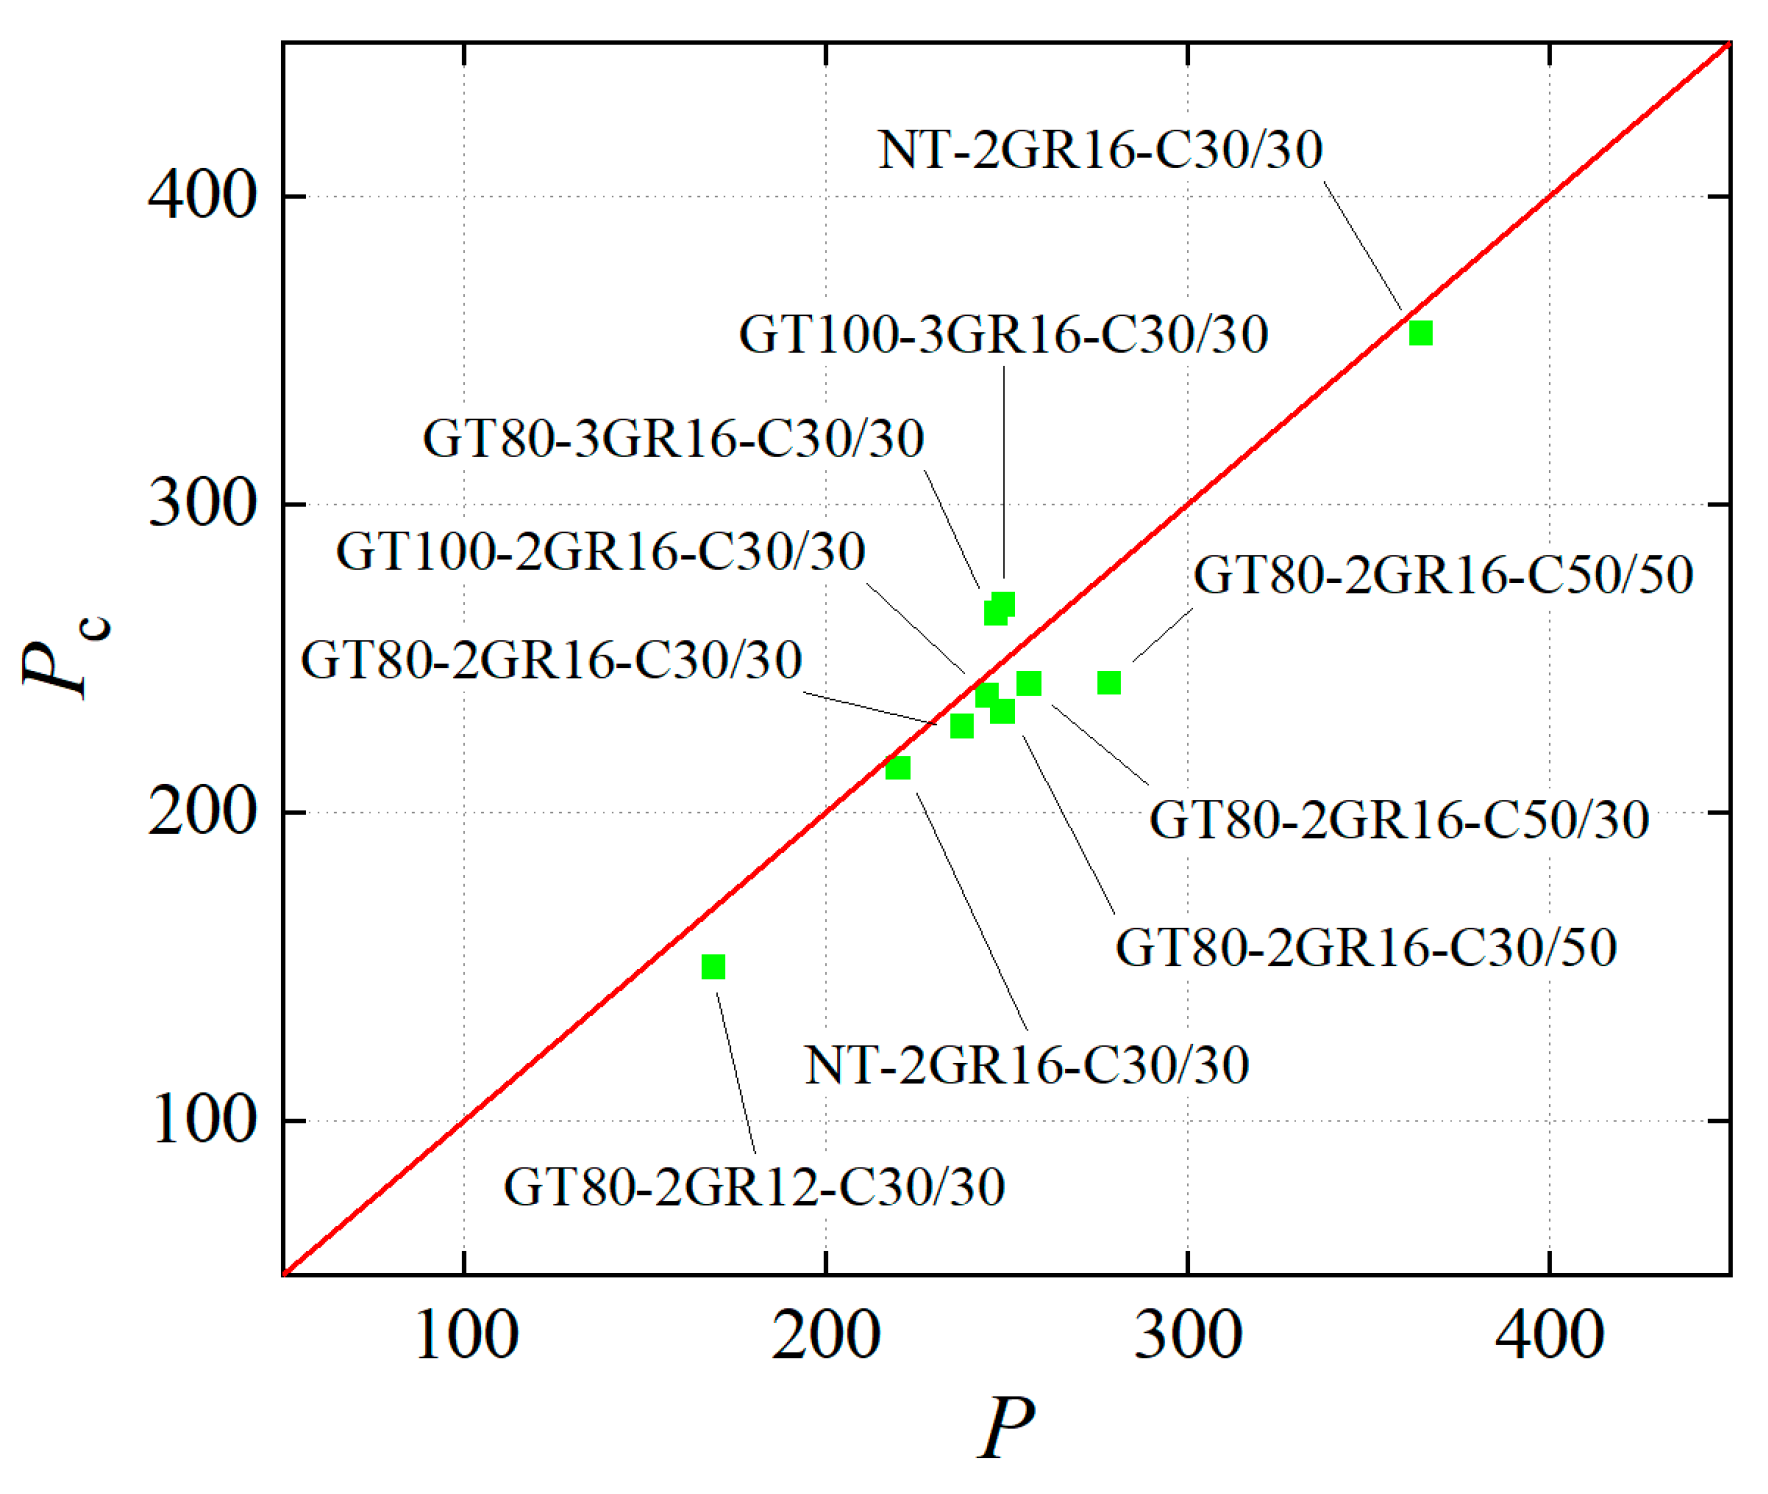
The comparison of the experimental value P and theoretical value Pc of normal section load capacity is illustrated in Figure 11. The differences between the experimental and theoretical values are between 2.52% and 13.18%, and the mean error is 5.82%. It indicates that the theoretical expressions are able to accurately calculate the flexural capacity of SSSC beams with GFRP tubes.

6. Conclusions

This study carried out flexural performance tests of GFRP-reinforced SSSC beams with built-in GFRP tubes. The damage modes, the P–w curves of the beams were analyzed, and the interaction mechanism between GFRP tubes and concrete was discussed. Based on the test results, a simplified method for the ultimate load capacity of the novel beam was proposed. The main conclusions are as follows:
(1)
The beam crack distribution was significantly affected by the reinforcement ratio and concrete strength. The increase in reinforcement ratio and the strength of concrete inside the tube led to a denser crack distribution, while the increased strength of concrete outside the tube made the crack distribution sparser. The height of the built-in GFRP tube had a limited effect on the crack distribution.
(2)
The equipment of GFRP tubes could change rare-reinforced damage which should have occurred into over-reinforced damage. Under low-reinforcement-ratio conditions, the GFRP tube had little impact on the damage modes. In addition, the arrangement of GFRP tubes significantly increased the ultimate load and post-cracking stiffness of beams, and the improvement raised with the increasing reinforcement ratio and tube height.
(3)
The ductility of the SSSC beams with built-in GFRP tubes was reduced compared to that of the beam without tube. The ductility decreased with the increase of reinforcement ratio, and the favorable beam ductility realized when the strength of the concrete inside and outside the tube was similar and low.
(4)
The two parts, the concrete outside the tube, the tube and the concrete inside the tube, basically conformed to the flat cross-sectional assumption. Using the test results, the expression for the interaction between the GFRP tube and concrete was obtained by fitting, and the proposed formula was effective to predict the normal section flexural capacity of GFRP-reinforced SSSC beam with GFRP tubes.
Due to the limitations of time, funding, and test conditions, there are still some tasks to be further studied. The parameter influences on the flexural performance of GFRP-reinforced SSSC beams with built-in GFRP tubes needs to be further investigated using numerical simulation methods. Then, the optimal design of the beam can be conducted. The interaction between the GFRP tube and the external concrete should be enhanced so as to sufficiently utilize the performance of the GFRP tube.

Author Contributions

Conceptualization, S.Y. and S.L.; methodology, S.L. and X.D.; software, S.T. and J.T.; validation, X.D., J.T. and S.T.; formal analysis, X.D. and S.T.; investigation, S.L. and X.D.; resources, S.Y.; data curation, S.T. and J.T.; writing—original draft preparation, S.L., X.D. and S.T.; writing—review and editing, S.L. and S.Y.; supervision, S.Y. and S.L.; project administration, S.Y. and S.L.; funding acquisition, S.Y. and S.L. All authors have read and agreed to the published version of the manuscript.

Funding

This research was funded by the National Natural Science Foundation of China [grant number 52178259] and the Postdoctoral Application Research Project of Qingdao.

Institutional Review Board Statement

Not applicable.

Informed Consent Statement

Not applicable.

Data Availability Statement

The data presented in this study is available on request from the corresponding author.

Conflicts of Interest

The authors declare no conflict of interest.

Nomenclature

VariableExplanation
EGTAxial elastic modulus
EGRGFRP bar elastic modulus
Ec1Elastic modulus of concrete in the GFRP tube
EcConcrete elastic modulus
E ¯ c Average concrete elastic modulus
fGRGFRP bar tensile strength
fc1Concrete strength outside the GFRP tube
fc2Concrete strength in the GFRP tube
fcConcrete compressive strength
f ¯ c Average concrete compressive strength
tThickness of the GFRP tube
hHeight of beam
bGWidth of the GFRP tube
bBeam width
h0Effective height of beam section
hGHeight of the GFRP tube
ρReinforcement ratio
ρbBoundary reinforcement ratio
PPeak load
PcCalculated load capacity
lBeam length
wMid-span deflections of beams
μεMicrostrain
xHeight of the relative compression zone
xcHeight of the compression zone
xGDistance from the neutral axis of the GFRP tube to the edge of the compression zone of the tube
β1Height conversion factor of equivalent rectangular stress
εcConcrete strain
εcuUltimate compressive strain of concrete
εrBasic strain reference
εG1Upper wall compressive strain
εG2Lower wall compressive strain
εr1Upper wall compressive strain of the GFRP tube in GT80-2GR16-C30/30
εr2Upper wall compressive strain of the GFRP tube in GT100-2GR16-C30/30
εr3Upper wall compressive strain of the GFRP tube in GT80-2GR16-C30/50
εr4Upper wall compressive strain of the GFRP tube in GT80-2GR16-C50/30
aGRDistance from the action point of the combined forces of the tension bars to the tensile edge of the concrete
AGRArea of the tension reinforcement
α1Strength conversion factor for the equivalent rectangular stress
aGTDistance between the upper wall of the GFRP tube and the edge of the compressed concrete
ψGImpact factor of the GFRP tube’s height
ψρImpact factor of reinforcement ratio
ψcoImpact factor of the strength of concrete outside tube
ψciImpact factor of the strength of concrete inside tube
DRDeformation capacity reserve factor
CRLoad capacity reserve factor
JOverall performance factor
M1Bending capacity of Part I
M2Bending capacity of Part II
MTotal bending capacity
M0.001Bending moment when the compressive strain of the compressed concrete reaches 0.001
MuUltimate bending moment
ϕ 0.001 Curvature when the compressive strain of the compressed concrete reaches 0.001
ϕ u Ultimate curvature
C1Upper wall force of the compression zone
C2Side wall force of the compression zone
C3Compressive force of the internal concrete of the compression zone
T1Lower wall forces of the tension zone
T2Side wall force of the tension zone

References

  1. Sun, Z.; Li, X.; Liu, Q.; Tang, Q.; Lin, X.; Fan, X.; Huang, X.; Gan, M.; Chen, X.; Ji, Z. Recent advances in alkali-activated materials with seawater and sea sand. Materials 2023, 16, 3571. [Google Scholar] [CrossRef]
  2. Dhondy, T.; Remennikov, A.; Sheikh, M. Properties and application of sea sand in sea sand-seawater concrete. J. Mater. Civ. Eng. 2020, 32, 04020392. [Google Scholar] [CrossRef]
  3. Xiao, J.; Qiang, C.; Nanni, A.; Zhang, K. Use of sea-sand and seawater in concrete construction: Current status and future opportunities. Constr. Build. Mater. 2017, 155, 1101–1111. [Google Scholar] [CrossRef]
  4. Xiang, Y.; Al-Saadi, S.; Zhao, X.; Raman, R. Electrochemical investigations of steels in seawater sea sand concrete environments. Materials 2021, 14, 5713. [Google Scholar] [CrossRef]
  5. Sun, X.; Li, T.; Shi, F.; Liu, X.; Zong, Y.; Hou, B.; Tian, H. Sulphate corrosion mechanism of ultra-high-performance concrete (UHPC) prepared with seawater and sea sand. Polymers 2022, 14, 971. [Google Scholar] [CrossRef]
  6. Guo, F.; Al-Saadi, S.; Raman, R.; Zhao, X. Durability of fiber reinforced polymer (FRP) in simulated seawater sea sand concrete (SWSSC) environment. Corros. Sci. 2018, 141, 1–13. [Google Scholar] [CrossRef]
  7. Ahmed, A.; Guo, S.; Zhang, Z.; Shi, C.; Zhu, D. A review on durability of fiber reinforced polymer (FRP) bars reinforced seawater sea sand concrete. Constr. Build. Mater. 2020, 256, 119484. [Google Scholar] [CrossRef]
  8. Wang, Z.; Zhao, X.; Xian, G.; Wu, G.; Raman, R.; Al-Saadi, S. Effect of sustained load and seawater and sea sand concrete environment on durability of basalt- and glass-fibre reinforced polymer (B/GFRP) bars. Corros. Sci. 2018, 138, 200–218. [Google Scholar] [CrossRef]
  9. Dong, Z.; Wu, G.; Zhao, X.; Zhu, H.; Lian, J. The durability of seawater sea-sand concrete beams reinforced with metal bars or non-metal bars in the ocean environment. Adv. Struct. Eng. 2020, 23, 334–347. [Google Scholar] [CrossRef]
  10. Wei, B.; He, X.; Zhou, M.; Wang, H.; He, J. Experimental study on flexural behaviors of FRP and steel bars hybrid reinforced concrete beams. Case Stud. Constr. Mater. 2024, 20, e02759. [Google Scholar] [CrossRef]
  11. Ortiz, J.; Dolati, S.; Malla, P.; Nanni, A.; Mehrabi, A. FRP-reinforced/strengthened concrete: State-of-the-art review on durability and mechanical effects. Materials 2023, 16, 1990. [Google Scholar] [CrossRef]
  12. GB50608-2020; Technical Standard for Fiber Reinforced Polymer in Construction. Ministry of Housing and Urban-Rural Development of the People’s Republic of China and State Administration for Market Regulation: Beijing, China, 2020. (In Chinese)
  13. Xie, Q.; Xiao, J.; Zhang, K.; Zong, Z. Compressive behavior and microstructure of concrete mixed with natural seawater and sea sand. Front. Struct. Civ. Eng. 2021, 15, 1347–1357. [Google Scholar] [CrossRef]
  14. Wang, X.; Dong, C.; Xu, S.; Song, Q.; Ren, J.; Zhu, J. Influence of seawater and sea sand on early-age performance and cracking sensitivity of concrete. J. Build. Eng. 2023, 79, 107811. [Google Scholar] [CrossRef]
  15. Chen, Z.; Mo, L.; Song, C.; Zhang, Y. Investigation on compression properties of seawater-sea sand concrete. Adv. Concr. Constr. 2021, 12, 93–103. [Google Scholar] [CrossRef]
  16. Pan, D.; Yaseen, S.; Chen, K.; Niu, D.; Leung, C.; Li, Z. Study of the influence of seawater and sea sand on the mechanical and microstructural properties of concrete. J. Build. Eng. 2021, 42, 103006. [Google Scholar] [CrossRef]
  17. Younis, A.; Ebead, U.; Suraneni, P.; Nanni, A. Fresh and hardened properties of seawater-mixed concrete. Constr. Build. Mater. 2018, 190, 276–286. [Google Scholar] [CrossRef]
  18. Li, L.; Zeng, L.; Xu, S.; Guo, Y. Experimental study on axial compressive behavior of hybrid FRP confined concrete columns. Comput. Concr. 2017, 19, 395–404. [Google Scholar] [CrossRef]
  19. Won, J.; Park, C. Effect of environmental exposure on the mechanical and bonding properties of hybrid FRP reinforcing bars for concrete structures. J. Compos. Mater. 2006, 40, 1063–1076. [Google Scholar] [CrossRef]
  20. You, Y.; Park, Y.; Kim, H.; Park, J. Hybrid effect on tensile properties of FRP rods with various material compositions. Compos. Struct. 2007, 80, 117–122. [Google Scholar] [CrossRef]
  21. Ge, W.; Wang, Y.; Ashour, A.; Lu, W.; Cao, D. Flexural performance of concrete beams reinforced with steel-FRP composite bars. Arch. Civ. Mech. Eng. 2020, 20, 56. [Google Scholar] [CrossRef]
  22. Wang, L.; Zhang, J.; Huang, C.; Fu, F. Comparative study of steel-FRP, FRP and steel-reinforced coral concrete beams in their flexural performance. Materials 2020, 13, 2097. [Google Scholar] [CrossRef]
  23. Yun, H.; Lim, S.; Choi, W. Effects of reinforcing fiber strength on mechanical properties of high-strength concrete. Fibers 2019, 7, 93. [Google Scholar] [CrossRef]
  24. Haktanir, T.; Ari, K.; Altun, F.; Karahan, O. A comparative experimental investigation of concrete, reinforced-concrete and steel-fibre concrete pipes under three-edge-bearing test. Constr. Build. Mater. 2007, 21, 1702–1708. [Google Scholar] [CrossRef]
  25. Bencardino, F.; Rizzuti, L.; Spadea, G.; Swamy, R. Fatigue experimental evaluation of fiber reinforced concrete fracture properties. Compos. Part B—Eng. 2010, 41, 17–24. [Google Scholar] [CrossRef]
  26. Iqbal, S.; Ali, I.; Room, S.; Khann, S.; Ali, A. Enhanced mechanical properties of fiber reinforced concrete using closed steel fibers. Mater. Struct. 2019, 52, 56. [Google Scholar] [CrossRef]
  27. Qeshta, I.; Shafigh, P.; Jumaat, M.; Abdulla, A.; Ibrahim, Z.; Alengaram, U. The use of wire mesh–epoxy composite for enhancing the flexural performance of concrete beams. Mater. Des. 2014, 60, 250–259. [Google Scholar] [CrossRef]
  28. Chen, C.; Li, X.; Li, C.; Zhou, Y.; Sui, L. Optimized flax FRP stirrup in reinforced concrete beam: Material property and shear performance. Compos. Struct. 2022, 302, 116219. [Google Scholar] [CrossRef]
  29. Fahmy, M.; Abd-ElShafy, Z.; Wu, Z. Experimental and numerical evaluation of the shear behavior of reinforced concrete t-beams with hybrid steel-FRP stirrups. J. Compos. Constr. 2017, 21, 04017007. [Google Scholar] [CrossRef]
  30. Zhao, J.; Bao, X.; Yang, S.; Wang, Z.; He, H.; Xu, X. Experimental and theoretical studies on the shear performance of concrete beams reinforced with fiber-reinforced polymer stirrups. Materials 2024, 17, 593. [Google Scholar] [CrossRef]
  31. Wei, Y.; Xu, Y.; Wang, G.; Cheng, X.; Li, G. Influence of the cross-sectional shape and corner radius on the compressive behaviour of concrete columns confined by FRP and stirrups. Polymers 2022, 14, 341. [Google Scholar] [CrossRef]
  32. Dong, H.; Wang, D.; Wang, Z.; Sun, Y. Axial compressive behavior of square concrete columns reinforced with innovative closed-type winding GFRP stirrups. Compos. Struct. 2018, 192, 115–125. [Google Scholar] [CrossRef]
  33. Fakharifar, M.; Dalvand, A.; Sharbatdar, M.; Chen, G.; Sneed, L. Innovative hybrid reinforcement constituting conventional longitudinal steel and FRP stirrups for improved seismic strength and ductility of RC structures. Front. Struct. Civ. Eng. 2016, 10, 44–62. [Google Scholar] [CrossRef]
  34. Chen, C.; Li, C.; Zhou, Y.; Sui, L.; Li, X. Applying flax FRP in an innovative closed-shape stirrup for concrete beams. Materials 2022, 15, 2927. [Google Scholar] [CrossRef]
  35. Li, W.; Huang, W.; Fang, Y.; Zhang, K.; Liu, Z.; Kong, Z. Experimental and theoretical analysis on shear behavior of RC beams reinforced with GFRP stirrups. Structures 2022, 46, 1753–1763. [Google Scholar] [CrossRef]
  36. Hadi, M.; Elbasha, N. Effects of tensile reinforcement ratio and compressive strength on the behaviour of over-reinforced helically confined HSC beams. Constr. Build. Mater. 2007, 21, 269–276. [Google Scholar] [CrossRef]
  37. Priastiwi, Y.A.; Imran, I. The effect of different shapes of confinement in compression zone on beam’s ductility subjected to monotonic loading. Procedia Eng. 2015, 125, 918–924. [Google Scholar] [CrossRef]
  38. Renic, T.; Kisicek, T. Ductility of concrete beams reinforced with FRP rebars. Buildings 2021, 11, 424. [Google Scholar] [CrossRef]
  39. Renic, T.; Kisicek, T.; Koscak, J. Experimental testing of FRP reinforced concrete beams with steel compression reinforcement and a compression area confined with steel stirrups. Mater. Struct. 2023, 56, 10. [Google Scholar] [CrossRef]
  40. Michael, A.; Hamilton, H. Experimental ductility of compression-controlled flexural members using CFRP grid to confine concrete. Materials 2021, 14, 5163. [Google Scholar] [CrossRef]
  41. Mohamed, H.; Masmoudi, R. Flexural strength and behavior of steel and FRP-reinforced concrete-filled FRP tube beams. Eng. Struct. 2010, 32, 3789–3800. [Google Scholar] [CrossRef]
  42. Huang, L.; Zhang, C.; Yan, L.; Kasal, B. Flexural behavior of u-shape FRP profile-RC composite beams with inner GFRP tube confinement at concrete compression zone. Compos. Struct. 2018, 184, 674–687. [Google Scholar] [CrossRef]
  43. Dong, Z.; Wu, G.; Zhu, H.; Zhao, X.; Wei, Y.; Qian, H. Flexural behavior of seawater sea-sand coral concrete–UHPC composite beams reinforced with BFRP bars. Constr. Build. Mater. 2020, 265, 120279. [Google Scholar] [CrossRef]
  44. Wang, Z.; Xie, J.; Mai, Z.; Liu, P.; Lu, Z.; Li, L. Durability of GFRP bar-reinforced seawater–sea sand concrete beams: Coupled effects of sustained loading and exposure to a chloride environment. Eng. Struct. 2023, 283, 115814. [Google Scholar] [CrossRef]
  45. Hua, Y.; Yin, S.; Peng, Z. Crack development and calculation method for the flexural cracks in BFRP reinforced seawater sea-sand concrete (SWSSC) beams. Constr. Build. Mater. 2020, 255, 119328. [Google Scholar] [CrossRef]
  46. Su, C.; Wang, X.; Ding, L.; Chen, Z.; Liu, S.; Wu, Z. Experimental study on the seismic behavior of seawater sea sand concrete beams reinforced with steel-FRP composite bars. Eng. Struct. 2021, 248, 113269. [Google Scholar] [CrossRef]
  47. Hu, X.; Xiao, J.; Zhang, K.; Zhang, Q. Evaluation of cracking and deflection of GFRP bar reinforced recycled concrete beams with seawater and sea sand. J. Build. Eng. 2023, 80, 108092. [Google Scholar] [CrossRef]
  48. Li, Z.; Dong, F.; Qian, H.; Qiu, P.; Shi, Y. Shear performance of seawater sea-sand concrete beams reinforced with shape memory alloy longitudinal and stirrup bars. Constr. Build. Mater. 2024, 421, 135685. [Google Scholar] [CrossRef]
  49. Chen, Z.; Huang, Y.; Zhou, J.; Dai, S. Parametric study, finite element analysis, and load capacity calculation for flexural behaviour of seawater and sea sand concrete beams reinforced with GFRP bars. Structures 2024, 63, 106424. [Google Scholar] [CrossRef]
  50. ASTM D1141–98; Standard Practice for the Preparation of Substitute Ocean Water. ASTM International: West Conshohocken, PA, USA, 2013.
  51. GB/T 30022-2013; Test method for Basic Mechanical Properties of Fiber Reinforced Polymer Bar. Standardization Administration of the People’s Republic of China: Beijing, China, 2013. (In Chinese)
  52. GB/T 3354-2014; Test Method for Tensile Properties of Orientation Fiber Reinforced Polymer Matrix Composite Materials. Standardization Administration of the People’s Republic of China: Beijing, China, 2020. (In Chinese)
  53. Jaeger, L.; Mufti, A.; Tadros, G. Balanced Section Ductility and Deformability in Concrete with FRP Reinforcement; West Virginia University: Morgantown, VA, USA, 1995. [Google Scholar]
  54. Spadea, G.; Bencardino, F.; Swamy, R. Optimizing the performance characteristics of beams strengthened with bonded CFRP laminates. Mater. Struct. 2020, 33, 119–126. [Google Scholar] [CrossRef]
  55. GB50010-2010; Code for Design of Concrete Structures. Ministry of Housing and Urban-Rural Development of the People’s Republic of China: Beijing, China, 2015. (In Chinese)
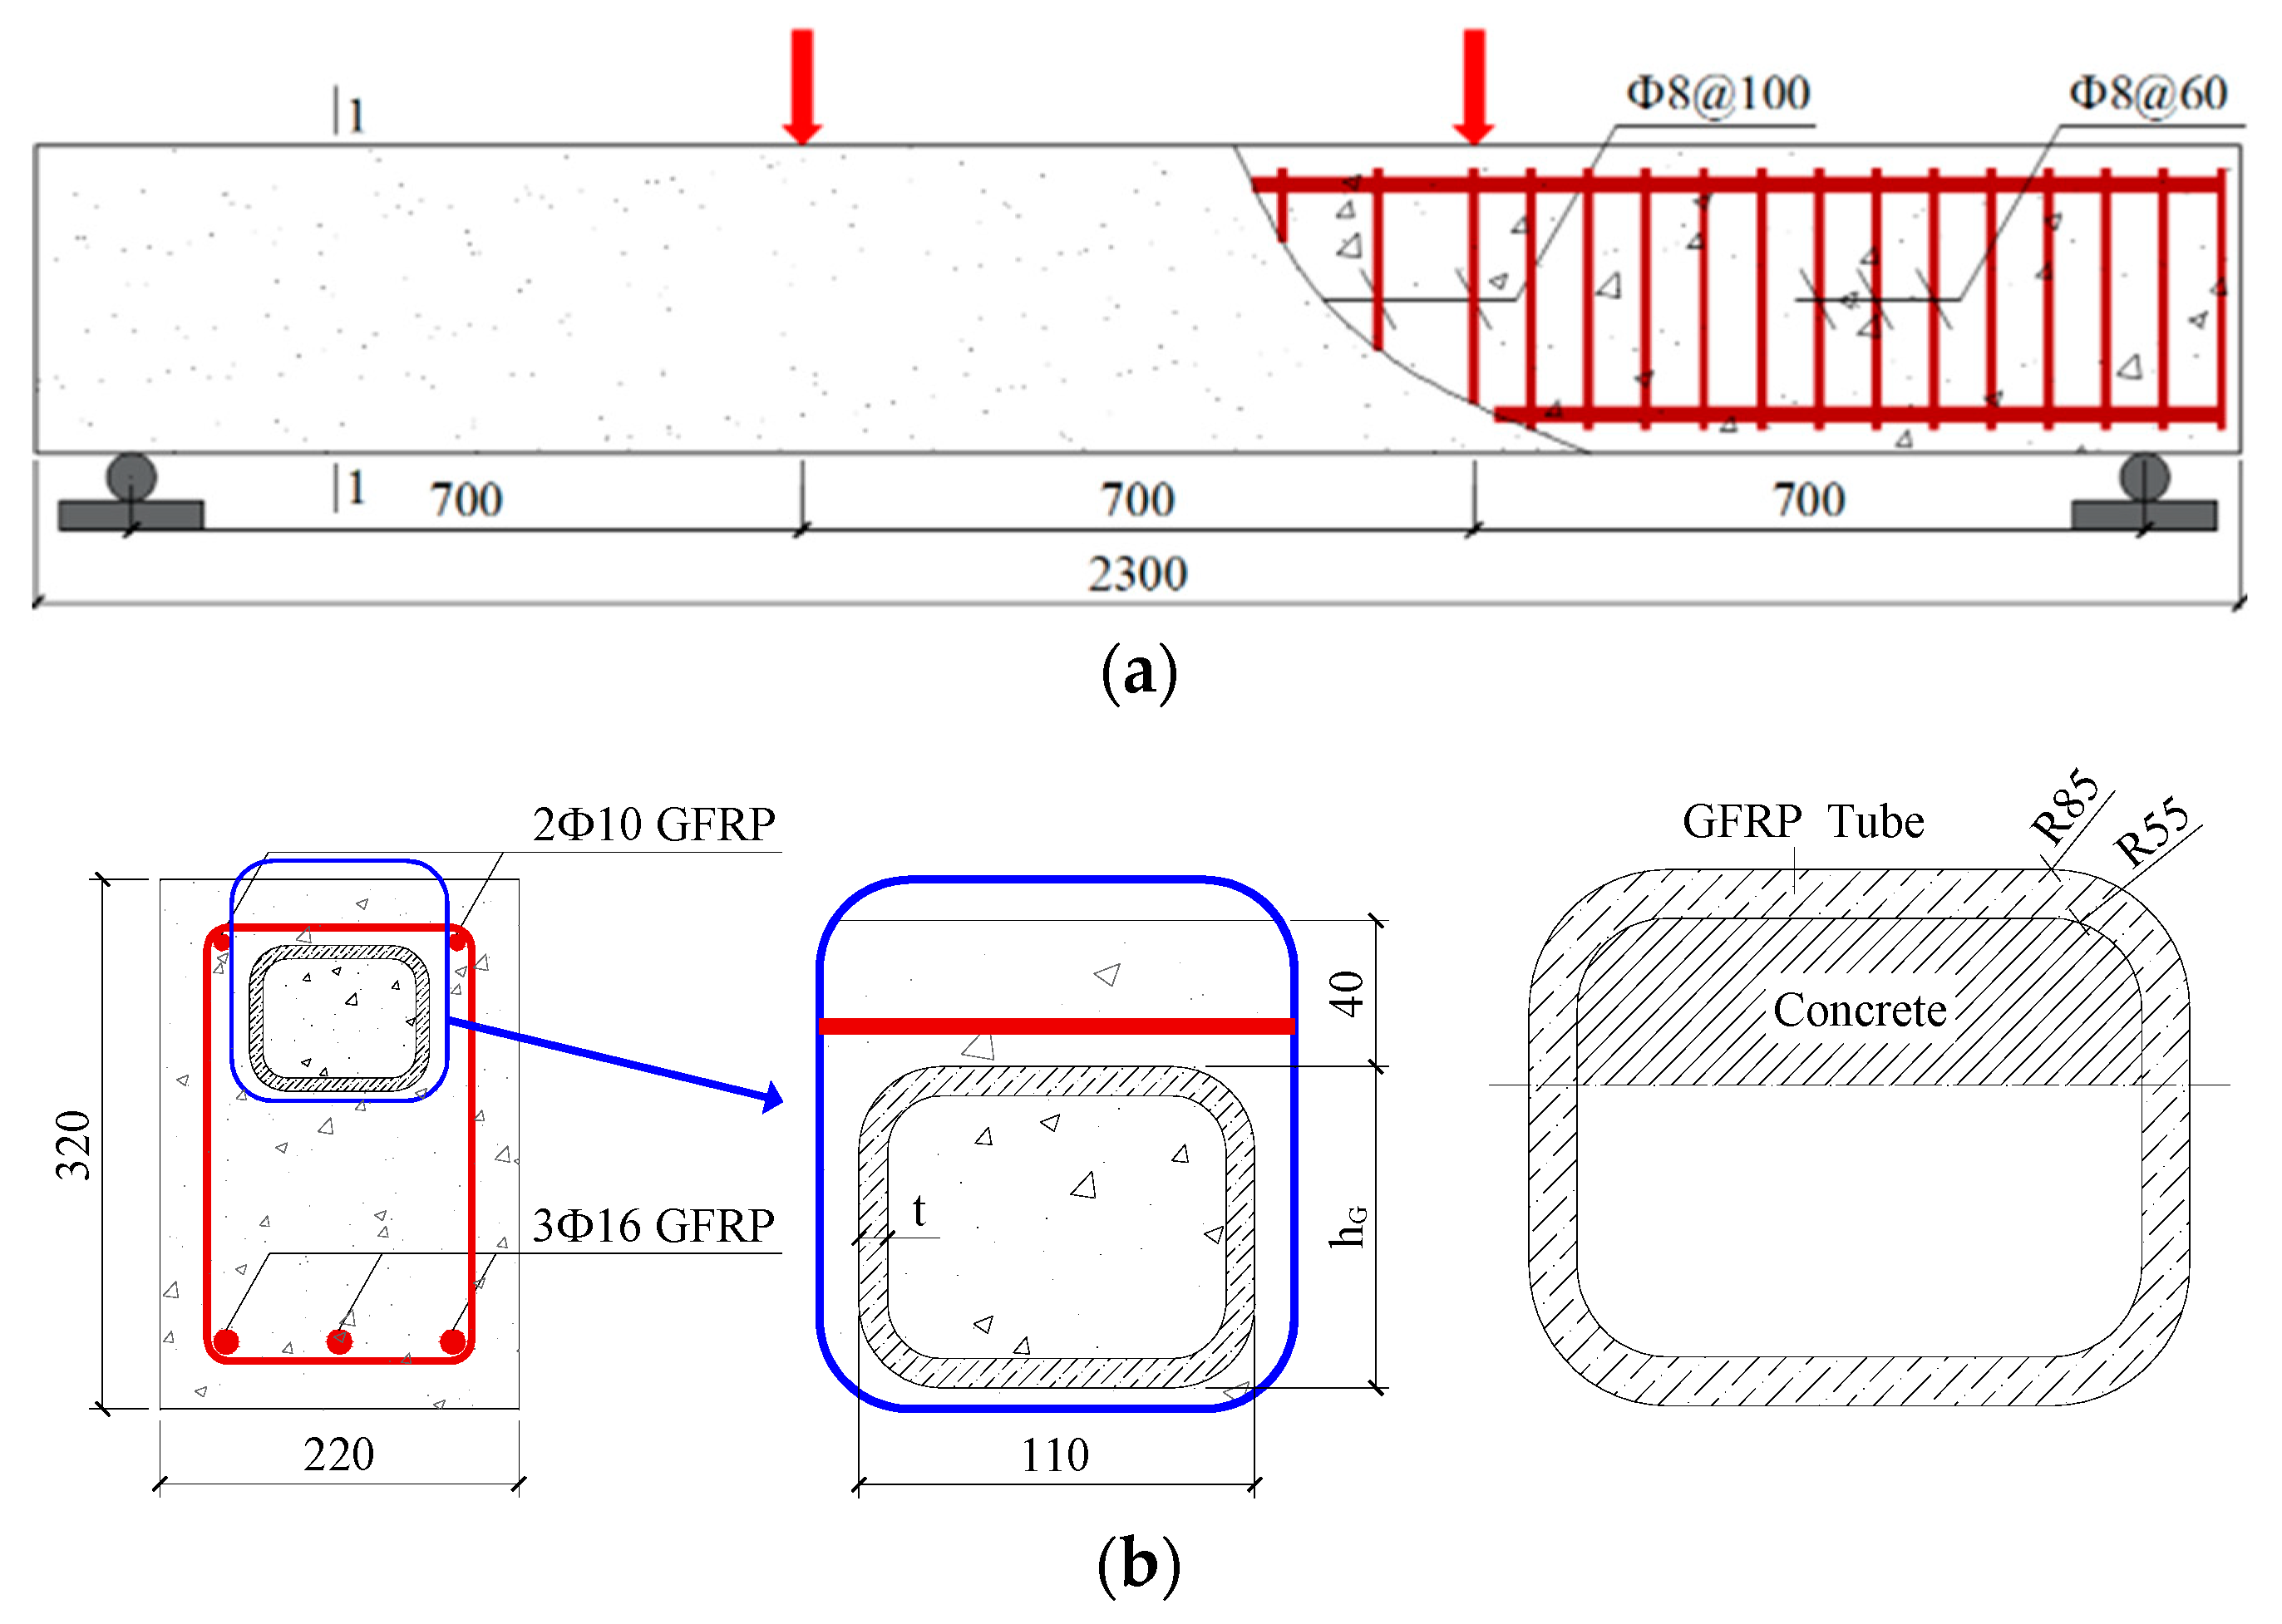
Figure 1. SSSC beam with GFRP tube (a) schematic diagram; (b) Section 1-1.
Materials 17 03221 g001
Figure 2. Specimen fabrication (a) GFRP reinforcement cage; (b) concrete poured inside GFRP tube; (c) specimens ready to be poured; (d) curing of specimens.
Materials 17 03221 g002
Figure 3. GFRP bar tensile test.
Materials 17 03221 g003
Figure 4. GFRP tube tensile test.
Materials 17 03221 g004
Figure 5. Loading device.
Materials 17 03221 g005
Figure 6. Measuring point arrangement.
Materials 17 03221 g006
Figure 7. The P–w curves’ (a) effects of GFRP tube height; (b) effects of strength grades of concrete inside and outside the GFRP tube.
Materials 17 03221 g007
Figure 8. Strain (a) concrete and GFRP bars (b) GFRP tubes.
Materials 17 03221 g008
Figure 9. Comparison of the calculated and test values of εG1.
Materials 17 03221 g009
Figure 10. Calculating sketch of the normal section flexural capacity (a) Part I; (b) Part II.
Materials 17 03221 g010
Figure 11. Comparison of the experimental and theoretical values of ultimate load capacity.
Materials 17 03221 g011
Table 1. Beam parameters.
No.BeamTube Height hG/mmReinforcementConcrete outside the TubeConcrete inside the Tube
1NT-2GR16-C302Ф16C30
2GT80-2GR12-C30/30802Ф12C30C30
3GT80-2GR16-C30/30802Ф16C30C30
4GT80-2GR16-C30/50802Ф16C30C50
5GT80-2GR16-C50/30802Ф16C50C30
6GT80-2GR16-C50/50802Ф16C50C50
7GT80-3GR16-C30/30803Ф16C30C30
8GT100-2GR16-C30/301002Ф16C30C30
9GT100-3GR16-C30/301003Ф16C30C30
10GT200-2GR16-C30/302002Ф16C30C30
Note: without GFRP tubes; 2GR16: two GFRP bars with 16mm diameter were arranged in the tensile zone; GT80: the height of the GFRP tube was 80 mm; C30\50: the strength of the concrete outside the tube was C30, the strength of the concrete inside the tube within the tube was C50.
Table 2. Chemical composition of seawater (g/L).
IngredientNaClMgCl2Na2SO4CaCl2
Content24.535.204.091.16
Table 3. Concrete proportioning design (kg/m3).
Concrete GradeSeawaterCementSandCrushed StoneWater Reducer
C3021544761112420.537
C5022965359512021.045
Table 4. Properties of SSSC.
Concrete GradeBatchSize/mmEc/
GPa
E ¯ c
/GPa
σ(Ec)
/GPa
Strength Conversion Factorfc
/MPa
f ¯ c
/MPa
σ(fc)
/MPa
C301150 × 150 × 30030.9528.721.98
27.17
28.04
1100 × 100 × 1000.9531.0629.431.48
28.18
29.06
2150 × 150 × 150131.3432.431.59
34.25
31.70
3150 × 150 × 150129.6130.081.00
29.4
31.22
C501150 × 150 × 30030.2732.311.84
32.81
33.85
1100 × 100 × 1000.9550.8151.600.85
51.48
52.5
2150 × 150 × 150151.4452.521.19
53.82
52.52
Note: Ec is concrete elastic modulus; E ¯ c is mean concrete elastic modulus; σ(Ec) is standard deviation of concrete elastic modulus; fc is concrete standard cubic compressive strength; f ¯ c is mean concrete standard cubic compressive strength; σ(fc) is standard deviation of concrete standard cubic compressive strength.
Table 5. Properties of GFRP bars and tubes.
TypeDiameterNoPeak Load/
kN
Destruction ModeStrength/
MPa
Average Strength/
MPa
Standard Error of MeanElastic Modulus/
GPa
Average Elastic Modulus/
GPa
Standard Error of Mean
GFRP bar16 mmGR16-1138.4Pull apart688.35725.6546.5945.3943.723.38
GR16-2156.4Explosive pull777.8739.83
GR16-3142.9Pull apart710.7345.93
12 mmGR12-171.7Pull away733.8845.0147.100.71
GR12-286.6Pull away765.7147.60
GR12-379.4Explosive pull702.0546.60
GFRP tubeAxial tensile GTA-149.15-245.8231.714.6813.5513.961.28
GTA-250.85254.315.39
GTA-338.90194.512.93
GTA-443.30216.511.70
GTA-546.55232.815.63
Circumferential tensileGTC-122.30-557.5543.49.3654.3852.322.57
GTC-221.35533.853.13
GTC-321.05526.349.44
GTC-422.10552.555.57
GTC-521.75543.847.22
Table 6. The failure mode and loading history of specimens.
NoBeamCrack Distribution and Destruction FeaturesCrack Development and Load
Order → Load (kN)
1NT-2GR16-C30Materials 17 03221 i001① → 38.71② →40.65 ③ → 45.61④ → 45.48⑤ → 45.48⑥ → 57.74⑦ → 62.26⑧ → 90.97⑨ → 102.90
2GT80-2GR12-C30Materials 17 03221 i002① → 35.16② → 36.13③ → 42.90④ → 59.68⑤ → 68.39⑥ → 71.29
3GT80-2GR16-C30/30Materials 17 03221 i003① → 28.39② → 37.10③ → 39.68④ → 50.00⑤ → 49.03⑥ → 59.35⑦ → 806.65⑧ → 86.45⑨ → 92.90
4GT80-2GR16-C30/50Materials 17 03221 i004① → 34.19② → 34.19③ → 40.32④ → 42.26⑤ → 53.23⑥ → 67.74⑦ → 68.39⑧ → 78.06
5GT80-2GR16-C50/30Materials 17 03221 i005① → 35.48② → 52.90③ → 58.39④ → 66.45⑤ → 72.90⑥ → 70.97⑦ → 70.97⑧ → 84.84⑨ → 99.68⑩ → 104.84⑪ → 148.39⑫ → 234.19
6GT80-2GR16-C50/50Materials 17 03221 i006① → 31.61② → 32.90③ → 45.81④ → 53.23⑤ → 50.65⑥ → 67.10⑦ → 65.48⑧ → 81.29⑨ → 104.52
7GT80-3GR16-C30/30Materials 17 03221 i007① → 40.32② → 42.58③ → 41.94④ → 47.74⑤ → 50.32⑥ → 59.35⑦ → 62.58⑧ → 68.06⑨ → 72.58⑩ → 93.87⑪ → 176.13
8GT100-2GR16-C30/30Materials 17 03221 i008① → 33.55② → 37.74③ → 41.61④ → 45.16⑤ → 43.55⑥ → 54.19⑦ → 69.35⑧ → 73.87⑨ → 130.97
9GT100-3GR16-C30/30Materials 17 03221 i009① → 37.74② → 40.32③ → 42.90④ → 46.77⑤ → 54.19⑥ → 57.42⑦ → 61.29⑧ → 63.87⑨ → 63.87⑩ → 65.81⑪ → 83.55⑫ → 83.55⑬ → 167.10
10GT200-2GR16-C30/30Materials 17 03221 i010① → 26.45② → 30.65③ → 42.58④ → 61.61⑤ → 69.03⑥ → 80.00⑦ → 107.13⑧ → 107.13⑨ → 106.13⑩ → 144.19⑪ → 171.29⑫ → 187.74⑬ → 218.06⑭ → 230.65⑮ → 283.87
Table 7. Ductility of specimens.
Beam ϕ 0.001 /m−1M0.001/kN·m ϕ u /m−1Mu/kN·mDRCRJ
NT-2GR16C-300.014420.440.083384.3382.7%73.5%21.732
GT80-2GR12-C30/300.014017.050.057564.7975.7%71.2%14.290
GT80-2GR16-C30/300.012827.230.057191.1177.5%67.3%13.574
GT80-2GR16-C30/500.014529.810.059795.4175.7%65.8%12.021
GT80-2GR16-C50/300.020738.050.067798.1869.5%57.6%7.719
GT80-2GR16-C50/500.020636.240.0748106.7272.4%62.8%9.748
GT80-3GR16-C30/300.015635.900.047394.7267.0%58.5%7.295
GT100-2GR16-C30/300.014533.990.057393.7374.7%60.3%9.970
GT100-3GR16-C30/300.015632.850.046495.4666.4%62.3%7.907
GT200-2GR16-C30/300.013741.600.0596139.6977.1%67.4%13.390
Table 8. Data used for fitting ψG.
BeamhG/mmεG1/×10−6εG1/εr
GT80-2GR16-C30/3080−15511.703
GT100-2GR16-C30/30100−19532.144
GT200-2GR16-C30/30200−29743.265
Table 9. Data used for fitting ψρ.
BeamReinforcement Ratio ρεG1/×10−6εG1/εr1εG1/εr2
GT80-2GR12-C30/300.366%−34792.243
GT80-2GR16-C30/300.655%−15511
GT80-3GR16-C30/300.983%−9230.595
GT100-2GR16-C30/300.655%−19531
GT100-3GR16-C30/300.983%−12900.661
Table 10. Data used for fitting ψco.
Beamfc1/MPaεG1/×10−6εG1/εr1εG1/εr3
GT80-2GR16-C30/3030−15511
GT80-2GR16-C50/3050−22811.471
GT80-2GR16-C30/5030−20281
GT80-2GR16-C50/5050−30191.489
Table 11. Data used for fitting ψci.
Beamfc2/MPaεG1/×10−6εG1/εr1εG1/εr4
GT80-2GR16-C30/3030−15511
GT80-2GR16-C30/5050−20281.308
GT80-2GR16-C50/3030−22811
GT80-2GR16-C50/5050−30191.324
Disclaimer/Publisher’s Note: The statements, opinions and data contained in all publications are solely those of the individual author(s) and contributor(s) and not of MDPI and/or the editor(s). MDPI and/or the editor(s) disclaim responsibility for any injury to people or property resulting from any ideas, methods, instructions or products referred to in the content.