
Optimizing the Tensile Strength of Weld Lines in Glass Fiber Composite Injection Molding

 , and
, and
Abstract
1. Introduction
2. Experimental Methods
3. Results and Discussion
4. Conclusions
Author Contributions
Funding
Institutional Review Board Statement
Informed Consent Statement
Data Availability Statement
Acknowledgments
Conflicts of Interest
References
- Kurt, M.; Kamber, O.S.; Kaynak, Y.; Atakok, G.; Girit, O. Experimental investigation of plastic injection molding: Assessment of the effects of cavity pressure and mold temperature on the quality of the final products. Mater. Des. 2009, 30, 3217–3224. [Google Scholar] [CrossRef]
- Alvarado-Iniesta, A.; Cuate, O.; Schütze, O. Multi-objective and many objective design of plastic injection molding process. Int. J. Adv. Manuf. Technol. 2019, 102, 3165–3180. [Google Scholar] [CrossRef]
- Ageyeva, T.; Horváth, S.; Kovács, J.G. In-mold sensors for injection molding: On the way to industry 4.0. Sensors 2019, 19, 3551. [Google Scholar] [CrossRef] [PubMed]
- Xie, L.; Ziegmann, G. A visual mold with variotherm system for weld line study in micro injection molding. Microsyst. Technol. 2008, 14, 809–814. [Google Scholar] [CrossRef]
- Gohn, A.M.; Brown, D.; Mendis, G.; Forster, S.; Rudd, N.; Giles, M. Mold inserts for injection molding prototype applications fabricated via material extrusion additive manufacturing. Addit. Manuf. 2022, 51, 102595. [Google Scholar] [CrossRef]
- Davis, C.S.; Hillgartner, K.E.; Han, S.H.; Seppala, J.E. Mechanical strength of welding zones produced by polymer extrusion additive manufacturing. Addit. Manuf. 2017, 16, 162–166. [Google Scholar] [CrossRef] [PubMed]
- Seppala, J.E.; Migler, K.D. Infrared thermography of welding zones produced by polymer extrusion additive manufacturing. Addit. Manuf. 2016, 12, 71–76. [Google Scholar] [CrossRef] [PubMed]
- Minh, P.S.; Nguyen, V.-T.; Nguyen, V.T.; Uyen, T.M.T.; Do, T.T.; Nguyen, V.T.T. Study on the Fatigue Strength of Welding Line in Injection Molding Products under Different Tensile Conditions. Micromachines 2023, 13, 1890. [Google Scholar] [CrossRef] [PubMed]
- The Uyen, T.M.; Truong Giang, N.; Do, T.T.; Anh Son, T.; Son Minh, P. External Gas-Assisted Mold Temperature Control Improves Weld Line Quality in the Injection Molding Process. Materials 2020, 13, 2855. [Google Scholar] [CrossRef]
- Liparoti, S.; De Piano, G.; Salomone, R.; Pantani, R. Analysis of Weld Lines in Micro-Injection Molding. Materials 2023, 16, 6053. [Google Scholar] [CrossRef]
- Purgleitner, B.; Viljoen, D.; Kühnert, I.; Burgstaller, C. Influence of injection molding parameters, melt flow rate, and reinforcing material on the weld-line characteristics of polypropylene. Polym. Eng. Sci. 2023, 63, 1551–1566. [Google Scholar] [CrossRef]
- Kitayama, S.; Hashimoto, S.; Takano, M.; Yamazaki, Y.; Kubo, Y.; Aiba, S. Multi-objective optimization for minimizing weldline and cycle time using variable injection velocity and variable pressure profile in plastic injection molding. Int. J. Adv. Manuf. Technol. 2020, 107, 3351–3361. [Google Scholar] [CrossRef]
- Scantamburlo, A.; Sorgato, M.; Lucchetta, G. Investigation of the inflow effect on weld lines morphology and strength in injection molding of short glass fiber reinforced polypropylene. Polym. Compos. 2020, 41, 2634–2642. [Google Scholar] [CrossRef]
- Liu, Q.; Liu, Y.; Jiang, C.; Zheng, S. Modeling and simulation of weld line location and properties during injection molding based on viscoelastic constitutive equation. Rheol. Acta 2020, 59, 109–121. [Google Scholar] [CrossRef]
- Hassan, A.; Yahya, R.; Yahaya, A.H.; Tahir, A.R.M.; Hornsby, P.R. Tensile, impact and fiber length properties of injection-molded short and long glass fiber-reinforced polyamide 6, 6 composites. J. Reinf. Plast. Compos. 2004, 23, 969–986. [Google Scholar] [CrossRef]
- Lionetto, F.; Montagna, F.; Natali, D.; De Pascalis, F.; Nacucchi, M.; Caretto, F.; Maffezzoli, A. Correlation between elastic properties and morphology in short fiber composites by X-ray computed micro-tomography. Compos. Part A Appl. Sci. Manuf. 2021, 140, 106169. [Google Scholar] [CrossRef]
- Maier, H.R.; Dandy, G.C. Neural network based modelling of environmental variables: A systematic approach. Math. Comput. Model. 2001, 33, 669–682. [Google Scholar] [CrossRef]
- Elmarakeby, H.A.; Hwang, J.; Arafeh, R.; Crowdis, J.; Gang, S.; Liu, D.; AlDubayan, S.H.; Salari, K.; Kregel, S.; Richter, C.; et al. Biologically informed deep neural network for prostate cancer discovery. Nature 2021, 598, 348–352. [Google Scholar] [CrossRef]
- Basheer, I.A.; Hajmeer, M. Artificial neural networks: Fundamentals, computing, design, and application. J. Microbiol. Methods 2000, 43, 3–31. [Google Scholar] [CrossRef]
- Abdolrasol, M.G.M.; Hussain, S.M.S.; Ustun, T.S.; Sarker, M.R.; Hannan, M.A.; Mohamed, R.; Ali, J.A.; Mekhilef, S.; Milad, A. Artificial neural networks based optimization techniques: A review. Electronics 2021, 10, 2689. [Google Scholar] [CrossRef]
- Garud, K.S.; Jayaraj, S.; Lee, M.Y. A review on modeling of solar photovoltaic systems using artificial neural networks, fuzzy logic, genetic algorithm and hybrid models. Int. J. Energy Res. 2021, 45, 6–35. [Google Scholar] [CrossRef]
- Shen, C.; Wang, L.; Li, Q. Optimization of injection molding process parameters using combination of artificial neural network and genetic algorithm method. J. Mater. Process. Technol. 2007, 183, 412–418. [Google Scholar] [CrossRef]
- Shi, H.; Gao, Y.; Wang, X. Optimization of injection molding process parameters using integrated artificial neural network model and expected improvement function method. Int. J. Adv. Manuf. Technol. 2010, 48, 955–962. [Google Scholar] [CrossRef]
- Lee, J.; Yang, D.; Yoon, K.; Kim, J. Effects of input parameter range on the accuracy of artificial neural network prediction for the injection molding process. Polymers 2022, 14, 1724. [Google Scholar] [CrossRef] [PubMed]
- Mijwel, M.M. Artificial neural networks advantages and disadvantages. Mesopotamian J. Big Data 2021, 2021, 29–31. [Google Scholar] [CrossRef]
- ASTM D638-14; Standard Test Method for Tensile Properties of Plastics. ASTM International: West Conshohocken, PA, USA, 2014.
- ISO 294-4:2018(EN); Plastics—Injection Moulding of Test Specimens of Thermoplastic Materials—Part 4: Determination of Moulding Shrinkage. ISO: Geneva, Switzerland, 2018.
- ISO 527-2:2012; Plastics—Determination of Tensile Properties—Part 2: Test Conditions for Moulding and Extrusion Plastics. ISO: Geneva, Switzerland, 2012.
- ISO 179-2:2020; Plastics—Determination of Charpy Impact Properties—Part 2: Instrumented Impact Test. ISO: Geneva, Switzerland, 2020.
- ISO 48-4:2018; Rubber, Vulcanized or Thermoplastic—Determination of Hardness Part 4: Indentation Hardness by Durometer Method (Shore Hardness). ISO: Geneva, Switzerland, 2018.
- ISO 11357-1:2023(EN); Plastics—Differential scanning calorimetry (DSC)—Part 1: General Principles. ISO: Geneva, Switzerland, 2023.
- ISO 62:2008; Plastics—Determination of Water Absorption. ISO: Geneva, Switzerland, 2008.
- ISO 1183-1:2019; Plastics—Methods for Determining the Density of Non-Cellular Plastics—Part 1: Immersion Method, Liquid Pycnometer Method and Titration Method. ISO: Geneva, Switzerland, 2019.
- Raos, P.; Stojsic, J. Influence of injection moulding parameters on tensile strength of injection moulded part. J. Manuf. Ind. Eng. 2014, 2972, 13–15. [Google Scholar] [CrossRef]
- Singh, G.; Pradhan, M.K.; Verma, A. Effect of injection moulding process parameter on tensile strength using Taguchi method. Int. J. Ind. Manuf. Eng. 2015, 9, 1844–1849. [Google Scholar]
- Shokri, P.; Bhatnagar, N. Effect of packing pressure and mold temperature on fiber orientation in injection molding of reinforced plastics. In Proceedings of the 8th International Conference on Flow Processes in Composite Materials (FPCM8), Douai, France, 11–13 July 2006; pp. 409–416. [Google Scholar]
- Der Chien, R.; Chen, S.C.; Peng, H.S.; Su, P.L.; Chen, C.S. Investigations on the weldline tensile strength of thin-wall injection molded parts. J. Reinf. Plast. Compos. 2004, 23, 575–588. [Google Scholar] [CrossRef]
- Kagitci, Y.C.; Tarakcioglu, N. The effect of weld line on tensile strength in a polymer composite part. Int. J. Adv. Manuf. Technol. 2016, 85, 1125–1135. [Google Scholar] [CrossRef]


| Properties | Typical Data | Unit | Test Method |
|---|---|---|---|
| Chemical composite | 70% Polyamide 6 ((C6H11NO)n) + 30% glass fibers | - | - |
| Molding shrinkage, parallel | 0.3 | % | ISO 294-4, 2577 [27] |
| Molding shrinkage, normal | 0.9 | % | ISO 294-4, 2577 |
| Tensile modulus | 9700/6000 | MPa | ISO 527-1/-2 [28] |
| Stress at break | 185/110 | MPa | ISO 527-1/-2 |
| Strain at break | 3.8/7 | % | ISO 527-1/-2 |
| Charpy impact strength, +23 °C | 95/110 | kJ·m−2 | ISO 179/1eU [29] |
| Shore D hardness | -/85 | - | ISO 48-4 [30] |
| Melting temperature, 10 °C/min | 220 | °C | ISO 11357-1/-3 [31] |
| Water absorption | 6.3 | % | Sim. to ISO 62 [32] |
| Humidity absorption | 1.9 | % | Sim. to ISO 62 |
| Density | 1350/- | Kg·m−3 | ISO 1183 [33] |
| Thermal conductivity of melt | 0.27 | W·(m K)−1 | - |
| No. | Filling Time (s) | Filling Pressure (MPa) | Packing Time (s) | Packing Pressure (MPa) | Melt Temperature (°C) | UTS (MPa) |
|---|---|---|---|---|---|---|
| 1 | 3 | 66.96 | ||||
| 2 | 3.2 | 65.51 | ||||
| 3 | 3.4 | 64 | 0.4 | 59 | 269 | 65.8 |
| 4 | 3.6 | 68.23 | ||||
| 5 | 3.8 | 66.59 | ||||
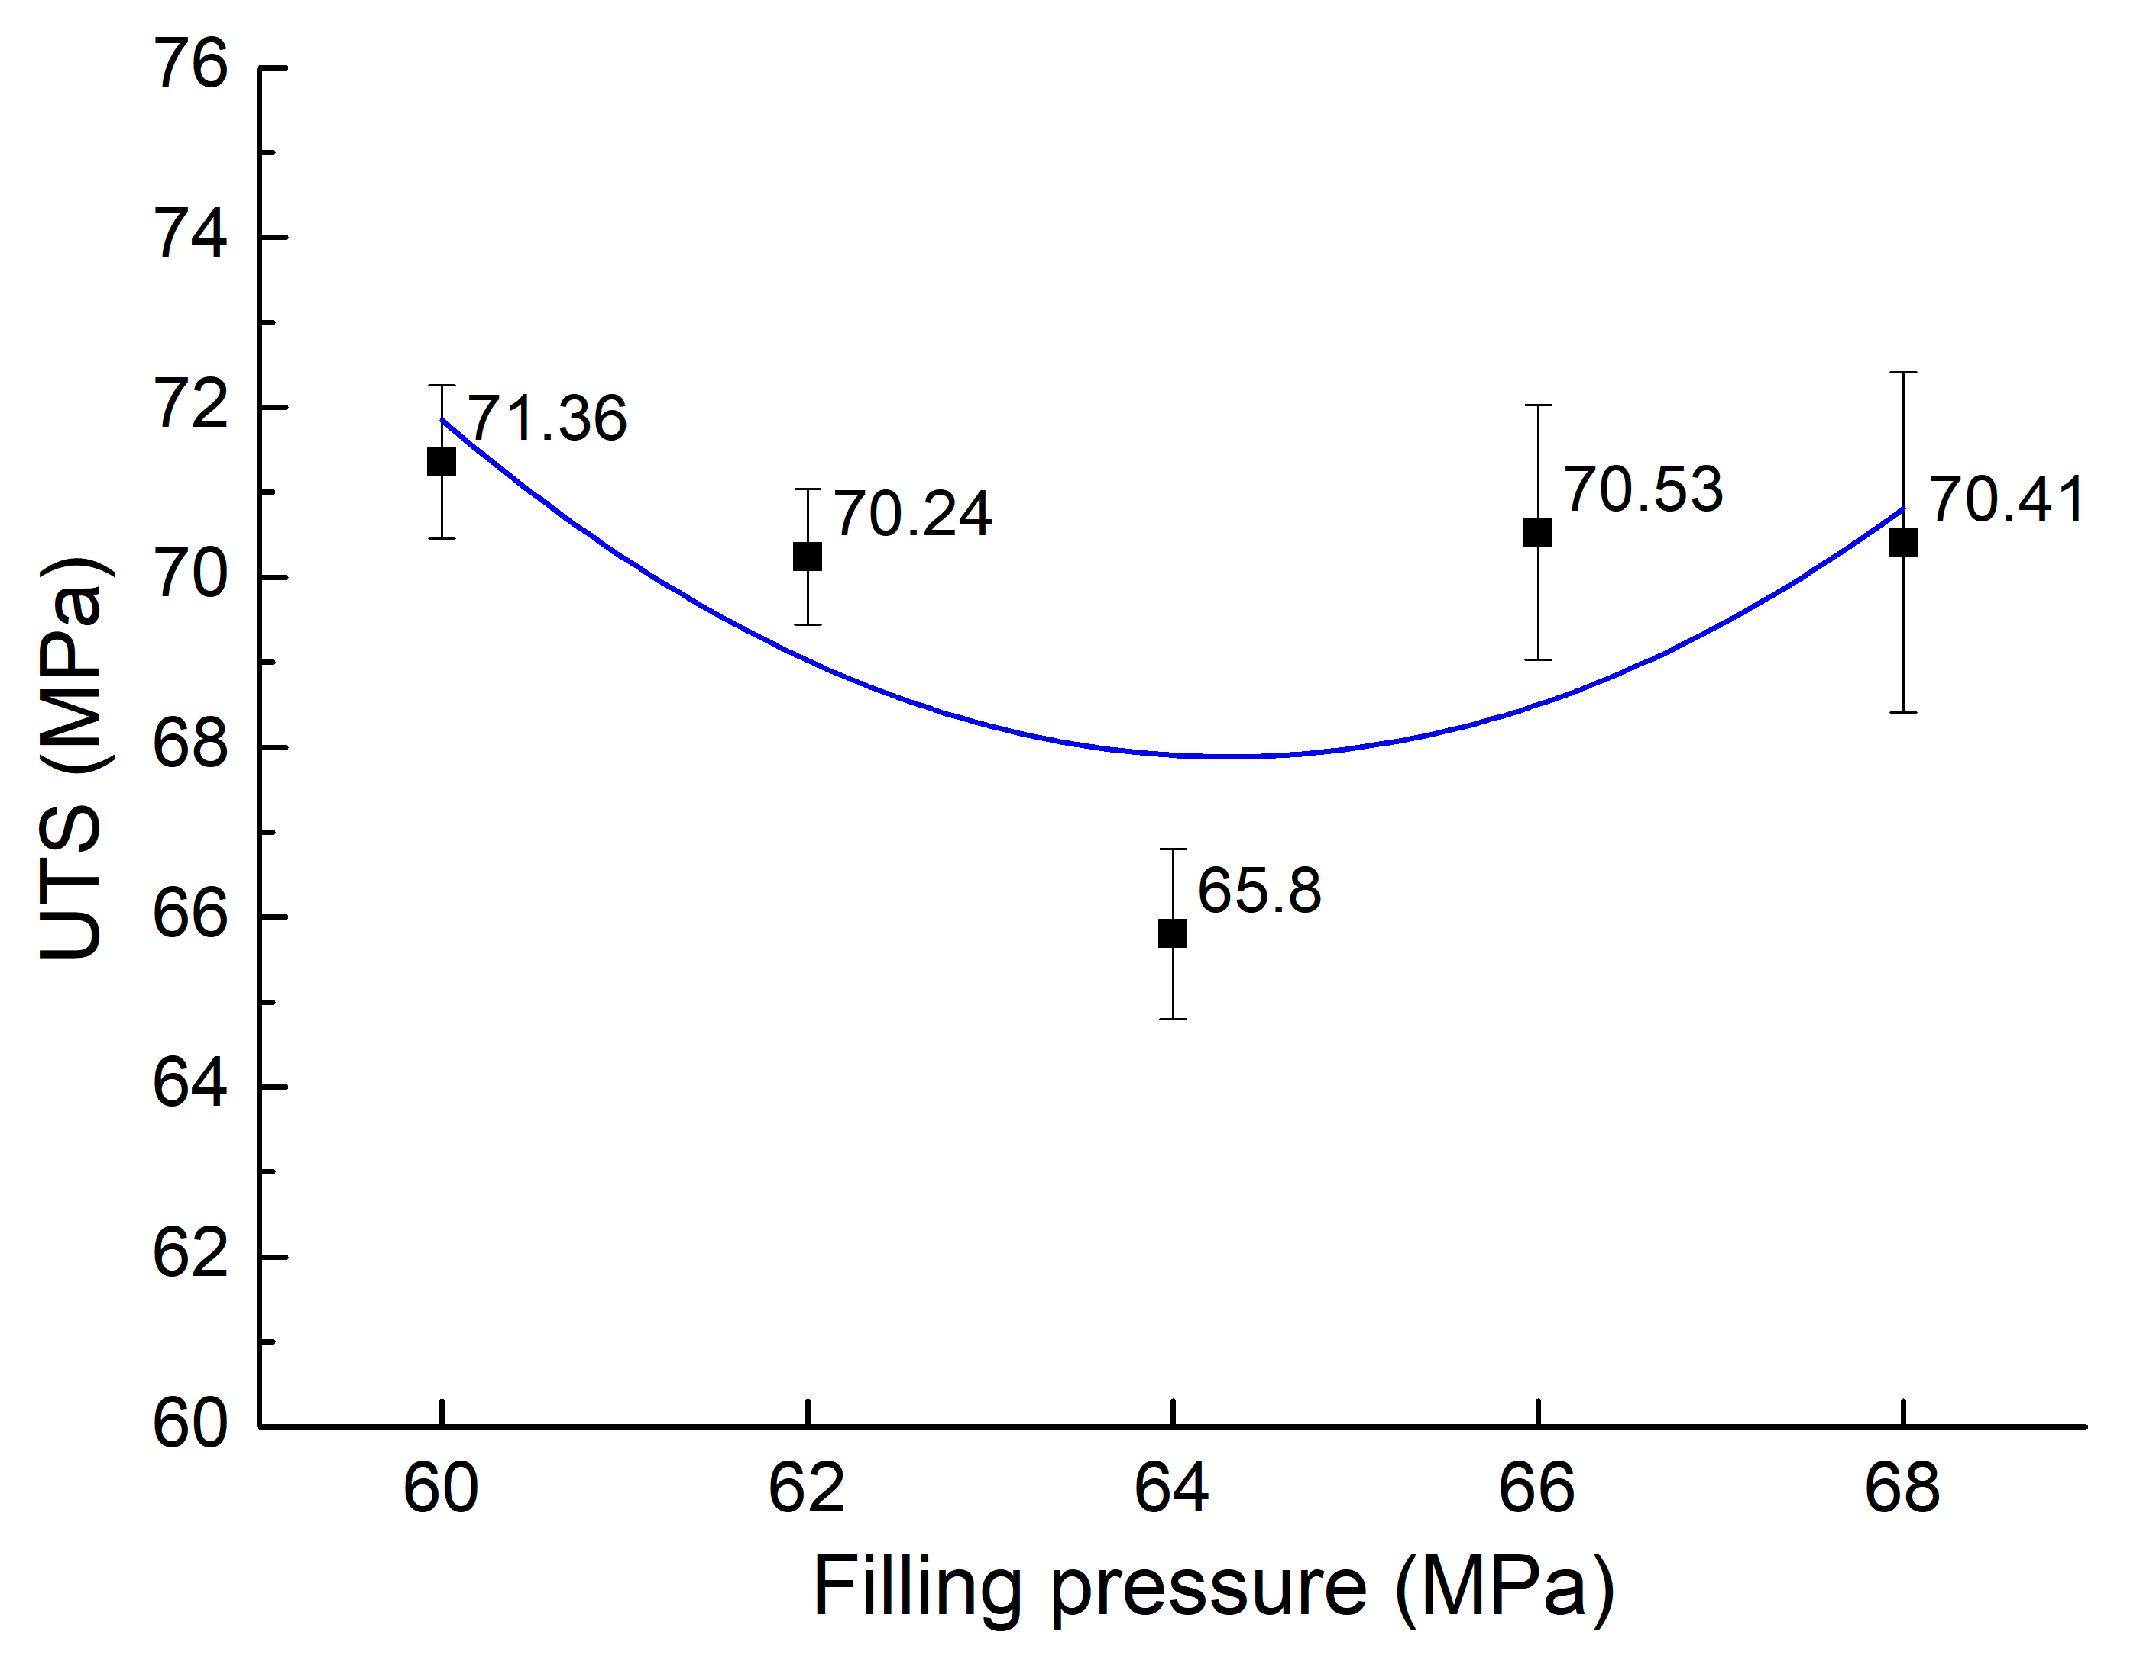
| 6 | 60 | 71.36 | ||||
| 7 | 62 | 70.24 | ||||
| 8 | 3.4 | 64 | 0.4 | 59 | 269 | 65.8 |
| 9 | 66 | 70.53 | ||||
| 10 | 68 | 70.41 | ||||
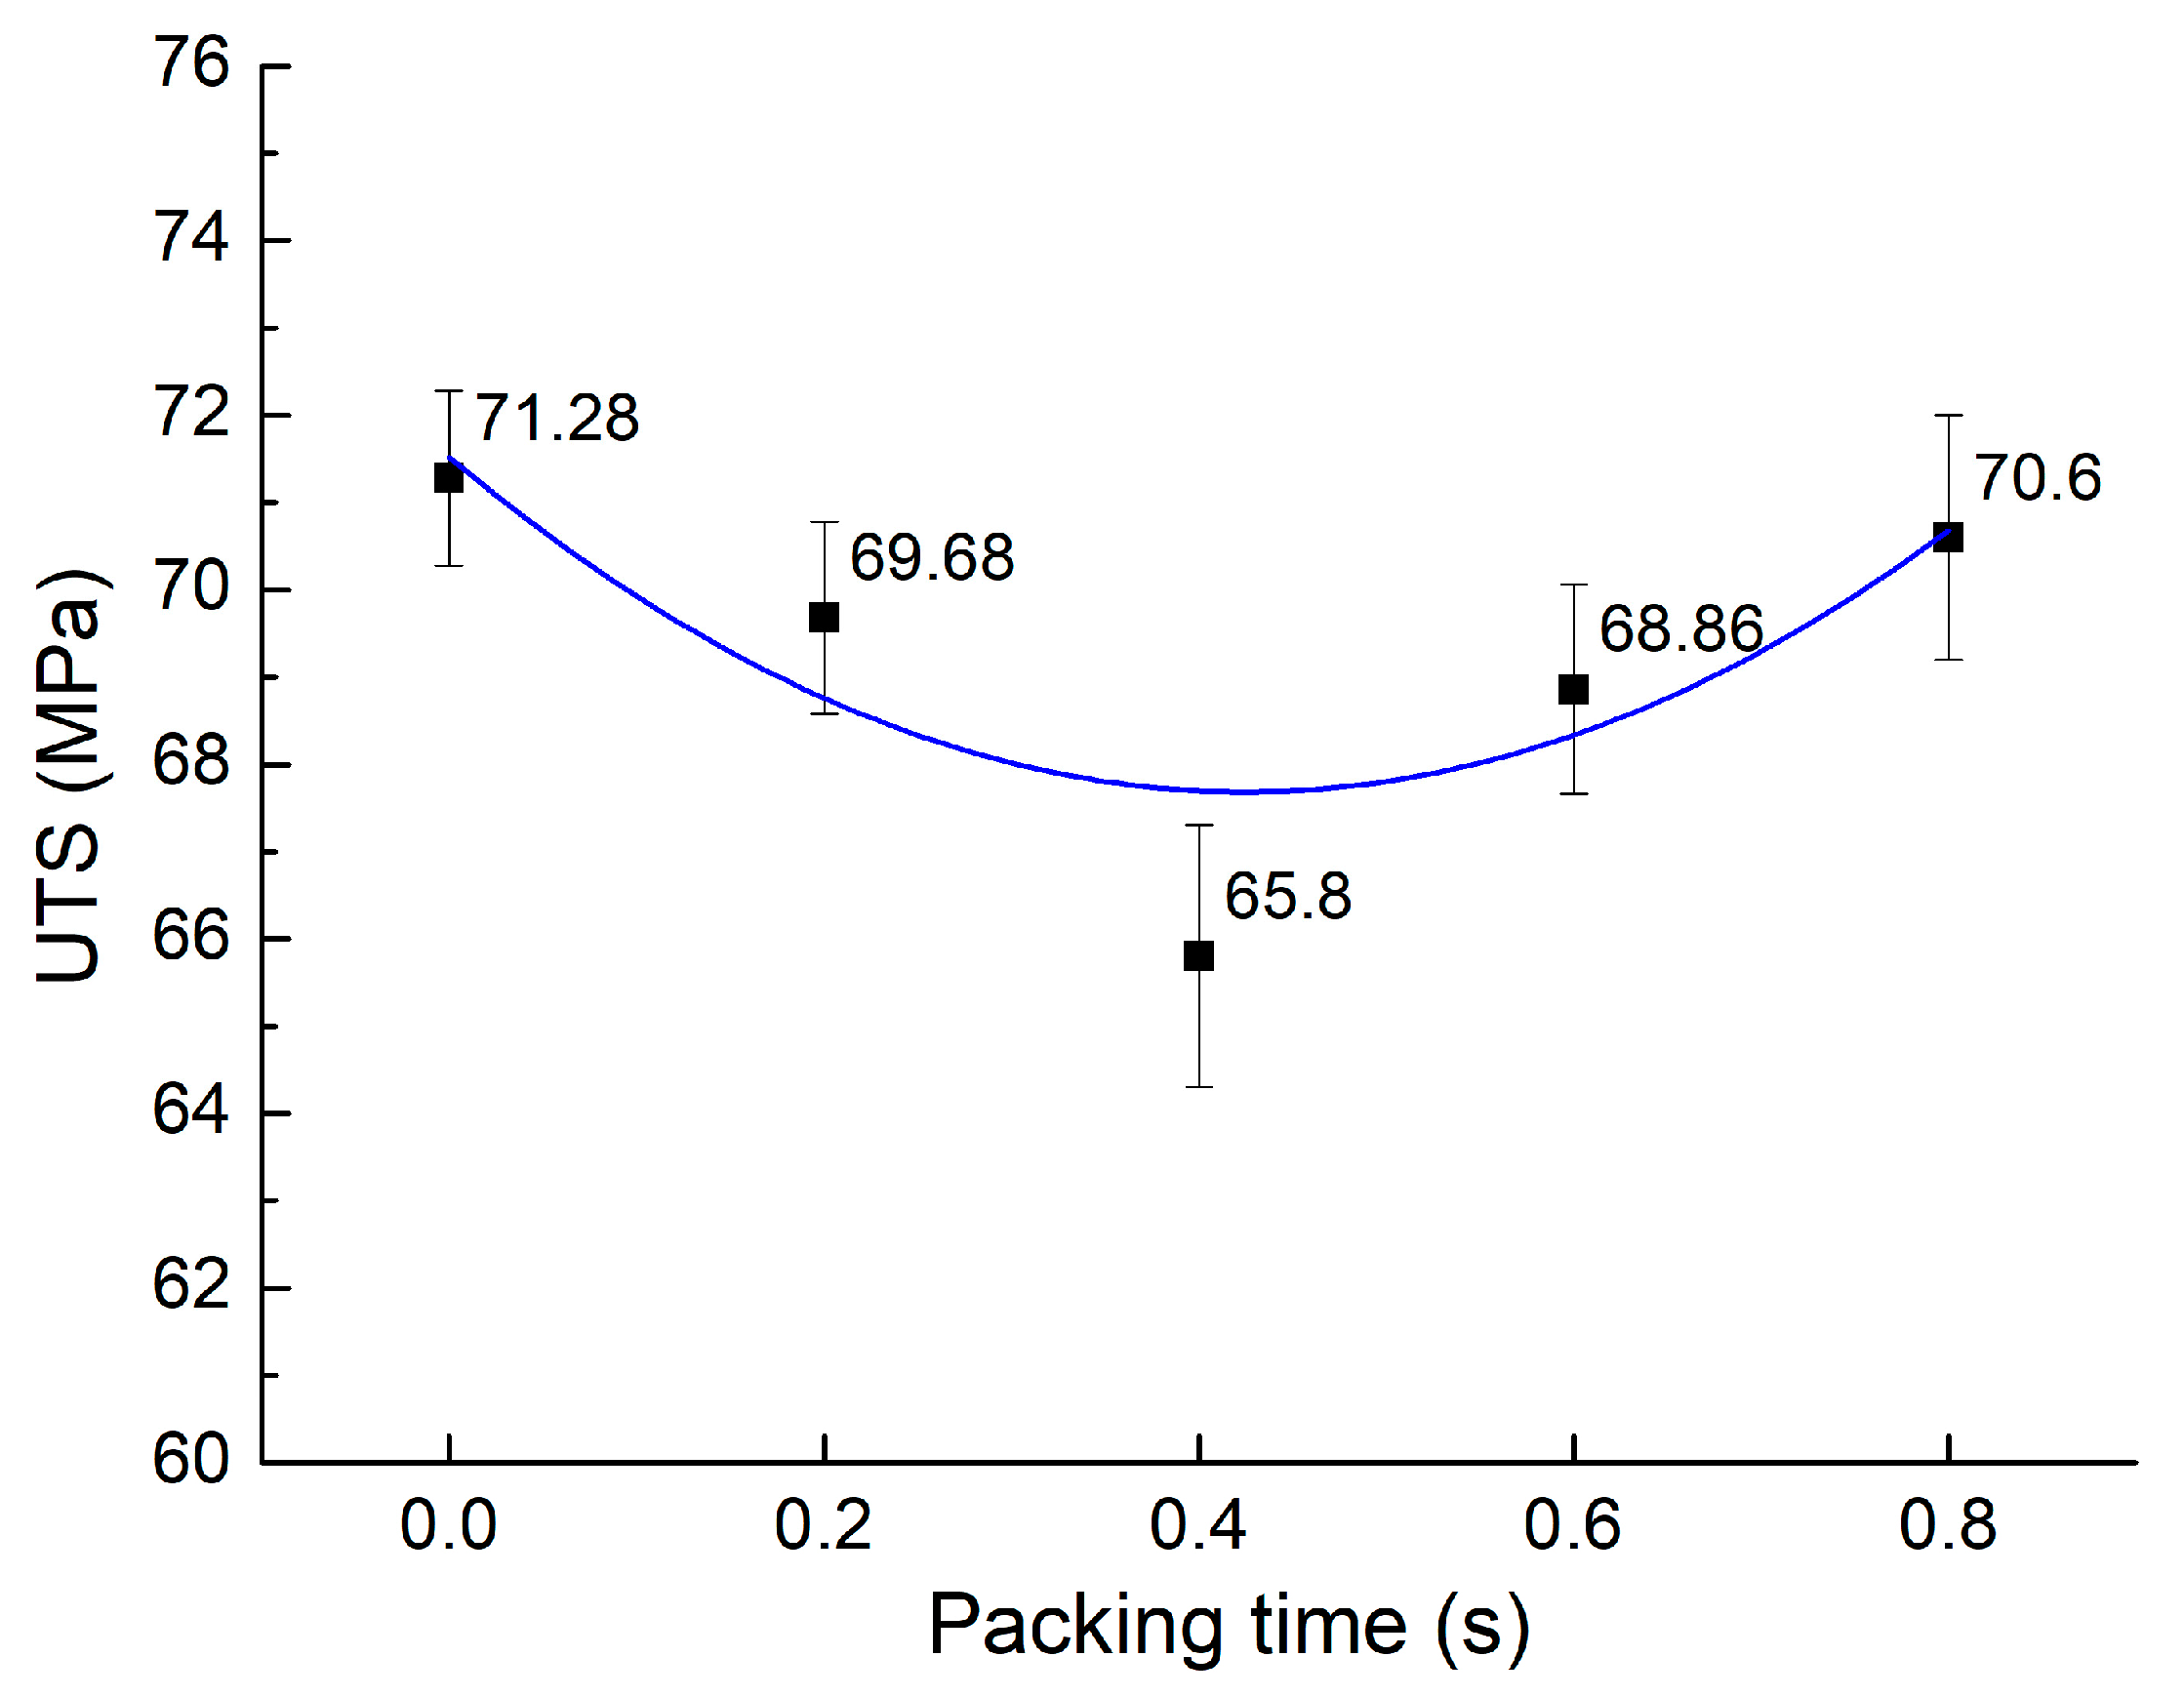
| 11 | 0 | 71.28 | ||||
| 12 | 0.2 | 69.68 | ||||
| 13 | 3.4 | 64 | 0.4 | 59 | 269 | 65.8 |
| 14 | 0.6 | 68.86 | ||||
| 15 | 0.8 | 70.6 | ||||
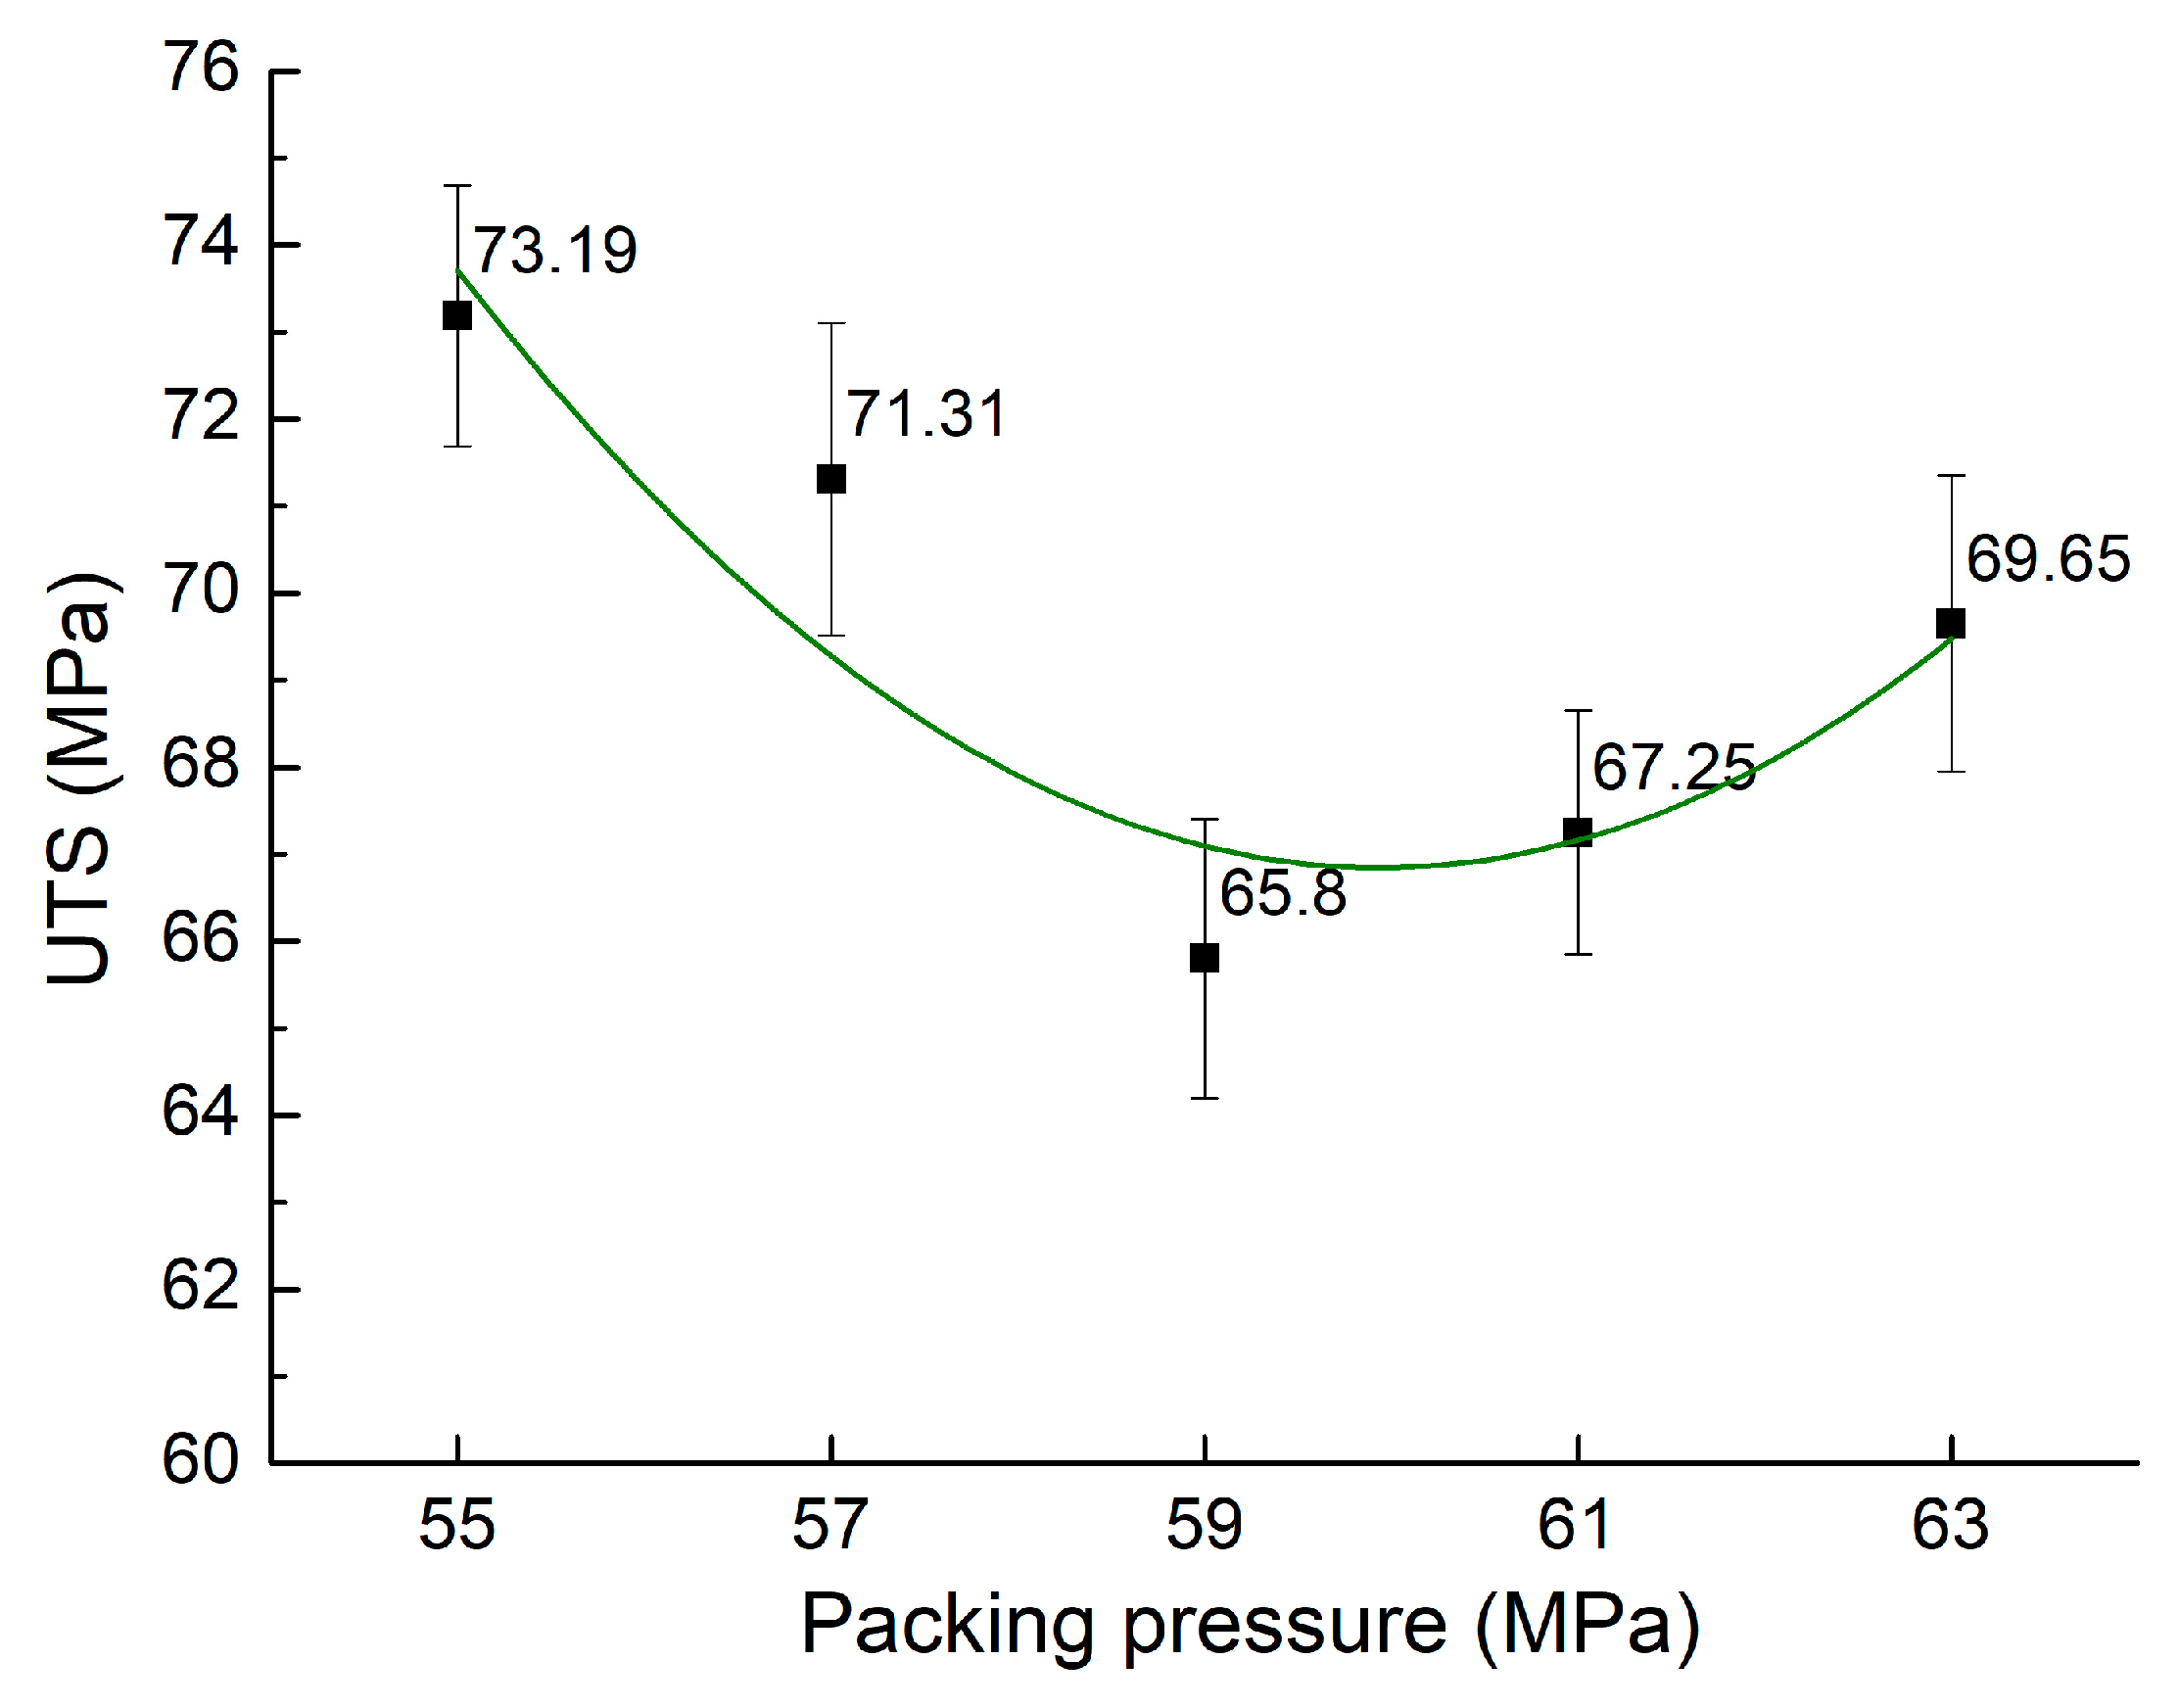
| 16 | 55 | 73.19 | ||||
| 17 | 57 | 71.31 | ||||
| 18 | 3.4 | 64 | 0.4 | 59 | 269 | 65.8 |
| 19 | 61 | 67.25 | ||||
| 20 | 63 | 69.65 | ||||
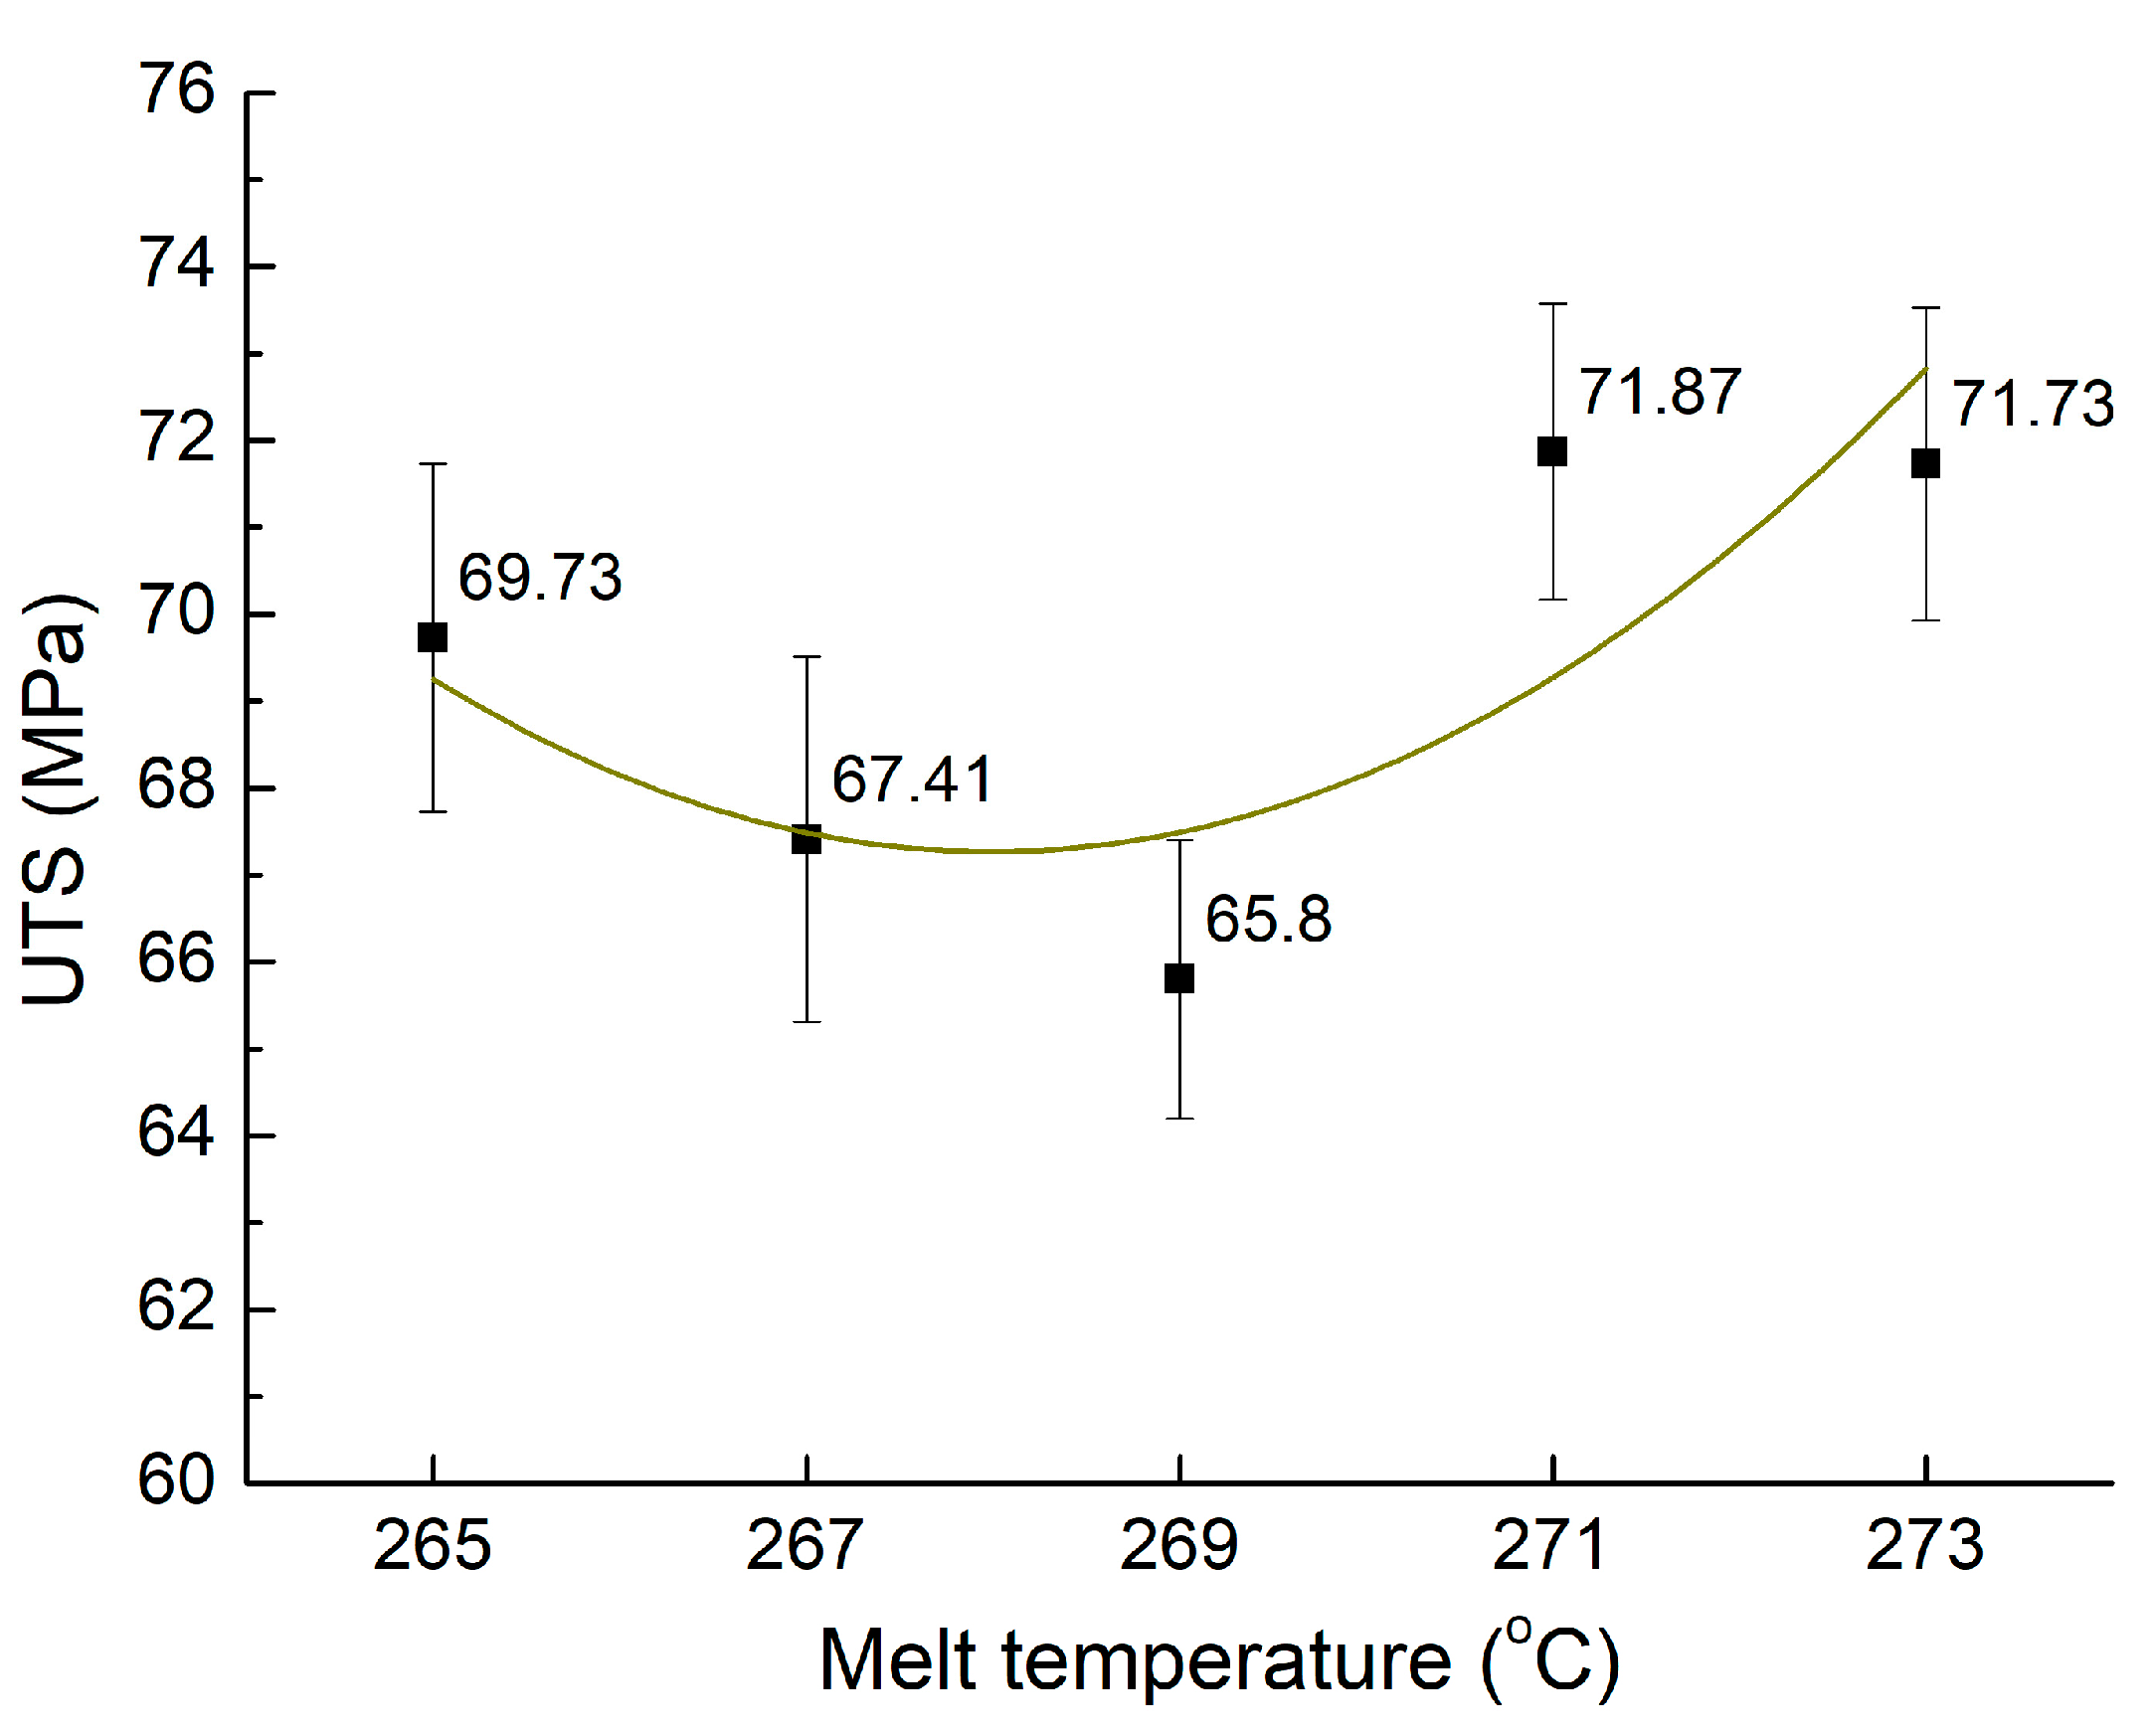
| 21 | 265 | 69.73 | ||||
| 22 | 267 | 67.41 | ||||
| 23 | 3.4 | 64 | 0.4 | 59 | 269 | 65.8 |
| 24 | 271 | 71.87 | ||||
| 25 | 273 | 71.73 |
| Factors | Average UTS (MPa) | Standard Deviation (MPa) |
|---|---|---|
| Filling time | 66.02 | 1.07 |
| Filling pressure | 69.67 | 2.20 |
| Packing time | 69.24 | 2.13 |
| Packing pressure | 69.44 | 2.99 |
| Melt temperature | 69.31 | 2.67 |
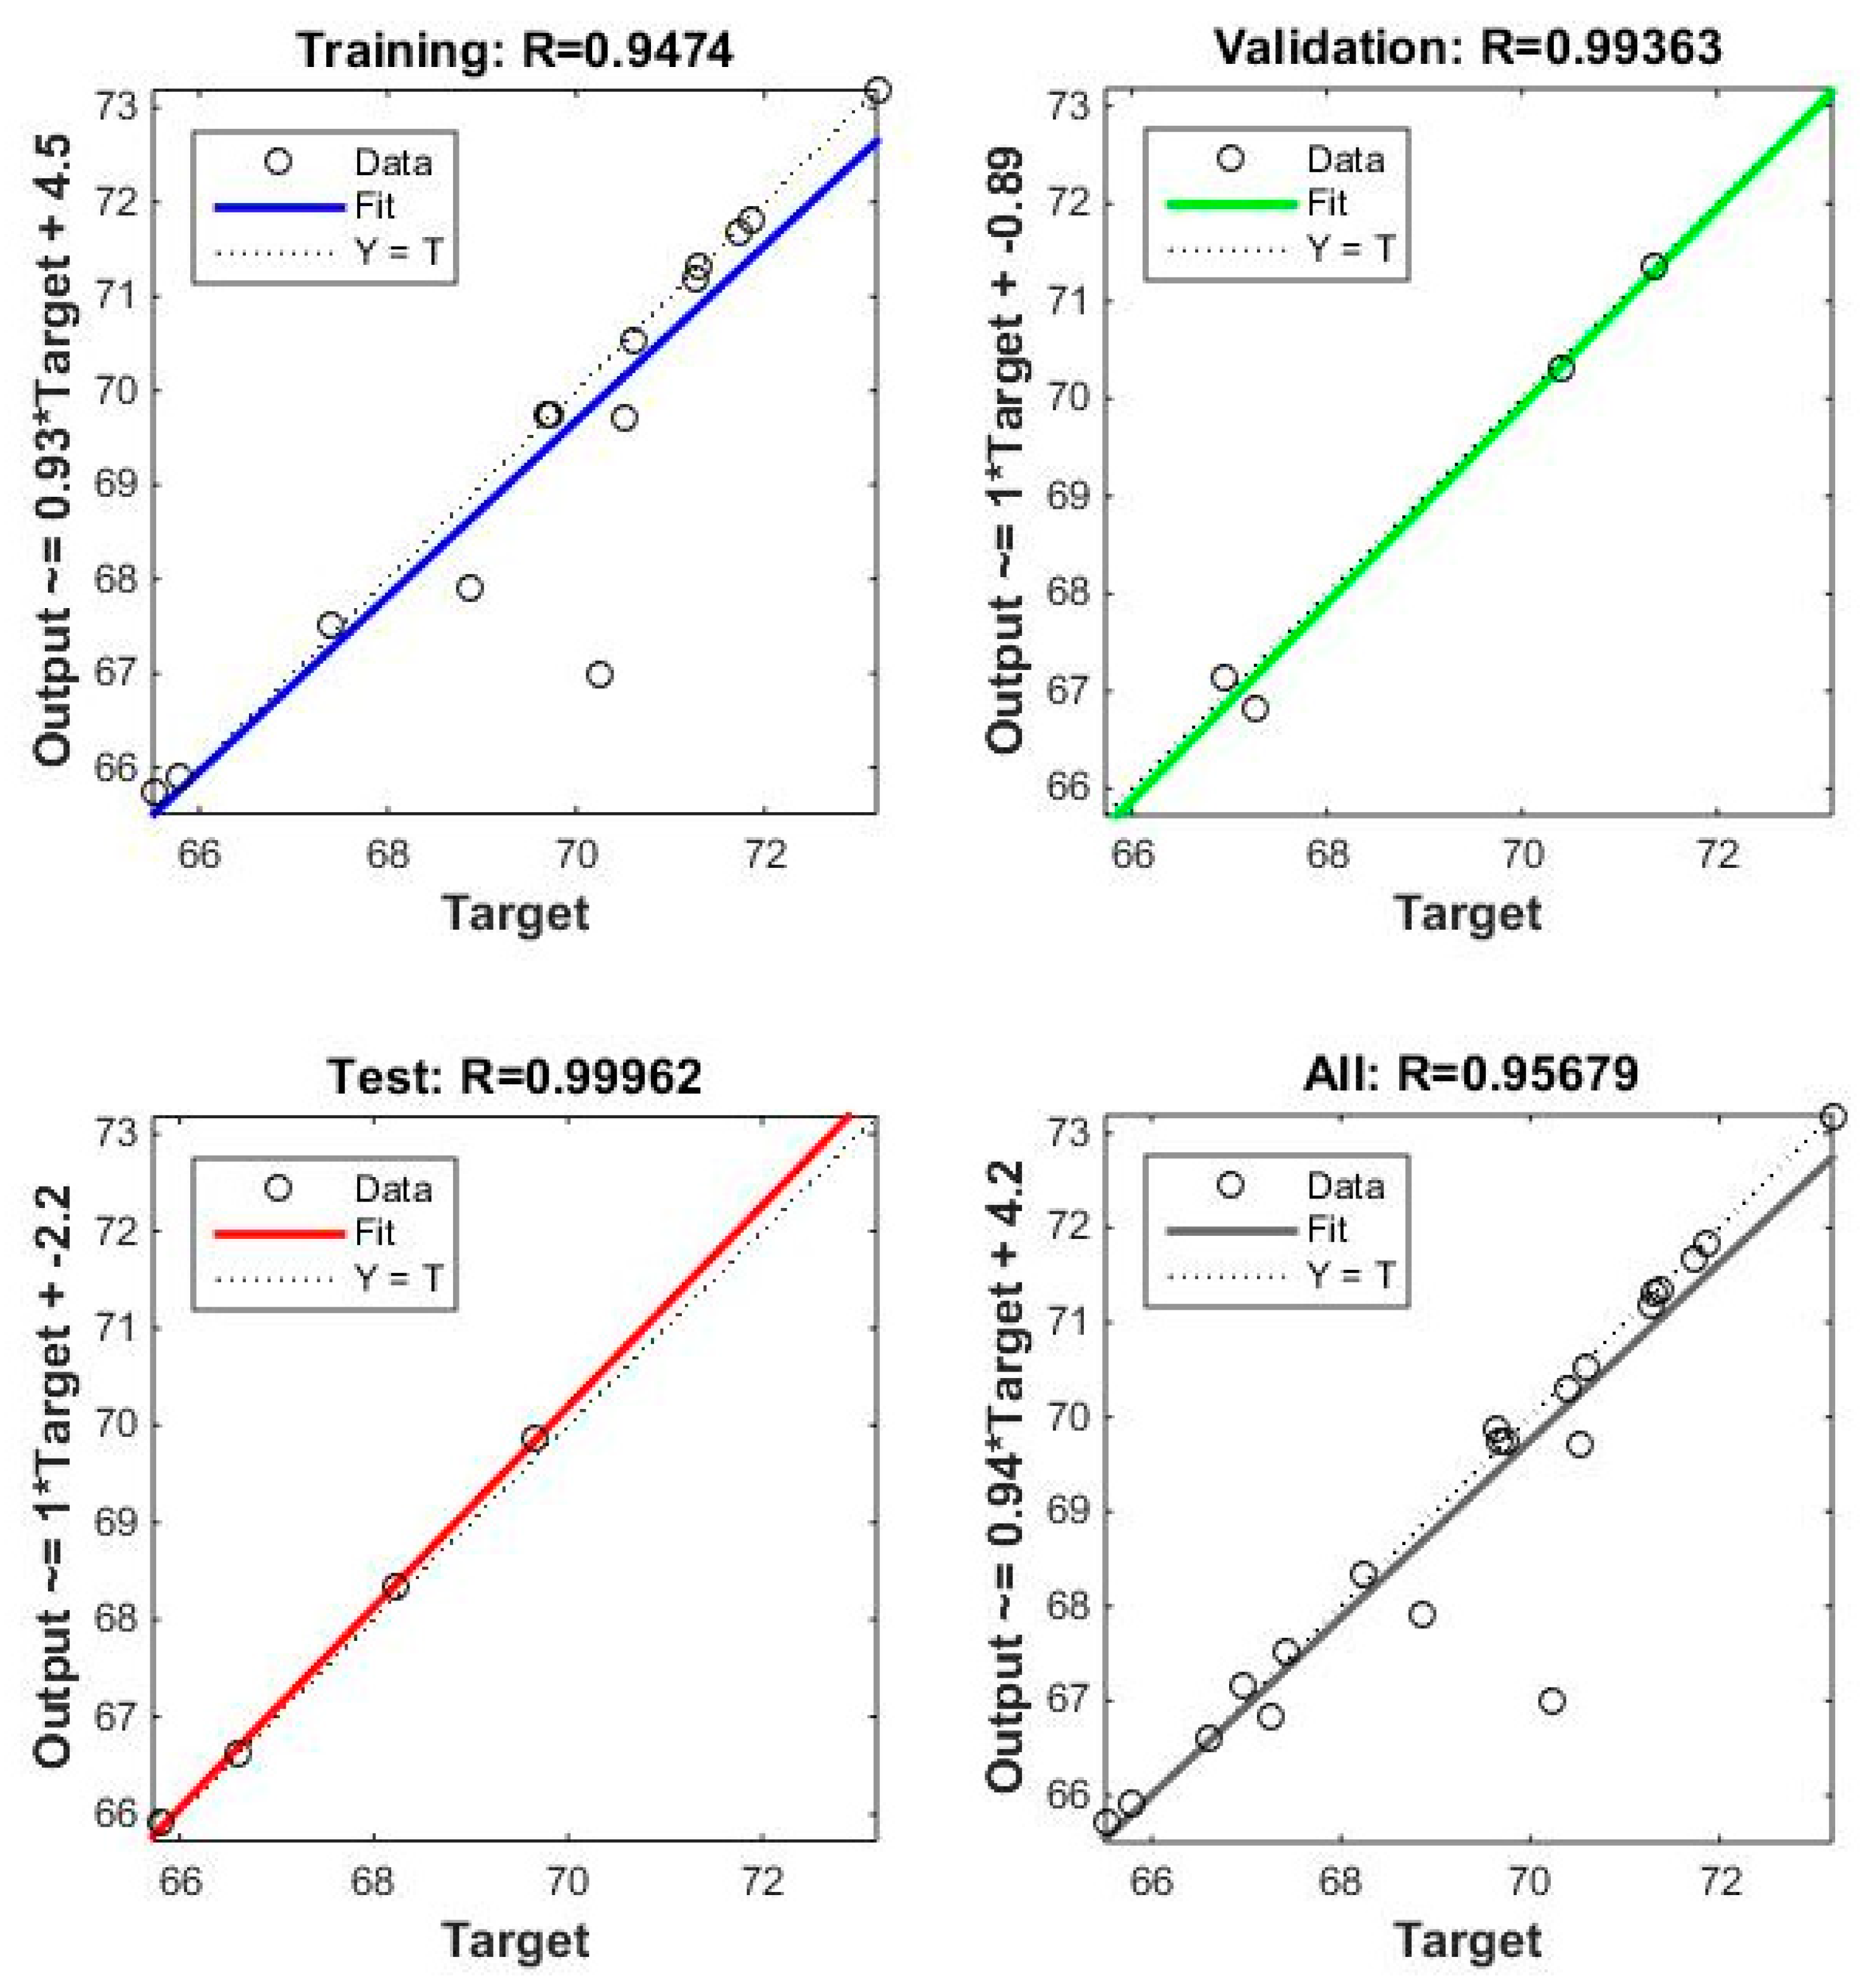
| No. | Experiment (MPa) | Network Output (MPa) | Relative Deviation (%) |
|---|---|---|---|
| 1 | 66.96 | 67.15 | 0.28 |
| 2 | 65.51 | 65.72 | 0.32 |
| 3 | 65.80 | 65.90 | 0.15 |
| 4 | 68.23 | 68.33 | 0.15 |
| 5 | 66.59 | 66.62 | 0.05 |
| 6 | 71.36 | 71.36 | 0.00 |
| 7 | 70.24 | 66.99 | 4.63 |
| 8 | 65.80 | 65.90 | 0.15 |
| 9 | 70.53 | 69.72 | 1.15 |
| 10 | 70.41 | 70.29 | 0.17 |
| 11 | 71.28 | 71.19 | 0.13 |
| 12 | 69.68 | 69.74 | 0.09 |
| 13 | 65.80 | 65.90 | 0.15 |
| 14 | 68.86 | 67.89 | 1.41 |
| 15 | 70.60 | 70.52 | 0.11 |
| 16 | 73.19 | 72.17 | 1.39 |
| 17 | 71.31 | 71.32 | 0.01 |
| 18 | 65.80 | 65.90 | 0.15 |
| 19 | 67.25 | 66.83 | 0.62 |
| 20 | 69.65 | 69.86 | 0.30 |
| 21 | 69.73 | 69.73 | 0.00 |
| 22 | 67.41 | 67.51 | 0.15 |
| 23 | 65.80 | 65.90 | 0.15 |
| 24 | 71.87 | 71.82 | 0.07 |
| 25 | 71.73 | 71.68 | 0.07 |
Disclaimer/Publisher’s Note: The statements, opinions and data contained in all publications are solely those of the individual author(s) and contributor(s) and not of MDPI and/or the editor(s). MDPI and/or the editor(s) disclaim responsibility for any injury to people or property resulting from any ideas, methods, instructions or products referred to in the content. |
© 2024 by the authors. Licensee MDPI, Basel, Switzerland. This article is an open access article distributed under the terms and conditions of the Creative Commons Attribution (CC BY) license (https://creativecommons.org/licenses/by/4.0/).
Share and Cite
Uyen, T.M.T.; Nguyen, H.T.; Nguyen, V.-T.; Minh, P.S.; Do, T.T.; Nguyen, V.T.T. Optimizing the Tensile Strength of Weld Lines in Glass Fiber Composite Injection Molding. Materials 2024, 17, 3428. https://doi.org/10.3390/ma17143428
Uyen TMT, Nguyen HT, Nguyen V-T, Minh PS, Do TT, Nguyen VTT. Optimizing the Tensile Strength of Weld Lines in Glass Fiber Composite Injection Molding. Materials. 2024; 17(14):3428. https://doi.org/10.3390/ma17143428
Chicago/Turabian StyleUyen, Tran Minh The, Hong Trong Nguyen, Van-Thuc Nguyen, Pham Son Minh, Thanh Trung Do, and Van Thanh Tien Nguyen. 2024. "Optimizing the Tensile Strength of Weld Lines in Glass Fiber Composite Injection Molding" Materials 17, no. 14: 3428. https://doi.org/10.3390/ma17143428
APA StyleUyen, T. M. T., Nguyen, H. T., Nguyen, V.-T., Minh, P. S., Do, T. T., & Nguyen, V. T. T. (2024). Optimizing the Tensile Strength of Weld Lines in Glass Fiber Composite Injection Molding. Materials, 17(14), 3428. https://doi.org/10.3390/ma17143428