
Investigating Enhanced Microwave Absorption of CNTs@Nd0.15-BaM/PE Plate via Low-Temperature Sintering and High-Energy Ball Milling

 ,
, 
Abstract
1. Introduction
2. Experiment Section
2.1. Raw Materials
2.2. Preparation Method
2.3. Testing and Characterization
3. Results and Discussion
4. Conclusions
Author Contributions
Funding
Institutional Review Board Statement
Informed Consent Statement
Data Availability Statement
Conflicts of Interest
References
- Chang, M.; Jia, Z.; He, S.; Zhou, J.; Zhang, S.; Tian, M.; Wang, B.; Wu, G. Two-dimensional interface engineering of NiS/MoS2/Ti3C2Tx heterostructures for promoting electromagnetic wave absorption capability. Compos. Part B Eng. 2021, 225, 109306. [Google Scholar] [CrossRef]
- Chang, Y.; Mu, C.; Yang, B.; Nie, A.; Wang, B.; Xiang, J.; Yang, Y.; Wen, F.; Liu, Z. Microwave absorbing properties of two dimensional materials GeP5 enhanced after annealing treatment. Appl. Phys. Lett. 2019, 114, 013103. [Google Scholar] [CrossRef]
- Che, R.C.; Zhi, C.Y.; Liang, C.Y.; Zhou, X.G. Fabrication and microwave absorption of carbon nanotubes/CoFe2O4 spinel nanocomposite. Appl. Phys. Lett. 2006, 88, 033105. [Google Scholar] [CrossRef]
- Gu, X.; Tan, G.; Chen, S.; Man, Q.; Chang, C.; Wang, X.; Li, R.W.; Che, S.; Jiang, L. Microwave absorption properties of planar-anisotropy Ce2Fe17N3-δ powders/Silicone composite in X-band. J. Magn. Magn. Mater. 2017, 424, 39–42. [Google Scholar] [CrossRef]
- Kaur, P.; Bahel, S.; Narang, S.B. Electromagnetic Wave Absorption Properties of La-Doped Strontium M-Type Hexagonal Ferrite in a 18–40 GHz Frequency Range. J. Electron. Mater. 2020, 49, 1654–1659. [Google Scholar] [CrossRef]
- Kong, L.B.; Li, Z.W.; Lin, G.Q.; Gan, Y.B. Electrical and magnetic properties of magnesium ferrite ceramics doped with Bi2O3. Acta Mater. 2007, 55, 6561–6572. [Google Scholar] [CrossRef]
- Li, J.; He, S.; Shi, K.; Wu, Y.; Bai, H.; Hong, Y.; Wu, W.; Meng, Q.; Jia, D.; Zhou, Z. Coexistence of broad-bandwidth and strong microwave absorption in Co2+-Zr4+ co-doped barium ferrite ceramics. Ceram. Int. 2018, 44, 6953–6958. [Google Scholar] [CrossRef]
- Yang, S.; Tang, L.; Wei, H.; Xue, J.; Wang, Z.; Wang, Q.; Zhao, F. In-situ construction of volcanic rock-like structures in Yb2O3 modified reduced graphene oxide and their boosted electromagnetic wave absorbing properties. Carbon 2023, 215, 118445. [Google Scholar] [CrossRef]
- Ma, H.; Zhang, X.; Yang, L.; Ma, L.; Park, C.B.; Gong, P.; Li, G. Electromagnetic wave absorption in graphene nanoribbon nanocomposite foam by multiscale electron dissipation of atomic defects, interfacial polarization and impedance match. Carbon 2023, 205, 159–170. [Google Scholar] [CrossRef]
- Ahmed, M.A.; Okasha, N.; Kershi, R.M. Extraordinary role of rare-earth elements on the transport properties of barium W-type hexaferrite. Mater. Chem. Phys. 2009, 113, 196–201. [Google Scholar] [CrossRef]
- Bi, S.; Su, X.-j.; Li, J.; Hou, G.-l.; Liu, Z.-h.; Zhong, C.-r.; Hou, Z.-l. High-temperature dielectric properties and microwave absorption abilities of Bi1-xMgxFeO3 nanoparticles. Ceram. Int. 2017, 43, 11815–11819. [Google Scholar] [CrossRef]
- Zhang, X.; Zhang, Y.; Yue, Z.; Zhang, J. Influences of sintering atmosphere on the magnetic and electrical properties of barium hexaferrites. Aip Adv. 2019, 9, 085129. [Google Scholar] [CrossRef]
- Qiu, J.X.; Gu, M.Y.; Shen, H.G. Microwave absorption properties of Al- and Cr-substituted M-type barium hexaferrite. J. Magn. Magn. Mater. 2005, 295, 263–268. [Google Scholar] [CrossRef]
- Ghasemi, A.; Hossienpour, A.; Morisako, A.; Saatchi, A.; Salehi, M. Electromagnetic properties and microwave absorbing characteristics of doped barium hexaferrite. J. Magn. Magn. Mater. 2006, 302, 429–435. [Google Scholar] [CrossRef]
- Feng, G.; Zhou, W.; Deng, H.; Chen, D.; Qing, Y.; Wang, C.; Luo, F.; Zhu, D.; Huang, Z.; Zhou, Y. Co substituted BaFe12O19 ceramics with enhanced magnetic resonance behavior and microwave absorption properties in 2.6–18 GHz. Ceram. Int. 2019, 45, 13859–13864. [Google Scholar] [CrossRef]
- Chen, Y.; Cheng, L.; Xia, T.; Wang, M.; Zhou, H.; Yao, Q.; Zhai, Y. Effect of Bi doping on the structure and wave absorption properties of barium ferrite. Ceram. Int. 2022, 48, 3963–3973. [Google Scholar] [CrossRef]
- Shooshtary Veisi, S.; Yousefi, M.; Amini, M.M.; Shakeri, A.R.; Bagherzadeh, M. Magnetic and microwave absorption properties of Cu/Zr doped M-type Ba/Sr hexaferrites prepared via sol-gel auto-combustion method. J. Alloys Compd. 2019, 773, 1187–1194. [Google Scholar] [CrossRef]
- Wang, Z.; Zhao, L.; Wang, P.; Guo, L.; Yu, J. Low material density and high microwave-absorption performance of hollow strontium ferrite nanofibers prepared via coaxial electrospinning. J. Alloys Compd. 2016, 687, 541–547. [Google Scholar] [CrossRef]
- Li, C.-J.; Wang, B.; Wang, J.-N. Magnetic and Microwave Absorbing Properties of Electrospun Ba(1-x)LaxFe12O19 Nanofibers. J. Magn. Magn. Mater. 2012, 324, 1305–1311. [Google Scholar] [CrossRef]
- Huang, X.; Chen, J.; Wang, L.; Zhang, Q. Electromagnetic and microwave absorbing properties of W-type barium ferrite doped with Gd3+. Rare Met. 2011, 30, 44–48. [Google Scholar] [CrossRef]
- Liu, J.; Feng, X.; Wu, S.; Zhou, P.; Huang, J.; Li, H.; Liang, T. High microwave absorption performance in Nd-substituted BaM/GO through sol-gel and high energy ball milling process. J. Alloys Compd. 2021, 892, 162207. [Google Scholar] [CrossRef]
- Wang, X.; Wang, B.; Wei, S.; Liang, Y.; Wang, Y.; Li, L.; Liu, Z. MOF-derived porous helical carbon nanotube/doped barium ferrite composites for enhanced microwave absorption. Colloids Surf. A-Physicochem. Eng. Asp. 2023, 671, 131678. [Google Scholar] [CrossRef]
- Ismail, I.; Ibrahim, I.R.; Matori, K.A.; Awang, Z.; Zulkimi, M.M.M.; Idris, F.M.; Nazlan, R.; Azis, R.a.S.; Zaid, M.H.M.; Rusly, S.N.A.; et al. Comparative study of single- and double-layer BaFe12O19-Graphite nanocomposites for electromagnetic wave absorber applications. Mater. Res. Bull. 2020, 126, 110843. [Google Scholar] [CrossRef]
- Liu, Y.; Lin, Y.; Yang, H. Facile fabrication for core-shell BaFe12O19@C composites with excellent microwave absorption properties. J. Alloys Compd. 2019, 805, 130–137. [Google Scholar] [CrossRef]
- Liu, J.; Zhang, J.; Zhang, P.; Wang, S.; Lu, C.; Li, Y.; Zhang, M. Tunable microwave absorbing properties of barium hexa-ferrite nano powders by surface carbonized layers. Mater. Lett. 2015, 158, 53–57. [Google Scholar] [CrossRef]
- He, L.; Chen, C.; Liu, J.; Ma, W.; Li, X.; Zhao, Y.; Xi, X. Magnetic Multilayer Composites Based on Carbon Nanotubes Modified SiC/BaFe12O19 for Wideband Microwave Absorption. ACS Appl. Nano Mater. 2023, 6, 23222–23231. [Google Scholar] [CrossRef]
- Beevers, J.E.; Love, C.J.; Lazarov, V.K.; Cavill, S.A.; Izadkha, H.; Vittoria, C.; Fan, R.; van der Laan, G.; Dhesi, S.S. Enhanced magnetoelectric effect in M-type hexaferrites by Co substitution into trigonal bi-pyramidal sites. Appl. Phys. Lett. 2018, 112, 082401. [Google Scholar] [CrossRef]
- Gulbin, V.N.; Tcherdyntsev, V.V. Structure and microwave absorbing properties of carbon-filled ultra-high molecular weight polyethylene. Sci. Eng. Compos. Mater. 2018, 25, 153–157. [Google Scholar] [CrossRef]
- Wu, C.; Chen, S.; Gu, X.; Hu, R.; Zhong, S.; Tan, G.; Man, Q.; Chang, C.; Wang, X.; Li, R.-W. Enhanced and broadband absorber with surface pattern design for X-Band. Curr. Appl. Phys. 2018, 18, 55–60. [Google Scholar] [CrossRef]
- Widanarto, W.; Amirudin, F.; Ghoshal, S.K.; Effendi, M.; Cahyanto, W.T. Structural and magnetic properties of La3+ substituted barium-natural nanoferrites as microwave absorber in X-band. J. Magn. Magn. Mater. 2017, 426, 483–486. [Google Scholar] [CrossRef]
- Xie, Y.; Guo, Y.; Cheng, T.; Zhao, L.; Wang, T.; Meng, A.; Zhang, M.; Li, Z. Efficient electromagnetic wave absorption performances dominated by exchanged resonance of lightweight PC/Fe3O4@PDA hybrid nanocomposite. Chem. Eng. J. 2023, 457, 141205. [Google Scholar] [CrossRef]
- Kim, T.; Lee, J.; Lee, K.; Park, B.; Jung, B.M.; Lee, S.B. Magnetic and dispersible FeCoNi-graphene film produced without heat treatment for electromagnetic wave absorption. Chem. Eng. J. 2019, 361, 1182–1189. [Google Scholar] [CrossRef]
- Zan, S.; Feng, Y.; Nie, Z.; Li, H.; Hu, X.; Su, J.; Deng, P.; Qi, S.; Wang, R. Double layer metal selenides growing on Ni-plated carbon fibers toward high efficiency electromagnetic wave absorption. Mater. Today Commun. 2022, 33, 104223. [Google Scholar] [CrossRef]
- Qiu, J.X.; Gu, M.Y. Magnetic nanocomposite thin films of BaFe12O19 and TiO2 prepared by sol-gel method. Appl. Surf. Sci. 2005, 252, 888–892. [Google Scholar] [CrossRef]
- Huang, X.; Liu, X.; Jia, Z.; Wang, B.; Wu, X.; Wu, G. Synthesis of 3D cerium oxide/porous carbon for enhanced electromagnetic wave absorption performance. Adv. Compos. Hybrid Mater. 2021, 4, 1398–1412. [Google Scholar] [CrossRef]
- Auwal, I.A.; Baykal, A.; Guner, S.; Sertkol, M.; Sozeri, H. Magneto-optical properties BaBixLaxFe12-2xO19 (0.0 ≤ x ≤ 0.5) hexaferrites. J. Magn. Magn. Mater. 2016, 409, 92–98. [Google Scholar] [CrossRef]
- Li, X.; Cui, E.; Xiang, Z.; Yu, L.; Xiong, J.; Pan, F.; Lu, W. Fe@NPC@CF nanocomposites derived from Fe-MOFs/biomass cotton for lightweight and high-performance electromagnetic wave absorption applications. J. Alloys Compd. 2020, 819, 152952. [Google Scholar] [CrossRef]
- Liu, T.; Zhang, Y.; Wang, C.; Kang, Y.; Wang, M.; Wu, F.; Huang, W. Multifunctional MoCx Hybrid Polyimide Aerogel with Modified Porous Defect Engineering for Highly Efficient Electromagnetic Wave Absorption. Small 2024, 2308378. [Google Scholar] [CrossRef]


| Materials | Methods | Shape | RLmin (dB) | The Frequency of RLmin (GHz) | EAB (GHz) | Thickness (mm) | Ref. |
|---|---|---|---|---|---|---|---|
| Al-BaM | Self-propagating combustion | powder | −34.76 | 14.57 | / | / | [13] |
| Mn, Cu, Ti-BaM | Conventional ceramic technique | powder | −51.78 | 18.78 | 2.79 (<−20 dB) | 1.8 | [14] |
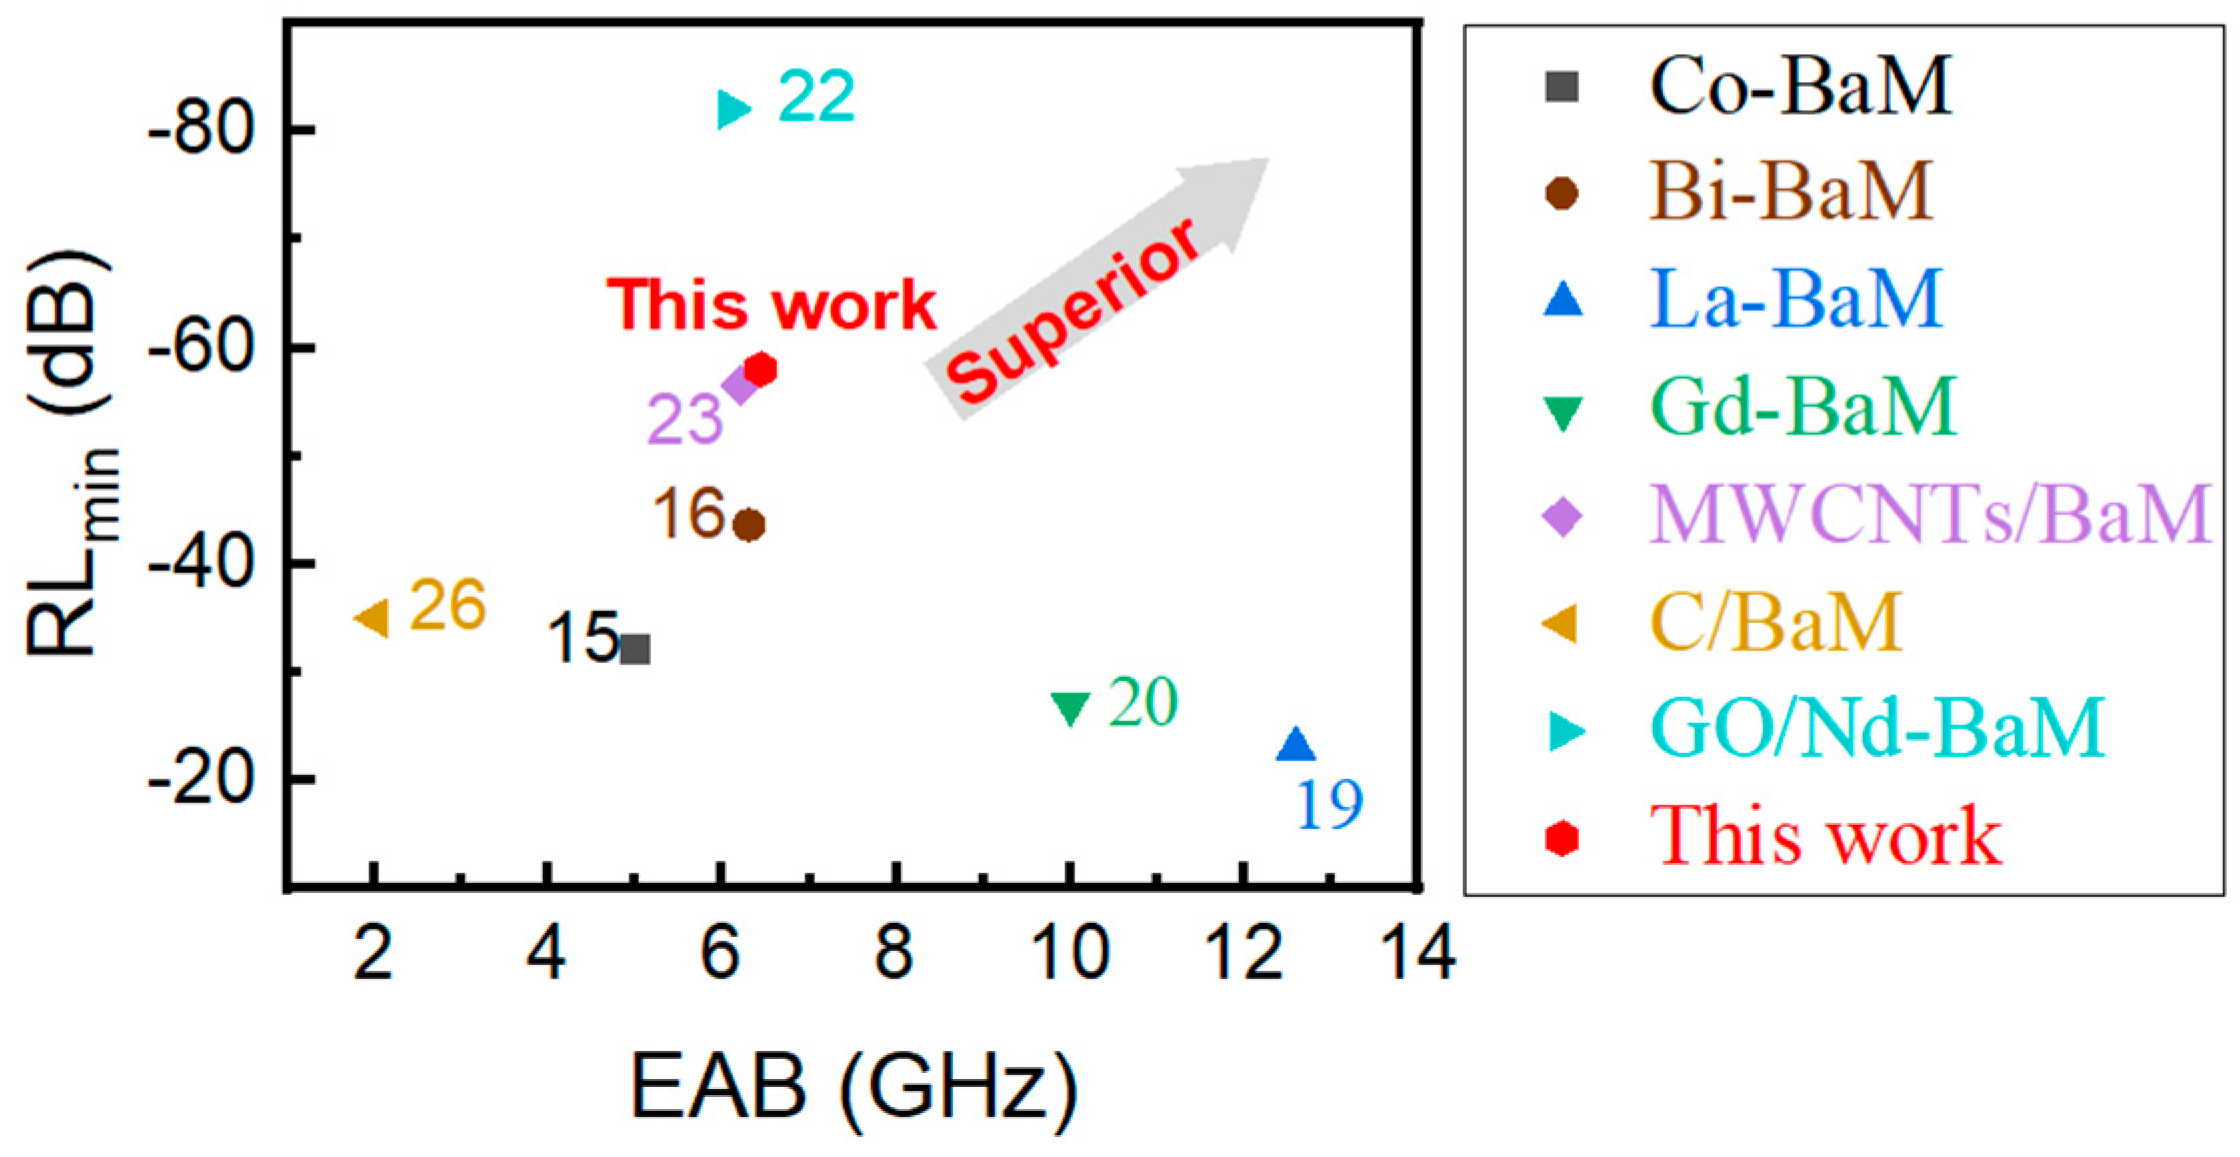
| Co-BaM | Solid-state reaction | powder | −32.1 | 11.2 | 5 | 2 | [15] |
| Bi-BaM | Sol–gel | powder | −43.60 | / | 6.3 | 2.4 | [16] |
| Sr, Cu, Zr-BaM | Sol–gel | powder | −15.20 | 11.1 | / | / | [17] |
| Sr-BaM | Co-axial electrospinning | coating | −12.69 | 11.68 | / | / | [18] |
| La-BaM | Electrospinning Heat treatment | powder | −23.03 | 2 | 12.6 | 2 | [19] |
| Gd-BaM | Sol–gel | coating | −27.00 | / | 10 | 1.92 | [20] |
| Nd-BaM | Sol–gel | powder | −17.91 | 12.56 | / | 3 | [21] |
| MWCNTs/BaM | Sol–gel | powder | −56.47 | 4.8 | 6.2 | 1.35 | [22] |
| C/BaM | / | powder | −30 | 9.2 | 0.6 | 3 | [23] |
| C/BaM | The hydrothermal carbonization and subsequent calcinations | powder | −73.42 | / | / | 1.40 | [24] |
| C/BaM | Surface carbonized layers | powder | −35 | 15.5 | 2.0 | 5.5 mm | [25] |
| C, SiC/BaM | Hydrothermal method | powder | / | / | 8.8 | 2.8 mm | [26] |
| GO/Nd-BaM | Sol–gel | powder | −82.07 | 12.65 | 6.08 | 2 mm | [21] |
Disclaimer/Publisher’s Note: The statements, opinions and data contained in all publications are solely those of the individual author(s) and contributor(s) and not of MDPI and/or the editor(s). MDPI and/or the editor(s) disclaim responsibility for any injury to people or property resulting from any ideas, methods, instructions or products referred to in the content. |
© 2024 by the authors. Licensee MDPI, Basel, Switzerland. This article is an open access article distributed under the terms and conditions of the Creative Commons Attribution (CC BY) license (https://creativecommons.org/licenses/by/4.0/).
Share and Cite
Wang, C.; Feng, X.; Yu, C.; Zhang, L.; Zhou, S.; Liu, Y.; Huang, J.; Li, H. Investigating Enhanced Microwave Absorption of CNTs@Nd0.15-BaM/PE Plate via Low-Temperature Sintering and High-Energy Ball Milling. Materials 2024, 17, 3433. https://doi.org/10.3390/ma17143433
Wang C, Feng X, Yu C, Zhang L, Zhou S, Liu Y, Huang J, Li H. Investigating Enhanced Microwave Absorption of CNTs@Nd0.15-BaM/PE Plate via Low-Temperature Sintering and High-Energy Ball Milling. Materials. 2024; 17(14):3433. https://doi.org/10.3390/ma17143433
Chicago/Turabian StyleWang, Chengying, Xiaohua Feng, Chengwu Yu, Lixia Zhang, Shengguo Zhou, Yi Liu, Jing Huang, and Hua Li. 2024. "Investigating Enhanced Microwave Absorption of CNTs@Nd0.15-BaM/PE Plate via Low-Temperature Sintering and High-Energy Ball Milling" Materials 17, no. 14: 3433. https://doi.org/10.3390/ma17143433
APA StyleWang, C., Feng, X., Yu, C., Zhang, L., Zhou, S., Liu, Y., Huang, J., & Li, H. (2024). Investigating Enhanced Microwave Absorption of CNTs@Nd0.15-BaM/PE Plate via Low-Temperature Sintering and High-Energy Ball Milling. Materials, 17(14), 3433. https://doi.org/10.3390/ma17143433