

Polarization-Accelerated Seawater Splash Simulation for Rapid Evaluation of Protection Performance of an Epoxy Coating on Carbon Steel


Abstract
:1. Introduction
2. Experimental
2.1. Materials
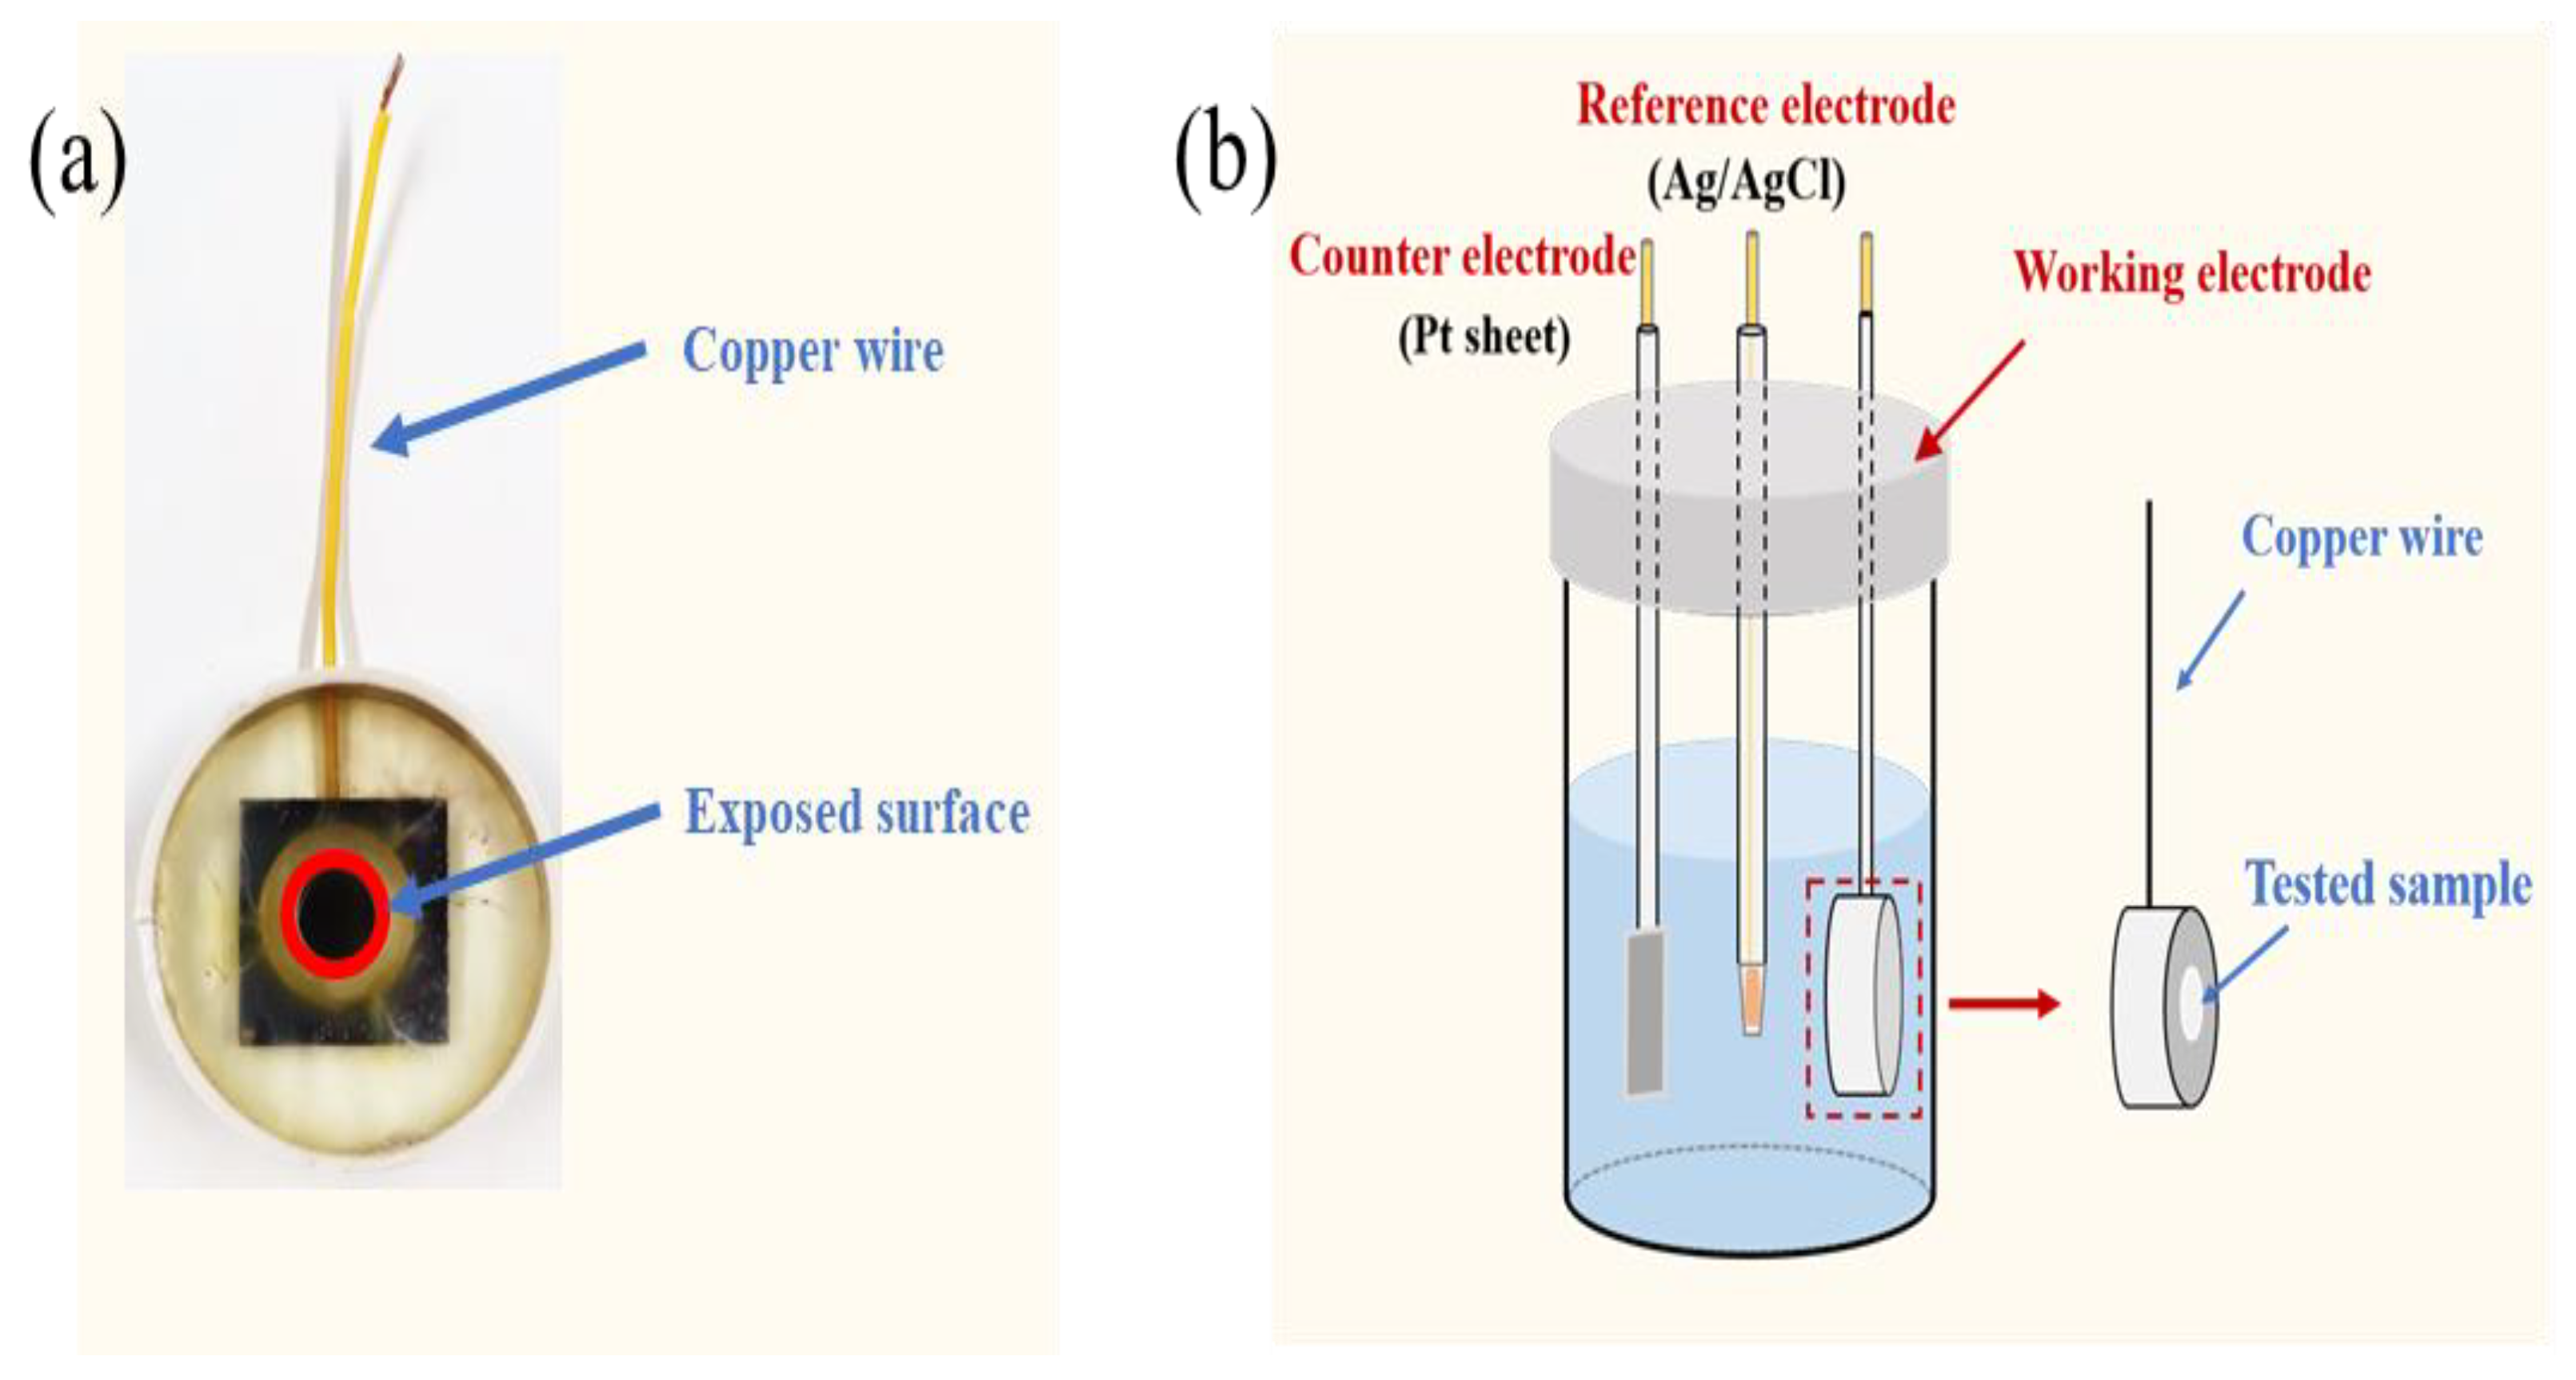
2.2. EIS Test
2.3. Three Accelerated Tests
- (1)
- An improved AC-DC-AC test including alternant cathodic and anodic polarization with symmetrical positive and negative electric charges, called EPolarization+Immersion. This test contained four parts. (a) The samples were immersed in the 3.5 wt% NaCl solution with the first OCP step for time t1. (b) Then, an AC EIS test was put into effect for time t2. (c) Then a cathodic DC (polarization) with −0.05 mC under −4 V was applied by using the Chronocoulometry method, and then an anodic DC (polarization) with 0.05 mC under 4 V was applied equally. Among these, the −4 V used in the cathodic DC (polarization) was derived from the accelerated cyclic electrochemical technique, named ACET corresponding to UNE-EN ISO 17463:2022 [53]; as a comparison goal, 4 V was also applied. The time of this step was t3. (d) Then, the sample was measured with the second OCP step for time t4. The total time (t1 + t2 + t3 + t4) of one cycle in this test was 4 h.
- (2)
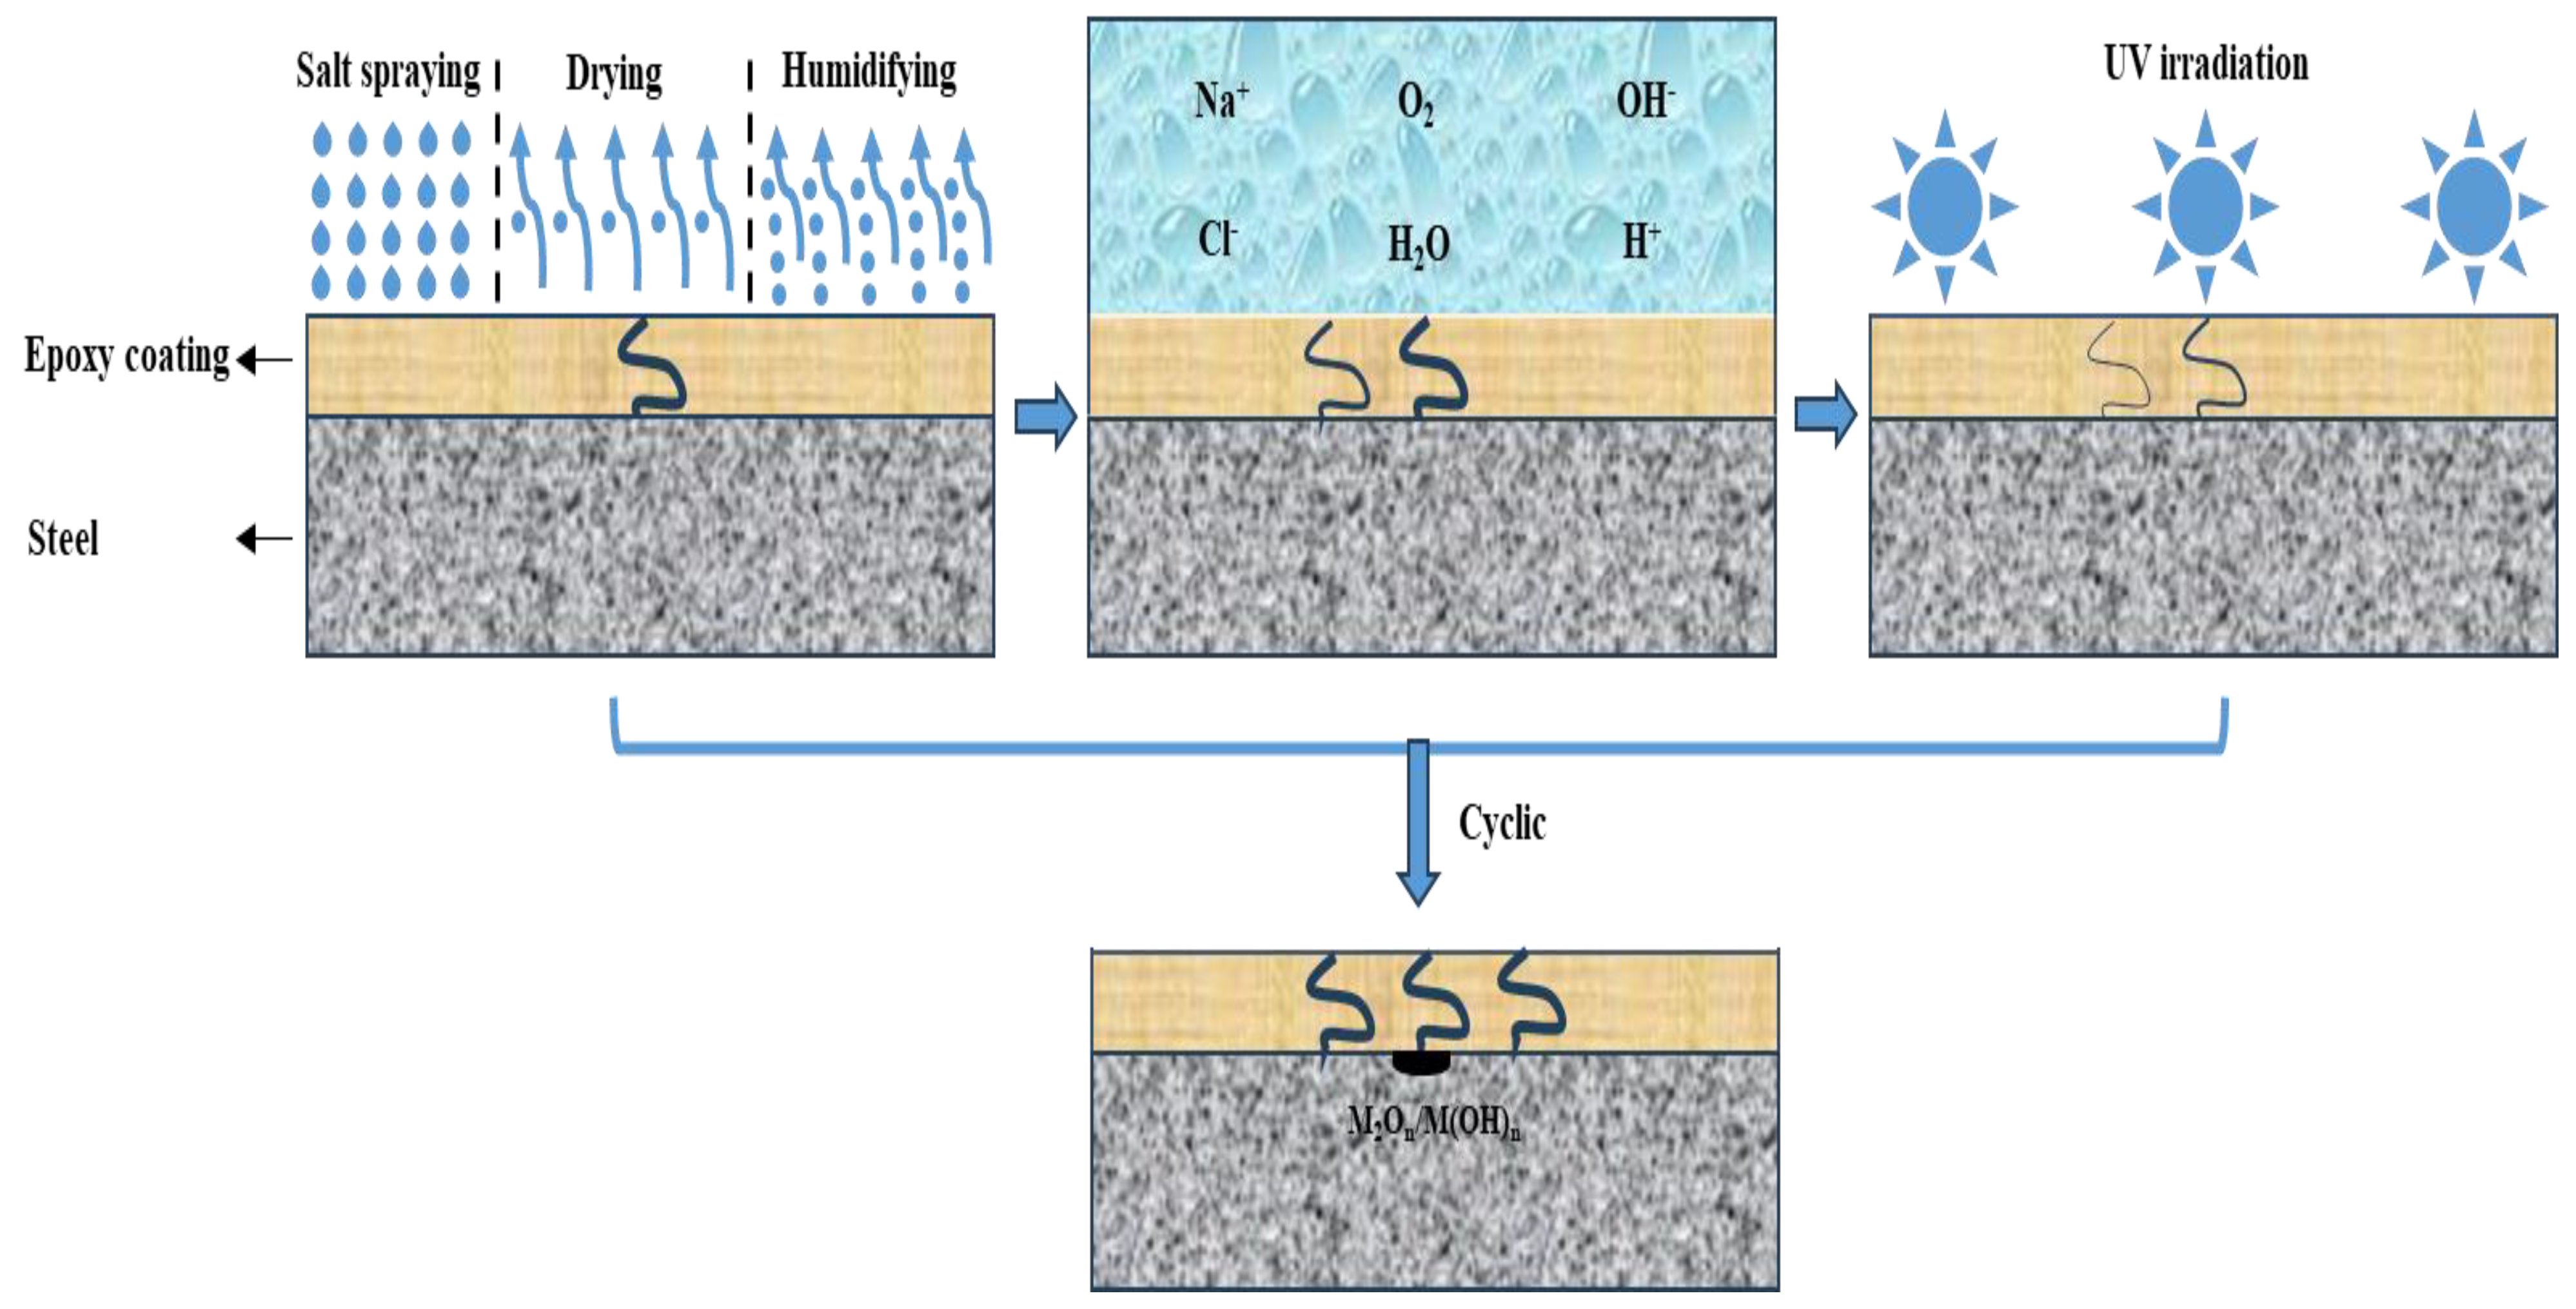
- An alternating salt spray (containing wet, dry and humid), immersion and UV irradiation procedure was applied to simulate the ocean splash environment, called ESalt+Immersion+UV. This test contained three parts. (a) The samples were stuck in a salt spray container under a wet condition (5 ± 0.5 wt.% NaCl solution, 35 ± 2 °C, pH: 6.5~7.2, continuous spray) for 2 h. Then, the samples were transferred into a steady temperature and humidity chamber under dry conditions of 60 ± 2 °C and 25 ± 5% humidity for 4 h, and then under wet conditions of 50 ± 2 °C and >95% humidity for 2 h. (b) Then, the samples were immersed in the 3.5 wt% NaCl solution with an OCP step for 4 h. (c) Then, the samples were taken out and exposed to the ultraviolet irradiator under an irradiance of 0.89 W/m2/nm in the container for 12 h. The entire time of one cycle under this test was 24 h.
- (3)
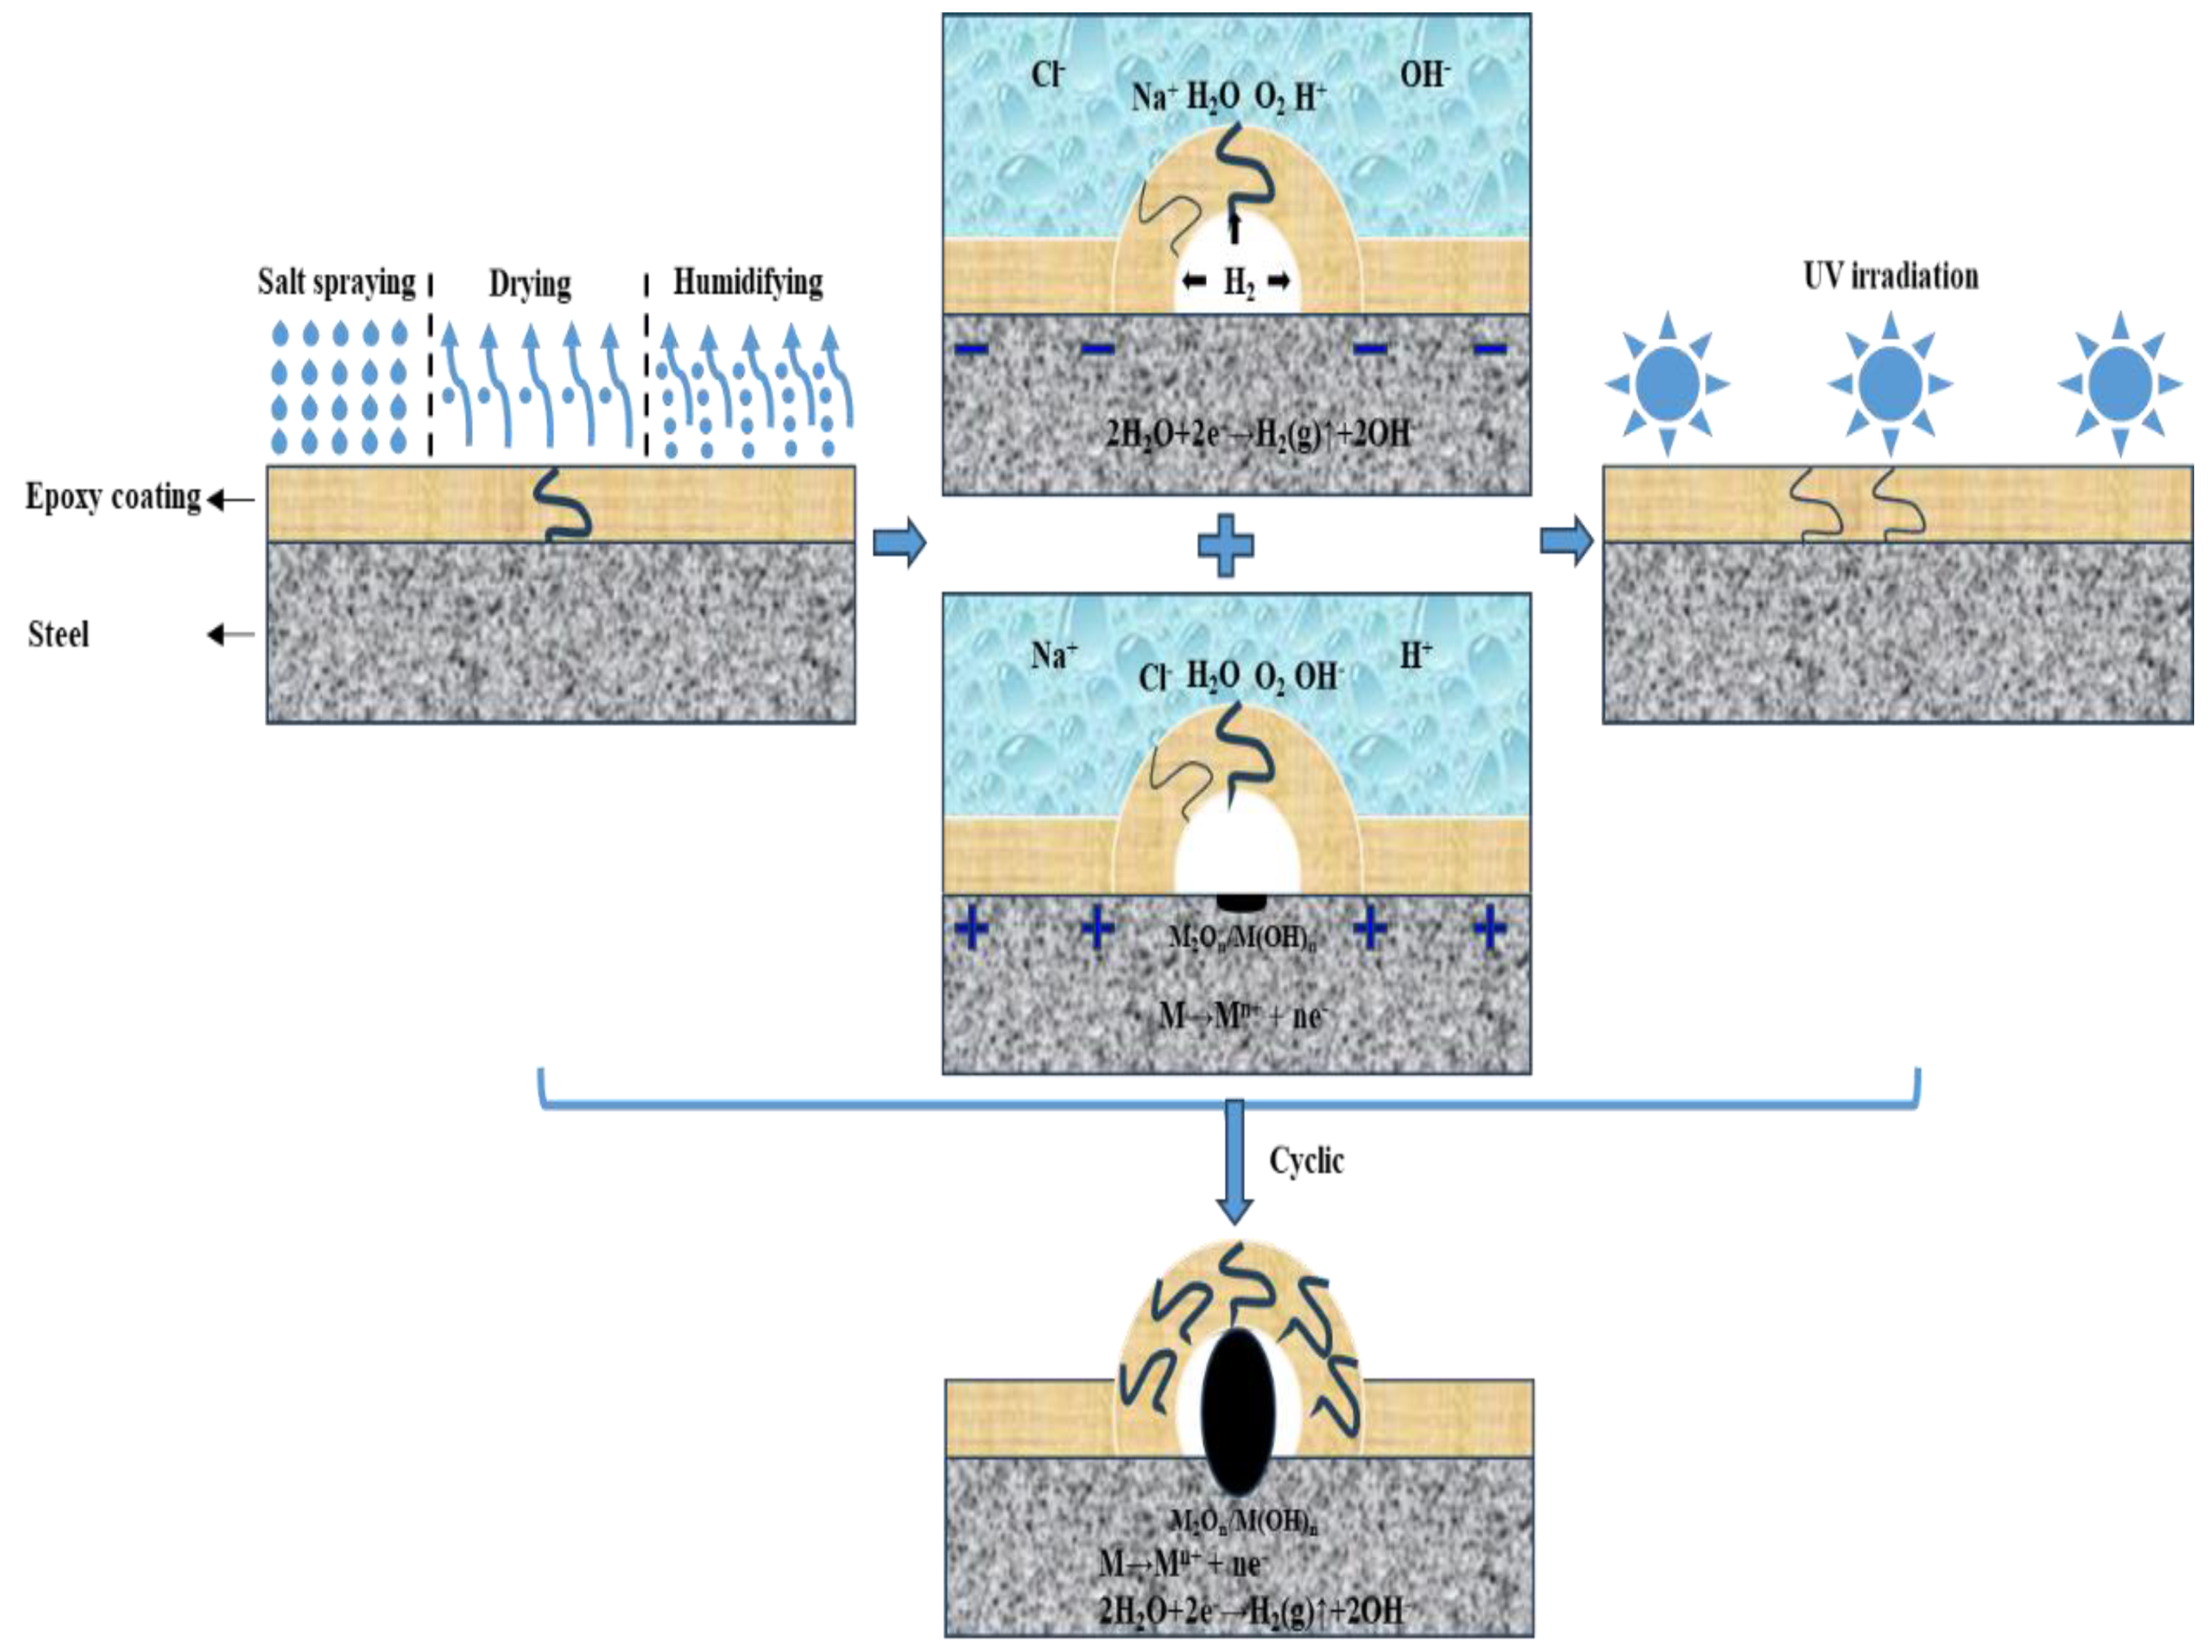
- Combination of the EPolarization+Immersion test and the ESalt+Immersion+UV test, called ESalt+Polarization+Immersion+UV. This new test contained three parts. (a) The step was the same as in the (a) of the (2) in the ESalt+Immersion+UV test, so the time was 8 h. (b) Then, the step was the same as in the (1) of the EPolarization+Immersion test, so the time was 4 h. (c) Then, the step was the same as in the (c) of the (2) in the ESalt+Immersion+UV test, so the time was 12 h. The entire time of one cycle in this test was also 24 h.
2.4. Coating Characterization
3. Results
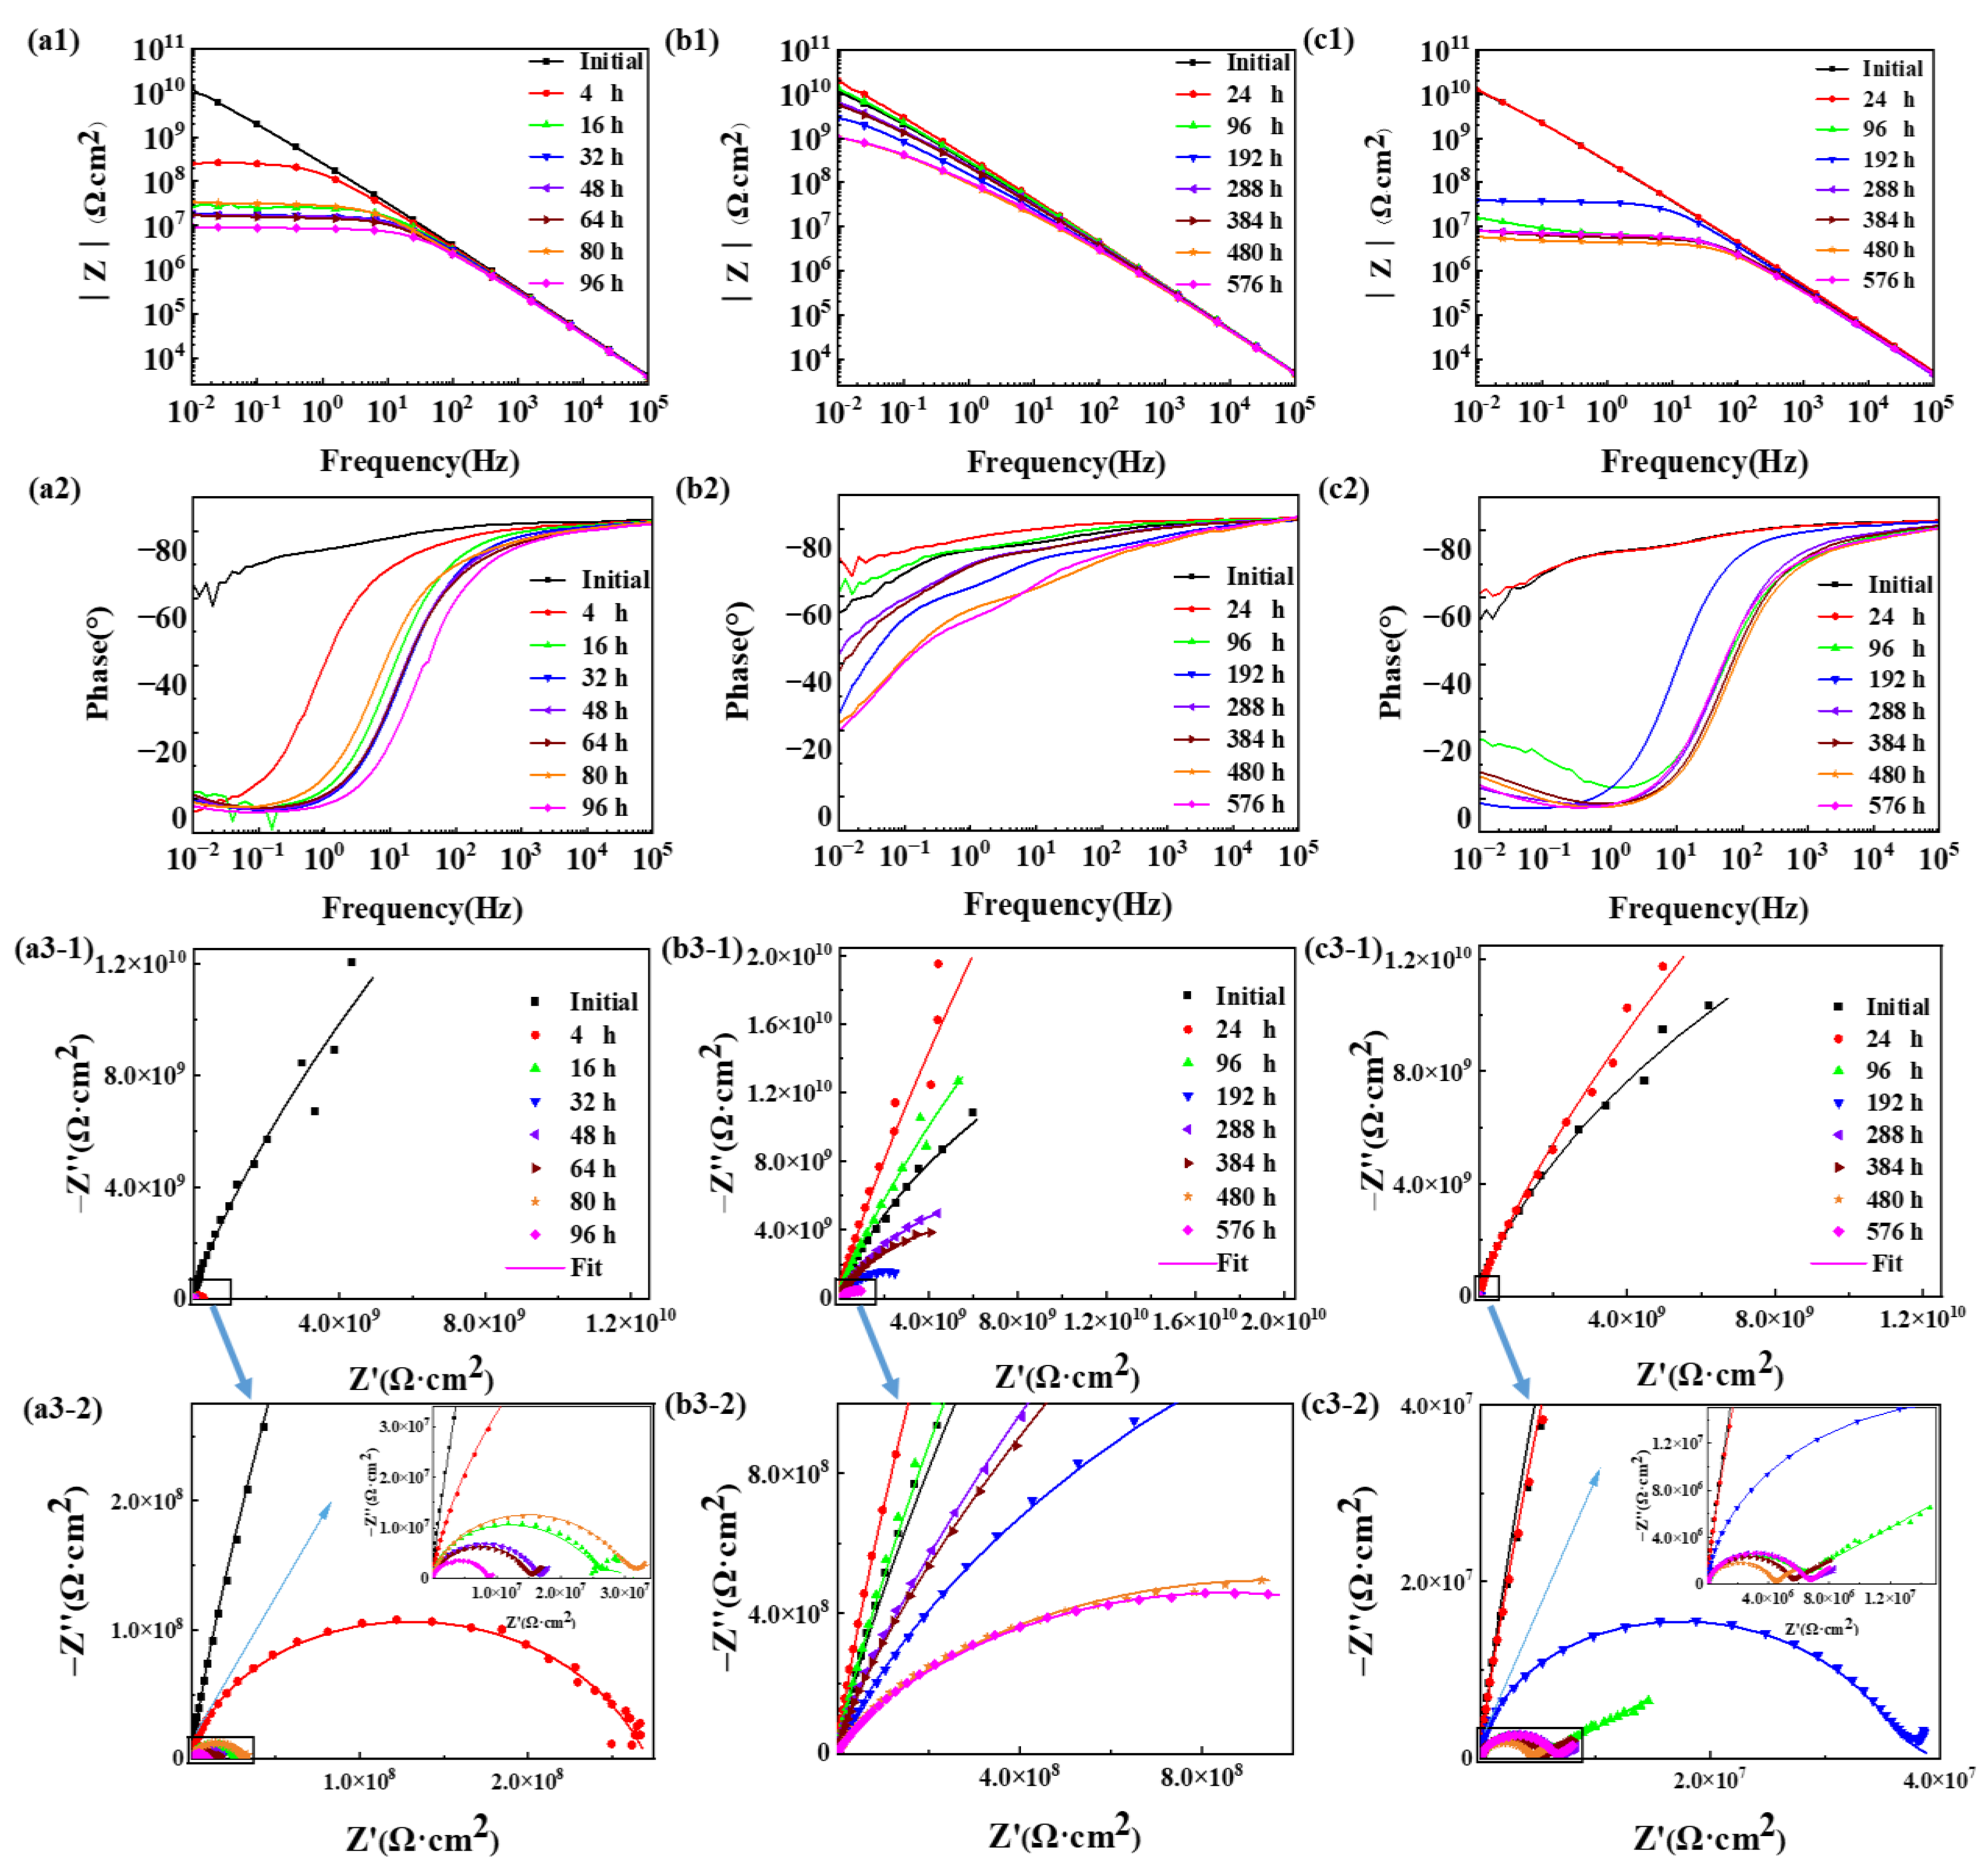
3.1. EIS Results
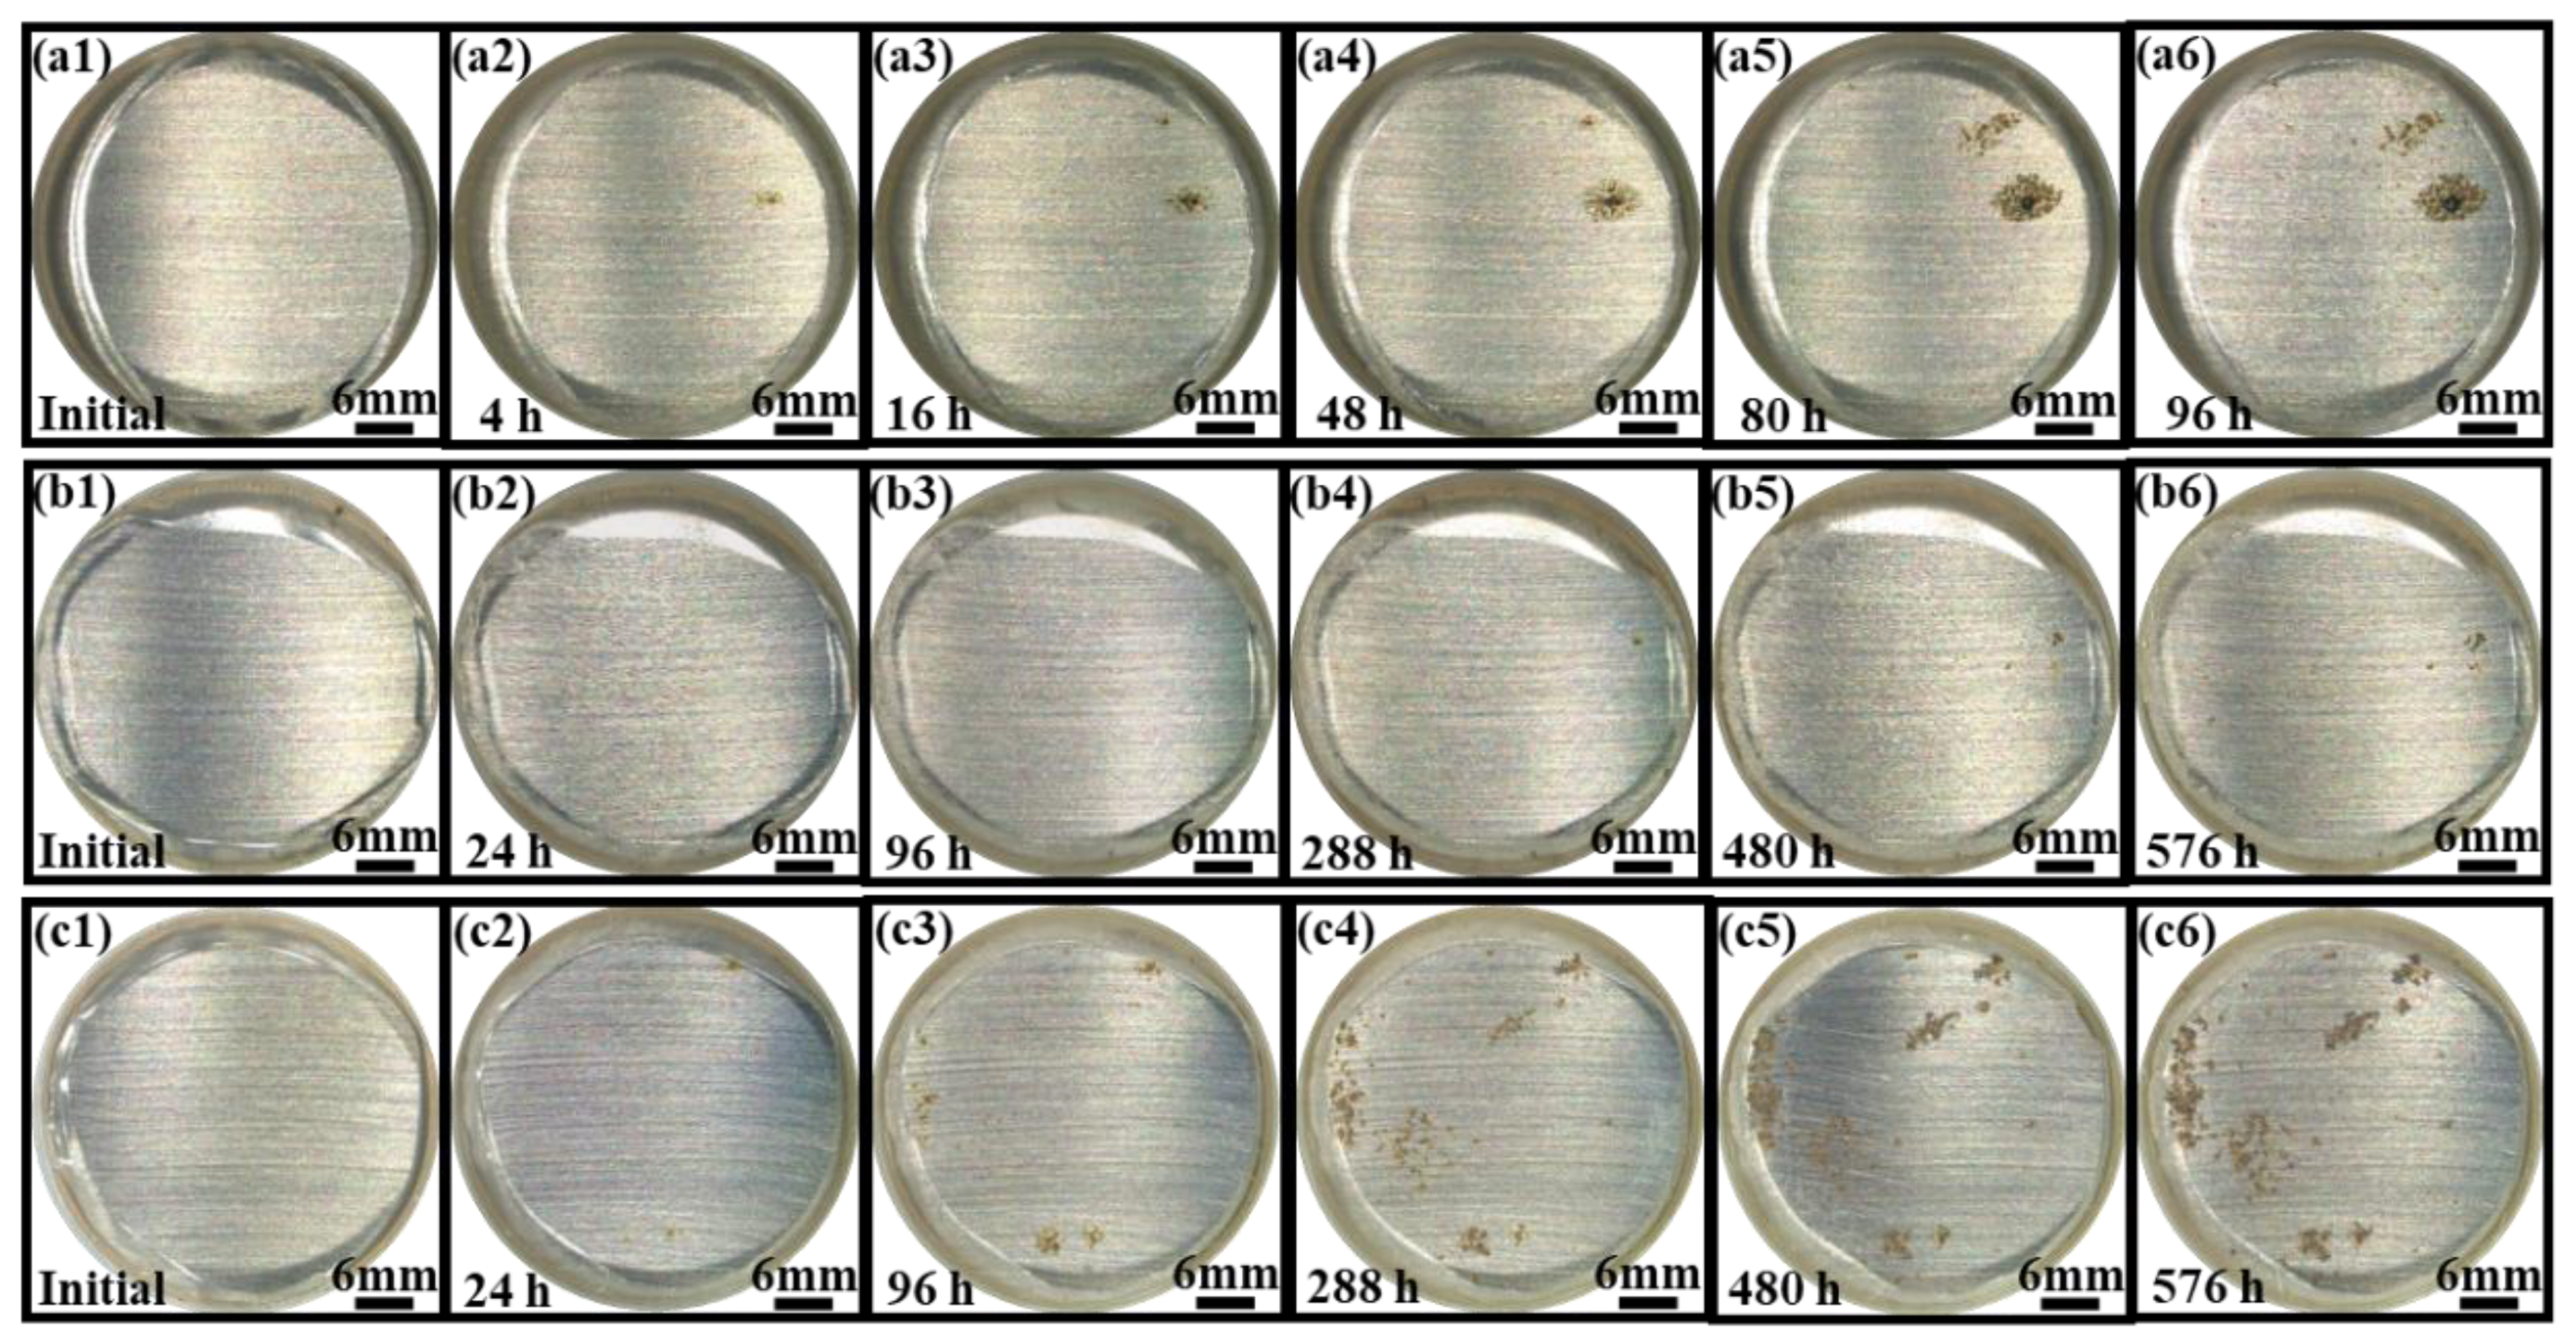
3.2. Surface Morphology
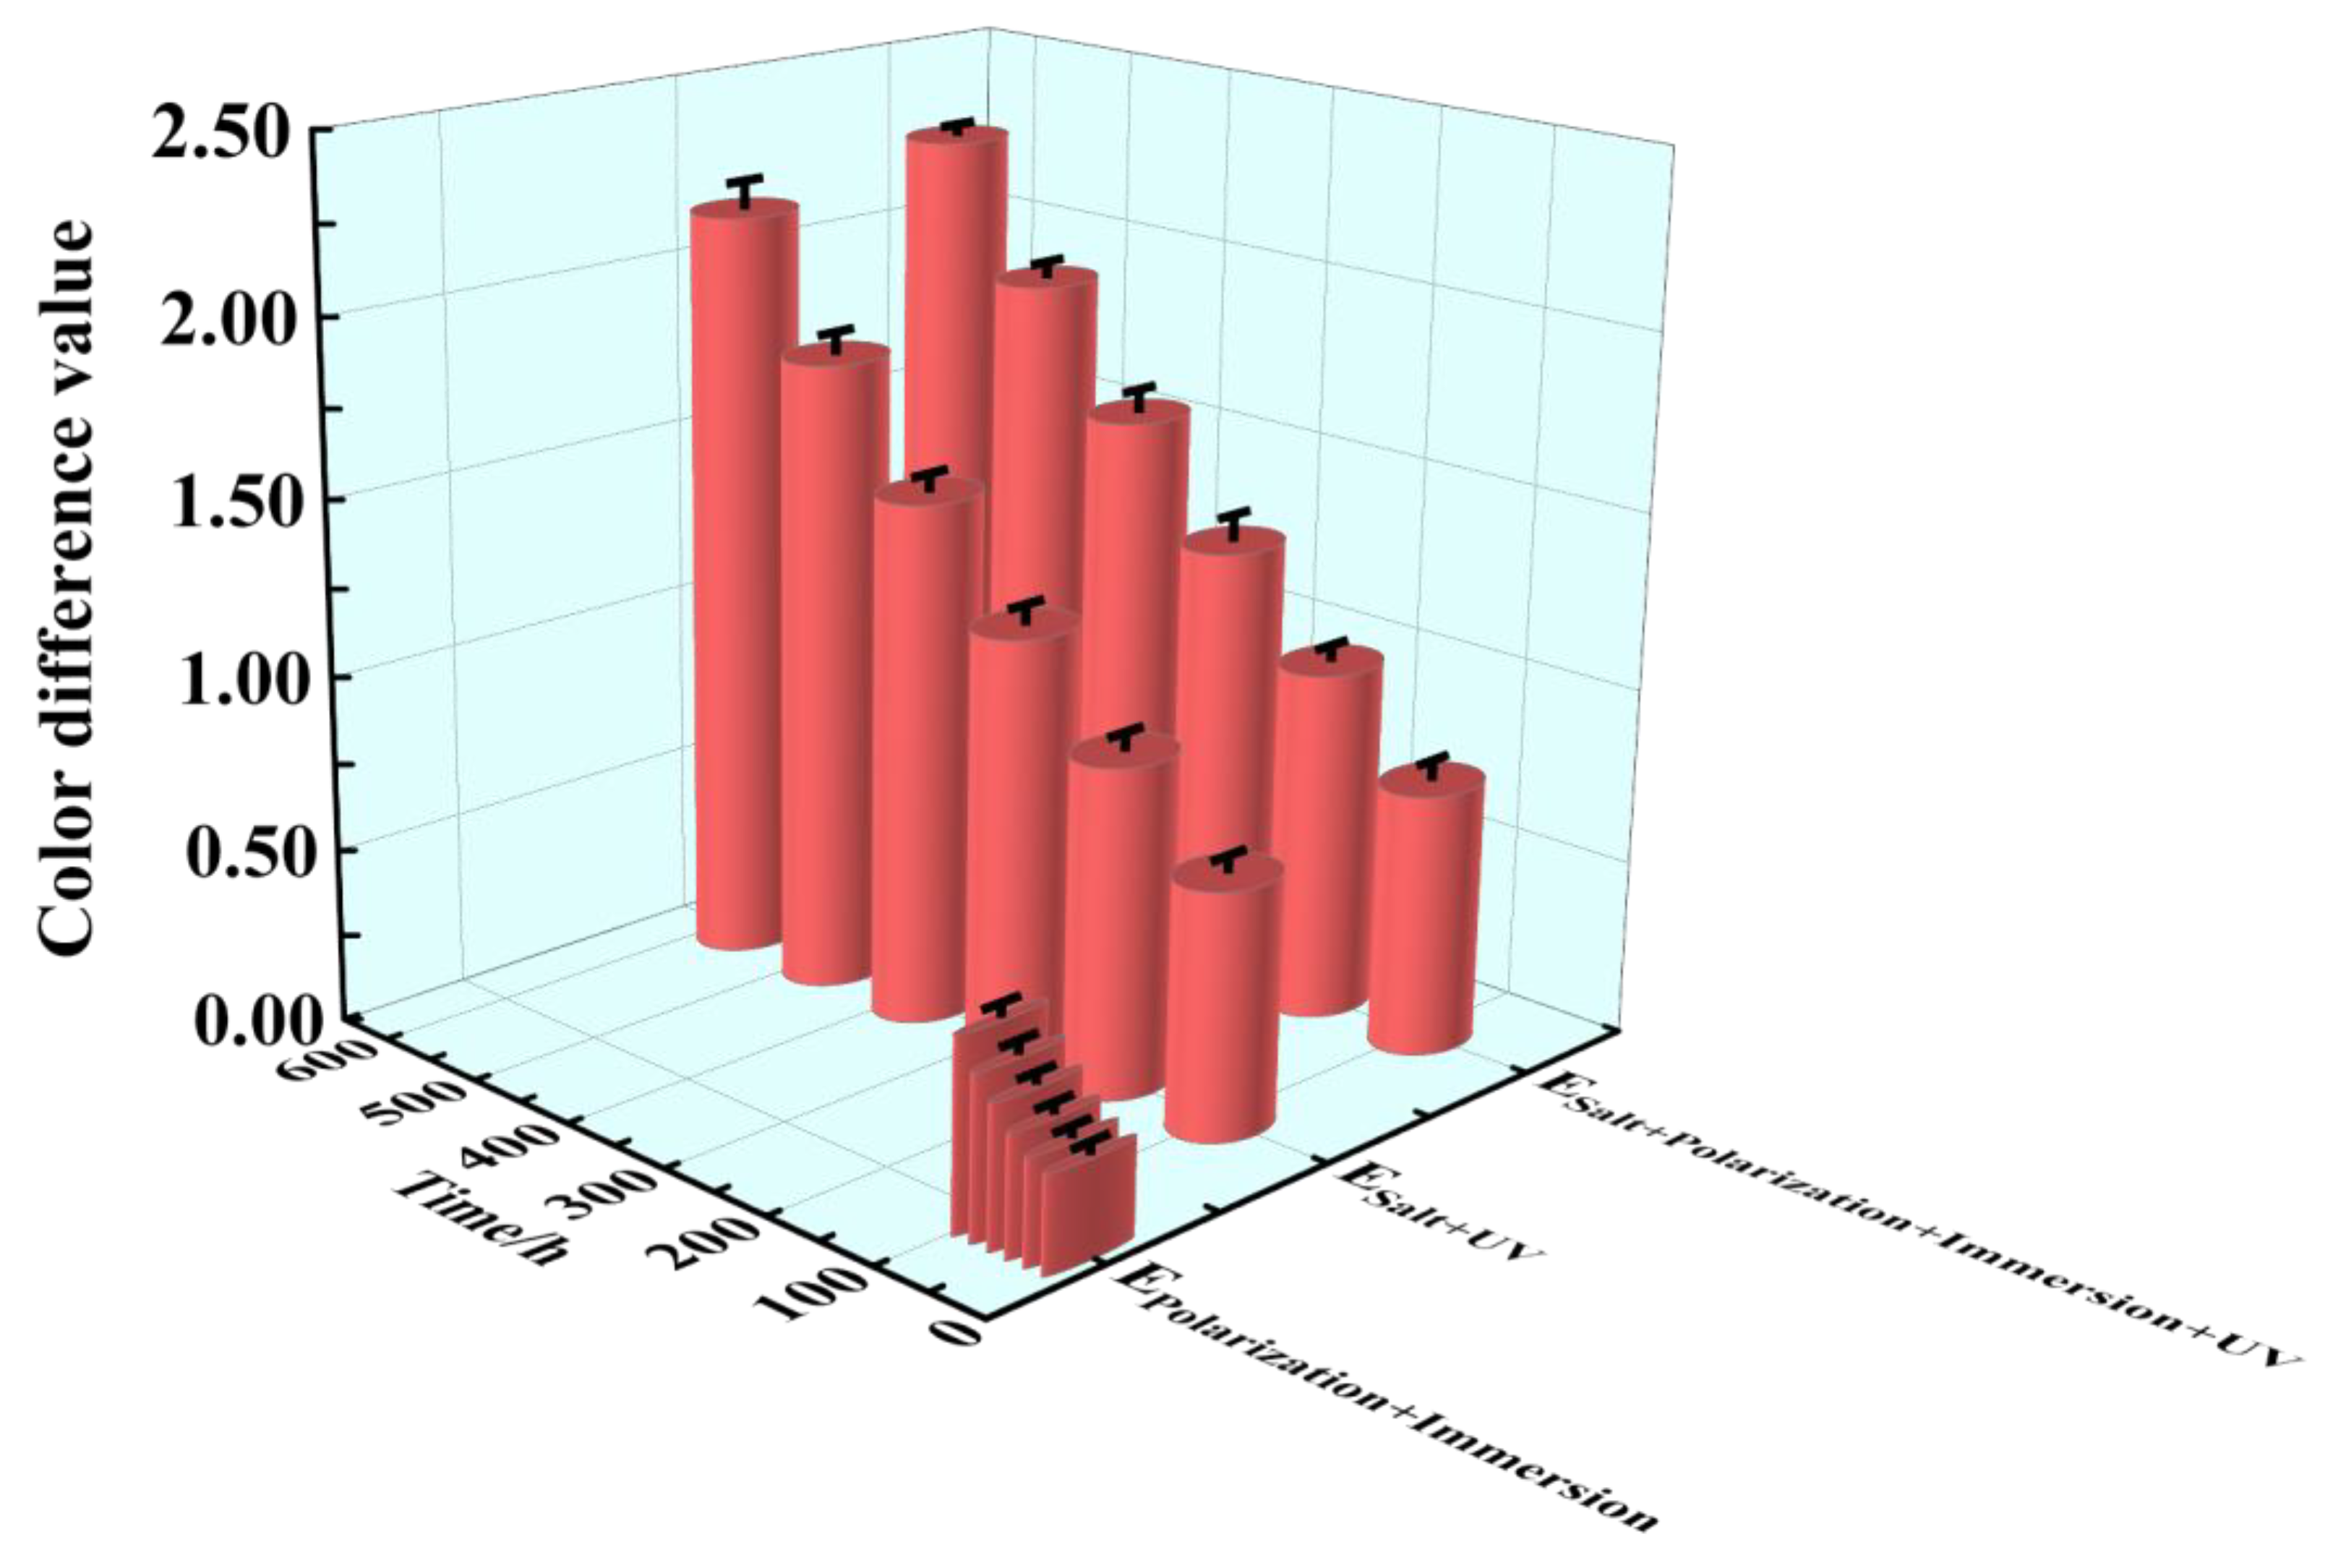
3.3. Color Changes
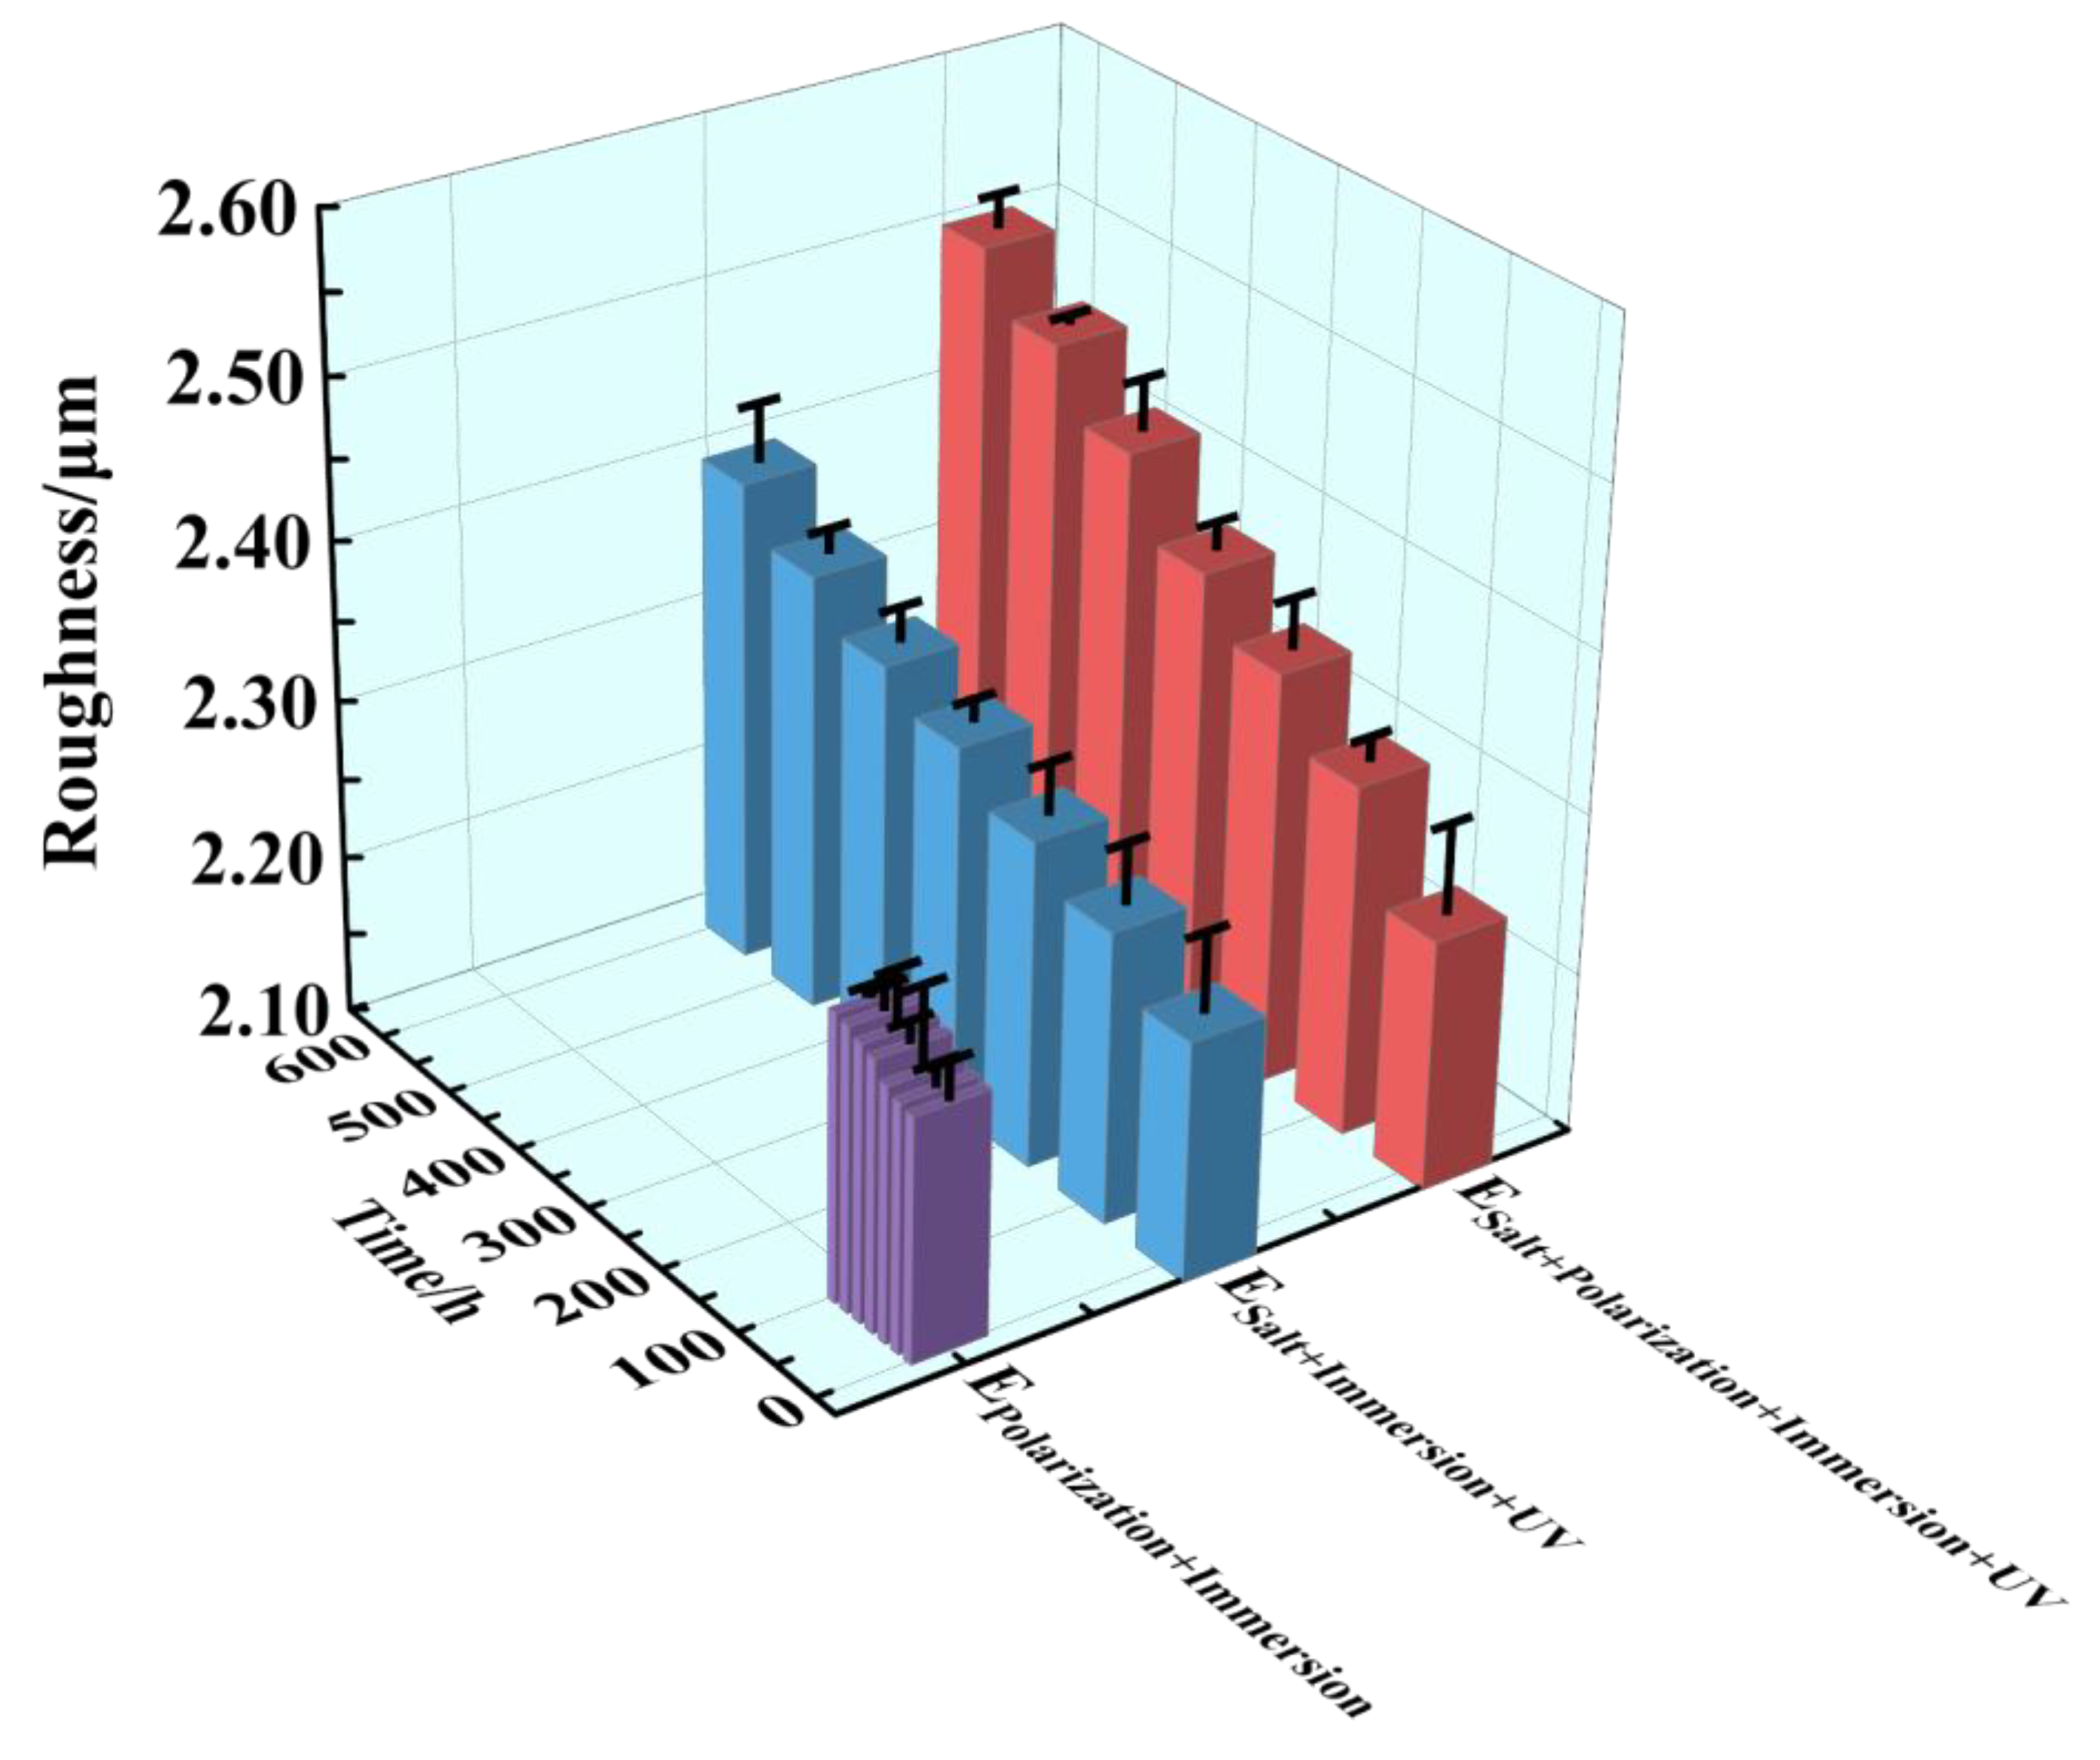
3.4. Surface Roughness
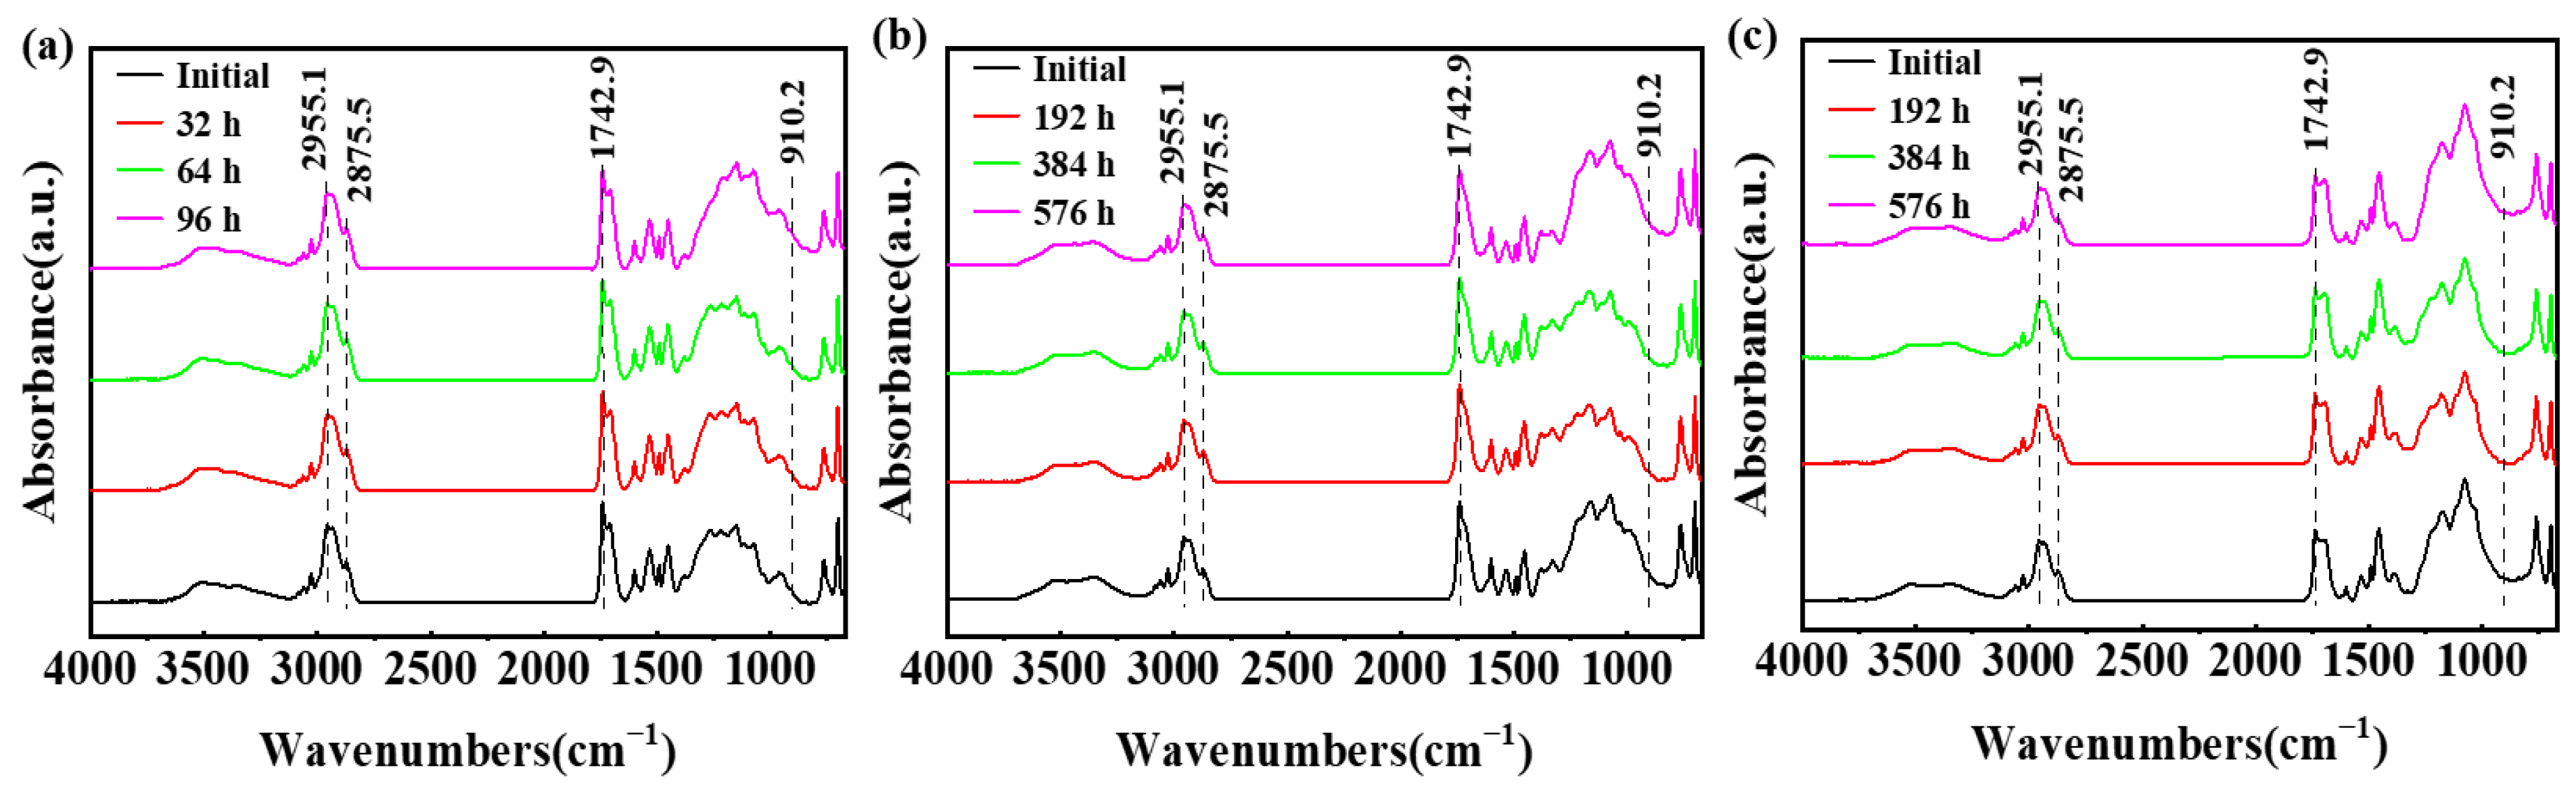
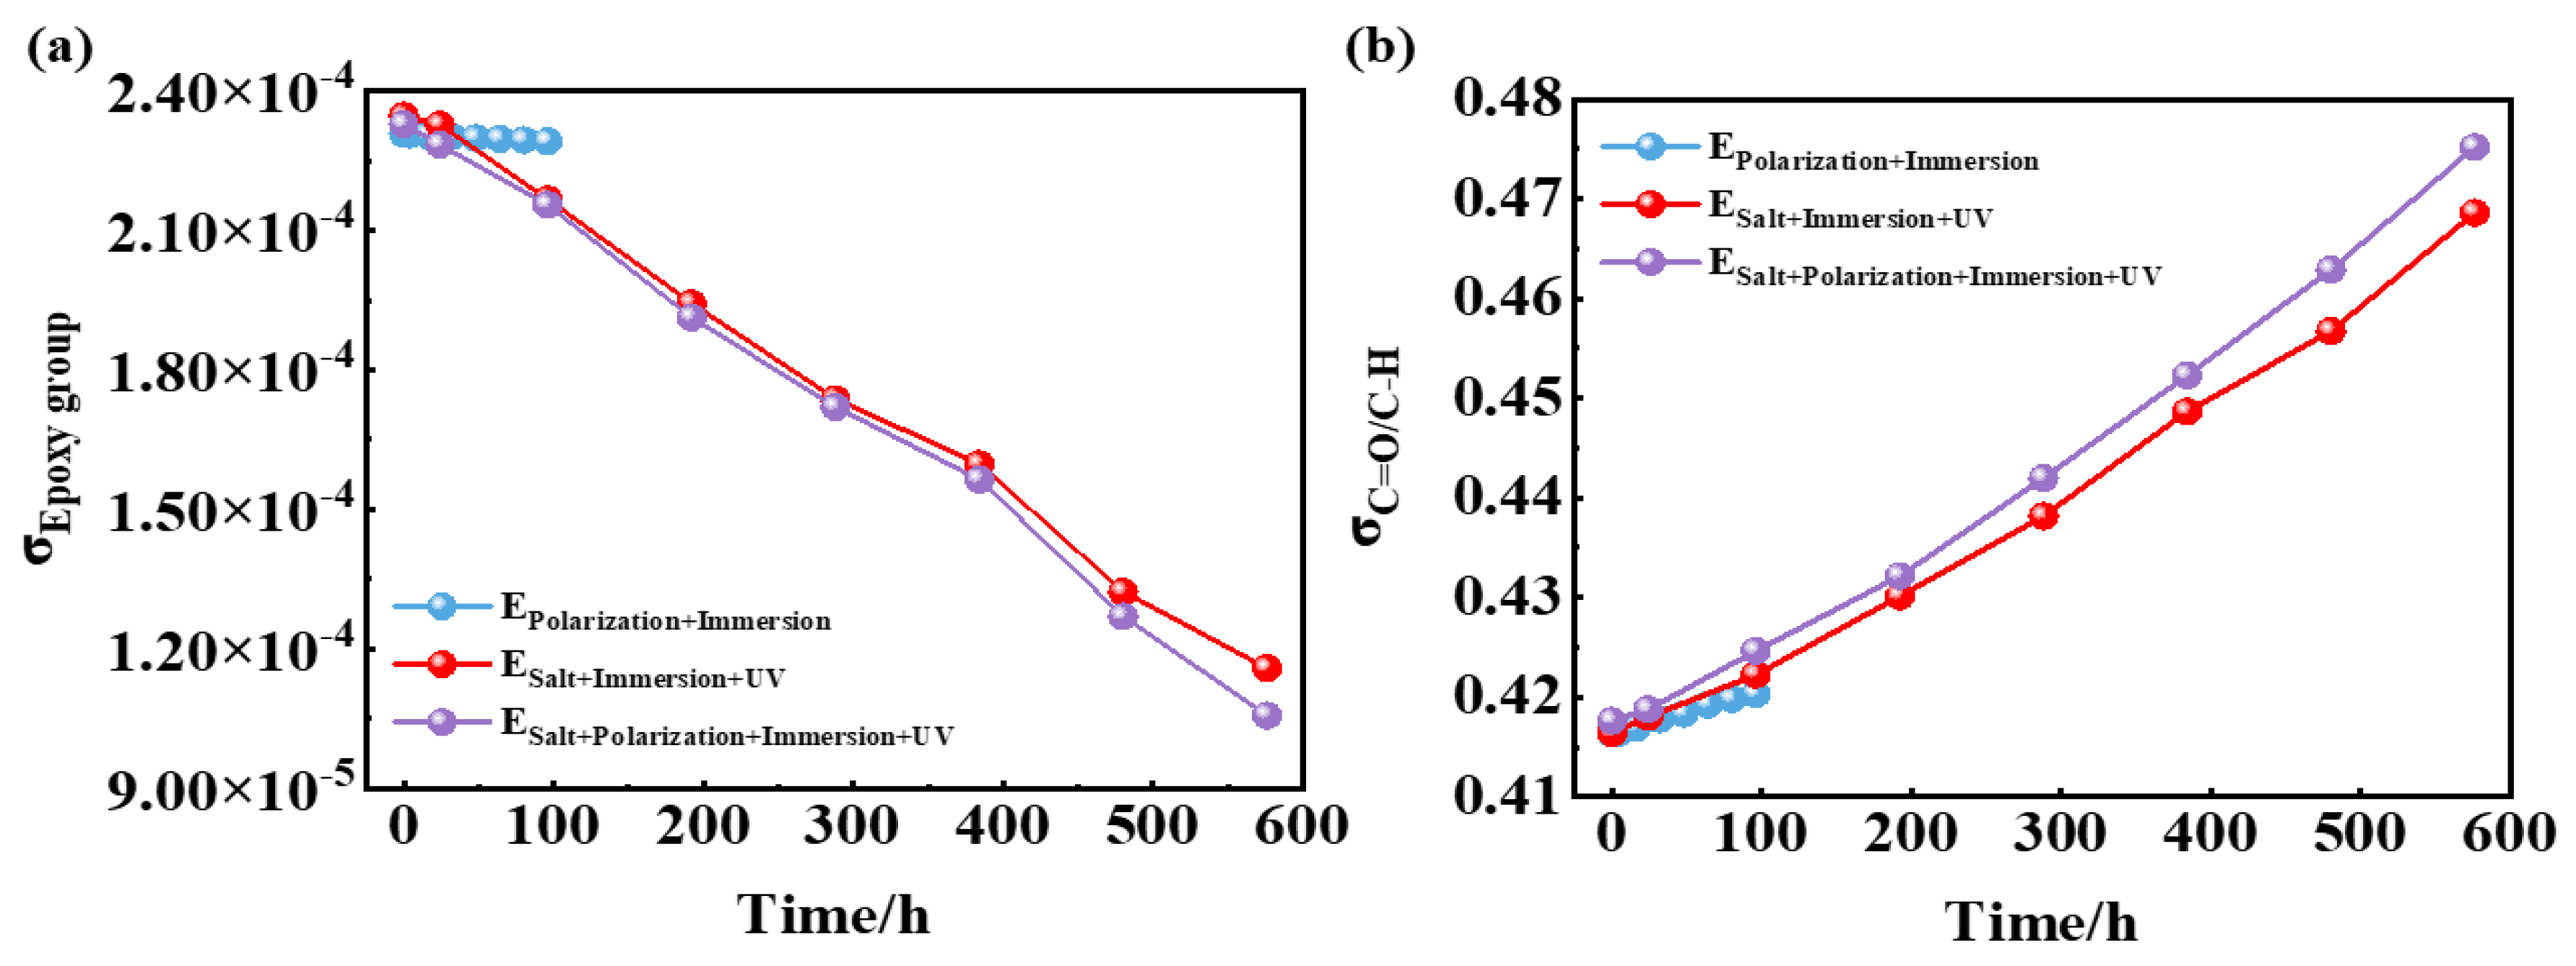
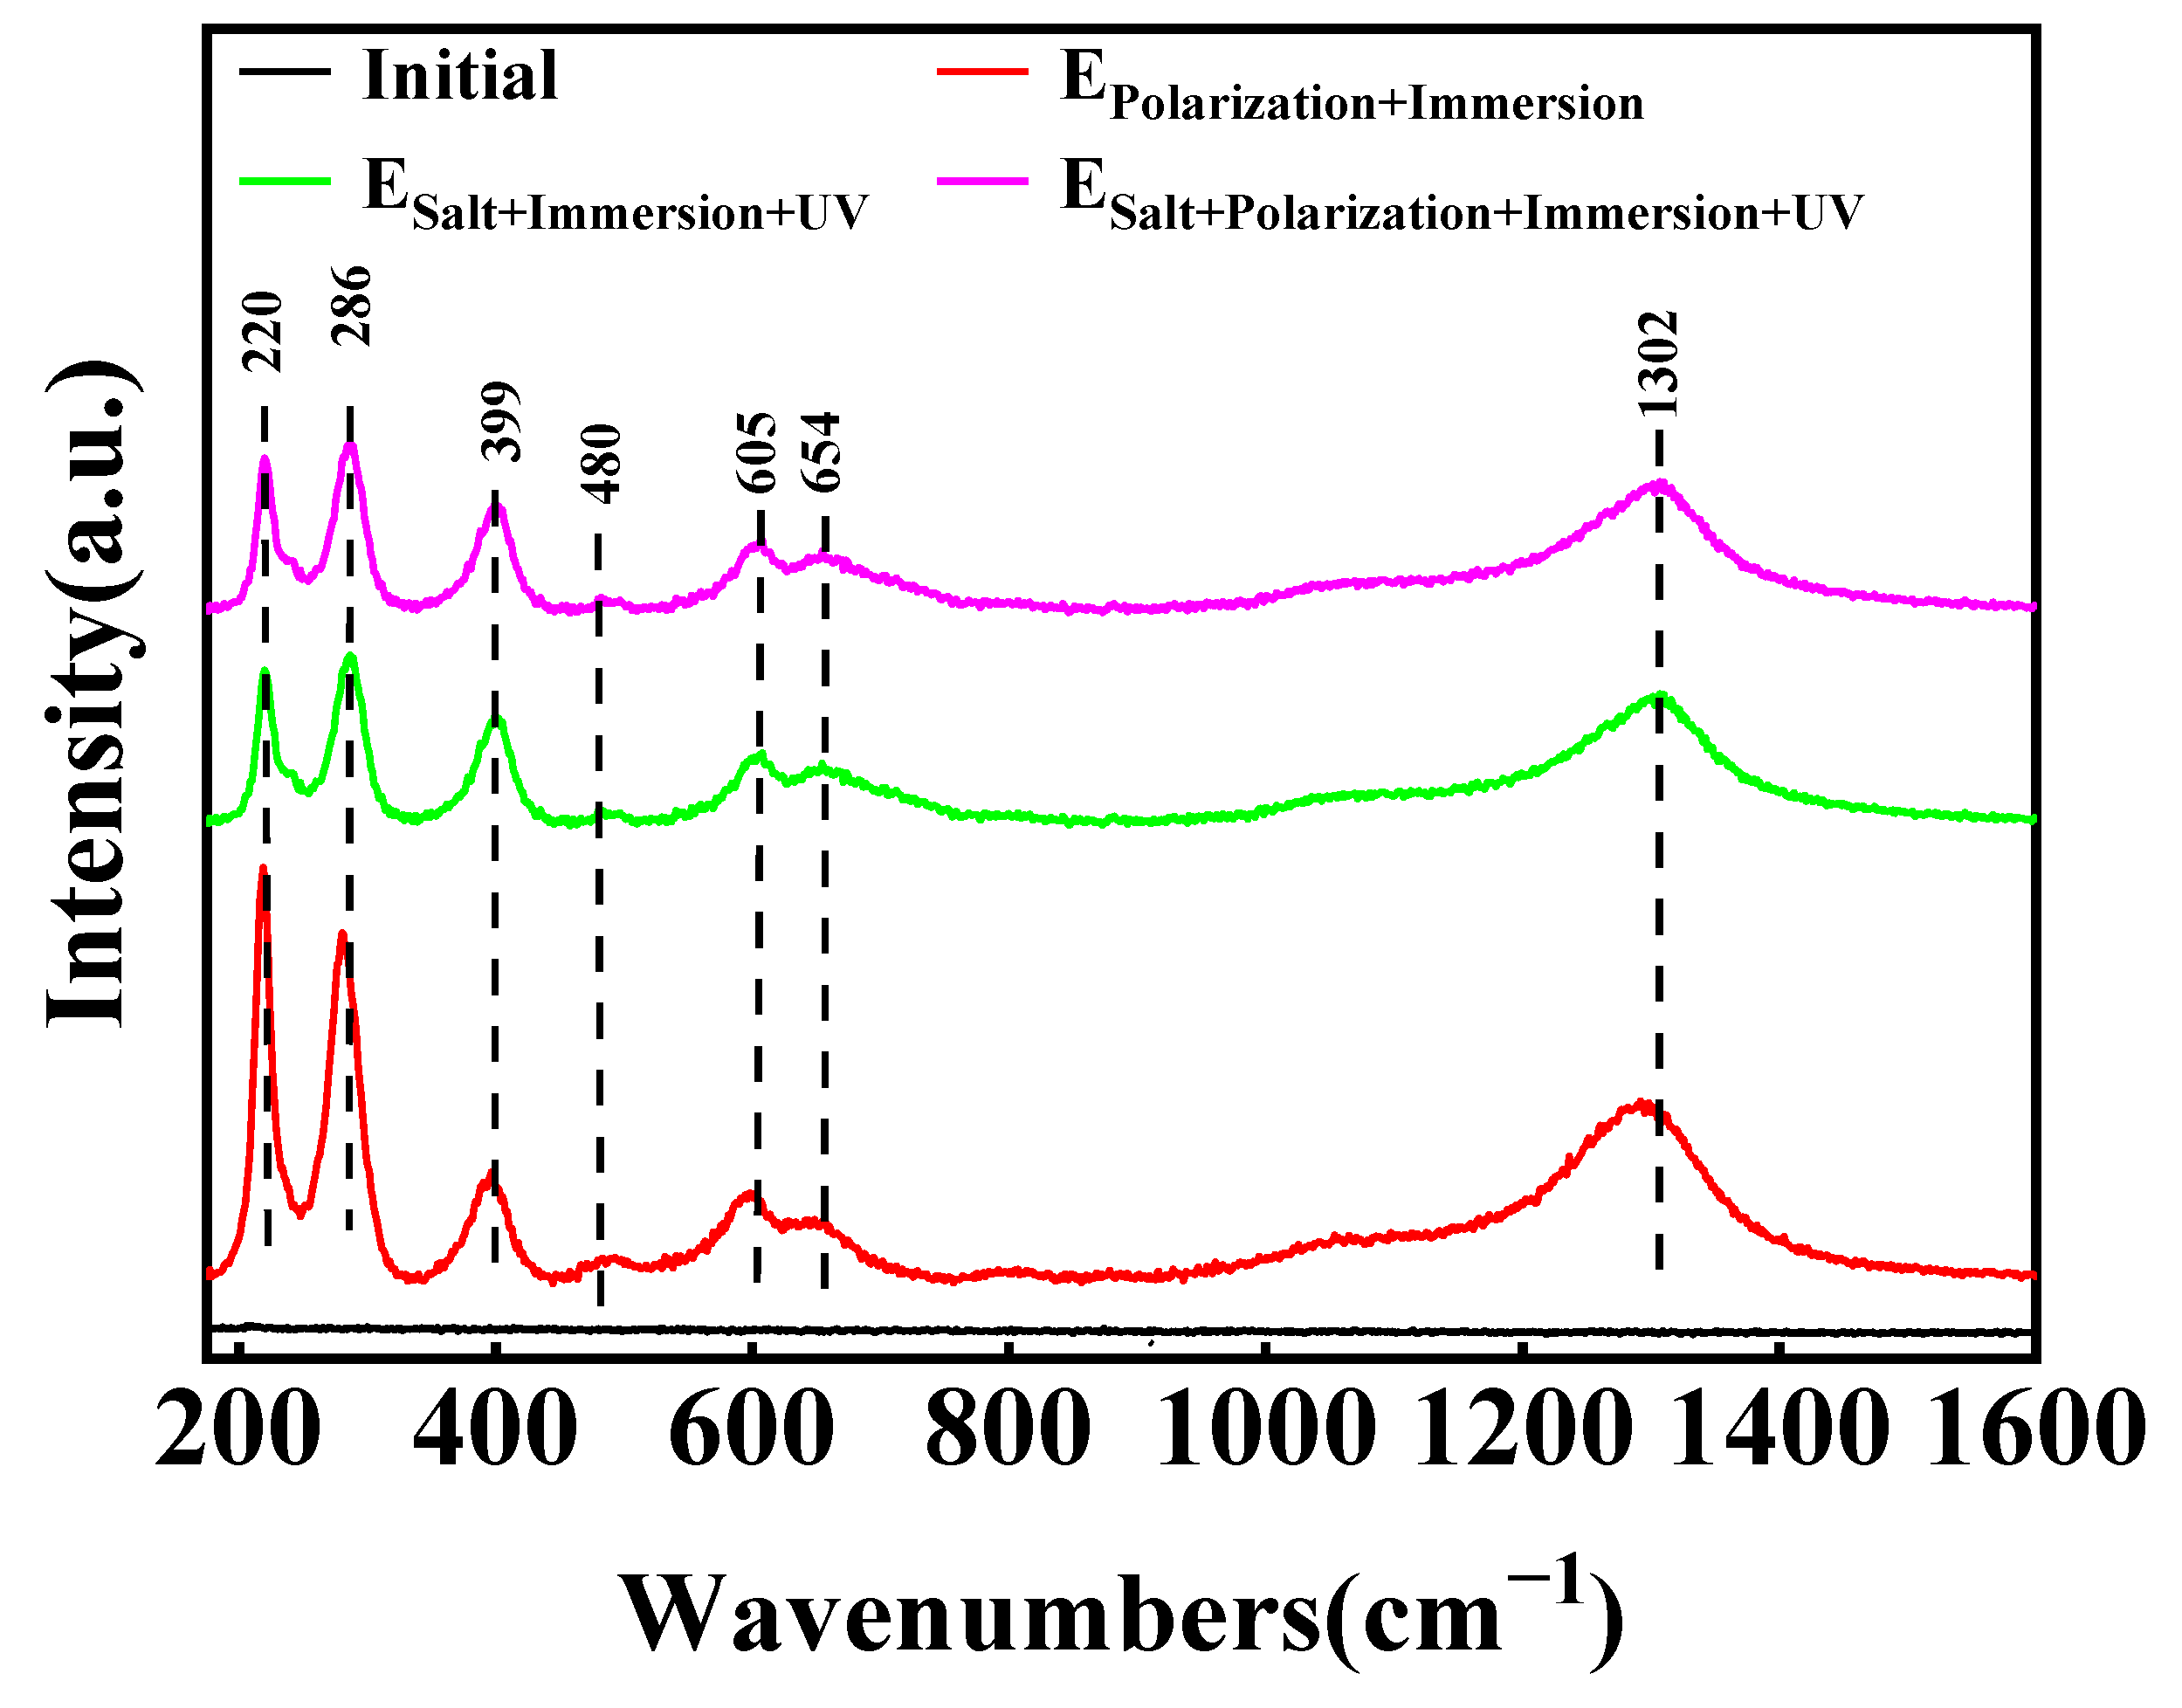
3.5. Chemical Structure
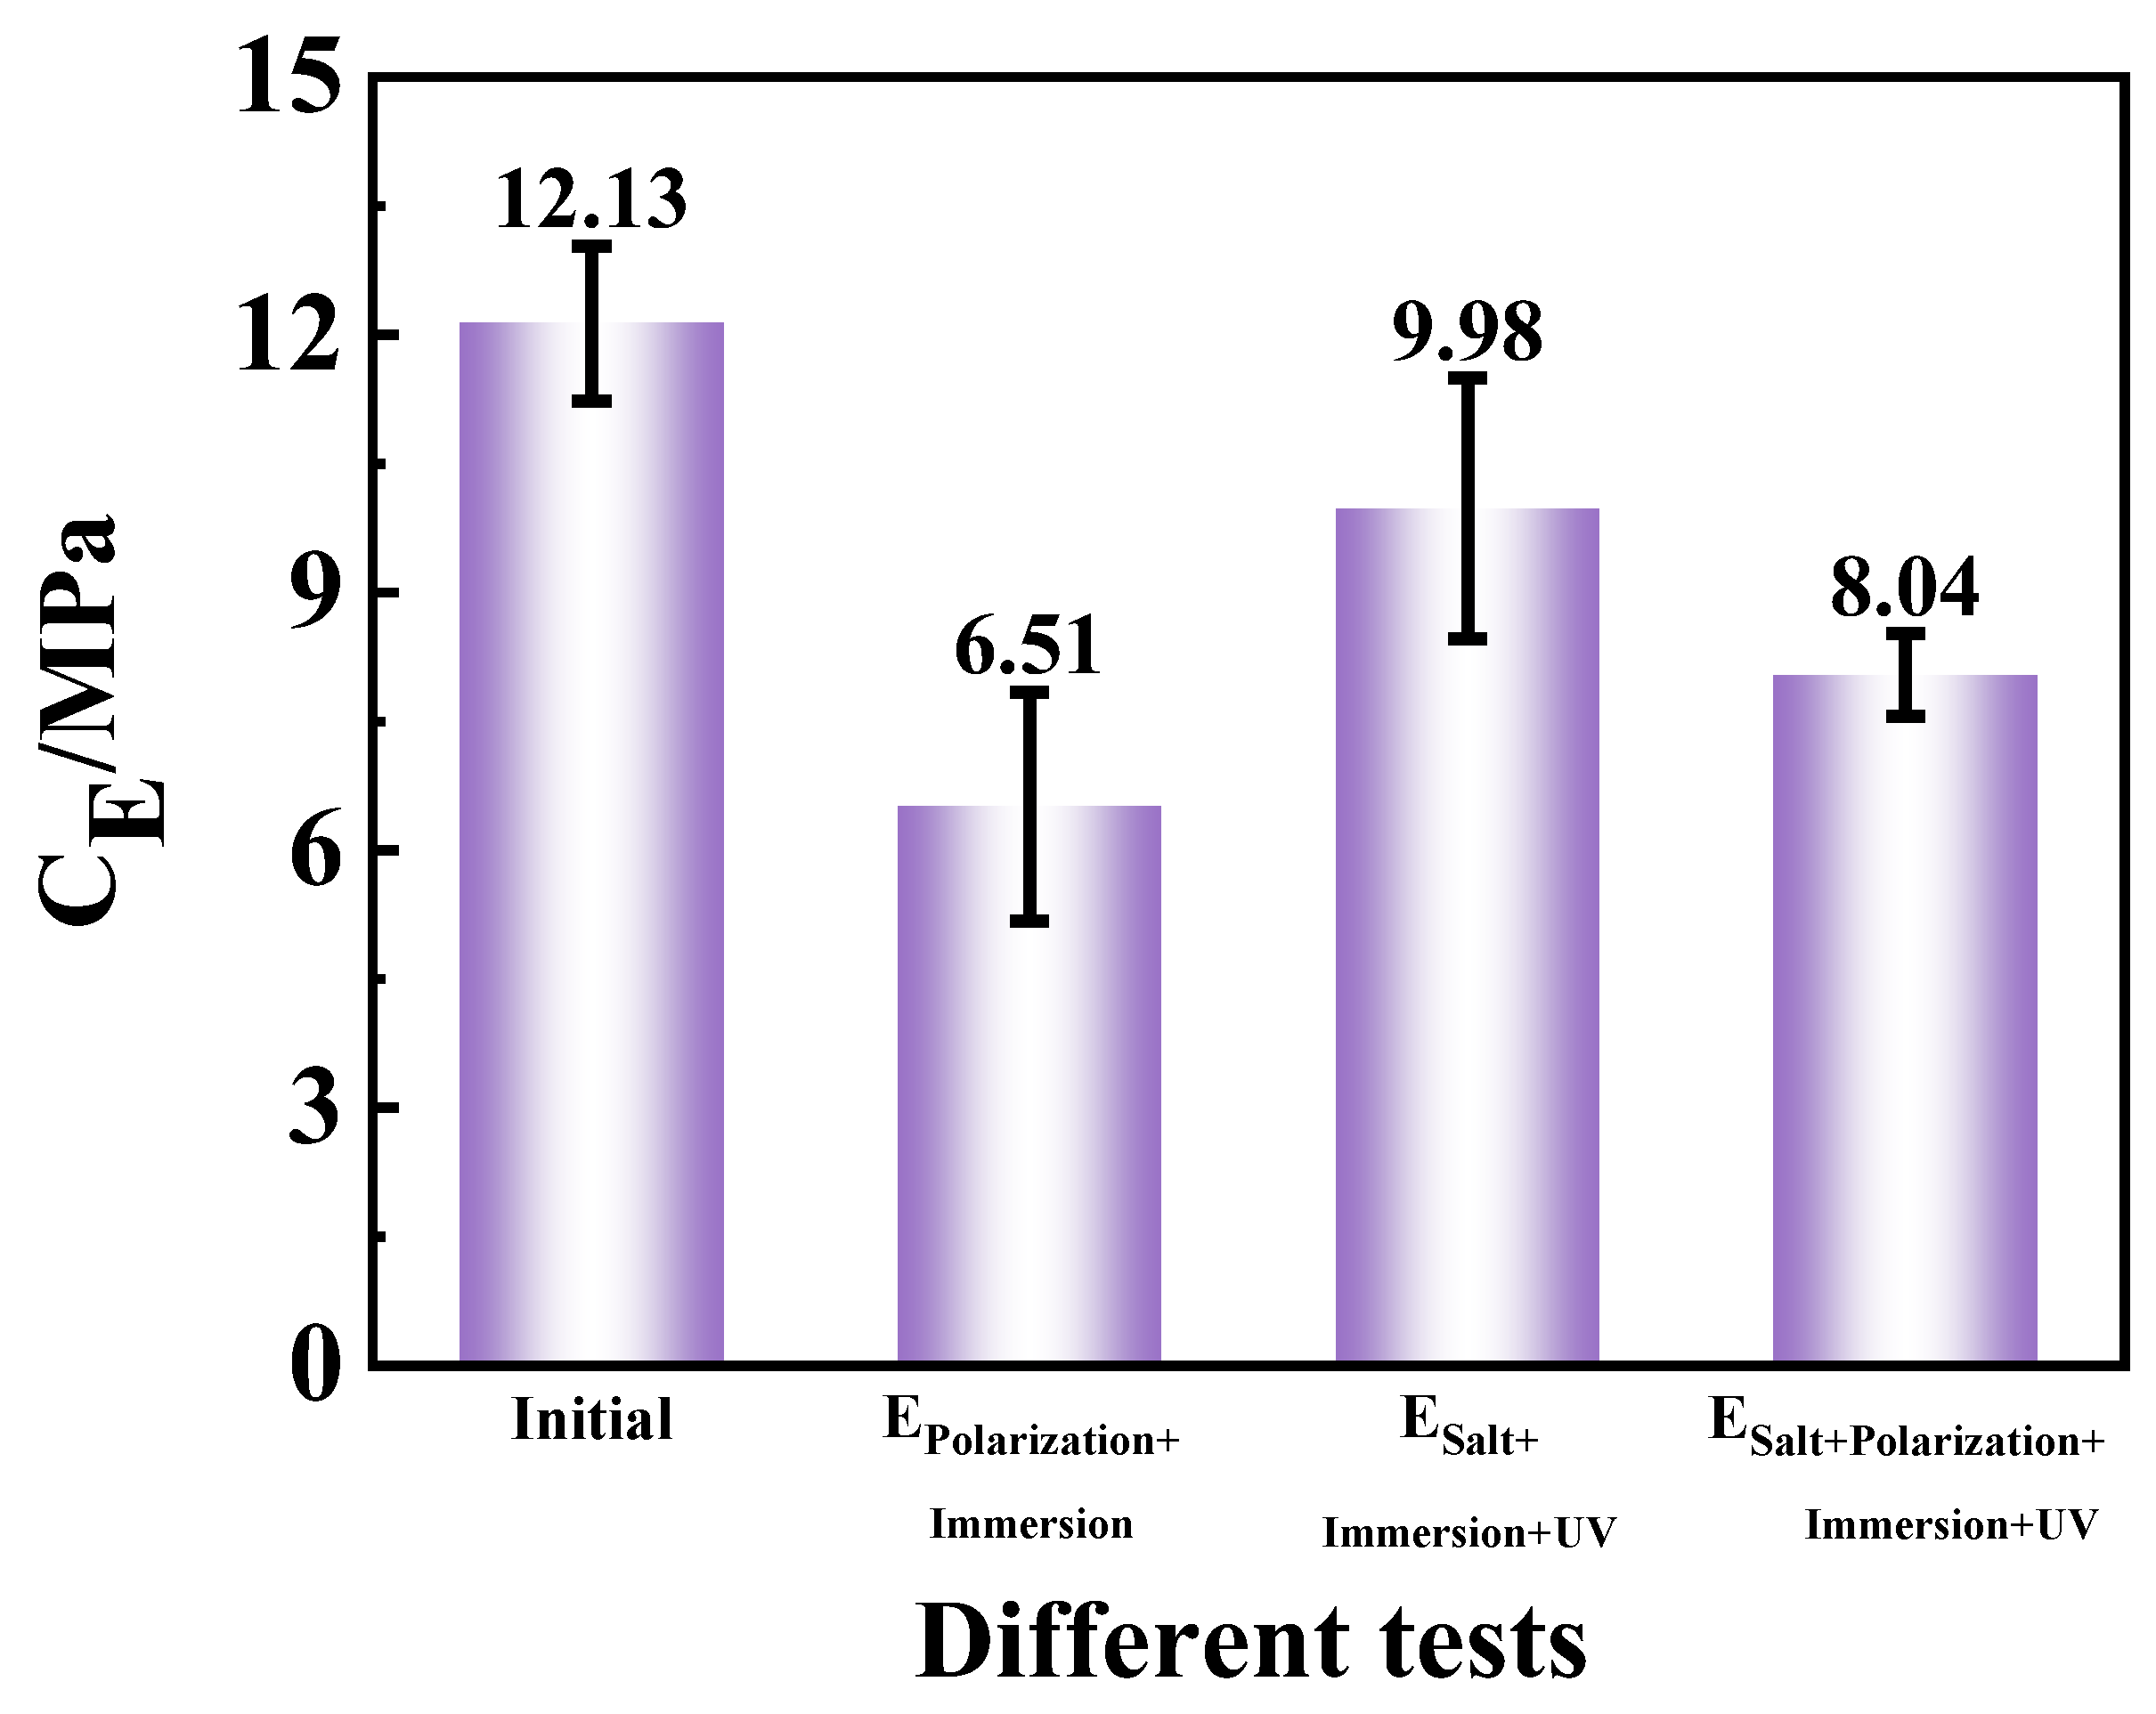
3.6. Adhesion Analysis
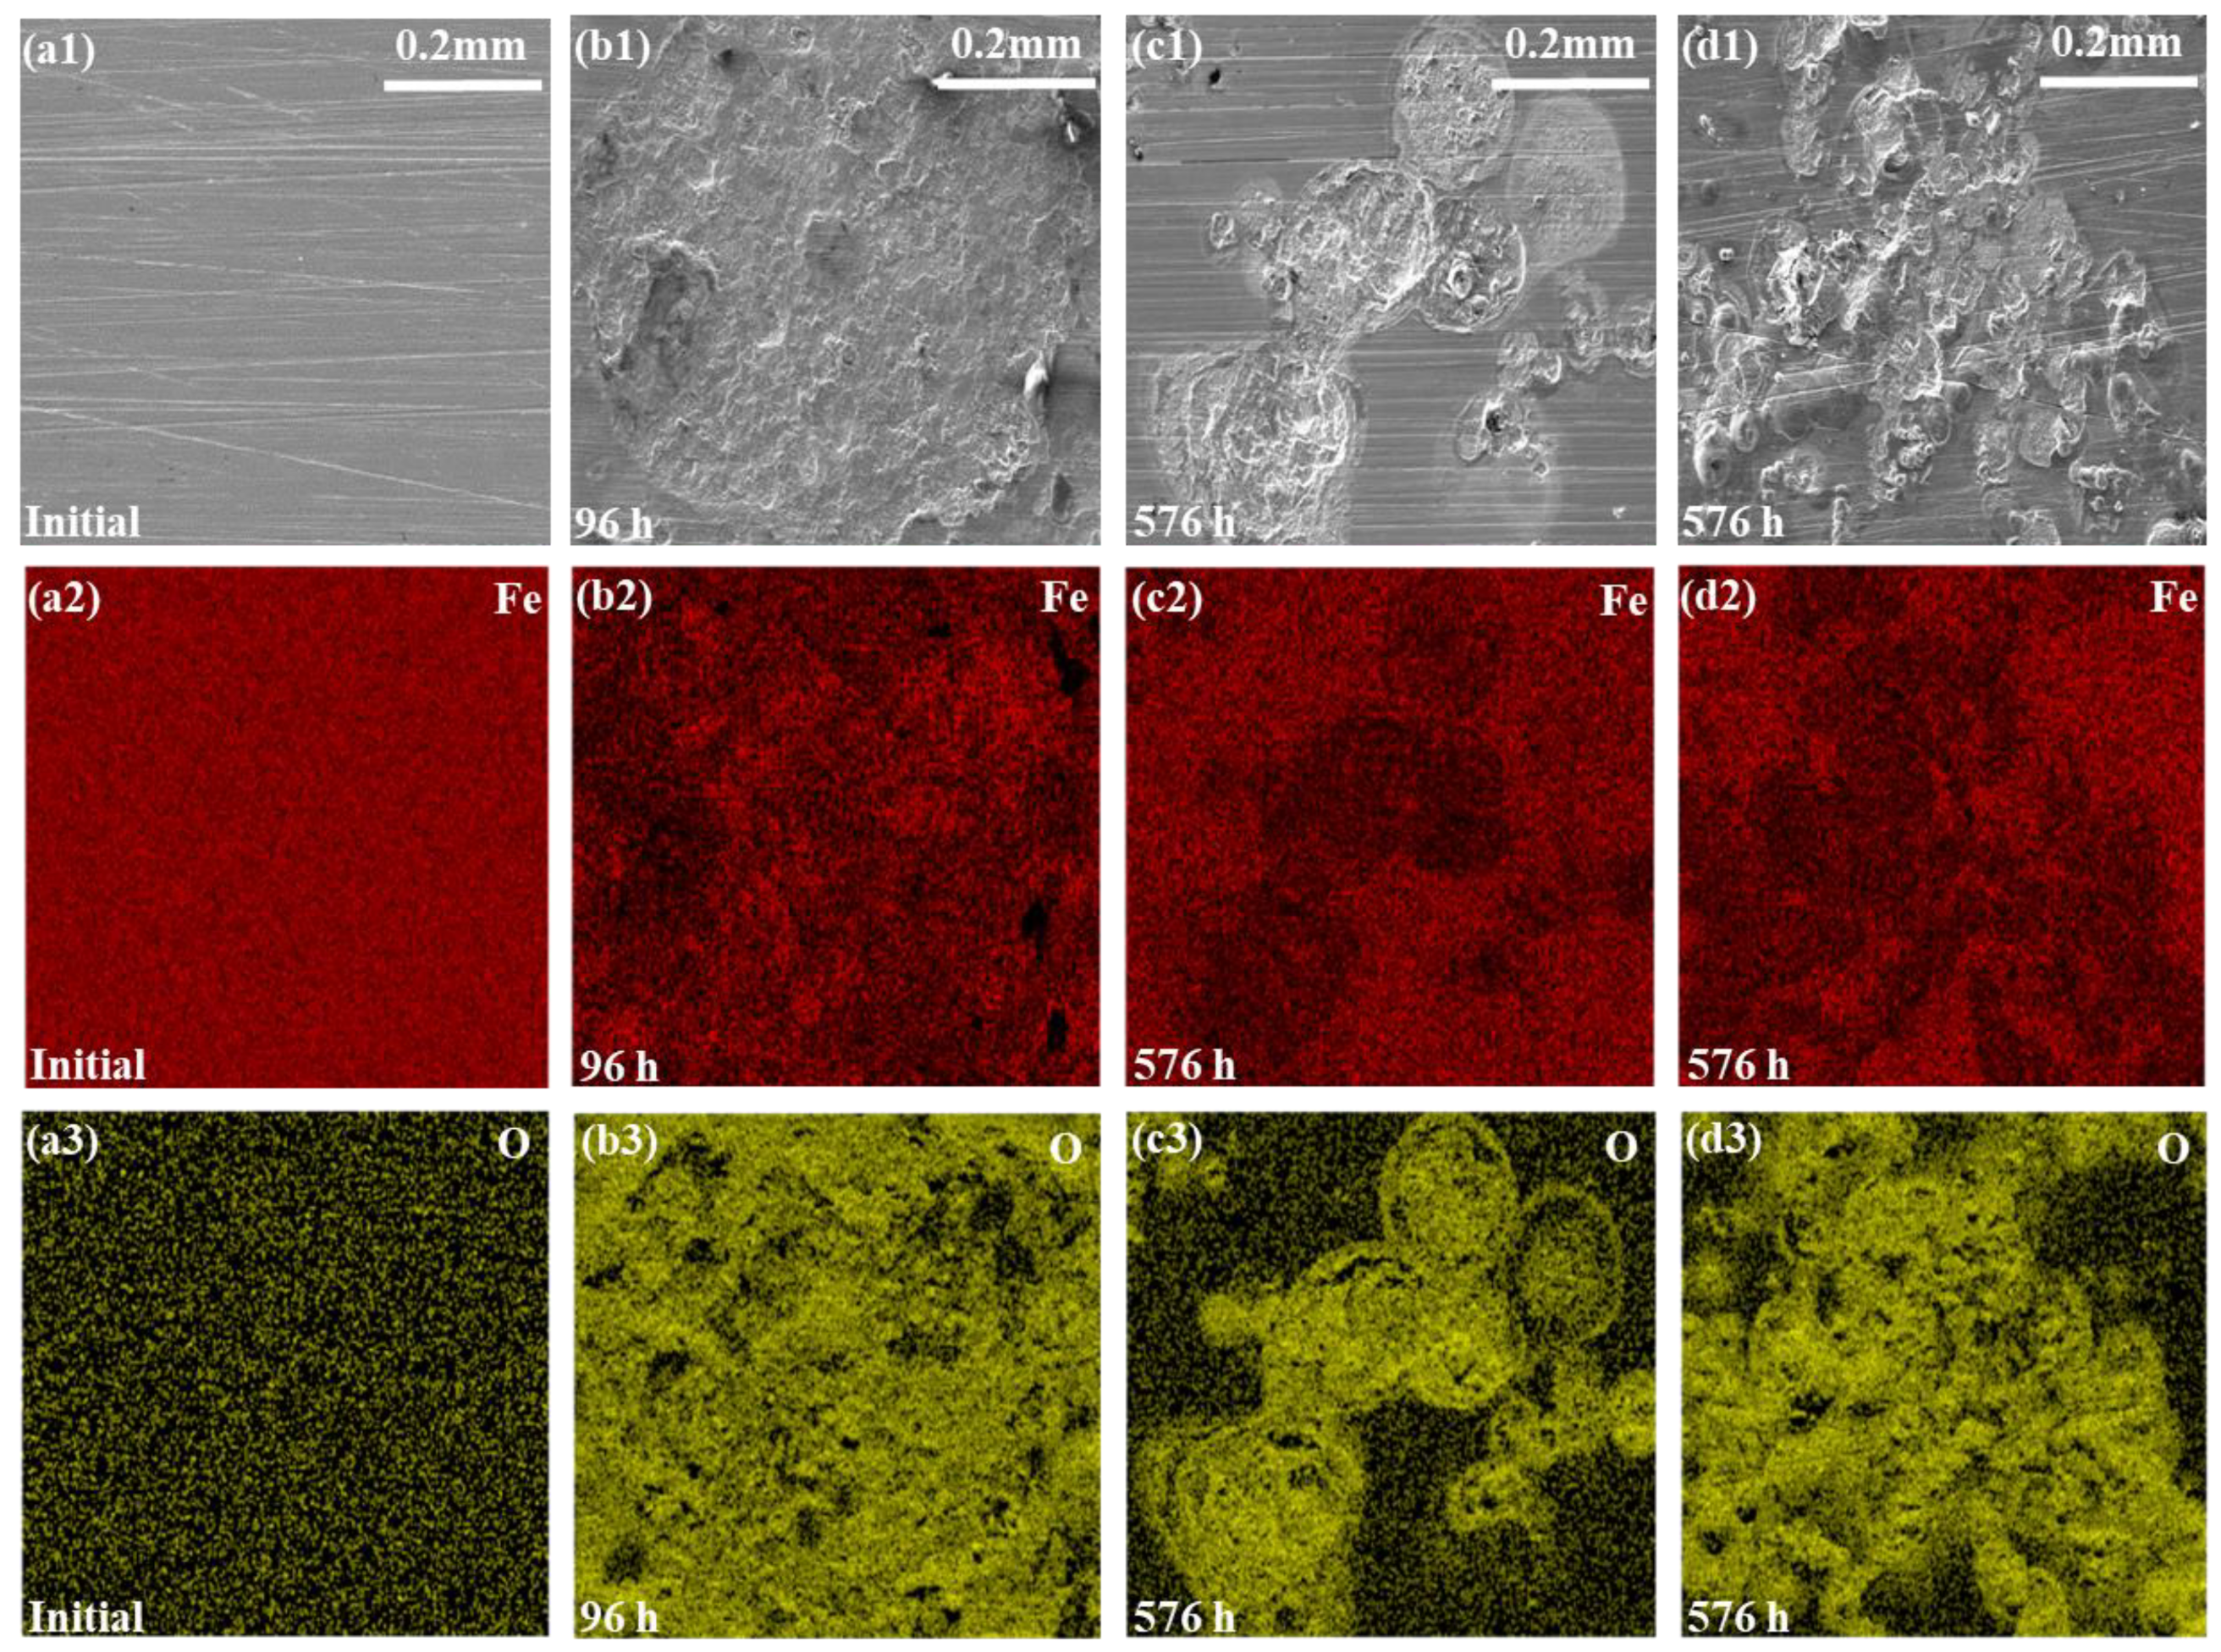
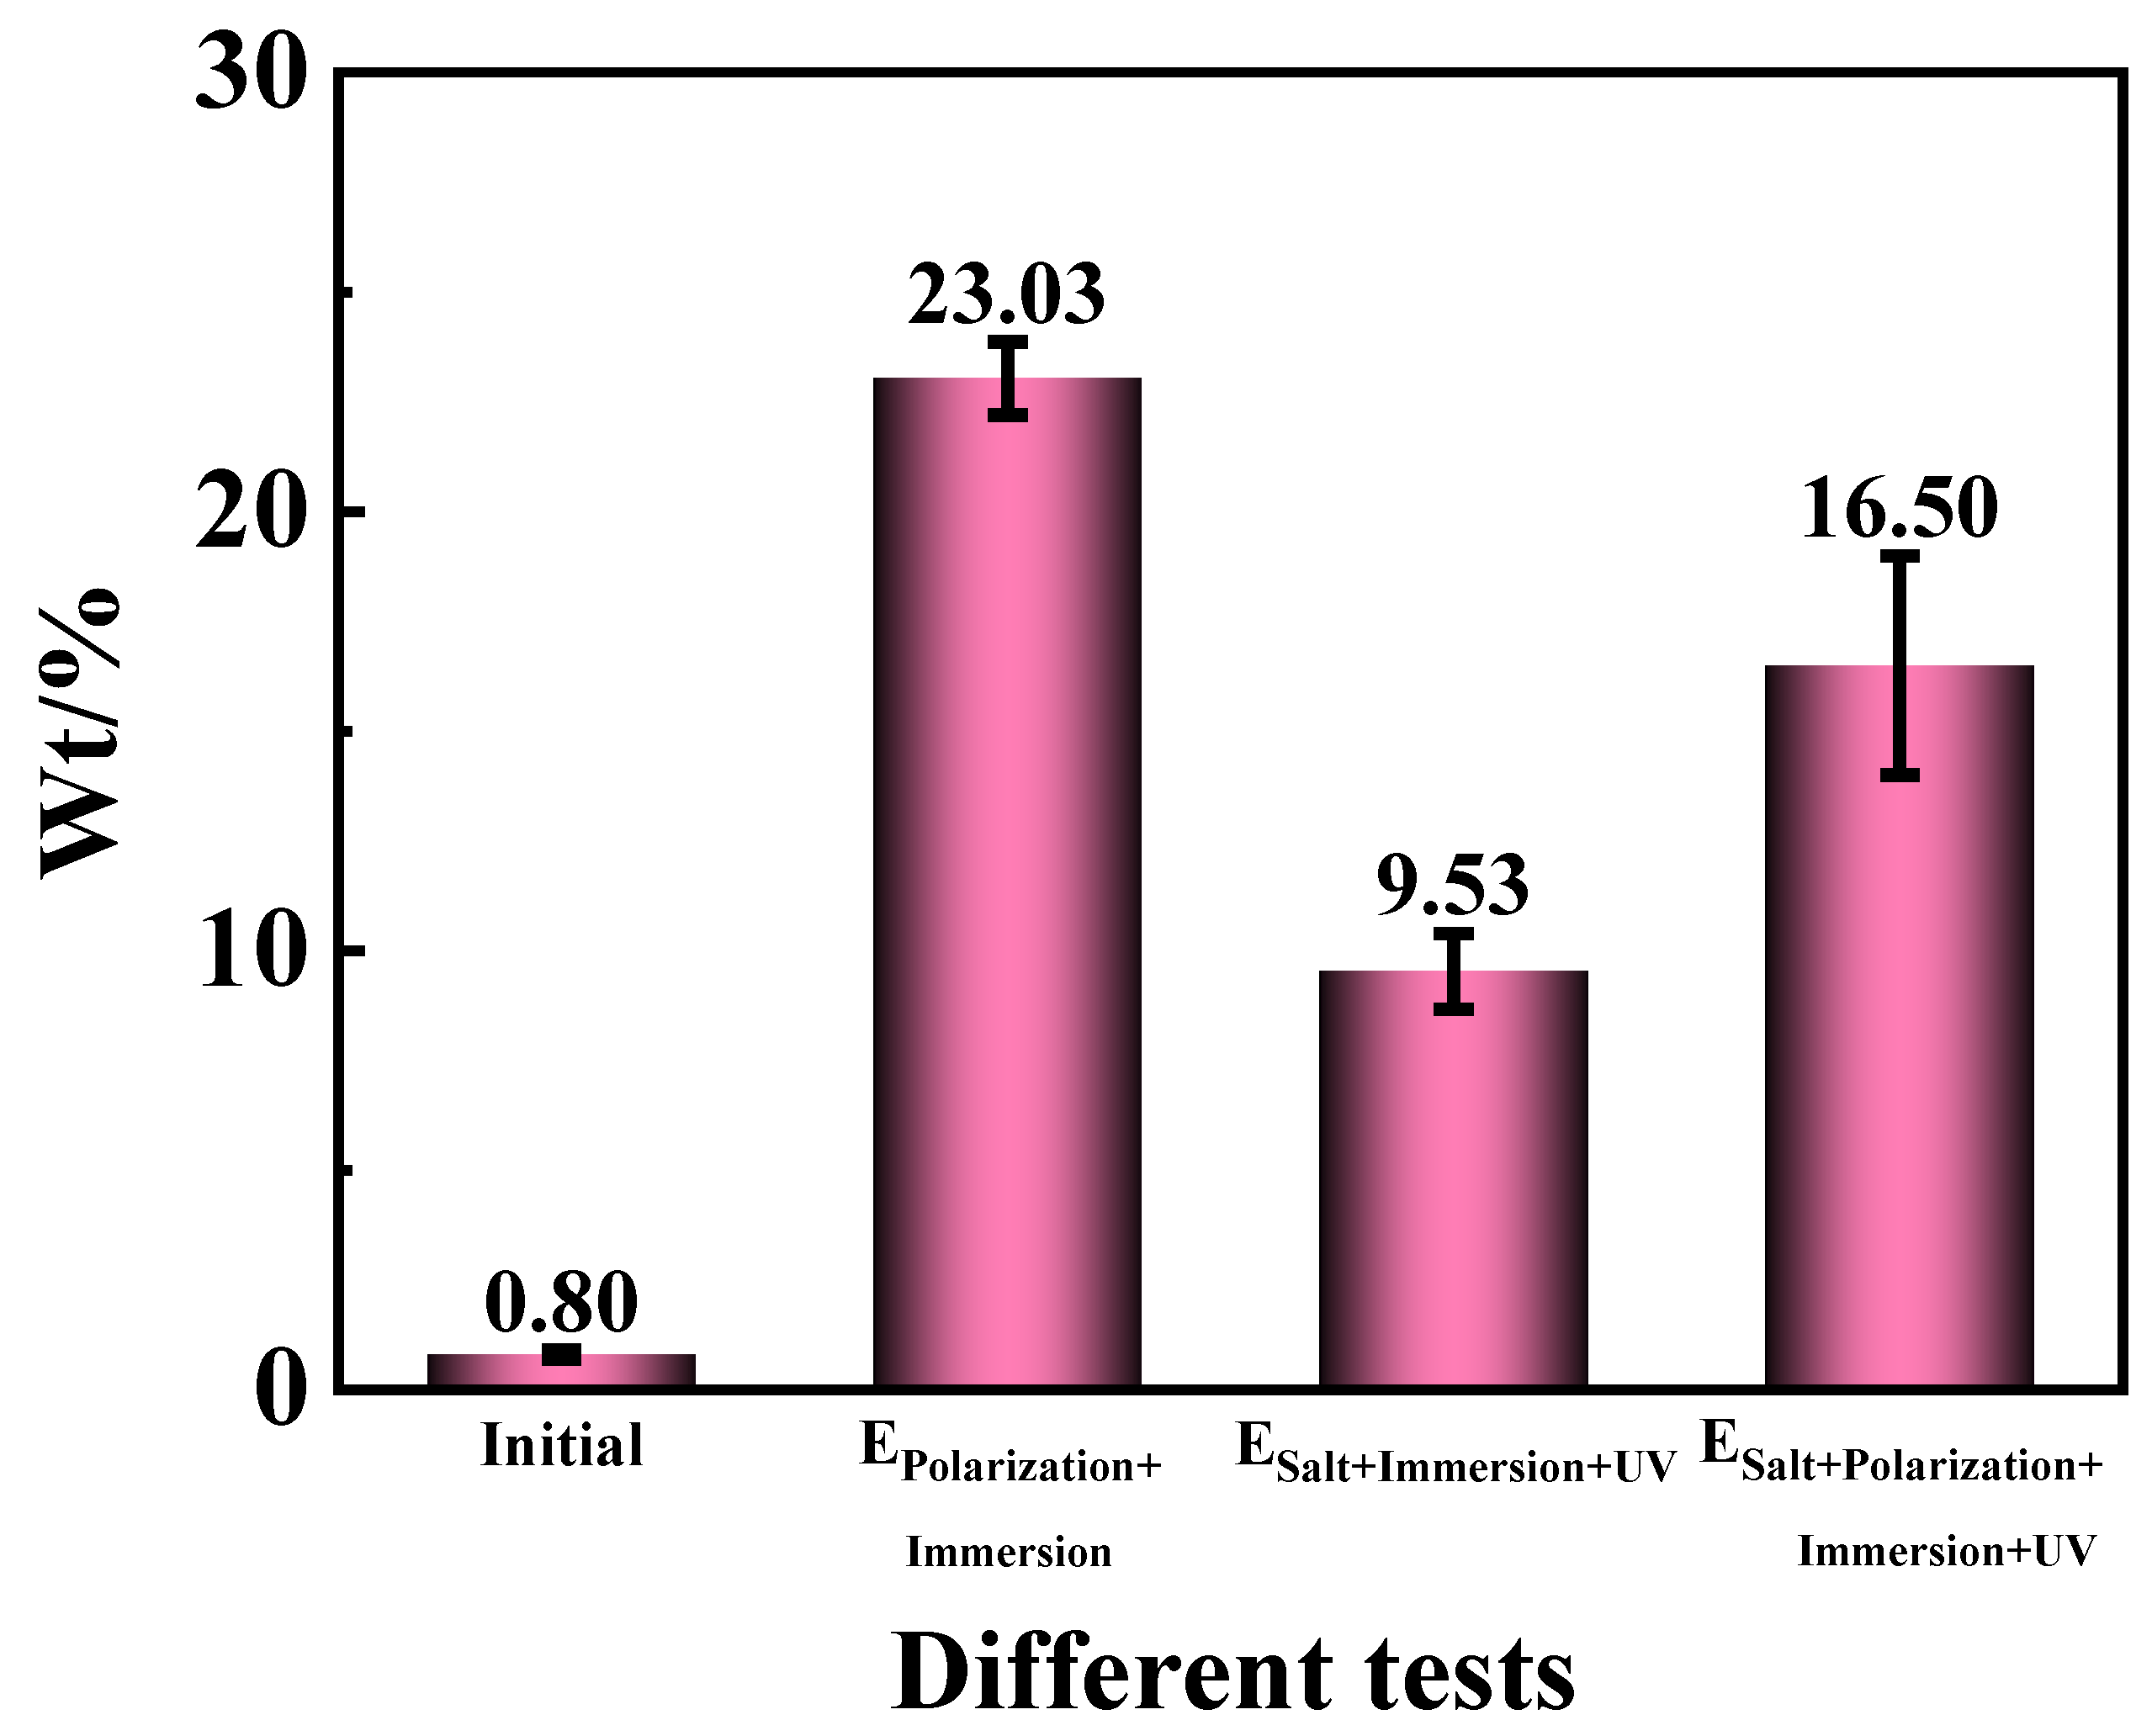
3.7. SEM Morphologies and EDS Analysis
4. Discussion
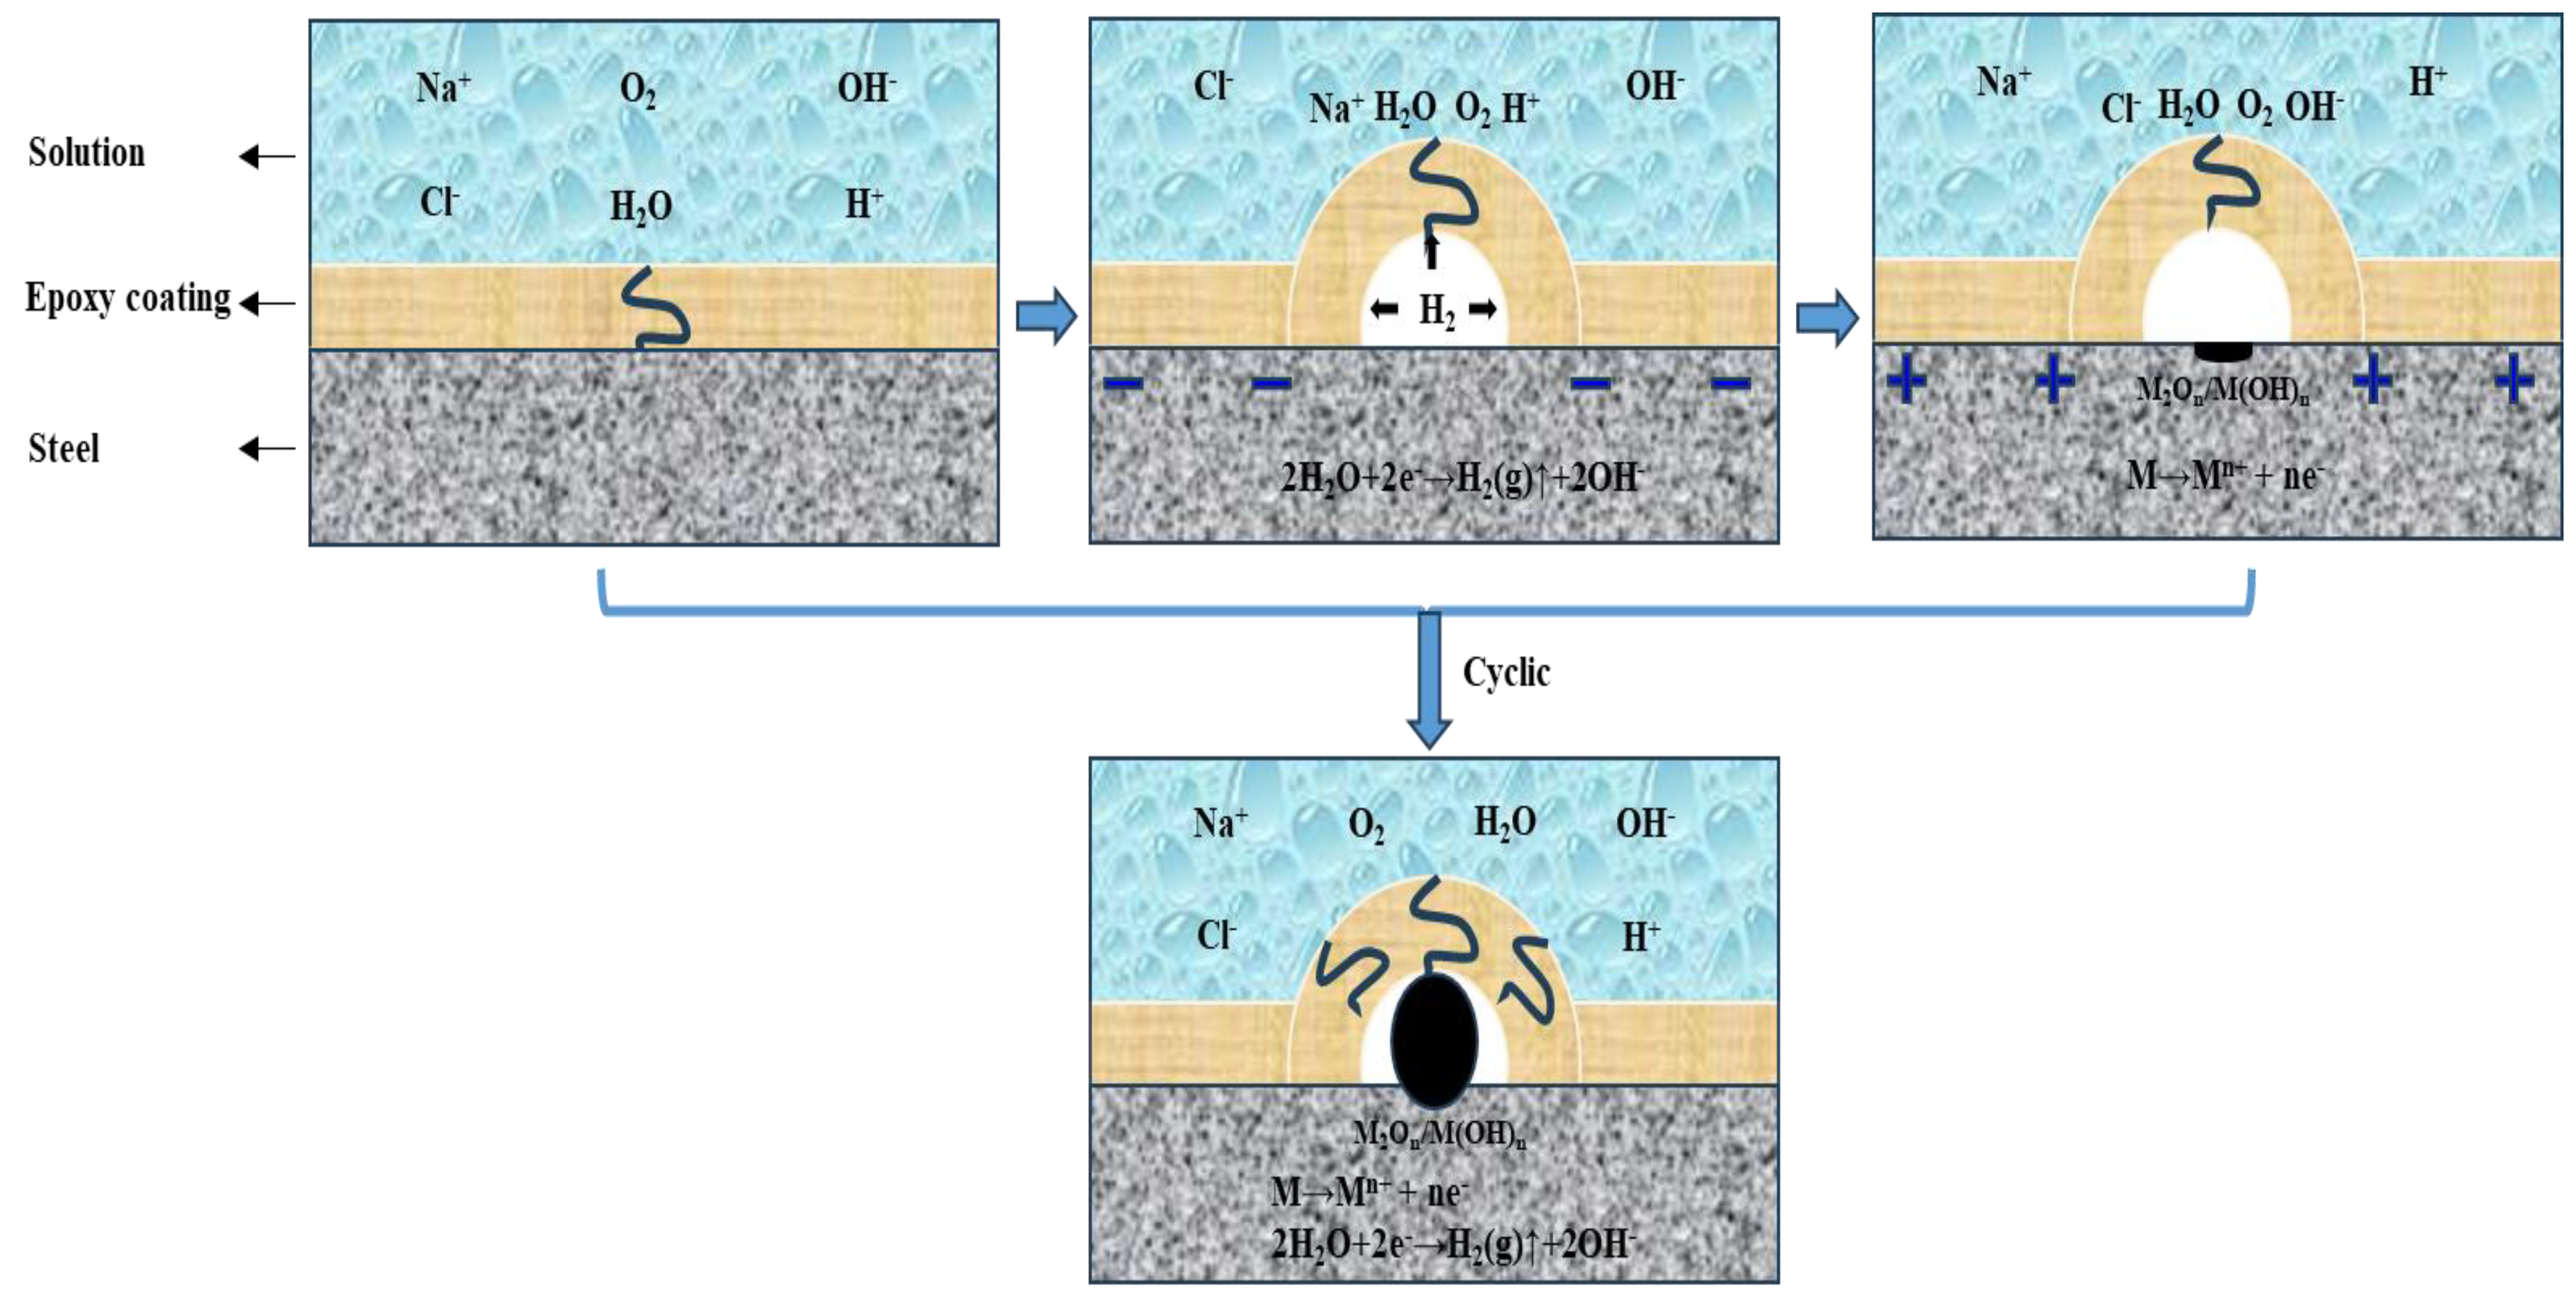
4.1. Corrosion-Acceleration Mechanism of EPolarization+Immersion
- (a)
- Firstly, the O2 and cations such as H+ and Na+ in 3.5 wt.% NaCl solution are transported in the cathodic DC step to the metallic substrate through the micro defects and pores in the epoxy coating. Meanwhile, the cathodic reaction (reaction (3)) occurring on the metallic substrate surface is accelerated by the cathodic polarization, resulting in fast formation of H2 and OH−. The evolved H2 pushes the coating film away from the substrate, forming a gaseous bubble between the epoxy coating film and the carbon steel substrate. The generated OH− can also impair the bonding strength between the coating film and the substrate.
- (b)
- Secondly, immediately after the cathodic polarization is the anodic DC step. The anions Cl− and OH− are transported in the 3.5 wt.% NaCl solution to the metallic substrate through the micro defects and pores in the epoxy coating film. At the same time, the substrate metal is anodically dissolved at a high rate on account of the accelerated anodic reaction (reaction (4)). Some of the dissolved metal cations combine with OH− to form hydroxides/oxides.
- (c)
- Thirdly, in the relaxation stage, the corrosion products ofmainly the hydroxides/oxides, are further produced duo to the corrosion of the substrate metal in the presence of the H2O and Cl−.2Mn+ + 2nOH− → 2M(OH)n → M2On + nH2O
4.2. Corrosion-Acceleration Mechanism of ESalt+Immersion+UV
4.3. Corrosion-Acceleration Mechanism of ESalt+Polarization+Immersion+UV
4.4. Corrosion Acceleration Effects of the Three Tests
5. Conclusions
- (1)
- Under the immersion environment during the EPolarization+Immersion, the alternating cathodic and anodic polarization with symmetrical positive and negative electric charges can dramatically accelerate both the cathodic and anodic reactions. The destruction of the epoxy coating systems was rapidly accelerated, which lost its anti-corrosion property after 24 cycles equal to 96 h. The main damage sites were the corrosion of metal substrate, while there was a mere loss of the chemical performances of the epoxy coating samples.
- (2)
- The ESalt+Immersion+UV consists of salt spray (containing wet, dry and humid), immersion and UV irradiation, which could preferably simulate the ocean splash zone. The destruction effect from the salt spraying, drying, humidifying, high temperature, salt immersion and UVA irradiation competed with the enhancement effect from the post-curing process by the UVA irradiation within the test time. The damage effect was weaker than the enhancement effect at early time, resulting in the entire impedance of the coating samples being improved about 1.6 times more than that in the initial time. As the testing time progressed, the situation reversed along with a gradual anti-corrosion performance decline in the samples.
- (3)
- The ESalt+Polarization+Immersion+UV is a combination of EPolarization+Immersion and ESalt+Immersion+UV. The coupling process of the salt spraying, drying, humidifying, high temperature, salt immersion combined with the cathodic and anodic polarization and the UVA-irradiation-induced degradation causes the acceleration of the penetration and transmission rate of water and corrosive media in the coating, the weakening or even break of the polymer and the chain scission of polymer molecules to occur together, whose damage effect is much greater than the enhancement effect from the post-curing process. It had the strongest damage-acceleration effect in the ESalt+Polarization+Immersion+UV than the other two tests.
Author Contributions
Funding
Institutional Review Board Statement
Informed Consent Statement
Data Availability Statement
Conflicts of Interest
References
- Peng, H.; Chen, Z.; Liu, M.; Zhao, Y.; Fu, W.; Liu, J.; Tan, X. Study on the Effect of Additives on the Performance of Cement-Based Composite Anti-Corrosion Coatings for Steel Bars in Prefabricated Construction. Materials 2024, 17, 1996. [Google Scholar] [CrossRef] [PubMed]
- Evan, W.; Chris, M.; Calvin, A.; Sarah-Jane, P.; Chris, B.; Peter, B.; Justin, S.; Eifion, J. Improving the Corrosion Performance of Organically Coated Steel Using a Sol–Gel Overcoat. Materials 2024, 17, 1075. [Google Scholar] [CrossRef] [PubMed]
- Rosa, V.; Margarita, B.; Rodrigo, H.; Lisa, M.; Paula, R.; Andrés, D. Performance of Anticorrosive Paint Systems for Carbon Steel in the Antarctic Marine Environment. Materials 2023, 16, 5713. [Google Scholar] [CrossRef] [PubMed]
- Policastro, S.A.; Anderson, R.M.; Hangarter, C.M.; Arcari, A.; Iezzi, E.B. Experimental and Numerical Investigation into the Effect of Water Uptake on the Capacitance of an Organic Coating. Materials 2023, 16, 3623. [Google Scholar] [CrossRef] [PubMed]
- Eugenio, A.; Barbara, P.; Stefania, D.; Alfonso, M. Thermally Mendable Self-Healing Epoxy Coating for Corrosion Protection in Marine Environments. Materials 2023, 16, 1775. [Google Scholar] [CrossRef] [PubMed]
- Xu, Y.; Ran, J.; Dai, W.; Zhang, W. Investigation of Service Life Prediction Models for Metallic Organic Coatings Using Full-Range Frequency EIS Data. Metals 2017, 7, 274. [Google Scholar] [CrossRef]
- ASTM B117-19; Standard Practice for Operating Salt Spray (Fog) Apparatus. ASTM International: West Conshohocken, PA, USA, 2019.
- Hammer, T.; Pugh, C.; Soucek, M. Ultraviolet-Curable Cycloaliphatic Polyesters Containing Spiroacetal Moieties for Application as Powder Coatings. ACS Appl. Polym. Mater. 2022, 4, 2294–2305. [Google Scholar] [CrossRef]
- Hadzich, A.; Flores, S.; Caprari, J.; Romagnoli, R. Study of zinc tannates prepared with Tara powder (Caesalpinia spinosa) as anticorrosive pigments in alkyd paints and wash primer formulations. Prog. Org. Coat. 2018, 117, 35–46. [Google Scholar] [CrossRef]
- Fedel, M.; Franch, J.; Rossi, S. Effect of thickness and sealing treatments on the corrosion protection properties of anodic oxide coatings on AA5005. Surf. Coat. Technol. 2021, 408, 126761. [Google Scholar] [CrossRef]
- ASTM G154-23; Standard Practice for Operating Fluorescent Ultraviolet (UV) Lamp Apparatus for Exposure of Materials. ASTM International: West Conshohocken, PA, USA, 2023.
- Sun, L.; Hao, X.; He, J.; Cai, Y.; Guo, P.; Ma, Q. Preparation and Performance Study of Rapid Repair Epoxy Concrete for Bridge Deck Pavement. Materials 2024, 17, 2674. [Google Scholar] [CrossRef]
- ASTM D5894-21; Standard Practice for Cyclic Salt Fog/UV Exposure of Painted Metal (Alternating Exposures in a Fog/Dry Cabinet and a UV/Condensation Cabinet). ASTM International: West Conshohocken, PA, USA, 2021.
- Upadhyay, V.; Allahar, K.; Bierwagen, G. Environmental humidity influence on a topcoat/Mg-rich primer system with embedded electrodes. Sens. Actuators B-Chem. 2014, 193, 522–529. [Google Scholar] [CrossRef]
- Gutierrez, S.; Stone, D.; He, R.; Gutierrez, P.; Walsh, Z.; Robinson, S. Potential Use of the Pigments from Scytalidium cuboideum and Chlorociboria aeruginosa to Prevent ‘Greying’ Decking and Other Outdoor Wood Products. Coatings 2021, 11, 511. [Google Scholar] [CrossRef]
- Gao, J.; Hu, W.; Wang, R.; Li, X. Study on a multifactor coupling accelerated test method for anticorrosive coatings in marine atmospheric environments. Polym. Test. 2021, 100, 107259. [Google Scholar] [CrossRef]
- Feng, Z.; Song, G.; Wang, Z.; Xu, Y.; Zheng, D.; Wu, P.; Chen, X. Salt crystallization-assisted degradation of epoxy resin surface in simulated marine environments. Prog. Org. Coat. 2020, 149, 105932. [Google Scholar] [CrossRef]
- Zhang, Z.; Wu, J.; Zhao, X.; Zhang, Y.; Wu, Y.; Su, T.; Deng, H. Life evaluation of organic coatings on hydraulic metal structures. Prog. Org. Coat. 2020, 148, 105848. [Google Scholar] [CrossRef]
- Zhang, Z.; Wu, J.; Su, T.; Mo, X.; Deng, H.; Wu, Y.; Zhang, Y. Life Prediction for Anticorrosive Coatings on Steel Bridges. Corrosion 2020, 76, 773–785. [Google Scholar] [CrossRef] [PubMed]
- Wang, H.; Feng, P.; Lv, Y.; Geng, Z.; Liu, Q.; Liu, X. A comparative study on UV degradation of organic coatings for concrete: Structure, adhesion, and protection performance. Prog. Org. Coat. 2020, 149, 105892. [Google Scholar] [CrossRef]
- Cai, G.; Zhang, D.; Jiang, D.; Dong, Z. Degradation of fluorinated polyurethane coating under UVA and salt spray. Part II: Molecular structures and depth profile. Prog. Org. Coat. 2018, 124, 25–32. [Google Scholar] [CrossRef]
- Hao, W.; Liu, Z.; Wu, W.; Li, X.; Du, C.; Zhang, D. Electrochemical characterization and stress corrosion cracking of E690 high strength steel in wet-dry cyclic marine environments. Mat. Sci. Eng. A-Struct. 2017, 710, 318–328. [Google Scholar] [CrossRef]
- Zhang, X.; Dong, R.; Gao, B.; Chen, J.; Mu, Z.; Zhang, W.; Yang, X. Effect of trace rare earth elements (Ce) on corrosion resistance of high strength steel used for offshore platform. Mater. Res. Express 2023, 10, 036514. [Google Scholar] [CrossRef]
- Guo, H.; Wei, H.; Li, G.; Sun, F. Experimental research on fatigue performance of butt welds of corroded Q690 high strength steel. J. Constr. Steel Res. 2021, 184, 106801. [Google Scholar] [CrossRef]
- Zhou, Y.; Wang, X.; Hu, B.; Sui, L.; Yuan, F. Seismic Retrofit of Nonuniformly Corroded Coastal Bridge Piers with FRP and Engineered Cementitious Composite Overlays. J. Compos. Constr. 2023, 27, 04022088. [Google Scholar] [CrossRef]
- Syrek-Gerstenkorn, B.; Paul, S.; Davenport, A. Use of thermally sprayed aluminium (TSA) coatings to protect offshore structures in submerged and splash zones. Surf. Coat. Technol. 2019, 374, 124–133. [Google Scholar] [CrossRef]
- Davalos-Monteiro, R.; D’Ambrosio, G.; Zhou, X.; Gibbon, S.; Curioni, M. Relationship between natural exposure testing and cyclic corrosion testing ISO 20340 for the assessment of the durability of powder-coated steel. Corros. Eng. Sci. Technol. 2021, 56, 742–752. [Google Scholar] [CrossRef]
- Mizuno, D. Automotive Corrosion and Accelerated Corrosion Tests for Zinc Coated Steels. ISIJ Int. 2018, 58, 1562–1568. [Google Scholar] [CrossRef]
- Miwa, T.; Takeshita, Y.; Ishii, A.; Sawada, T. Simulation of water absorption and desorption behavior for an-ti-corrosion coatings in existing and new accelerated corrosion tests. Prog. Org. Coat. 2018, 120, 71–78. [Google Scholar] [CrossRef]
- Yin, D.; Xu, Q. Comparison of Sandstone Damage Measurements Based on Non-Destructive Testing. Materials 2020, 13, 5154. [Google Scholar] [CrossRef]
- Wang, X.; Liu, Y.; Liu, Z.; Li, Z.; Zhang, T.; Cheng, Y.; Lei, L.; Yang, B.; Hou, Y. Highly efficient electrosynthesis of H2O2 in acidic electrolyte on metal-free heteroatoms co-doped carbon nanosheets and simultaneously promoting Fenton process. Chin. Chem. Lett. 2024, 35, 108926. [Google Scholar] [CrossRef]
- Bierwagen, G.; Tallman, D.; Li, J.; He, L.; Jeffcoate, C. EIS studies of coated metals in accelerated exposure. Prog. Org. Coat. 2003, 46, 148–157. [Google Scholar] [CrossRef]
- Bethencourt, M.; Botana, F.; Cano, M.; Osuna, R.; Marcos, M. Lifetime prediction of waterborne acrylic paints with the AC-DC-AC method. Prog. Org. Coat. 2004, 49, 275–281. [Google Scholar] [CrossRef]
- Lopes, T.; Lopes, T.; Martins, D.; Carneiro, C.; Machado, J.; Mendes, A. Accelerated aging of anticorrosive coat-ings: Two-stage approach to the AC/DC/AC electrochemical method. Prog. Org. Coat. 2020, 138, 105365. [Google Scholar] [CrossRef]
- Hollaender, J. Rapid assessment of food/package interactions by electrochemical impedance spectroscopy (EIS). Food Addit. Contam. 1997, 14, 617–626. [Google Scholar] [CrossRef] [PubMed]
- Weidje, H.; Mills, D.; Bierwagen, G. International workshop on application of electrochemical techniques to organic coatings. Prog. Org. Coat. 2000, 39, 3–5. [Google Scholar] [CrossRef]
- Cuttone, L.; Cristini, S.; Trueba, M.; Trasatti, S. Electrochemical investigation of polyaniline blends on galvanized steel. Prog. Org. Coat. 2016, 96, 65–79. [Google Scholar] [CrossRef]
- Zadeh, M.; Zwaag, S.; García, S. Assessment of healed scratches in intrinsic healing coatings by AC/DC/AC ac-celerated electrochemical procedure. Sur. Coat. Technol. 2016, 303, 396–405. [Google Scholar] [CrossRef]
- García, S.; Suay, J. Epoxy powder clearcoats used for anticorrosive purposes cured with ytterbium III trifl uoro-methanesulfonate. Corrosion 2007, 63, 379–390. [Google Scholar] [CrossRef]
- García, S.; Rodríguez, M.; Izquierdo, R.; Suay, J. Evaluation of cure temperature effects in cataphoretic automotive primers by electrochemical techniques. Prog. Org. Coat. 2007, 60, 303–311. [Google Scholar] [CrossRef]
- Fragni, R.; Zurlini, C.; Montanari, A.; Kiroplastis, V.; Peñalba, F. Adhesion improvement of the UV lacquers for food cans by applying a post-curing current treatment. Prog. Org. Coat. 2006, 55, 254–261. [Google Scholar] [CrossRef]
- Usman, B.; Scenini, F.; Curioni, M. Exploring the use of an AC-DC-AC technique for the accelerated evaluation of anticorrosion performance of anodic films on aluminium alloys. Prog. Org. Coat. 2020, 144, 105648. [Google Scholar] [CrossRef]
- Puig, M.; Gimeno, M.; Gracenea, J.; Suay, J. Anticorrosive properties enhancement in powder coating duplex systems by means of ZMP anticorrosive pigment. Assessment by electrochemical techniques. Prog. Org. Coat. 2014, 77, 1993–1999. [Google Scholar] [CrossRef]
- Xu, Y.; Song, G.; Zheng, D.; Feng, Z. The corrosion damage of an organic coating accelerated by different AC-DC-AC tests. Eng. Failure Anal. 2021, 126, 105461. [Google Scholar] [CrossRef]
- Zheng, D.; Gui, Q.; Xu, Y.; Song, G. Modified AC-DC-AC method for evaluation of corrosion damage of acrylic varnish paint coating/Q215 steel system. Prog. Org. Coat. 2021, 159, 106401. [Google Scholar] [CrossRef]
- Fan, B.; Yang, J.; Cao, L.; Wang, X.; Li, J.; Yang, Y.; Wang, Q.; Zhang, P.; Vogel, F.; Li, W.; et al. Revealing the Impact of Micro-SiO2 Filer Content on the Anti-Corrosion Performance of Water-Borne Epoxy Resin. Polymer 2023, 15, 3273. [Google Scholar] [CrossRef] [PubMed]
- Shen, Y.; Xu, L.; Liu, Y.; Lu, Y.; Xu, H.; Zhao, R.; Bai, S.; Xin, Y.; Hou, J.; Liu, X.; et al. Influence of AC-DC-AC Cycling with Hydrostatic Pressure on Accelerated Protective Performance Test of Glass Flake Epoxy Coating. Coating 2023, 13, 1843. [Google Scholar] [CrossRef]
- Xu, Y.; Song, G.; Zheng, D. The Combined Effect of Direct Current Polarization, Ultraviolet Radiation, and Saline Immersion on the Degradation of an Epoxy Coating. J. Mater. Eng. Perform. 2023, 33, 3570–3581. [Google Scholar] [CrossRef]
- Du, S.; Zhang, Y.; Meng, M.; Tang, A.; Li, Y. The role of water transport in the failure of silicone rubber coating for implantable electronic devices. Prog. Org. Coat. 2021, 159, 106419. [Google Scholar] [CrossRef]
- Tokutake, K.; Okazaki, S.; Kodama, S. Investigation of Accelerated Degradation Methods to Cause Blisters for Non-Defective Vinyl Ester Resin Glass Flake Organic Coatings. Coatings 2022, 12, 76–97. [Google Scholar] [CrossRef]
- Xu, Y.; Song, G.; Zheng, D. Prediction of long-term service life of an organic coating based on short-term exposure results. Anti-corros. Method. M. 2022, 69, 269–278. [Google Scholar] [CrossRef]
- ISO/TR 16208:2014; Corrosion of Metals and Alloys—Test Method for Corrosion of Materials by Electrochemical Impedance Measurements. ISO: Geneva, Switzerland, 2014.
- ISO 17463:2022; Paints and Varnishes—Guidelines for the Determination of Anticorrosive Properties of Organic Coatings by Accelerated Cyclic Electrochemical Technique. ISO: Geneva, Switzerland, 2022.
- Zhou, Y.; Liu, X.; Kang, J.; Yue, W.; Qin, W.; Ma, G.; Fu, Z.; Zhu, L.; She, D.; Wang, H.; et al. Corrosion behavior of HVOF sprayed WC-10Co4Cr coatings in the simulated seawater drilling fluid under the high pressure. Eng. Failure Anal. 2020, 109, 104338. [Google Scholar] [CrossRef]
- Zhu, Q.; Zhang, B.; Zheng, M.; Zhao, X.; Xu, J. Corrosion Behaviors of S355 Steel under Simulated Tropical Marine Atmosphere Conditions. J. Mater. Eng. Perform. 2022, 31, 10054–10062. [Google Scholar] [CrossRef]
- Thinaharan, C.; George, R.; Philip, J. In Situ Raman Spectroscopic Analysis on Carbon Steel, Immersed in Aqueous Solutions at Different pH and Anions. J. Mater. Eng. Perform. 2020, 29, 2792–2805. [Google Scholar] [CrossRef]
- Yan, S.; Wu, Q. A novel structure for enhancing the sensitivity of gas sensors—α-Fe2O3 nanoropes containing a large amount of grain boundaries and their excellent ethanol sensing performance. J. Mater. Chem. A 2015, 3, 5982. [Google Scholar] [CrossRef]
- Vidal, F.; Vicente, R.; Bastos, A.; Rocha, A.; Silva, J.; Mendes Silva, J. Atmospheric corrosion in two different urban environments in Portugal: Results of one-year exposure. Corros. Eng. Sci. Technol. 2019, 54, 614–626. [Google Scholar] [CrossRef]
- Cai, G.; Wang, H.; Jiang, D.; Dong, Z. Degradation of fluorinated polyurethane coating under UVA and salt spray. Part I: Corrosion resistance and morphology. Prog. Org. Coat. 2018, 123, 337–349. [Google Scholar] [CrossRef]
- Bouvet, G.; Cohendoz, S.; Feaugas, X.; Touzain, S.; Mallarino, S. Microstructural reorganization in model epoxy network during cyclic hygrothermal ageing. Polymer 2017, 122, 1–11. [Google Scholar] [CrossRef]
- Krakovsky, I.; Plestil, J.; Almásy, L. Structure and swelling behaviour of hydrophilic epoxy networks investigated by SANS. Polymer 2006, 47, 218–226. [Google Scholar] [CrossRef]
- Al-Turaif, H. Surface morphology and chemistry of epoxy-based coatings after exposure to ultraviolet radiation. Prog. Org. Coat. 2013, 76, 677–681. [Google Scholar] [CrossRef]
- La Mantia, F.; Morreale, M.; Botta, L.; Mistretta, M.; Ceraulo, M.; Scaffaro, R. Degradation of polymer blends: A brief review. Polym. Degrad. Stabil. 2017, 145, 79–92. [Google Scholar] [CrossRef]
Disclaimer/Publisher’s Note: The statements, opinions and data contained in all publications are solely those of the individual author(s) and contributor(s) and not of MDPI and/or the editor(s). MDPI and/or the editor(s) disclaim responsibility for any injury to people or property resulting from any ideas, methods, instructions or products referred to in the content. |
© 2024 by the authors. Licensee MDPI, Basel, Switzerland. This article is an open access article distributed under the terms and conditions of the Creative Commons Attribution (CC BY) license (https://creativecommons.org/licenses/by/4.0/).
Share and Cite
Xu, Y.; Song, G.; Zheng, D.; Liu, C.; Han, E. Polarization-Accelerated Seawater Splash Simulation for Rapid Evaluation of Protection Performance of an Epoxy Coating on Carbon Steel. Materials 2024, 17, 3623. https://doi.org/10.3390/ma17143623
Xu Y, Song G, Zheng D, Liu C, Han E. Polarization-Accelerated Seawater Splash Simulation for Rapid Evaluation of Protection Performance of an Epoxy Coating on Carbon Steel. Materials. 2024; 17(14):3623. https://doi.org/10.3390/ma17143623
Chicago/Turabian StyleXu, Yuqing, Guangling Song, Dajiang Zheng, Changsheng Liu, and Enhou Han. 2024. "Polarization-Accelerated Seawater Splash Simulation for Rapid Evaluation of Protection Performance of an Epoxy Coating on Carbon Steel" Materials 17, no. 14: 3623. https://doi.org/10.3390/ma17143623