Article

The Influence of Electrolytes on the Performance of Self-Powered Photoelectrochemical Photodetector Based on α-Ga2O3 Nanorods

School of Materials Science and Engineering, Harbin Institute of Technology, Harbin 150001, China
*
Author to whom correspondence should be addressed.
These authors contributed equally to this work.
Materials 2024, 17(15), 3665; https://doi.org/10.3390/ma17153665
Submission received: 26 June 2024 / Revised: 22 July 2024 / Accepted: 23 July 2024 / Published: 25 July 2024
(This article belongs to the Section Advanced Nanomaterials and Nanotechnology)

Abstract

:
Photodetectors have a wide range of applications across various fields. Self-powered photodetectors that do not require external energy have garnered significant attention. The photoelectrochemical type of photodetector is a self-powered device that is both simple to fabricate and offers high performance. However, developing photoelectrochemical photodetectors with superior quality and performance remains a significant challenge. The electrolyte, which is a key component in these detectors, must maintain extensive contact with the semiconductor without degrading its material quality and efficiently catalyze the redox reactions of photogenerated electrons and holes, while also facilitating rapid charge carrier transport. In this study, α -Ga2O3 nanorod arrays were synthesized via a cost-effective hydrothermal method to achieve a self-powered solar-blind photodetector. The impacts of different electrolytes—Na2SO4, NaOH, and Na2CO3—on the photodetector was investigated. Ultimately, a self-powered photodetector with Na2SO4 as the electrolyte demonstrated a stable photoresponse, with the maximum responsivity of 0.2 mA/W at 262 nm with the light intensity of 3.0 mW/cm2, and it exhibited rise and decay times of 0.16 s and 0.10 s, respectively. The α -Ga2O3 nanorod arrays and Na2SO4 electrolyte provided a rapid pathway for the transport of photogenerated carriers and the built-in electric field at the semiconductor–liquid heterojunction interface, which was largely responsible for the effective separation of photogenerated electron–hole pairs that provided the outstanding performance of our photodetector.

1. Introduction

Ultraviolet (UV) radiation with wavelengths from 200 to 280 nm is absorbed by the ozone layer and does not reach the surface of the Earth; this is known as solar-blind ultraviolet light. Photodetectors that operate within this wavelength range are termed solar-blind photodetectors, which offer the benefits of a high signal-to-noise ratio (SNR), low false alarm rates, the capability for all-weather operation, and immunity to the interference of sunlight. Solar-blind photodetectors offer many promising applications, including solar-blind imaging, ultraviolet optical communication, monitoring of the ozone layer, forest fire alarms, and general ultraviolet monitoring. Wide-bandgap semiconductors are commonly utilized in the fabrication of solar-blind ultraviolet photodetectors, such as GaN [1,2] and SiC [3], which often require the use of optical filters or doping to control the bandgap. Gallium oxide (Ga2O3) is a wide-bandgap semiconductor, with a bandgap of approximately 5 eV, and exists in five phases: α , β , γ , δ , and ϵ . At present, α - and β -Ga2O3 are commonly used to construct solar-blind photodetectors [4,5]. To date, the vast majority of photodetectors based on gallium oxide (Ga2O3) have employed the metal–semiconductor–metal (MSM) configuration, which mostly functions with an external power source. This limitation restricts the application of solar-blind photodetectors in a variety of environments, while simultaneously posing a potential environmental hazard [6,7], which increases the demand for self-powered photodetectors. PN junctions, Schottky barriers, and photoelectrochemical detectors can all achieve self-powered detection capabilities. Among these devices, PEC photodetectors are gaining attention for their low energy consumption, which allows them to operate self-sufficiently without the need for external power sources. This feature not only minimizes the environmental impact but also reduces the initial investments and long-term operational costs, thus contributing to sustainable development. Through these features, PEC UV detectors not only demonstrate high performance and advanced capabilities technically but also offer significant advantages economically and environmentally. PEC-type solar-blind UV photodetectors based on Ga2O3 demonstrate a remarkable photoresponse under UV radiation [5,8,9,10]. For PEC-type detectors, the electrolyte plays a pivotal role in facilitating pure ionic conductivity between the counter electrode and the photoanode. To ensure the functionality of PEC-type ultraviolet (UV) detectors, several criteria must be met: (a) The electrolyte should be capable of efficiently transporting electrons and holes between the photoanode and the counter electrode. Photogenerated holes should be swiftly oxidized by electron donors present in the electrolyte. (b) The electrolyte must promote the rapid migration of charge carriers and maintain a substantial contact area with both the photoanode and the counter electrode. (c) It is essential that the electrolyte exhibits chemical stability and remains inert to the materials of the photoanode to ensure the reliable operation and enduring stability of the PEC system. Electrolytes can be differentiated based on their physical state, their chemical composition, and the mechanisms of their formation into categories such as aqueous [5], organic liquid [11], and solid-state gel electrolytes [12]. Due to their safety, stability, and environmental benignity, aqueous electrolytes are particularly well suited for PEC UV detectors. Nevertheless, research on the influence of electrolytes on PEC detectors is quite limited. In this work, PEC detectors that utilized a variety of electrolytes were fabricated to explore the effect on the performance of the photodetector.

2. Materials and Methods

The process of preparing the gallium-oxide-based PEC photodetector involved several steps. Initially, a gallium oxide sol–gel solution (50 μ L) was prepared; it consisted of ethanol solution with Ga(NO3)3 and LiOH. This mixture was applied to a fluorine-doped tin oxide (FTO) substrate via spin-coating at a rotation speed of 3000 rpm for a duration of 30 s. The coated substrate was then subjected to an annealing process in a furnace preheated to 450 °C for 20 min, resulting in a uniform Ga2O3 seed layer. Subsequently, the annealed FTO substrate was immersed into a 30 mL precursor solution with a concentration of 0.03 M Ga(NO3)3. It underwent a hydrothermal reaction at 180 °C for 720 min to obtain GaOOH. After the reaction, the samples were rinsed and dried. The final transformation of GaOOH to α -Ga2O3 was achieved through annealing in a muffle furnace under an atmospheric environment, as illustrated in Figure 1a. The fabrication of the PEC UV detector was a three-step procedure: (1) α -Ga2O3 nanorods on the FTO substrate acted as the photoanode; (2) a high-transmittance quartz plate, which was partially coated with Pt to facilitate current conduction and reception of solar-blind UV signals, was employed as the counter electrode; and (3) different 0.1 M aqueous solutions, namely, Na2CO3, Na2SO4, NaOH, and pure water, were used as the electrolytes. The photoanode and counter electrodes were securely bonded using a 60 µm thick Bynel film, and the electrolyte was injected through a strategically placed hole on the counter electrode.
The morphology of the α -Ga2O3 nanorods was examined through field-emission scanning electron microscopy (FE-SEM, TESCAN, Brno, Czech Republic) and transmission electron microscopy (TEM, JEOLJEM-2100, JEOL, Tokyo, Japan). The crystallographic properties of α -Ga2O3 nanorods were characterized using X-ray diffraction (XRD, PANalytical Empyrean, Cu Ka Radiation, Alemlo, Poland). The chemical composition and valence states of the α -Ga2O3 nanorods were elucidated using X-ray photoelectron spectroscopy (XPS, Thermo K-Alpha, Thermo Fisher(CN), Shanghai, China). The performance testing of the PEC solar-blind UV detectors was conducted as illustrated in Figure 1b. The responsivity test of the devices was carried out by a 500 W xenon light source with a full-automatic grating monochromator to split the light, with a calibrated standard single crystal silicon solar cell (S1337-1010BQ, Hamamatsu, Shizuoka, Japan) as the reference cell, and current–voltage curves were collected by a Semiconductor Parametric Analyzer (FS-Pro, Primarius, Shanghai, China).

3. Results and Discussion

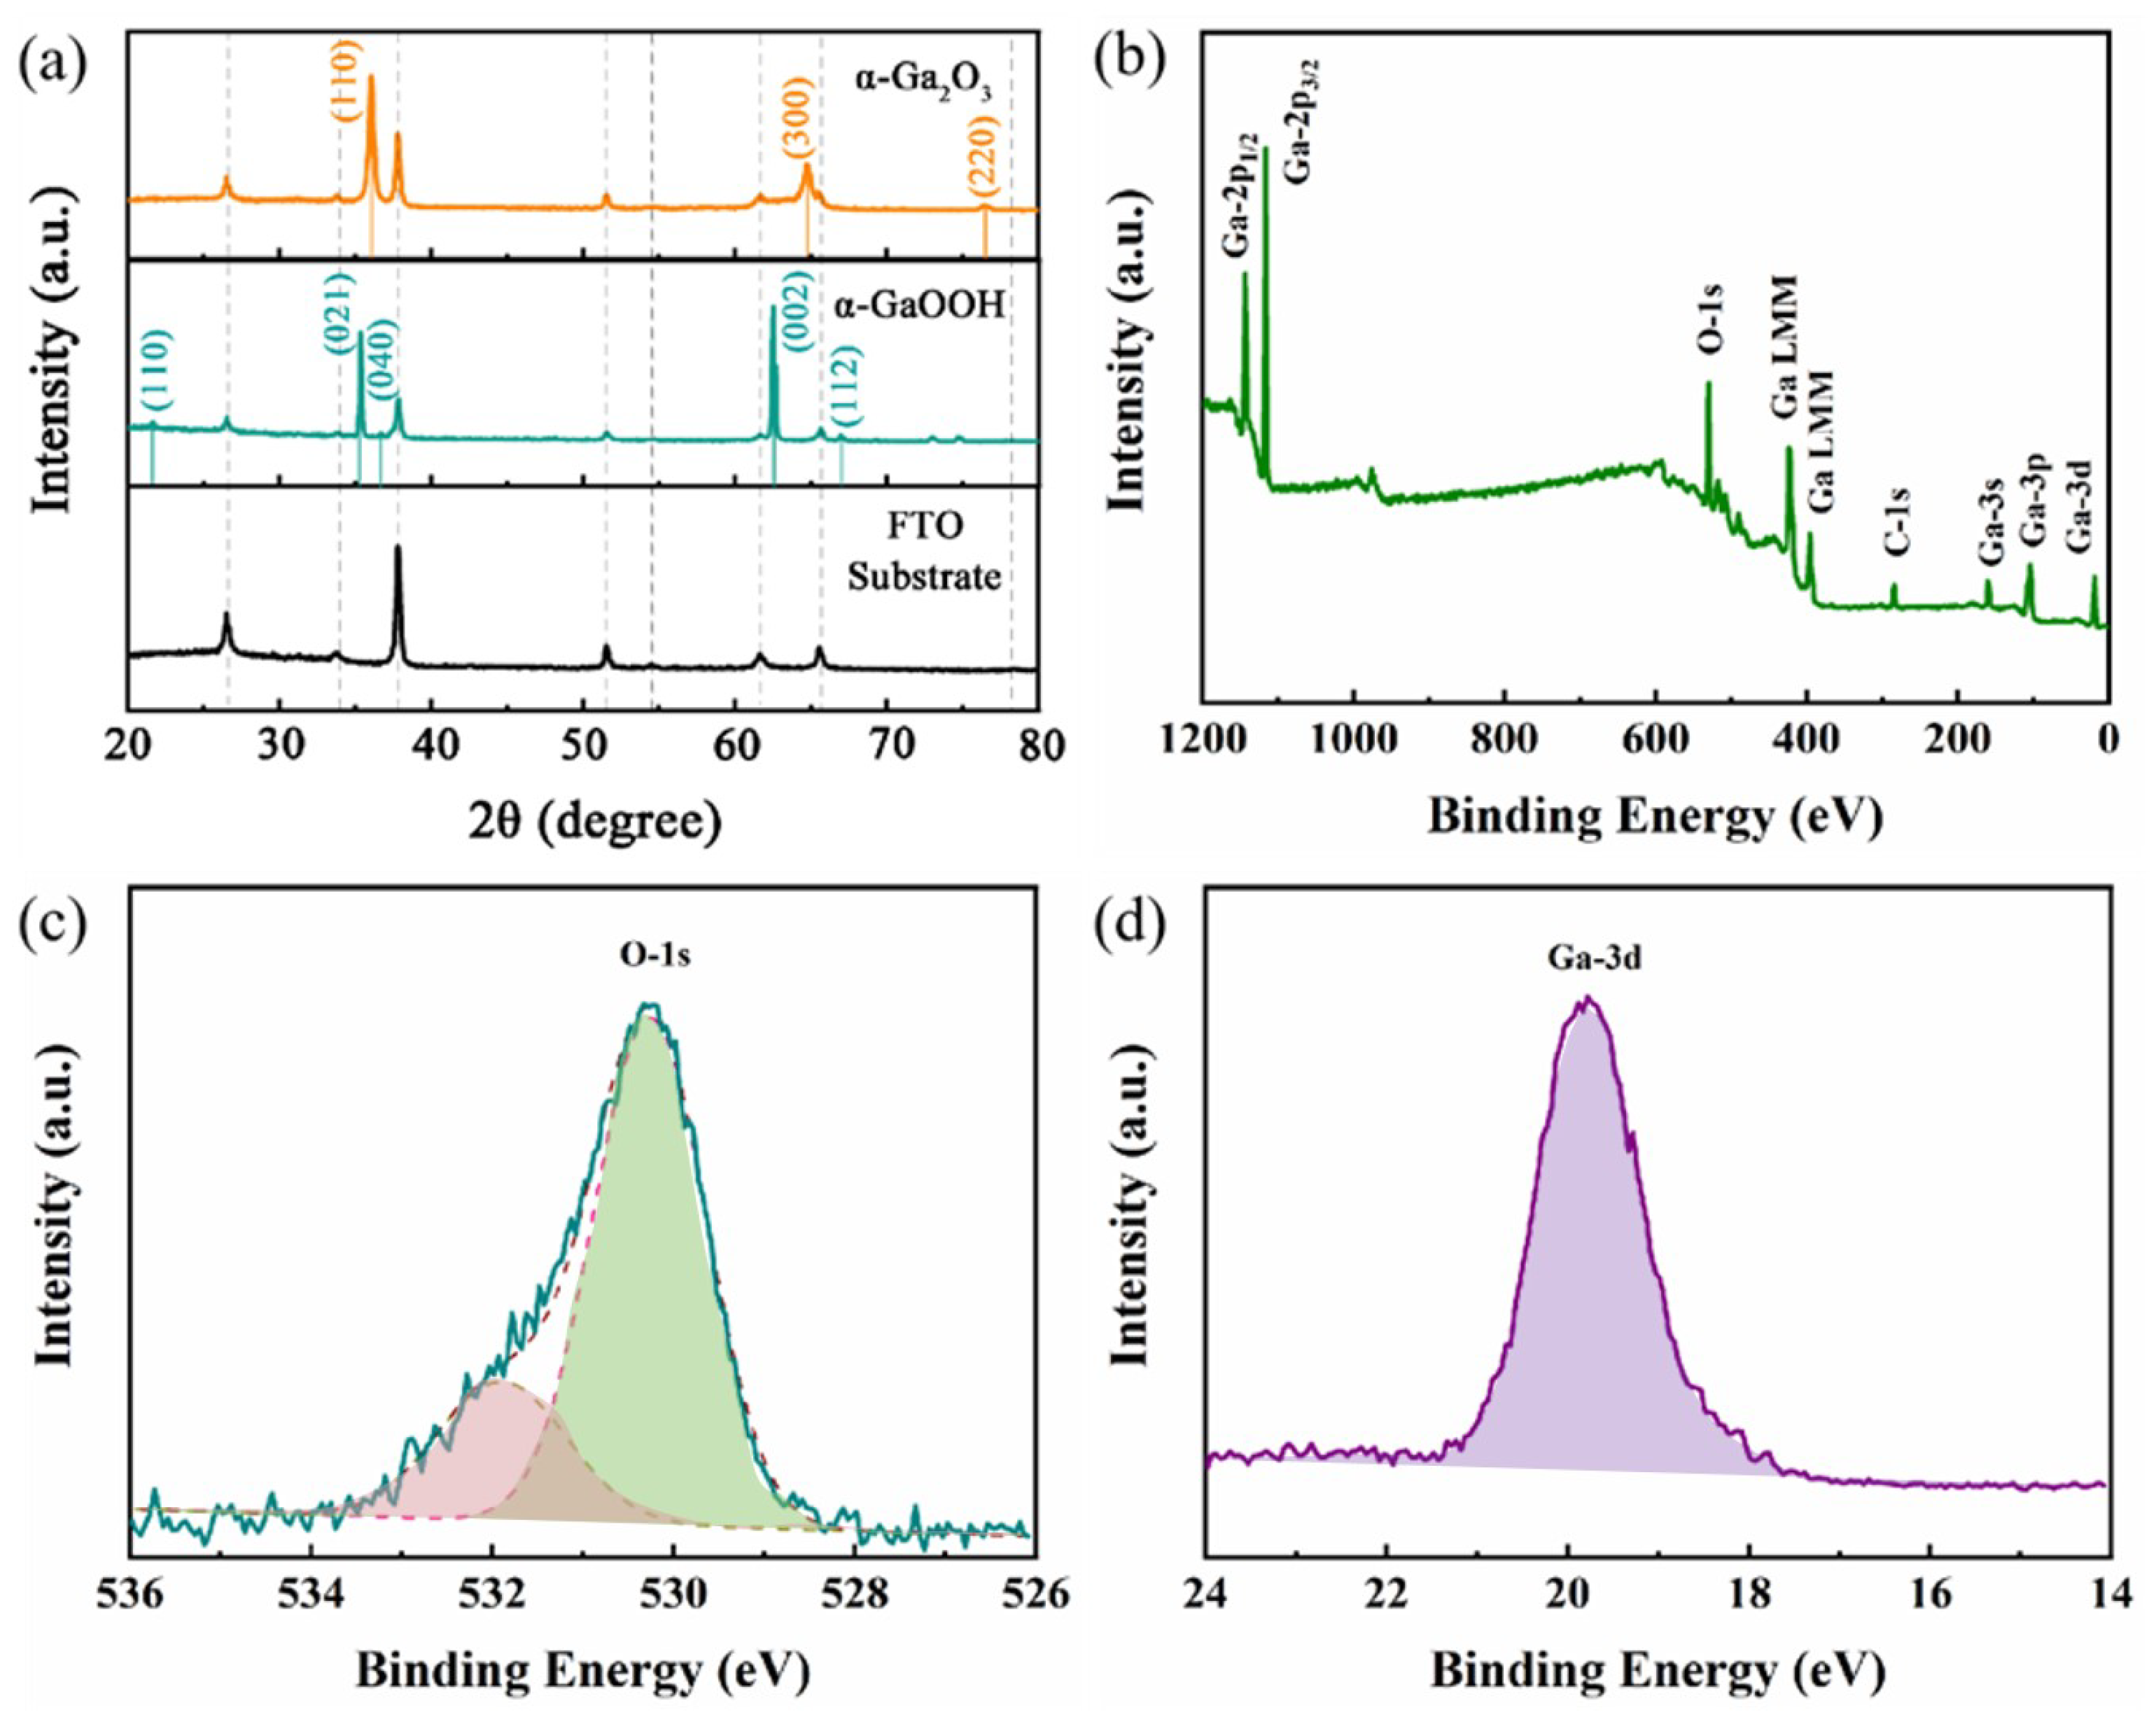
Figure 2a shows the XRD patterns of the FTO substrate, intermediate product GaOOH, and α -Ga2O3 nanorods. Regarding the intermediate product GaOOH, five distinctive peaks were observed at approximately 21.5°, 35.3°, 36.6°, 62.4°, and 66.8°. The distinct peaks corresponded to the (110), (021), (040), (002), and (112) planes of α -GaOOH, as indexed with the JCPDS card no. 54-0910. The noticeable shift in the positions of the XRD peaks confirmed that a phase transformation from α -GaOOH to α -Ga2O3 indeed occurred during the annealing process. The XRD pattern of α -Ga2O3 displayed a primary sharp peak at approximately 36.0°, which was complemented by two subsidiary peaks at 64.7° and 76.4°. These peaks were associated with the (110), (300), and (220) planes of the trigonal system of α -Ga2O3 (JCPDS card no. 06-0503), respectively. This observation suggests that the synthesized α -Ga2O3 exhibited superior crystallinity and predominantly grew in a direction perpendicular to the (110) plane [13]. The X-ray photoelectron spectroscopy (XPS) patterns of the as-grown α -Ga2O3 are presented in Figure 2b–d. The survey pattern of α -Ga2O3, as depicted in Figure 2b, reveals the presence of only gallium (Ga) and oxygen (O), thereby confirming the high purity of the as-grown α -Ga2O3. The principle peak in Figure 2c can be attributed to the Ga 3d from α -Ga2O3 at a binding energy of 20.2 eV [14]. The O 1s core level spectrum of α -Ga2O3, as shown in Figure 2d, was deconvoluted into two distinct components. The dominant peak, observed at 530.8 eV, is characteristic of Ga–O bonds, and signified the fully oxidized state of gallium within the α -Ga2O3 structure. This peak was a clear indication of the material’s intrinsic bonding configuration. The minor shoulder at 532.1 eV was likely associated with ionization from weakly adsorbed surface species, which may have arose from interactions with the ambient atmosphere [15,16].
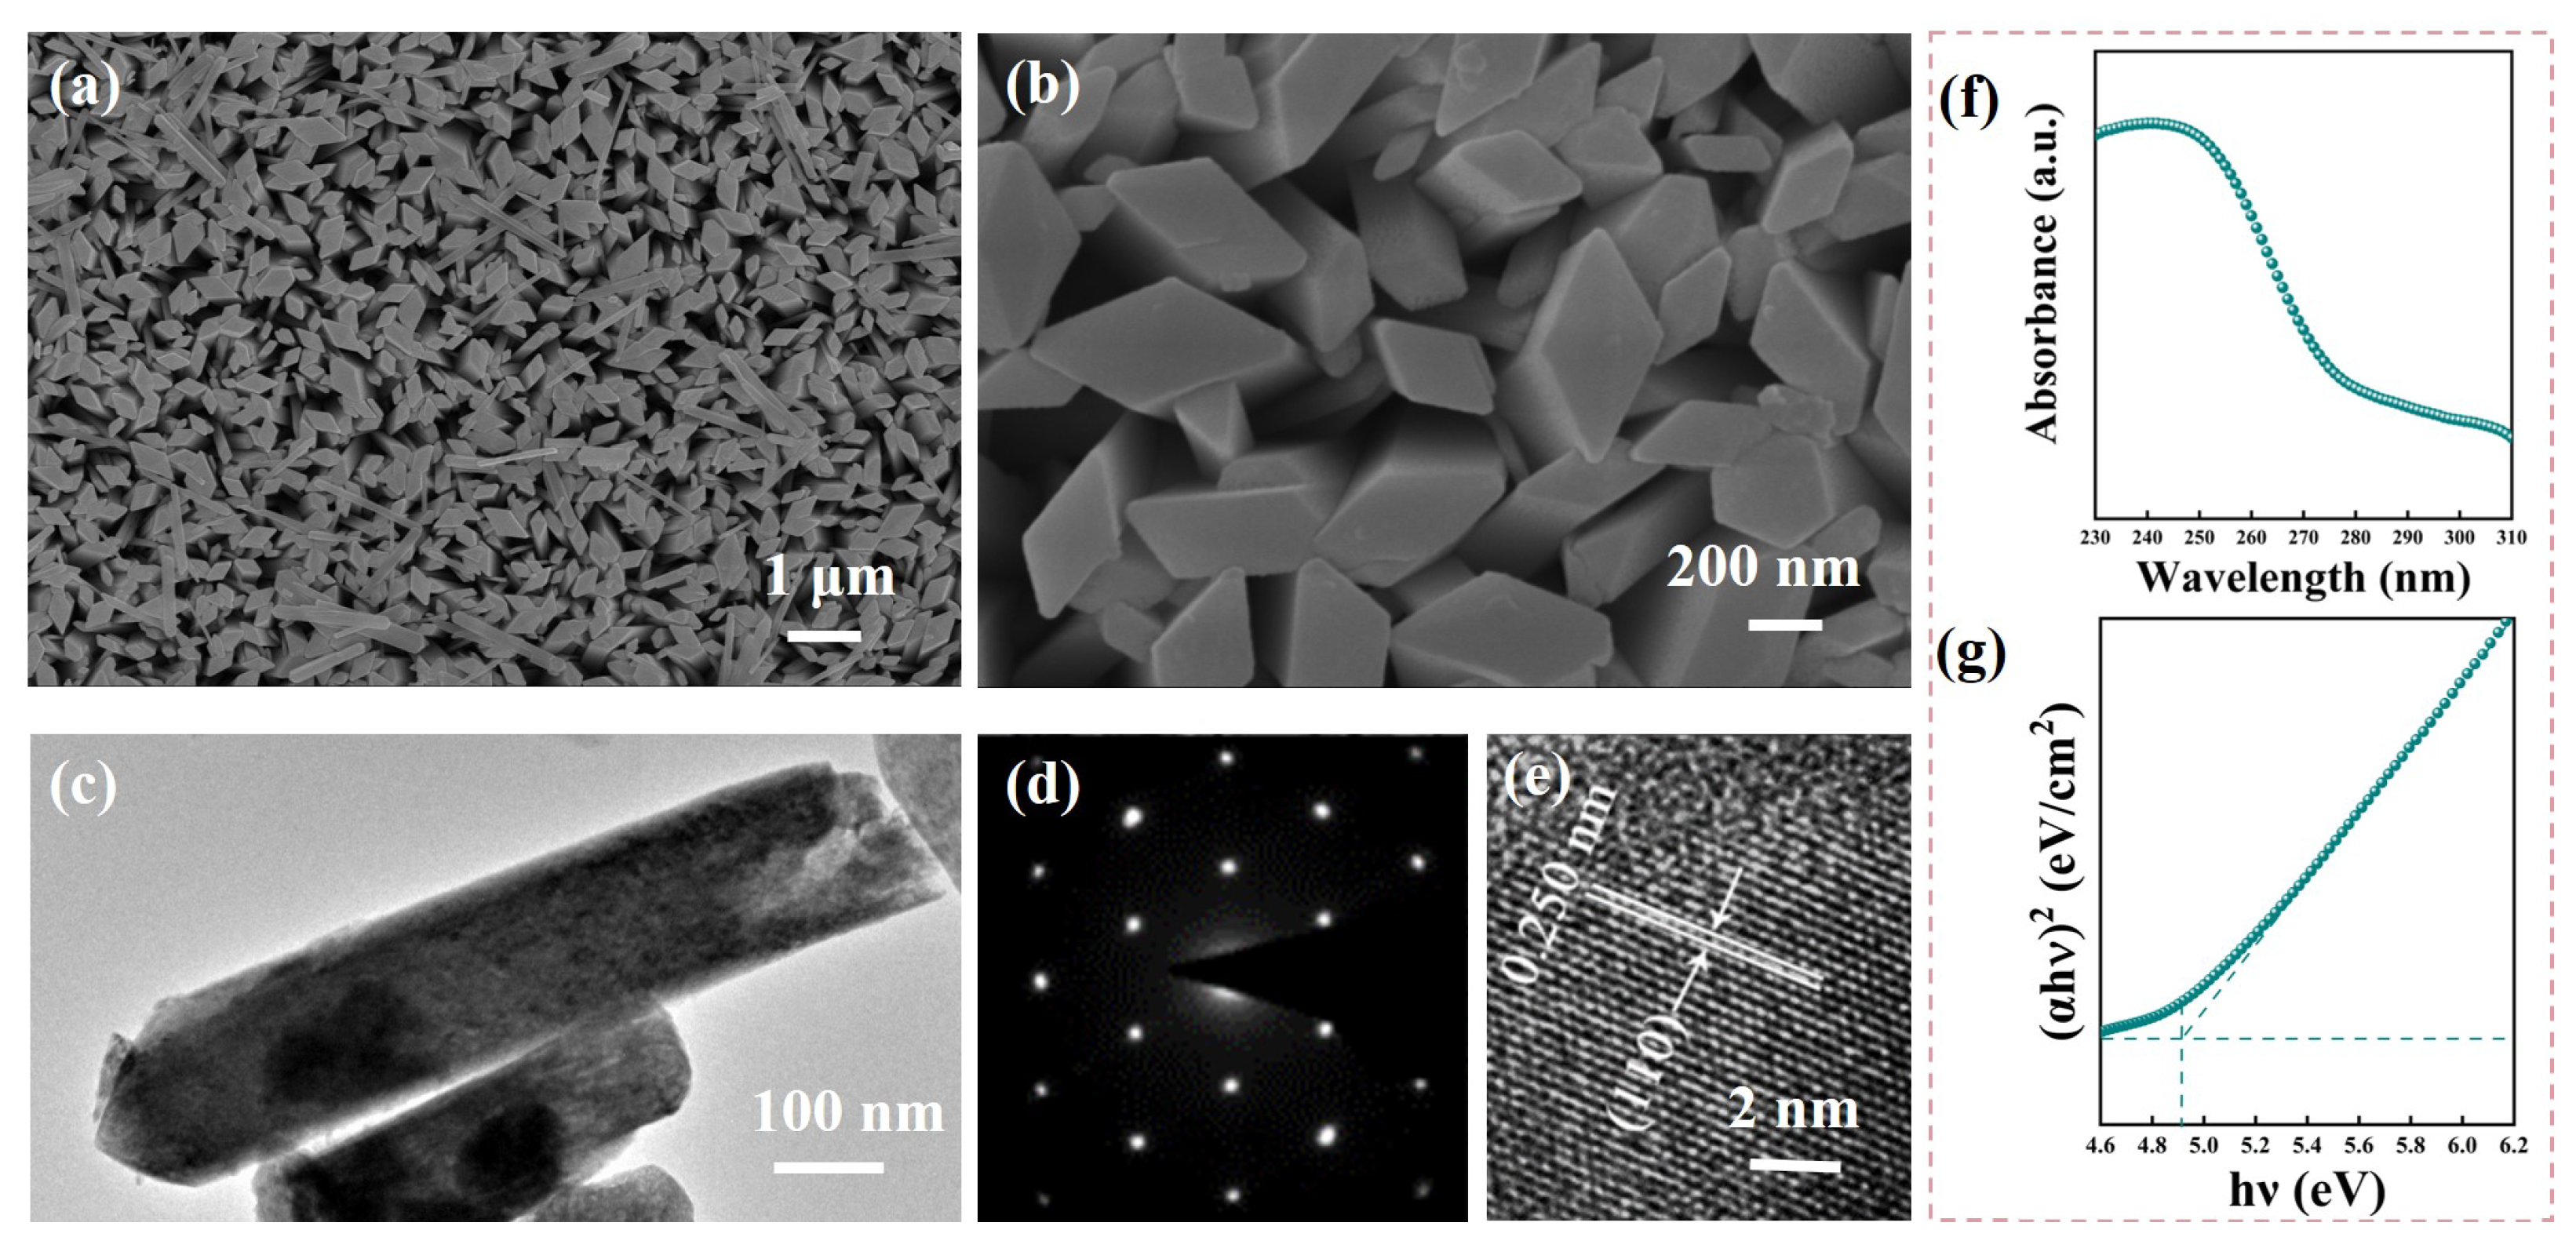
The scanning electron microscopy (SEM) images clearly show an array of α -Ga2O3 nanorods on the FTO substrate, as depicted in Figure 3a and the magnified view in Figure 3b. It is evident that the α -Ga2O3 nanorods grew vertically on the FTO substrate with a high density. Each nanorod had a characteristic rhombohedral cross-section, with an average side length that varied from 200 to 300 nm, as shown in Figure 3b. The transmission electron microscopy (TEM) image further elucidates the structure of the α -Ga2O3 nanorods in Figure 3c. The rough surface of the nanorods was likely due to the variations in density that occurred during the dehydration process when converting from α -GaOOH to α -Ga2O3. The selected area electron diffraction (SAED) pattern shown in Figure 3d confirmed that the prepared α -Ga2O3 nanorods were indeed single crystals. The high-resolution transmission electron microscopy (HR-TEM) image, as shown in Figure 3e, revealed a lattice spacing of 0.250 nm, which corresponded to the (110) plane of the trigonal system of α -Ga2O3 [13]. Figure 3f demonstrates that the α -Ga2O3 nanorod array exhibited significant light absorption in the ultraviolet region, which reached a maximum at 250 nm. To determine the optical bandgap of the α -Ga2O3 nanorod array, the following equation could be employed:
( α h ν ) 2 = A ( h ν E g ) ,
where α , h ν , and A in this equation present the optical absorption coefficient, photon energy, and constant, respectively. The optical bandgap ( E g ) of the α -Ga2O3 nanorod array was determined through a methodical approach that involved the linear extrapolation to the h ν -axis. The graphical representation of this analysis is captured in Figure 3g, where the curve of ( α h ν ) 2 is plotted against h ν . By applying this technique, the bandgap of the α -Ga2O3 nanorod array was deduced to be approximately 4.93 eV.
In a PEC photodetector, the presence of the redox couple in the solution alters the distribution of charge carriers within α -Ga2O3, creating a space charge region and inducing upward band bending [17]. When ultraviolet light with wavelengths shorter than 300 nm traverses high-transparency quartz and is absorbed by α -Ga2O3 nanorods, electron–hole pairs are produced by photons with energies that exceed the bandgap of α -Ga2O3. The built-in electric field at the interface of α -Ga2O3 and the electrolyte acts as a driving force to separate these photogenerated electron–hole pairs [15,18,19]. The separated electrons are collected by FTO along the α -Ga2O3 nanorods and are channeled into the external circuit, while the photogenerated holes migrate toward the α -Ga2O3 electrolyte interface. Here, the holes ( h + ) that reach the interface are captured by active ions from the electrolyte and engage in a redox reaction to form the redox molecule. The redox molecule, which is propelled by a concentration gradient, migrates to the surface of the Pt electrode, where it recombines with electrons ( e ) that have re-entered from the external circuit, and then undergoes another redox reaction before being reduced back to ions, as shown in Equations (2) and (3) [20,21]. This sequence of reactions completes the circuit, enabling the PEC device to operate in a self-powered mode [22,23], as depicted in Figure 4a.
h + + OH OH * ,
e + OH * OH ,
Electrolytes can be classified into categories that include aqueous electrolytes, organic liquid electrolytes, and solid-state gel electrolytes. Aqueous electrolyte attributes mean they are considered as one of the safest, most stable, and eco-friendly electrolytes, and thus, are deemed more appropriate for PEC UV detectors. This study conducted a comparative analysis of the photoelectric detection capabilities of α -Ga2O3-based PEC detectors using different aqueous solutions as electrolytes. Furthermore, it explored the influence of various electrolytes on the surface morphology of α -Ga2O3 nanoarrays.
PEC-type ultraviolet photodetectors were fabricated using different electrolytes, including a 0.1 M solution of the strong alkali sodium hydroxide (NaOH), a 0.1 M solution of sodium carbonate (Na2CO3), and a 0.1 M solution of sodium sulfate (Na2SO4) as electrolytes, with pure water (H2O) as the control electrolyte. The performances of these detectors were then characterized by I–t curves. Figure 4b–e illustrate the I–t curves for the detectors prepared with electrolytes of identical concentration but varying compositions under exposure to 254 nm ultraviolet light at power densities ranging from 2 to 5 mW/cm2.
Notably, regardless of the light power density, the photocurrent generated by devices that employ ionic solutions as electrolytes significantly outperformed that of devices with pure water (H2O) as the electrolyte. This enhanced photocurrent was likely due to the high concentration of mobile ions in the ionic solutions, which not only boosted the electrolyte’s conductivity but also expedited the separation of electron–hole pairs, thereby enhancing the overall efficiency of the photoelectric conversion process. Figure 4b–e indicate that regardless of the type of electrolyte used in the photodetectors, the photocurrent increased as the light power increased. In particular, photodetectors with Na2CO3 as the electrolyte exhibited a significantly elevated photocurrent compared with those that used other electrolytes. Conversely, there was little to no significant difference in the photocurrent between detectors that employed NaOH or Na2SO4 as the electrolyte. Sodium hydroxide (NaOH), which is renowned for its strong alkalinity, is a commonly used electrolyte solution, while sodium carbonate (Na2CO3) is a salt formed from a strong base and a weak acid. They are both adept at providing a generous amount of hydroxide ions (OH), which are crucial for promoting vigorous redox reactions that involve electrons and holes. Considering the corrosive impact that strong acids and alkalis can have on metal oxide materials, it is important to recognize that these substances can intensify surface imperfections. This, in turn, can lead to a degradation in the performance and sensitivity of photoelectrochemical (PEC) ultraviolet detectors.
To illustrate the impact of the different electrolytes on the performance of the detectors, long-term irradiation and I–t tests were conducted on the detectors with various electrolytes. Figure 5a reveals that the photodetectors that employed H2O as the electrolyte exhibited a gradual decline in photocurrent as the duration of testing time increased. Conversely, the photodetectors with electrolytes that initially demonstrated higher photocurrents, such as Na2CO3 and NaOH, experienced fluctuations in the photocurrent, suggesting a propensity for instability. However, the detectors with the Na2SO4 electrolyte displayed a very stable photocurrent. To further analyze the reasons for these phenomena, detectors were prepared with a 0.1 M Na2SO4 solution, Na2CO3 solution, or NaOH solution as electrolytes. After the electrolytes were injected, the devices were left to stand for 3 h before being disassembled. The SEM images obtained are shown in Figure 5, where Figure 5e is the blank sample without electrolyte injection, and Figure 5f–h correspond to the samples extracted from the devices after 3 h of exposure to the Na2SO4, Na2CO3, and NaOH solutions, respectively.
From the SEM images in Figure 5e,f, the Na2SO4 electrolyte had no effect on the morphology of the α -Ga2O3 nanoarrays. There were small particles on the top of the nanorods after 3 h of the Na2CO3 treament, as shown in Figure 5g. Much more particles and small nanorods were observed on the top of the α -Ga2O3 nanoarrays for the NaOH-electrolyte-treated sample, as depicted in Figure 5h, which is the reason for the unstable photocurrent of those detectors. The changes on the surface of the α -Ga2O3 nanoarrays also modulated the transport of charge carriers at the interface between the α -Ga2O3 nanoarrays and the electrolyte, which affected the redox reactions, as illustrated in Equations (2) and (3). Taking into account the previous analysis, due to the fact that the Na2SO4 electrolyte had no adverse effects on the α -Ga2O3 nanorods and the PEC detector fabricated demonstrated a stable photocurrent, the Na2SO4 aqueous solution was chosen as the optimal electrolyte for the PEC detectors.
The detailed photoelectric response performance of the PEC photodetector using Na2SO4 as the electrolyte was analyzed. The responsivity (R) of the photodetector could be calculated by this equation:
R = I p h I d a r k P · S ,
where I p h and I d a r k are the photocurrent and dark current, respectively. P represents the irradiance power density and S is the active area of the photodetector.
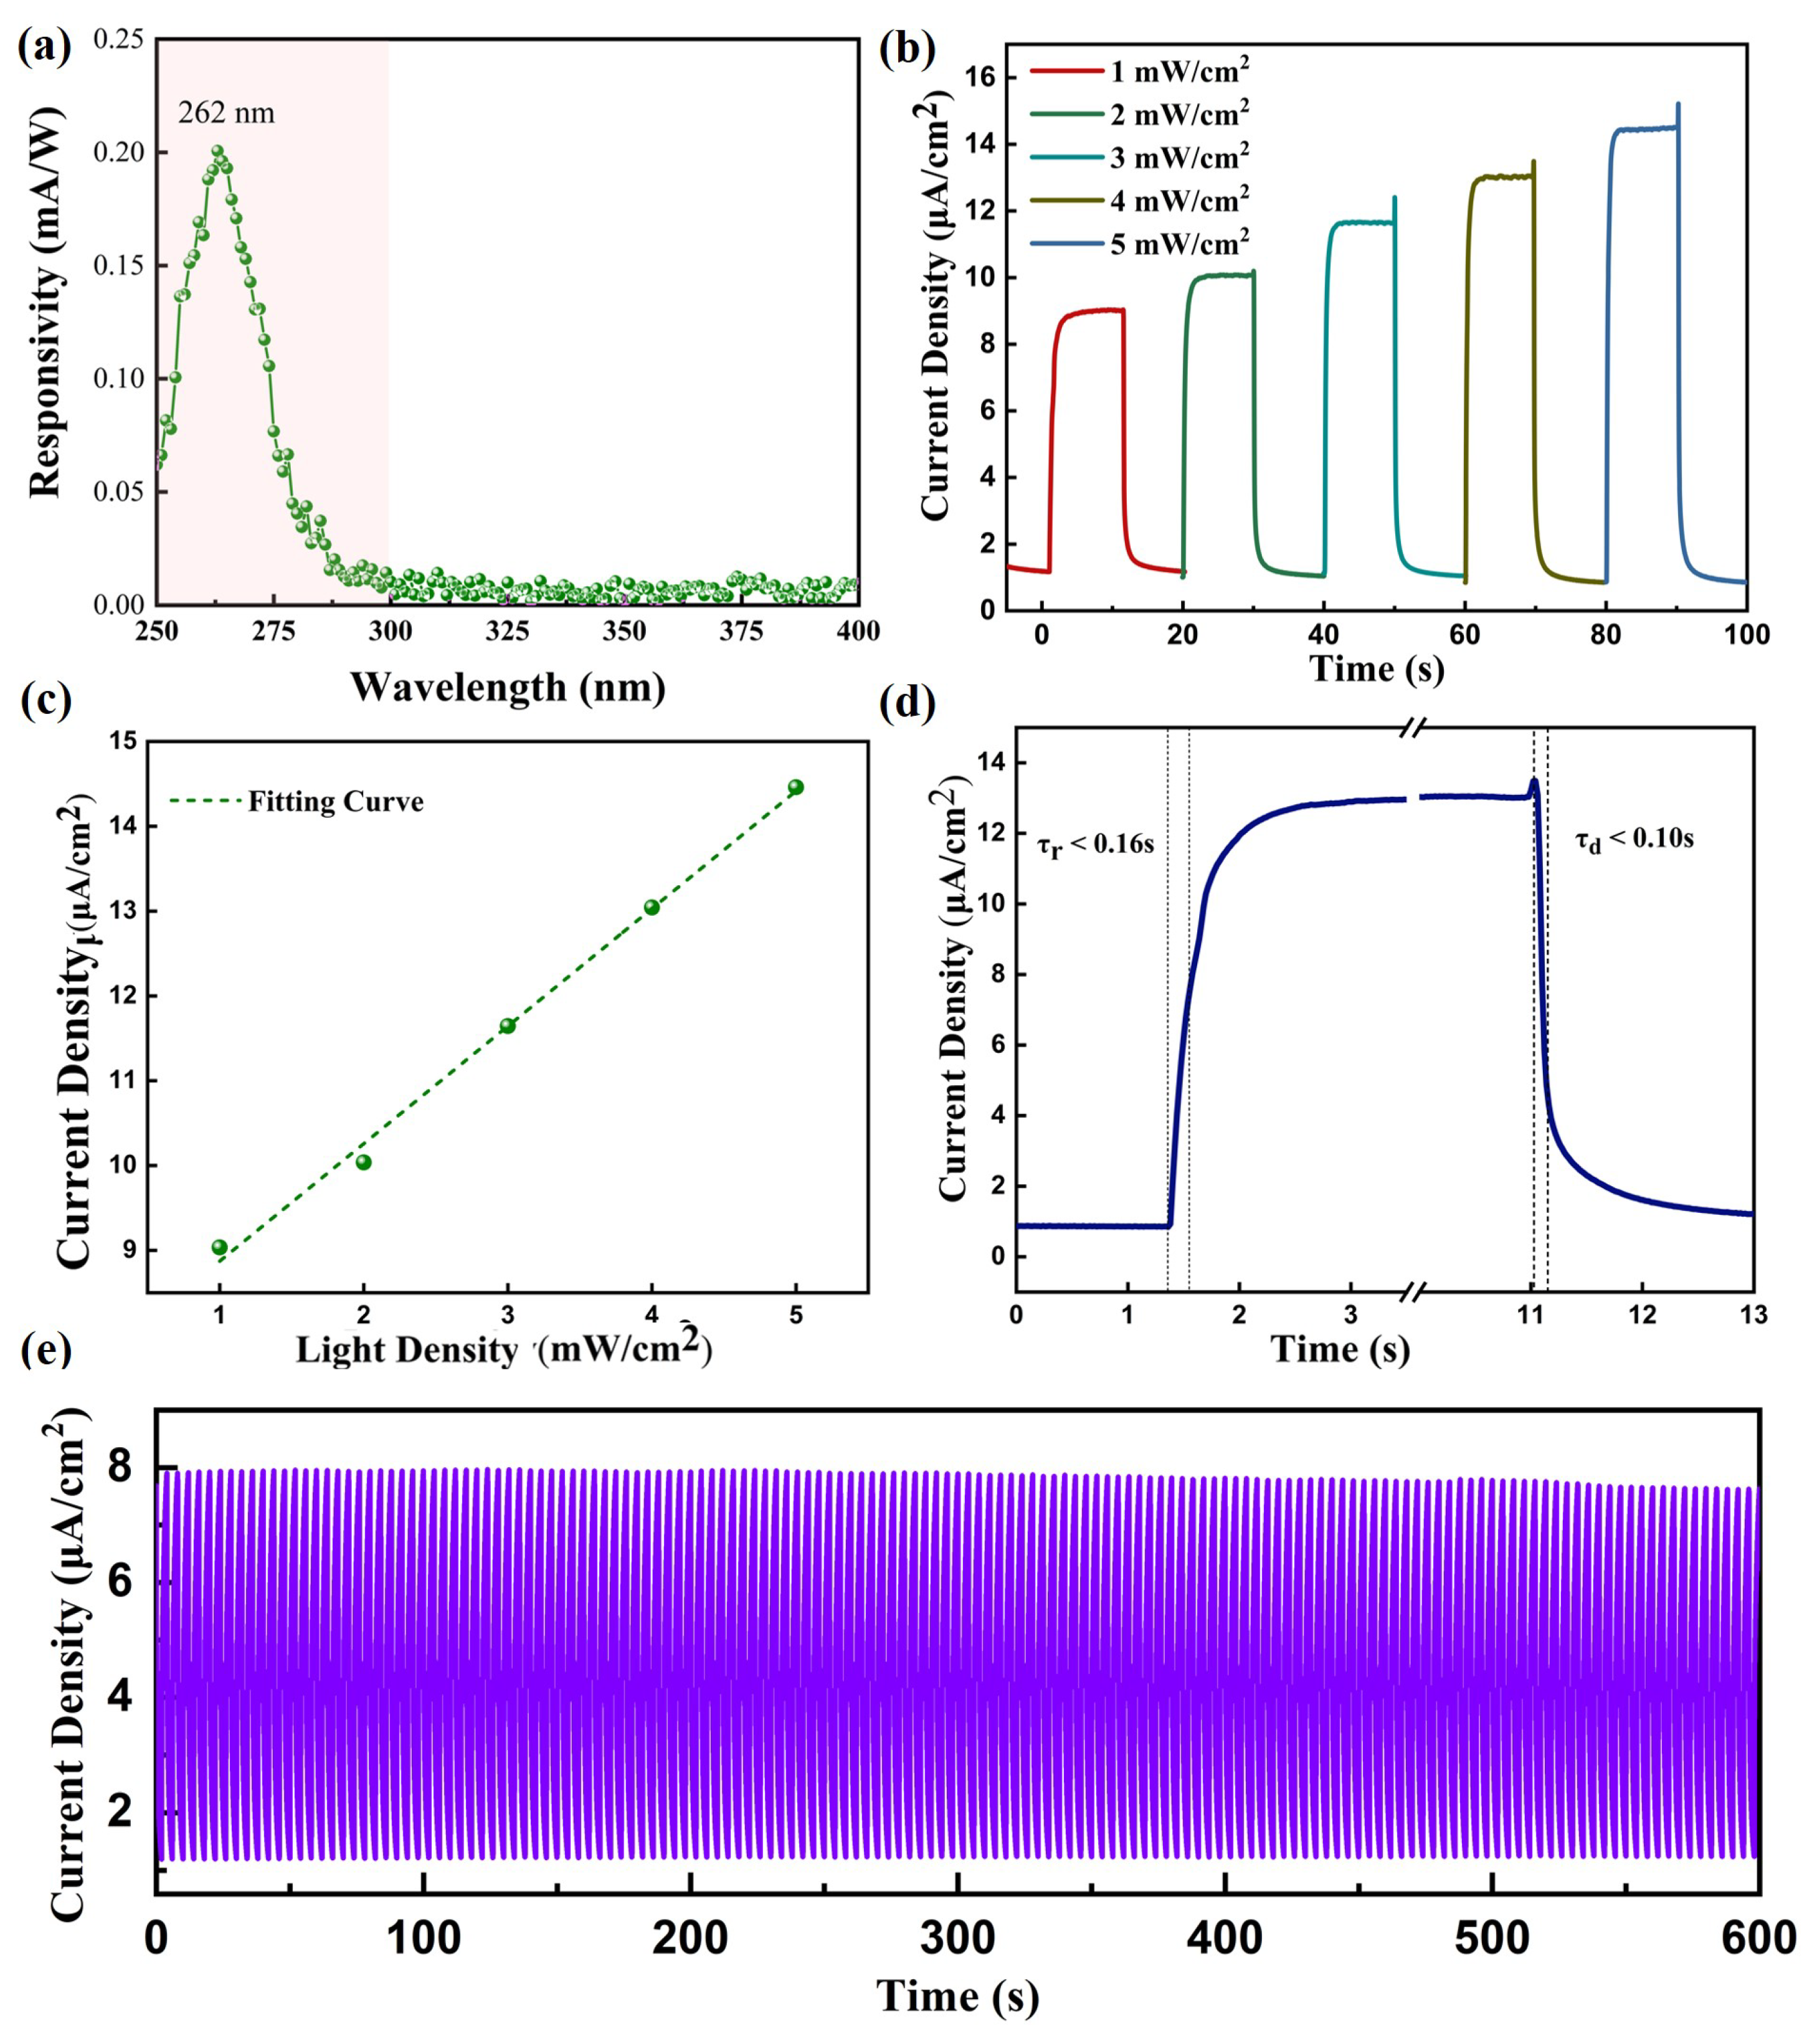
Figure 6a reveals that the peak response occurred at 262 nm with a maximum responsivity of approximately 0.2 mA/W. Figure 6b shows the I–t curve of the α -Ga2O3 PEC UV detector at zero bias as the light power density increased from 1 mW/cm2 to 5 mW/cm2. It can be seen that as the light power increased, the photocurrent density of the detector also increased. A linear fit for the photo power density–photocurrent density relationship at zero bias is shown in Figure 6c, indicating that the device exhibited excellent linear detection characteristics for solar-blind UV light signals, thereby showing it was capable of accurately measuring the magnitude of solar-blind UV light power, which is of significant practical importance. Figure 6d presents the rise and fall times of the photocurrent for the α -Ga2O3 PEC UV detector. The rise time ( τ r ) is defined as the time taken for the photocurrent to increase from its minimum to 1−1/e (approximately 63.2%) of its maximum value, with τ r being less than 0.16 s. The fall time ( τ d ) is defined as the time taken for the photocurrent to decrease to 1/e (approximately 36.8%) of its maximum value from the peak, with τ d being less than 0.10 s. It is evident that the improved PEC device possessed a rapid response speed, which meets the requirements for “sensitive detection.” Figure 6e depicts the stability of the α -Ga2O3-nanorod-based PEC UV detector with a Na2SO4 electrolyte under illumination with 262 nm UV light at a power of 3 mW/cm², without the application of an external bias. It was observed that under rapid switching conditions, the detector could still respond quickly to UV light, and after more than 120 cycles of repetition, the photocurrent density showed almost no fluctuation or degradation. This once again confirmed the detector’s exceptional stability and repeatability, thus allowing for long-term reuse.
For a more comprehensive comparison, the performance parameters of the PEC photodetectors presented in this paper, as well as those of recent PEC photodetectors based on α -Ga2O3, are listed in Table 1. The results not only show a good performance but also highlight the advantages, particularly in terms of the response time and the ratio of the photocurrent to dark current. The PEC detectors based on α -Ga2O3 with an appropriate electrolyte could achieve outstanding detection capabilities in the solar-blind ultraviolet spectrum.

4. Conclusions

This research investigated the impact of various electrolytes on the photoelectric detection capabilities of α -Ga2O3 nanorods. The I–t curves demonstrated that the PEC detector with Na2CO3 electrolyte initially exhibited higher photocurrent levels. However, as the test duration increased, the photocurrent became unstable and experienced a gradual decline. A similar trend was observed with the PEC detector with the NaOH electrolyte. In contrast, the detector with the Na2SO4 electrolyte maintained consistent detection capabilities throughout the test. The SEM characterization of samples from the disassembly of the PEC detectors revealed that the morphology of the α -Ga2O3 nanorods was significantly altered due to the effects of Na2CO3 and NaOH, which was likely a consequence of the corrosive action of the highly alkaline solution or the strong base–weak acid salt, which led to fluctuations in the photocurrent. After a comprehensive evaluation, sodium sulfate was chosen as the electrolyte for the PEC detectors and the response performance of the PEC detector was investigated. The photodetector with Na2SO4 as the electrolyte showed a maximum responsivity of 0.2 mA/W and at 262 nm with a light intensity of 3.0 mW/cm2, and it exhibited rise and decay times of 0.16 s and 0.10 s, respectively.

Author Contributions

Conceptualization, S.J.; methodology, Y.Z., J.S. and X.Z.; validation, D.W.; writing—original draft preparation, J.H. and C.T.; writing—review and editing, Y.Z. and S.J.; supervision, S.J.; project administration, S.J. and J.W. All authors read and agreed to the published version of this manuscript.

Funding

This research was funded by the National Key R&D Program of China (2019YFA0705201) and National Natural Science Foundation of China (grant no. 62174042).

Institutional Review Board Statement

Not applicable.

Informed Consent Statement

Not applicable.

Data Availability Statement

The raw data supporting the conclusions of this article will be made available by the authors on request.

Conflicts of Interest

The authors declare no conflicts of interest.

References

  1. Goswami, L.; Aggarwal, N.; Vashishtha, P.; Jain, S.K.; Nirantar, S.; Ahmed, J.; Khan, M.A.M.; Pandey, R.; Gupta, G. Fabrication of GaN nano-towers based self-powered UV photodetector. Sci. Rep. 2021, 11, 10859. [Google Scholar] [CrossRef] [PubMed]
  2. Kumar, V.; Maan, A.S.; Akhtar, J. Barrier height inhomogeneities induced anomaly in thermal sensitivity of Ni/4H-SiC Schottky diode temperature sensor. J. Vac. Sci. Technol. B 2014, 32, 041203. [Google Scholar] [CrossRef]
  3. Kumar, V.; Kaminski, N.; Maan, A.S.; Akhtar, J. Capacitance roll-off and frequency-dispersion capacitance–conductance phenomena in field plate and guard ring edge-terminated Ni/SiO2/4H-n-SiC Schottky barrier diodes. Phys. Status Solidi A 2016, 213, 193–202. [Google Scholar] [CrossRef]
  4. Nie, Y.; Jiao, S.; Yang, S.; Jing, J.; Zhang, S.; Shi, Z.; Lu, H.; Wang, D.; Gao, S.; Wang, X.; et al. The excellent performance of β-Ga2O3 Schottky photodiode under forward bias and its application in solar-blind ultraviolet communication. Mater. Today Phys. 2023, 33, 101032. [Google Scholar] [CrossRef]
  5. Zhang, J.; Jiao, S.; Wang, D.; Ni, S.; Gao, S.; Wang, J. Solar-blind ultraviolet photodetection of an α–Ga2O3 nanorod array based on photoelectrochemical self-powered detectors with a simple, newly-designed structure. J. Mater. Chem. C 2019, 7, 6867–6871. [Google Scholar] [CrossRef]
  6. Oh, S.; Kim, C.K.; Kim, J. High Responsivity β-Ga2O3 Metal-Semiconductor-Metal Solar-Blind Photodetectors with Ultraviolet Transparent Graphene Electrodes. ACS Photonics 2018, 5, 1123–1128. [Google Scholar] [CrossRef]
  7. Xu, Y.; An, Z.; Zhang, L.; Feng, Q.; Zhang, J.; Zhang, C.; Hao, Y. Solar blind deep ultraviolet β-Ga2O3 photodetectors grown on sapphire by the Mist-CVD method. Opt. Mater. Express 2018, 8, 2941–2947. [Google Scholar] [CrossRef]
  8. Vigil, E.; Peter, L.M.; Forcade, F.; Jennings, J.R.; Gonzalez, B.; Wang, H.; Curbelo, L.; Dunn, H. An ultraviolet selective photodetector based on a nanocrystalline TiO2 photoelectrochemical cell. Sensors Actuators Phys. 2011, 171, 87–92. [Google Scholar] [CrossRef]
  9. Zhang, M.; Wang, Y.; Teng, F.; Chen, L.; Li, J.; Zhou, J.; Pan, X.; Xie, E. A photoelectrochemical type self-powered ultraviolet photodetector based on GaN porous films. Mater. Lett. 2016, 162, 117–120. [Google Scholar] [CrossRef]
  10. Yu, C.; Li, H.; Ding, K.; Huang, L.; Zhang, H.; Pang, D.; Xiong, Y.; Yang, P.A.; Fang, L.; Li, W.; et al. Flexible and Self-Powered Photoelectrochemical-Type Solar-Blind Photodetectors Based on Ag Nanowires-Embedded Amorphous Ga2O3 Films. Adv. Opt. Mater. 2024, 12, 2400116. [Google Scholar] [CrossRef]
  11. Gazotti, W.; Girotto, E.; Nogueira, A.; De Paoli, M. Solid-state photoelectrochemical cell using a polythiophene derivative as photoactive electrode. Sol. Energy Mater. Sol. Cells 2001, 69, 315–323. [Google Scholar] [CrossRef]
  12. Ohta, N.; Takada, K.; Sasaki, T.; Watanabe, M. All solid-state photoelectrochemical cell with RbAg4I5 as the electrolyte. Electrochem. Solid State Lett. 2003, 6, A187–A189. [Google Scholar] [CrossRef]
  13. Marezio, M.; Remeika, J.P. Bond Lengths in the α-Ga2O3 Structure and the High-Pressure Phase of Ga2−xFexO3. J. Chem. Phys. 1967, 46, 1862–1865. [Google Scholar] [CrossRef]
  14. Battistoni, C.; Dormann, J.; Fiorani, D.; Paparazzo, E.; Viticoli, S. An XPS and Mössbauer study of the electronic properties of ZnCrxGa2−xO4 spinel solid solutions. Solid State Commun. 1981, 39, 581–585. [Google Scholar] [CrossRef]
  15. Li, Q.; Wei, L.; Xie, Y.; Zhang, K.; Liu, L.; Zhu, D.; Jiao, J.; Chen, Y.; Yan, S.; Liu, G.; et al. ZnO nanoneedle/H2O solid-liquid heterojunction-based self-powered ultraviolet detector. Nanoscale Res. Lett. 2013, 8, 415. [Google Scholar] [CrossRef] [PubMed]
  16. Ramana, C.V.; Rubio, E.J.; Barraza, C.D.; Miranda Gallardo, A.; McPeak, S.; Kotru, S.; Grant, J.T. Chemical bonding, optical constants, and electrical resistivity of sputter-deposited gallium oxide thin films. J. Appl. Phys. 2014, 115, 043508. [Google Scholar] [CrossRef]
  17. He, C.; Guo, D.; Chen, K.; Wang, S.; Shen, J.; Zhao, N.; Liu, A.; Zheng, Y.; Li, P.; Wu, Z.; et al. α-Ga2O3 Nanorod Array-Cu2O Microsphere pin Junctions for Self-Powered Spectrum-Distinguishable Photodetectors. ACS Appl. Nano Mater. 2019, 2, 4095–4103. [Google Scholar] [CrossRef]
  18. Zhou, J.; Chen, L.; Wang, Y.; He, Y.; Pan, X.; Xie, E. An overview on emerging photoelectrochemical self-powered ultraviolet photodetectors. Nanoscale 2016, 8, 50–73. [Google Scholar] [CrossRef] [PubMed]
  19. Zhang, J.; Jiao, S.; Wang, D.; Gao, S.; Wang, J.; Zhao, L. Nano tree-like branched structure with α-Ga2O3 covered by γ-Al2O3 for highly efficient detection of solar-blind ultraviolet light using self-powered photoelectrochemical method. Appl. Surf. Sci. 2021, 541, 148380. [Google Scholar] [CrossRef]
  20. Bai, Z.; Zhang, Y. Self-powered UV-visible photodetectors based on ZnO/Cu2O nanowire/electrolyte heterojunctions. J. Alloy. Compd. 2016, 675, 325–330. [Google Scholar] [CrossRef]
  21. Ni, S.; Guo, F.; Wang, D.; Liu, G.; Xu, Z.; Kong, L.; Wang, J.; Jiao, S.; Zhang, Y.; Yu, Q.; et al. Effect of MgO Surface Modification on the TiO2 Nanowires Electrode for Self-Powered UV Photodetectors. ACS Sustain. Chem. Eng. 2018, 6, 7265–7272. [Google Scholar] [CrossRef]
  22. Qu, Y.; Wu, Z.; Ai, M.; Guo, D.; An, Y.; Yang, H.; Li, L.; Tang, W. Enhanced Ga2O3/SiC ultraviolet photodetector with graphene top electrodes. J. Alloy. Compd. 2016, 680, 247–251. [Google Scholar] [CrossRef]
  23. Zhang, Y.; Jiao, S.; Zhang, J.; Liu, S.; Wang, D.; Gao, S.; Wang, J. Study on the evolution from α-GaOOH to α-Ga2O3 and solar-blind detection behavior of an α-GaOOH/α-Ga2O3 heterojunction. Crystengcomm 2022, 24, 1789–1794. [Google Scholar] [CrossRef]
  24. Zhang, B.; Wu, H.; Feng, C.; Zhang, Z.; Yu, H.; Zhang, C.; Lin, S.; Xu, C.; Bai, H.; Guo, F. Self-Powered Solar-Blind Photodetectors Based on α-Ga2O3 Nanorod Arrays. ACS Appl. Nano Mater. 2022, 5, 11956–11963. [Google Scholar] [CrossRef]
  25. Huang, L.; Hu, Z.; Zhang, H.; Xiong, Y.; Fan, S.; Kong, C.; Li, W.; Ye, L.; Li, H. A simple, repeatable and highly stable self-powered solar-blind photoelectrochemical-type photodetector using amorphous Ga2O3 films grown on 3D carbon fiber paper. J. Mater. Chem. C 2021, 9, 10354–10360. [Google Scholar] [CrossRef]
  26. Chen, K.; Wang, S.; He, C.; Zhu, H.; Zhao, H.; Guo, D.; Chen, Z.; Shen, J.; Li, P.; Liu, A.; et al. Photoelectrochemical Self-Powered Solar-Blind Photodetectors Based on Ga2O3 Nanorod Array/Electrolyte Solid/Liquid Heterojunctions with a Large Separation Interface of Photogenerated Carriers. ACS Appl. Nano Mater. 2019, 2, 6169–6177. [Google Scholar] [CrossRef]
  27. Qu, L.; Ji, J.; Liu, X.; Shao, Z.; Cui, M.; Zhang, Y.; Fu, Z.; Huang, Y.; Yang, G.; Feng, W. Oxygen-vacancy-dependent high-performance α-Ga2O3 nanorods photoelectrochemical deep UV photodetectors. Nanotechnology 2023, 34, 225203. [Google Scholar] [CrossRef]
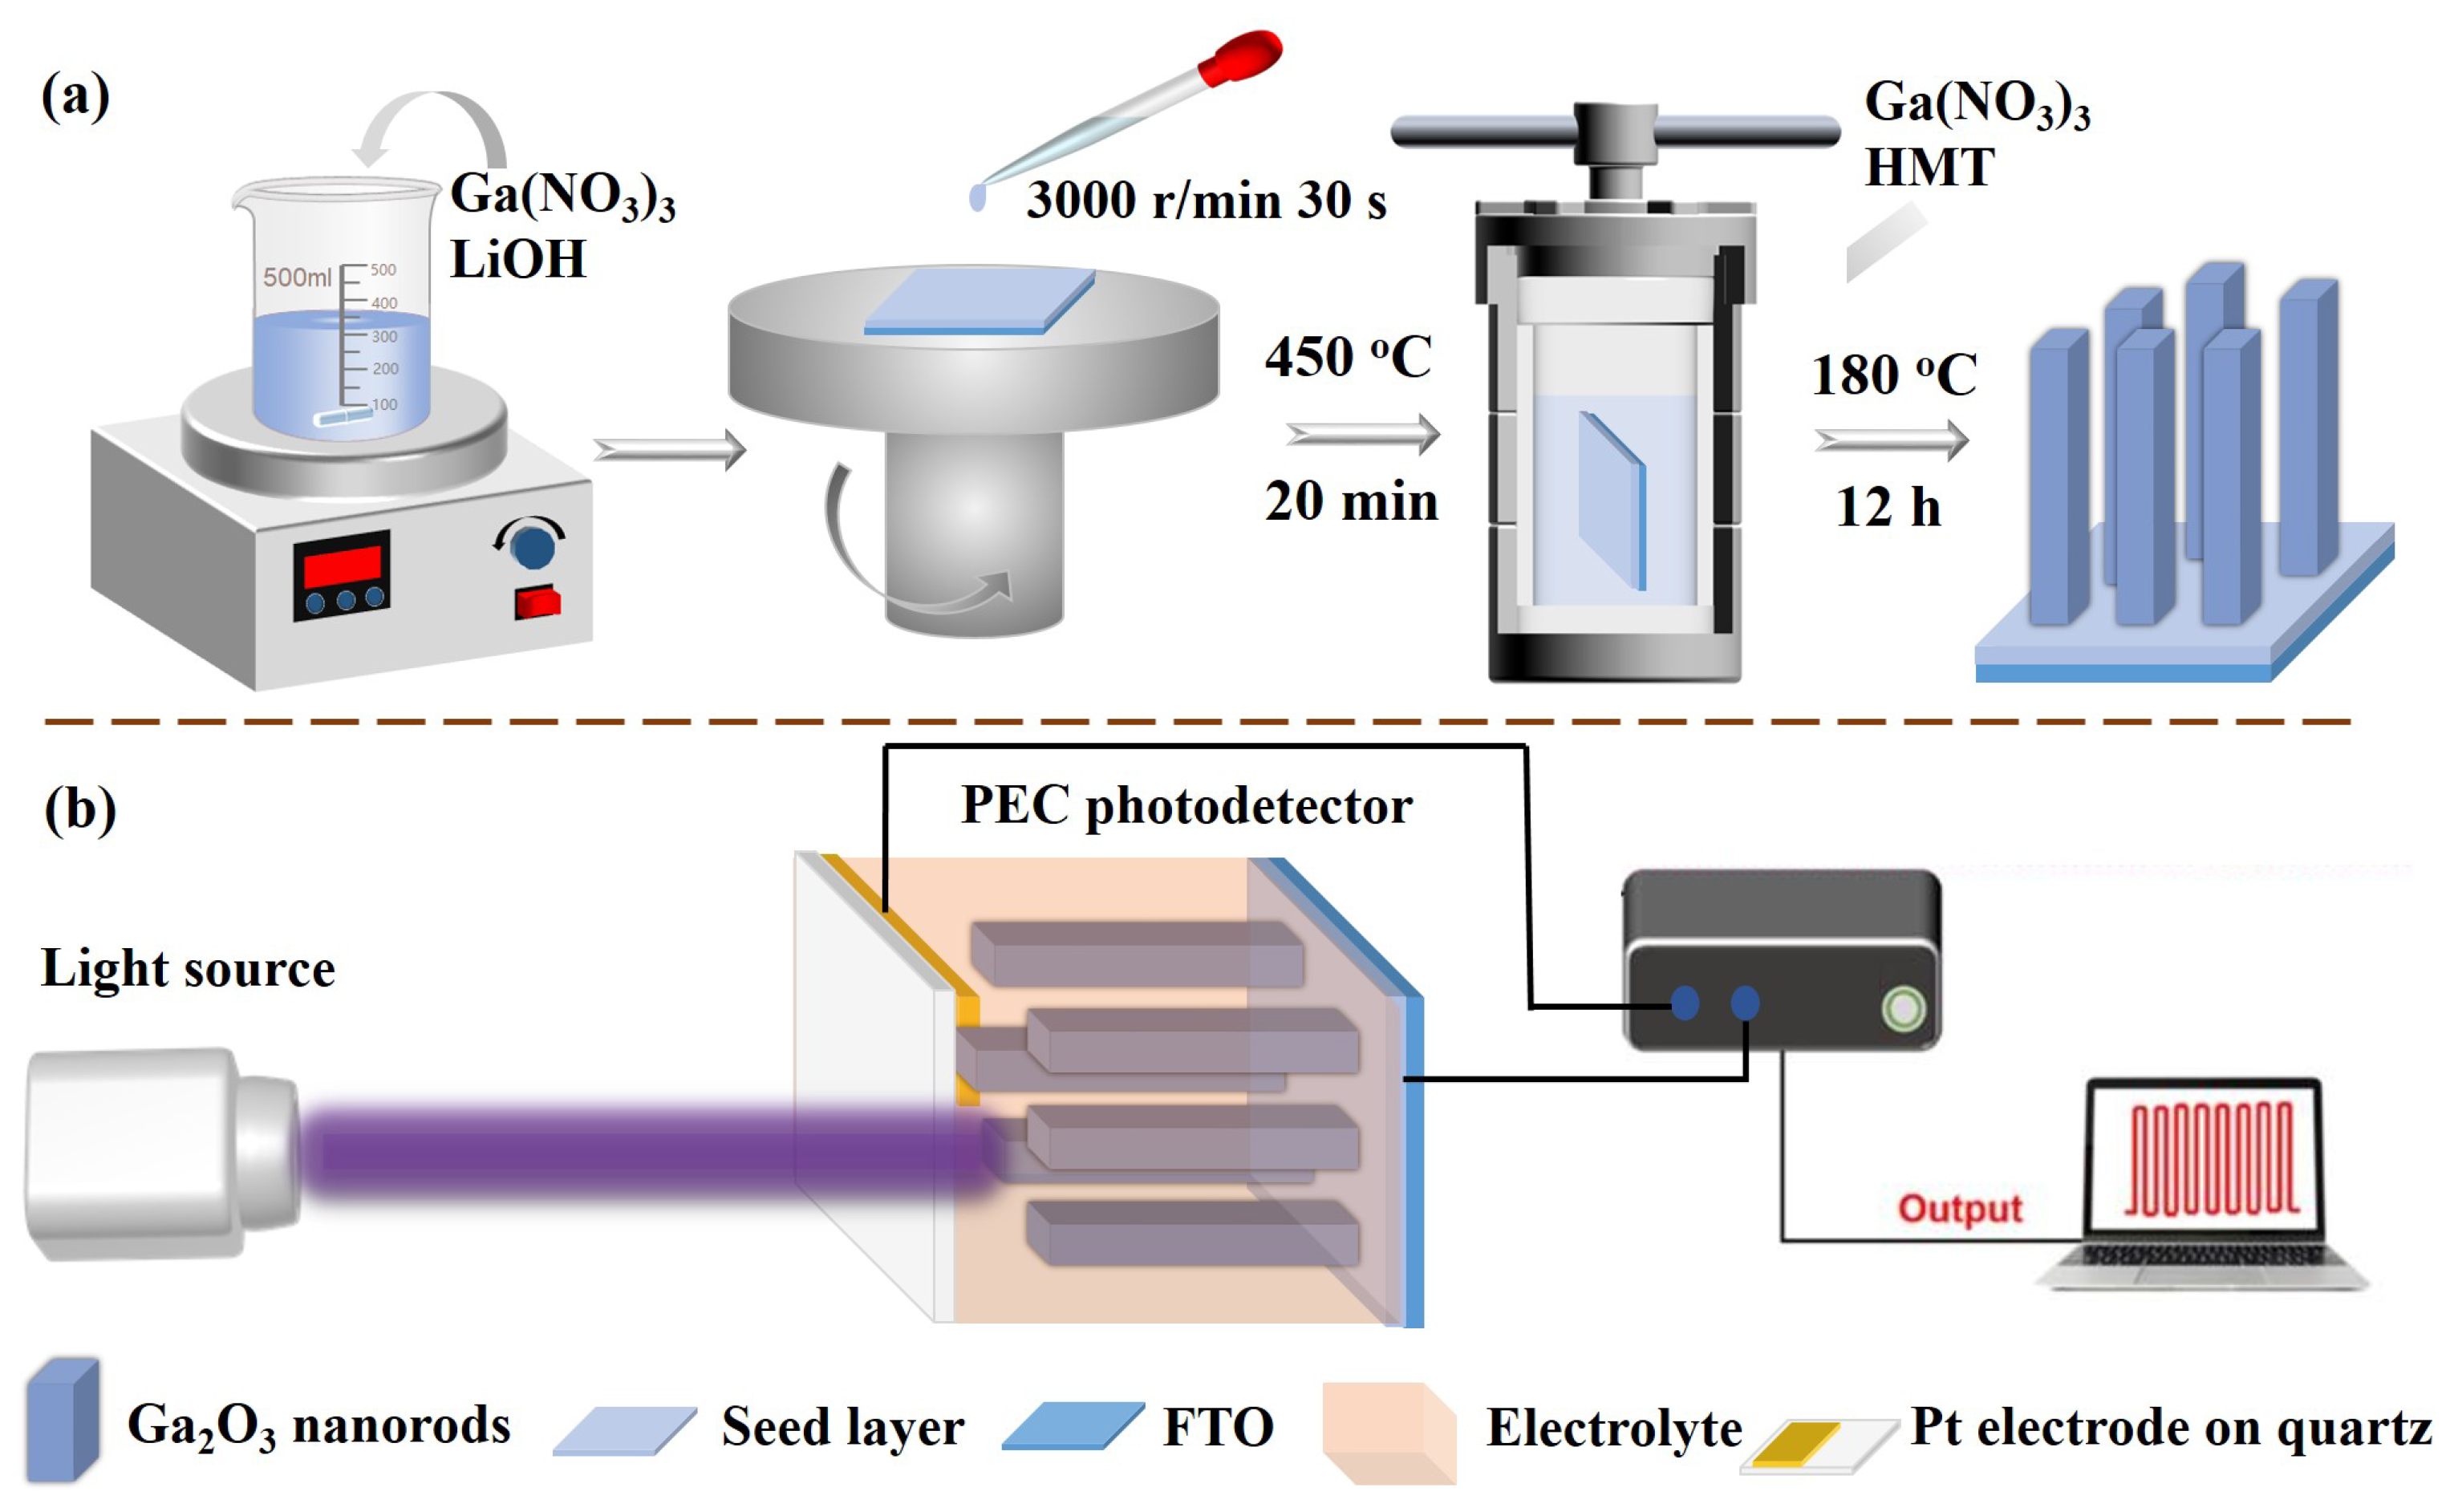
Figure 1. (a) The schematic diagram of the processing of the α -Ga2O3 nanorods. (b) The measurement setup of the α -Ga2O3-nanorod PEC photodetector.
Materials 17 03665 g001
Figure 2. (a) X-ray diffraction (XRD) patterns of the prepared α -Ga2O3, the intermediate product GaOOH, and the FTO substrate. XPS patterns of α -Ga2O3 nanorods array: (b) survey spectrum, (c) O 1s, and (d) Ga 3d.
Materials 17 03665 g002
Figure 3. (a) Top view of the SEM image of the α -Ga2O3 nanorod array. (b) A high-magnification view of the SEM image from (a). (c) TEM image of an α -Ga2O3 nanorod. (d) SAED pattern of an α -Ga2O3 nanorod. (e) High-resolution TEM image of an α -Ga2O3 nanorod. (f) Absorptance spectrum of an α -Ga2O3 nanorod. (g) Tauc plot of an α -Ga2O3 nanorod array.
Materials 17 03665 g003
Figure 4. (a) The schematic diagram of the working mechanism of the PEC photodetector. The I–t curves of the PEC photodetector with different electrolytes under (b) 2 mW/cm2 irradiation, (c) 3 mW/cm2 irradiation, (d) 4 mW/cm2 irradiation, and (e) 5 mW/cm2 irradiation.
Materials 17 03665 g004
Figure 5. (ad) Long-term I–t curves of the PEC detector with H2O, Na2SO4, Na2CO3, and NaOH as the electrolyte, respectively. (eh) The SEM images of nanorods with H2O, Na2SO4, Na2CO3, and NaOH as the electrolyte, respectively.
Materials 17 03665 g005
Figure 6. (a) The responsivity curve of the PEC detector with the Na2SO4 electrolyte. (b) I–t curves of the detector with different light powers. (c) The linear fit of the photocurrent density with the light power. (d) The response time of the PEC detector. (e) The stability of the PEC photodetector.
Materials 17 03665 g006
Table 1. Comparison of the parameters for the Ga2O3 photodetectors reported for PEC detectors.
Structure of G a 2 O3Responsivity (mA/W)Rise/Decay Time (s) I dark / I ph Ref.
Nanorod array0.2120.076, 0.05633.74Ref. [5]
Nanorod array3.870.23, 0.1512.81Ref. [24]
Amorphous films on 3D CFP12.900.15, 0.13-Ref. [25]
Nanorod array-<0.5, <0.228.97Ref. [26]
Nanorod array101.51, 3.2-Ref. [27]
Nanorod array0.20.16, 0.1035This work
Disclaimer/Publisher’s Note: The statements, opinions and data contained in all publications are solely those of the individual author(s) and contributor(s) and not of MDPI and/or the editor(s). MDPI and/or the editor(s) disclaim responsibility for any injury to people or property resulting from any ideas, methods, instructions or products referred to in the content.