Article

The Determining Influence of the Phase Composition on the Mechanical Properties of Titanium—Iron Alloys after High-Pressure Torsion

by
Alena S. Gornakova
1,*,
Boris B. Straumal
1,
Alexander I. Tyurin
2,
Natalia S. Afonikova
1,
Askar R. Kilmametov
3,
Alexander V. Druzhinin
1,
Aleksey N. Nekrasov
4,
Gregory S. Davdian
1 and
Luong V. Duong
5
1
Osipyan Institute of Solid State Physics of the Russian Academy of Sciences, Ac. Osipyan str. 2, Chernogolovka 142432, Russia
2
G.R. Derzhavin Research Institute “Nanotechnologies and Nanomaterials” TSU, Internazionalnaja str. 30, Tambov 392000, Russia
3
Laboratory of Technological and Materials Science Research, 93430 Viltanez, France
4
Korzhinskii Institute of Experimental Mineralogy, Russian Academy of Sciences, Ac. Osipyan str. 4, Chernogolovka 142432, Russia
5
Institute of Materials Science, Vietnam Academy of Science and Technology, 18 Hoang Quoc Viet Road, Cau Giay District, Hanoi 70072, Vietnam
*
Author to whom correspondence should be addressed.
Materials 2024, 17(15), 3740; https://doi.org/10.3390/ma17153740 (registering DOI)
Submission received: 14 June 2024 / Revised: 17 July 2024 / Accepted: 26 July 2024 / Published: 28 July 2024

Abstract

:
Three titanium alloys with 0.5, 6, and 9 wt.% iron were investigated, and the samples were pre-annealed in three different regions of the Ti–Fe phase diagram, namely β, α+β, and α+FeTi. After annealing, five samples of different phases and structural compositions were studied. They were then subjected to the high-pressure torsion (HPT). The microstructure of the samples before and after HPT treatment was studied using transmission and scanning electron microscopy. The microstructure of the samples obtained during heat treatment before HPT treatment had a fundamental effect on the microstructure after HPT. Grain boundary layers and chains of particles formed during the annealing process made it difficult to mix the material during HPT, which led to the formation of areas with non-uniform mixing of components. Thus, the grain boundary layers of the α-phase formed in the Ti–6wt % Fe alloy after annealing at 670 °C significantly decreased the mixing of the components during HPT. Despite the fact that the microstructure and phase composition of Ti–6wt % Fe alloys pre-annealed in three different regions of the Ti–Fe phase diagram had significant differences, after HPT treatment, the phase compositions of the studied samples were quite similar. Moreover, the measured micro- and nanohardness as well as the Young’s modulus of Ti–6wt % Fe alloy had similar values. It was shown that the microhardness of the studied samples increased with the iron content. The values of nanohardness and Young’s modulus correlated well with the fractions of β- and ω-phases in the studied alloys.

1. Introduction

Since R.Z. Valiev and his co-authors described a method for severe plastic deformation (SPD) [1,2], the interest in materials subjected to SPD has not subsided to this day. SPD allows not only for the reduction of the grain size of bulk metal samples down to the nanoscale but also a change in the phase composition of the material as well as its physical and mechanical properties. Fundamental parameters of materials are typically changed upon SPD, such as elastic modules, saturation magnetization, etc. This, in turn, opens up ways for improving existing materials and creating fundamentally new ones. Additionally, the phase composition, microstructure, and mechanical properties of alloys after SPD are affected by applied pressure [3], temperature during deformation [4], impurities [5,6], the number of anvil revolutions [5,7], the anvil rotation speed [8], as well as grain orientation in the starting material [7]. In our work, we exclude most of the above-mentioned factors by fixing the experimental parameters.
In our work, titanium alloys subjected to high-pressure torsion (HPT) were studied. The HPT of pure titanium has been studied in numerous studies [9,10,11,12,13,14]. Similarly, there are numerous published studies in the literature devoted to the HPT of binary titanium alloys like Ti–Al [15,16,17,18,19,20,21,22,23,24], Ti–Mg [25,26], Ti–Fe [27], Ti–Ni [28,29,30,31,32,33,34,35,36,37,38,39,40,41,42,43,44,45], Ti–Mo [46,47,48,49,50,51,52,53,54], Ti–Nb [50,51,55,56,57,58,59,60,61,62,63,64,65,66], Ti–Hf [67], Ti–V [68], and Ti–Ta [50]. HPT is one of the SPD modes that allows for obtaining the finest grains. To investigate mechanical properties, nanoindentation was chosen [69]. Nanoindentation allows for measuring almost non-destructively the nanohardness and calculating Young’s modulus. Modern nanoindentation makes it possible to study mechanical properties of various materials at the nanoscale. It can also complement the complex standard methods, providing the possibility to re-examine samples.
Recently, the Ti–Fe binary alloys have attracted considerable attention in the automotive and aerospace industries. First of all, this is due to their lower price ensured by the absence of expensive alloying elements, such as vanadium, molybdenum, and niobium. Another reason is the wide range of microstructures and mechanical properties obtained in Ti–Fe alloys [70,71,72]. Basically, the microstructures of titanium alloys can consist of two main phases, namely the β-phase with a body-centered cubic lattice (BCC), which is stable at high temperatures, and the low-temperature α-phase with a hexagonal close packed lattice (HCP). However, when titanium and its alloys are subjected to HPT, an additional high-pressure phase (ω-phase) is typically detected. It appears under shear strain under pressure, and it is conserved after pressure release and even after additional heating up to 300–500 °C.
Earlier, the present authors and their colleagues thoroughly studied titanium–iron alloys [73,74,75,76,77,78,79,80] with a different fraction of the second component and various kinds of heat treatments, also subjected to HPT, as one of the most popular SPD modes. One of the main conclusions of these studies is that the second component and preliminary heat treatment determine the phase composition in the samples subjected to HPT, particularly the fraction of the ω-phase. The purpose of this work is to find the relationship between the proportion of alpha/beta/omega phases and nanohardness/Young’s modulus in samples subjected to the thermal and HPT treatments.

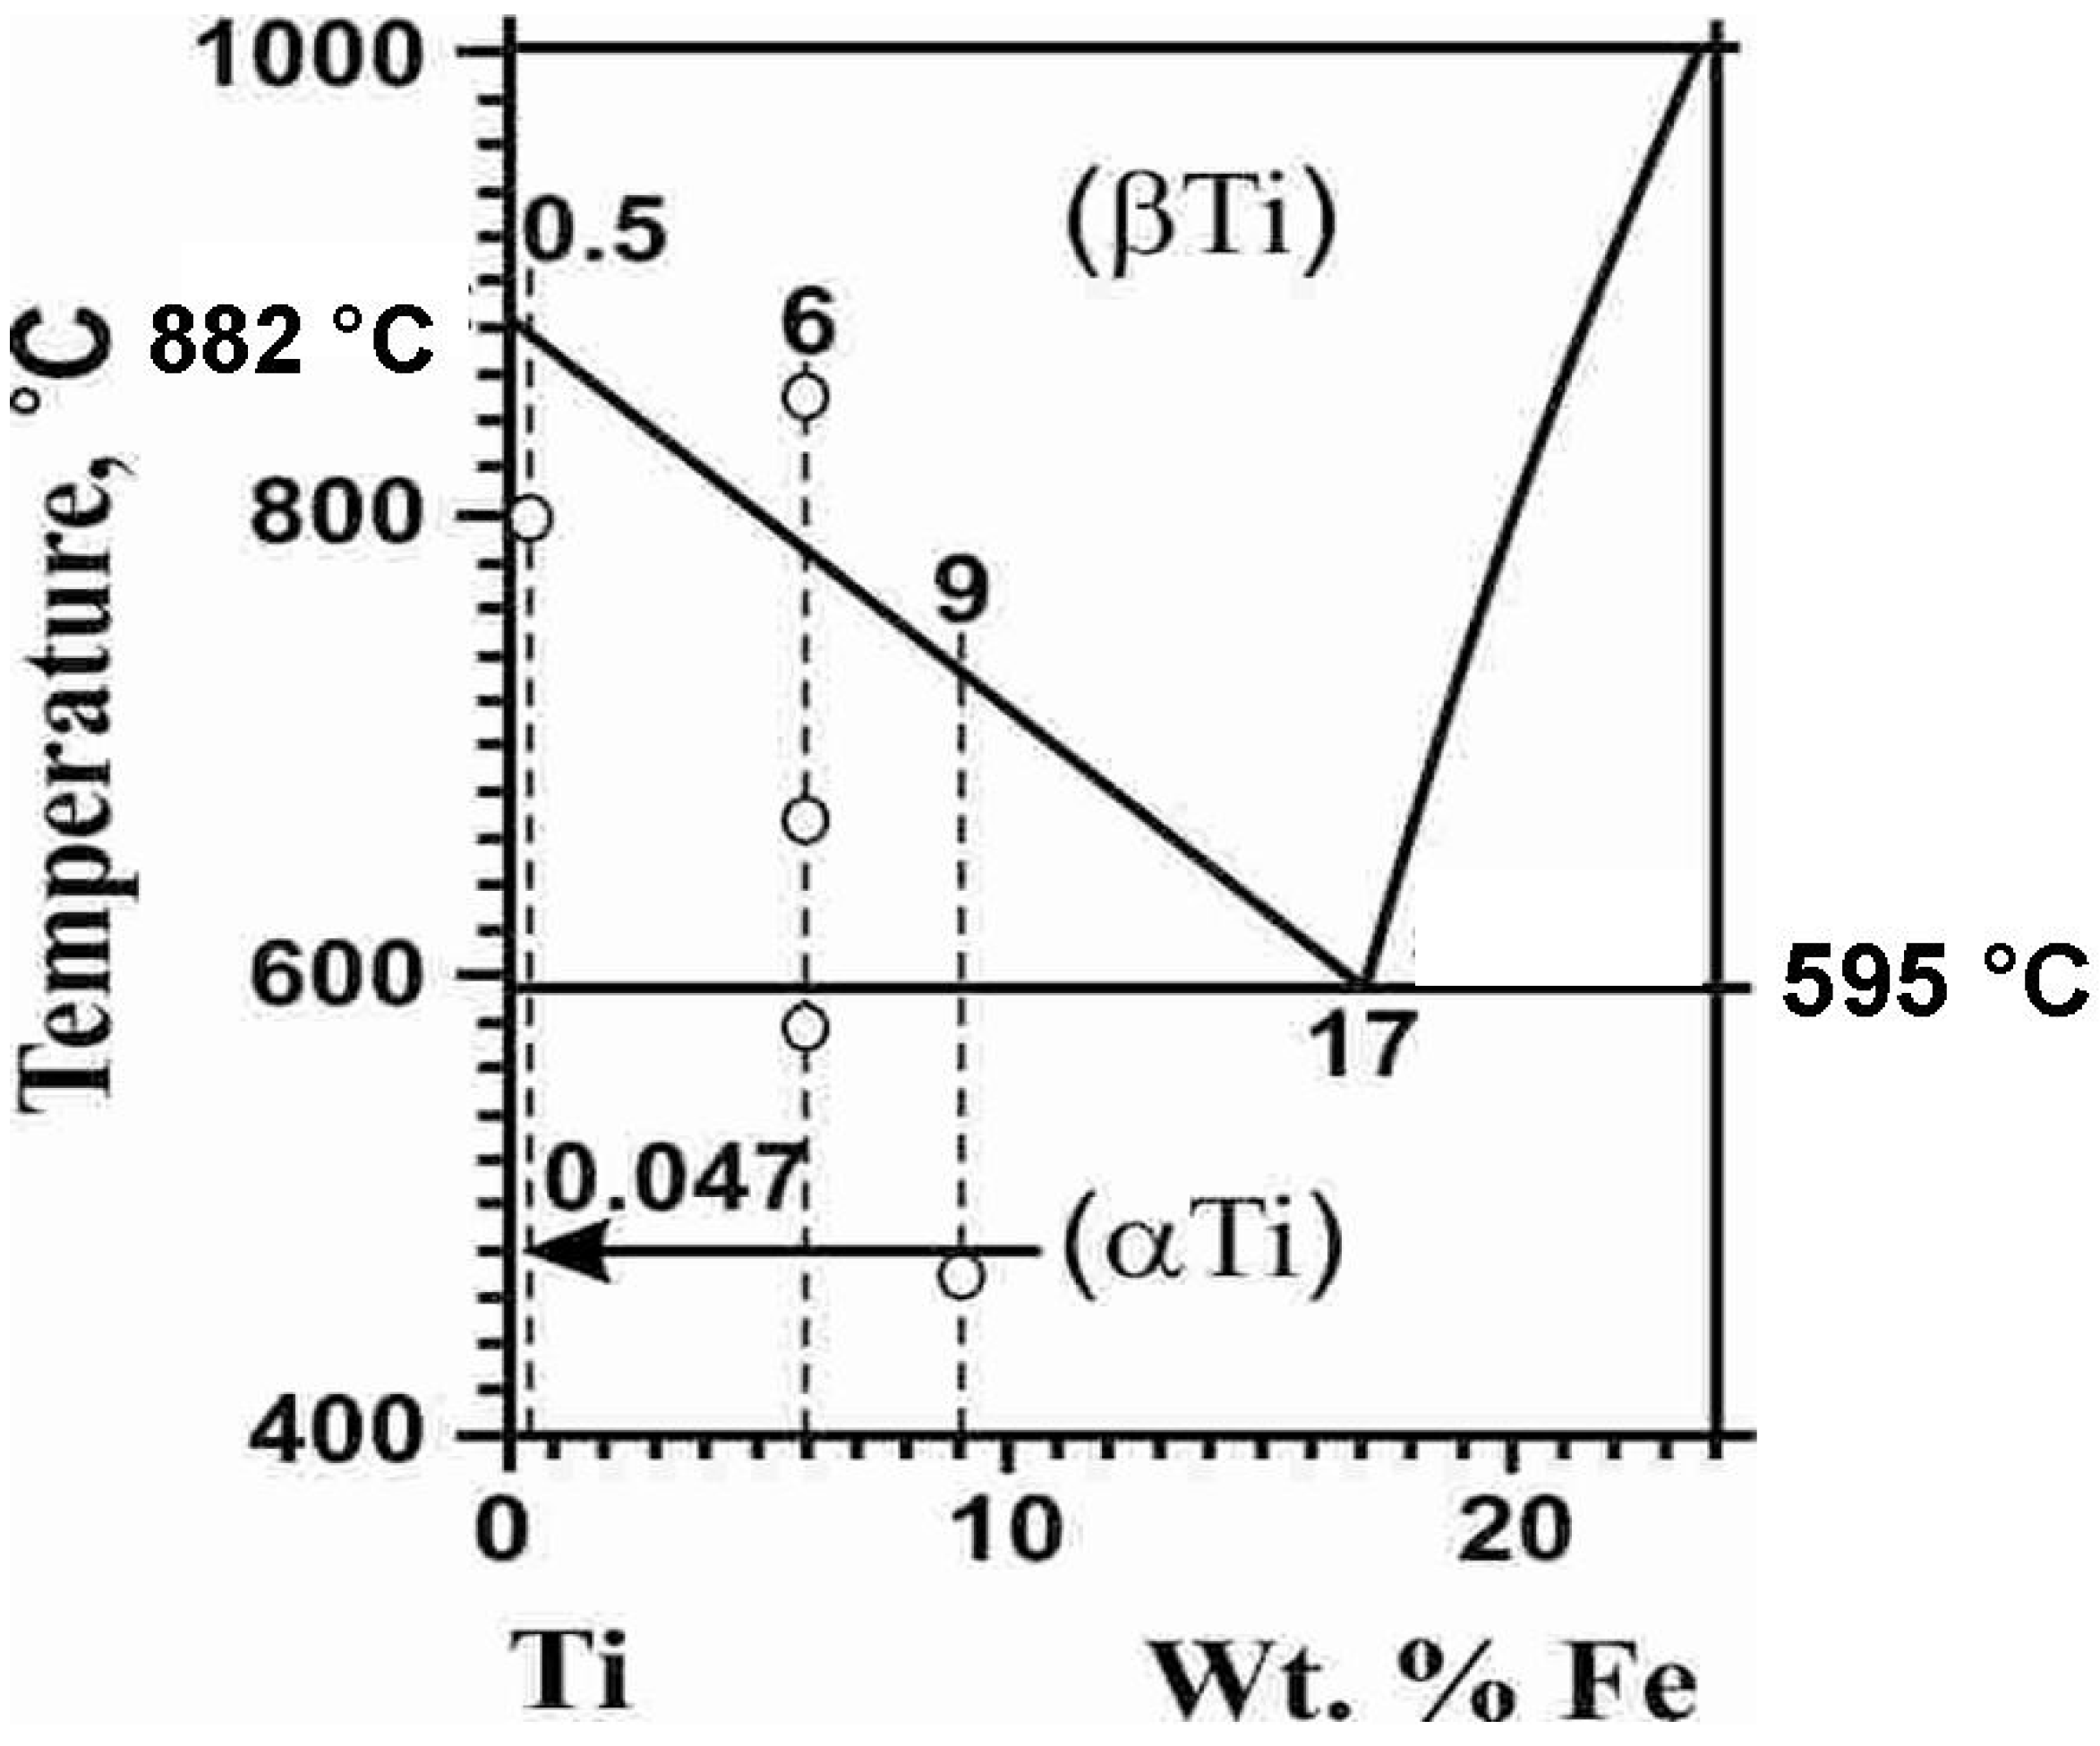
2. Materials and Methods

The investigated binary titanium alloys, Ti–0.5 wt.% Fe (0.5 ± 0.0 wt.% Fe), Ti–6 wt.% Fe (6.3 ± 0.3 wt.% Fe), and Ti–9 wt.% Fe (9.2 ± 0.2 wt.% Fe), were manufactured in the form of cylindrical ingots with a diameter of 2R = 10 mm. The levitation melting method in an atmosphere of pure argon using electromagnetic induction was used for this purpose. These alloys were smelted using pure titanium (99.98%, TI-1 grade, Special Metallurgy Ltd., Moscow, Russia) and iron (99.97%, Special Metallurgy Ltd., Moscow, Russia). Chemical analysis of ingots was carried out with the help of a scanning electron microscope Tescan Vega TS 5130 MM (Brno, Czech Republic), equipped with an energy-dispersion spectrometer LINK (Oxford Instruments, Abingdon, UK). SEM images were made using Versa 3D DualBeam FEI (Thermo Fisher Scientific, Hillsborough, OR, USA). The 0.7 mm thick disks were cut off from the ingot using spark erosion. After removing the disturbed surface layer by grinding, the samples were annealed in the sealed quartz ampoules with the initial residual pressure in the ampoule of about 4 × 10⁻⁴ Pa. Annealing was carried out in various regions of the titanium–iron phase diagram (Figure 1): 800 °C, 7 h (Ti–0.5 wt.% Fe), 580 °C, 840 h, 670 °C, 1230 h, 850 °C, 148 h (Ti–6 wt.% Fe), and 470 °C, 673 h (Ti–9 wt.% Fe). The samples were quenched after annealing in cold water together with the ampoule.
Afterwards, the annealed and quenched samples were subjected to HPT. The HPT conditions were room temperature with 5 rotations of the plunger, under pressure of 7 GPa, at a rotation speed of 1 rpm. HPT was performed in a computer-controlled Bridgman anvil-type machine manufactured by W. Klement GmbH, Lang, Austria. After the HPT, the thickness of the samples was 0.35 mm. The nanohardness of the samples was measured using the Hysitron TI-950 Triboindenter (Bruker, Eden Prairie, MN, USA) equipped with a Berkovich indenter. Measurements were carried out along the radius of the samples, and the loading rate was constant and equal to dP/dt = 40 mN/s. Before the measurements, the surface of the samples was polished using a diamond paste with a grain size of 1 µm. The numerical values of nanohardness (H) and Young’s modulus (E) of the studied samples were determined using the Oliver–Farr method based on characteristic P-h diagrams [81,82].
The structural and phase analysis was performed with the Rigaku Smartlab X-ray diffractometer (Rigaku Corp., Akishima-shi, Tokyo, Japan). The CuKα1+α2 radiation was used. The X-ray wavelength was 0.15419 nm. The phase analysis and calculation of the lattice parameters were carried out using the PowderCell 2.4 program (PowderCell for Windows. Version 2.4. 08.03.2000, Werner Kraus & Gert Nolze, BAM Berlin). After HPT, the microstructure of the samples was studied using a 200 kV transmission electron microscope JEM-2100 (TEM) (JEOL Ltd., Akishima, Japan). Samples for TEM studies were prepared using standard techniques, including mechanical polishing and etching with Ar ions.

3. Experimental Results

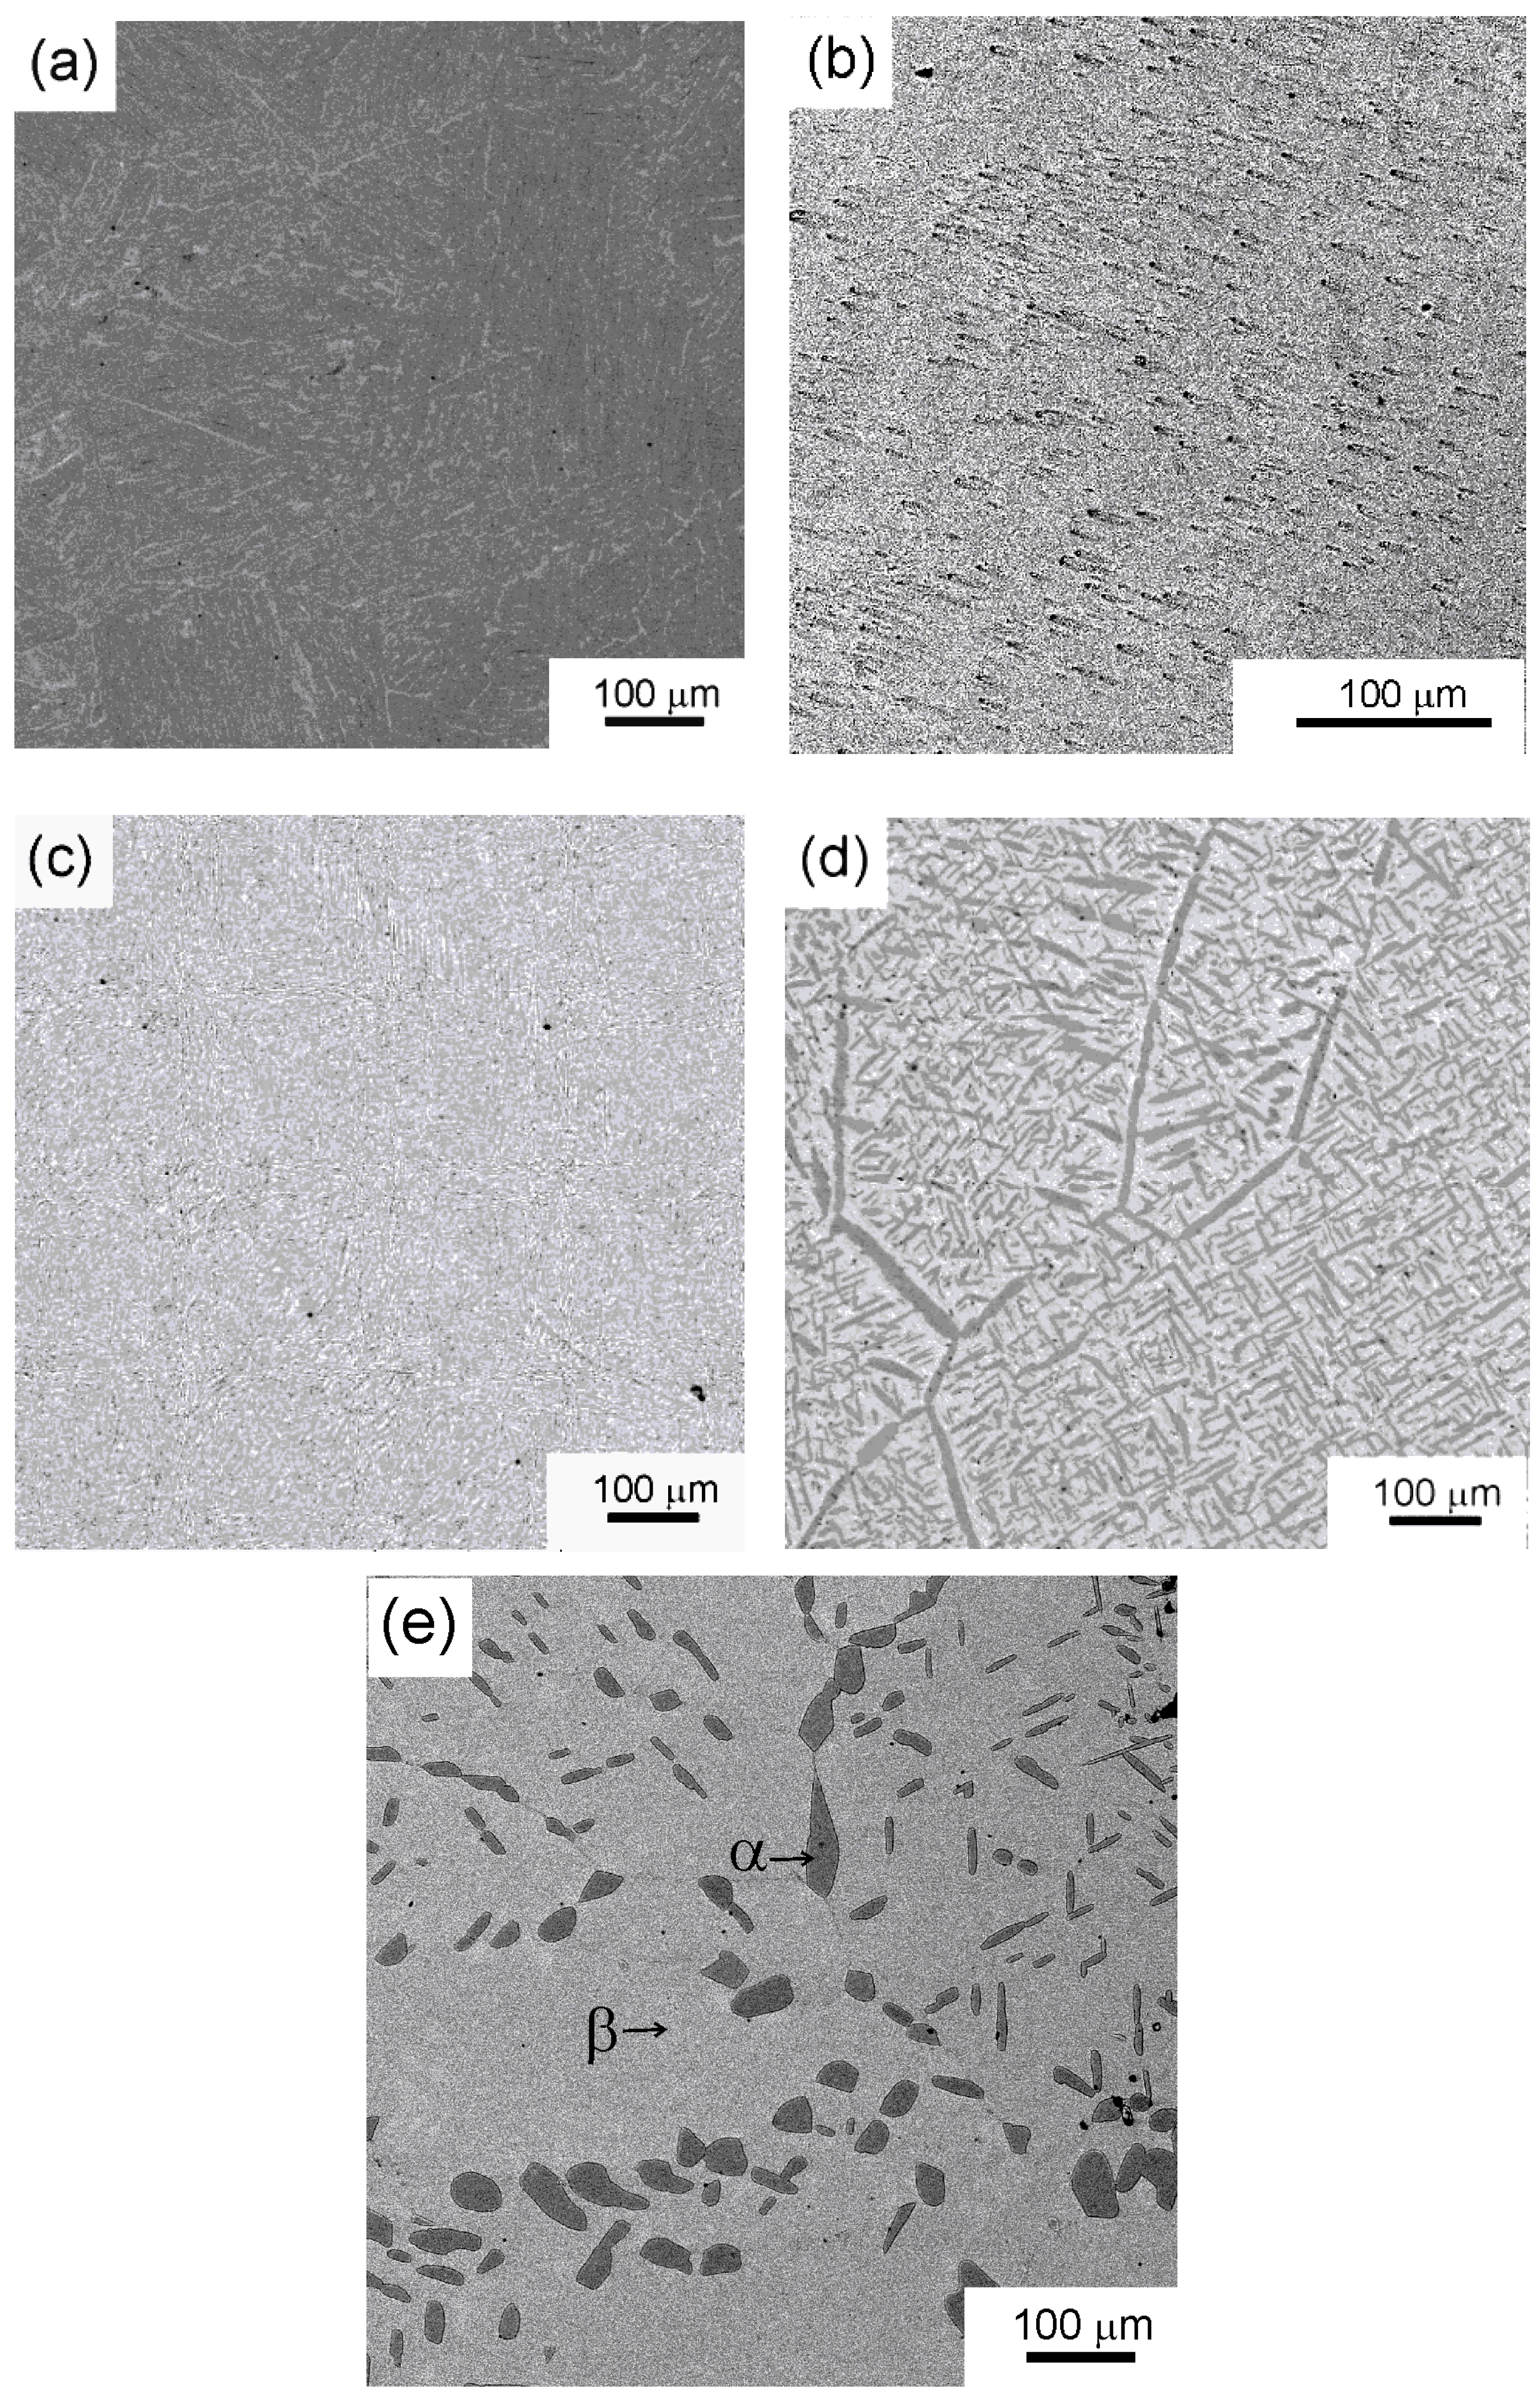
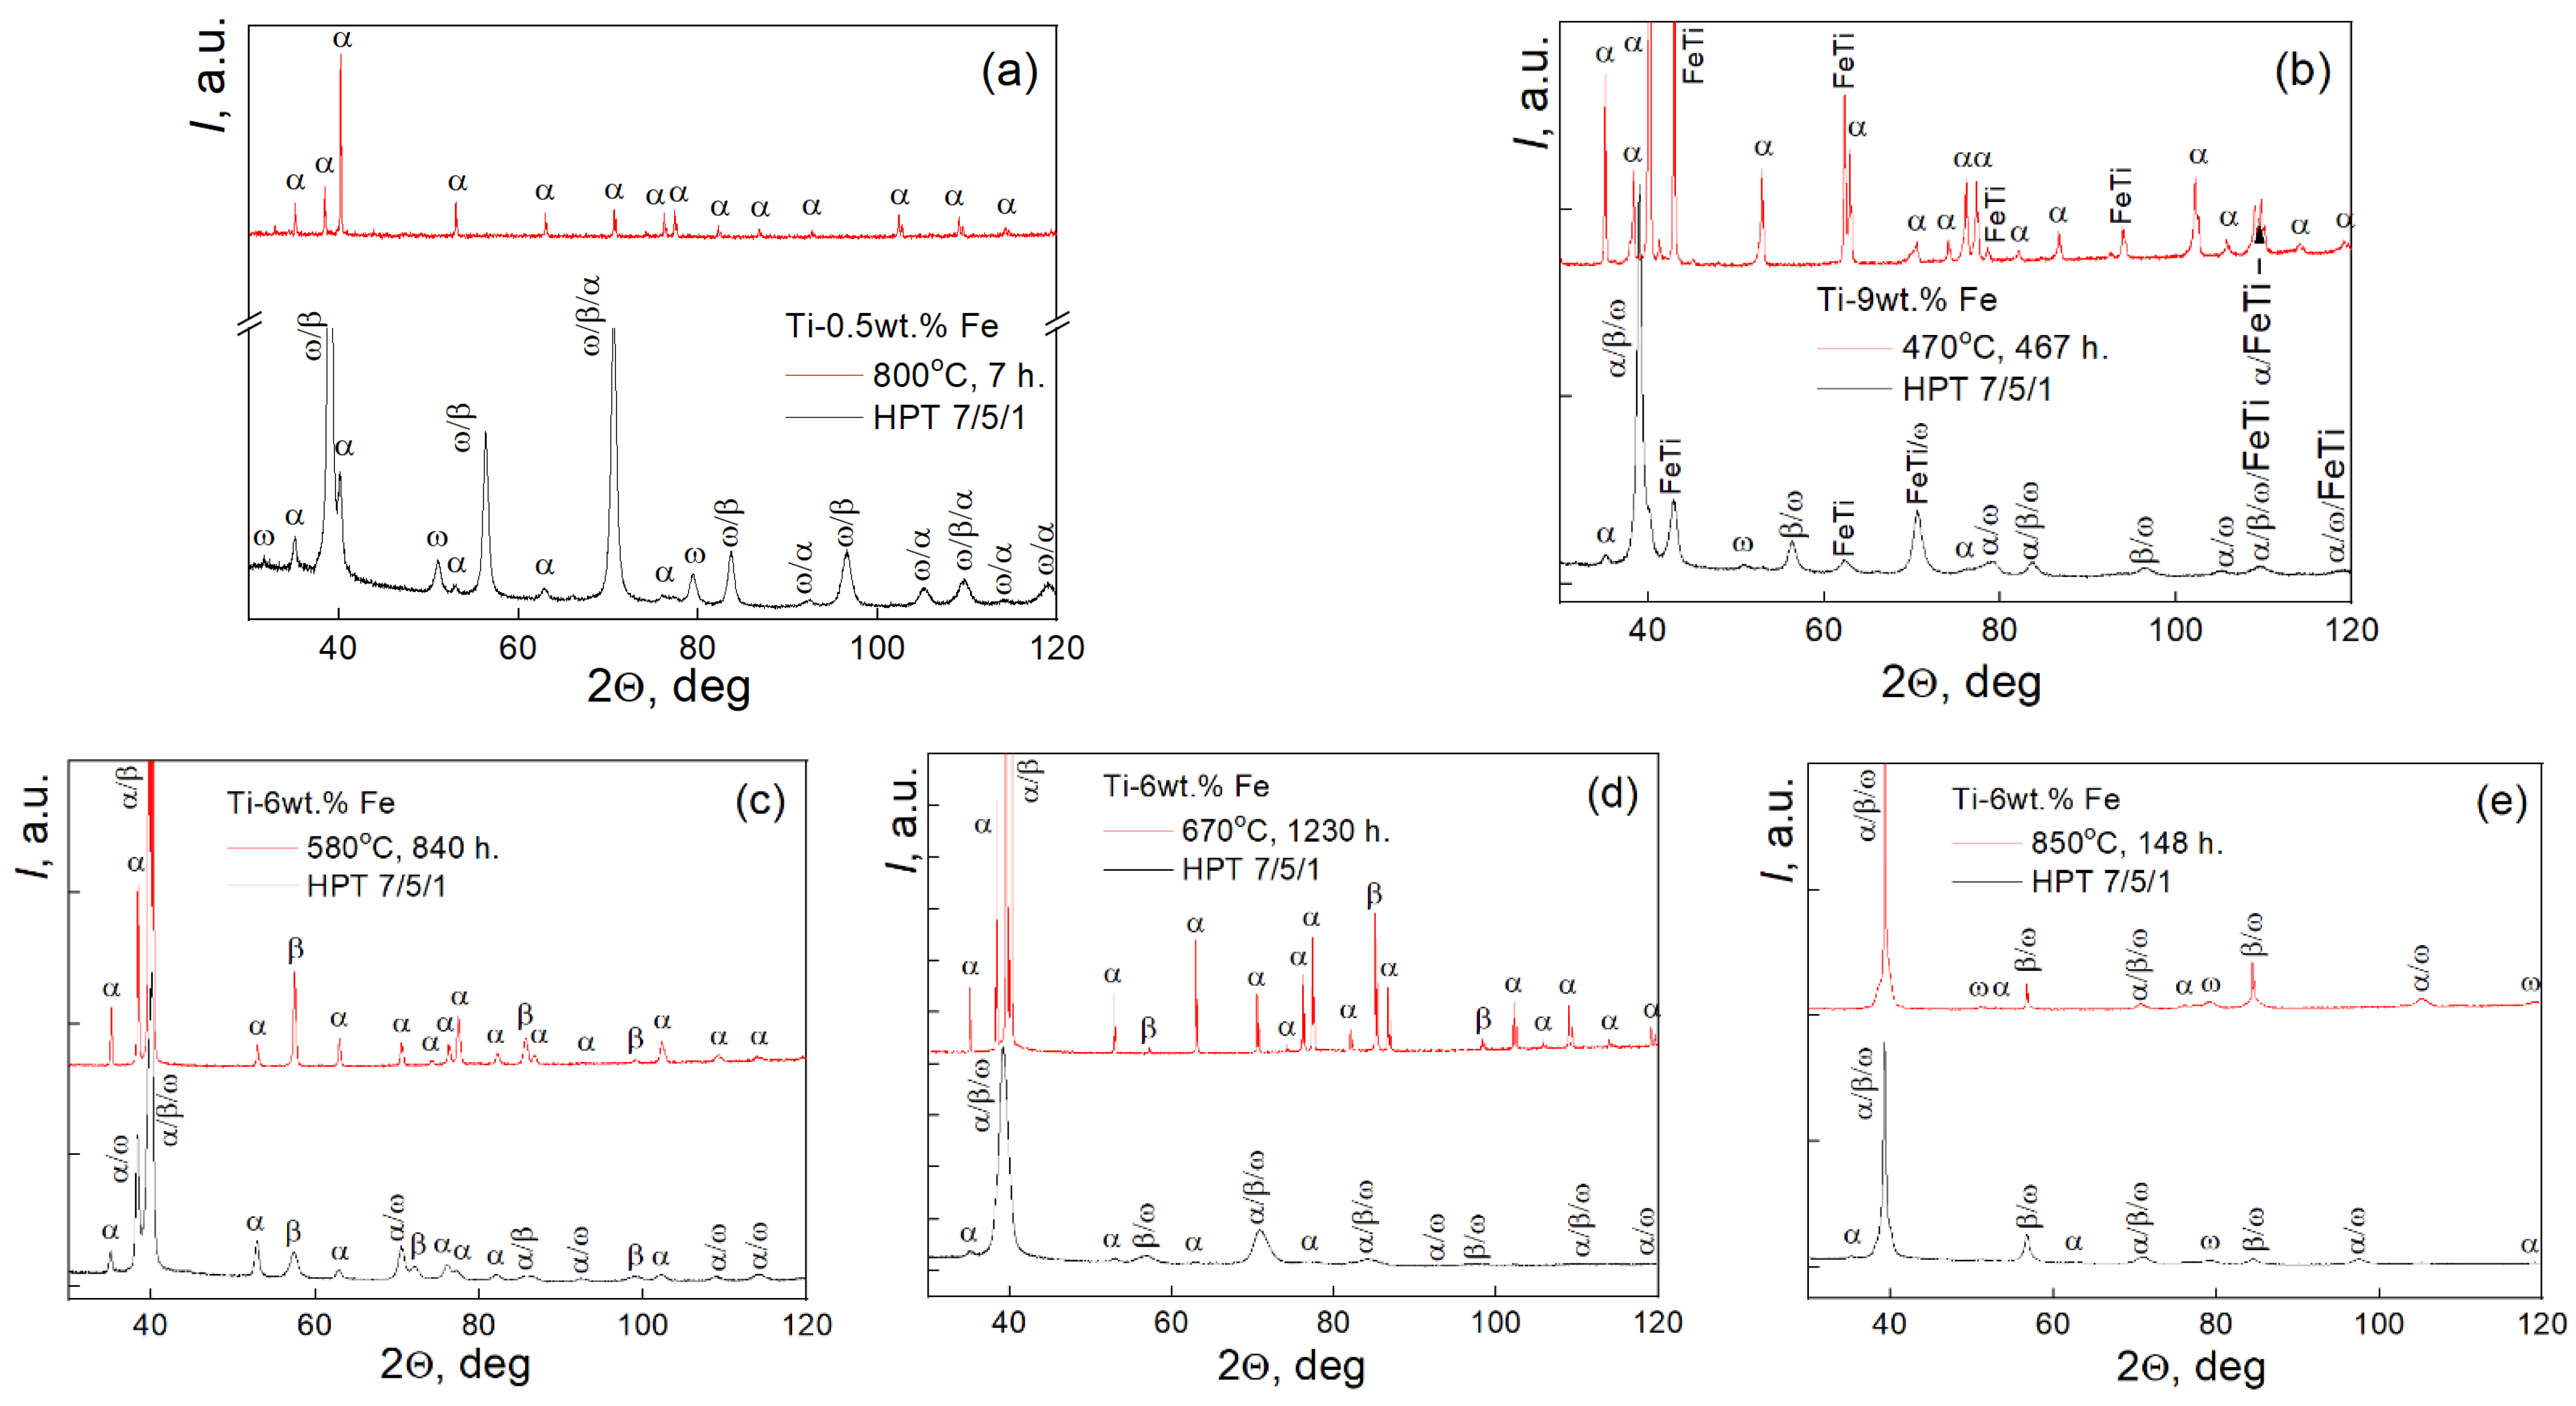
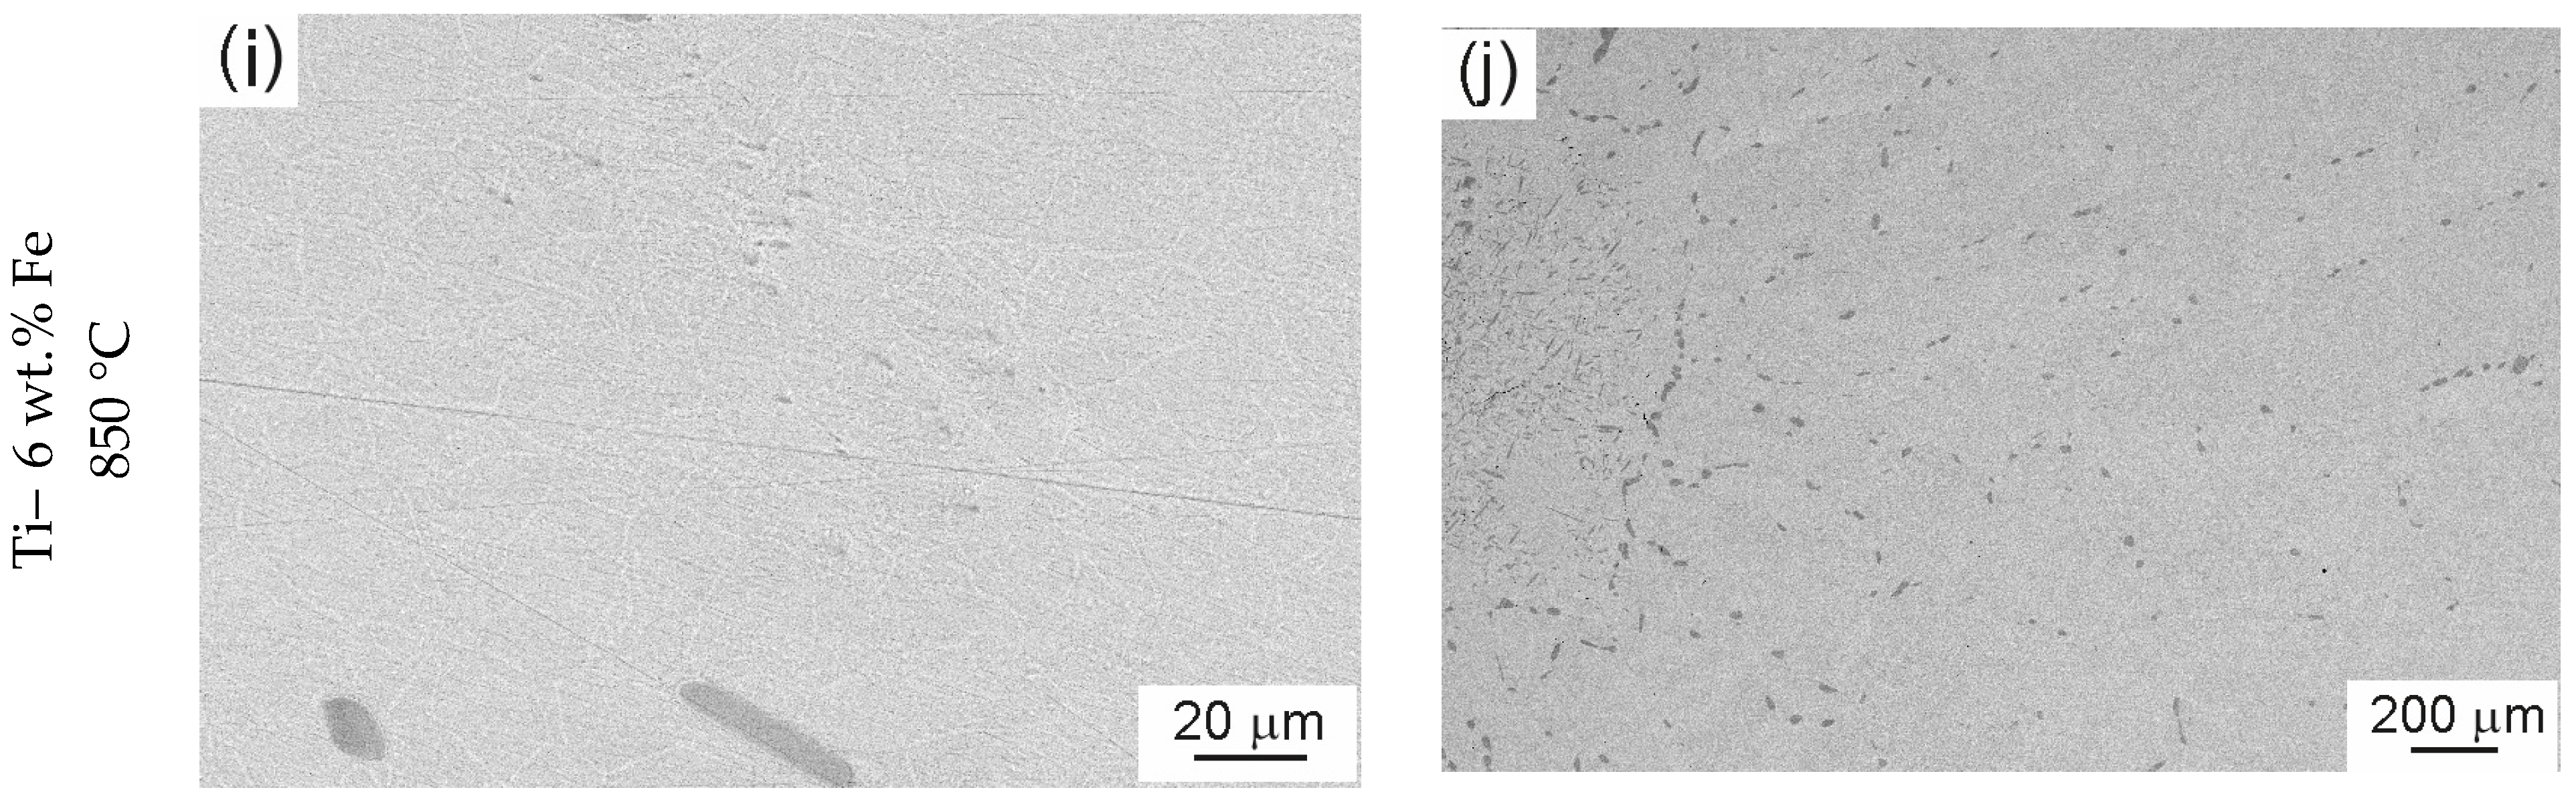
3.1. Microstructures and Phase Composition of Samples before and after HPT

Figure 2 shows micrographs of titanium–iron alloys annealed at various temperatures (Figure 2a), Ti–0.5 wt.% Fe, 800 °C, (Figure 2b) Ti–9 wt.% Fe, 470°C, and Ti–6 wt.% Fe (Figure 2c), 580 °C, (Figure 2d) 670 °C, and (Figure 2e) 850 °C.
The SEM images show that the composition of the alloys and the annealing temperature have a significant impact on the microstructure before the HPT. The image in Figure 2a shows a completely single-phase (αTi) material (see also XRD results in Figure 3 and Table 1). The image in Figure 2b demonstrates that the particles of the brittle intermetallic-phase FeTi had fallen apart during polishing (black dots). Although the microstructure in Figure 2c contains 50/50% of α/β-phases, the phase distribution is uniform, and it is quite difficult to estimate the grain size. In Figure 2d,e, there is a light gray and dark gray contrast related to the α- and β-phases. In Figure 2d, the α-phase is present in both the (βTi) grains and at the (βTi)/(βTi) grain boundaries. Meanwhile, in Figure 2e, the α-phase is completely distributed along the (βTi)/(βTi) grain boundaries. It is worth noting that all five samples have different phase compositions and various microstructures after annealing. In the Ti–6 wt.% Fe alloy annealed at 850 °C, the isothermal ω-phase is visible in the XRD pattern in addition to the α- and β-phases (Figure 3b).
In Figure 4, the SEM micrographs of samples after HPT are presented. In Figure 4a,c,e, the distribution of iron is uniform, and the grayscale is uniform without any significant changes. In Figure 4g,i, the micrographs of two Ti–6 wt. % Fe samples pre-annealed at 670 °C (Figure 2d) and 850 °C (Figure 2e) are shown. In these samples, the GB layers of α-phase and GB chains of α-particles formed during annealing and quenching significantly decreased the mixing of the components during HPT. As a result, the regions rich and depleted of iron were formed (Figure 4h). In Figure 4j, we see that not all chains of the α-Ti phase were destroyed during HPT.
Table 2 shows the results of the X-ray diffraction analysis of samples after HPT treatment. The phase composition of the Ti–6 wt.% Fe alloy, pre-annealed at three different temperatures and having different microstructures and phase compositions, has a similar phase distribution after HPT.
The average values of the grain size in different phases before and after HPT were determined (Figure 5). These values were calculated from X-ray diffraction data. They correspond to the size of coherent scattering regions for different phases. The filled symbols correspond to the annealed samples. The data points are quite spread. The largest grains are present in the Ti–6 wt.% Fe alloy annealed at 670 °C. There are no grains smaller than 70 nm in annealed samples. HPT leads to the decrease of grain sizes, and the average grain size decreases to 50 nm. This is also evidenced by X-ray diffraction due to a characteristic broadening of peaks in HPT-treated samples. Data for the samples subjected to HPT are shown in Figure 3 and Figure 4, as well as in the Table 2. For the Ti–6 wt.% Fe alloy, the phase ratio α/β/ω varies slightly with the annealing temperature, and the mean phase ratio value is 18/36/46, respectively. A significant difference is observed in Ti–0.5 wt.% Fe and Ti–9 wt.% Fe alloys. In these alloys, the fraction of α-phase is almost equal. The fraction of ω-phase in the Ti–9 wt.% Fe alloy is two times larger (about 60%) than in the Ti–0.5 wt.% Fe alloy. The highest fraction of β-phase is in the Ti–0.5 wt.% alloy.

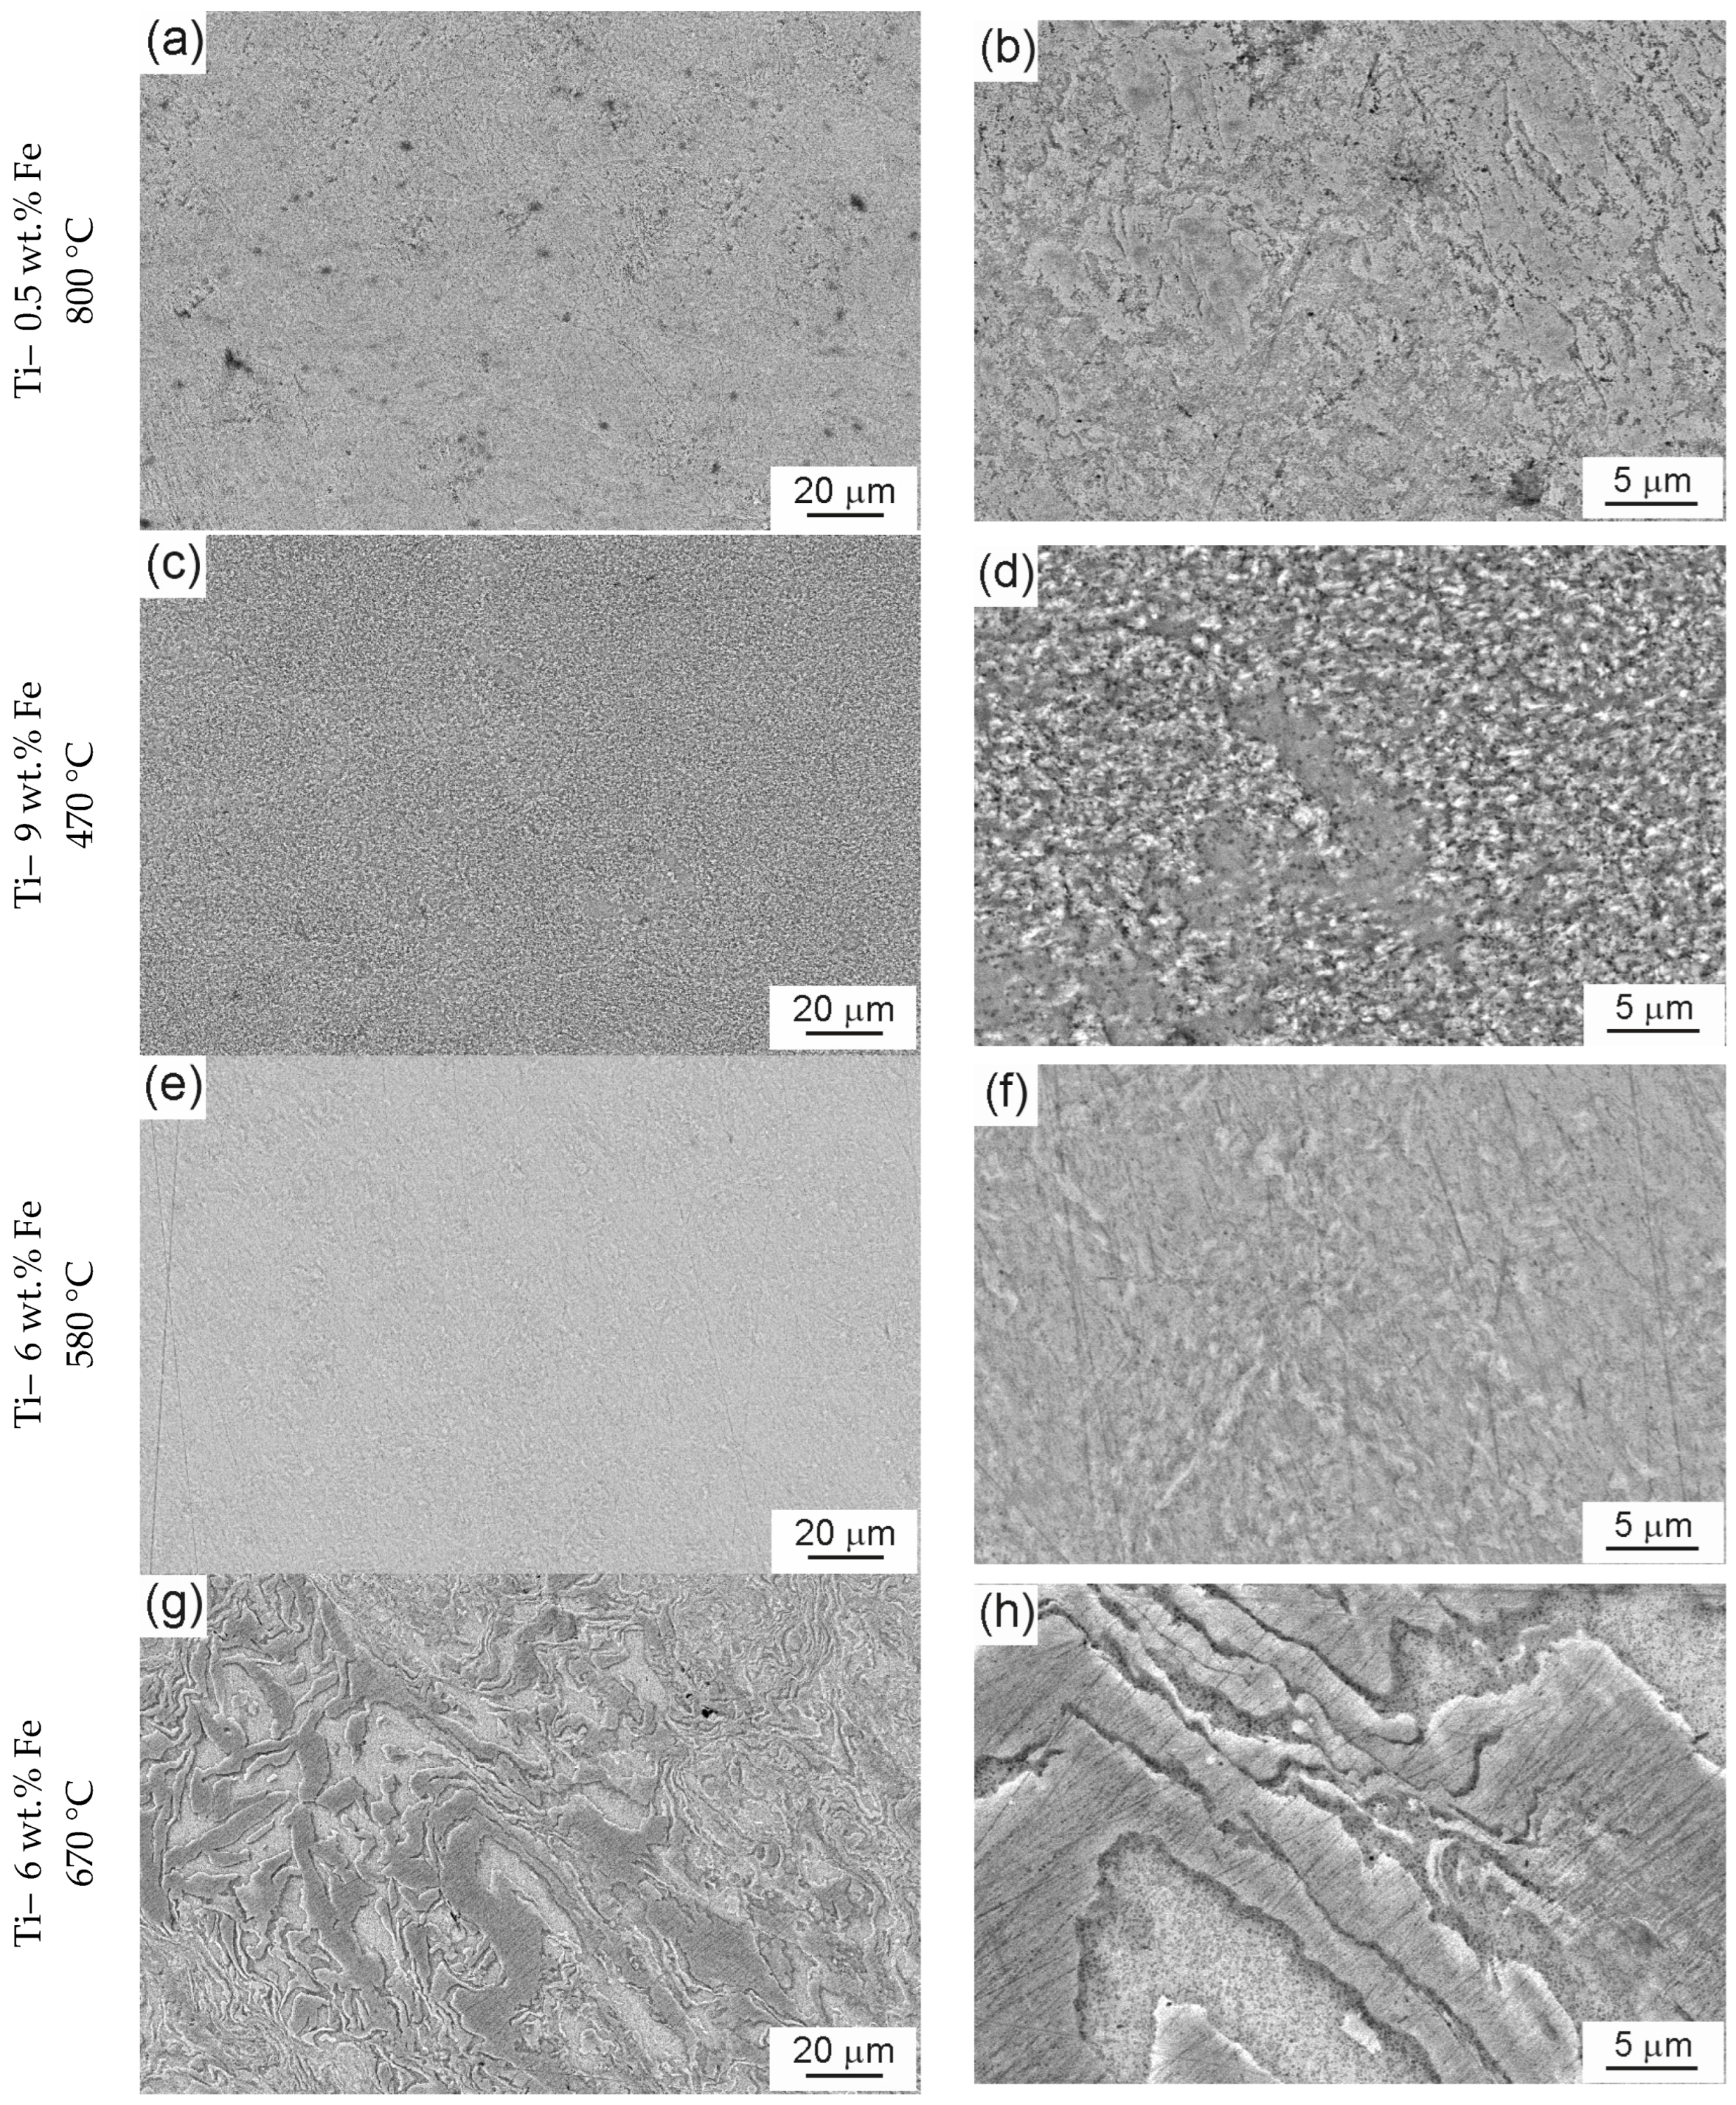
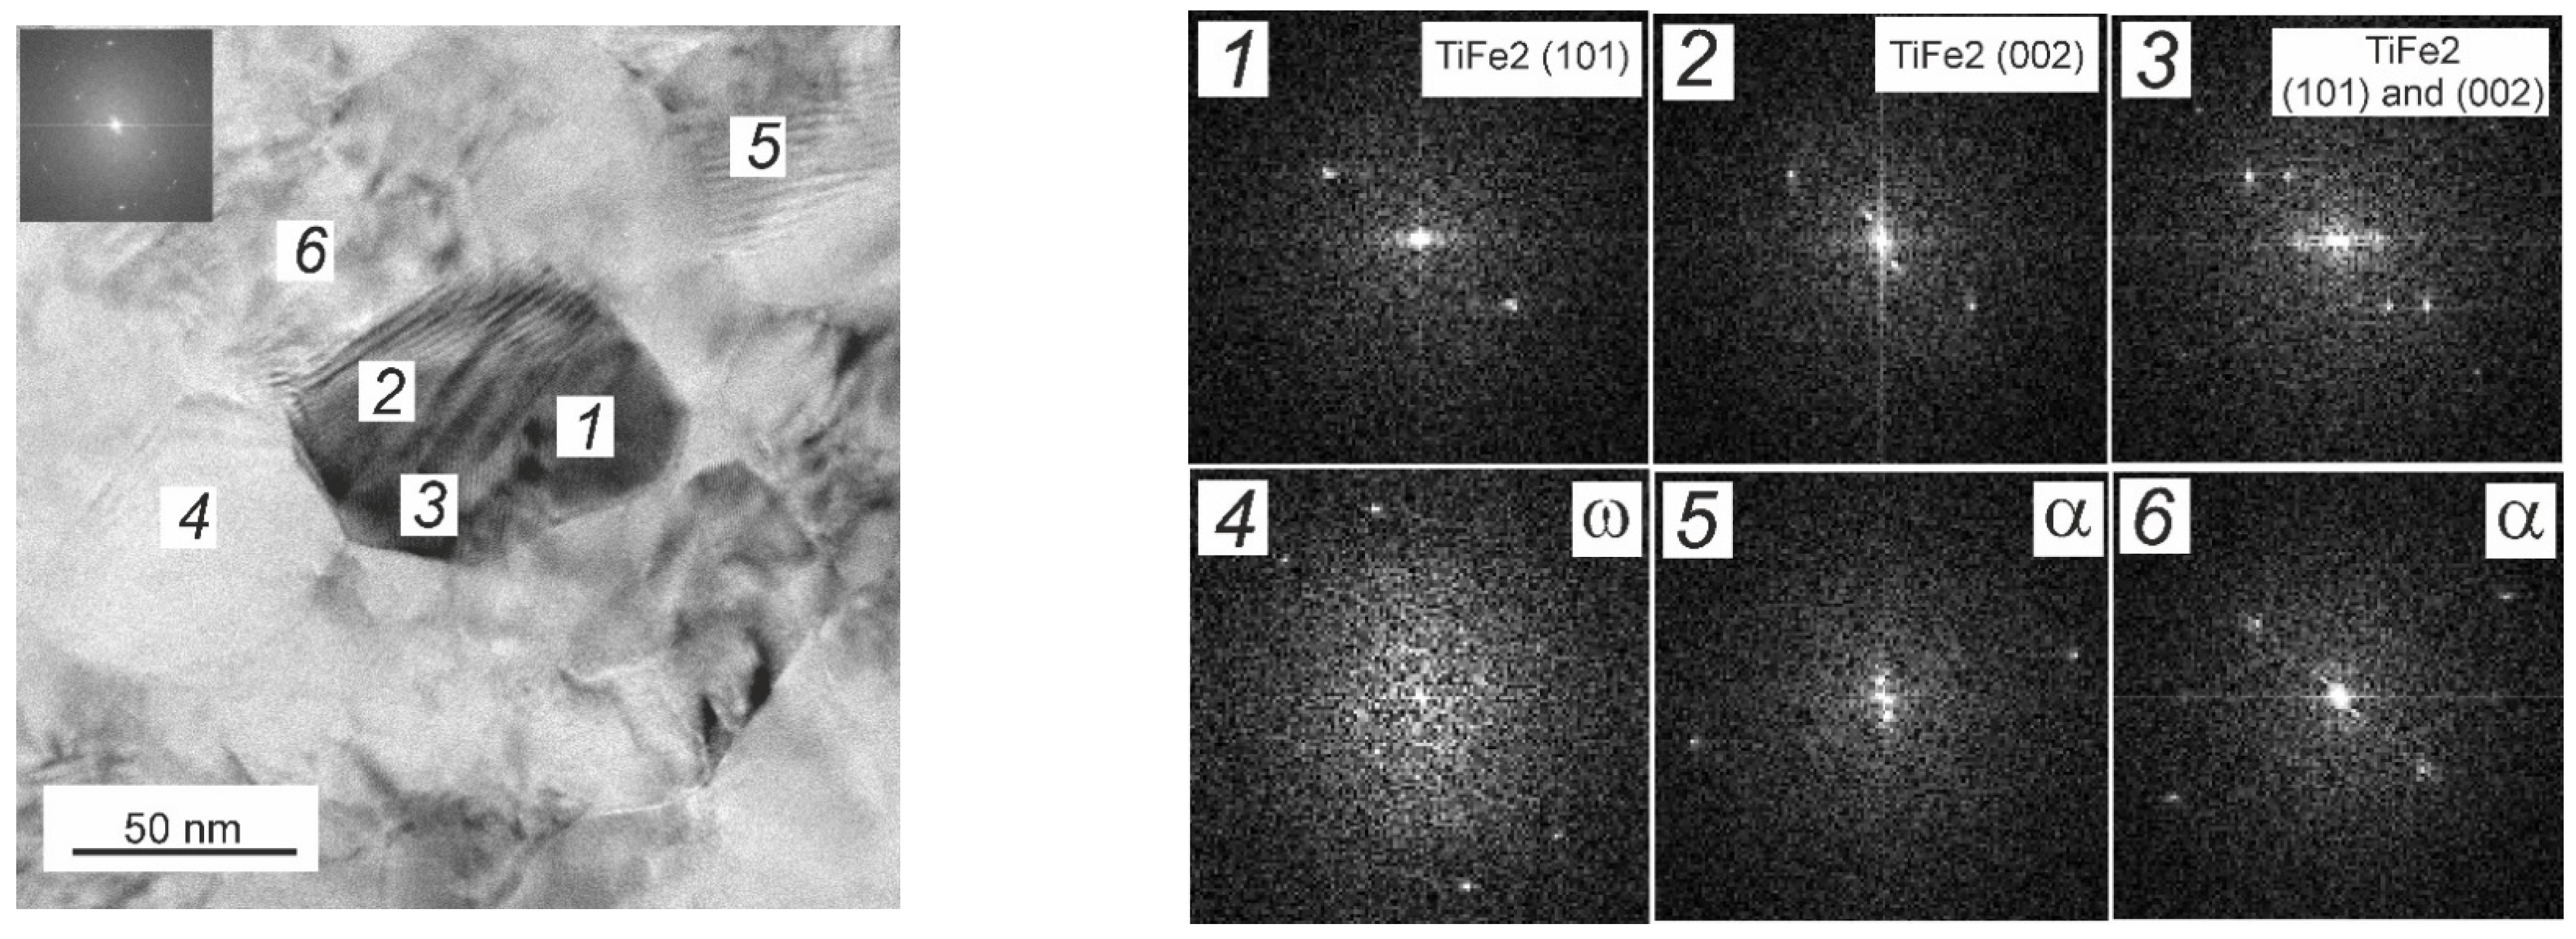
3.2. Characterization of the Microstructure of HPT-Processed Samples Using a TEM

The microstructure of samples processed through HPT was also investigated using a TEM (Figure 6).
The electron diffraction patterns presented in the central part of Figure 6 were analyzed. The respective data are given in Table 3. The intermetallic-phase TiFe2 was not determined through XRD. However, it was detected using a TEM in all investigated samples. There are two assumptions about the formation of this intermetallic compound. The first is based on the emergence of the TiFe2 phase during the manufacture of ingots, i.e., there are non-melted Ti particles enriched with Fe. The second supposes that the intermetallic phase forms during HPT. In this paper, these are just assumptions that have no confirmation. However, another question arises: how significant is the role of these particles, and how does their volume change with an increase in the iron content in the alloy?
In the dark field images (Figure 6), the average grain sizes are 35 ± 2 nm for Ti–0.5 wt.% Fe, 17 ± 1 nm for Ti–6 wt.% Fe, and 12 ± 1 nm for Ti–10 wt.% Fe (Figure 7). Because diffraction spots that formed the dark field images are unknown, it is difficult to identify the phases.
Confirmation of the presence of the intermetallic-phase TiFe2 in alloys was found using a TEM (Figure 8). The dark particle in the center of the image consists of two TiFe2 grains surrounded by the α and ω grains.

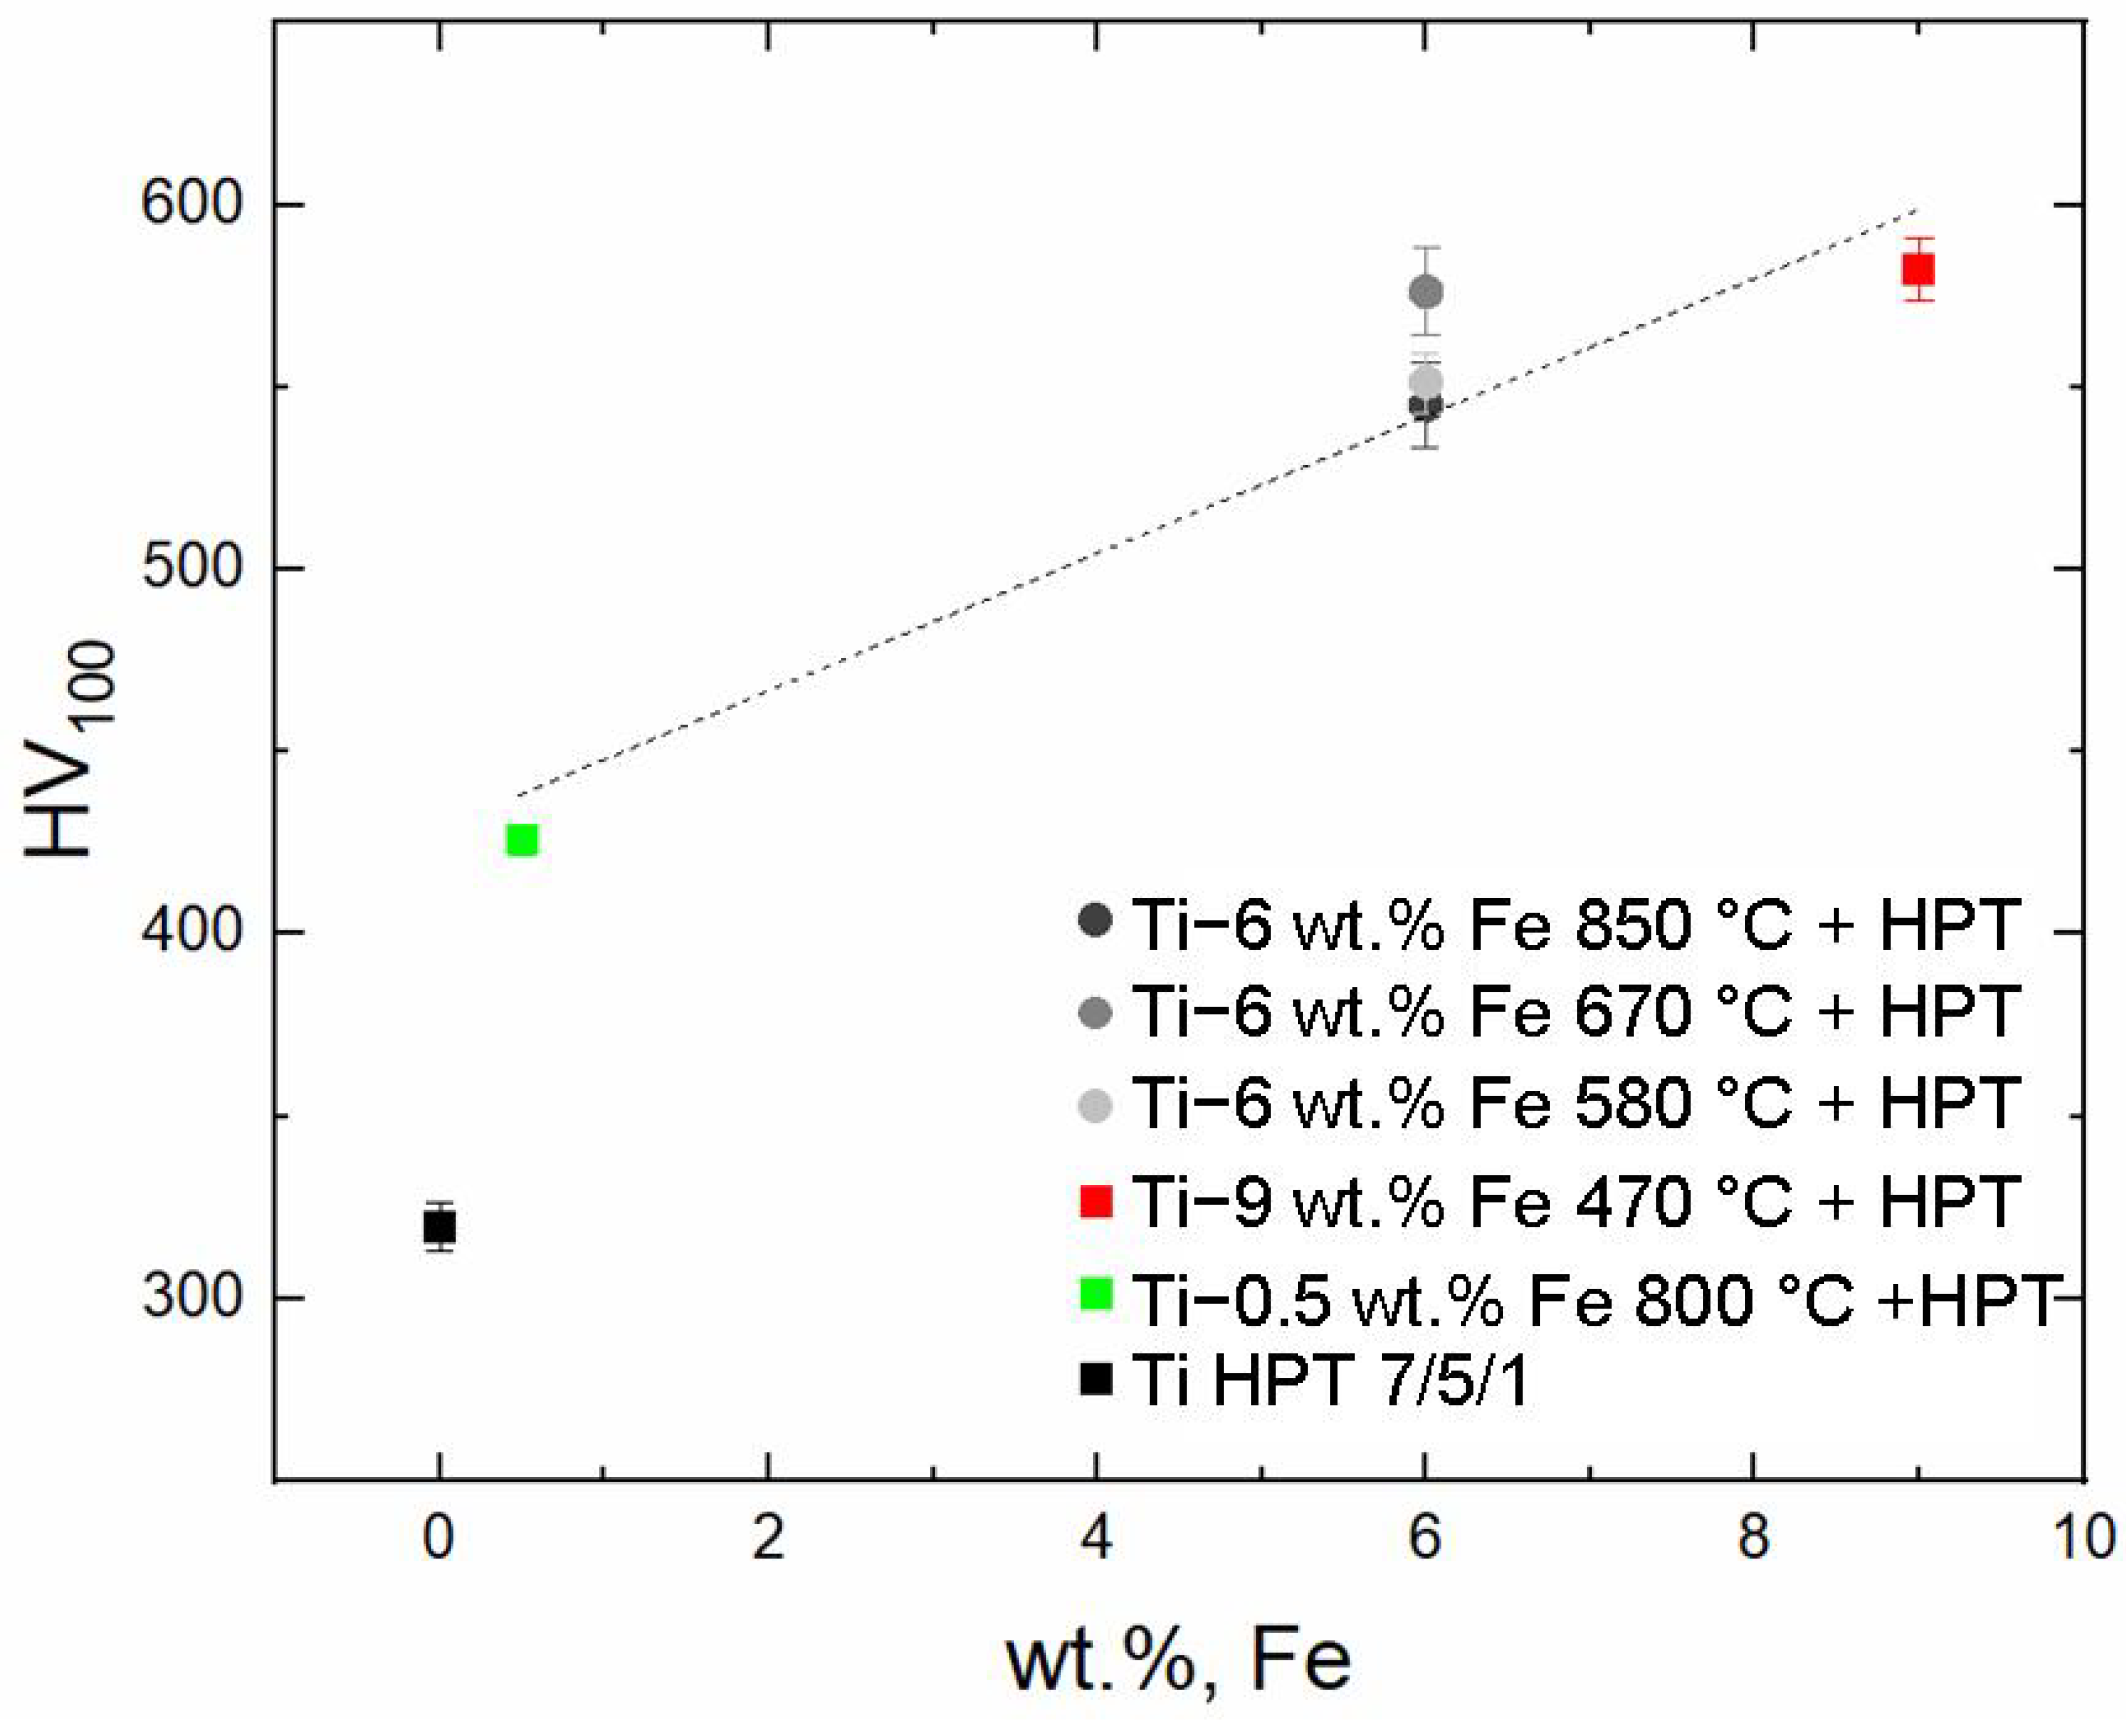
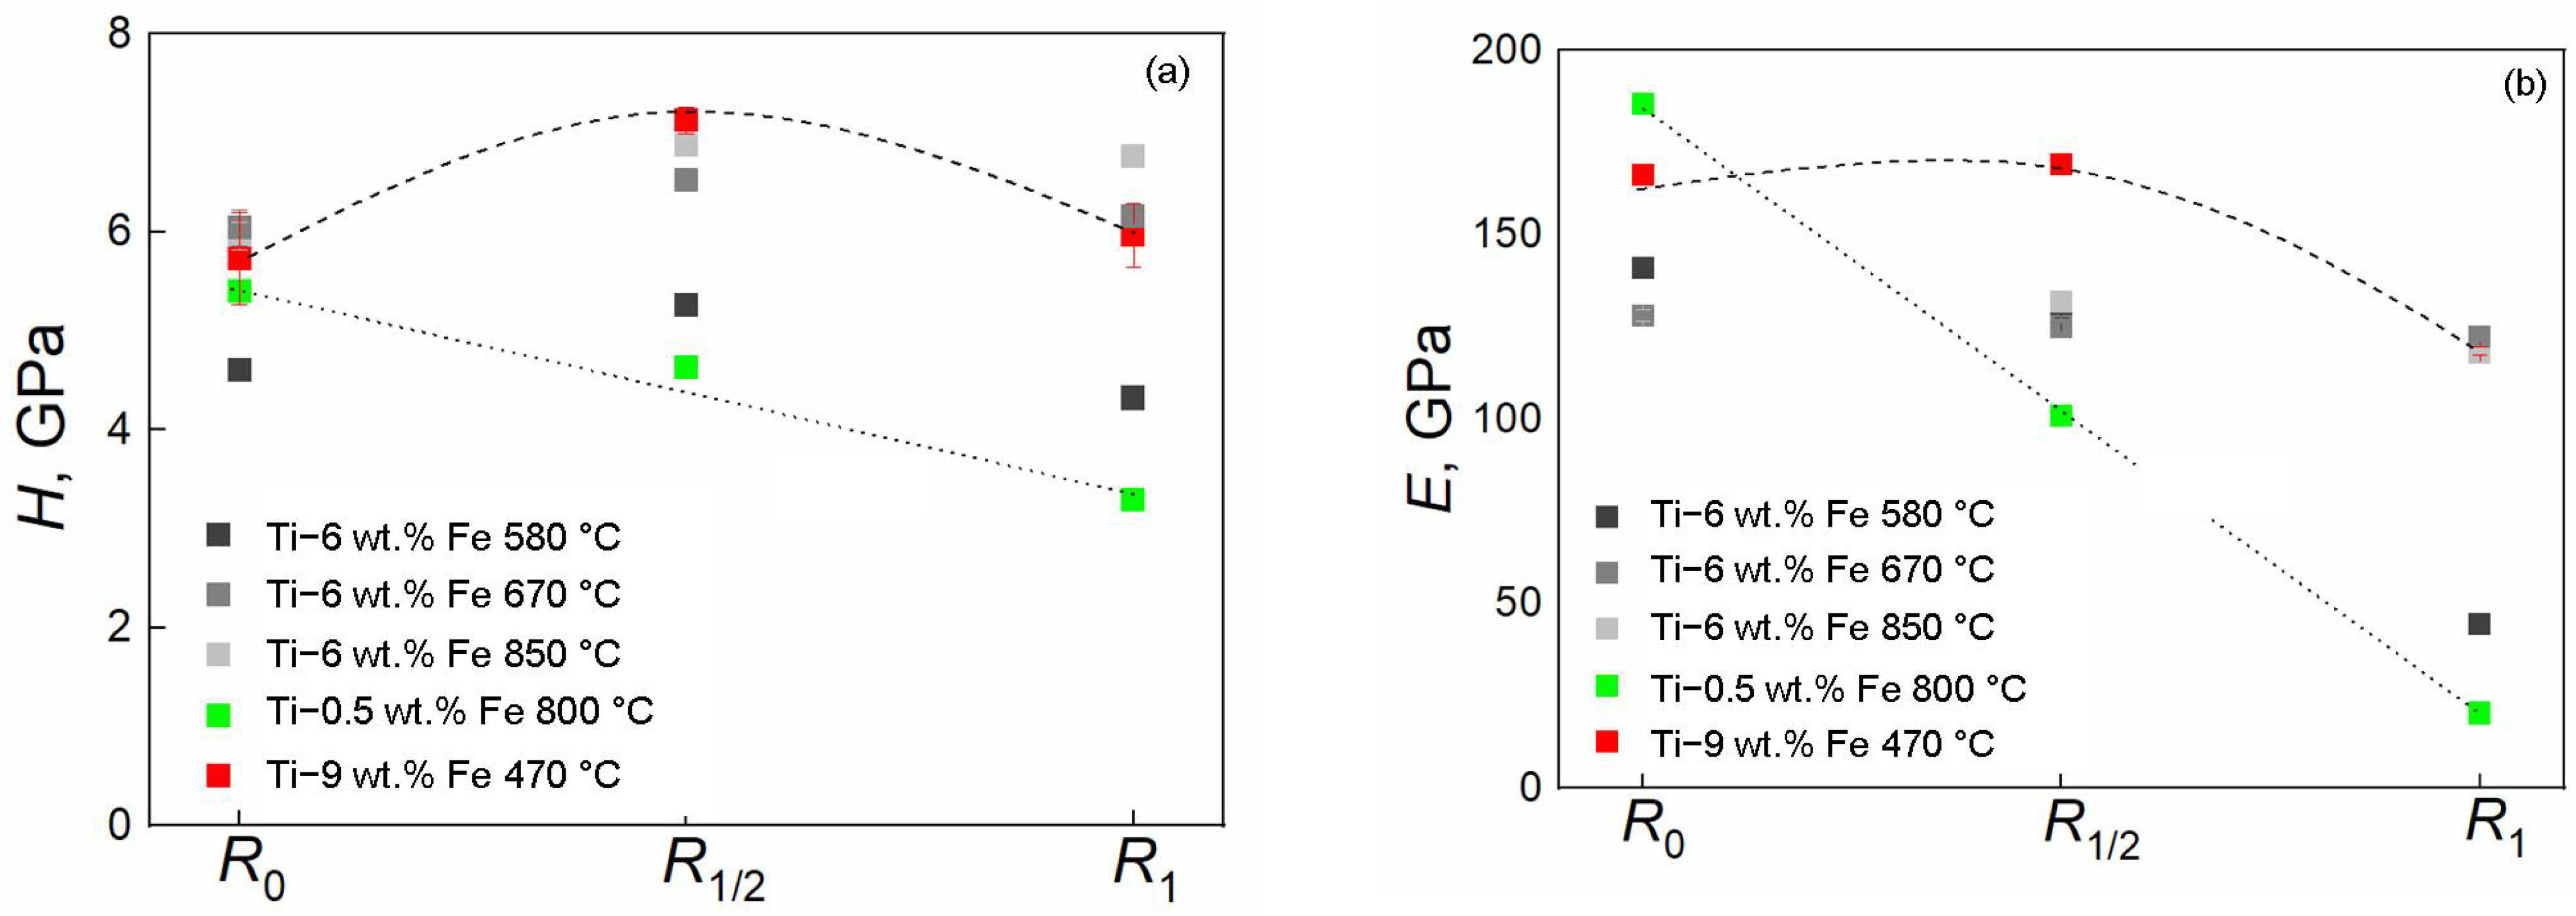
3.3. Nanoindentation and Microhardness of Samples after HPT

Figure 9a shows the P-h diagrams taken from the middle of the radius of the samples processed through HPT. The extreme curves relate to alloys with 0.5 and 9 wt.% iron. They correspond to the softest and hardest response of the material, respectively. Figure 9b shows a typical imprint of the Berkovich indenter for the studied alloys. The length of the imprint side is about 6 µm. There are no specific features on the imprint, and there are no parapets around the imprint. Based on the P-h diagrams, the values of nanohardness (H) and Young’s modulus (E) were calculated.
The measured values of microhardness (Figure 10) show an increase in the alloy hardness with an increase in the iron content. Alloying titanium with 0.5 wt.% Fe leads to an increase in microhardness by more than 100 HV compared with pure titanium. Alloy with 9 wt.% Fe shows a 55% increase in microhardness. It was noted that although the microstructures of the Ti–6 wt.% Fe alloy differ after HPT, the microhardness values are similar.

4. Discussion

Based on the data obtained from the P-h curves in three regions (center, middle of the radius, and edge of the sample), the values of H and E as a function of the analyzed region are shown in Figure 11. It can be seen that the values corresponding to 0.5 wt.% of iron are the smallest, but there is a linear decrease in values from the center to the edge of the HPT disc. In the center, the material has higher hardness and Young’s modulus, while the edge of the sample shows a low value of H = 3.3 ± 0.1 GPa and the abnormally low value of E = 20.4 ± 0.5 GPa. However, such “abnormal” E values on the edges of samples in titanium–iron alloys have been published earlier in Refs. [80,83]. The upper dotted line refers to the 9 wt.% of iron, and it has a maximum in the middle of the sample radius. The nanohardness of samples doped with 6 wt.% of Fe linearly depends on the radius, and the hardness increases. Therefore, at a pre-annealing temperature of 580 °C, the abnormally low value of E = 44.5 ± 0.8 GPa is again manifested at the edge of the sample.
In a Ti–Fe alloy, the iron content determines the kinetics of growth and dissolution of phases. Under high-pressure conditions, the mass transfer of iron atoms is controlled by the dislocation glide imposed by shear stresses. The high density of mobile dislocations with cores supersaturated with vacancies as well as vacancies of interphase boundaries can cause an abnormal drop in the Young’s modulus in titanium and titanium alloys [84,85]. Another reason for the decrease of the Young’s modulus at the edge of the sample in combination with the high mobility of dislocations can be the nanoporosity of the material [86]. The porosity of the material and the oxygen content in the studied alloys were not determined in this work.
Next, the dependences of H and E values on the iron content in Ti–Fe alloys were derived (Figure 12). The R1/2 values were taken for these plots. All dependences are linear, and the magnitudes of H and E increase with the rise of the Fe content in the alloy. There is a sharp decrease in the nanohardness value in the Ti–6 wt.% Fe alloy annealed at 580 °C, while the fraction of the ω-phase for this alloy is the highest. Based on these results, we can make an assumption based on the impact of the pre-annealing on the phase composition of samples after HPT. We can assume that the lower the pre-annealing temperature, the higher the fraction of the ω-phase in the titanium–iron alloy and the lower the nanohardness value.
Because the dependencies in Figure 12 are linear, we decided to check how strong the correlation among H, E, and the fractions of α-, β-, and ω-phases is based on the results shown in Figure 13. We considered all of our dependencies as linear. In the direction of correlation, it is positive/forward (Figure 13c), negative/reverse (Figure 13b), and there is no connection (Figure 13a).
In Figure 13a, the E and H values are almost independent of the portion of the α-phase and the slopes are close to zero, i.e., −0.097 and −0.028, respectively. The absence of correlation and the spread of experimental points among the values of nanohardness and Young’s modulus and the fraction of the α-phase indicates the absence of correlation of the studied parameters. For the β-phase, the E/H dependencies have correlation coefficients equal to −0.881/−0.0623 (Figure 13b), and for the ω-phase E/H they are 0.898/0.660 (Figure 13c). On the Chaddock scale for a qualitative assessment of the strength of the coupling of characteristics, the derived values are attributed to high indicators [87]. A weak spread of experimental points also indicates a high correlation of parameters. In any case, the relationship of H from the portion of β- and ω-phases is “noticeable”, and for E it is “high”.
Combining the results of previously published studies on titanium–iron alloys [74,80] and the results obtained in this work, two graphs were constructed (see Figure 14). The blue symbols in both graphs correspond to this work. Figure 14 shows that the maximum at 4 wt% Fe remained and, until 6 wt% Fe, there is no impact of the pre-annealing before HPT. Alloying with 6 wt% of Fe results in a significant impact of the pre-annealing, and the spread of the data points is large. At the same time, the lower the pre-annealing temperature, the higher the fraction of the omega phase after HPT treatment. Figure 14b shows that the nanohardness (H) is around 6 ± 1.5 GPa and weakly influenced by the fraction of the omega phase, while Young’s modulus (E) has a maximum at 60% of the ω-phase. Additional research is needed on the mechanical properties of the Ti–4wt.% Fe alloy to confirm the dotted line shown on the dependence for Young’s modulus.

5. Conclusions

1. It has been shown that the main influence on the phase transformations after HPT in titanium–iron alloys is manifested by the iron content. Although the Ti–6 wt.% Fe alloy was annealed at three different temperatures and three different states of microstructures and phase compositions were obtained, nevertheless, after HPT, the phase compositions were quite similar. The nanohardness and Young’s modulus also had similar values.
2. Ti–0.5 wt.% Fe and Ti–9 wt.% Fe alloys show extreme values of nanohardness and Young’s modulus, increasing with the rise of the Fe content.
3. We would especially like to underline the high correlation among the Young’s modulus E and the fractions of β- and ω-phases.

Author Contributions

Conceptualization, A.R.K., A.S.G., and B.B.S.; methodology, G.S.D., A.I.T., and N.S.A.; software, A.I.T., N.S.A., L.V.D., A.N.N., and A.V.D.; validation, A.I.T., and L.V.D.; formal analysis, A.V.D., A.N.N., and G.S.D.; investigation, A.I.T., N.S.A., and A.R.K.; resources, A.S.G.; data curation, A.R.K., N.S.A., and G.S.D.; writing—original draft preparation, A.S.G.; writing—review and editing, B.B.S.; visualization, L.V.D., A.N.N., and A.V.D.; supervision, B.B.S.; project administration, A.S.G.; funding acquisition, A.S.G. All authors have read and agreed to the published version of the manuscript.

Funding

The research was supported by the Russian Science Foundation grant No. 24-22-00222, https://rscf.ru/project/24-22-00222/ (accessed on 27 July 2024).

Institutional Review Board Statement

Not applicable.

Informed Consent Statement

Informed consent was obtained from all subjects involved in the study.

Data Availability Statement

The data presented in this study are available upon request from the corresponding author.

Acknowledgments

The support of the Facility Center at the ISSP RAS is kindly acknowledged.

Conflicts of Interest

The authors declare no conflicts of interest.

References

  1. Valiev, R.Z.; Alexandrov, I.V.; Islamgaliev, R.K. Processing and Properties of Nanostructured Materials Prepared by Severe Plastic Deformation. In Nanostructured Materials; Chow, G.M., Noskova, N.I., Eds.; NATO ASI Series Springer: Dordrecht, The Netherlands, 1998; Volume 50. [Google Scholar] [CrossRef]
  2. Valiev, R.Z.; Korznikov, A.V.; Mulyukov, R.R. Structure and properties of ultrafine-grained materials produced by severe plastic deformation. Mater. Sci. Eng. A 1993, 168, 141–148. [Google Scholar] [CrossRef]
  3. Edalati, K.; Matsubara, E.; Horita, Z. Processing pure Ti by high-pressure torsion in wide ranges of pressure and strain. Metall. Mater. Trans. A 2009, 40, 2079–2086. [Google Scholar] [CrossRef]
  4. Edalati, K.; Daio, T.; Arita, M.; Lee, S.; Horita, Z.; Togo, A.; Tanaka, I. High pressure torsion of titanium at cryogenic and room temperatures: Grain size effect on allotropic phase transformation. Acta Mater. 2014, 68, 207–213. [Google Scholar] [CrossRef]
  5. Deng, G.Y.; Bhattacharjee, T.; Chong, Y.; Zheng, R.; Bai, Y.; Shibata, A.; Tsuji, N. Characterization of microstructure with different Fe addition processed by severe plastic deformation and subsequent annealing. IOP Conf. Ser. Mater. Sci. Eng. 2017, 194, 012020. [Google Scholar] [CrossRef]
  6. Wang, C.T.; Fox, A.G.; Langdon, T.G. Microstructural evolution in ultrafine-grained titanium processed by high-pressure torsion under different pressures. J. Mater. Sci. 2014, 49, 6558–6564. [Google Scholar] [CrossRef]
  7. Sinha, S.; Sahu, V.K.; Beura, V.; Sonkusare, R.; Kalsar, R.; Das, A.K.L.; Basu, J.; Gurao, N.P.; Biswas, K. Initial texture dependence of nanocrystalline omega phase formation during high pressure torsion of commercially pure titanium. Mater. Sci. Eng. A 2021, 802, 140687. [Google Scholar] [CrossRef]
  8. Zaher, G.; Lomakin, I.; Enikeev, N.; Jouen, S.; Saiter-Fourcin, A.; Sauvage, X. Influence of strain rate and Sn in solid solution on the grain refinement and crystalline defect density in severely deformed Cu. Mater. Today Comm. 2021, 26, 101746. [Google Scholar] [CrossRef]
  9. Edalati, K.; Wang, Q.; Enikeev, N.A.; Peters, L.J.; Zehetbauer, M.J.; Schafler, E. Significance of strain rate in severe plastic deformation on steady-state microstructure and strength. Mater. Sci. Eng. A 2022, 859, 144231. [Google Scholar] [CrossRef]
  10. Lin, H.K.; Cheng, Y.H.; Li, G.Y.; Chen, Y.C.; Bazarnik, P.; Muzy, J.; Huang, Y.; Langdon, T.G. Study on the surface modification of nanostructured Ti alloys and coarse-grained Ti alloys. Metals 2022, 12, 948. [Google Scholar] [CrossRef]
  11. Figueiredo, R.B.; Langdon, T.G. Deformation mechanisms in ultrafine-grained metals with an emphasis on the Hall–Petch relationship and strain rate sensitivity . J. Mater. Res. Technol. 2021, 14, 137–159. [Google Scholar] [CrossRef]
  12. Islamgaliev, R.K.; Kazyhanov, V.U.; Shestakova, L.O.; Sharafutdinov, A.V.; Valiev, R.Z. Microstructure and mechanical properties of titanium (Grade 4) processed by high-pressure torsion. Mater. Sci. Eng. A 2008, 493, 190–194. [Google Scholar] [CrossRef]
  13. Sotniczuk, A.; Garbacz, H. Nanostructured bulk titanium with enhanced properties—Strategies and prospects for dental applications. Adv. Eng. Mater. 2021, 23, 2000909. [Google Scholar] [CrossRef]
  14. Chen, W.J.; Xu, J.; Liu, D.T.; Bao, J.X.; Sabbaghianrad, S.; Shan, D.B.; Guo, B.; Langdon, T.G. Microstructural evolution and microhardness variations in pure titanium processed by high-pressure torsion. Adv. Eng. Mater. 2020, 22, 1901462. [Google Scholar] [CrossRef]
  15. Li, H.; Zhang, W.C.; Yang, J.L.; Pan, J.Q.; Chen, W.Z.; Cui, G.R.; Wang, G.F.; Chu, G.N. Microstructural evolution and mechanical properties of Ti-22Al-25Nb alloy fabricated by high-pressure torsion under ageing treatment. J. Mater. Eng. Perform. 2022, 31, 07465. [Google Scholar] [CrossRef]
  16. Bazarnik, P.; Bartkowska, A.; Huang, Y.; Szlazak, K.; Adamczyk-Cieslak, B.; Sort, J.; Lewandowska, M.; Langdon, T.G. Fabrication of hybrid nanocrystalline Al–Ti alloys by mechanical bonding through high-pressure torsion. Mater. Sci. Eng. A 2022, 833, 142549. [Google Scholar] [CrossRef]
  17. Liss, K.D.; Liu, X.J.; Li, X.; Han, J.K.; Dippenaar, R.J.; Kawasaki, M. On the thermal evolution of high-pressure torsion processed titanium aluminide. Mater. Lett. 2021, 304, 130650. [Google Scholar] [CrossRef]
  18. Bartkowska, A.; Bazarnik, P.; Huang, Y.; Lewandowska, M.; Langdon, T.G. Using high-pressure torsion to fabricate an Al–Ti hybrid system with exceptional mechanical properties. Mater. Sci. Eng. A 2021, 799, 140114. [Google Scholar] [CrossRef]
  19. Han, J.K.; Li, X.; Dippenaar, R.; Liss, K.D.; Kawasaki, M. Microscopic plastic response in a bulk nano-structured TiAl intermetallic compound processed by high-pressure torsion. Mater. Sci. Eng. A 2018, 714, 84–92. [Google Scholar] [CrossRef]
  20. Cao, G.H.; Russell, A.M.; Oertel, C.G.; Skrotzki, W. Microstructural evolution of TiAl-based alloys deformed by high-pressure torsion. Acta Mater. 2015, 98, 103–112. [Google Scholar] [CrossRef]
  21. Edalati, K.; Ashida, M.; Horita, Z.; Matsui, T.; Kato, H. Wear resistance and tribological features of pure aluminum and Al–Al2O3 composites consolidated by high-pressure torsion. Wear 2014, 310, 83–89. [Google Scholar] [CrossRef]
  22. Edalati, K.; Iwaoka, H.; Horita, Z.; Tanaka, M.; Higashida, K.; Fujiwara, H.; Ameyama, K. Fabrication of ultrafine-grained Ti-(5-50 wt.%) Al2O3 composites using high-pressure torsion. Kovové Mater. Metal. Mater. 2011, 49, 85–91. [Google Scholar] [CrossRef]
  23. Cao, G.H.; Kloeden, B.; Rybacki, E.; Oertel, C.G.; Skrotzki, W. High strain torsion of a TiAl-based alloy. Mater. Sci. Eng. A 2008, 483–484, 512–516. [Google Scholar] [CrossRef]
  24. Cao, G.H.; Skrotzki, W.; Gemming, T. Transmission electron microscopy investigation of Ti2Al precipitation in titanium aluminides during high-strain torsion. J. Alloys Compd. 2006, 417, 169–172. [Google Scholar] [CrossRef]
  25. Oh, S.H.; Kiener, D. Synthesis and mechanical characterisation of an ultra-fine grained Ti-Mg composite. Materials 2016, 9, 688. [Google Scholar] [CrossRef]
  26. Edalati, K.; Emami, H.; Staykov, A.; Smith, D.J.; Akiba, E.; Horita, Z. Formation of metastable phases in magnesium–titanium system by high-pressure torsion and their hydrogen storage performance. Acta Mater. 2015, 99, 150–156. [Google Scholar] [CrossRef]
  27. Deng, G.; Bhattacharjee, T.; Chong, Y.; Zheng, R.X.; Bai, Y.; Shibata, A.; Tsuji, N. Influence of Fe addition in CP titanium on phase transformation, microstructure and mechanical properties during high pressure torsion. J. Alloys Compd. 2020, 822, 153604. [Google Scholar] [CrossRef]
  28. Gurau, G.; Gurau, C.; Braz Fernandes, F.M.; Alexandru, P.; Sampath, V.; Marin, M.; Galbinasu, B.M. Structural characteristics of multilayered Ni-Ti nanocomposite fabricated by high speed high pressure torsion (HSHPT). Metals 2020, 10, 1629. [Google Scholar] [CrossRef]
  29. Sundeev, R.V.; Glezer, A.M.; Shalimova, A.V. Are the abilities of crystalline alloys to amorphization upon melt quenching and severe plastic deformation identical or different? Mater. Lett. 2016, 175, 72–74. [Google Scholar] [CrossRef]
  30. Resnina, N.; Belyaev, S.; Zeldovich, V.; Pilyugin, V.; Frolova, N.; Glazova, D. Variations in martensitic transformation parameters due to grains evolution during post-deformation heating of Ti-50.2 at.% Ni alloy amorphized by HPT. Therm. Acta 2016, 627–629, 20–30. [Google Scholar] [CrossRef]
  31. Shri, D.N.A.; Tsuchiya, K.; Yamamoto, A. Cytocompatibility evaluation and surface characterization of TiNi deformed by high-pressure torsion. Mater. Sci. Eng. C 2014, 43, 411–417. [Google Scholar] [CrossRef] [PubMed]
  32. Shri, D.N.A.; Tsuchiya, K.; Yamamoto, A. Effect of high-pressure torsion deformation on surface properties and biocompatibility of Ti-50.9 mol. %Ni alloys. Biointerphases 2014, 9, 029007. [Google Scholar] [CrossRef]
  33. Shri, D.N.A.; Tsuchiya, K.; Yamamoto, A. Surface characterization of TiNi deformed by high-pressure torsion. Appl. Surf. Sci. 2014, 289, 338–344. [Google Scholar] [CrossRef]
  34. Pushin, V.G.; Kuranova, N.N.; Kourov, N.I.; Valiev, R.Z.; Korolev, A.V.; Makarov, V.V.; Pushin, A.V.; Uksusnikov, A.N. Effect of heat treatment on structural and phase transformations in the Ti49.5Ni50.5 alloy amorphized by high-pressure torsion. Phys. Met. Metallogr. 2013, 114, 488–502. [Google Scholar] [CrossRef]
  35. Mahesh, K.K.; Braz Fernandes, F.M.; Gurau, G. Stability of thermal-induced phase transformations in the severely deformed equiatomic Ni–Ti alloys. J. Mater. Sci. 2012, 47, 6005–6014. [Google Scholar] [CrossRef]
  36. Pushin, V.G.; Valiev, R.Z.; Kourov, N.I.; Kuranova, N.N.; Makarov, V.V.; Pushin, A.V.; Uksusnikov, A.N. Phase and structural transformations in the Ti49.5Ni50.5 alloy with a shape-memory effect during torsion under high pressure. Phys. Met. Metallogr. 2012, 113, 256–270. [Google Scholar] [CrossRef]
  37. Kourov, N.I.; Pushin, V.G.; Korolev, A.V.; Kazantsev, V.A.; Knyazev, Y.V.; Kuranova, N.N. Effect of plastic deformation on physical properties and structure of the shape memory alloy Ti49.5Ni50.5. Phys. Sol. State 2011, 53, 1397–1403. [Google Scholar] [CrossRef]
  38. Singh, R.; Divinski, S.V.; Roesner, H.; Prokofiev, E.A.; Valiev, R.Z.; Wilde, G. Microstructure evolution in nanocrystalline NiTi alloy produced by HPT. J. Alloys Compd. 2011, 509, S290–S293. [Google Scholar] [CrossRef]
  39. Singh, R.; Divinski, S.V.; Roesner, H.; Prokofiev, E.A.; Valiev, R.Z.; Wilde, G. Annealing behaviour of nanocrystalline NiTi (50 at% Ni) alloy produced by high-pressure torsion. Phil. Mag. 2011, 91, 3079–3092. [Google Scholar] [CrossRef]
  40. Surikova, N.S.; Klopotov, A.A.; Korznikova, E.A. Mechanisms of plastic deformation in microcrystalline and nanocrystalline TiNi-based alloys. Phys. Met. Metallogr. 2010, 110, 269–278. [Google Scholar] [CrossRef]
  41. Gunderov, D.V.; Kuranova, N.N.; Luk’yanov, A.V.; Uksusnikov, A.N.; Prokof’ev, E.A.; Yurchenko, L.I.; Valiev, R.Z.; Pushin, V.G. Application of severe plastic deformation by torsion to form amorphous and nanocrystalline states in large-size TiNi alloy sample. Phys. Met. Metallogr. 2009, 108, 131–138. [Google Scholar] [CrossRef]
  42. Valiev, R.; Gunderov, D.; Prokofiev, E.; Pushin, V.; Zhu, Y. Nanostructuring of TiNi alloy by SPD processing for advanced properties. Mater. Trans. 2008, 49, 97–101. [Google Scholar] [CrossRef]
  43. Pushin, V.G.; Valiev, R.Z.; Zhu, Y.T.; Gunderov, D.V.; Kourov, N.I.; Kuntsevich, T.E.; Uksusnikov, A.N.; Yurchenko, L.I. Effect of severe plastic deformation on the behavior of Ti–Ni shape memory alloys. Mater. Trans. 2006, 47, 694–697. [Google Scholar] [CrossRef]
  44. Prokoshkin, S.D.; Khmelevskaya, I.Y.; Dobatkin, S.V.; Trubitsyna, I.B.; Tatyanin, E.V.; Stolyarov, V.V.; Prokofiev, E.A. Alloy composition, deformation temperature, pressure and post-deformation annealing effects in severely deformed Ti–Ni based shape memory alloys. Acta Mater. 2005, 53, 2703–2714. [Google Scholar] [CrossRef]
  45. Sergueeva, A.V.; Stolyarov, V.V.; Valiev, R.Z.; Mukherjee, A.K. Advanced mechanical properties of pure titanium with ultrafine grained structure. Scr. Mater. 2001, 45, 747–752. [Google Scholar] [CrossRef]
  46. Bartha, K.; Strasky, J.; Veverkova, A.; Vesely, J.; Cizek, J.; Malek, J.; Polyakova, V.; Semenova, I.; Janecek, M. Phase Transformations upon ageing in Ti15Mo alloys to two different deformation methods. Metals 2021, 11, 1230. [Google Scholar] [CrossRef]
  47. Jiang, B.Z.; Emura, S.; Tsuchiya, K. Effect of quasi-hydrostatic pressure on deformation mechanism in Ti-10Mo alloy. Metals 2020, 10, 1387. [Google Scholar] [CrossRef]
  48. Bartha, K.; Strasky, J.; Veverkova, A.; Barriobero-Vila, P.; Lukac, F.; Dolezal, P.; Sedlak, P.; Polyakova, V.; Semenova, I.; Janecek, M. Effect of the high-pressure torsion (HPT) and subsequent isothermal annealing on the phase transformation in biomedical Ti15Mo alloy. Metals 2019, 9, 1194. [Google Scholar] [CrossRef]
  49. Bartha, K.; Strasky, J.; Harcuba, P.; Semenova, I.; Polyakova, V.; Janecek, M. Heterogeneous precipitation of the α-phase in Ti15Mo alloy subjected to high pressure torsion. Acta Phys. Pol. A 2018, 134, 790–793. [Google Scholar] [CrossRef]
  50. Afonso, C.R.M.; Amigo, A.; Stolyarov, V.; Gunderov, D.; Amigo, V. From porous to dense nanostructured β-Ti alloys through high-pressure torsion. Sci. Rep. 2017, 7, 13618. [Google Scholar] [CrossRef]
  51. Vaclavova, K.; Strasky, J.; Polyakova, V.; Straska, J.; Nejezchlebova, J.; Seiner, H.; Semenova, I.; Janecek, M. Microhardness and microstructure evolution of ultra-fine grained Ti-15Mo and TIMETAL LCB alloys prepared by high pressure torsion. Mater. Sci. Eng. A 2017, 682, 220–228. [Google Scholar] [CrossRef]
  52. Zafari, A.; Wei, X.S.; Xu, W.; Xia, K. Formation of nanocrystalline β structure in metastable beta Ti alloy during high pressure torsion: The role played by stress induced martensitic transformation. Acta Mater. 2015, 97, 146–155. [Google Scholar] [CrossRef]
  53. Jiang, B.Z.; Tsuchiya, K.; Emura, S.; Min, X.H. Effect of high-pressure torsion process on precipitation behavior of α phase in β-type Ti–15Mo alloy. Mater. Trans. 2014, 55, 877–884. [Google Scholar] [CrossRef]
  54. Xu, W.; Edwards, D.P.; Wu, X.; Stoica, M.; Calin, M.; Kuehn, U.; Eckert, J.; Xia, K. Promoting nano/ultrafine-duplex structure via accelerated α precipitation in a β-type titanium alloy severely deformed by high-pressure torsion. Scr. Mater. 2013, 68, 67–70. [Google Scholar] [CrossRef]
  55. Cvijovic-Alagic, I.; Laketic, S.; Bajat, J.; Hohenwarter, A.; Rakin, M. Grain refinement effect on the Ti-45Nb alloy electrochemical behavior in simulated physiological solution. Surf. Coat. Technol. 2021, 423, 127609. [Google Scholar] [CrossRef]
  56. Laketic, S.; Rakin, M.; Momcilovic, M.; Ciganovic, J.; Veljovic, D.; Cvijovic-Alagic, I. Influence of laser irradiation parameters on the ultrafine-grained Ti-45Nb alloy surface characteristics. Surf. Coat. Technol. 2021, 418, 127255. [Google Scholar] [CrossRef]
  57. Cvijovic-Alagic, I.; Rakin, M.; Laketic, S.; Zagorac, D. Microstructural study of Ti-45Nb alloy before and after HPT processing using experimental and ab initio data mining approach. Mater. Charact. 2020, 169, 110635. [Google Scholar] [CrossRef]
  58. Campos-Quiros, A.; Cubero-Sesin, J.M.; Edalati, K. Synthesis of nanostructured biomaterials by high-pressure torsion: Effect of niobium content on microstructure and mechanical properties of Ti-Nb alloys. Mater. Sci. Eng. A 2020, 795, 139972. [Google Scholar] [CrossRef]
  59. Barjaktarevic, D.; Medjo, B.; Stefane, P.; Gubeljak, N.; Cvijovic-Alagic, I.; Djokic, V.; Rakin, M. Tensile and corrosion properties of anodized ultrafine-grained Ti–13Nb–13Zr biomedical alloy obtained by high-pressure torsion. Metal. Mater. Int. 2021, 27, 3325–3341. [Google Scholar] [CrossRef]
  60. Voelker, B.; Maier-Kiener, V.; Werbach, K.; Mueller, T.; Pilz, S.; Calin, M.; Eckert, J.; Hohenwarter, A. Influence of annealing on microstructure and mechanical properties of ultrafine-grained Ti45Nb. Mater. Design 2019, 179, 107864. [Google Scholar] [CrossRef]
  61. Delshadmanesh, M.; Khatibi, G.; Ghomsheh, M.Z.; Lederer, M.; Zehetbauer, M.; Danninger, H. Influence of microstructure on fatigue of biocompatible β-phase Ti-45Nb. Mater. Sci. Eng. A 2017, 706, 83–94. [Google Scholar] [CrossRef]
  62. Voelker, B.; Jaeger, N.; Calin, M.; Zehetbauer, M.; Eckert, J.; Hohenwarter, A. Influence of testing orientation on mechanical properties of Ti45Nb deformed by high pressure torsion. Mater. Des. 2017, 114, 40–46. [Google Scholar] [CrossRef]
  63. Panigrahi, A.; Sulkowski, B.; Waitz, T.; Ozaltin, K.; Chrominski, W.; Pukenas, A.; Horky, J.; Lewandowska, M.; Skrotzki, W.; Zehetbauer, M. Mechanical properties, structural and texture evolution of biocompatible Ti–45Nb alloy processed by severe plastic deformation. J. Mech. Behav. Biomed. Mater. 2016, 62, 93–105. [Google Scholar] [CrossRef] [PubMed]
  64. Panigrahi, A.; Boenisch, M.; Waitz, T.; Schafler, E.; Calin, M.; Eckert, J.; Skrotzki, W.; Zehetbauer, M. Phase transformations and mechanical properties of biocompatible Ti–16.1Nb processed by severe plastic deformation. J. Alloys Compd. 2015, 628, 434–441. [Google Scholar] [CrossRef]
  65. Edalati, K.; Daio, T.; Lee, S.; Horita, Z.; Nishizaki, T.; Akune, T.; Nojima, T.; Sasaki, T. High strength and superconductivity in nanostructured niobium–titanium alloy by high-pressure torsion and annealing: Significance of elemental decomposition and supersaturation. Acta Mater. 2014, 80, 149–158. [Google Scholar] [CrossRef]
  66. Sulkowski, B.; Panigrahi, A.; Ozaltin, K.; Lewandowska, M.; Mikulowski, B.; Zehetbauer, M. Evolution of strength and structure during SPD processing of Ti–45Nb alloys: Experiments and simulations. J. Mater. Sci. 2014, 49, 6648–6655. [Google Scholar] [CrossRef]
  67. Dobromyslov, A.V.; Taluts, N.I.; Pilyugin, V.P. Severe plastic deformation by high-pressure torsion of Hf and Hf-Ti alloys. Int. J. Refr. Met. Hard Mater. 2020, 93, 105354. [Google Scholar] [CrossRef]
  68. Edalati, K.; Shao, H.; Emami, H.; Iwaoka, H.; Akiba, E.; Horita, Z. Activation of titanium-vanadium alloy for hydrogen storage by introduction of nanograins and edge dislocations using high-pressure torsion. Int. J. Hydr. Ener. 2016, 41, 8917–8924. [Google Scholar] [CrossRef]
  69. Oliver, W.C.; Pharr, G.M. Nanoindentation in materials research: Past, present, and future. MRS Bulletin 2010, 35, 897–907. [Google Scholar] [CrossRef]
  70. Niu, J.; Guo, Y.; Li, K.; Liu, W.; Dan, Z.; Sun, Z.; Chang, H.; Zhou, L. Improved mechanical, bio-corrosion properties and in vitro cell responses of Ti-Fe alloys as candidate dental implants. Mater. Sci. Eng. C 2021, 122, 111917. [Google Scholar] [CrossRef]
  71. Straumal, B.B.; Kilmametov, A.R.; Ivanisenko, Y.; Mazilkin, A.A.; Valiev, R.Z.; Afonikova, N.S.; Hahn, H. Diffusive and displacive phase transitions in Ti–Fe and Ti–Co alloys under high pressure torsion. J.Alloys Compd. 2018, 735, 2281–2286. [Google Scholar] [CrossRef]
  72. Chong, Y.; Deng, G.; Shibata, A.; Tsuji, N. Microstructure Evolution and Phase Transformation of Ti-1.0 wt%Fe Alloy with an Equiaxed α+β Initial Microstructure during High-Pressure Torsion and Subsequent Annealing. Adv. Eng. Mater. 2019, 21, 1900607. [Google Scholar] [CrossRef]
  73. Kilmametov, A.; Ivanisenko, Y.; Straumal, B.B.; Mazilkin, A.A.; Gornakova, A.S.; Kriegel, M.J.; Fabrichnaya, O.B.; Rafaja, D.; Hahn, H. Transformations of α’ martensite in Ti–Fe alloys under high pressure torsion. Scripta Mater. 2017, 136, 46–49. [Google Scholar] [CrossRef]
  74. Kilmametov, A.; Ivanisenko, Y.; Mazilkin, A.A.; Straumal, B.B.; Gornakova, A.S.; Fabrichnaya, O.B.; Kriegel, M.J.; Rafaja, D.; Hahn, H. The α→ω and β→ω phase transformations in Ti–Fe alloys under high-pressure torsion. Acta Mater. 2018, 144, 337–351. [Google Scholar] [CrossRef]
  75. Gornakova, A.S.; Straumal, B.B.; Nekrasov, A.N.; Kilmametov, A.; Afonikova, N.S. Grain boundary wetting by a second solid phase in Ti-Fe alloys. J. Mater. Eng. Perform. 2018, 27, 4989–4992. [Google Scholar] [CrossRef]
  76. Kriegel, M.J.; Kilmametov, A.; Klemm, V.; Schimpf, C.; Straumal, B.B.; Gornakova, A.S.; Ivanisenko, Y.; Fabrichnaya, O.; Hahn, H.; Rafaja, D. Thermal stability of athermal ω-Ti(Fe) produced upon quenching of β-Ti(Fe). Adv. Eng. Mater. 2019, 21, 1800158. [Google Scholar] [CrossRef]
  77. Kriegel, M.J.; Kilmametov, A.; Rudolph, M.; Straumal, B.B.; Gornakova, A.S.; Ivanisenko, Y.; Fabrichnaya, O.; Hahn, H.; Rafaja, D. Transformation pathway upon heating of Ti-Fe alloys deformed by high-pressure torsion. Adv. Eng. Mater. 2018, 20, 1700933. [Google Scholar] [CrossRef]
  78. Zavorotnev, Y.D.; Davdjan, G.C.; Varyukhin, V.N.; Petrenko, A.G.; Tomashevskaya, E.Y.; Straumal, B.B. Evolution of nanohardness of binary titanium-based solutions under high-pressure torsion. J. Surf. Inv. X-ray, Synch. Neutron Techn. 2024, 18, 660–665. [Google Scholar] [CrossRef]
  79. Straumal, B.B.; Kilmametov, A.R.; Mazilkin, A.A.; Gornakova, A.S.; Fabrichnaya, O.B.; Kriegel, M.J.; Rafaja, D.; Bulatov, M.F.; Nekrasov, A.N.; Baretzky, B. The formation of the omega phase in the titanium-iron system under shear deformation. JETP Lett. 2020, 111, 568–574. [Google Scholar] [CrossRef]
  80. Gornakova, A.S.; Straumal, B.B.; Mazilkin, A.A.; Afonikova, N.S.; Novikova, E.A.; Karpov, M.I.; Tyurin, A.I. Phase composition, nanohardness and Young’s modulus in Ti–Fe alloys after heat treatment and high pressure torsion. Metals 2021, 11, 1657. [Google Scholar] [CrossRef]
  81. Oliver, W.C.; Pharr, G.M. An improved technique for determining hardness and elastic modulus using load and displacement sensing indentation experiments. J. Mater. Res. 1992, 7, 1564–1583. [Google Scholar] [CrossRef]
  82. Oliver, W.C.; Pharr, G.M. Measurement of hardness and elastic modulus by instrumented indentation: Advances in understanding and refinements to methodology. J. Mater. Res. 2004, 19, 3–20. [Google Scholar] [CrossRef]
  83. Gornakova, A.S.; Straumal, B.B.; Golovin, Y.I.; Afonikova, N.S.; Pirozhkova, T.S.; Tyurin, A.I. Phase Transformations and mechanical properties of two-component titanium alloys after heat treatment in the two-phase region (α + intermetallic compound) and high-pressure torsion. J. Surf. Inv. X-ray Synch. Neut. Techn. 2021, 15, 1154–1158. [Google Scholar] [CrossRef]
  84. Kardashev, B.K.; Sapozhnikov, K.V.; Betekhtin, V.I.; Kadomtsev, A.G.; Narykova, M.V. Internal friction, Young’s modulus, and electrical resistivity of submicrocrystalline titanium. Phys. Sol. State 2017, 59, 2381–2386. [Google Scholar] [CrossRef]
  85. Kardashev, B.K.; Narykova, M.V.; Betekhtin, V.I.; Kadomtsev, A.G. Evolution of elastic properties of Ti and its alloys due to severe plastic deformation. Phys. Mesomech. 2020, 23, 193–198. [Google Scholar] [CrossRef]
  86. Qi, Y.; Kosinova, A.; Kilmametov, A.R.; Straumal, B.B.; Rabkin, E. Generation and healing of porosity in high purity copper by high-pressure torsion. Mater. Charact. 2018, 145, 1–9. [Google Scholar] [CrossRef]
  87. Koterov, A.N.; Ushenkova, L.N.; Zubenkova, E.S.; Kalinina, M.V.; Biryukov, A.P.; Lastochkina, E.M.; Molodtsova, D.V.; Vayison, A.A. The power of communication. Message 2. Gradations of the correlation value. Med. Radiol. Radiat. Saf. 2019, 64, 12–24. [Google Scholar] [CrossRef]
Figure 1. The part of the Ti–Fe phase diagram with marked annealing temperatures (circles).
Materials 17 03740 g001
Figure 2. SEM images: (a) Ti–0.5 wt.% Fe annealed at 800 °C, (b) Ti–9 wt.% Fe at 470 °C, and Ti–6 wt.% Fe at (c) 580 °C, (d) 670 °C, (e) 850 °C.
Materials 17 03740 g002
Figure 3. XRD patterns of samples before (red lines) and after HPT (black lines): (a) Ti–0.5 wt.% Fe, (b) Ti–9 wt.% Fe и Ti–6 wt.% Fe пpи, (c) 580 °C, (d) 670 °C, (e) 850 °C. “HPT 7/5/1” means HPT at 7 GPa, 5 rot., 1 rpm.
Materials 17 03740 g003
Figure 4. SEM micrographs HPT: (a,b) Ti–0.5 wt.% Fe, 800 °C, (c,d) Ti–9 wt.% Fe at 470 °C and Ti–6 wt.% Fe at (e,f) 580 °C, (g,h) 670 °C, and (i,j) 850 °C.
Materials 17 03740 g004aMaterials 17 03740 g004b
Figure 5. Grain size in the (αTi), (βTi), (ωTi), and FeTi phases in the annealed state (filled symbols) and after HPT (open symbols): Ti–0.5 wt.% Fe (light circles), Ti–9 wt.% Fe (dark circles), and Ti–6 wt.% Fe (squares of different colors).
Materials 17 03740 g005
Figure 6. TEM images of samples after HPT: light field (a,d,g), dark field (b,e,f), and the SAED (c,f,i) patterns for alloys Ti–0.5 wt.% Fe (a,b,c), Ti–6 wt.% Fe (d,e,f), and Ti–9 wt.% Fe (g,h,i).
Materials 17 03740 g006
Figure 7. The average grain size of the phases in alloys (a) Ti–0.5 wt.% Fe (green color), (b) Ti–6 wt.% Fe (blue color), and (c) Ti–10 wt.% Fe (pink color) after HPT, measured in the dark field images of Figure 6.
Materials 17 03740 g007
Figure 8. Bright field TEM image of various phases in Ti–0.5 wt.% Fe alloy after HPT. Insets 1 to 6 show FFT images in the respective points shown in the micrograph.
Materials 17 03740 g008
Figure 9. (a) P-h diagrams taken from the middle of the radius of samples (1) Ti–0.5 wt.% Fe, Ti–6 wt.% Fe (3) for 580 °C, (4) for 670 °C, (5) for 850 °C, and (2) for the Ti–9 wt.% Fe alloy. (b) SEM image of the Berkovich indenter fingerprint taken from a Ti–6 wt.% Fe sample annealed at 670 °C and subjected to HPT.
Materials 17 03740 g009
Figure 10. The microhardness values measured in the middle of the radius of the alloy samples Ti–0.5 wt.% Fe (green square), Ti–6 wt.% Fe (circles of various grayscale), and Ti–9 wt.% Fe (red square).
Materials 17 03740 g010
Figure 11. The values of nanohardness H (a) and Young’s modulus E (b) are presented for all studied Ti–Fe alloys. They were measured in three regions of the samples: in the central part (R0), in the middle of the radius (R1/2), and at the edge (R1).
Materials 17 03740 g011
Figure 12. The dependences of the values of (a) nanohardness H and (b) Young’s modulus E on the iron content in Ti–Fe alloys measured in the middle of the radii of the samples.
Materials 17 03740 g012
Figure 13. The dependences of H and E values on the fraction of α- (a), β- (b), and ω-phases (c) in Ti–Fe alloys.
Materials 17 03740 g013
Figure 14. (a) Dependence of the fraction of the ω-phase on the concentration of iron in Ti–Fe alloys pre-annealed in various regions of the Ti–Fe phase diagram. (b) The dependences of H (squares) and E (circles) on the portion of the ω-phase. The blue symbols in the graphs refer to this work, the red symbols refer to Ref. [80], and the black ones refer to Ref. [74].
Materials 17 03740 g014
Table 1. Fractions of phases and parameters of phase lattices in alloys after annealing.
Fe, wt.%T, °CαTiβTiωTiFeTi
V, %a, c, nmV, %a, nmV, %a, c, nmV, %a, nm
0.58001000.2949; 0.4684- - - - - -
6580530.2949; 0.4685470.3206----
6670490.2950; 0.4686510.3220----
6850110.2950; 0.4686790.3243100.4626; 0.2813--
9470840.2950; 0.4686- - --160.2976
Table 2. The fractions of phases and lattice parameters in alloys after HPT.
Fe, wt.%T, °C αTiβTiωTi FeTi
V, %a, c, nmV, %a, nmV, %a, c, nmV, %a, nm
0.5800110.2949, 0.4686590.3259300.4628; 0.2821 - -
6580200.2949, 0.4686310.3210490.4624; 0.2816--
6670190.2949, 0.4686340.3240470.4628; 0.2816--
6850140.2949, 0.4687450.3239410.4620; 0.2810--
9470120.2951, 0.4683180.3249580.4631; 0.2821120.2979
Table 3. Interpretation of the electron diffraction patterns shown in Figure 6.
Ti–0.5 wt.% FeTi–6 wt.% FeTi–9 wt.% Fe
α (100)ω (001)TiFe (100)
ω (101)ω (101)α (002)
TiFe2 (104)β (200)TiFe2 (200)
β (200)TiFe2 (204)TiFe2 (202)
TiFe2 (211)α (112)β (200)
β (211)TiFe2 (220)α (110)
Disclaimer/Publisher’s Note: The statements, opinions and data contained in all publications are solely those of the individual author(s) and contributor(s) and not of MDPI and/or the editor(s). MDPI and/or the editor(s) disclaim responsibility for any injury to people or property resulting from any ideas, methods, instructions or products referred to in the content.

