3.2. Structure-Related Raman Parameter
Table 3 presents chemical composition parameters, including basicity (
), optical basicity (OB), and non-bridging oxygen per tetrahedral cation (NBO/T) calculated using XRF compositions in mol%. The NBO/T is expressed as follows [
9,
45]:
where
denotes the mole fraction of oxide (
). Additionally, Raman parameters extracted from Raman spectroscopy measurements, as shown in
Figure 2, are given in
Table 3. The center of the Raman peaks in the low-wavenumber (LW) and high-wavenumber (HW) regions are represented by
and
, respectively. The Raman parameter, (R), is calculated as the ratio of the intensity (I) of the two main bands of LW and HW, i.e., R =
/
[
43,
44]. Previous research has shown that R values are inversely and non-linearly related to the chemical parameters, with R decreasing as B, OB, and NBO/T increase [
23,
43,
44]. Thus, R serves as a representative parameter for the degree of polymerization of the silicate network in melts and glasses. In the presence of Al
2O
3, the intensity of the LW band decreases, while the intensity of the HW band increases, as observed in this study. A comparison between slags with and without Al
2O
3 shows that the addition of Al
2O
3 results in a reduction in the R values, indicating their role as network modifiers in slag systems. The shifts in
and
with varying slag compositions indicate changes in the polymerization or depolymerization of the silicate network in the slag structure. A shift in
(
) towards the left (right), i.e., lower (higher) wavenumbers, indicates the depolymerization of the silicate network, while a shift towards the right (left), i.e., higher (lower) wavenumbers, indicates the polymerization of the silicate network in the slag structure.
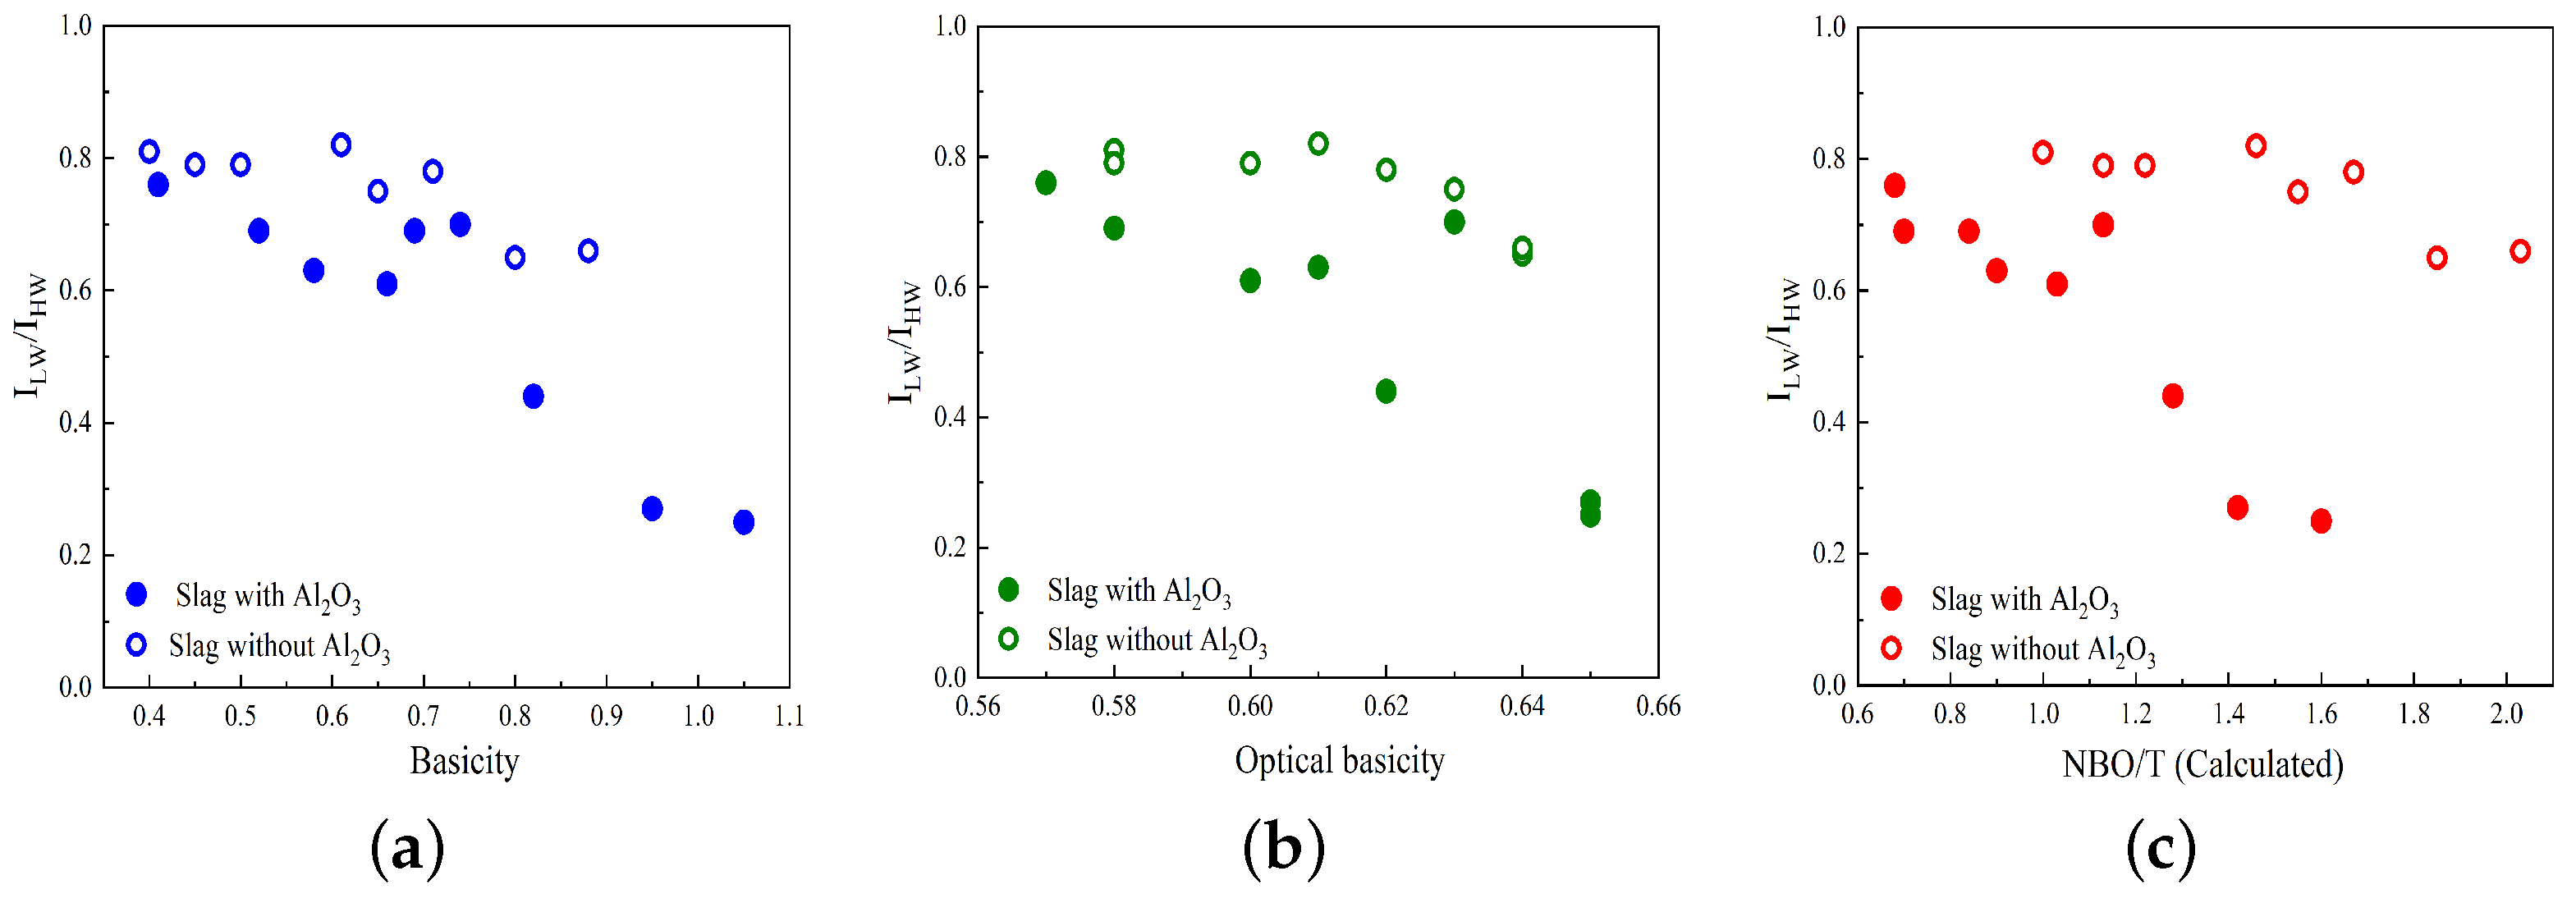
Variations in the R parameter (
/
) against basicity, optical basicity, and calculated NBO/T are illustrated in
Figure 3a–c. The slags containing and not containing Al
2O
3 are represented by solid circles and open circles, respectively. As seen in
Figure 3, the R parameter decreases as basicity, optical basicity, and NBO/T increase for slags that contain Al
2O
3, which is consistent with previous studies [
23,
43,
44]. For slags without Al
2O
3, such as the MnO-SiO
2-CaO and MnO-SiO
2-CaO-MgO systems, the R parameter decreases slightly with increasing basicity, optical basicity, and NBO/T.
3.3. Quantitative Analysis of Raman Spectra
In this section, the results of analyzing the different Q
n species (
) obtained using the deconvolution of Raman spectra in the high-wavenumber range of 800 to 1200
are presented.
Figure 4 and
Figure 5 display the fitting results for slags B1 to B4 and C1 to C4 and for slags D1 to D4 and E1 to E4, respectively. The bands of Q
2 and Q
3 species are predominant in slags without Al
2O
3 in groups B, C, and D, while the substitution of 17 wt% SiO
2 by Al
2O
3 leads to a decline in Q
3 and an increase in the Q
1 and Q
2 bands. In group E, the dominant band is Q
2 for slags without Al
2O
3, while the predominant bands are Q
0 and Q
1 for slags containing Al
2O
3. In general, the study shows that the Raman spectra of slags containing SiO
2 and slags containing both SiO
2 and Al
2O
3 behave differently, while the Raman spectra of slags with CaO and slags with both CaO and MgO are relatively similar. Additionally, as the contents of SiO
2 and Al
2O
3 are reduced, the Raman spectra in the high-wavenumber range shift to the left-hand side, and Q
n species with less bridging oxygen become predominant.
Table 4 presents the data extracted from the Raman spectral deconvolutions shown in
Figure 4 and
Figure 5, including the relative abundances (area; A
0, A
1, A
2, and A
3), and band centers (C
n) of different Q
n species. For slags in groups B and C, the variations in A
n are similar, with A
2 changing slightly and A
0 having the lowest contribution. A
3 and A
1 are the predominant relative areas for slags without and with Al
2O
3, respectively, and their contributions switch when substituting Al
2O
3 with SiO
2. For slags without Al
2O
3 in group D, namely slags D1 and D3, A
2 and A
3 are predominant, while A
0 and A
1 make fewer contributions. When Al
2O
3 is substituted for SiO
2 in slags D2 and D4, A
3 decreases, while A
0 and A
1 increase. For slags in group E, A
3 makes fewer contributions, especially for slags with Al
2O
3 (slags E2 and E4), compared to the other groups. While A
2 makes the main contribution for slags E1 and E3, A
0 and A
1 are predominant for slags E2 and E4.
The mole fractions of Q
n species, namely X
n, are calculated using the A
n values presented in
Table 4 according to the following equation [
54]:
where S
n represents the Raman scattering coefficient for Q
n with values of
,
,
, and
equal to 1, 0.514, 0.242, and 0.09, respectively [
55,
56].
The relationship between slag structure and viscosity can be quantitatively analyzed by the measured NBO/T value (
), which is obtained using X
n calculated according to Equation (
2).
The
values are inversely proportional to the degree of polymerization (DOP) of the silicate network. This means that a higher NBO/T value corresponds to a lower DOP of the silicate network, typically resulting in a lower slag viscosity. The
values calculated by Equation (
3) using deconvolution results are presented in
Table 4.
Figure 6a–d illustrate the variations in mole fractions for Q
n species (X
0, X
1, X
2, and X
3) and the
values for slags in groups B to E. The figures first present the variations in mole fractions and NBO/T for slags without Al
2O
3 (slags 1 and 3), where these variations are nearly identical. Subsequently, the variations for slags with Al
2O
3 (slags 2 and 4) are shown. Slags with similar basicity in each group show wide variations in both X
n and
values, with the variations being more pronounced between slags with and without Al
2O
3. In general, X
2 and X
3 have higher values, while X
0 and X
1 make fewer contributions to slag compositions in groups B to E, except for slags containing Al
2O
3 in group E, where X
1 is more prominent. The substitution of 17 wt% SiO
2 with Al
2O
3 leads to a decrease in X
3, indicating the depolymerization of the silicate network. Substituting 6 wt% CaO with MgO has little effect on the silicate structure in slags without Al
2O
3. However, the substitution of 6 wt% CaO with MgO in slags containing Al
2O
3 causes the depolymerization of the silicate network, as seen by the reduction in X
3 and the increase in X
1.
Figure 7 presents the Raman spectra as a function of wavenumbers, the variations in X
n species, and the
values for the studied slag systems. For the MnO-SiO
2-CaO slag system, the Raman spectra are displayed in
Figure 7a. In the high-wavenumber range of 800 to 1200
, the Raman spectra for slags B1 and C1 exhibit two peaks at ∼960 and ∼1050
, corresponding to Q
2 and Q
3 bands, respectively, and a shoulder at 870
related to the vibrations of Q
0 and Q
1. As basicity increases, the intensity of the 1050
band decreases and the intensity of the 870
band increases, as seen in slag E1.
Figure 7b shows that the mole fraction of X
3 decreases and that of X
2 increases to compensate for X
3. This indicates that the silicate network is depolymerized by increasing the basicity at a fixed MnO content. These findings are consistent with Park’s research on the MnO-SiO
2-CaO slag system [
36]. For the MnO-SiO
2-CaO-Al
2O
3 slag system,
Figure 7c illustrates that the broad band in the high-wavenumber range shifts to the left-hand side as the basicity increases from slag B2 to slag E2. Therefore, the mole fraction of X
3 decreases, while X
1 and X
0 increase, as seen in
Figure 7d. The Raman spectral analysis of the MnO-SiO
2-CaO-MgO slag system shown in
Figure 7e,f is similar to that of the MnO-SiO
2-CaO system. The results suggest that the substitution of 6 wt% CaO with MgO causes slight depolymerization in the silicate structure. For the MnO-SiO
2-CaO-Al
2O
3-MgO slag system, the broad band in the high-wavenumber region shifts to the left-hand side with increasing basicity, as presented in
Figure 7g.
Figure 7f illustrates that the mole fractions of X
1 and X
0 continuously increase as the basicity increases. The substitution of 6 wt% CaO with MgO leads to depolymerization of the silicate network, as indicated by a comparison of
Figure 7d,h.
Figure 7 indicates that
increases with increasing basicity, demonstrating a reduction in the degree of polymerization (DOP) of the silicate structure. The effect of basicity on the depolymerization is more pronounced in slags containing Al
2O
3, as indicated by higher
values compared to slags without Al
2O
3.
Figure 8 compares the calculated and measured NBO/T values, represented by
and
, respectively. Slags with and without Al
2O
3 are represented by solid circles and open circles, respectively. The acidic (basic) region is identified where
values are higher (lower) than the
values [
36]. This study expands Park’s research [
36] by including slags containing Al
2O
3. Park utilized area fractions to determine measured NBO/T values for a CaO-SiO
2-MnO slag system and found that the calculated NBO/T was significantly overestimated for values greater than 2.5 [
36]. In this study, mole fractions calculated according to Equation (
2) were used to calculate
values. For slags with Al
2O
3, the
values are significantly underestimated compared to the measured NBO/T, which may indicate an underestimation of the Al
2O
3 effect on the depolymerization of the silicate network. In comparison, for slags without Al
2O
3, the
values are relatively close to the measured NBO/T. However, for slags in groups D and E with calculated NBO/T values greater than 1.5,
is overestimated, while for slags in group B with calculated NBO/T values around 1,
is underestimated. As mentioned by Park, overestimation indicates that the silicate network is not as depolymerized as the calculated NBO/T suggests. Underestimation in the acidic region for slags without Al
2O
3 is the result of an underestimation of bridging oxygen, corresponding to Q
4. This fully polymerized silicate unit was not determined in the deconvolution process due to the low intensity of the 1200
bands in the Raman spectra. For slags containing Al
2O
3, the
values are significantly underestimated compared to the measured NBO/T, especially in slags with lower basicity. Note that the calculation of NBO/T assumes that all Al
2O
3 act as a network former in the presence of sufficient charge-balancing cations. However, research has revealed that a fraction of Al
2O
3 exists, even in peralkaline compositions, without being associated with a charge-balancing cations [
57]. This fraction of Al
2O
3 acts as a network modifier, influencing the depolymerization of the silicate network and leading to larger measured NBO/T values compared to the calculated ones. In addition, the presence of aluminosilicate chains (Q
2) or cation-deficient regions can contribute to the observed discrepancy between the measured and calculated NBO/T values in slags containing Al
2O
3 [
50,
58].
3.4. Relation between Structure and Viscosity
In this section, the correlation between slag viscosity and structure is presented using various parameters, such as the R parameter (
/
), calculated NBO/T from slag compositions (
), and measured NBO/T from the deconvolution of Raman spectra (
).
Table 5 presents the viscosity values, denoted as
, for temperatures in the range of 1423 to 1873 K for all slag compositions, as obtained by FactSage [
46,
47]. These viscosity values from the FactSage software are used as reference data for comparing predicted viscosity values from different viscosity models. This choice is due to the unavailability of experimental viscosity values for all slag compositions from a single reference. Note that the Raman-structure model, the NBO/T model, and FactSage predict viscosity based on distinct slag structural parameters and/or viscosity–temperature equations.
For slags in groups B to E, the variations in log
are plotted as a function of temperature in
Figure 9a–d. The viscosity decreases as the temperature increases for all slag compositions. Furthermore, slags in group B, characterized by the highest SiO
2 content, have higher viscosity values compared to the corresponding slag compositions in other groups.
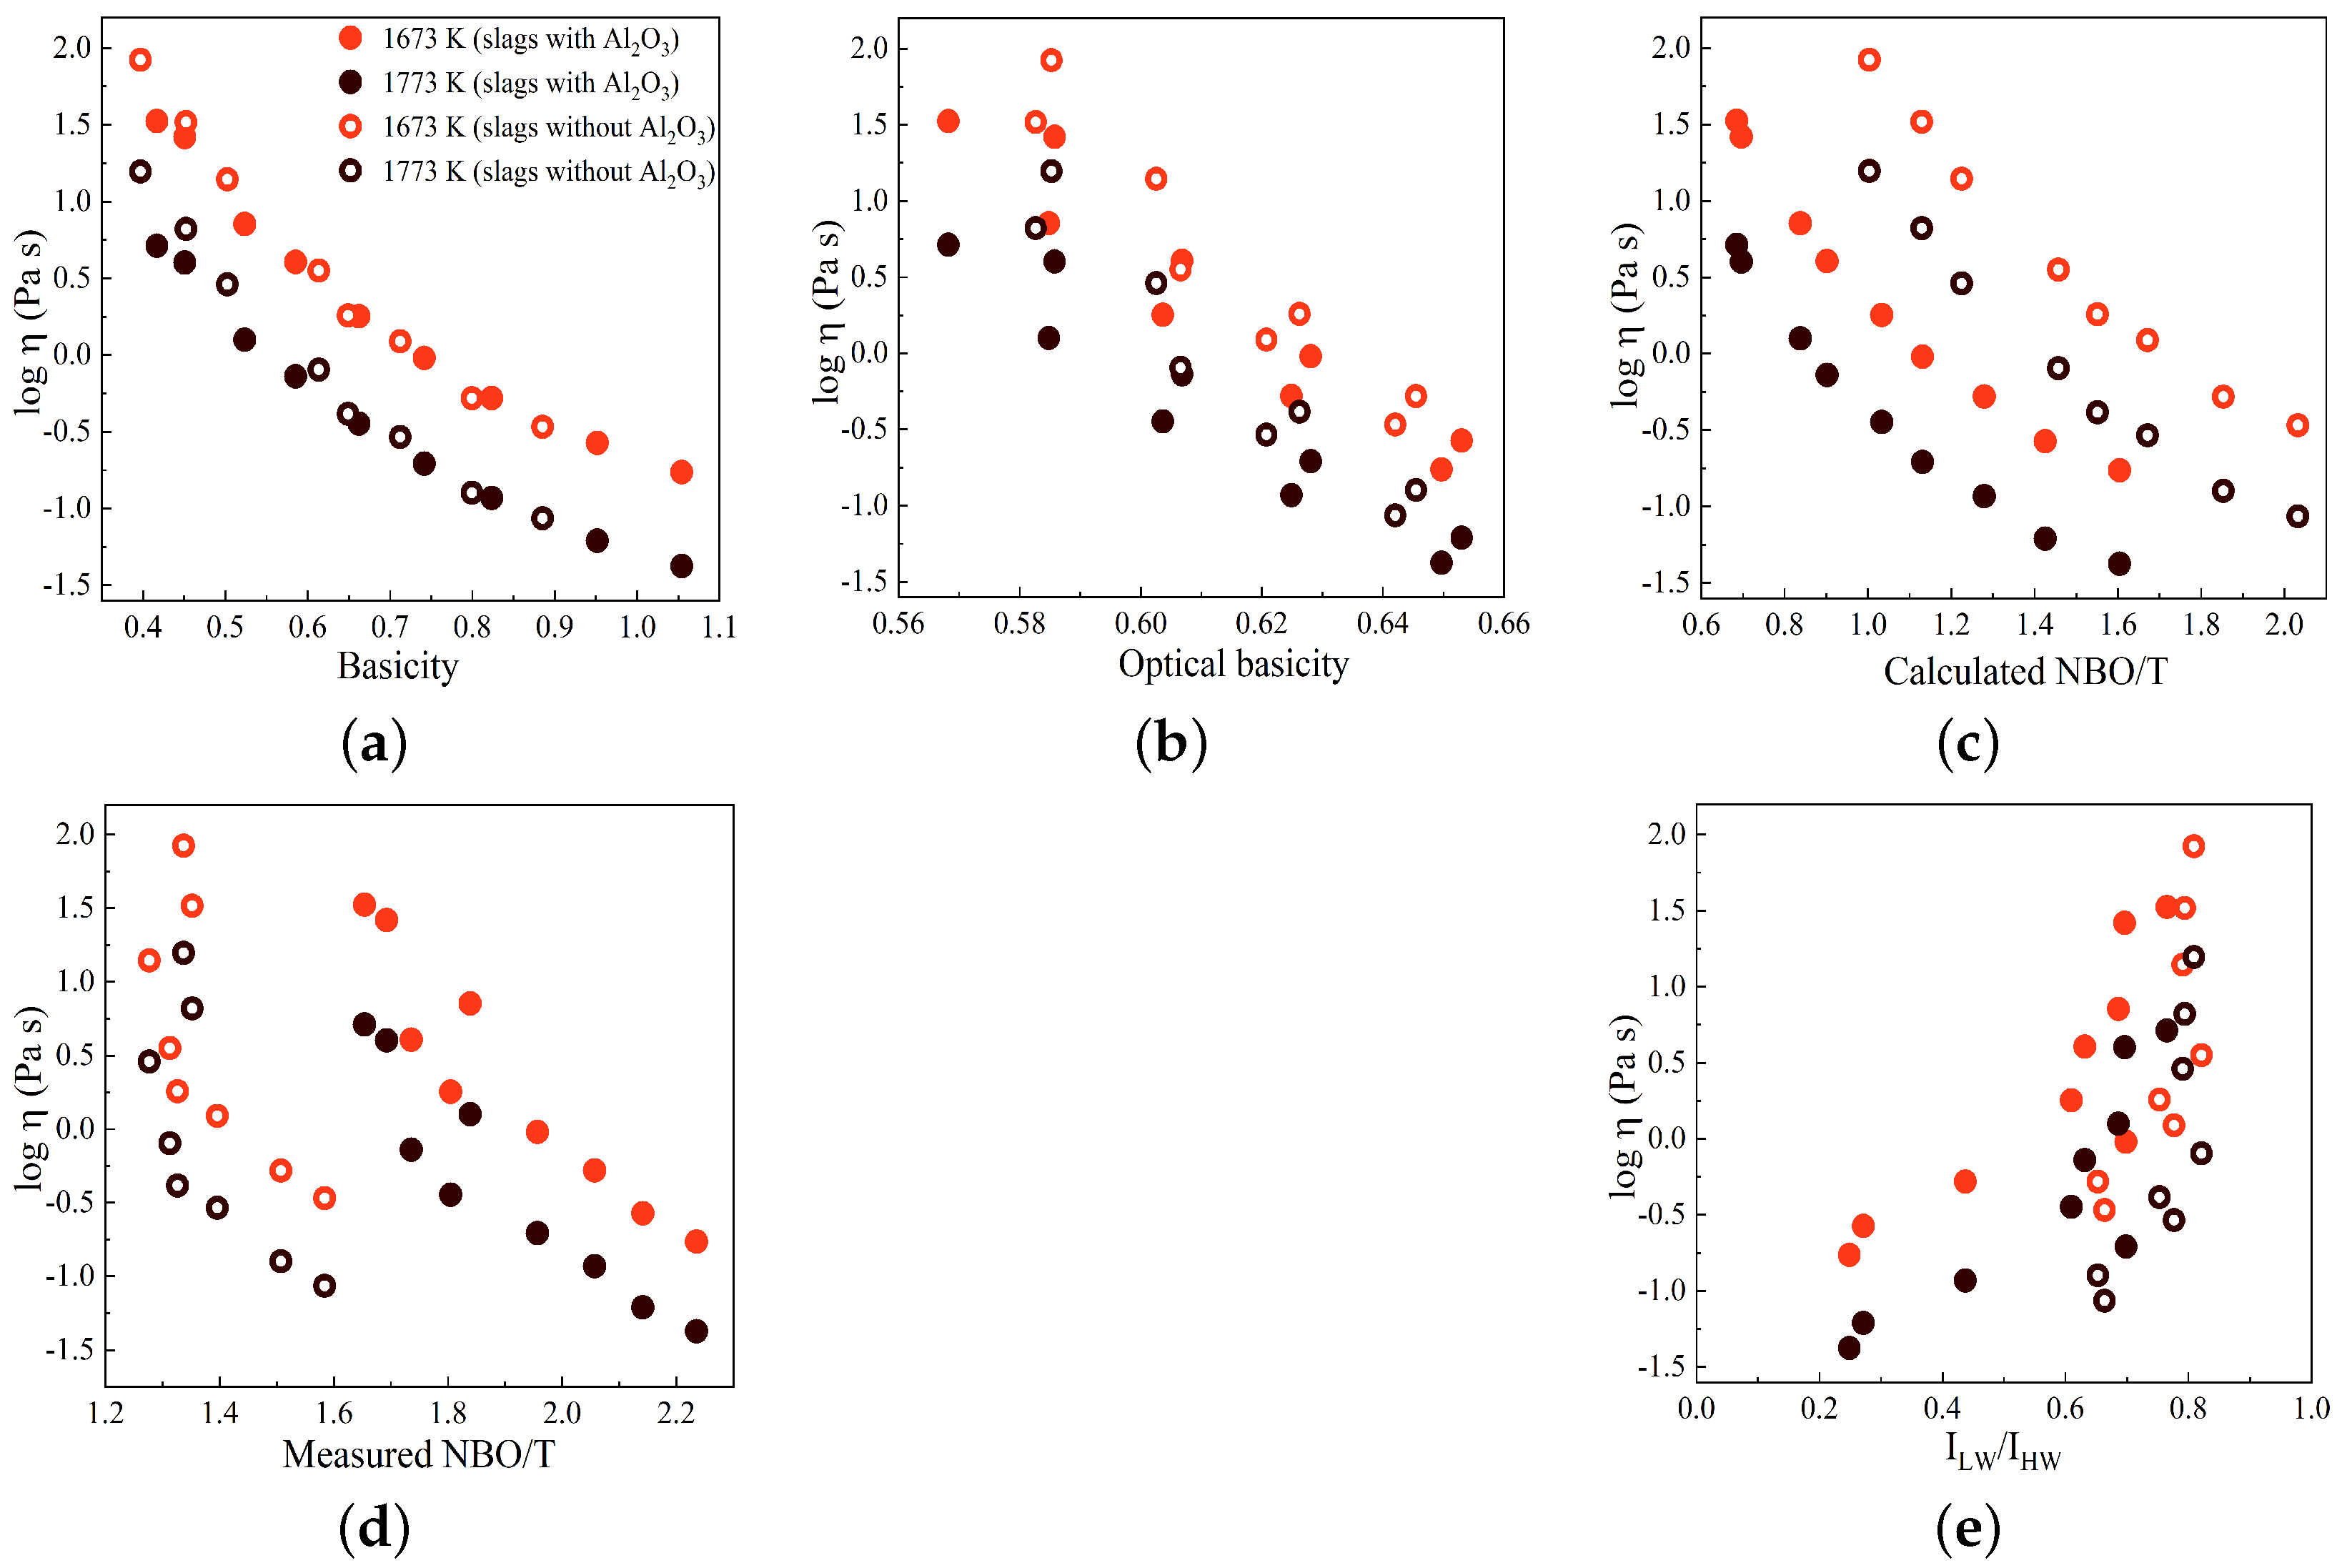
In
Figure 10a–e, the variations in log
are displayed against basicity, optical basicity,
,
, and the Raman R parameter (
/
), respectively, for two temperatures of 1673 and 1773 K. The slags with and without Al
2O
3 are indicated by solid circles and open circles, respectively. In general, as observed previously, the log
values decrease as the basicity, optical basicity, and NBO/T values increase. However, in contrast to this pattern, the log
values exhibit an increase with an increasing Raman R parameter, as depicted in
Figure 10e. The R parameter serves as a representative measure of the polymerization degree within the silicate network, suggesting that an increased degree of polymerization corresponds to higher viscosity values. As shown in
Figure 10c, the
values for slags containing Al
2O
3 are smaller compared to those for slags without Al
2O
3. However, the viscosity values for slags without Al
2O
3 are larger than the viscosity values for slags with Al
2O
3, contrary to the expected trend. This deviation can be attributed to the fact that the calculation of NBO/T assumes that all Al
2O
3 acts as a network former in the presence of sufficient charge-balancing cations. However, the results of this study indicate that a fraction of Al
2O
3 acts as a network modifier. This network modifier leads to the depolymerization of the silicate network, resulting in a decrease in viscosity, as expected. The variations in the R parameter and log
have similar patterns when plotted against basicity, optical basicity, and NBO/T parameters, particularly for slags containing Al
2O
3, as seen by comparing
Figure 3 and
Figure 10. This demonstrates the correlation between the Raman R parameter, structural chemical parameters, and viscosity, as reported in previous studies [
23,
43,
44].
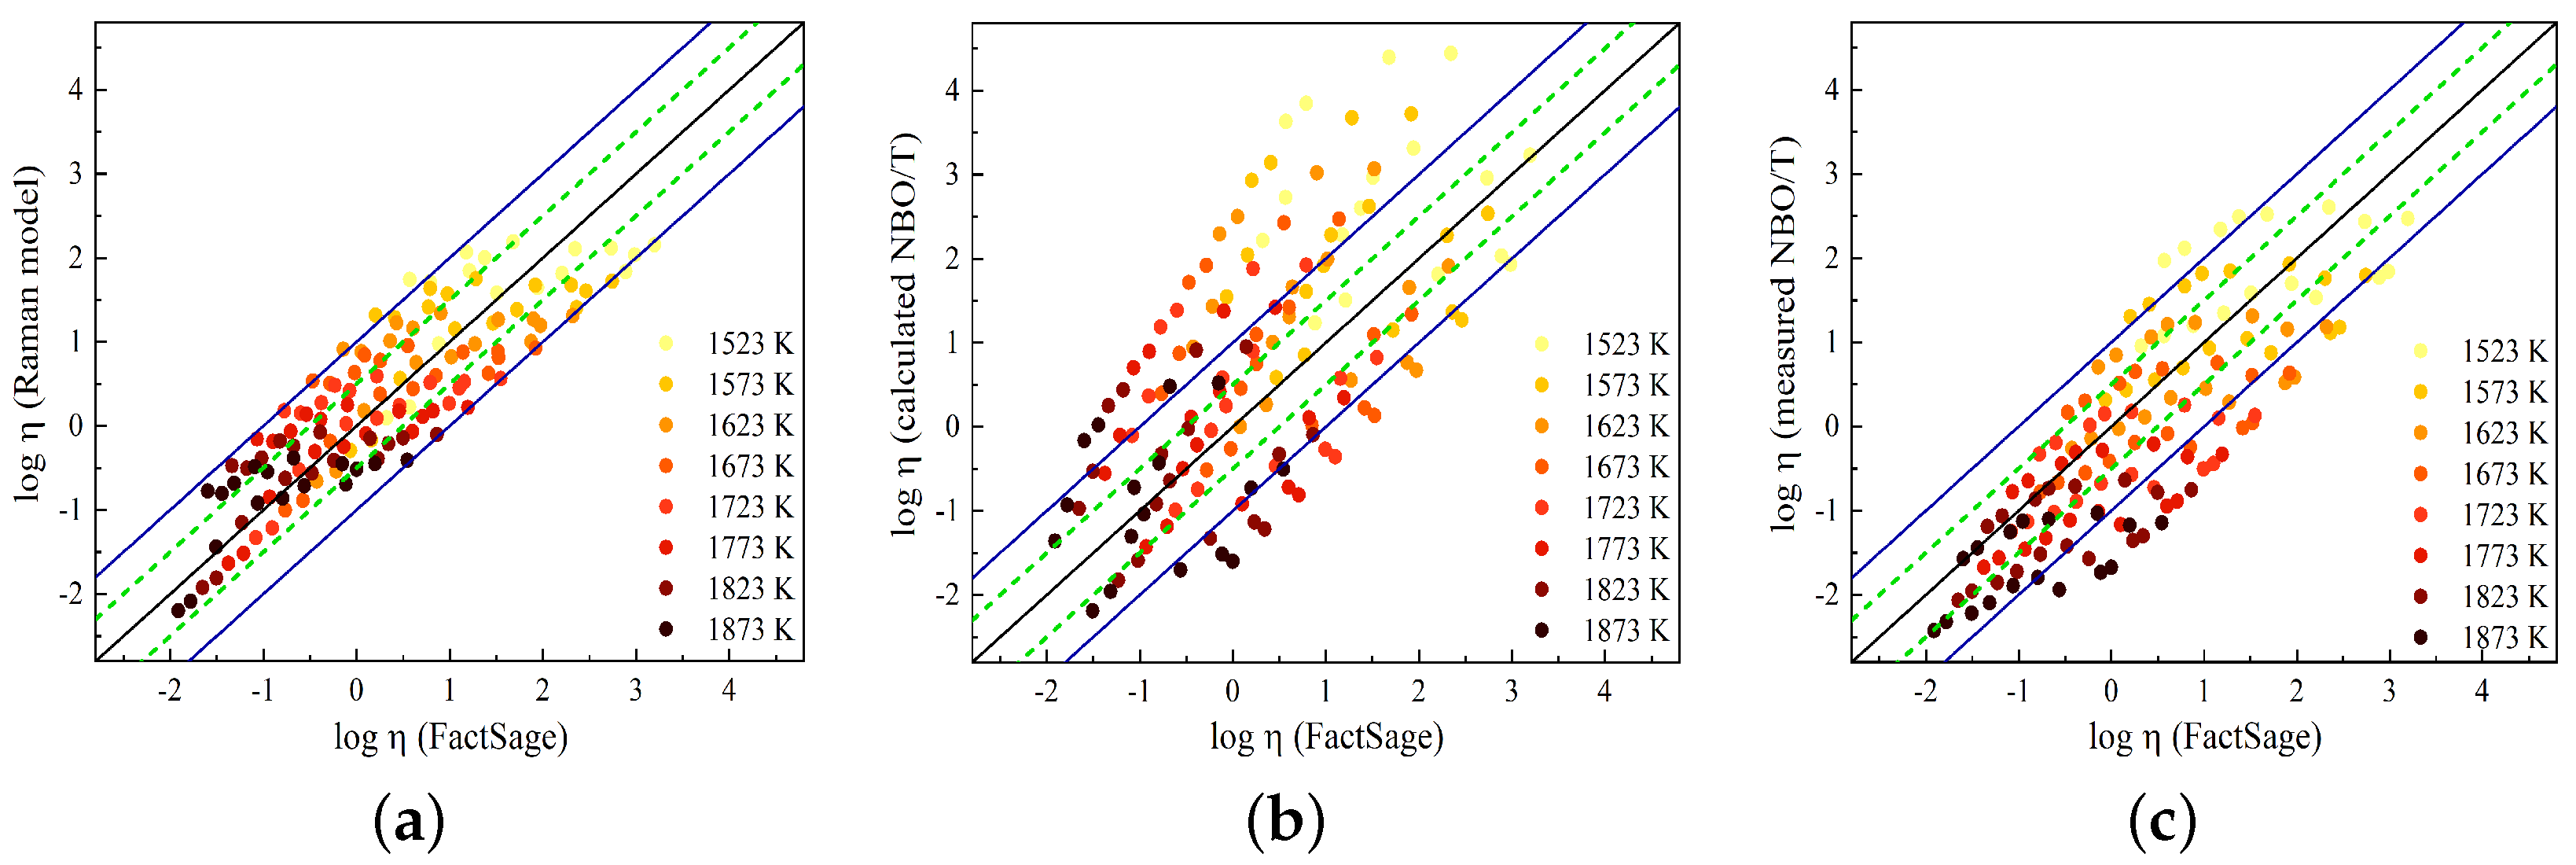
In
Figure 11, the predicted viscosity values obtained using the Raman-structure model and the NBO/T model proposed by Giordano [
59] are compared to the viscosity values taken from FactSage. In a previous study [
23], the Raman-structure model was presented using the Arrhenius equation with four adjustable parameters for the SiO
2-CaO-Al
2O
3 slag system. In this work, these parameters were re-determined using the viscosity data from FactSage (given in
Table 5). By incorporating these new parameters, the viscosity model as a function of temperature and the Raman R parameter can be represented by the following equation:
Viscosity values at low temperatures, where FactSage calculations may be less precise, are included. These values could be corrected to account for partial solidification.
The NBO/T model, proposed by Giordano [
59], employs the Tammann–Vogel–Fulcher (TVF) equation to express the temperature dependence of viscosity. This model is given by the following equation:
The adjustable parameters of
,
, and
are temperature-dependent [
59].
Figure 11a shows a comparison between the Raman-structure model results and FactSage, while in
Figure 11b,c, the results of the viscosity model using
and
, respectively, are compared to the FactSage results. Good agreement is observed between the Raman-structure model and FactSage viscosities, where the model predicts the FactSage viscosity within
log units for most of the slags. The Giordano model overestimates the viscosity values for most of the slags when using the calculated NBO/T, while the model reproduces viscosity values closer to the FactSage values by using the measured NBO/T. In this study, the presence of Al
2O
3 in the slag compositions was found to result in a decrease in viscosity, indicating its network-modifying effect. While the calculated NBO/T considers to Al
2O
3 to act as a network-forming component, our measurements suggest that Al
2O
3 behaves as a network modifier. This discrepancy highlights the difference between viscosity values predicted based on
values and viscosity values obtained from
values, as displayed in
Figure 11b,c.
Figure 11 demonstrates that the Raman-structure model predicts the FactSage slag viscosity with good accuracy over a wide range of slag compositions and temperatures.


