Article

In Vitro Assessment of a New Block Design for Implant Crowns with Functional Gradient Fabricated with Resin Composite and Zirconia Insert †

by
Nicolás Gutiérrez Robledo
1,2,*,
Miquel Punset Fuste
3,4,5,6,
Alejandra Rodríguez-Contreras
3,5,6,
Fernando García Marro
5,7,
José María Manero Planella
3,5,6,
Oscar Figueras-Álvarez
1 and
Miguel Roig Cayón
1
1
School of Dentistry, Universitat Internacional de Catalunya (UIC), 08195 Barcelona, Spain
2
Independent Research, 28028 Madrid, Spain
3
Biomaterials, Biomechanics and Tissue Engineering Group (BBT), Universitat Politècnica de Catalunya (UPC), 08019 Barcelona, Spain
4
UPC Innovation and Technology Center (CIT-UPC), Universitat Politècnica de Catalunya (UPC), 08034 Barcelona, Spain
5
Barcelona Research Centre in Multiscale Science and Engineering, Universitat Politècnica de Catalunya (UPC), 08019 Barcelona, Spain
6
Reserach Institute San Joan de Déu (IRSJD), 08950 Barcelona, Spain
7
Center for Structural Integrity, Reliability and Micromechanics of Materials Research Group (CIEFMA), Universitat Politècnica de Catalunya (UPC), 08019 Barcelona, Spain
*
Author to whom correspondence should be addressed.
In memoriam of Dr. Ralf Böhner.
Materials 2024, 17(15), 3815; https://doi.org/10.3390/ma17153815 (registering DOI)
Submission received: 26 June 2024 / Revised: 26 July 2024 / Accepted: 29 July 2024 / Published: 2 August 2024
(This article belongs to the Special Issue Advanced Biomaterials for Dental Applications)

Abstract

:
This study aims to evaluate and compare the mechanical resistance, fatigue behavior and fracture behavior of different CAD/CAM materials for implant crowns. Eighty-eight implant crowns cemented-screwed with four sample groups: two monolithic G1 Zirconia (control) and G3 composite and two bi-layered G2 customized zirconia/composite and G4 prefabricated zirconia/composite. All static and dynamic mechanical tests were conducted at 37 °C under wet conditions. The fractographic evaluation of deformed and/or fractured samples was evaluated via electron microscopy. Statistical analysis was conducted using Wallis tests, which were performed depending on the variables, with a confidence interval of 95%, (p < 0.05). The Maximum Fracture Strength values displayed by the four groups of samples showed no statistically significant differences. The crown–abutment material combination influenced the failure mode of the restoration, transitioning from a fatigue fracture type located at the abutment–analog connection for monolithic materials (G1 and G3) to a brittle fracture located in the crown for bi-layered materials (G2 and G4). The use of layered crown materials with functional gradients appears to protect the crown/abutment connection area by partially absorbing the applied mechanical loads. This prevents catastrophic mechanical failures, avoiding long chairside time to solve these kinds of complications.

1. Introduction

The absence of the periodontal ligament in the implant–prosthesis–bone set can frequently generate mechanical complications in implant prostheses. This occurs due to the mechanical overload caused by the lack of cushioning [1], especially in the unitary crowns of male molars [2,3]. The most frequent mechanical complications are the loosening of the fixation screw or the transepithelial abutment [4,5] and the fracture or delamination (chipping) of the esthetic coating material of the restoration [6].
The mechanical properties of the ceramic-reinforced resin composite with a dispersed filler microstructure (DFM) included in the new classification of ceramic materials [7], have considerably improved due to new industrial polymerization methods (atmospheric pressure and high temperature) [8,9], which replace intraoral photopolymerization [10]. A reduced monomer release and an increase in flexural strength, hardness, tenacity and even density of these materials have been observed [11,12,13,14]. The great stability achieved in resin-composite blocks (RCBs) allows excellent reproducibility by machining [15,16] and causes less wear on the opposing enamel compared to glass-matrix ceramics [17,18,19,20]. All these characteristics, together with the low flexural modulus, allow RCBs to achieve a cushioning effect on implant restorations by transmitting less stress to the prosthetic attachment and implant, which favors bone response [21,22,23,24,25]. On the other hand, when the implant–prosthesis–bone complex exceeds the limits of physiological adaptation, it produces bone overload, which, in turn, triggers osteoclastic activity and bone resorption [26,27,28]. This sometimes results in traumatic failure, diverging from infectious failure or bacterial peri-implantitis [29].
Marginal bone preservation is influenced by multiple factors, such as implant design, crown material, prosthetic abutment, connection and disconnection of the prosthetic abutment and the type of surgery performed. The correct selection of the restorative material, as well as the prosthetic abutment, is one of the keys to success in implant prosthesis [30,31,32]. Given that the masticatory force into the crown is then transmitted to the maxillary or mandibular bone through the prosthesis and implant [33], the use of resilient materials that function as a shock absorber to the implant–prosthesis set could help reduce stress and pressure on the bone [34]. It may reduce prosthetic complications derived from the overload received in the crown [35]. Currently, the prefabricated titanium abutment with a mesostructured zirconia to mask the grayish color of titanium has become the prosthetic abutment of choice for restorations on implants, given its excellent mechanical and esthetic properties as well as its biocompatibility with the tissues [36,37,38].
Functional gradient materials (FGMs) are a new concept in materials engineering [39], where both the material composition and structure gradually change. Their sole purpose is to dissipate or absorb stress or mechanical load.
FGMs have been used in several investigations in the dental field [40,41,42]. In this process, both the material composition and the structure gradually change throughout the volume, resulting in changes in the material’s properties, chemical composition, physical state and geometric configuration. This has allowed us to explore optimal designs of bio-inspired or bio-mimetic materials in which different layers of materials achieve greater stress reduction and distribution. The best example is the human tooth, which consists of two main layers: enamel and dentin. The outer layer allows it to maintain its shape and resist fracture and wear upon loading. This quality is due to a variation of the transformation in its microstructure and chemical composition. Starting from the outermost layer, four well-differentiated histological layers are recognized until reaching the dentin–enamel junction (DEJ) [43,44]. This interface plays a crucial role in the fatigue resistance of the natural tooth, given the reliable connection between the different layers of the tooth [45,46]. This study is the first one in the field and is unique because it combines different materials perfectly bonded to produce a functional gradient implant crown, trying to emulate the natural tooth structure.
The reproducibility of the resin composite by machining and the feasibility of polishing or intraoral adjustment allow great control of the occlusion. Moreover, the favorable cutting properties lead to considerable savings in production time and reduce wear on manufacturing instruments, such as motors and diamond milling cutters; in contrast, materials with a ceramic matrix, when machined, often result in lower-quality margins and edges [16]. A layered design with an individualized zirconia mesostructure implies additional production costs, as the mesostructure must be designed and milled separately from an additional block and then requires an additional cementation to the resin composite crown. As a solution, a new resin-composite block design with an industrially bonded zirconia insert is proposed (Figure 1). The industrially manufactured insert, which is a component of the resin block, enables the masking of the metal’s colors and ensures an optimal fit tolerance to the titanium base. In addition, it can be used for chair-side restorations on implants, as it can be machined within 12–14 min and does not require thermal processing.
The design of the new experimental block is composed of two materials commonly used today: resin composite with filler content of VOL % 51.5 and zirconia. These two materials are industrially bonded to ensure optimal and consistent tolerances. From a mechanical and an esthetic point of view, the experimental crown could be an effective prosthetic solution with the combination of prefabricated zirconia insert and resin-composite block [35,47]. Furthermore, it is easy to polish and repair in the mouth. Additionally, due to its low production cost, it could be affordable for most patients.
This study aims to evaluate the mechanical resistance of the resin-composite blocks for implant crowns under different scenarios. We will compare fracture behavior and failure mode with the control group monolithic zirconia, one of the most common materials for single-unit implant crowns under static and dynamic loads.
The study’s main hypothesis suggests the presence of statistically significant differences in both maximum static strength and fatigue limit among the materials evaluated. However, the null hypothesis in this study proposes the absence of statistically significant disparities in these properties, regardless of the material’s characteristics and the component’s geometry.

2. Materials and Methods

2.1. Materials

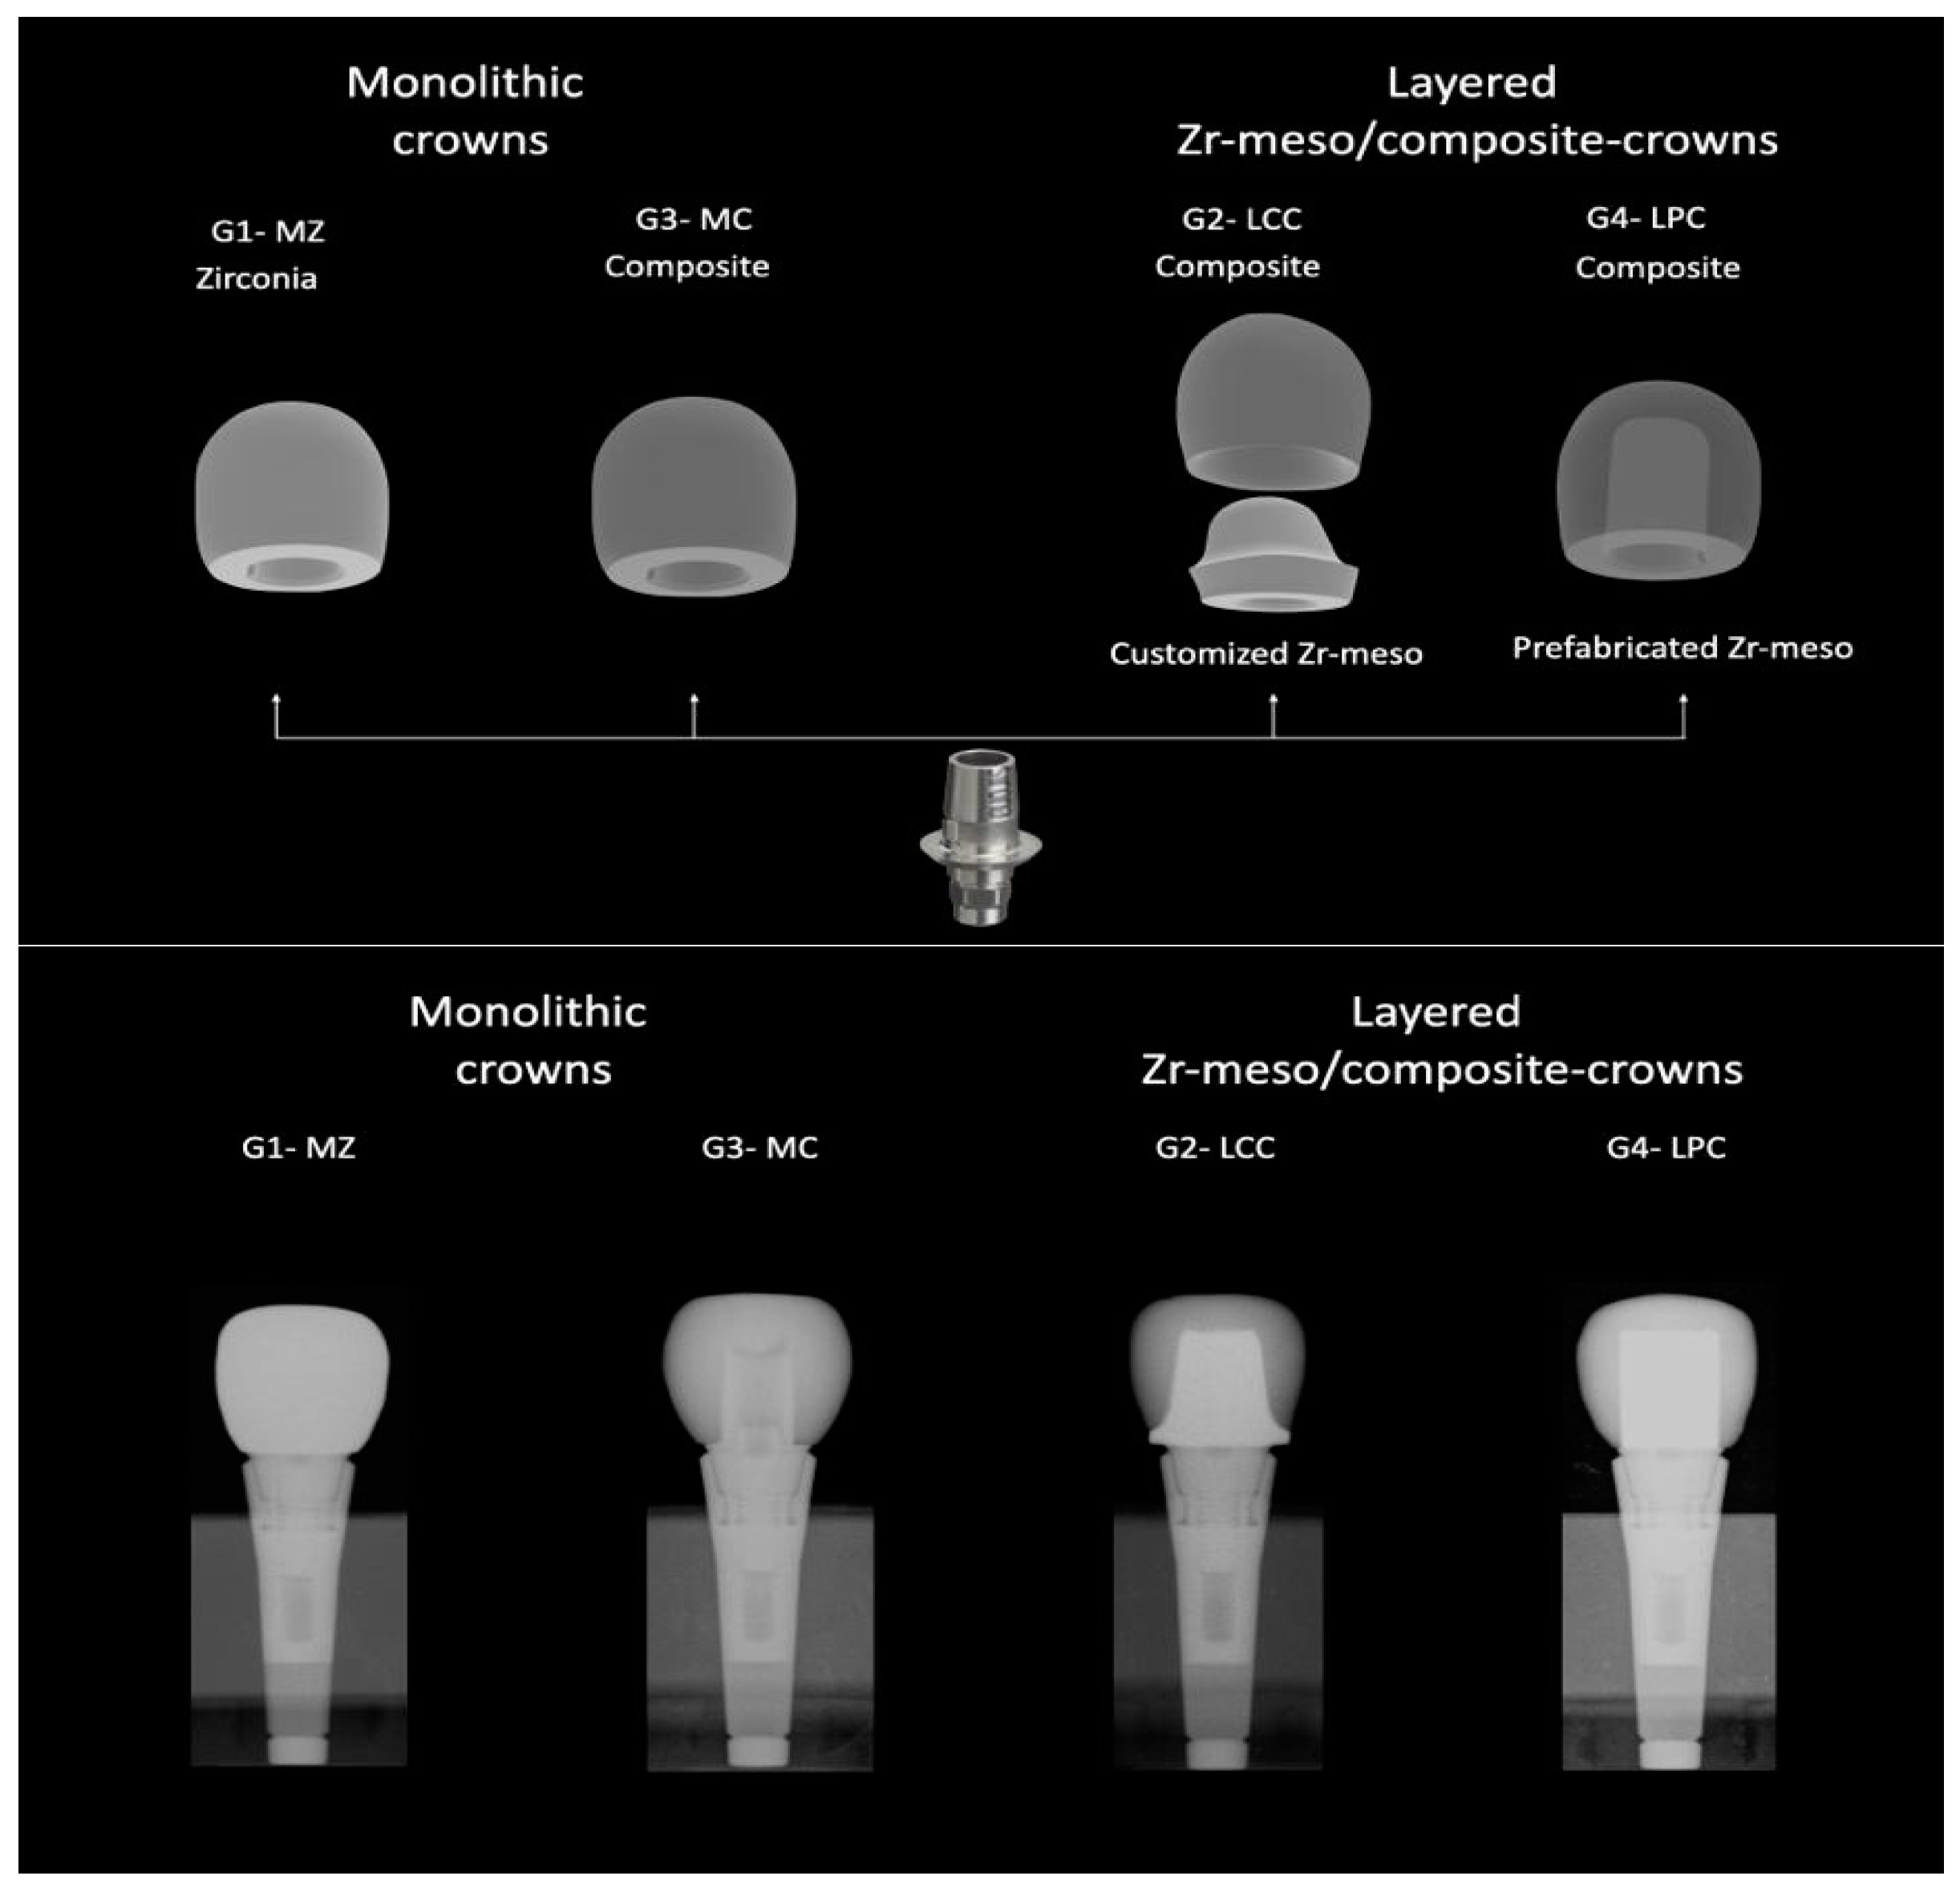
Eighty-eight ASTRA EV implant analogs (Dentsply Sirona, Charlotte, NC, USA) with a diameter of XL 5.4 mm (Ref 25547 and LOT 456009) were prepared with the corresponding CEREC Ti-base (CEREC/inLab Ref 6586338 and LOT B200003054), onto which a crown of each group (n = 22) was previously cemented. The sample groups were designated as G1 (control group) and G3, which comprised monolithic crowns, whereas the sample groups G2 and G4 comprised layered crowns with customized or prefabricated mesostructured zirconia (Figure 2).

2.2. Sample Preparation

All samples were prepared and treated according to ISO 14801:2016 [48]. The preparation of the samples to be mechanically tested in this study was carried out in two consecutive and well-differentiated sequential stages. The first stage involved embedding the ASTRA EV implant analogs in a bone-like resin, followed by the second stage of fabricating and assembling the different crowns by cementation.
Before performing any static and dynamic mechanical testing, all titanium analogs were inserted into a bone-like polymeric resin to provide stable support, as well as to mimic oral conditions. Analog samples were embedded into a polymeric resin (Mecaprex MA2+, PRESI SAS, Eybens, France), leaving the implant 3 ± 0.1 mm above the implant nominal bone level determined by the implant manufacturer. All samples were embedded, resulting in a total set of 88 samples for the study. The resin discs with the embedded implants were subjected to rectifying operations, thus ensuring parallelism between the upper and lower faces.
The second phase of sample preparation included the fabrication of four distinct crown groups, along with their final embedment into the analog, which had been previously fixed in a resin-like bone material during the preceding stage. The Ti-base was scanned with a Dentsply Sirona Ineos X5 extraoral scanner (Dentsply Sirona, Charlotte, NC, USA) using the corresponding “L” scan-body for the Ti-base. Once scanned, a crown was designed using the InLab CAD 19 software (Dentsply Sirona, Charlotte, NC, USA). An STL model of the monolithic crown groups G1-MZ and G3-MC and the layered crown groups G2-LCC and G4-LPC was obtained. The material’s characteristics are described in Table 1.
The single blocks for crowns of the G1-MZ, G2-LCC and G4-LPC groups were milled using the MCXL, a 4-axis milling machine (Dentsply Sirona, Charlotte, NC, USA), serial no. 106352, using the wet strategy and diamond burs. For the crowns of G3-MC, a 5-axis Imes icore 350 PRO milling machine (Imes Icore GmbH, Eiterfeld, Germany) was used. In addition, the Brilliant Crios Disc (Coltene Whaledent, Altstätten, Switzerland) was used and a CAM Mill Box software v5 SMART(CIM Systems s.r.l., Milan, Italy). Then, all the crowns were carefully separated from the blocks and discs using a cutting disk. Once the supports were polished, the zirconia crowns from G1 and the customized mesostructured from G2 were dried in a pre-drying oven (Imes Icore) for 15 min to remove the moisture from the wet milling. Subsequently, they were sintered in the corresponding program of the DEKEMA sintering furnace model AUSTROMAT 674 (DEKEMA Dental-Keramiköfen GmbH, Freilassing, Germany).
Before cementing all the crowns, the Ti-bases were attached to the implant analogs according to the manufacturer recommendations using a torque wrench with 25 Ncm, and then they were cemented over a Ti-base and finally, the crown holes were filled with Teflon tape and light-cure composite Brilliant EverGlow A2/B2 and One coat 7 Universal (Coltene Whaledent, Altstätten, Switzerland) as bonding. Lastly, the composite fillings were polished using silicon polishers DIATECH Shape guard (Coltene Whaledent, Altstätten, Switzerland). The surface treatment during the cementation of the different crown samples is described in Table 2.

2.3. Observation by Field Emission Scanning Electron Microscope

Scanning Electron Microscopy (SEM) enables the surface-level and comprehensive evaluation of components and samples by acquiring high-resolution images using the interactions generated between an incident electron beam and the surface under analysis. A Field Emission Scanning Electron Microscope (FSEM) model JSM-7001F Scanning Microscope (JSM 7100, JEOL Ltd., Akishima, Japan) was used for fractographic evaluation of deformed and/or fractured specimens, operating at a potential of 20 kV and an approximate working distance ranging from 9 to 11 mm. This equipment is equipped with an Energy-Dispersive X-ray Spectroscopy (EDS) analysis probe, Oxford Xmax20 model, which allows for the identification of chemical composition by acquiring the characteristic X-ray emission of each chemical element.
Coating ceramic samples for SEM observation is essential to improve conductivity, prevent charge accumulation, protect the sample, and obtain higher quality and resolution images, enabling a more precise and detailed analysis of the properties and characteristics of this type of material. Once the samples had been fractured through fatigue testing, the fragments were positioned on pin-shaped holders to undergo a coating process using PVD-Sputtering techniques, specifically the LEICA EM ACE600 equipment (LEICA MICROSYSTEMS, Wetzlar, Germany). Using this equipment, a PVD-Sputtered Pt-Au conductive coating was applied to the samples prior to the SEM observation; this coating had an average thickness ranging from 5 to 10 nm.

2.4. Determination of the Maximum Compression Strength

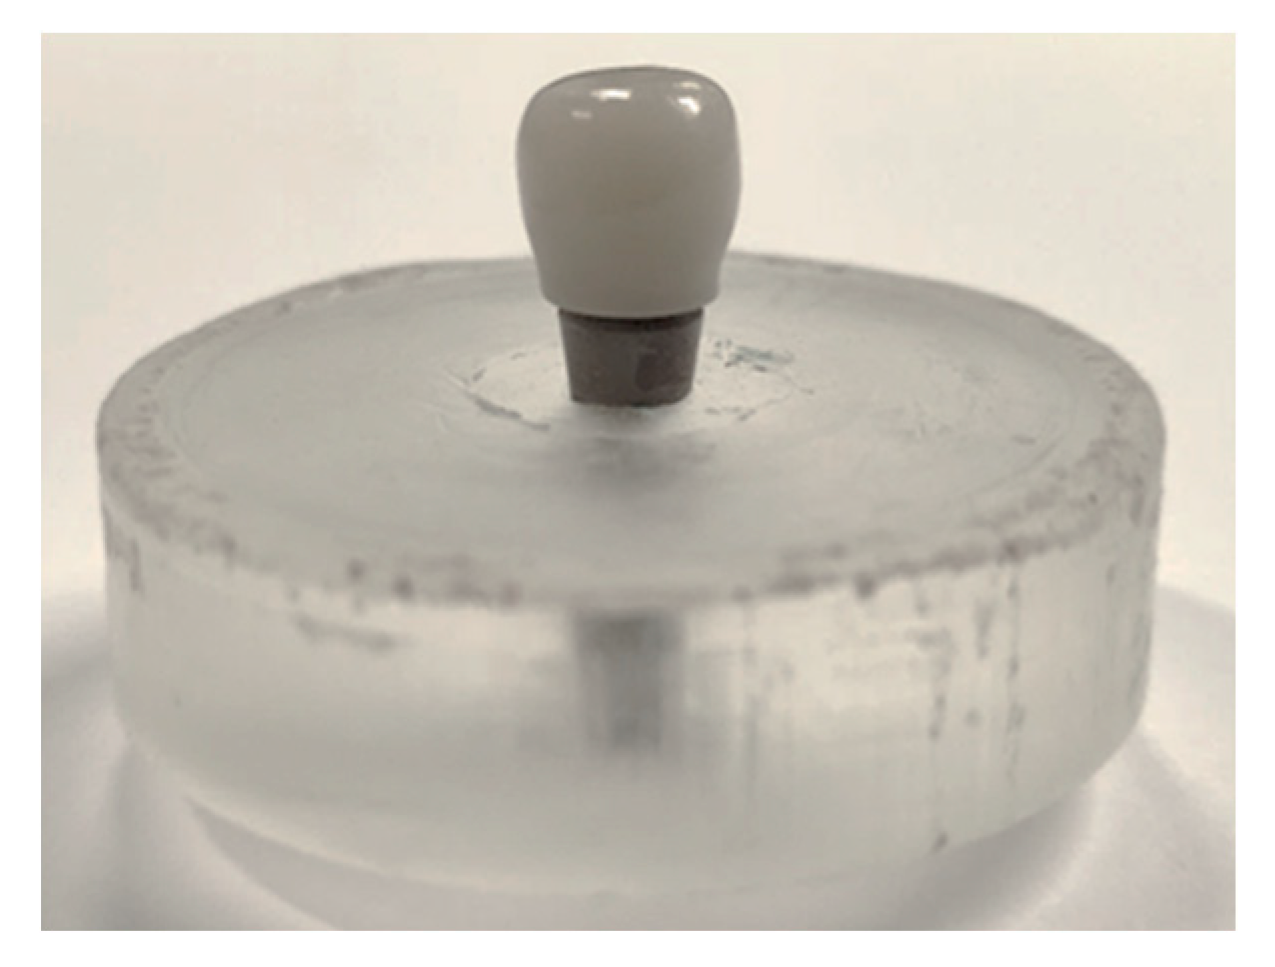
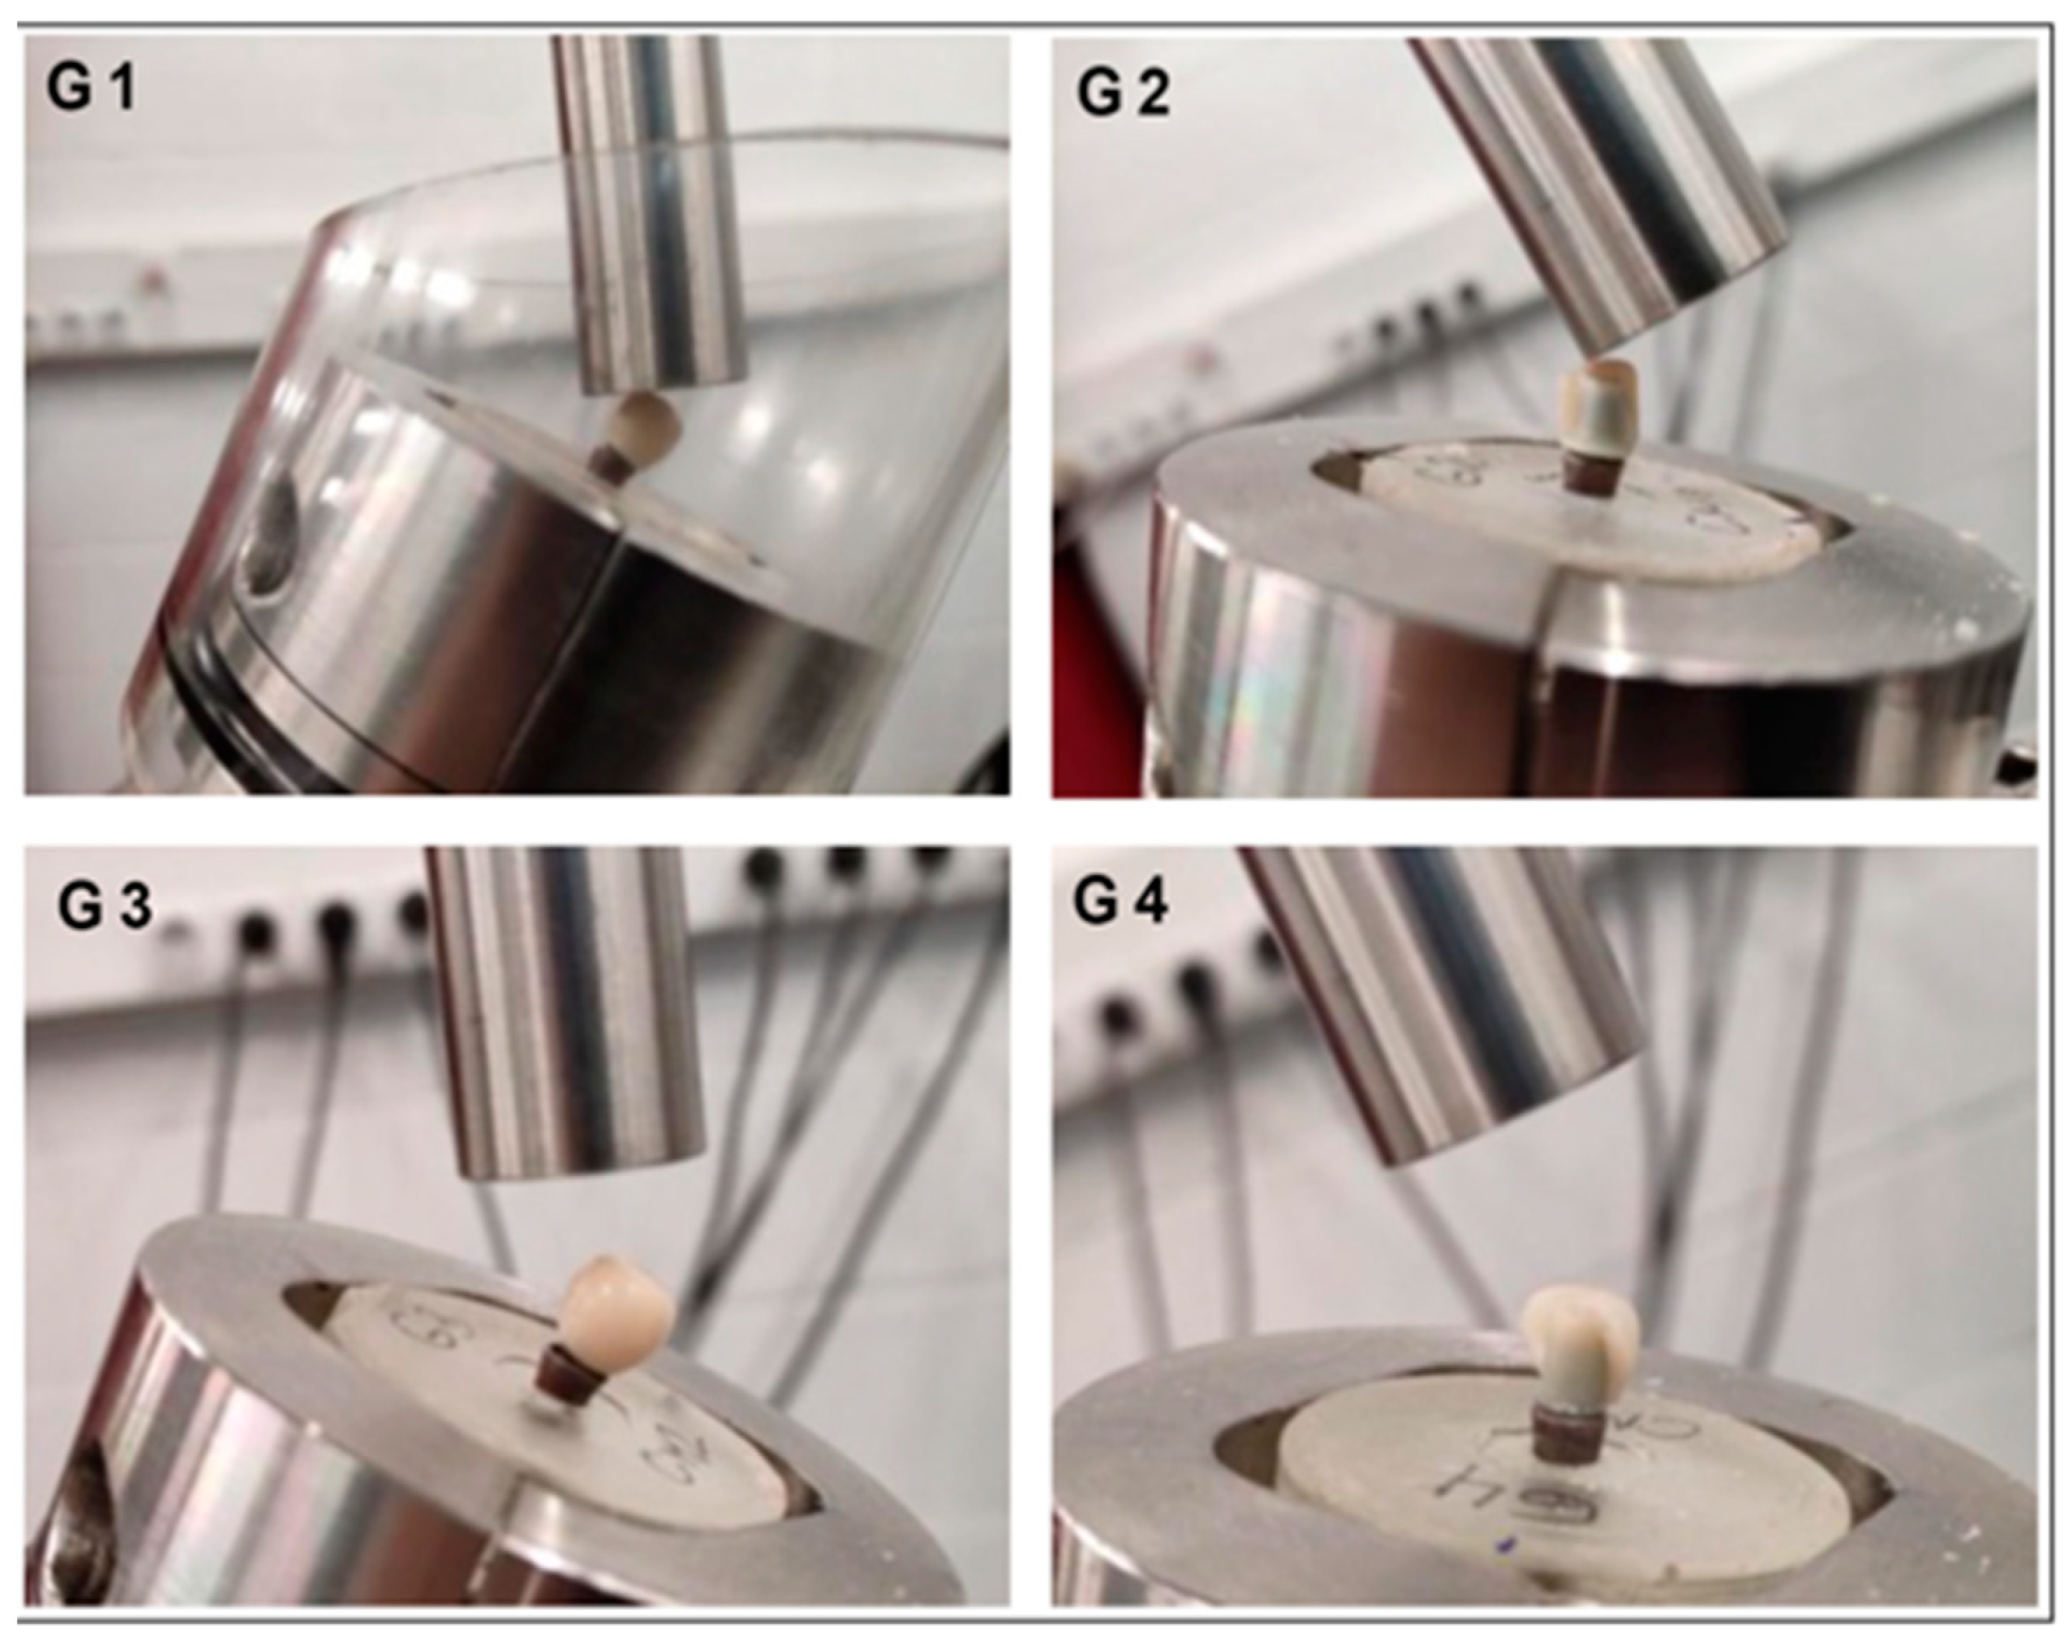
A universal MTS model BIONIX-370 servo-hydraulic mechanical testing machine (MTS Bionix 370, Minneapolis, MN, USA) was used for the determination of the maximum compressive strength using a 2.5 kN load cell controlled by Telstar II software (Telstar, MTS System Corp., Eden Prairie, MN, USA). A total of 20 uniaxial static compression tests were carried out, divided into 5 tests for each of the 4 study sample groups to be evaluated. All static and dynamic mechanical tests were conducted at (37 ± 1) °C, fixing the specimen in the testing machine with a 30° angle of inclination and under wet conditions using Hank’s salt solution as a liquid medium. All the analyses were carried out under the same test conditions. The implants were held with the same and unique clamping device, consisting of a clamping jaw made of stainless steel, which supports the resin block in which each implant has previously been encasted (Figure 3). The compressive load was applied at a constant displacement rate of 1 mm/min on the loading device (cap) until system failure.
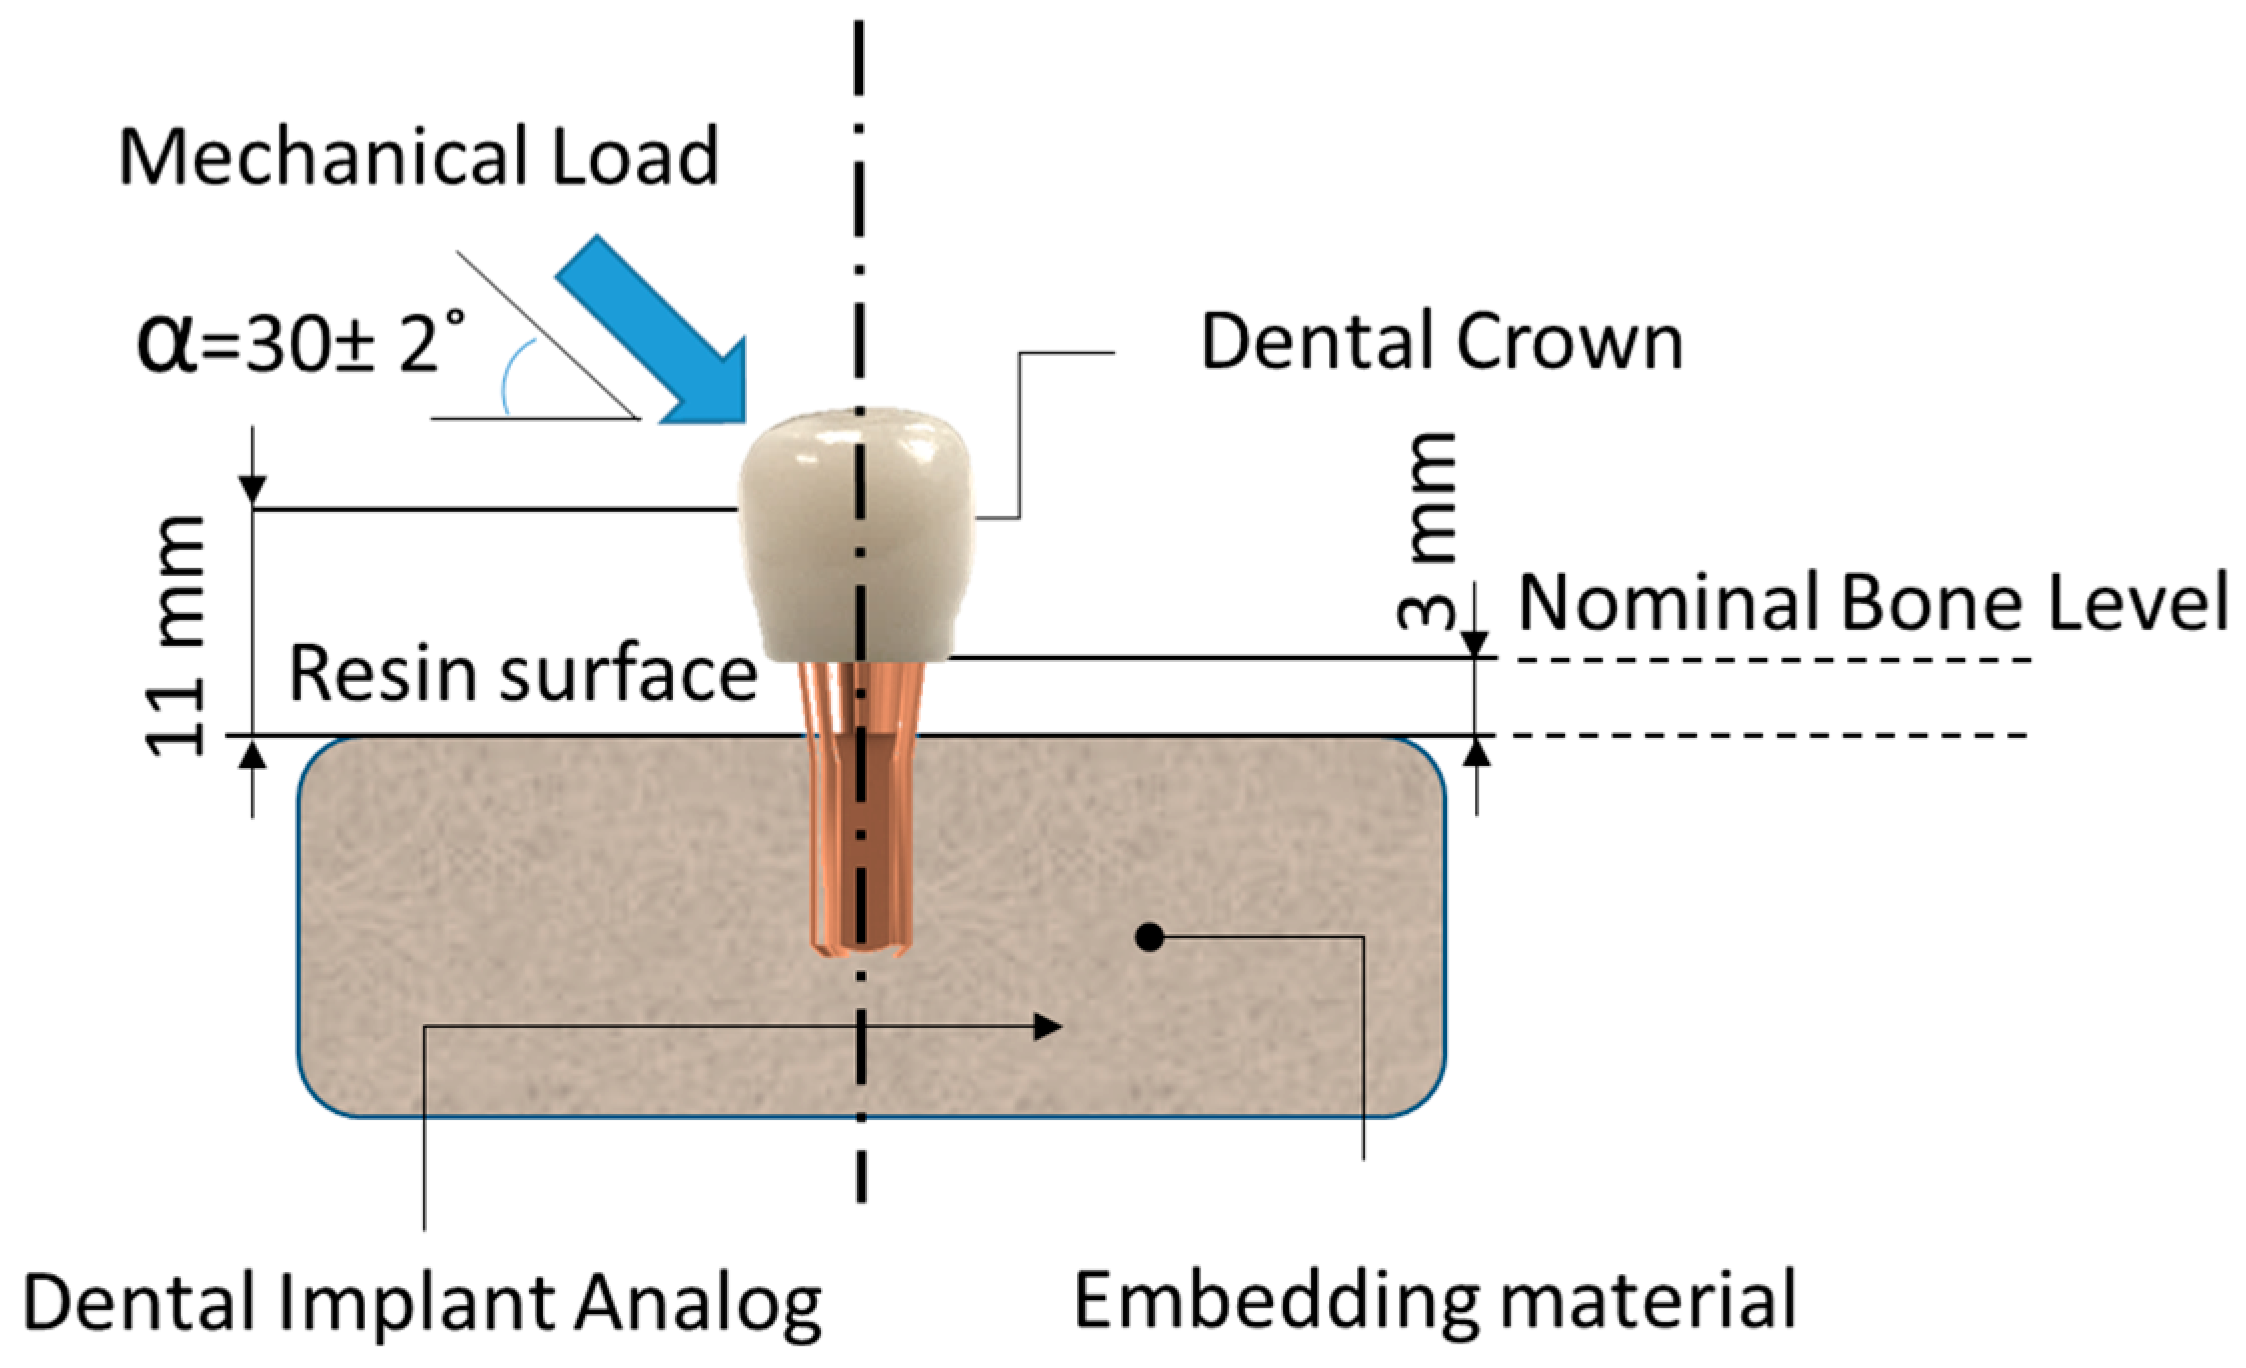
All samples were prepared following ISO-14801:2017. According to the standard, the bone anchoring part of the sample must be fixed in a fixed anchoring device that must hold the sample at a distance of 3.0 ± 0.1 mm apically from the nominal bone level determined by the manufacturer (Figure 4); in this case, the company Astra implants by Detsply Sirona. This distance is internationally accepted as the average level of bone resorption after dental implant implantation. The ISO-14801:2017 standard also specifies the existence of a constant distance of 11.0 ± 0.1 mm from the implant support level to the center of the hemispherical free end. This distance must be measured parallel to the central longitudinal axis of the implant body, and it is counted from the surface of the resin to the center of the hemispherical dome.

2.5. Determination of S-N Curve

Dental implant fracture is a critical concern in prosthetic dentistry. Cyclic loads experienced during mastication can potentially lead to structural failures, compromising the longevity and functionality of dental implants. Hence, it is crucial to evaluate the resistance of implants under varying cyclic load conditions to ensure their reliability and durability. The ISO14801 standard provides guidelines for testing the fatigue strength of dental implants, offering a standardized approach for assessing their performance. After conducting static compression-to-fracture tests, fatigue tests were carried out at various percentages of the previously obtained maximum breaking load. This allowed determining the number of cycles before fracture at each load level (n ≤ 4), starting from an initial load of 80% according to ISO 14801 of the load to failure in a static test carried out with the same test geometry. Following this guideline, the implants were submitted to a sinusoidal compression–compression fatigue test at a frequency of 2 Hz and a stress variation of 10%.
The total number of cycles applied to each sample was fixed at 2 × 10⁶, also defined as run-outs for fatigue tests performed in liquid immersion according to the ISO standard. Implants that survived this number of cycles were considered to have passed the test successfully. The force of the impact was performed on the distal cuspid of the implant-supported restoration for all groups of samples. Implants that endured this number of cycles were considered to have passed the test successfully. The fatigue test was run in liquid immersion using Hank’s salt solution (Sigma Aldrich, St. Louis, MO, USA) as a liquid medium.

2.6. Characterization of Hardness and Fracture Toughness

The determination of hardness was analyzed by using a Vickers EMCO-Test microhardness tester (EMCO-TEST Prüfmaschinen Gmbh, Kuchl, Austria) equipped with a Vickers indenter, which consists of a diamond pyramid with a base angle of 136°. The standard used for the determination of the hardness of the materials under study was ASTM E384-17 [49].
The hardness measurements were carried out under a constant load of 5 kg applied for 15 s, making a total of three measurements for each of the four materials studied. The Vickers hardness number (VHN) (GPa) was obtained and compared. The Vickers hardness number (VHN) in GPa has been expressed following Equation (1). VHN as a function of the applied load (F) in N and the average of the diagonals of the indentation (d) in µm. The constant value, 1854.4, was obtained from the calculation of the contact area.
V H N 1854.4 × P d 2
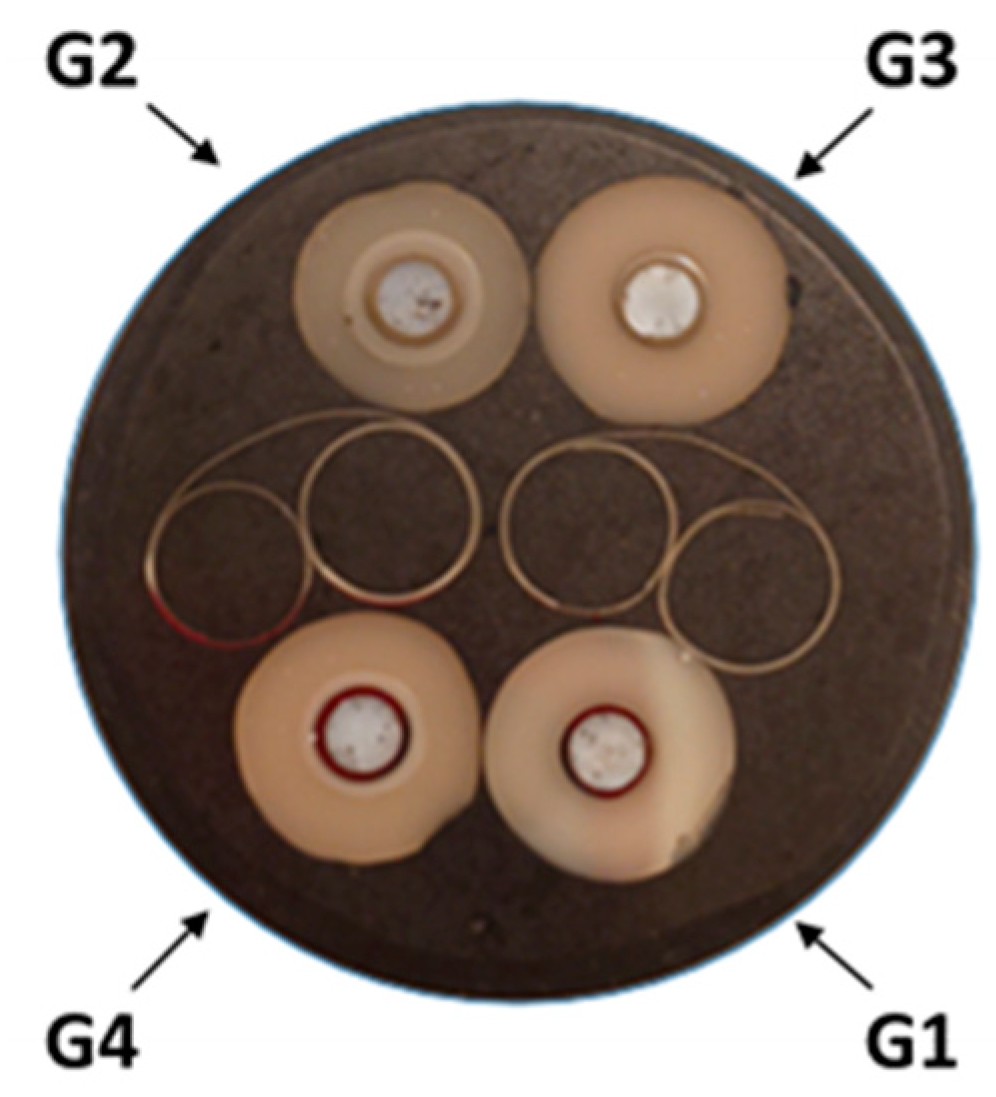
The estimation of fracture toughness K I c   [49,50,51,52,53,54] was achieved through the measurement of crack length nucleated at the corners of the residual imprint, utilizing indentation fracture toughness, following research by Niihara et al. [55]. Sample preparation was necessary to produce a polished cross-section for each pillar (Figure 5).
The fracture toughness K I c [50] is a crucial mechanical parameter in brittle materials that quantifies their ability to resist crack propagation. The estimation of fracture toughness can be achieved through the measurement of crack length nucleated at the corners of the residual imprint, utilizing a technique known as indentation microfracture. Various mathematical formulations have been suggested to determine K I c , contingent upon the tip indenter geometry and crack morphology (such as radial, half a penny, or Palmqvist). Among these, the expression most commonly employed for radial cracks is Equation (2) [51]:
K I C = a E H 1 2 × P C 3 2
where a is a (dimensionless) empirical constant depending on the indenter geometry (a = 0016 for pyramidal tips), P (in mN) is the peak indentation load, and C (in mm) is the length of the radial cracks. For Palmqvist cracks, the following Equation (3) applies [52]:
K I C = a l 1 2 × E H 2 3 × P C 3 2
where xv is 0.016 for a Berkovich tip indenter, a (mm) is the length from the center of the imprint until one of the corners, and l (mm) is the crack length. The applicability of the different expressions for indentation microfracture tests performed with Berkovich indenters has been extensively discussed in [53,54].

2.7. Statistical Analysis

Statistical analysis has been carried out using the statistical software Minitab® 16.2.1 (Minitab Inc., State College, PA, USA). Parametric ANOVA or a non-parametric test with Kruskal–Wallis was performed, depending on the variables, with a confidence interval of 95% and considered statistically different when p < 0.05. Maximum compression strength results are set out as mean ± standard deviation.
All data were analyzed, beginning with a normal distribution test to determine if the data followed a normal distribution. If the values followed a normal distribution (p > 0.05) and two independent data groups were compared, the statistical study was conducted using the parametric t-test. If the values followed a normal distribution (p > 0.05) and three or more independent data groups were compared, the statistical study was conducted using the ANOVA test. In both studies, the initial hypothesis assumed that all means were equal. To accept this initial hypothesis as true, the probability was set within a 95% confidence interval, meaning the probability of it not being true was only 5%. Therefore, when the probability is less than 0.05, it indicates that the hypothesis is not met and that the means are not equal. Thus, if p < 0.05, the means are different, indicating statistically significant differences.
If the values did not follow a normal distribution (p < 0.05) and two independent data groups were compared, the study was conducted using the non-parametric Mann–Whitney test. If the values did not follow a normal distribution (p < 0.05) and three or more independent data groups were compared, the study was conducted using the non-parametric Kruskal–Wallis test. Therefore, when the Mann–Whitney and Kruskal–Wallis probability is p < 0.05, there are statistically significant differences between the variables and the factors analyzed.

3. Results

3.1. Uniaxial Flex-Compression Resistance

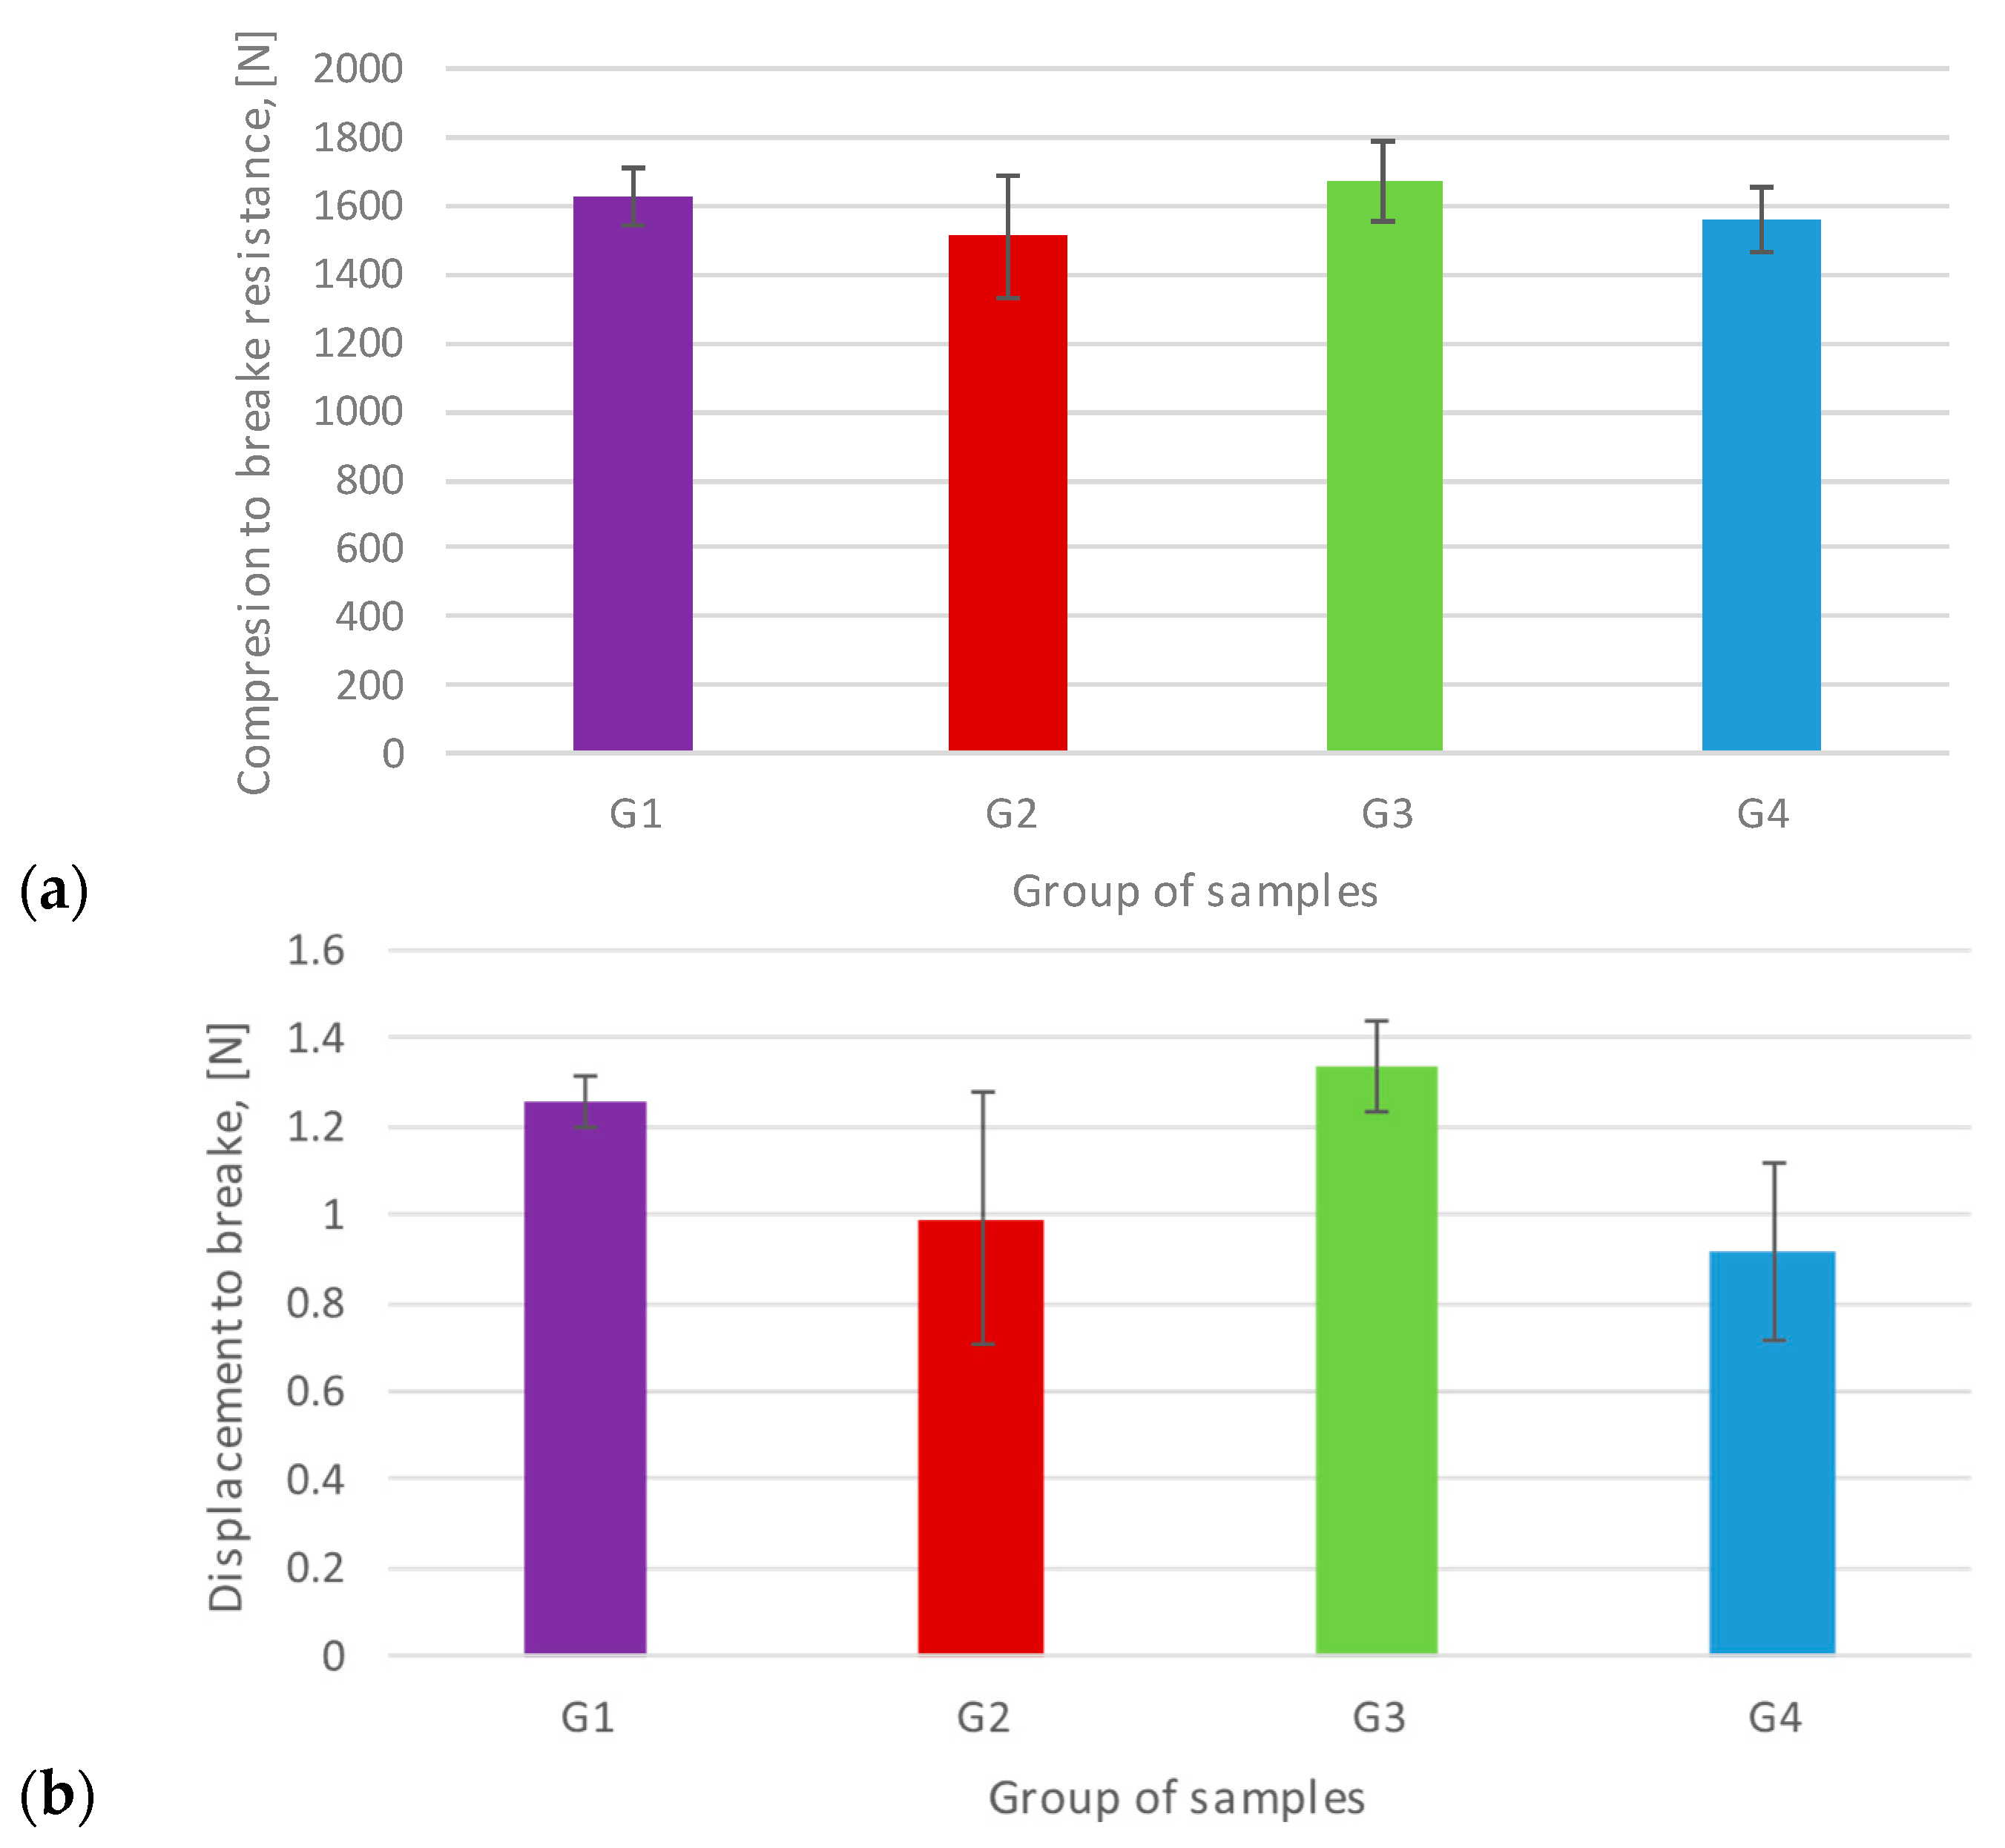
To obtain average values of the static compression strength for all tested implant sample groups, it is necessary to determine the starting point for the different levels of load required to create an S/N curve. In order to do this, compression tests were conducted on five different samples (n = 5) per sample group (Table 3). The comparative analysis of the maximum static fracture strength values suggested slightly higher maximum strength values in groups G3 and G1 in comparison to groups G4 and G2, respectively (Figure 6a). However, the statistical analysis of maximum fracture force results of the four sample groups did not reveal the presence of statistically significant differences (p = 0.213).
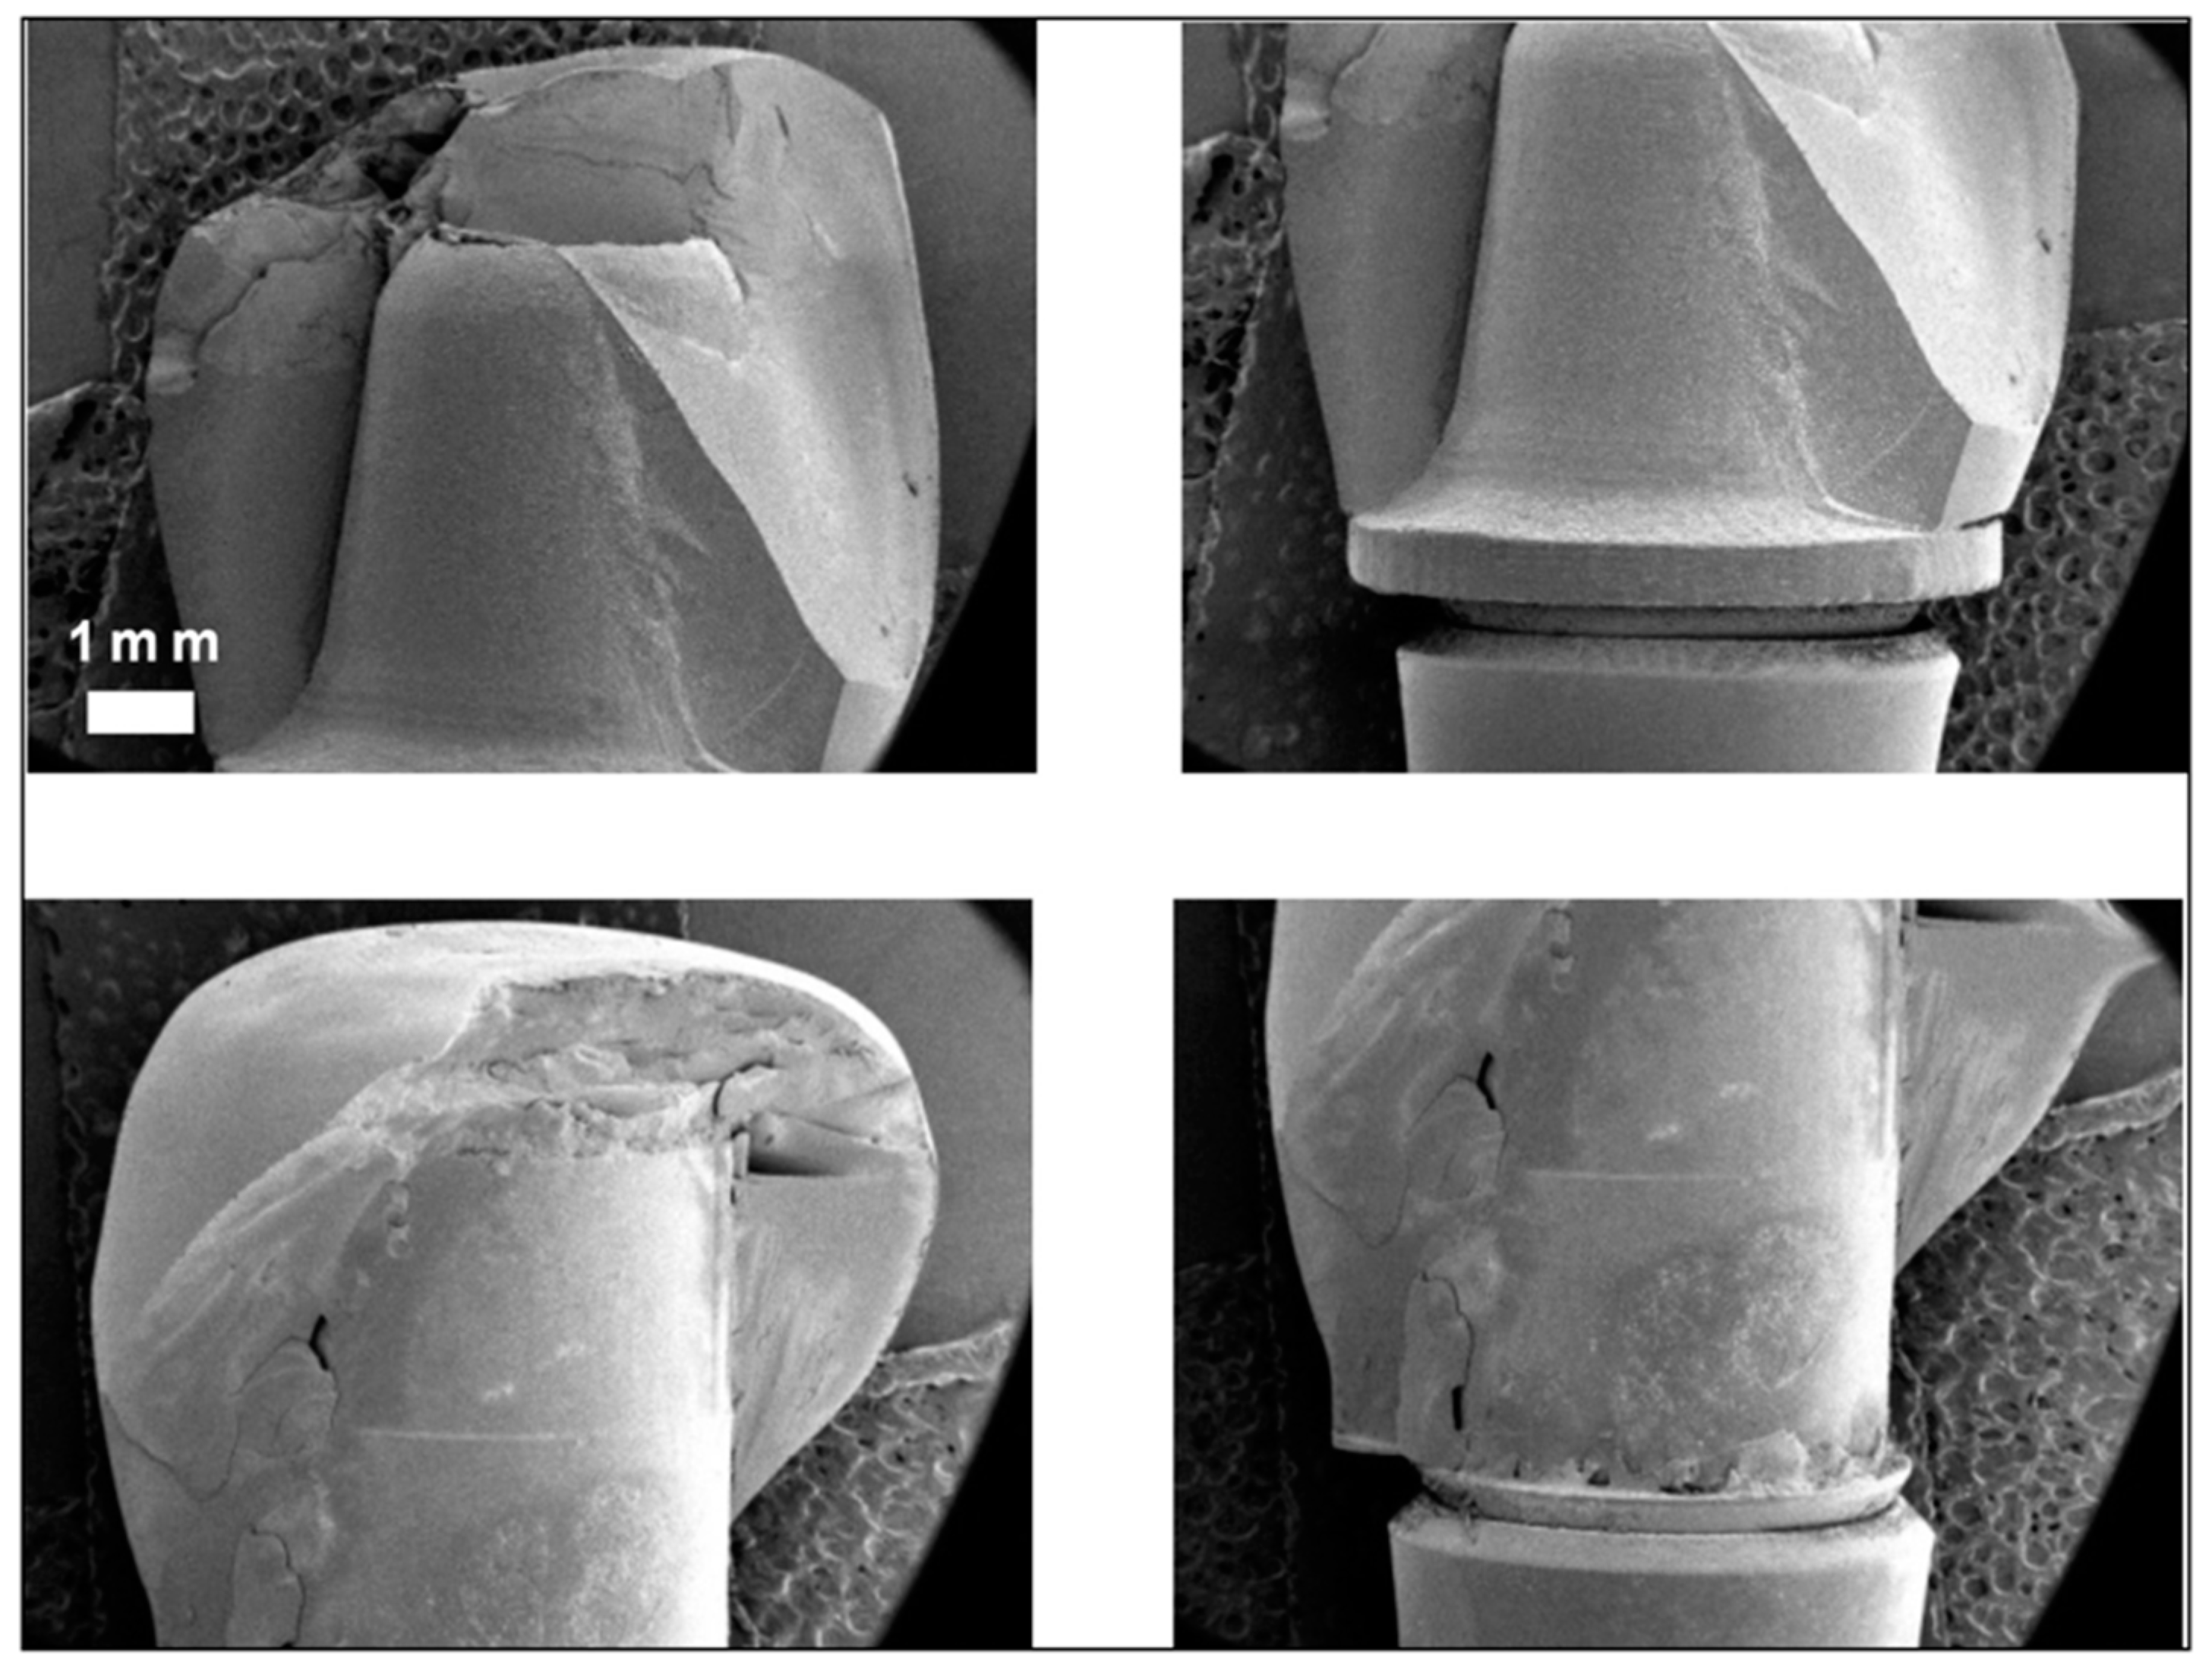
Moreover, the comparative analysis of displacement at break proposed higher displacement values in groups G3 and G1 compared to groups G2 and G4, respectively (Figure 6b). Furthermore, the analysis conducted on the displacement-to-fracture outcomes within the four groups unveiled the existence of statistically significant disparities in displacement (p = 0.005). There were statistically significant differences from displacement-to-fracture between the G3 and G4 sample groups (p = 0.006) but not between G1 and G2 (p = 0.71). The four study groups showed different modes of fracture. They were characterized by a deformation of the neck of the analog and a fracture of the fixation screw in groups G1 and G3, and crown fracture in groups G2 and G4 (Figure 7).
The images in Figure 7 show the different modes of fracture exhibited by the analyzed samples of the four study groups. They are characterized by a crown fracture in groups G2 and G4, a deformation of the neck of the analog and the fracture of the fixation screw in groups G1 and G3.

3.2. Uniaxial Cyclic Fatigue Test

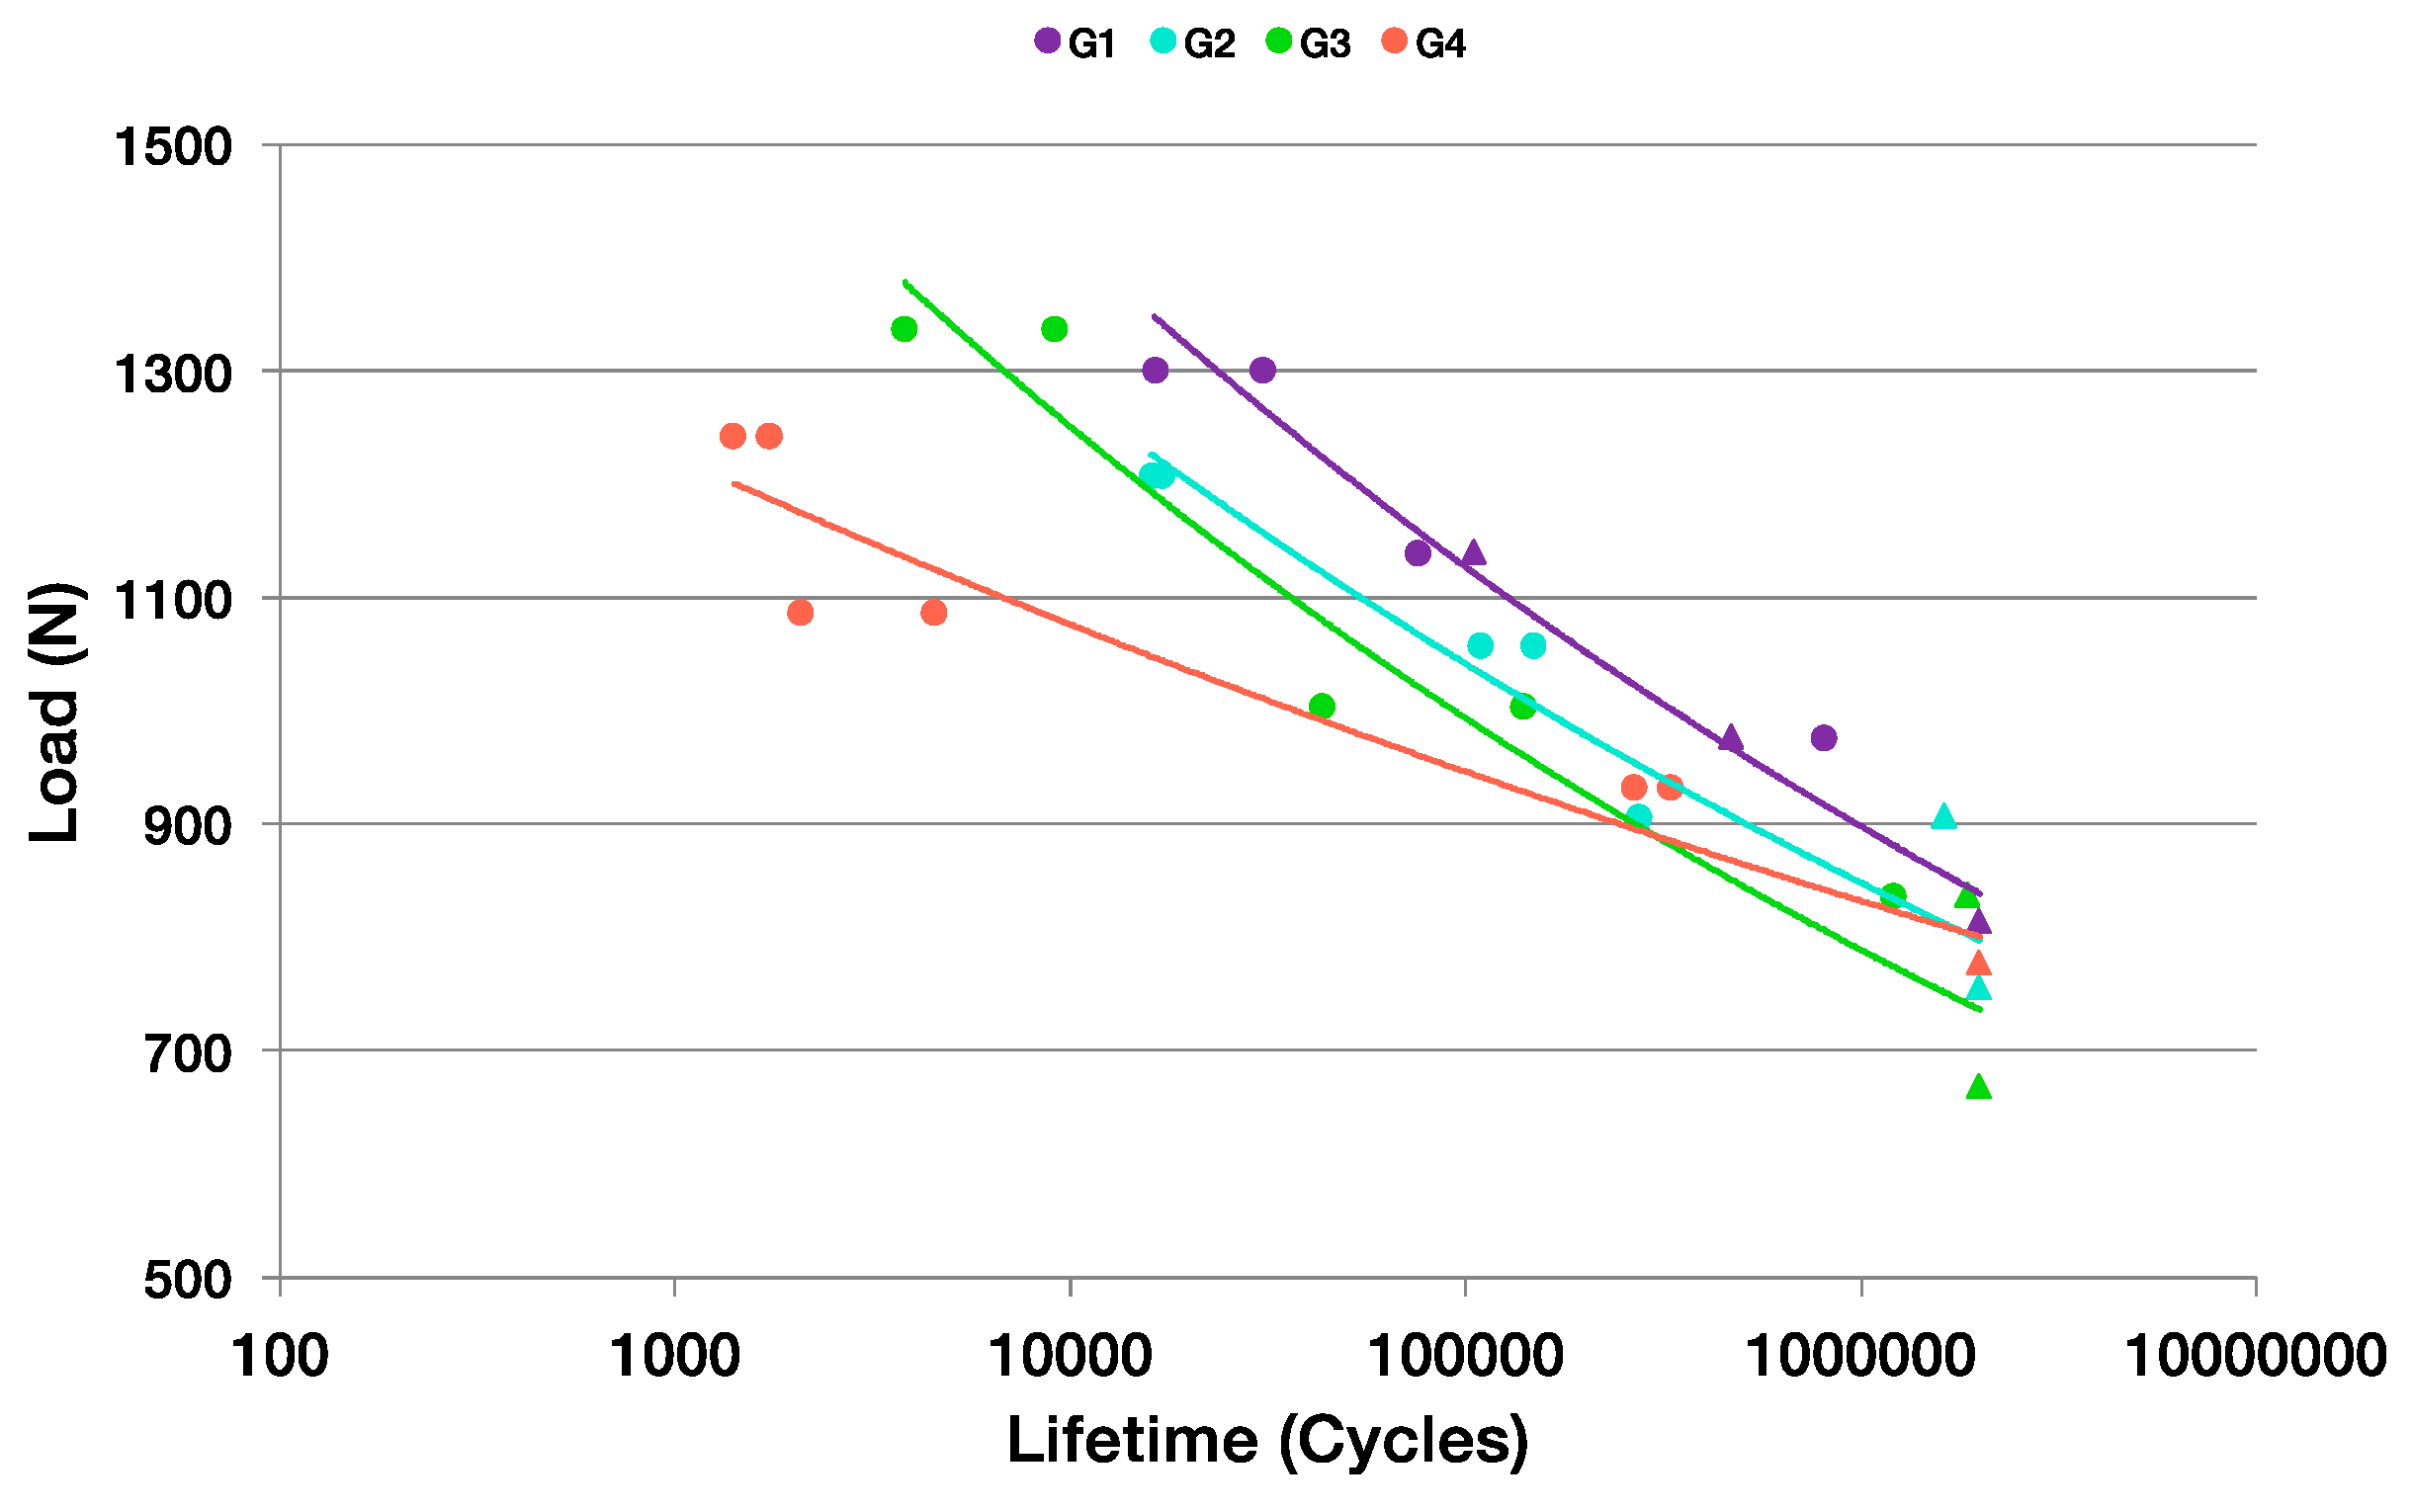
The S-N graphics obtained from the tests showed similar decreasing tendencies for all the groups (Figure 8). Moreover, the fatigue limit obtained was very similar for groups G2 and G4, whereas the G1 group showed the highest fatigue limit. Table 4 summarizes the fatigue limit (FL) for all sample groups.
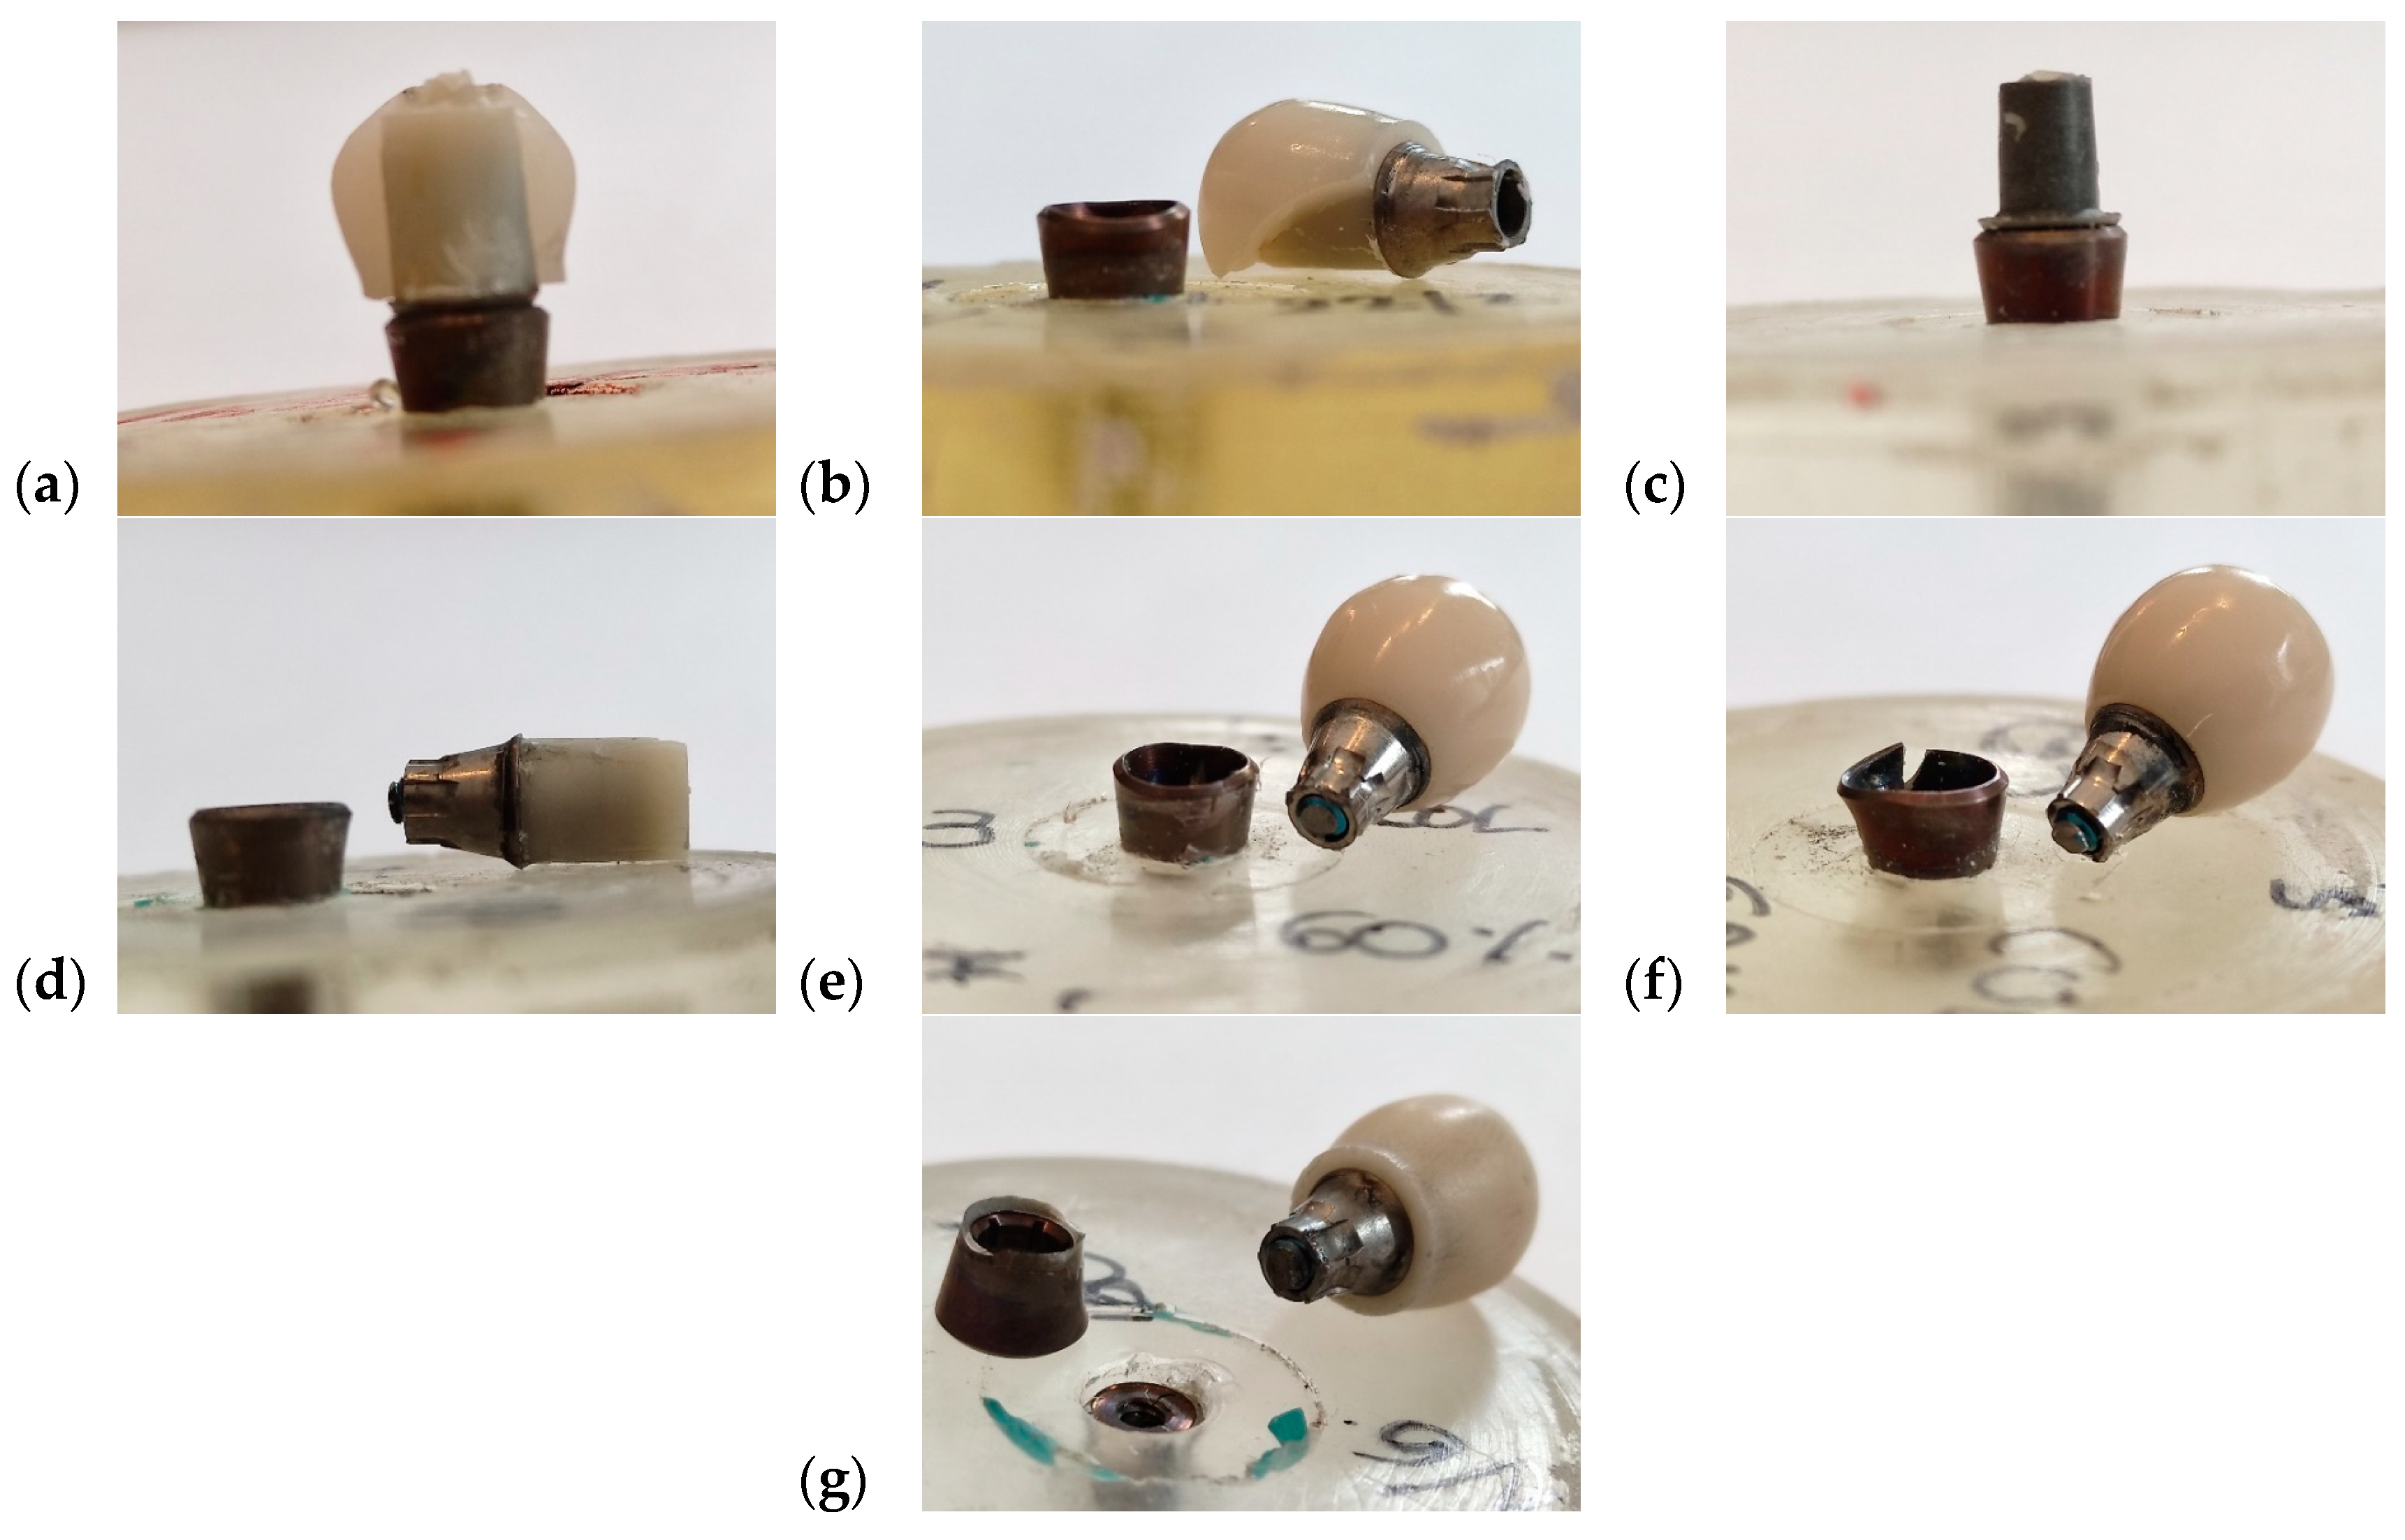
Moreover, Table 5 indicates the loads supported by each group sample and shows up to eight different fracture modes, from T1 through T8, with the eighth being run out of the samples. Likewise, Figure 9 is the illustrative image of these fracture modes on the samples.
A comparative analysis of the failure modes observed in this study has also revealed discrepancies among the different groups of samples evaluated. The implants in groups G2 and G3 exhibited very similar fracture behaviors, characterized by the same types of fracture modes at equivalent percentages of applied cyclic load. However, the G1 and G4 groups of samples not only displayed variations in fracture modes between each other but also demonstrated distinct fracture behaviors compared to the remaining groups, along with a greater variability of fracture modes.
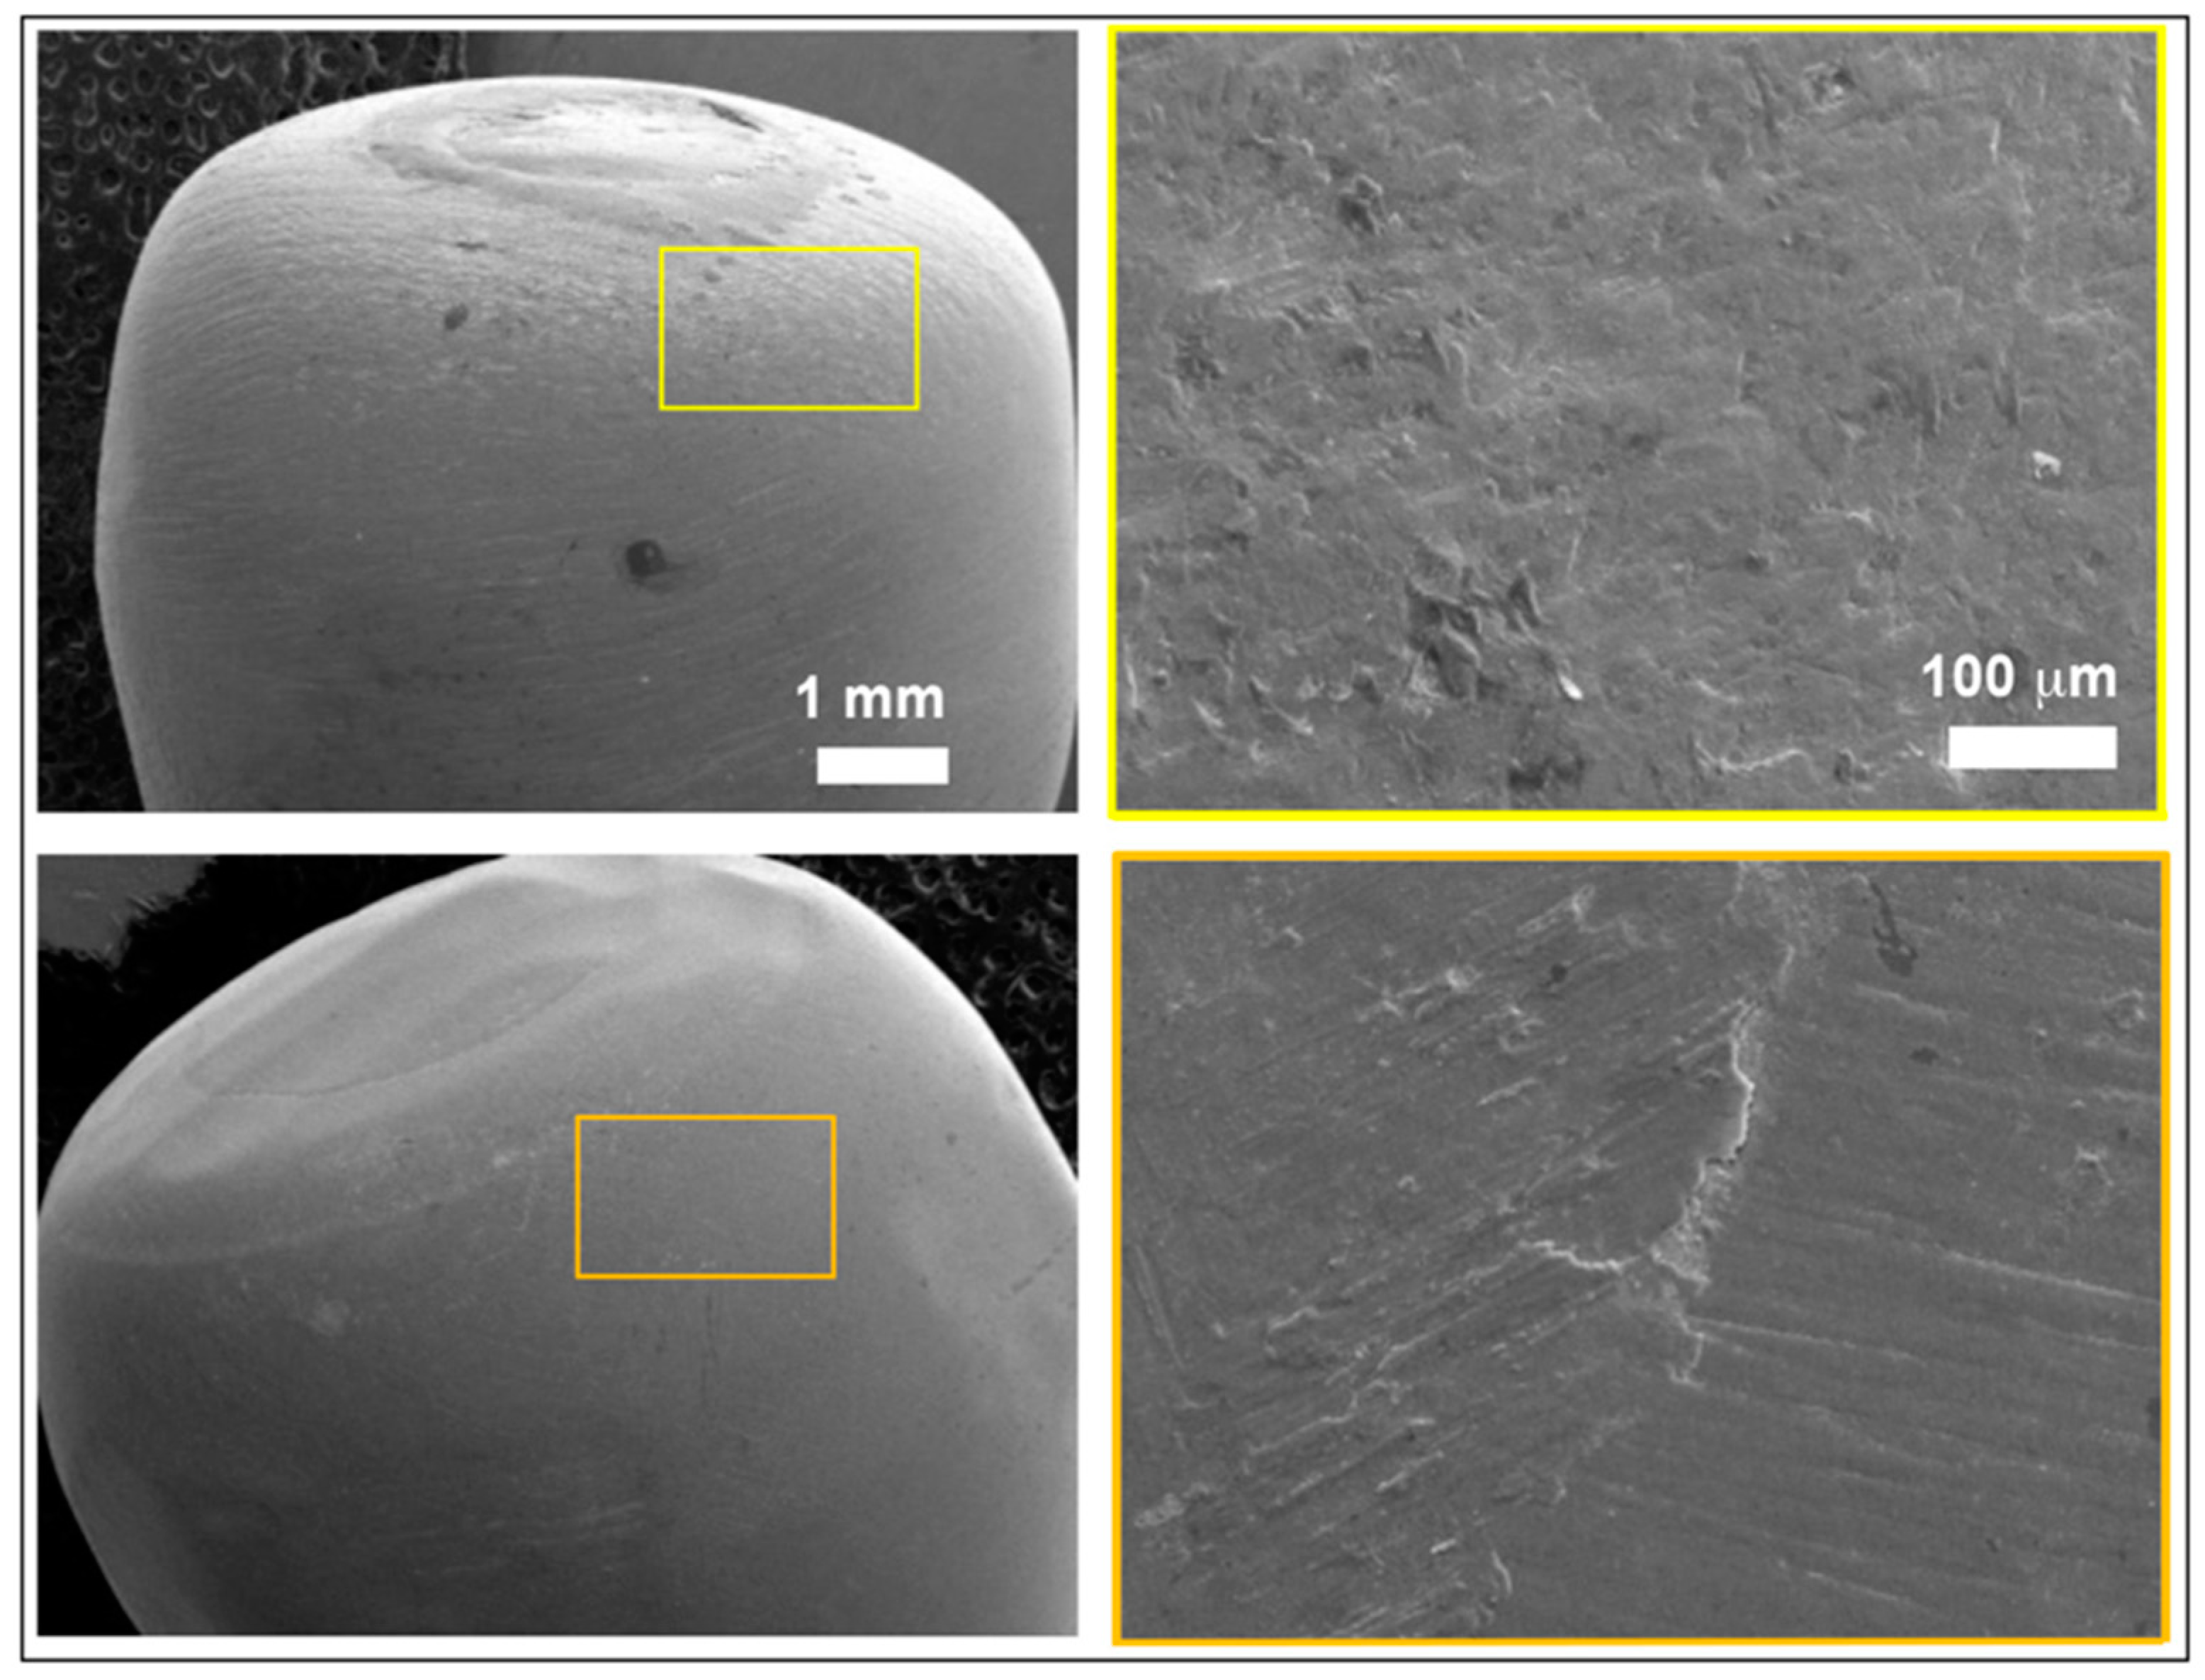
Figure 10 illustrates the fracture sections of fractured crowns pertaining to sample groups G2 and G4. A fractographic indicated a localized fracture initiation site at the crown’s uppermost region, presumably at the point of interaction with the load application clamp. Both samples exhibited crack formation on the external surface.
The fracture surface of sample G2 displayed superior material adherence. In contrast, the fracture surface of sample G4 exhibited interfacial cracks and areas with inadequate adherence, suggesting the existence of air bubbles between the material and the zirconia insert surface.
Scanning Electron Microscopy (SEM) images of non-fractured crowns subjected to fatigue tests for sample groups G1 (images a and b) and G3 (images c and d) are presented in Figure 11, respectively.
Detailed fractographic analysis of both specimens at higher magnifications (images b and d) shows a minimal contact area between the clamp and crown with no evidence of fissures, cracks, delamination or material detachment in the crown.
The mechanical load applied to the top of the samples would have been efficiently transmitted to the crown/analog connection area without causing any adverse effects on the crown material beyond minor wear marks due to relative sliding between the clamp and crown at the contact point.
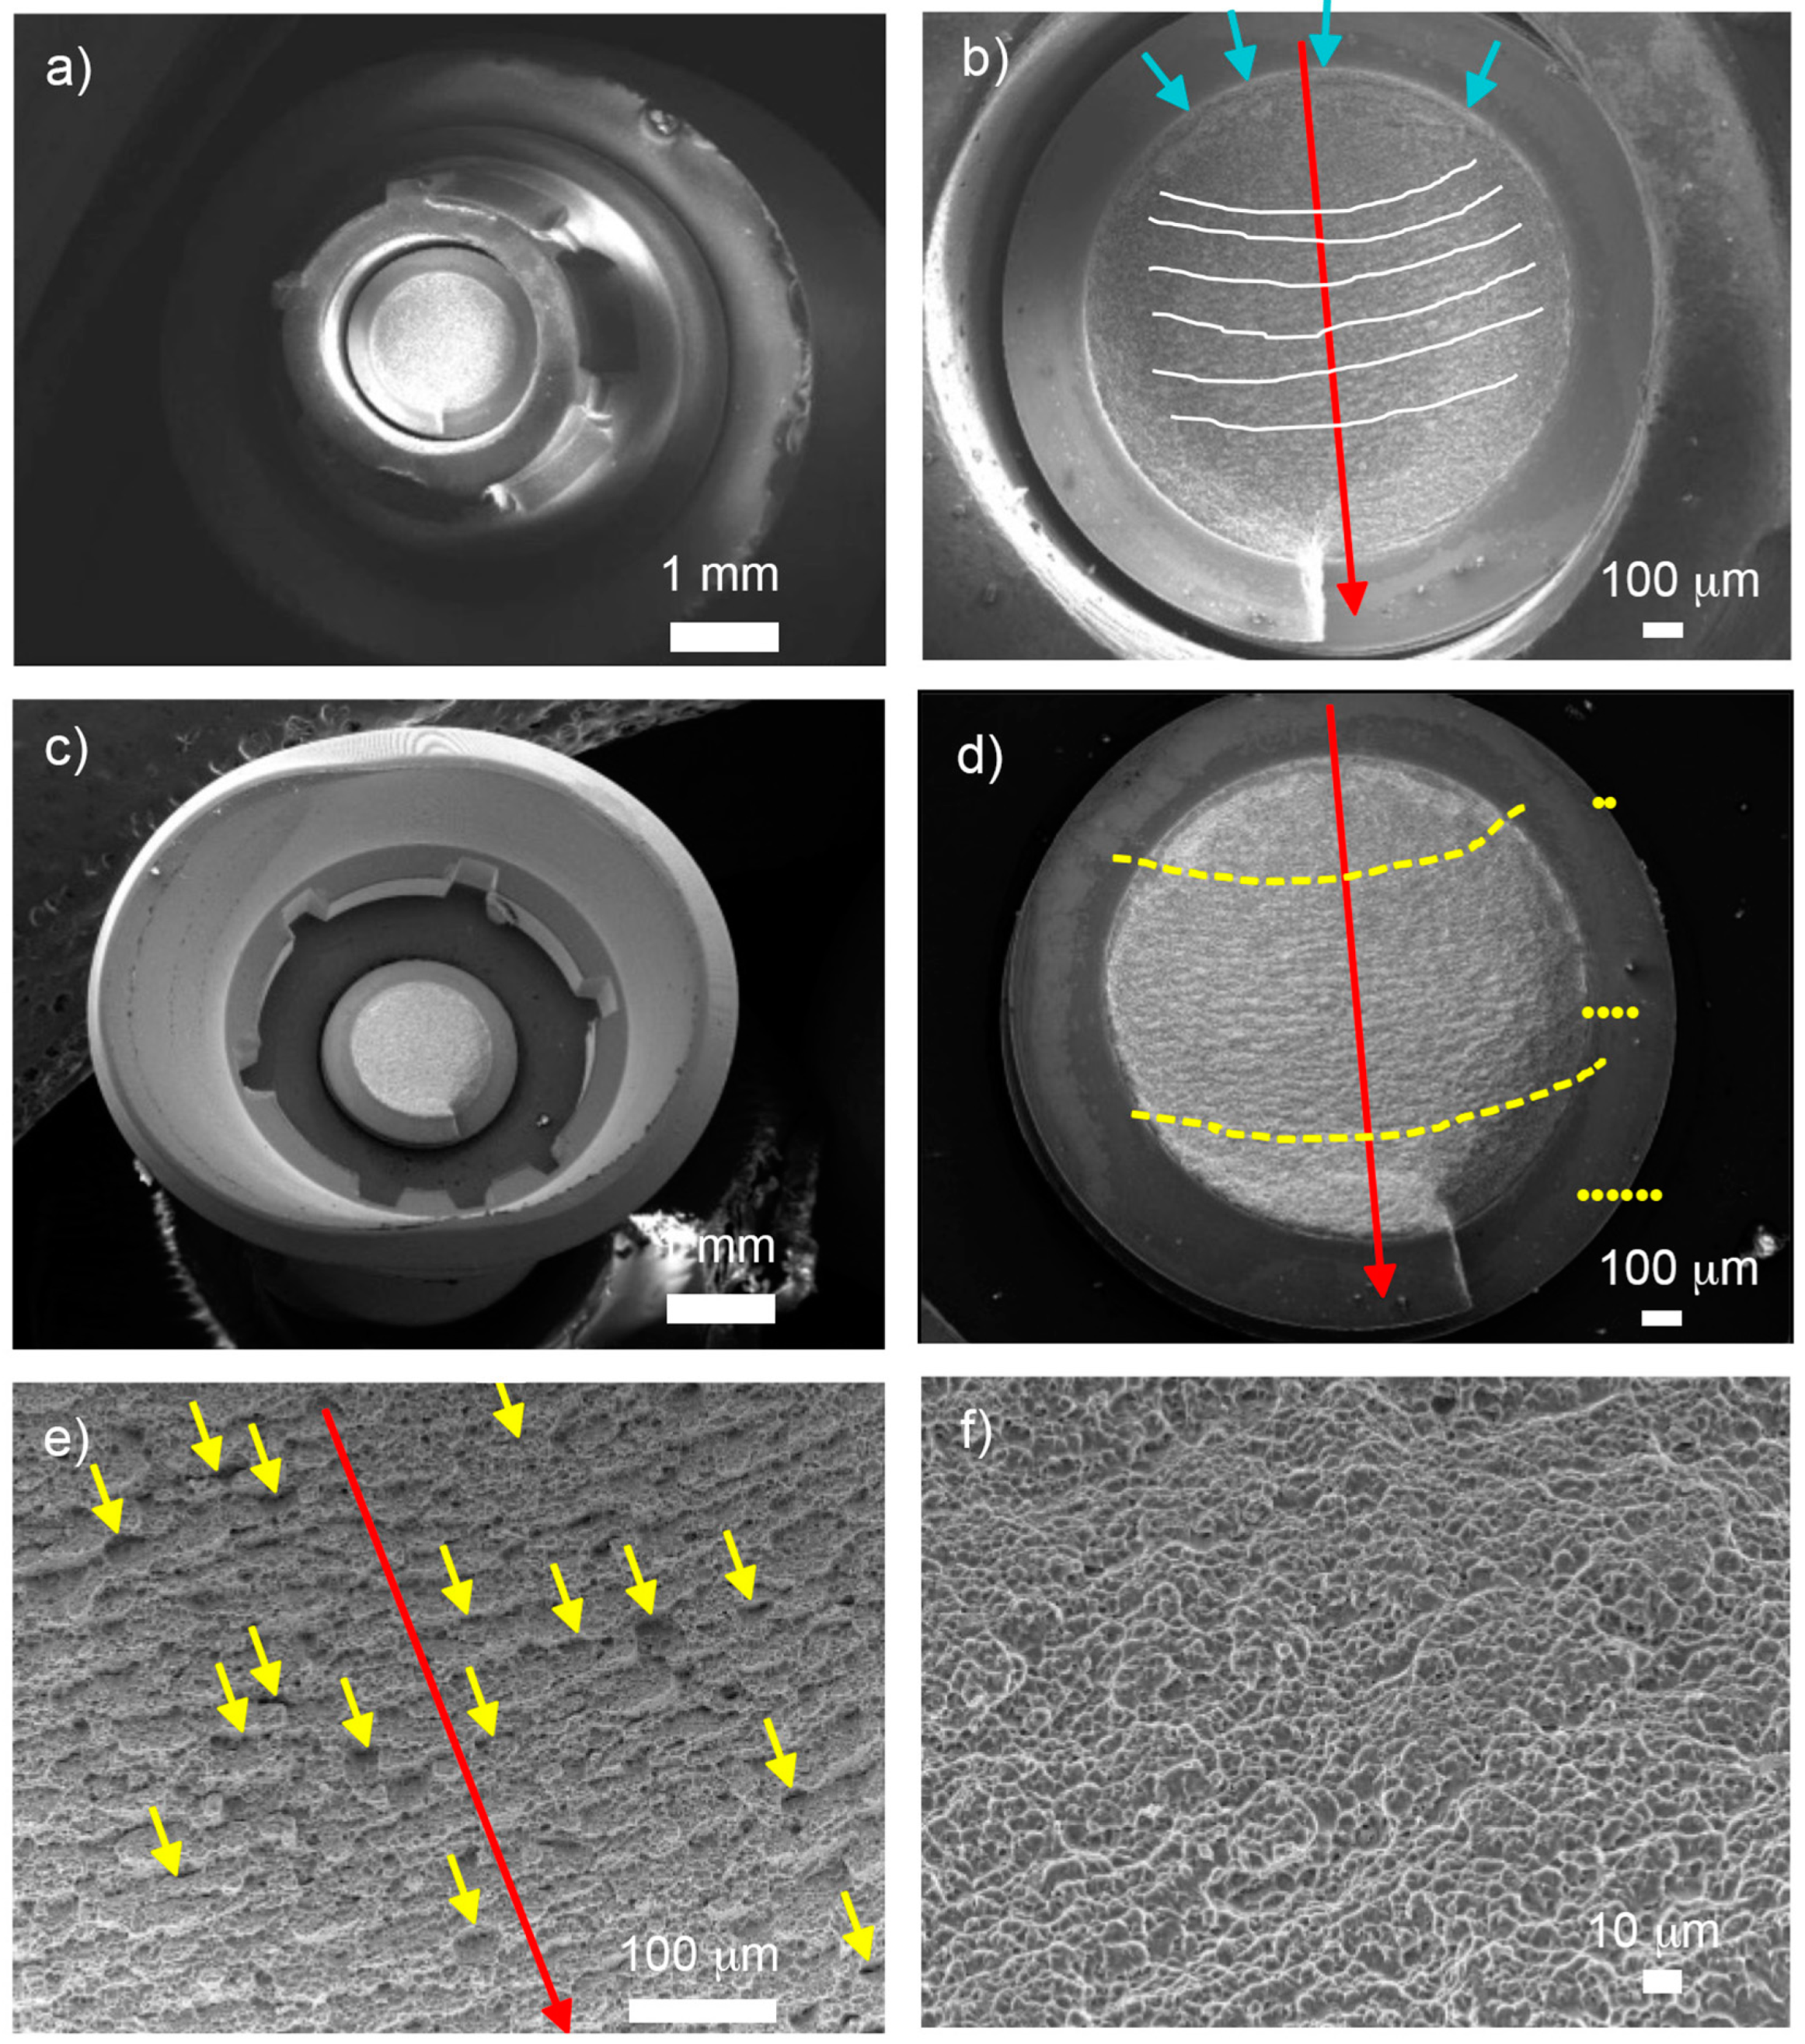
As shown in Figure 12, there was a significant level of plastic deformation experienced in the crown/abutment connection area (a and c), which transitioned from a spherical geometry to a completely oval shape. The components tested exhibited fracture along the loading direction and underwent significant levels of deformation in the same direction. Three fracture regions were identified (d): Region I, the initial nucleation crack zone, above the uppermost yellow striped line; Region II, the stable fatigue crack growth zone, between the yellow striped lines; and Region III, the catastrophic overload fracture zone, below the lower yellow striped line.
The observation of Region II (d) revealed the presence of two characteristic aspects indicative of fatigue fracture processes: striations and secondary cracking. Striations appeared as cyclic fatigue loading patterns in the form of thin parallel lines (e), while secondary cracking manifested as arrays of parallel microcracks perpendicular to the main direction of fracture propagation. In the ultimate failure in Region III (f), the fracture became unstable, leading to an “overload fracture” characterized by significant plastic deformation and “dimple” micro-cavity formation on the fracture surface.
Figure 12 depicts the fractured sections of group G3, highlighting the same three fracture regions on the fracture surface (d), delineated by yellow dashed lines. Region I was located on the outer surface of the screw in the zone submitted to bending and tensile stresses. In addition, it exhibited a limited number of crack initiation points indicated by blue arrows (d). These initiation points were situated on the smooth outer surface of the screw near the body–head connection zone, specifically within the thread valley. Region II exhibited the largest fracture surface area among the three regions, in addition to the presence of typical fracture advancement beach marks: (c) indicated by white lines and typical secondary crack striations and (e) indicated by yellow arrows.
In Region II (Figure 13), beach marks were observed, and their positions are perpendicular to the path of fracture advancement, which helps locate the point of fracture initiation. The secondary cracks seemed to propagate in the same preferential direction perpendicular to both the fracture advancement direction and beach marks (e), gradually reducing the resistant section of the screw. Region III, situated in the lower section of the micrograph (d), displayed notable plastic deformation from mechanical overloading, leading to the formation of “dimple” micro-cavities (f). This rougher region featured granular morphology and numerous dimples characteristic of microvoid coalescence.
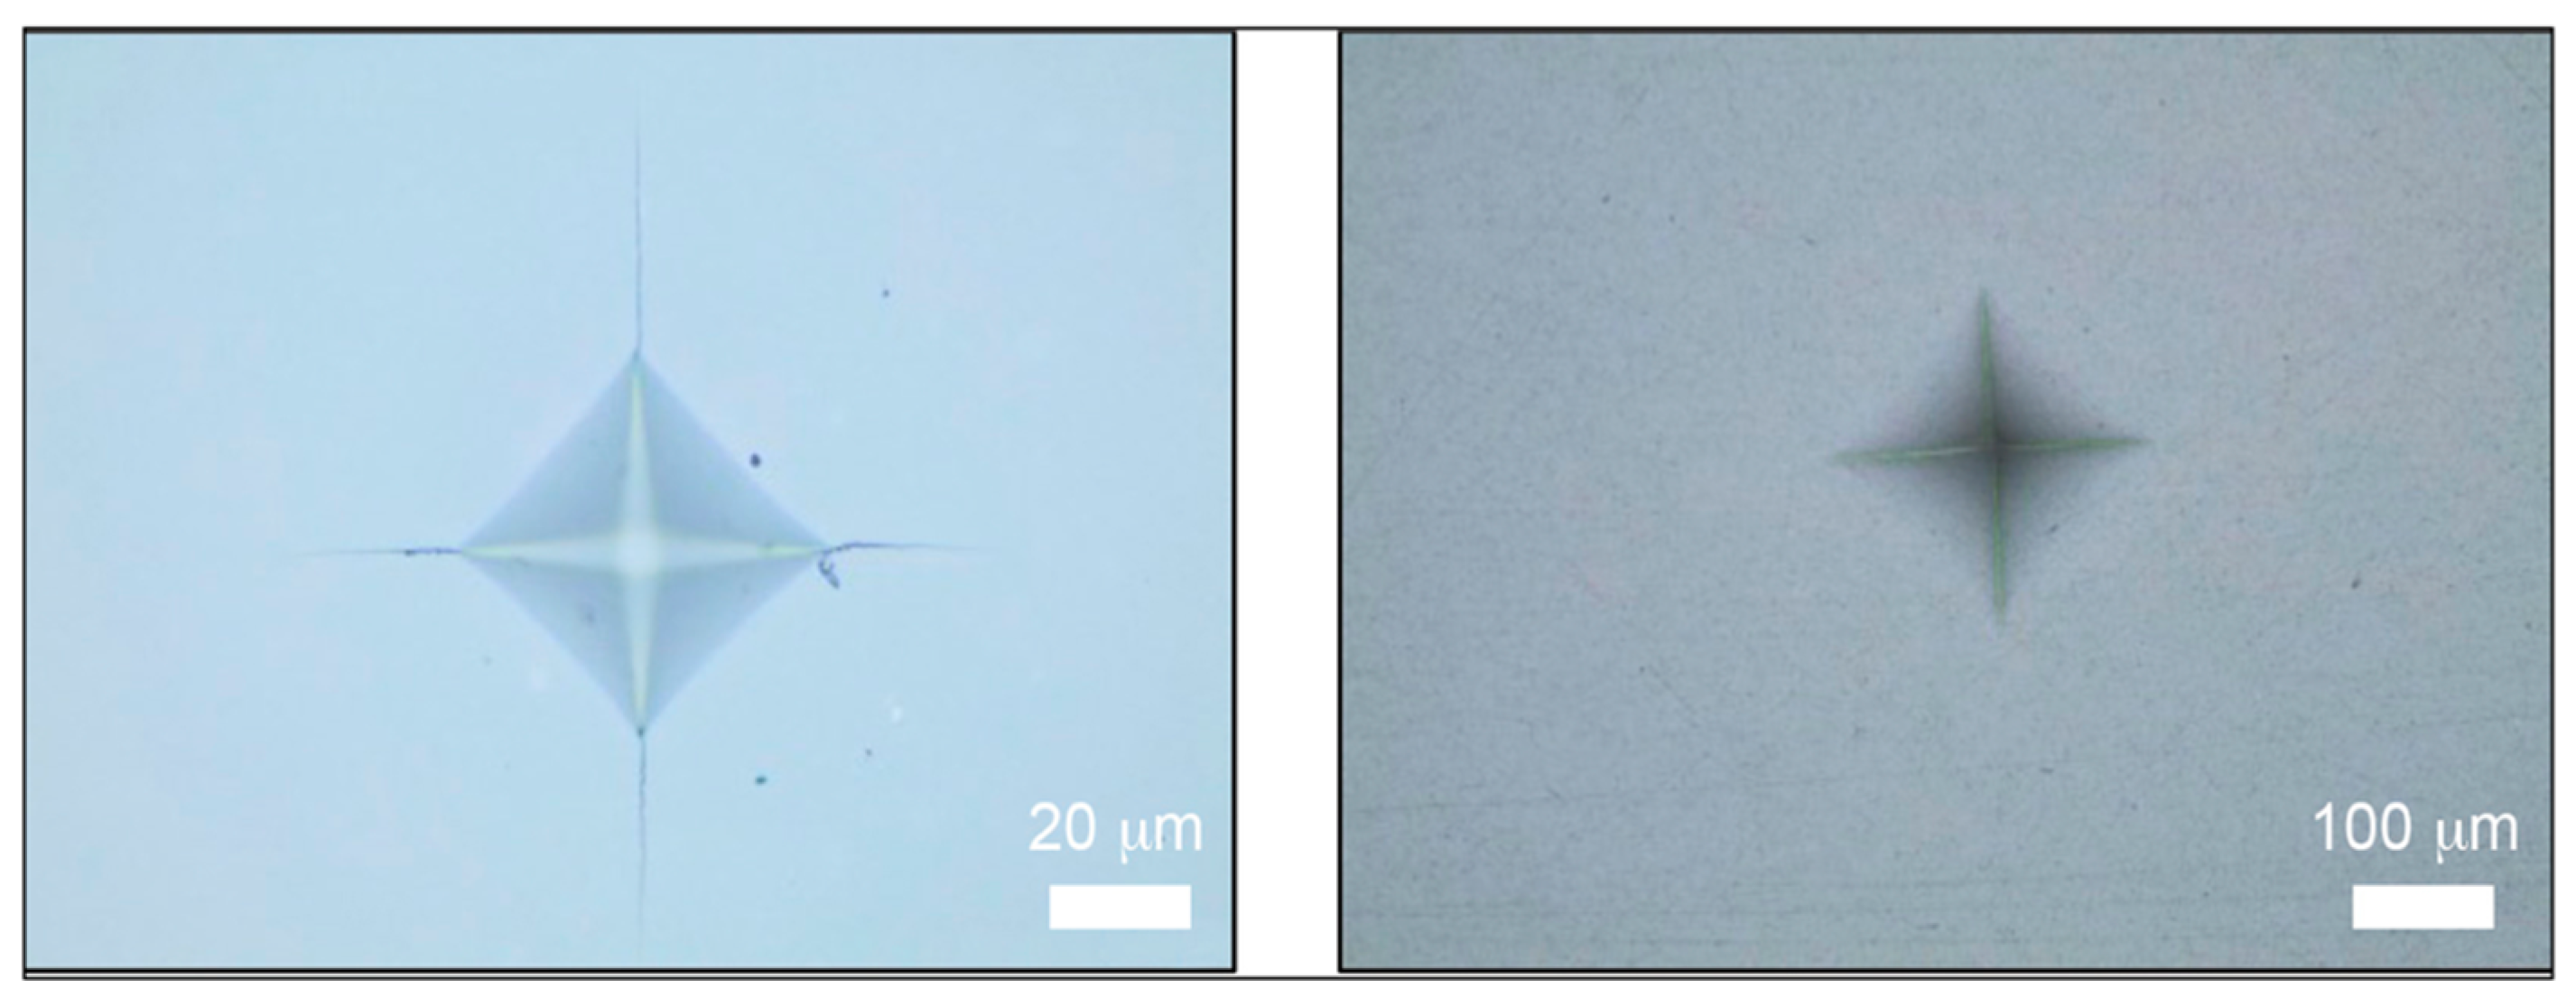
The indentation tests on the zirconia regions resulted in “small” imprints with a diameter of approximately 82 µm, while the same tests on the composite regions produced much larger imprints with a diameter of 355 µm (Figure 14). Contrarily, no cracks were observed in the composite regions at the corners of the imprints that prevented the determination of fracture toughness in these areas.
As shown in Table 6, the zirconia regions exhibited the standard hardness and fracture toughness values for dental zirconia ceramic grades, while the composite regions displayed lower hardness values.

4. Discussion

The main objective was to evaluate the mechanical behavior of the different combinations of materials among the samples and see how it affects the failure mode under static and dynamic loading.
Since the beginning of dental implantology history, the lack of cushioning on the ankylosis of implants has been a great concern and represents a big challenge for industrial manufacturers. The first attempt was the IMZ implant with the intra-mobile element (IME) as its implant system, which was very popular in the 1980s [56]; another different prototype was presented in 2014 [57]. New developments in CAD/CAM materials, especially resin-based blocks, appeared on the market in the same decade. In 2012, the global manufacture of dental materials (3M ESPE, Seefeld, Germany) launched a new CAD/CAM restorative material: Lava Ultimate, based on Magne et al. [24] which was the first study that combined stiff ceramic and the resilient composite block. Despite the promising results of this combination of materials in emulating the Cushing effect of the periodontal ligament, the results from one clinical trial presented a higher failure rate, approximately 80% [58]. Two in vitro studies by Krejci et al. [59] and Lohbauer et al. [60] explained the reasons for the failures by demonstrating the high stress concentration at the bonding interface in between composite/zirconia and the reasons for debonding.
Thus, combining resilient composite on top of the implant crown with a low module of elasticity (around 10–15 Gpa of resin-composite blocks) and stiff ceramic with a high module of elasticity (210 Gpa of zirconia) on the base of the implant crown and bonded to the Ti-base abutment needs adequate bonding to work accordingly with the materials. Hence, in 2015, the same manufacturer withdrew the indication for implant and dental crowns, given the lack of a bonding strategy. Later, in 2016, a new resin block was launched in the dental market along with a new bonding strategy: Brilliant Crios and One Coat 7 Universal (Coltene Whaledent, Altstätten, Switzerland). The effectiveness of the new bonding protocol was confirmed by Reymus et al. [61] and Emsermann et al. [62], showing the disadvantages of using silane over resin-composite blocks and the benefits of monomers containing MDP.
Currently, the use of resin-composite blocks for implant crowns is well accepted because of the damping effect, considering the high occlusal forces of around 900 N required for molar areas [63,64,65]. Given the lack of evidence, it is unknown which is the best scenario for this material: either the monolithic bonded directly to the Ti-base (G3) or combined with mesostructured zirconia (G2 and G4), as proposed by Magne et al. [24]. According to our results, both scenarios—monolithic G2 or layered G3 and G4—demonstrated fracture strength in comparison to zirconia monolithic ceramic crowns G1, with no statistically significant differences in Fmax.
The key point of this study was focused on the damping effect and the failure mode of the material combination crown–abutment. This influenced the failure mode of the restoration, transitioning from a fatigue fracture type located at the abutment–analog connection for monolithic materials (G1 and G3) to a brittle fracture located in the crown for bi-layered materials (G2 and G4). This coincides with the research carried out by Elsayed et al. [35], where they demonstrated favorable failures, and Taha et al. [34], who concluded that with less rigid crown materials, a stiff substructure might be able to preserve their force absorption behavior.
This study was conducted to simulate the chewing function using cyclic loading and the humidity of the oral cavity conditions to ensure their reliability and durability. We also used prefabricated blocks and original Ti-base abutments with a conical abutment connection [66,67,68] to achieve the ideal tolerance, cement space and a proper bonding strategy between the Ti-base and the different layers of the implant crowns under study. Thus, to achieve the damping effect in resin implant restorations with a low module of elasticity, it is necessary to have support from a stiff material, such as a substructure or mesostructure, in contact with the titanium base, as demonstrated by Südbeck et al. [69]. Furthermore, a reliable bonding interface among the different materials is essential, as confirmed by Rosentritt et al. [23].
The main hypothesis of this study was validated twice through the experimental findings, as significant differences had been observed among the four assessed materials within implant–abutment–screw assemblies, both in terms of maximum fracture strength and fatigue limit values. Consequently, the null hypothesis was rejected due to the discernment of significant differences among the sample groups, as proved by the results of analyses of fracture resistance, fatigue survival, and fracture mode. This makes them potentially suitable as an alternative for restoring single implants, even in the posterior area of the mouth. The fatigue limits of the four tested groups have been determined, with the resistance arranged in the following decreasing order: G1 > G4 > G2 > G3.
Future research works are expected to focus on increasing the fracture and fatigue resistance of these bi-layered crowns through a geometric overhaul of the internal ceramic insert. This dual objective aims to amplify load-absorption capacity and refine internal load distribution, thereby concurrently reducing potential stress concentration effects.
The main limitations of the study are, among others, the use of implant replicas instead of real implants, the use of implant crowns with bigger prosthetic height and testing the wear of the implant composite block. Those aspects should be laboratory and clinically tested to evaluate the long-term performance of these restorations in the future scope of current work.

5. Conclusions

From the results obtained from both static and dynamic mechanical tests, the use of monolithic crowns would entail the direct and complete transmission of applied mechanical loads to the crown/abutment connection area, leading to progressive deformation of the abutment neck and eventual fatigue fracture of the connection screw. On the other hand, the use of bi-laminar crowns appears to protect the crown/abutment connection area by partially absorbing the applied mechanical loads, preventing deformation and fracture of the connection area at the expense of facing the final partial or total fracture of the crown.
The maximum fracture strength values obtained in this study greatly surpass the previously reported maximum beat occlusal forces, with mean Fmax values ranging from 1510.20 ± 176.96 N to 1671.18 ± 119.17 N, corresponding to the sample groups G2 and G3, respectively. Additionally, in a comparative context, the fatigue limit (LF) values obtained in this study, ranging between 668 N and 813 N, would be of a comparable magnitude, potentially indicative of infinite fatigue life resistance without failure.
Both monolithic and bi-laminar designs are approved for dental crown use, even in high-stress molar regions. Bi-laminar crowns, however, seem to safeguard the crown/abutment junction by absorbing mechanical loads, averting excessive deformation and implant fracture. This enables the crown repair of post-partial or full fractures without the need for implant removal.
In future studies, efforts are expected to improve the fracture and fatigue resistance of these bi-laminar crowns by geometrically redesigning the inner ceramic insert to enhance load distribution and reduce potential stress concentration.

6. Patents

The authors, Dr. Nicolas Gutierrez R. and Dr. Ralf Böhner (RIP), declare the rights as inventors of the “DENTAL BLANK WITH AN INSERT” by the European patent # 17175940.0-1126 on 19 September 2018 and US patent # 11.633,267 B2 in 25 April 2023.

Author Contributions

Conception and Design: N.G.R. and M.P.F. Drafting the article or revising: N.G.R., M.P.F., A.R.-C., F.G.M., J.M.M.P., O.F.-Á. and M.R.C. Final approval of the version submitted: N.G.R., M.P.F., A.R.-C., F.G.M., J.M.M.P., O.F.-Á. and M.R.C. All authors have read and agreed to the published version of the manuscript.

Funding

The authors acknowledge the financial support received from the Ministry of Science and Innovation of Spain for financial support through the PID2021- 125150OB-I00 project, cofounded by the EU through the European Regional Development Funds (MINECO-FEDER, EU). The authors are thankful to both Generalitat de Cataluña and the Agència de Gestioó d’Ajuts Universitaris i de Recerca (2021 SGR 01368) for financial support. The authors also wish to thank the Ministry of Science and Innovation of Spain for financial support through the María de Maeztu Program for Units of Excellence CEX2023-001300-M funded by MICIU/AEI/10.13039/501100011033.

Informed Consent Statement

Not applicable.

Data Availability Statement

The original contributions presented in the study are included in the article, further inquiries can be directed to the corresponding author.

Acknowledgments

The authors wish to thank COLTENE/WALEDENT for their financial support used in the in vitro assays and the material support and to DENTSPLY SIRONA for the material support. We also want to thank Ralf Böhner (RIP) for his contributions to the design and development of the new block patent.

Conflicts of Interest

The authors declare no conflict of interest.

References

  1. Chang, H.H.; Yeh, C.L.; Wang, Y.L.; Huang, Y.C.; Tsai, S.J.; Li, Y.T.; Yang, J.H.; Lin, C.P. Differences in the biomechanical behaviors of natural teeth and dental implants. Dent. Mater. 2021, 37, 682–689. [Google Scholar] [CrossRef] [PubMed]
  2. Murakami, H.; Igarashi, K.; Fuse, M.; Kitagawa, T.; Igarashi, M.; Uchibori, S.; Komine, C.; Gotouda, H.; Okada, H.; Kawai, Y. Risk factors for abutment and implant fracture after loading. J. Oral Sci. 2021, 63, 92–97. [Google Scholar] [CrossRef] [PubMed]
  3. Yi, Y.; Heo, S.J.; Koak, J.Y.; Kim, S.K. Mechanical complications of implant-supported restorations with internal conical connection implants: A 14-year retrospective study. J. Prosthet. Dent. 2023, 129, 732–740. [Google Scholar] [CrossRef] [PubMed]
  4. Jung, R.E.; Zembic, A.; Pjetursson, B.E.; Zwahlen, M.; Thoma, D.S. Systematic review of the survival rate and the incidence of biological, technical, and aesthetic complications of single crowns on implants reported in longitudinal studies with a mean follow-up of 5 years. Clin. Oral Implants Res. 2012, 23 (Suppl. S6), 2–21. [Google Scholar] [CrossRef] [PubMed]
  5. Jung, R.E.; Pjetursson, B.E.; Glauser, R.; Zembic, A.; Zwahlen, M.; Lang, N.P. A systematic review of the 5-year survival and complication rates of implant-supported single crowns. Clin. Oral Implants Res. 2008, 19, 119–130. [Google Scholar] [CrossRef] [PubMed]
  6. Pjetursson, B.E.; Sailer, I.; Latyshev, A.; Rabel, K.; Kohal, R.J.; Karasan, D. A systematic review and meta-analysis evaluating the survival, the failure, and the complication rates of veneered and monolithic all-ceramic implant-supported single crowns. Clin. Oral Implants Res. 2021, 32 (Suppl. S21), 254–288. [Google Scholar] [CrossRef] [PubMed]
  7. Gracis, S.; Thompson, V.P.; Ferencz, J.L.; Silva, N.R.; Bonfante, E.A. A New Classification System for All-Ceramic and Ceramic-like Restorative Materials. Int. J. Prosthodont. 2015, 28, 227–235. [Google Scholar] [CrossRef] [PubMed]
  8. Nguyen, J.F.; Migonney, V.; Ruse, N.D.; Sadoun, M. Resin composite blocks via high-pressure high-temperature polymerization. Dent. Mater. 2012, 28, 529–534. [Google Scholar] [CrossRef] [PubMed]
  9. Ruse, N.D.; Sadoun, M.J. Resin-composite blocks for dental CAD/CAM applications. J. Dent. Res. 2014, 93, 1232–1234. [Google Scholar] [CrossRef] [PubMed]
  10. Mainjot, A.K.; Dupont, N.M.; Oudkerk, J.C.; Dewael, T.Y.; Sadoun, M.J. From Artisanal to CAD-CAM Blocks: State of the Art of Indirect Composites. J. Dent. Res. 2016, 95, 487–495. [Google Scholar] [CrossRef]
  11. Mourouzis, P.; Andreasidou, E.; Samanidou, V.; Tolidis, K. Short-term and long-term release of monomers from newly developed resin-modified ceramics and composite resin CAD-CAM blocks. J. Prosthet. Dent. 2020, 123, 339–348. [Google Scholar] [CrossRef]
  12. Hampe, R.; Theelke, B.; Lümkemann, N.; Eichberger, M.; Stawarczyk, B. Fracture toughness analysis of ceramic and resin composite CAD/CAM material. Oper. Dent. 2019, 44, E190–E201. [Google Scholar] [CrossRef]
  13. Naffah, N.; Ounsi, H.; Ozcan, M.; Bassal, H.; Salameh, Z. Evaluation of the adaptation and fracture resistance of three CAD-CAM resin ceramics: An in vitro study. J. Contemp. Dent. Pract. 2019, 20, 571–576. [Google Scholar]
  14. Lauvahutanon, S.; Takahashi, H.; Shiozawa, M.; Iwasaki, N.; Asakawa, Y.; Oki, M.; Finger, W.J.; Arksornnukit, M. Mechanical properties of composite resin blocks for CAD/CAM. Dent. Mater. J. 2014, 33, 705–710. [Google Scholar] [CrossRef]
  15. Awada, A.; Nathanson, D.; Coldea, A.; Swain, M.V.; Thiel, N.; Della Bona, A. Mechanical properties of resin-ceramic CAD/CAM restorative materials. J. Prosthet. Dent. 2015, 114, 587–593. [Google Scholar] [CrossRef]
  16. Chavali, R.; Nejat, A.H.; Lawson, N.C. Machinability of CAD-CAM materials. J. Prosthet. Dent. 2017, 118, 194–199. [Google Scholar] [CrossRef] [PubMed]
  17. Lauvahutanon, S.; Takahashi, H.; Oki, M.; Arkornnukit, M.; Kanehira, M.; Finger, W.J. In vitro evaluation of the wear resistance of composite resin blocks for CAD/CAM. Dent. Mater. J. 2015, 34, 495–502. [Google Scholar] [CrossRef] [PubMed]
  18. Zaim, B.; Kalay, T.S.; Purcek, G. Friction, and wear behavior of chairside CAD-CAM materials against different types of antagonists: An in vitro study. J. Prosthet. Dent. 2022, 128, 803–813. [Google Scholar] [CrossRef] [PubMed]
  19. Stawarczyk, B.; Liebermann, A.; Eichberger, M.; Güth, J.F. Evaluation of mechanical and optical behavior of current esthetic dental restorative CAD/CAM composites. J. Mech. Behav. Biomed. Mater. 2015, 55, 1–11. [Google Scholar] [CrossRef]
  20. Stawarczyk, B.; Özcan, M.; Trottmann, A.; Schmutz, F.; Roos, M.; Hämmerle, C. Two-body wear rate of CAD/CAM resin blocks and their enamel antagonists. J. Prosthet. Dent. 2013, 109, 325–332. [Google Scholar] [CrossRef]
  21. Gracis, S.E.; Nicholls, J.I.; Chalupnik, J.D.; Yuodelis, R.A. Shock-absorbing behavior of five restorative materials used on implants. Int. J. Prosthodont. 1991, 4, 282–291. [Google Scholar] [CrossRef] [PubMed]
  22. Niem, T.; Youssef, N.; Wöstmann, B. Energy dissipation capacities of CAD-CAM restorative materials: A comparative evaluation of resilience and toughness. J. Prosthet. Dent. 2019, 121, 101–109. [Google Scholar] [CrossRef] [PubMed]
  23. Rosentritt, M.; Schneider-Feyrer, S.; Behr, M.; Preis, V. In Vitro Shock Absorption Tests on Implant-Supported Crowns: Influence of Crown Materials and Luting Agents. Int. J. Oral Maxillofac. Implants 2018, 33, 116–122. [Google Scholar] [CrossRef] [PubMed]
  24. Magne, P.; Silva, M.; Oderich, E.; Boff, L.L.; Enciso, R. Damping behavior of implant-supported restorations. Clin. Oral Implants Res. 2013, 24, 143–148. [Google Scholar] [CrossRef] [PubMed]
  25. Menini, M.; Conserva, E.; Tealdo, T.; Bevilacqua, M.; Pera, F.; Signori, A.; Pera, P. Shock Absorption Capacity of Restorative Materials for Dental Implant Prostheses: An In Vitro Study. Int. J. Prosthodont. 2013, 26, 549–556. [Google Scholar] [CrossRef] [PubMed]
  26. Han, J.Y.; Hou, J.X.; Zhou, G.; Wang, C.; Fan, Y.B. A histological and biomechanical study of bone stress and bone remodeling around immediately loaded implants. Sci. China Life Sci. 2014, 57, 618–626. [Google Scholar] [CrossRef] [PubMed]
  27. Frost, H.M. Wolff’s Law and bone’s structural adaptation to mechanical usage: An overview for clinicians. Angle Orthod. 1994, 64, 175–188. [Google Scholar] [PubMed]
  28. Fu, J.H.; Hsu, Y.T.; Wang, H.L. Identifying occlusal overload and how to deal with it to avoid marginal bone loss around implants. Eur. J. Oral Implantol. 2012, 5, S91–S103. [Google Scholar]
  29. Rossenberg, E.S.; Torosian, J.P.; Slots, J. Microbial differences in 2 clinically distinct types of failures of osseointegrated implants. Clin. Oral Implants Res. 1991, 2, 135–144. [Google Scholar] [CrossRef]
  30. Delgado-Ruiz, R.A.; Calvo-Guirado, J.L.; Romanos, G.E. Effects of occlusal forces on the peri-implant-bone interface stability. Periodontol. 2000 2019, 81, 179–193. [Google Scholar] [CrossRef]
  31. Mish, C.E. Contemporary Implant Dentistry, 3rd ed.; Elsevier: St. Louis, MO, USA, 2008. [Google Scholar]
  32. Korabi, R.; Shemtov-Yona, K.; Dorogoy, A.; Rittel, D. The Failure Envelope Concept Applied to the Bone-Dental Implant System. Sci. Rep. 2017, 7, 2051. [Google Scholar] [CrossRef]
  33. Atkinson, S.R. Balance-the magic word. Am. J. Orthod. 1964, 50, 189–202. [Google Scholar] [CrossRef]
  34. Taha, D.; Cesar, P.F.; Sabet, A. Influence of different combinations of CAD-CAM crown and customized abutment materials on the force absorption capacity in implant supported restorations—In Vitro study. Dent. Mater. 2022, 38, e10–e18. [Google Scholar] [CrossRef] [PubMed]
  35. Elsayed, A.; Yazigi, C.; Kern, M.; Chaar, M.S. Mechanical behavior of nano-hybrid composite in comparison to lithium disilicate as posterior cement-retained implant-supported crowns restoring different abutments. Dent. Mater. 2021, 37, e435–e442. [Google Scholar] [CrossRef]
  36. Mascarenhas, F.; Yilmaz, B.; McGlumphy, E.; Clelland, N.; Seidt, J. Load to failure of different zirconia implant abutments with titanium components. J. Prosthet. Dent. 2017, 117, 749–754. [Google Scholar] [CrossRef] [PubMed]
  37. Guilherme, N.M.; Chung, K.H.; Flinn, B.D.; Zheng, C.; Raigrodski, A.J. Assessment of reliability of CAD/CAM tooth-colored implant custom abutments. J. Prosthet. Dent. 2016, 116, 206–213. [Google Scholar] [CrossRef]
  38. Moris, I.C.M.; Chen, Y.C.; Faria, A.C.L.; Ribeiro, R.F.; Fok, A.S.L.; Rodrigues, R.C.S. Fracture loads and failure modes of customized and non-customized zirconia abutments. Dent. Mater. 2018, 34, e197–e204. [Google Scholar] [CrossRef]
  39. Miyamoto, Y.; Kaysser, W.A.; Rabin, B.H.; Kawasaki, A.; Ford, R.G. Functionally Graded Materials; Design, Processing and Applications; Springer Science + Business Media: New York, NY, USA, 1999; pp. 2–9. [Google Scholar]
  40. Cui, C.; Sun, J. Optimizing the design of bio-inspired functionally graded material (FGM) layer in all-ceramic dental restorations. Dent. Mater. J. 2014, 33, 173–178. [Google Scholar] [CrossRef] [PubMed]
  41. Petrini, M.; Ferrante, M.; Su, B. Fabrication and characterization of biomimetic ceramic/polymer composite materials for dental restoration. Dent. Mater. 2013, 29, 375–381. [Google Scholar] [CrossRef]
  42. Chen, Y.C.; Fok, A. Stress distributions in human teeth modeled with a natural graded material distribution. Dent. Mater. 2014, 30, e337–e348. [Google Scholar] [CrossRef]
  43. He, L.H.; Yin, Z.H.; Van Vuuren, L.J.; Carter, E.A.; Liang, X.W. A natural functionally graded biocomposite coating-human enamel. Acta Biomater. 2013, 9, 6330–6337. [Google Scholar] [CrossRef] [PubMed]
  44. He, L.H.; Swain, M.V. Enamel—A “metallic-like” deformable biocomposite. J. Dent. 2007, 35, 431–437. [Google Scholar] [CrossRef] [PubMed]
  45. Arola, D. Fatigue testing of biomaterials and their interfaces. Dent. Mater. 2017, 33, 367–381. [Google Scholar] [CrossRef] [PubMed]
  46. Wang, Z.; Wang, K.; Xu, W.; Gong, X.; Zhang, F. Mapping the mechanical gradient of human dentin-enamel-junction at different intratooth locations. Dent. Mater. 2018, 34, 376–388. [Google Scholar] [CrossRef]
  47. Joda, T.; Huber, S.; Bürki, A.; Zysset, P.; Brägger, U. Influence of Abutment Design on Stiffness, Strength, and Failure of Implant-Supported Monolithic Resin Nano Ceramic (RNC) Crowns. Clin. Implant. Dent. Relat. Res. 2015, 17, 1200–1207. [Google Scholar] [CrossRef]
  48. ISO 14801-2016; Dentistry—Implants—Dynamic Loading Test for Endosseous Dental Implants. International Organization for Standardization: Geneva, Switzerland, 2016.
  49. ASTM-E-384-17; Standard Test Method for Microindentation Hardness of Materials. ASTM International: West Conshohocken, PA, USA, 2017.
  50. Anderson, T.L. Fracture Mechanics: Fundamentals and Applications; Taylor & Francis: Abingdon, UK, 2005; ISBN 978-0-8493-1656-2. [Google Scholar]
  51. Marshall, D.B.; Lawn, B.R.; Evans, A.G. Elastic/plastic indentation damage in ceramics: The lateral crack system. J. Am. Ceram. 1980, 574. [Google Scholar] [CrossRef]
  52. Laugier, M.T. Load bearing capacity of TiN coated WC–Co cemented carbides. J. Mater. Sci. Lett. 1983, 2, 419–421. [Google Scholar] [CrossRef]
  53. Dukino, R.D.; Swain, M.V. Comparative measurement of indentation fracture toughness with Berkovich and Vickers indenters. J. Am. Ceram. Soc. 1992, 75, 3299–3304. [Google Scholar] [CrossRef]
  54. Casellas, D.; Caro, J.; Molas, S.; Prado, J.M.; Valls, I. Fracture toughness of carbides in tool steels evaluated by nanoindentation. Acta Mater. 2007, 55, 4277–4286. [Google Scholar] [CrossRef]
  55. Niihara, K.; Morena, R.; Hasselman, D.P.H. Evaluation of KIc of brittle solids by the indentation method with low crack-to-indent ratios. J. Mater. Sci. 1982, 1, 13–16. [Google Scholar]
  56. Mautsch, C.; Wolfard, S.; Mautsch, W.; Rittich, A. Long-term outcome of the IMZ implant system: A retrospective clinical study with a follow-up between 23 and 34 years. Int. J. Implant. Dent. 2022, 8, 54. [Google Scholar] [CrossRef] [PubMed]
  57. Chena, Y.Y.; Chena, W.P.; Chang, H.H.; Huang, S.H.; Lin, C.P. A novel dental implant abutment with micro-motion capability—Development and biomechanical evaluations. Dent. Mater. 2014, 30, 131–137. [Google Scholar] [CrossRef] [PubMed]
  58. Schepke, U.; Meijer, H.J.; Vermeulen, K.M.; Raghoebar, G.M.; Cune, M.S. Clinical Bonding of Resin Nano Ceramic Restorations to Zirconia Abutments: A Case Series within a Randomized Clinical Trial. Clin. Implant. Dent. Relat. Res. 2016, 18, 984–992. [Google Scholar] [CrossRef] [PubMed]
  59. Krejci, I.; Daher, R. Stress distribution difference between Lava Ultimate full crowns and IPS e. max CAD full crowns on a natural tooth and on tooth-shaped implant abutments. Odontology 2017, 105, 254–256. [Google Scholar] [PubMed]
  60. Lohbauer, U.; Belli, R.; Cune, M.S.; Schepke, U. Fractography of clinically fractured, implant-supported dental computer- aided design and computer-aided manufacturing crowns. SAGE Open Med. Case Rep. 2017, 5, 2050313X17741015. [Google Scholar] [CrossRef]
  61. Reymus, M.; Roos, M.; Eichberger, M.; Edelhoff, D.; Hickel, R.; Stawarczyk, B. Bonding to new CAD/CAM resin composites: Influence of air abrasion and conditioning agents as pretreatment strategy. Clin. Oral Investig. 2019, 23, 529–538. [Google Scholar] [CrossRef]
  62. Emsermann, I.; Eggmann, F.; Krastl, G.; Weiger, R.; Amato, J. Influence of Pretreatment Methods on the Adhesion of Composite and Polymer Infiltrated Ceramic CAD-CAM Blocks. J. Adhes. Dent. 2019, 21, 433–443. [Google Scholar]
  63. Ferrario, V.F.; Sforza, C.; Serrao, G.; Dellavia, C.; Tartaglia, G.M. Single tooth bite forces in healthy young adults. J. Oral Rehabil. 2004, 31, 18–22. [Google Scholar] [CrossRef]
  64. Varga, S.; Spalj, S.; Lapter Varga, M.; Anic Milosevic, S.; Mestrovic, S.; Slaj, M. Maximum voluntary molar bite force in subjects with normal occlusion. Eur. J. Orthod. 2011, 33, 427–433. [Google Scholar] [CrossRef] [PubMed]
  65. Padma, S.; Umesh, S.; Asokan, S.; Srinivas, T. Bite Force Measurement Based on Fiber Bragg Grating Sensor. J. Biomed. Opt. 2017, 22, 107002. [Google Scholar] [CrossRef]
  66. Ramalho, I.S.; Bergamo, E.T.P.; Witek, L.; Coelho, P.G.; Lopes, A.C.O.; Bonfante, E.A. Implant-abutment fit influences the mechanical performance of single-crown prostheses. J. Mech. Behav. Biomed. Mater. 2020, 102, 103506. [Google Scholar] [CrossRef] [PubMed]
  67. Alonso-Pérez, R.; Bartolomé, J.F.; Ferreiroa, A.; Salido, M.P.; Pradíes, G. Original vs. non-original abutments for screw-retained single implant crowns: An in vitro evaluation of internal fit, mechanical behaviour and screw loosening. Clin. Oral Implants Res. 2018, 29, 1230–1238. [Google Scholar] [CrossRef] [PubMed]
  68. Schmitt, C.M.; Nogueira-Filho, G.; Tenenbaum, H.C.; Lai, J.Y.; Brito, C.; Doering, H.; Nonhoff, J. Performance of conical abutment (Morse Taper) connection implants: A systematic review. J. Biomed. Mater. Res. A 2014, 102, 552–574. [Google Scholar] [CrossRef] [PubMed]
  69. Südbeck, S.; Hoffmann, M.; Reymus, M.; Buser, R.; Edelhoff, D.; Stawarczyk, B. Bending moment of implants restored with CAD/CAM polymer-based restoration materials with or without a titanium base before and after artificial aging. Dent. Mater. 2022, 38, e245–e255. [Google Scholar] [CrossRef] [PubMed]
Figure 1. Experimental setup: (a) resin composite experimental block with prefabricated zirconia insert and (b) implant crown cemented over Ti-base and screwed on the implant analog.
Materials 17 03815 g001
Figure 2. Different study groups and X-rays of samples tested: monolithic zirconia (G1-MZ), monolithic composite (G3-MC), layered customized composite (G2-LCC) and layered prefabricated composite (G4 LPC).
Materials 17 03815 g002
Figure 3. Image of the dental implant system embedded in the resin ready for testing.
Materials 17 03815 g003
Figure 4. Schematic diagram of an embedded sample.
Materials 17 03815 g004
Figure 5. Picture of the polished cross-sections of G1, G2, G3 and G4 material.
Materials 17 03815 g005
Figure 6. Comparative graphs of Fmax (a) and displacement to break (b).
Materials 17 03815 g006
Figure 7. Photographic images of the fracture modes under static uniaxial compression.
Materials 17 03815 g007
Figure 8. Comparative graph of S-N curves obtained for all groups of samples tested.
Materials 17 03815 g008
Figure 9. Photographic images of the different fracture modes identified: (a) T1, (b) T2, (c) T3, (d) T4, (e) T5, (f) T6 and (g) T7.
Materials 17 03815 g009
Figure 10. Fracture sections from sample group G2 (upper images) and G4 (lower images), respectively.
Materials 17 03815 g010
Figure 11. SEM images of unfractured samples of group G1 (upper images) and G3 (lower images).
Materials 17 03815 g011
Figure 12. SEM images of fractured G1 samples, detailing: (a) abutment deformation, (c) fracture section of the screw with multiple crack initiation points, (b) analogous deformation, (d) detailed view of fracture regions within the screw’s fracture section, (e) secondary cracking and fatigue striations. Red arrows denote the direction of fracture propagation and (f) micro-cavity “dimples”.
Materials 17 03815 g012
Figure 13. SEM images of fractured G3 samples. (a,b) Analogous and abutment deformation and screw’s fracture sections. (c) Multiple crack initiation points (blue arrows). (d) Detailed view of fracture regions within the screw’s fracture section. (e) Secondary cracking and fatigue striations Red arrows denote the direction of fracture propagation. (f) Micro-cavity “dimples”.
Materials 17 03815 g013
Figure 14. Images of indentations captured through optical microscopy. (Right) Low-magnification imprint obtained in a composite region of a dental abutment pillar. (Left) High-magnification imprint obtained in a zirconia region of a dental abutment pillar.
Materials 17 03815 g014
Table 1. General table of the material properties for each study sample group.
MaterialsManufacturers CompositionFlexural Strength Fracture Toughness Modulus of Elasticity
Zirconia crown:
CEREC Zirconia meso L A2
LOT 2017484418
Dentsply Sirona®Yttria stabilized zirconia >900 MPa7.1 MPa1/2210 GPa
Composite crown:
BRILLIANT Crios Disc
A2 LT H18 LOT J52869
Coltene®Barium glass < 1.0 µm, amorphous silica SiO2 < 20 nm, cross linked methacrylic matrix and inorganic pigments198 MPa2.0 MPa m0.510.3 GPa
Customized meso structure:
inCoris ZI meso F2 L
LOT 3314000426
Dentsply Sirona®Dentsply Sirona® >900 MPa5.8 MPa1/2210 GPa
Zirconia insertColtene®Yttria stabilized zirconia
(3 mol% Y2O3)
500–1000 MPa5.8–10.5 MPa m0.5210 GPa
TiBase
CEREC/inLab AT EV 4,8 GH 1 “L”
LOT B200003054
Dentsply Sirona®Ti6Al4V, medical grade 5, ASTM 136n.an.a105–117 GPa
Implant Replica
EV 5.4
LOT 456009
Dentsply Sirona®Ti6Al4V Grade 5
ASTM F136
n.an.a105–117 GPa
Cement:
Solocem®
LOT J64901
Coltene®UDMA, TEGDMA, HEMA Methacrylate, zinc oxide, dental glass, MDP and 4-MET (A) monomers120 MPan.a7.2 GPa
Bonding:
OneCoat 7 Universal®
LOT J69945
Coltene®Methacrylates including 10-MDP photoinitiators, ethanol, watern.an.an.a
Table 2. Descriptive table of the surface treatments used for sample adhesion.
Surface Pre-Treatment GroupG1G2G3G4
Ti-baseSand-blasting 2.5 bar, Al2O3, particles, 50 µm
Monolithic zirconia crownSand-blasting, 1 bar, Al2O3 particles, 50 µm,
Composite crown Sand-blasting, 2 bar, Al2O3 particles, 50 µm,
Zirconia mesostructure Sand-blasting, 1 bar, Al2O3 particles, 50 µm,
Zirconia insertSand-blasting, 1 bar, Al2O3 particles, 50 µm,
Primer/CementOneCoat 7 universal and Solocem by Coltene®
Table 3. General table of maximum compressive force and elongation at break values determined by static compression.
Properties/Group of Samples G1 G1 G3 G4
Fmax, N11706.101699.501720.101572.20
21578.601397.701717.101701.40
31737.101439.701818.101487.40
41565.001696.501523.001549.60
51546.101317.601577.601457.10
X ¯ 1626.581510.201671.181553.54
D. Std88.19176.96119.1794.74
Elongation at break, mm11.250.951.320.67
21.290.601.230.88
31.171.061.281.16
41.261.401.501.07
51.310.941.350.80
X ¯ 1.260.991.340.92
D. Std0.050.290.100.20
Table 4. Comparative table of fatigue limit values (FL) obtained for all groups of samples tested.
Property/Group of Samples G1 G2 G3 G4
FL, N813755668777
Table 5. Maximum and minimum loads supported by each group sample illustrating up to 8 distinct fracture modes.
Group of Samples% FmaxFmax (N)Fmin (N)N° Cycles to BreakFailure Mode
G180130113016,314T2
80130113030,475T4
701139114105,522T6
70113911475,315T5
6097698470,741T7
6097698805,596T8
50813812,000,000Run out
G280120812116,028T5
80120812116,930T5
701057106109,106T5
701057106148,110T6
60906911,631,627T5
6090691273,531T6
50755762,000,000Run out
G38013371343797T5
8013371349108T6
60100310043,309T5
601003100140,250T6
50836841,197,943T5
50836841,864,478T6
40668672,000,000Run out
G48012431241724T1
8012431241396T5
7010871092063T3
7010871094518T2
6093293265,460T1
6093293328,837T4
50777782,000,000Run out
Where: T1: (Partial fracture of the crown), T2: (Partial fracture of the crown and fracture of screw, with deformation of both implant and abutment), T3: (Total fracture of the crown, without deformation of either the implant or the abutment), T4: (Total fracture of the crown, with deformation of both implant and abutment), T5: (Fracture of the screw, with deformation of both implant and abutment), T6: (Fracture of the screw, with deformation of the abutment and partial fracture of the implant), T7: (Fracture of the screw, with deformation of the abutment and total fracture of the implant).
Table 6. Summary of HV5 hardness and KIC fracture toughness characterization.
Sample GroupsRegionHV5 (GPa)KIC (MPa·m1/2)
G1Zirconia13.7 ± 0.35.0 ± 0.3
G2Zirconia (internal region)13.6 ± 0.24.6 ± 0.4
Composite (external region)0.7 ± 0.1-
G3Composite0.7 ± 0.1-
G4Zirconia (internal region)13.8 ± 0.34.6 ± 0.4
Composite (external region)0.7 ± 0.1-
Disclaimer/Publisher’s Note: The statements, opinions and data contained in all publications are solely those of the individual author(s) and contributor(s) and not of MDPI and/or the editor(s). MDPI and/or the editor(s) disclaim responsibility for any injury to people or property resulting from any ideas, methods, instructions or products referred to in the content.