
Concrete Aggregate-Gradation Effect and Strength-Criterion Modification for Fully Graded Hydraulic Concrete
Abstract
:1. Introduction
2. Experimental Triaxial Compressive Behaviors for Scaled Hydraulic Concrete
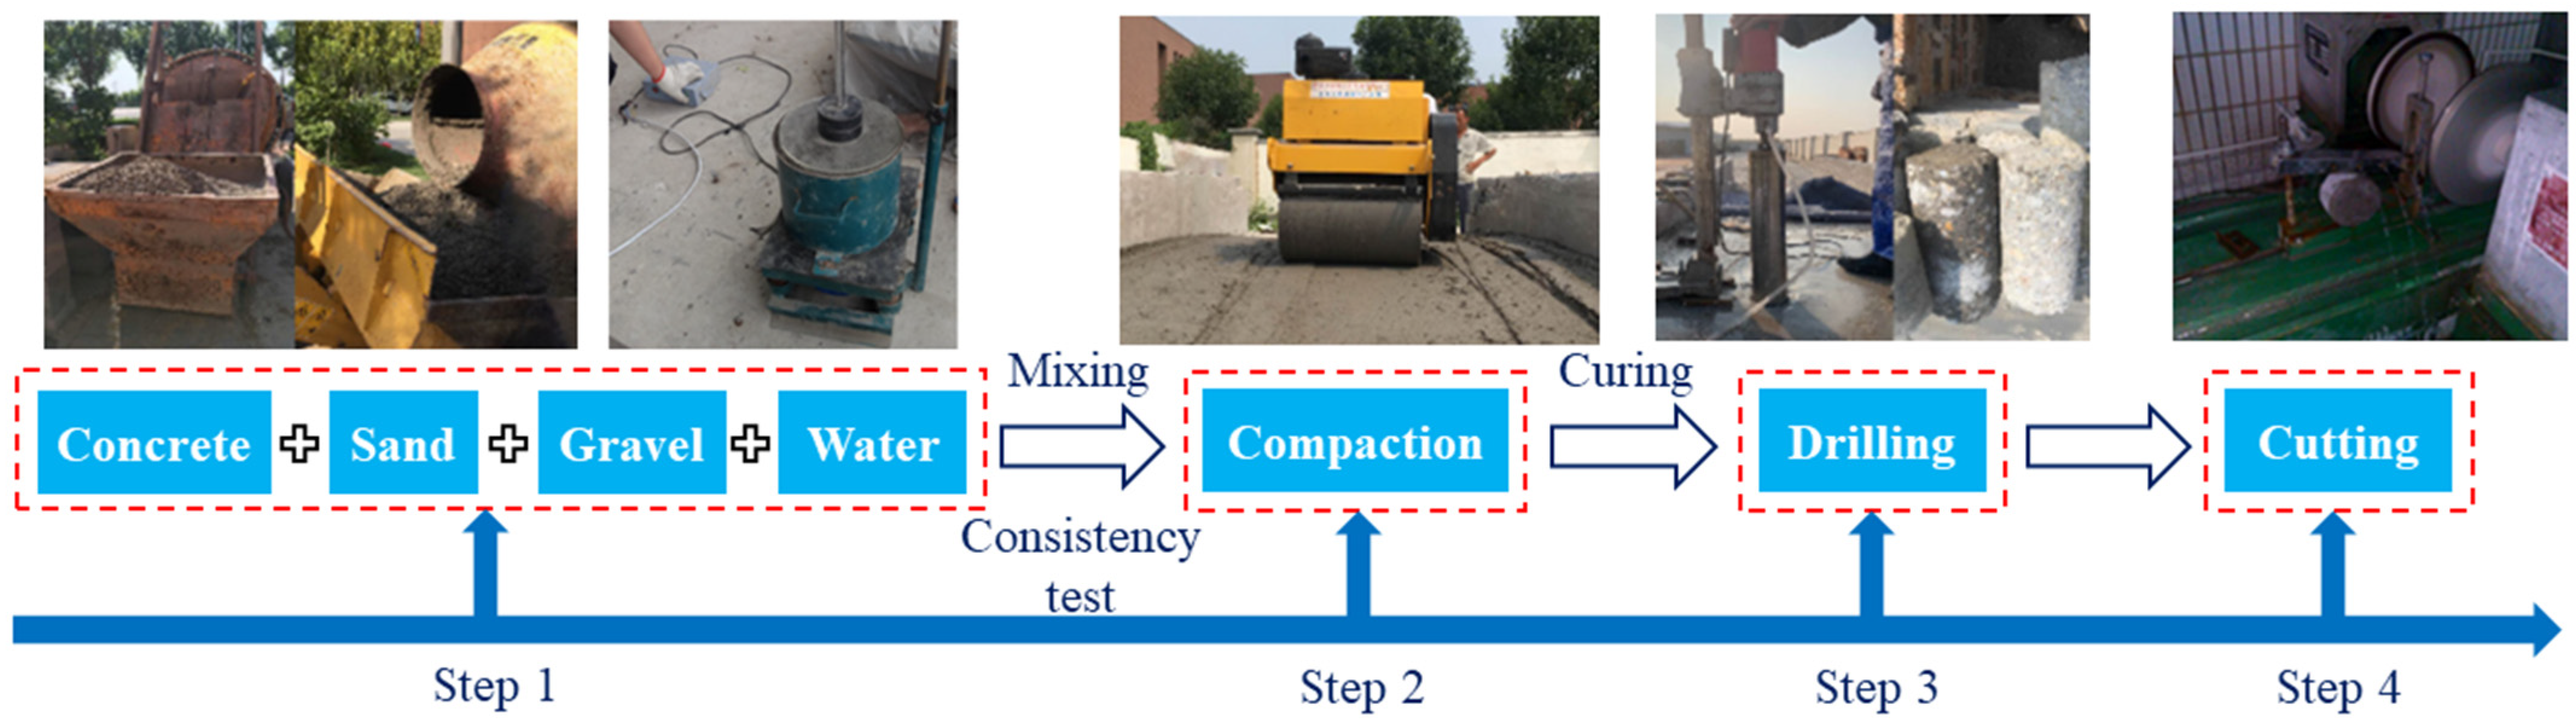
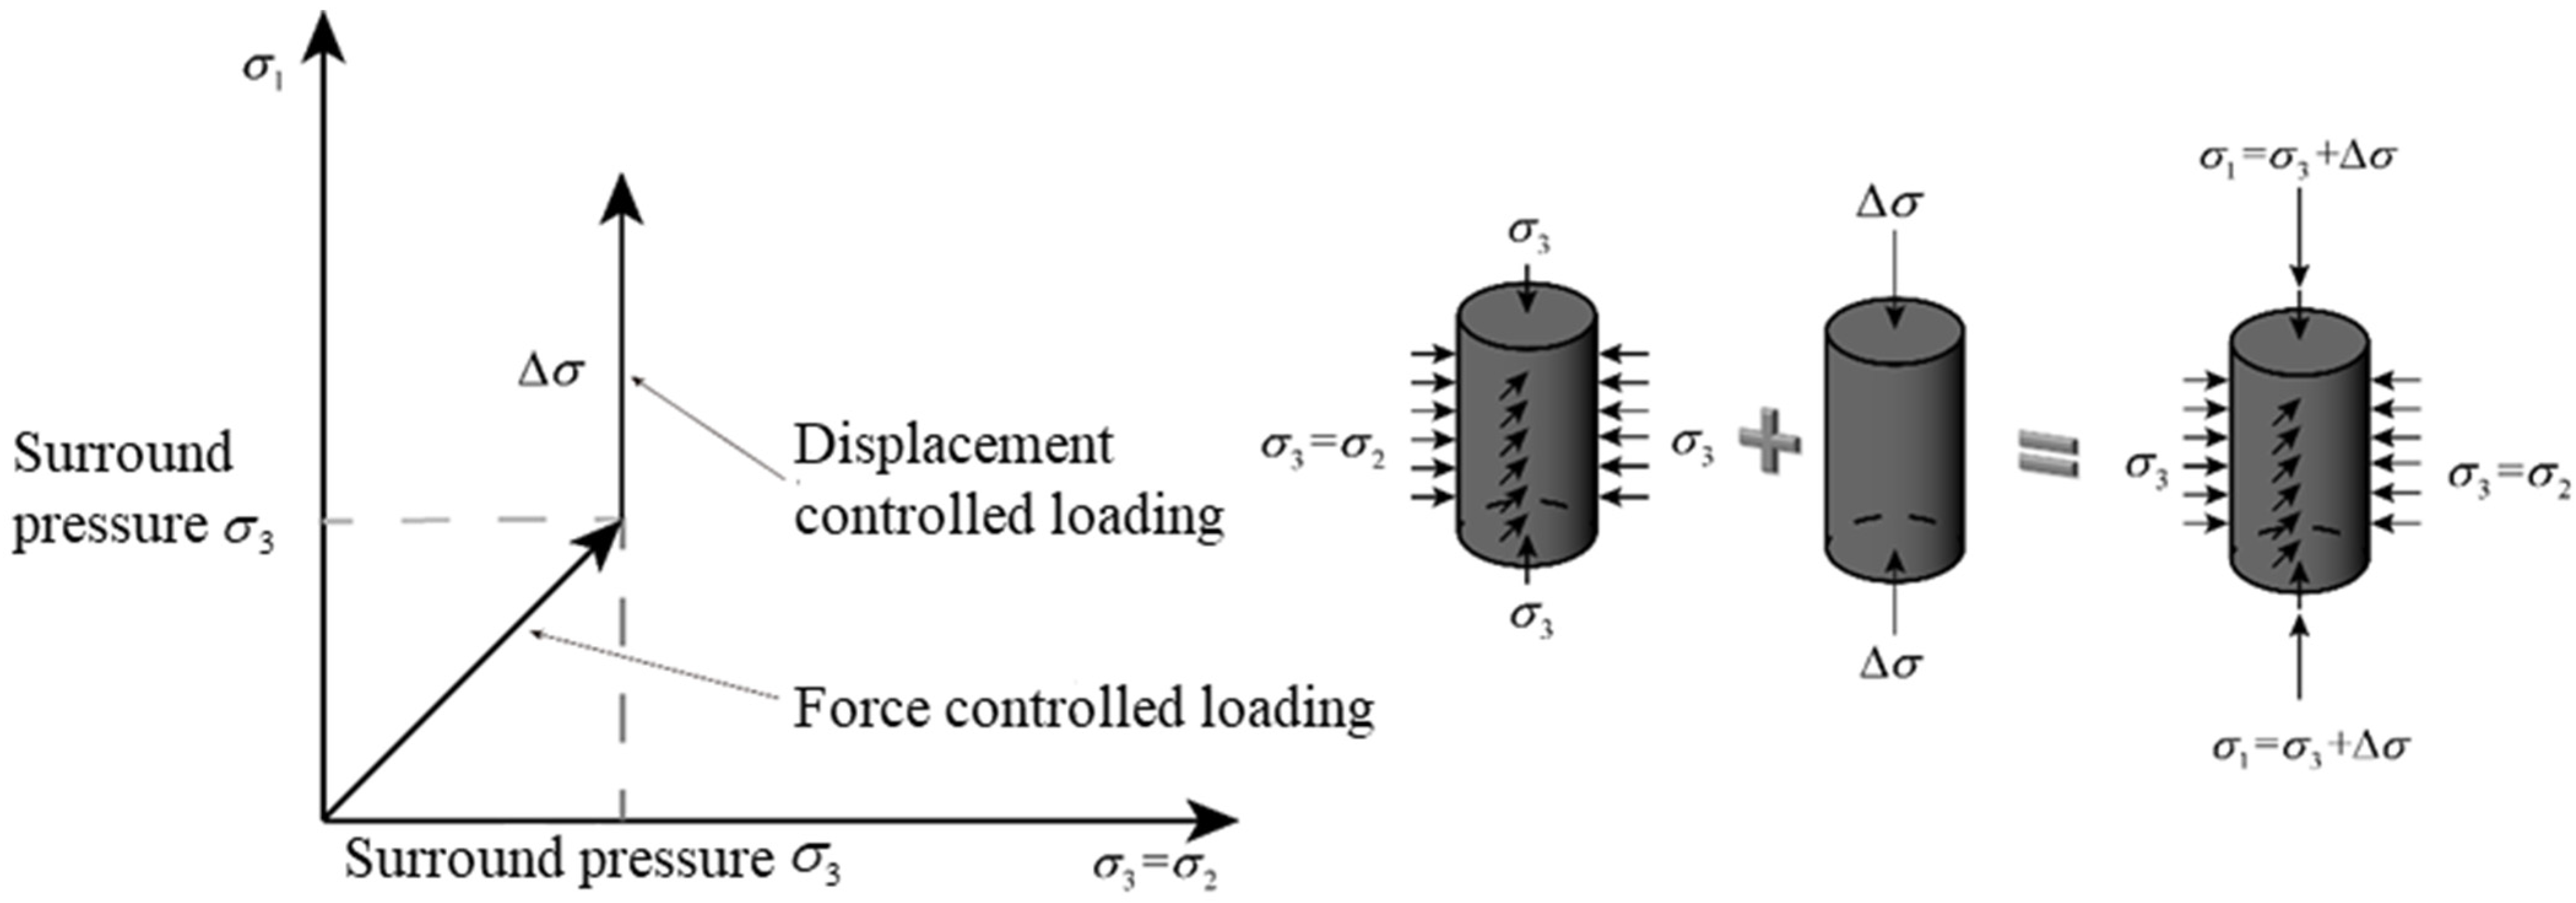
2.1. Test
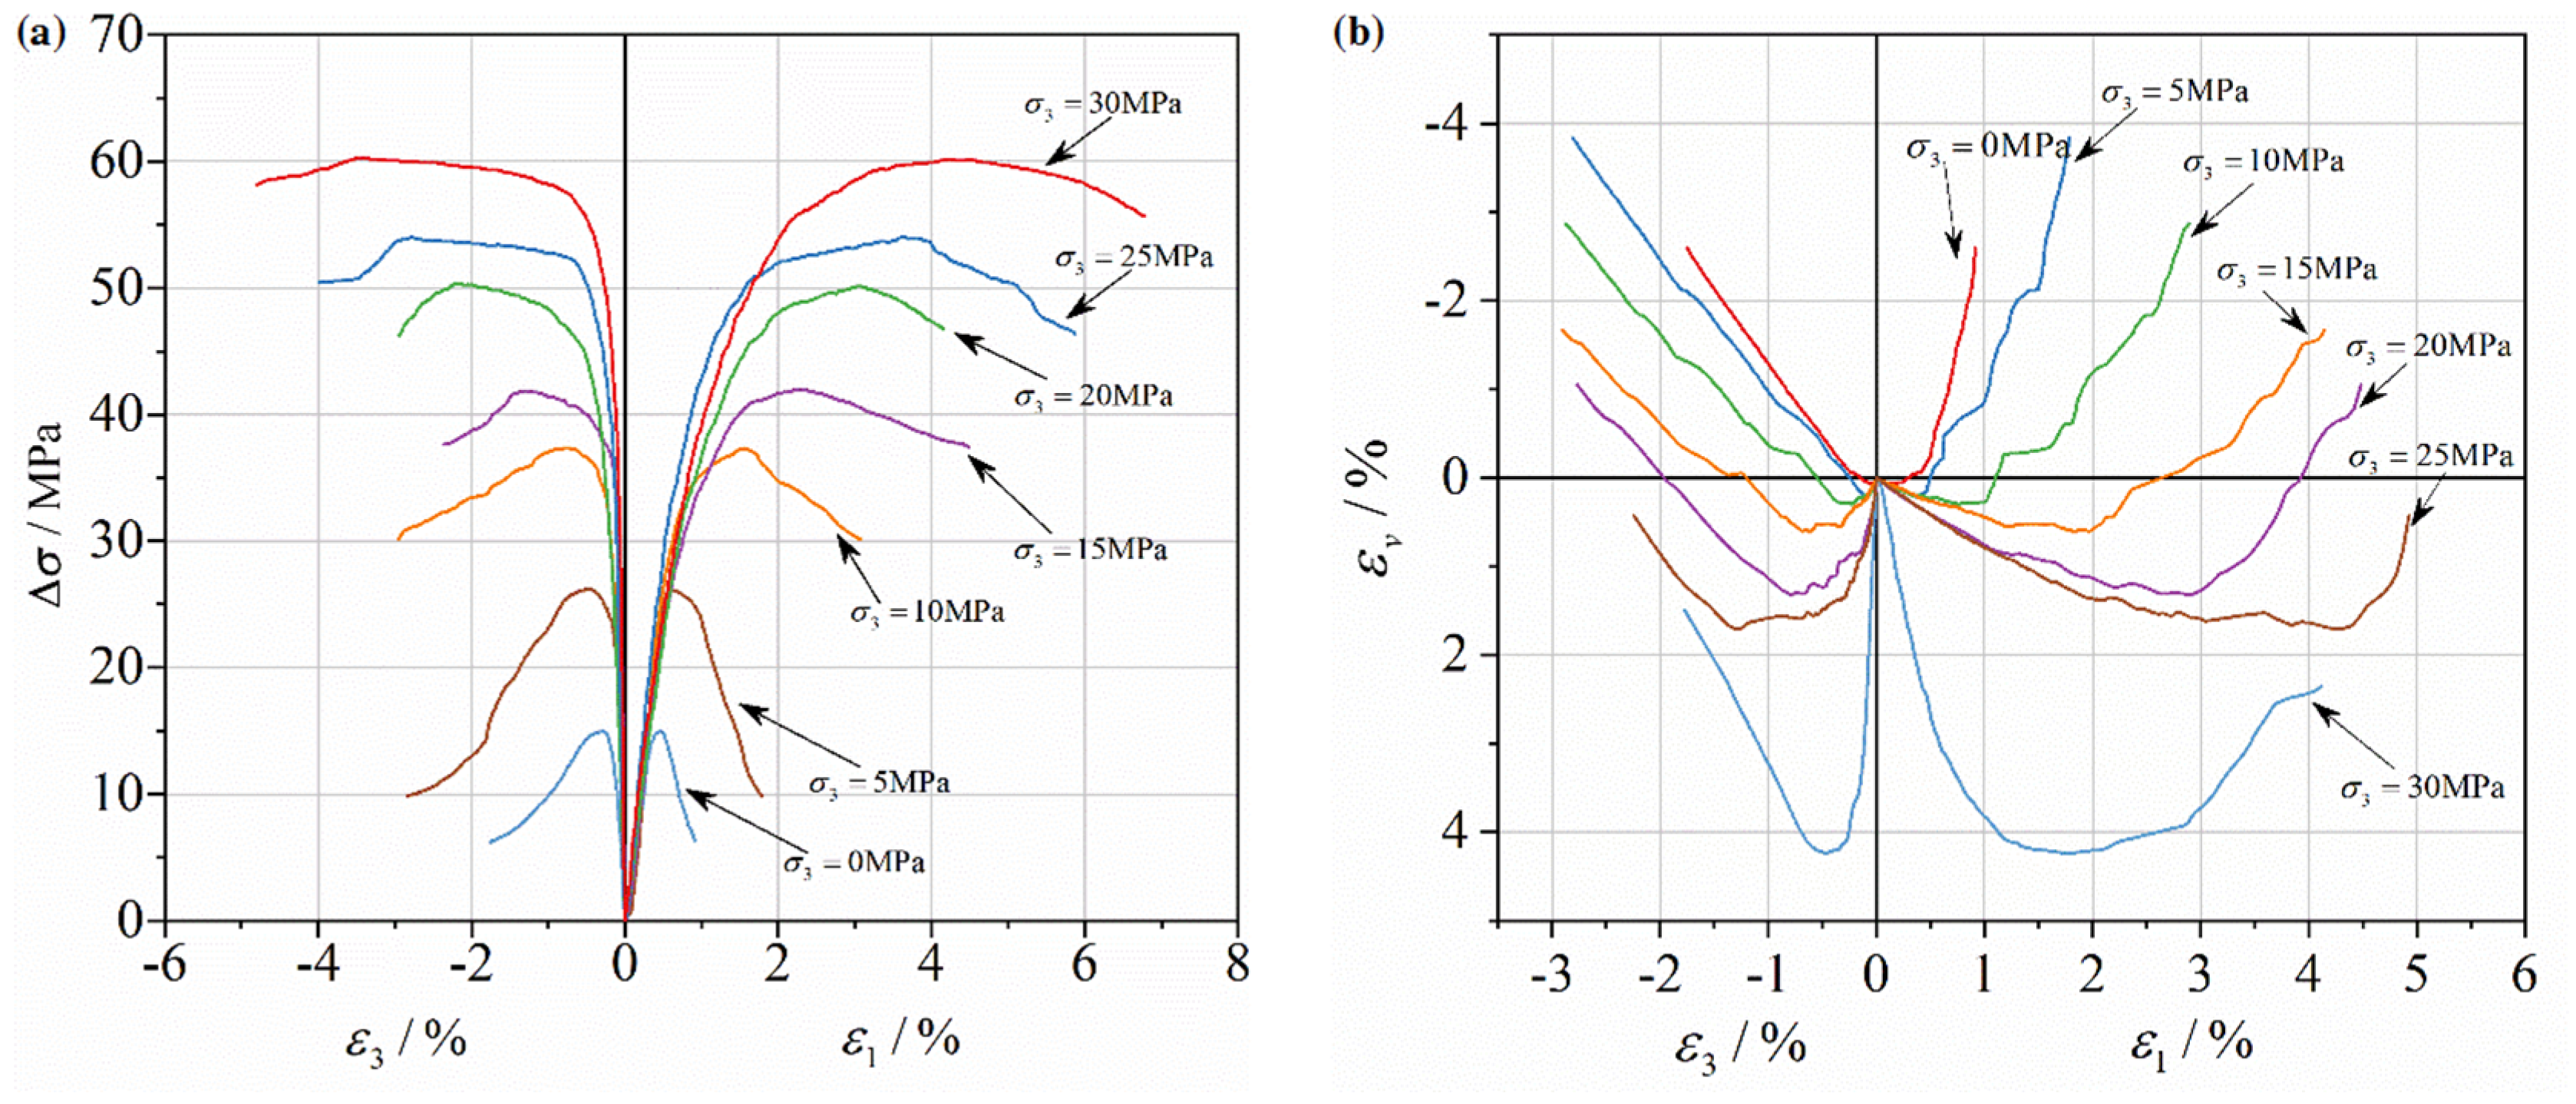
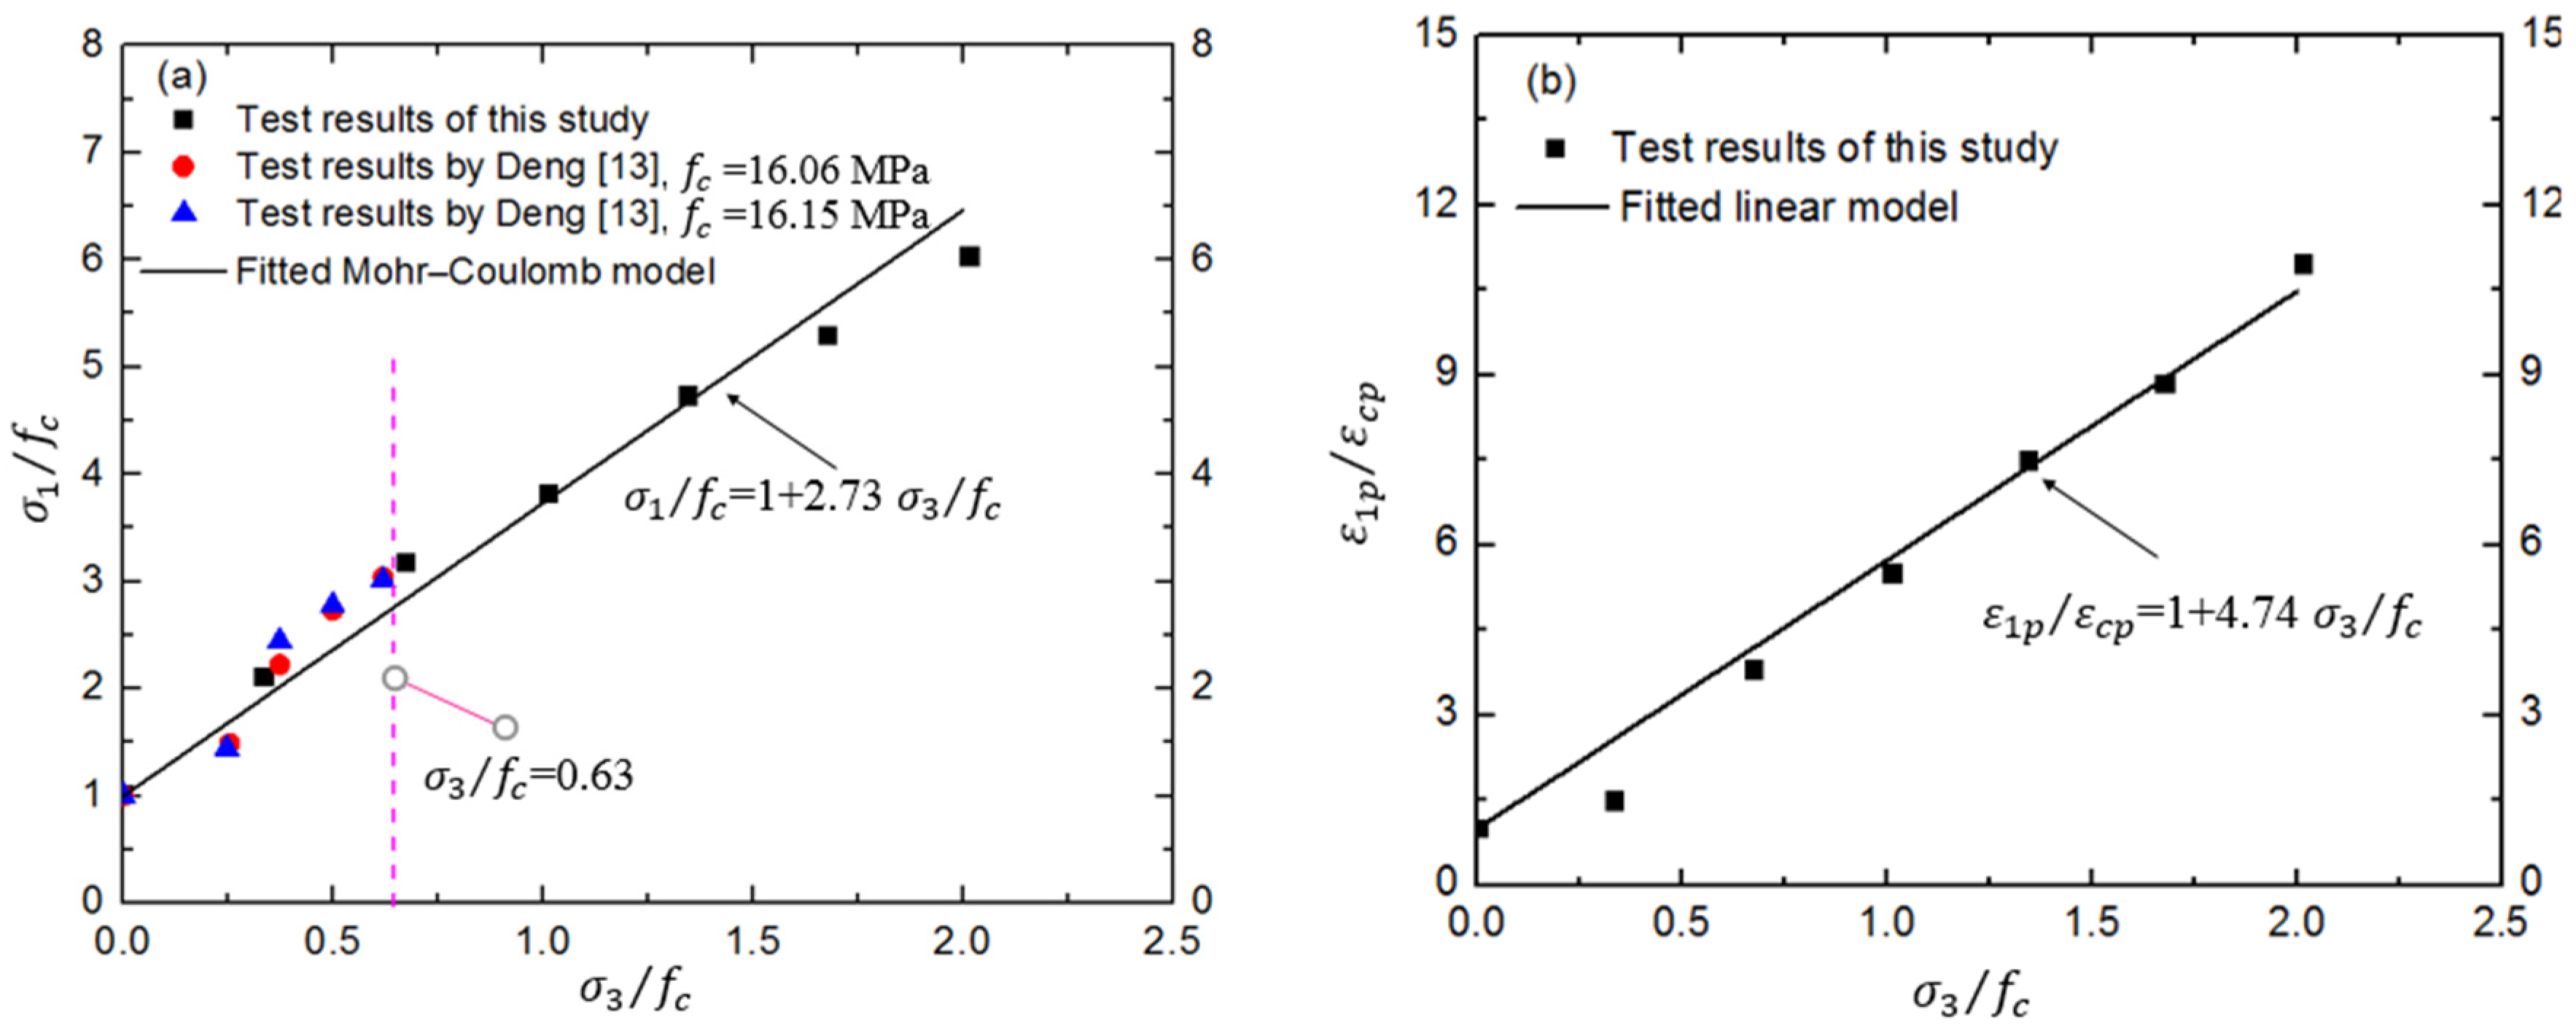
2.2. Test Results
3. Numerical Investigation of Triaxial Compressive Behaviors for Hydraulic Concrete
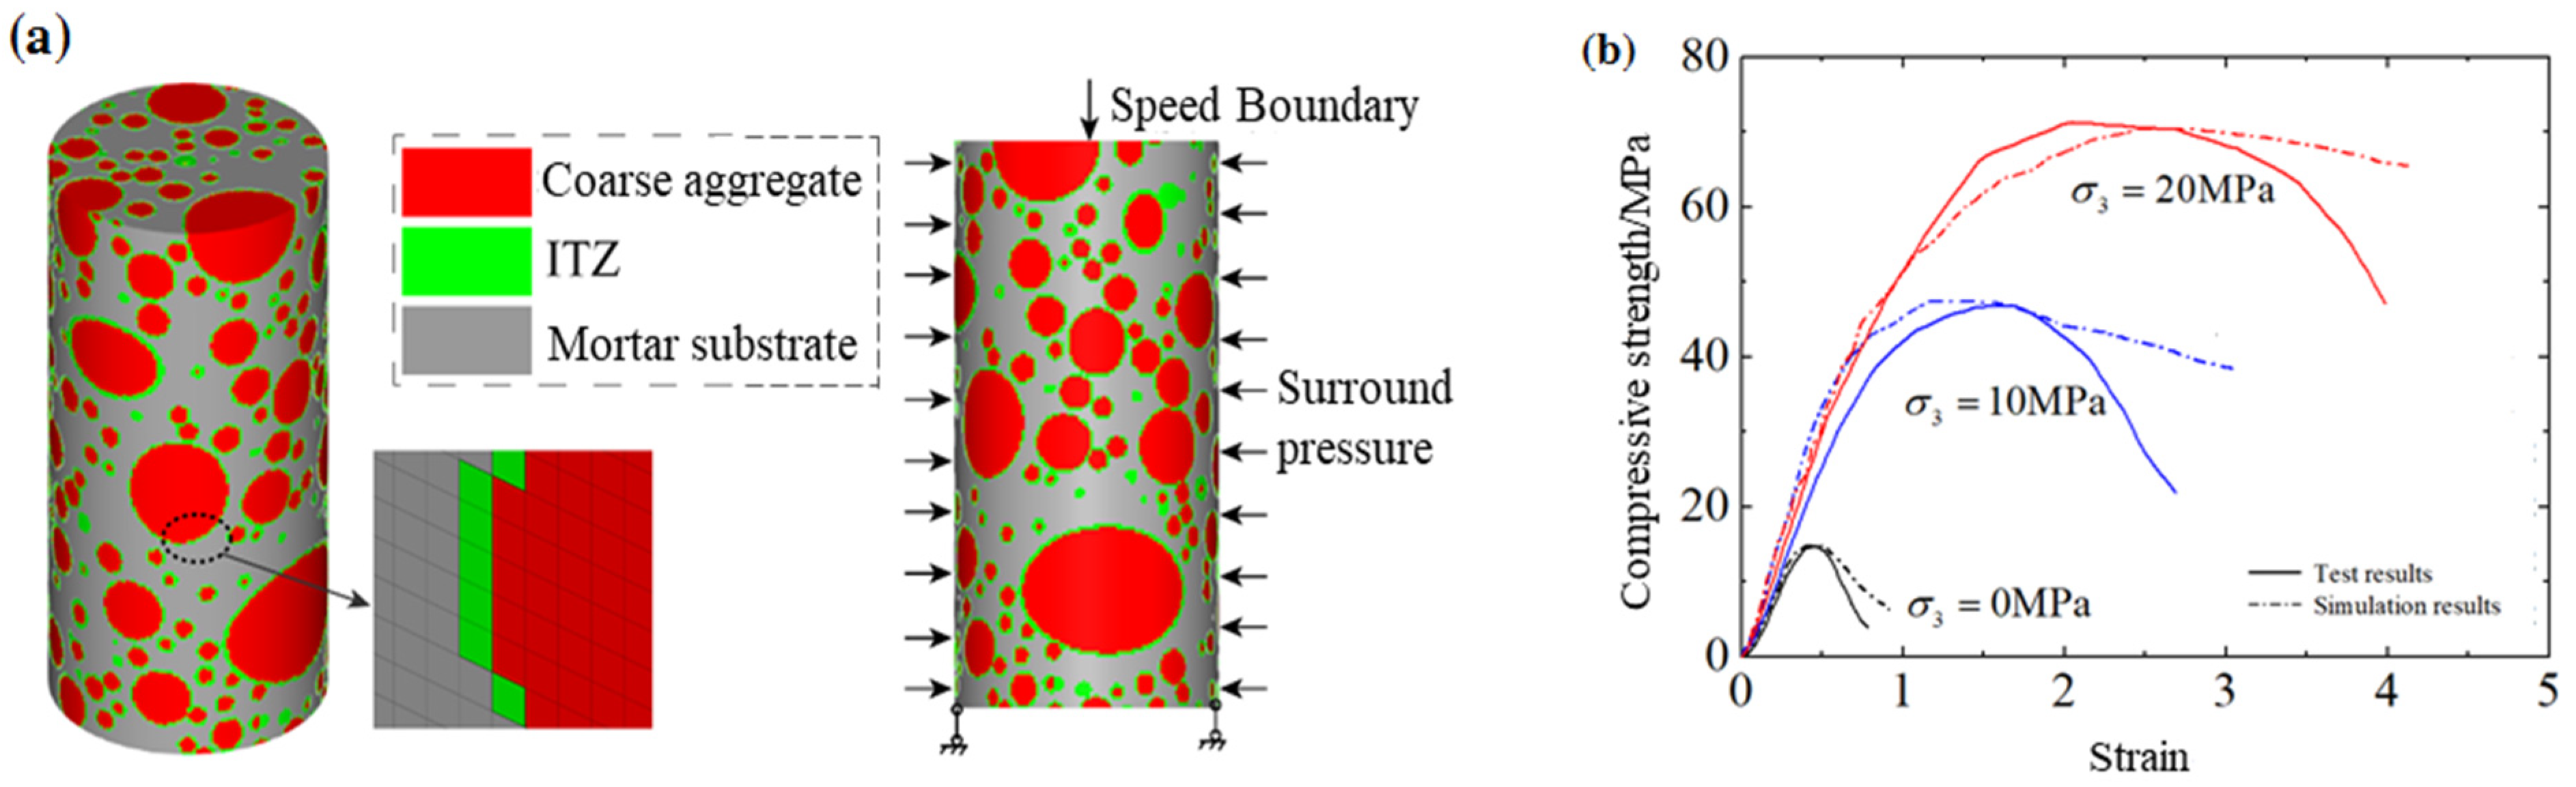
3.1. Establishing and Verification of Mesoscopic Numerical Model
3.2. Triaxial Compressive Behaviors of Different Grades of Hydraulic Concrete
4. Discussion of the Strength Criterion of Fully Graded Concrete
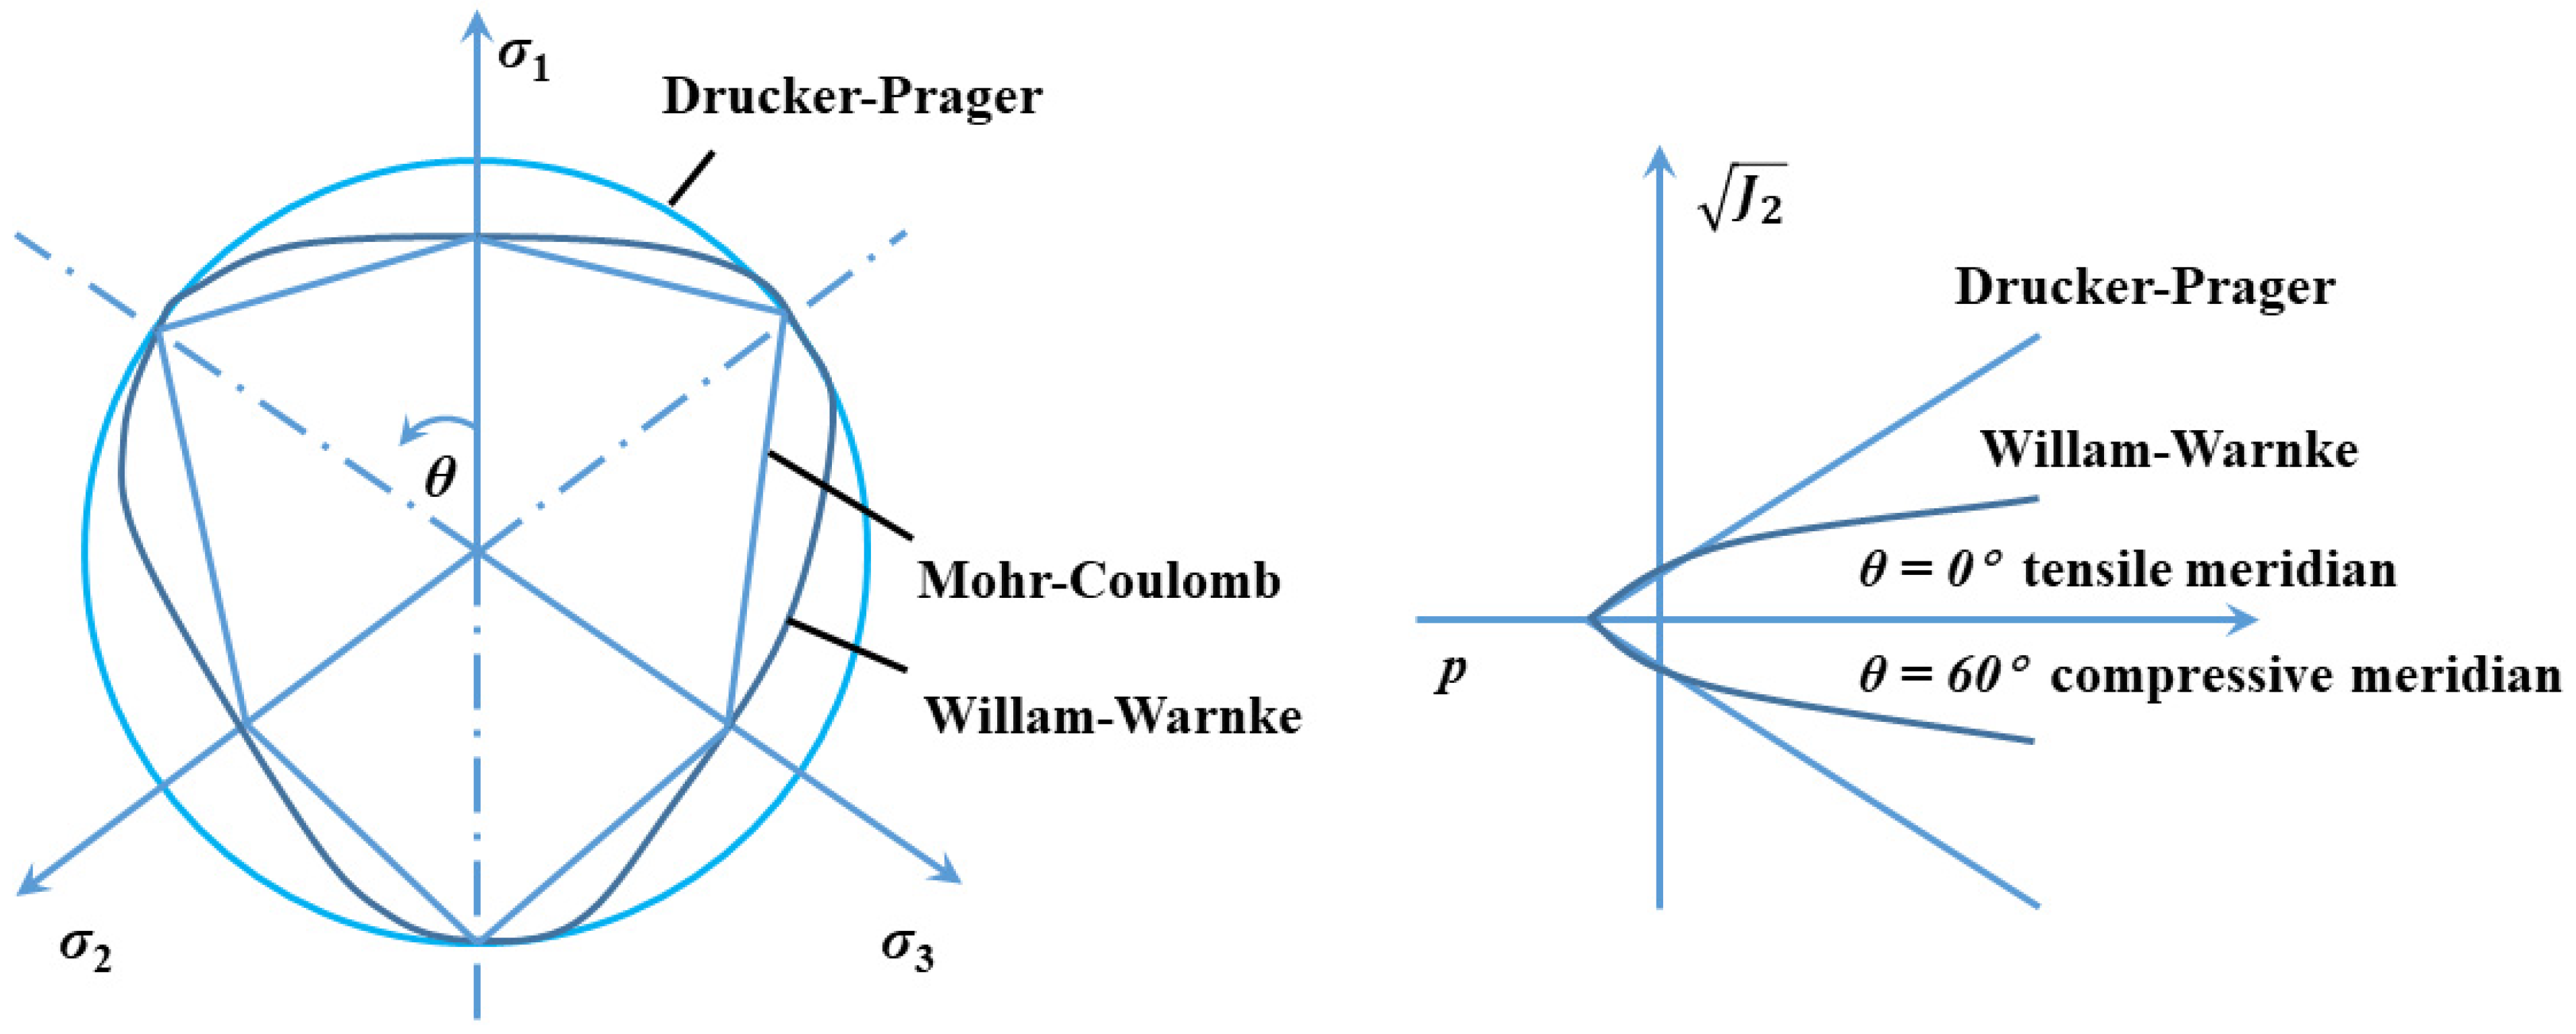
4.1. Background of Concrete Strength Criterion
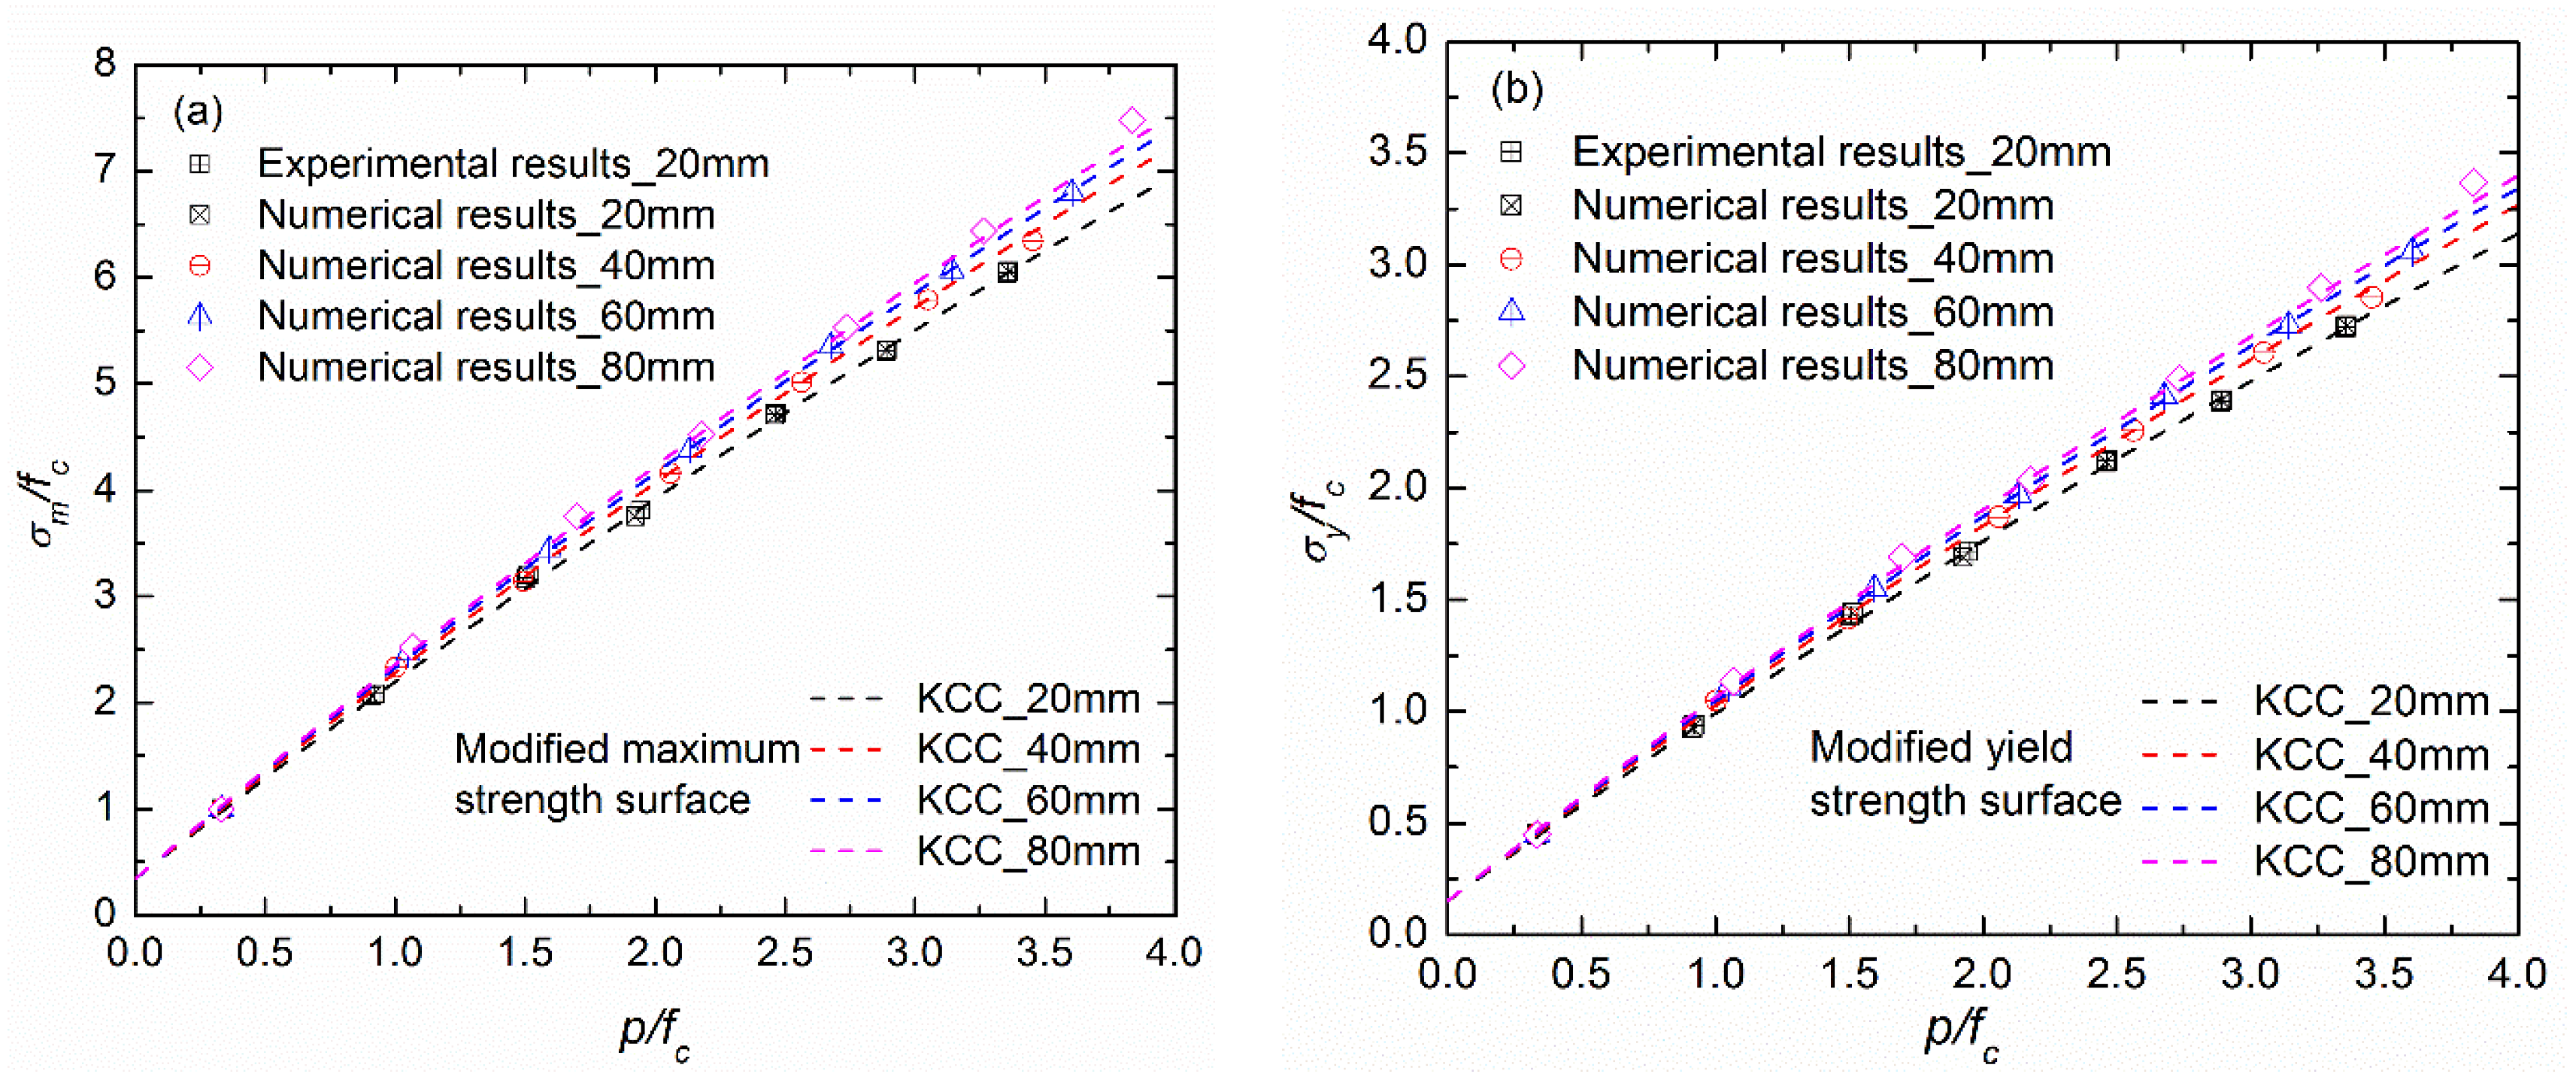
4.2. Strength-Criterion Modification for the KCC Model
4.3. Modification of Strength Criterion for the HJC Model
4.4. Modification of thenStrength Criterion for RHT Model
5. Conclusions
- (1)
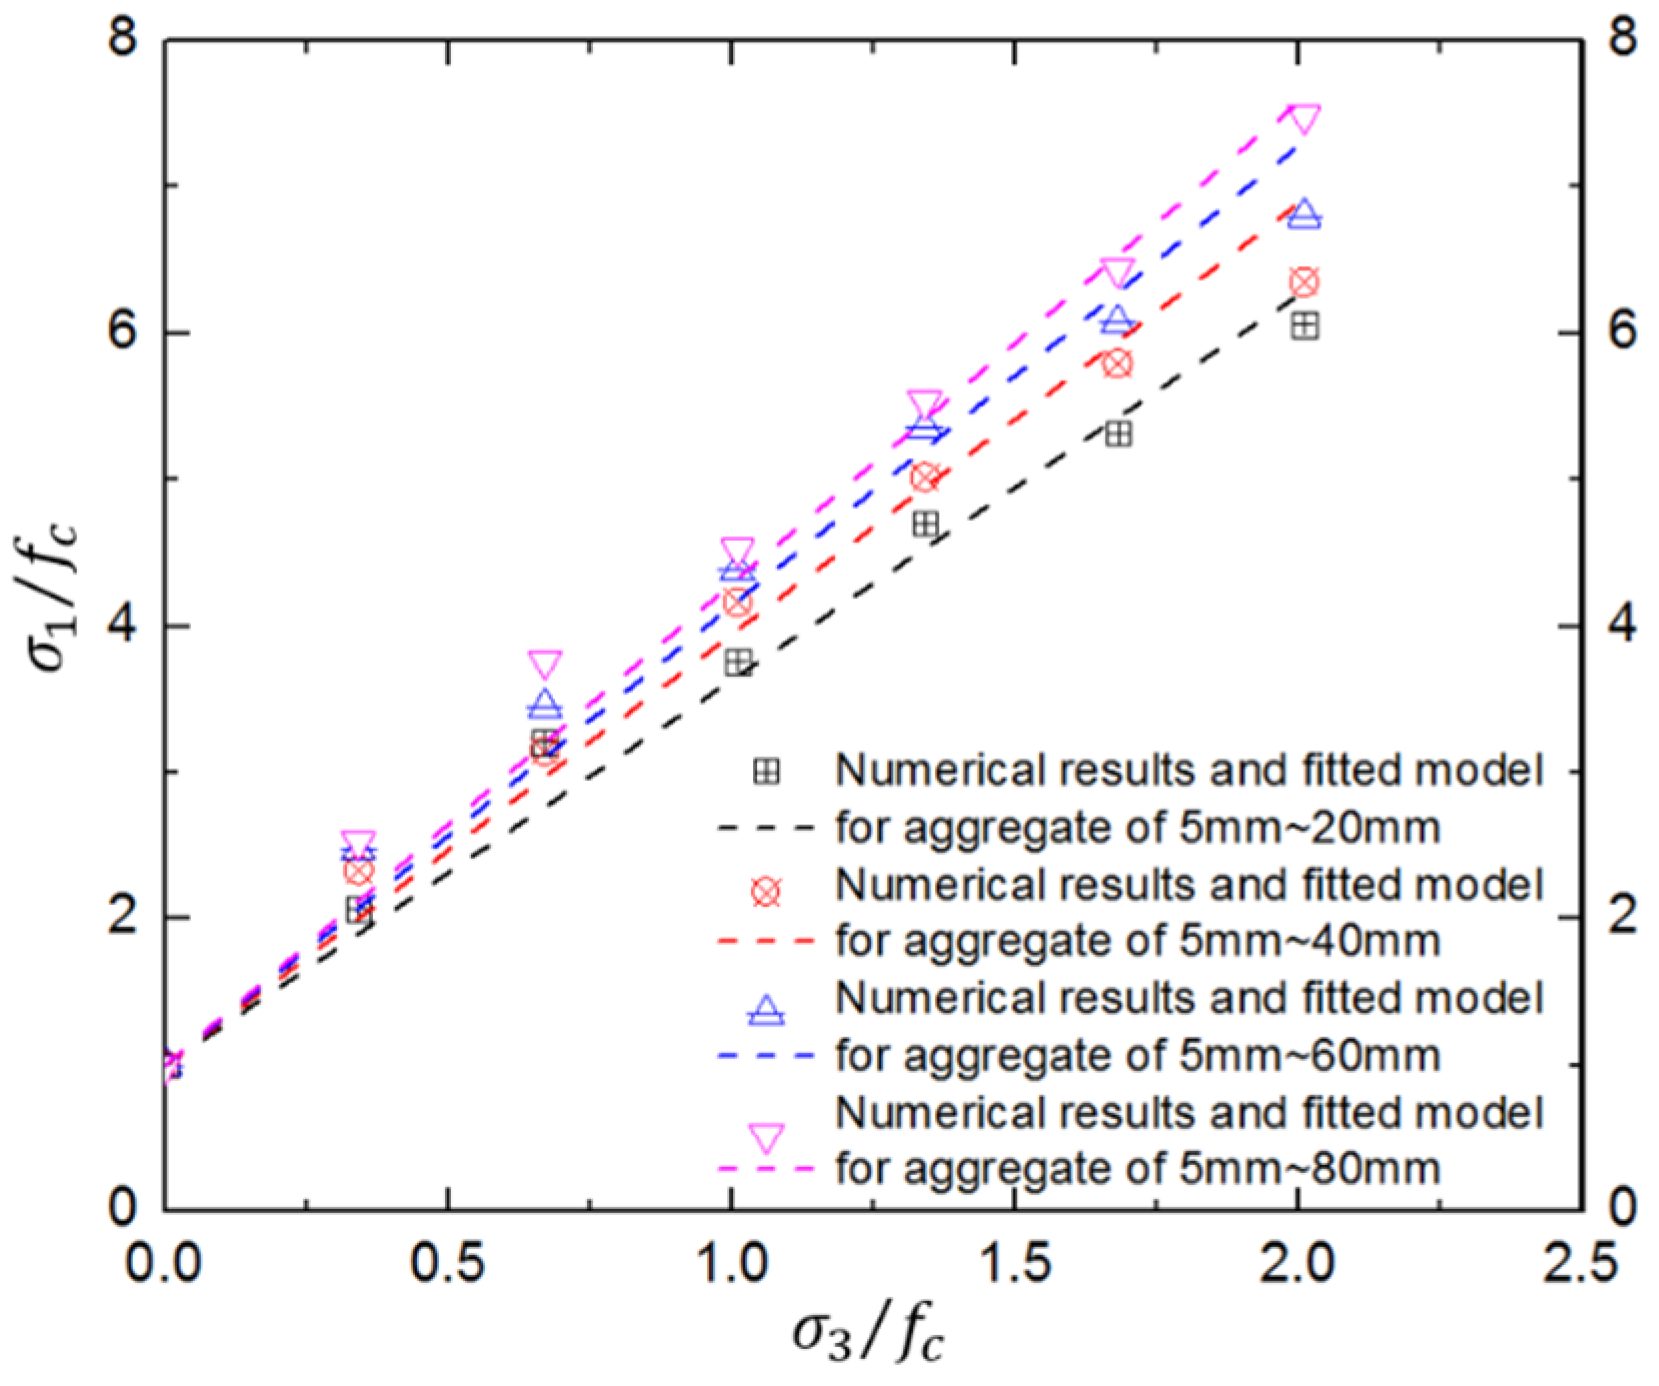
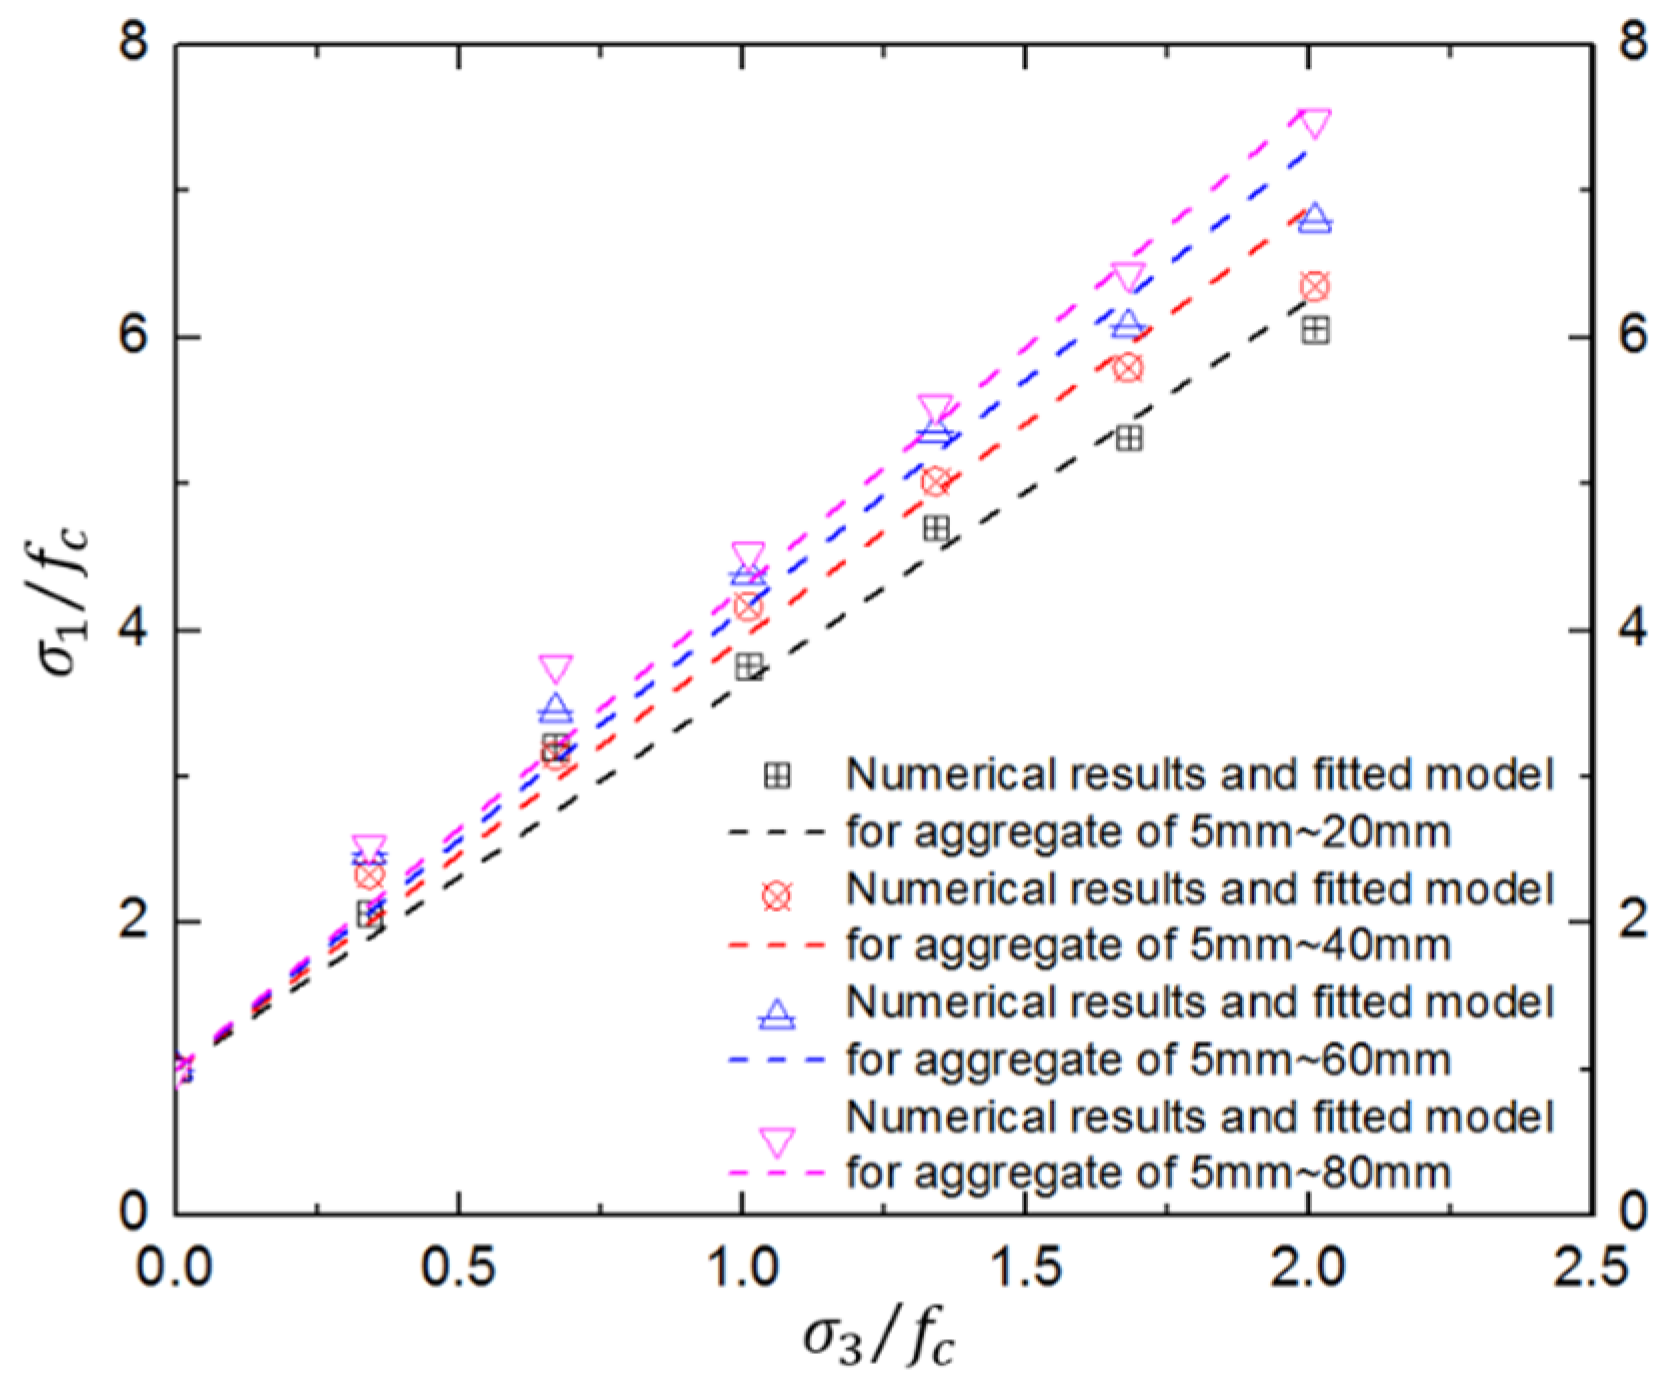
- The available testing data and three-dimensional mesoscopic numerical results indicate a significant aggregate-gradation effect, where both the normalized axial compressive strength and the corresponding axial strain increase with increasing confinement. Moreover, at low confining pressures, the influence of aggregate gradation on concrete compressive strength is relatively limited. Concrete strength will increase with increasing aggregate size, and this aggregate-gradation effect is particularly significant under high confining pressures.
- (2)
- The mechanism of the aggregate-gradation effect may be that smaller coarse aggregates in concrete lead to more ITZs, resulting in strength attenuation, which is amplified by the confinement effect. For example, when the maximum aggregate size increases from 20 mm to 80 mm, the increase of normalized peak strength reaches 23.49% at a confinement ratio of 2.01. Thus, the aggregate-gradation effect of fully graded concrete is especially significant at high confinement levels, especially when the concrete is subjected to high confinements such as extreme blast and impact loads.
- (3)
- To emphasize the aggregate-gradation effect in the extreme-blast and impact conditions, the strength criteria in concrete dynamic constitutive models are further discussed. In this study, a modified strength criterion is derived by introducing the maximum aggregate factor to better represent fully graded concrete material, and the corresponding model parameters are fitted based on the available testing data and three-dimensional mesoscopic numerical results.
Author Contributions
Funding
Institutional Review Board Statement
Informed Consent Statement
Data Availability Statement
Conflicts of Interest
References
- Rao, M.; Yang, H.; Lin, Y.; Li, J.; Shi, Y. Influence of maximum aggregate sizes on the performance of RCC. Constr. Build. Mater. 2016, 115, 42–47. [Google Scholar] [CrossRef]
- He, Z.; Deng, H.; Fan, F.; Tan, J. Microstructure of four-graded roller compacted concrete. Constr. Build. Mater. 2018, 187, 25–37. [Google Scholar] [CrossRef]
- Lin, Y.Q.; Shi, Y.; Guo, D.; Li, J.Z.; Yang, H.Q. Study on Site Construction Technology of Four-Graded RCC. Adv. Mater. Res. 2011, 250–253, 2927–2930. [Google Scholar] [CrossRef]
- Hao, Y.; Hao, H.; Jiang, G.P.; Zhou, Y. Experimental confirmation of some factors influencing dynamic concrete compressive strengths in high-speed impact tests. Cem. Concr. Res. 2013, 52, 63–70. [Google Scholar] [CrossRef]
- Hao, Y.; Hao, H. Numerical Evaluation of the Influence of Aggregates on Concrete Compressive Strength at High Strain Rate. Int. J. Prot. Struct. 2011, 2, 177–206. [Google Scholar] [CrossRef]
- Wang, X.-H.; Zhang, S.-R.; Wang, C.; Liu, F.-C.; Song, R.; Wei, P.-Y. Initial damage effect on dynamic compressive behaviors of roller compacted concrete (RCC) under impact loadings. Constr. Build. Mater. 2018, 186, 388–399. [Google Scholar] [CrossRef]
- Wang, X.-H.; Zhang, S.-R.; Wang, C.; Song, R.; Shang, C.; Cao, K.-L. Fragmentation-based dynamic size effect of layered roller compacted concrete (RCC) under impact loadings. Constr. Build. Mater. 2018, 192, 58–69. [Google Scholar] [CrossRef]
- Zhang, S.-R.; Wang, X.-H.; Wang, C.; Song, R.; Huo, H.-Y. Compressive behavior and constitutive model for roller compacted concrete under impact loading: Considering vertical stratification. Constr. Build. Mater. 2017, 151, 428–440. [Google Scholar] [CrossRef]
- Zhang, S.; Wang, X.; Wang, C. Dynamic Mechanical Behaviors and Constitutive Model of Roller Compacted Concrete; Springer: Beijing, China, 2023. [Google Scholar]
- Jiang, J.-F.; Xiao, P.-C.; Li, B.-B. True-triaxial compressive behaviour of concrete under passive confinement. Constr. Build. Mater. 2017, 156, 584–598. [Google Scholar] [CrossRef]
- Chen, C.; Zhang, X.; Hao, H.; Cui, J. Discussion on the suitability of dynamic constitutive models for prediction of geopolymer concrete structural responses under blast and impact loading. Int. J. Impact Eng. 2022, 160, 104064. [Google Scholar] [CrossRef]
- Li, B.; Dai, S.; Zhan, Y.; Xu, J.; Guo, X.; Yang, Y.; Chen, Y. Strength criterion of recycled aggregate concrete under triaxial Compression: Model calibration. Constr. Build. Mater. 2022, 320, 126201. [Google Scholar] [CrossRef]
- Zhang, S.; Wei, P.; Wang, C.; Wang, G.; Lu, W.; Cao, K. Failure criteria calibration based on the triaxial compression behavior of roller compacted concrete (RCC). Mater. Struct. 2021, 54, 7. [Google Scholar] [CrossRef]
- Deng, R. Mechanical properties of roller compacted concrete. J. Southwest Jiaotong Univ. 2002, 1, 19–25. Available online: https://en.cnki.com.cn/Article_en/CJFDTotal-XNJT200201005.htm (accessed on 17 May 2024).
- Gimenes, M.; Rodrigues, E.A.; Bitencourt, L.A.G.; Manzoli, O.L. 2D mesoscale modeling of compressive fracture in concrete using a mesh fragmentation technique. Int. J. Solids Struct. 2023, 260–261, 112031. [Google Scholar] [CrossRef]
- Grassl, P. 3D lattice meso-scale modelling of the effect of lateral compression on tensile fracture processes in concrete. Int. J. Solids Struct. 2023, 262–263, 112086. [Google Scholar] [CrossRef]
- Li, H.; Huang, Y.; Yang, Z.; Yu, K.; Li, Q.M. 3D meso-scale fracture modelling of concrete with random aggregates using a phase-field regularized cohesive zone model. Int. J. Solids Struct. 2022, 256, 111960. [Google Scholar] [CrossRef]
- Tian, R. Study on the Static, Dynamic Mechanical Properties of (Fully-Graded) Concrete Based on Mesomechanics; Beijing University of Technology: Beijing, China, 2008; Available online: https://cdmd.cnki.com.cn/Article/CDMD-10005-2008088345.htm (accessed on 18 May 2024).
- Zhou, Y.; Jin, H.; Wang, B. Modeling and mechanical influence of meso-scale concrete considering actual aggregate shapes. Constr. Build. Mater. 2019, 228, 116785. [Google Scholar] [CrossRef]
- Fang, Q.; Zhang, J.; Huang, Y.; Zhang, Y. Investigation into three-dimensional mesoscale modelling of fully-graded concrete. Eng. Mech. 2013, 30, 14–21+30. Available online: https://www.cnki.com.cn/Article/CJFDTOTAL-GCLX201301004.htm (accessed on 21 May 2024).
- Jin, L.; Yang, W.; Yu, W.; Du, X. Influence of aggregate size on the dynamic tensile strength and size effect of concrete. J. Vib. Shock. 2022, 39, 24–34. Available online: http://jvs.sjtu.edu.cn/CN/abstract/abstract9439.shtml (accessed on 21 May 2024).
- Du, X.; Jin, L.; Ma, G. Numerical simulation of dynamic tensile-failure of concrete at meso-scale. Int. J. Impact Eng. 2014, 66, 5–17. [Google Scholar] [CrossRef]
- Maleki, M.; Rasoolan, I.; Khajehdezfuly, A.; Jivkov, A.P. On the effect of ITZ thickness in meso-scale models of concrete. Constr. Build. Mater. 2020, 258, 119639. [Google Scholar] [CrossRef]
- Malvar, L.J.; Crawford, J.E.; Wesevich, J.W.; Simons, D. A plasticity concrete material model for DYNA3D. Int. J. Impact Eng. 1997, 19, 847–873. [Google Scholar] [CrossRef]
- Kong, X.; Fang, Q.; Li, Q.M.; Wu, H.; Crawford, J.E. Modified K&C model for cratering and scabbing of concrete slabs under projectile impact. Int. J. Impact Eng. 2017, 108, 217–228. [Google Scholar] [CrossRef]
- Holmquist, T.J.; Johnson, G.R.; Cook, W.H. A Computational Constitutive Model for Concrete Subjected to Large Strains, High Strain Rates and High Pressures. In Proceedings of the 14th International Symposium on Ballistics, Québec City, QC, Canada, 26–29 September 1993; pp. 591–600. Available online: https://www.tib.eu/en/search/id/BLCP%3ACN008959584/A-Computational-Constitutive-Model-for-Concrete/ (accessed on 10 June 2024).
- Riedel, W.; Thoma, K.; Hiermaier, S. Penetration of Reinforced Concrete by BETA-B-500 Numerical Analysis Using a New Macroscopic Concrete Model for Hydrocodes. In Proceedings of the 9th ISIEMS, Berlin, Germany, 3–4 May 1999; pp. 315–322. Available online: https://www.scirp.org/(S(351jmbntvnsjt1aadkposzje))/reference/referencespapers.aspx?referenceid=2011435 (accessed on 13 June 2024).
- Tu, Z.; Lu, Y. Modifications of RHT material model for improved numerical simulation of dynamic response of concrete. Int. J. Impact Eng. 2010, 37, 1072–1082. [Google Scholar] [CrossRef]
- Feng, K.N.; Ruan, D.; Pan, Z.; Collins, F.; Bai, Y.; Wang, C.M.; Duan, W.H. Effect of strain rate on splitting tensile strength of geopolymer concrete. Mag. Concr. Res. 2014, 66, 825–835. [Google Scholar] [CrossRef]
- Borrvall, T.; Riedel, W. The RHT Concrete Model in LS-DYNA. 2011. Available online: https://www.researchgate.net/publication/263467071_The_RHT_concrete_model_in_LS-DYNA (accessed on 15 June 2024).


| Parameters | Unit | Coarse Aggregate | Mortar | ITZ |
|---|---|---|---|---|
| kg·m−3 | 2600 | 2000 | 1800 | |
| Shear modulus G | GPa | 18.50 | 10.63 | 8.65 |
| 0.20 | 0.167 | 0.167 | ||
| MPa | 5.20 | 2.10 | 1.80 | |
| MPa | 50 | 15 | 10 |
| (MPa) | |||||
|---|---|---|---|---|---|
| Laboratory Test 5 mm~20 mm | Mesoscopic Simulation | ||||
| 5 mm~20 mm | 5 mm~40 mm | 5 mm~60 mm | 5 mm~80 mm | ||
| 0 | 14.9 | 14.8 | 13.9 | 13.3 | 12.8 |
| 0.34 | 31.1 | 30.5 | 32.4 | 32.8 | 32.3 |
| 0.67 | 47.3 | 47.4 | 43.7 | 45.8 | 48.1 |
| 1.01 | 56.9 | 55.6 | 57.8 | 58.3 | 57.9 |
| 1.34 | 70.3 | 69.6 | 69.7 | 71.2 | 70.8 |
| 1.68 | 79.1 | 78.7 | 80.5 | 80.7 | 82.4 |
| 2.01 | 90.1 | 89.7 | 88.2 | 90.4 | 95.8 |
| Maximum Strength Surface | Yield Strength Surface | Residual Strength Surface | Aggregate Gradation | ||||
|---|---|---|---|---|---|---|---|
| 0 | 0.0595 | ||||||
| 0.515 | 1.145 | 0.515 | 0.0595 | ||||
| 0.0595 | |||||||
| 20 mm | |||||||
| Strength Surface | Aggregate Gradation | |||
|---|---|---|---|---|
| B | N | |||
| 0.30 | 1.514 | 0.7549 | 0.1182 | 20 mm |
| Strength Surface Parameters | Aggregate Gradation Parameters | ||
|---|---|---|---|
| 3.729 | 0.634 | 0.0572 | 20 mm |
Disclaimer/Publisher’s Note: The statements, opinions and data contained in all publications are solely those of the individual author(s) and contributor(s) and not of MDPI and/or the editor(s). MDPI and/or the editor(s) disclaim responsibility for any injury to people or property resulting from any ideas, methods, instructions or products referred to in the content. |
© 2024 by the authors. Licensee MDPI, Basel, Switzerland. This article is an open access article distributed under the terms and conditions of the Creative Commons Attribution (CC BY) license (https://creativecommons.org/licenses/by/4.0/).
Share and Cite
Wang, C.; Qiu, Q.; Wang, X.; Zhang, S.; Wang, G.; Wei, P. Concrete Aggregate-Gradation Effect and Strength-Criterion Modification for Fully Graded Hydraulic Concrete. Materials 2024, 17, 3816. https://doi.org/10.3390/ma17153816
Wang C, Qiu Q, Wang X, Zhang S, Wang G, Wei P. Concrete Aggregate-Gradation Effect and Strength-Criterion Modification for Fully Graded Hydraulic Concrete. Materials. 2024; 17(15):3816. https://doi.org/10.3390/ma17153816
Chicago/Turabian StyleWang, Chao, Qingming Qiu, Xiaohua Wang, Sherong Zhang, Gaohui Wang, and Peiyong Wei. 2024. "Concrete Aggregate-Gradation Effect and Strength-Criterion Modification for Fully Graded Hydraulic Concrete" Materials 17, no. 15: 3816. https://doi.org/10.3390/ma17153816