
The Impact of Boron Compounds on the Structure and Ionic Conductivity of LATP Solid Electrolytes
 , , , , and
Abstract
:1. Introduction
2. Materials and Methods
2.1. Preparation of LABTP Materials
- (i)
- To prepare boron-doped LATP using 10% B2O3, stoichiometric amounts of Li2CO3, Al2O3, boric anhydride (B2O3), TiO2, and NH4H2PO4 were homogenously mixed by ball milling for 2 h and then put into the furnace for melting. The furnace was first set at 450 °C for 2 h to allow the raw materials to decompose and then increased to 900 °C.
- (ii)
- For the production of 10% H3BO3 doped LATP material, Li2CO3, Al2O3, boric acid (H3BO3), TiO2, and NH4H2PO4 chemicals weighed in stoichiometric amounts were subjected to the same processes as the other samples except for the final furnaced. The obtained powder samples were finally annealed at 1100 °C.
- (iii)
- To add 5% B2O3 and 5% H3BO3 to the pure LATP material, the same procedure was followed as the other samples except for the last step. Finally, the material was subjected to a temperature of 1000 °C.
2.2. Characterization of the Samples
3. Results and Discussion
4. Conclusions
Supplementary Materials
Author Contributions
Funding
Institutional Review Board Statement
Informed Consent Statement
Data Availability Statement
Conflicts of Interest
References
- Kim, J.G.; Son, B.; Mukherjee, S.; Schuppert, N.; Bates, A.; Kwon, O.; Choi, M.J.; Chung, H.Y.; Park, S. A review of lithium and non-lithium based solid state batteries. J. Power Sources 2015, 282, 299–322. [Google Scholar] [CrossRef]
- Varzi, A.; Raccichini, R.; Passerini, S.; Scrosati, B. Challenges and prospects of the role of solid electrolytes in the revitalization of lithium metal batteries. J. Mater. Chem. A 2016, 4, 17251–17259. [Google Scholar] [CrossRef]
- Zhao, W.; Yi, J.; He, P.; Zhou, H. Solid-State Electrolytes for Lithium-Ion Batteries: Fundamentals, Challenges and Perspectives. Electrochem. Energy Rev. 2019, 2, 574–605. [Google Scholar] [CrossRef]
- Feng, X.; Ouyang, M.; Liu, X.; Lu, L.; Xia, Y.; He, X. Thermal runaway mechanism of lithium ion battery for electric vehicles: A review. Energy Storage Mater. 2018, 10, 246–267. [Google Scholar] [CrossRef]
- Wang, Y.; Richards, W.D.; Ong, S.P.; Miara, L.J.; Kim, J.C.; Mo, Y.; Ceder, G. Design principles for solid-state lithium superionic conductors. Nat. Mater. 2015, 14, 1026–1031. [Google Scholar] [CrossRef] [PubMed]
- Quartarone, E.; Mustarelli, P. Electrolytes for solid-state lithium rechargeable batteries: Recent advances and perspectives. Chem. Soc. Rev. 2011, 40, 2525–2540. [Google Scholar] [CrossRef]
- Tatsumisago, M.; Nagao, M.; Hayashi, A. Recent development of sulfide solid electrolytes and interfacial modification for all-solid-state rechargeable lithium batteries. J. Asian Ceram. Soc. 2013, 1, 17–25. [Google Scholar] [CrossRef]
- Xiao, W.; Wang, J.; Fan, L.; Zhang, J.; Li, X. Recent advances in Li1+xAlxTi2−x(PO4)3 solid-state electrolyte for safe lithium batteries. Energy Storage Mater. 2019, 19, 379–400. [Google Scholar] [CrossRef]
- Aono, H.; Sugimoto, E.; Sadaoka, Y.; Imanaka, N.; Adachi, G. Ionic conductivity of solid electrolytes based on lithium titanium phosphate. J. Electrochem. Soc. 1990, 137, 1023. [Google Scholar] [CrossRef]
- Bruce, P.G. Solid State Electrochemistry; Cambridge University press: Cambridge, UK, 1997. [Google Scholar]
- Maldonado-Manso, P.; Losilla, E.R.; Martínez-Lara, M.; Aranda, M.A.G.; Bruque, S.; Mouahid, F.E.; Zahir, M. High Lithium Ionic Conductivity in the Li1+xAlxGeyTi2−x−y(PO4)3 NASICON Series. Chem. Mater. 2003, 15, 1879–1885. [Google Scholar] [CrossRef]
- Arbi, K.; Lazarraga, M.G.; Ben Hassen Chehimi, D.; Ayadi-Trabelsi, M.; Rojo, J.M.; Sanz, J. Lithium Mobility in Li1.2Ti1.8R0.2(PO4)3 Compounds (R = Al, Ga, Sc, In) as Followed by NMR and Impedance Spectroscopy. Chem. Mater. 2004, 16, 255–262. [Google Scholar] [CrossRef]
- Kang, J.; Guo, X.; Gu, R.; Tang, Y.; Hao, H.; Lan, Y.; Jin, L.; Wei, X. Effect of boron-based glass additives on the ionic conductivity of Li1.3Al0.3Ti1.7(PO4)3 solid electrolyte. J. Alloys Compd. 2023, 941, 168857. [Google Scholar] [CrossRef]
- Fu, J. Fast Li+ ion conduction in Li2O–(Al2O3 Ga22O3)–TiO2–P2O5 glass–ceramics. J. Mater. Sci. 1998, 33, 1549–1553. [Google Scholar] [CrossRef]
- Kothari, D.H.; Kanchan, D.K. Effect of doping of trivalent cations Ga3+, Sc3+, Y3+ in Li1.3Al0.3Ti1.7(PO4)3 (LATP) system on Li+ ion conductivity. Phys. B Condens. Matter 2016, 501, 90–94. [Google Scholar] [CrossRef]
- Liang, Y.; Peng, C.; Kamiike, Y.; Kuroda, K.; Okido, M. Gallium doped NASICON type LiTi2(PO4)3 thin-film grown on graphite anode as solid electrolyte for all solid state lithium batteries. J. Alloys Compd. 2019, 775, 1147–1155. [Google Scholar] [CrossRef]
- Rai, K.; Kundu, S. Fabrication and performances of high lithium-ion conducting solid electrolytes based on NASICON Li1.3Al0.3Ti1.7−xZrx(PO4)3 (0≤ x ≤ 0.2). Ceram. Int. 2020, 46, 23695–23705. [Google Scholar] [CrossRef]
- Abdel-Hameed, S.A.; Fathi, A.M.; Elwan, R.L.; Margha, F.H. Effect of F− and B3+ ions and heat treatment on the enhancement of electrochemical and electrical properties of nanosized LiTi2(PO4)3 glass-ceramic for lithium-ion batteries. J. Alloys Compd. 2020, 832, 154943. [Google Scholar] [CrossRef]
- Narváez-Semanate, J.L.; Rodrigues, A.C.M. Microstructure and ionic conductivity of Li1+xAlxTi2−x(PO4)3 NASICON glass-ceramics. Solid State Ion. 2010, 181, 1197–1204. [Google Scholar] [CrossRef]
- Chen, H.; Tao, H.; Wu, Q.; Zhao, X. Crystallization Kinetics of Superionic Conductive Al(B,La)- Incorporated LiTi2(PO4)3 Glass-Ceramics. J. Am. Ceram. Soc. 2013, 96, 801–805. [Google Scholar] [CrossRef]
- Ślubowska, W.; Kwatek, K.; Jastrzębski, C.; Nowiński, J.L. Thermal, structural and electrical study of boron-incorporated LATP glasses and glass-ceramics. Solid State Ion. 2019, 335, 129–134. [Google Scholar] [CrossRef]
- Kwatek, K.; Ślubowska, W.; Ruiz, C.; Sobrados, I.; Sanz, J.; Garbarczyk, J.E.; Nowiński, J.L. The mechanism of enhanced ionic conductivity in Li1.3Al0.3Ti1.7(PO4)3–(0.75Li2O·0.25B2O3) composites. J. Alloys Compd. 2020, 838, 155623. [Google Scholar] [CrossRef]
- Öksüzoğlu, F.; Ateş, Ş.; Özkendir, O.M.; Çelik, G.; Eker, Y.R.; Baveghar, H. Structure and ionic conductivity of NASICON-type LATP solid electrolyte synthesized by the solid-state method. Ceram. Int. 2024, 50, 31435–31441. [Google Scholar] [CrossRef]
- Siller, V.; Morata, A.; Eroles, M.N.; Arenal, R.; Gonzalez-Rosillo, J.C.; del Amo, J.M.L.; Tarancón, A. High performance LATP thin film electrolytes for all-solid-state microbattery applications. J. Mater. Chem. A 2021, 9, 17760–17769. [Google Scholar] [CrossRef]
- Arbi, K.; Mandal, S.; Rojo, J.M.; Sanz, J. Dependence of Ionic Conductivity on Composition of Fast Ionic Conductors Li1+xTi2−xAlx(PO4)3, 0 ≤ x ≤ 0.7. A Parallel NMR and Electric Impedance Study. Chem. Mater. 2002, 14, 1091–1097. [Google Scholar] [CrossRef]
- Mariappan, C.R.; Gellert, M.; Yada, C.; Rosciano, F.; Roling, B. Grain boundary resistance of fast lithium ion conductors: Comparison between a lithium-ion conductive Li–Al–Ti–P–O-type glass ceramic and a Li1.5Al0.5Ge1.5P3O12 ceramic. Electrochem. Commun. 2012, 14, 25–28. [Google Scholar] [CrossRef]
- Campanella, D.; Krachkovskiy, S.; Faure, C.; Zhu, W.; Feng, Z.; Savoie, S.; Girard, G.; Demers, H.; Vijh, A.; George, C.; et al. Influence of AlPO4 Impurity on the Electrochemical Properties of NASICON-Type Li1.5Al0.5Ti1.5(PO4)3 Solid Electrolyte. ChemElectroChem 2022, 9, e202200984. [Google Scholar] [CrossRef]
- Yu, S.; Mertens, A.; Gao, X.; Gunduz, D.C.; Schierholz, R.; Benning, S.; Hausen, F.; Mertens, J.; Kungl, H.; Tempel, H.; et al. Influence of microstructure and AlPO4 secondary-phase on the ionic conductivity of Li1.3Al0.3Ti1.7(PO4)3 solid-state electrolyte. Funct. Mater. Lett. 2016, 9, 1650066. [Google Scholar] [CrossRef]
- Puech, L.; Cantau, C.; Vinatier, P.; Toussaint, G.; Stevens, P. Elaboration and characterization of a free standing LiSICON membrane for aqueous lithium–air battery. J. Power Sources 2012, 214, 330–336. [Google Scholar] [CrossRef]
- Ślubowska, W.; Montagne, L.; Lafon, O.; Méar, F.; Kwatek, K. B2O3-doped LATP glass-ceramics studied by X-ray diffractometry and MAS NMR spectroscopy methods. Nanomaterials 2021, 11, 390. [Google Scholar] [CrossRef]
- Ashton, T.E.; Baker, P.J.; Shakespeare, Y.S.; Commandeur, D.; Darr, J.A. Phase Evolution and Li Diffusion in LATP Solid-State Electrolyte Synthesized via a Direct Heat-Cycling Method. Adv. Energy Sustain. Res. 2022, 3, 2200017. [Google Scholar] [CrossRef]
- Fu, Y.; Ming, H.; Zhao, S.; Guo, J.; Chen, M.; Zhou, Q.; Zheng, J. A new insight into the LiTiOPO4 as an anode material for lithium ion batteries. Electrochim. Acta 2015, 185, 211–217. [Google Scholar] [CrossRef]
- Lasri, K.; Dahbi, M.; Liivat, A.; Brandell, D.; Edström, K.; Saadoune, I. Intercalation and conversion reactions in Ni0.5TiOPO4 Li-ion battery anode materials. J. Power Sources 2013, 229, 265–271. [Google Scholar] [CrossRef]
- Burba, C.M.; Frech, R. Vibrational spectroscopic study of lithium intercalation into LiTi2(PO4)3. Solid State Ion. 2006, 177, 1489–1494. [Google Scholar] [CrossRef]
- Ramaraghavulu, R.; Buddhudu, S. Analysis of structural, thermal and dielectric properties of LiTi(PO4)3 ceramic powders. Ceram. Int. 2011, 37, 3651–3656. [Google Scholar] [CrossRef]
- Kurazhkovskaya, V.S.; Bykov, D.M.; Borovikova, E.Y.; Boldyrev, N.Y.; Mikhalitsyn, L.; Orlova, A.I. Vibrational spectra and factor group analysis of lanthanide and zirconium phosphates MIII0.33Zr2(PO4)3, where MIII = Y, La–Lu. Vib. Spectrosc. 2010, 52, 137–143. [Google Scholar] [CrossRef]
- Pikl, R.; De Waal, D.; Aatiq, A.; El Jazouli, A. Vibrational Spectra and Factor Group Analysis of Li2xMn0.5−xTi2(PO4)3 {x = 0, 0.25, 0.50}. Mater. Res. Bull. 1998, 33, 955–961. [Google Scholar] [CrossRef]
- Haile, S.M.; West, D.L.; Campbell, J. The role of microstructure and processing on the proton conducting properties of gadolinium-doped barium cerate. J. Mater. Res. 1998, 13, 1576–1595. [Google Scholar] [CrossRef]
- Duan, S.; Yu, J.; Sun, Y.; Li, A.; Chen, S.; Qu, K.; Ding, Z.; Liu, Z.; Li, Y.; Huang, C. Selective doping to relax glassified grain boundaries substantially enhances the ionic conductivity of LiTi2(PO4)3 glass-ceramic electrolytes. J. Power Sources 2020, 449, 227574. [Google Scholar] [CrossRef]
- Ma, C.; Chen, K.; Liang, C.; Nan, C.-W.; Ishikawa, R.; More, K.; Chi, M. Atomic-scale origin of the large grain-boundary resistance in perovskite Li-ion-conducting solid electrolytes. Energy Environ. Sci. 2014, 7, 1638–1642. [Google Scholar] [CrossRef]


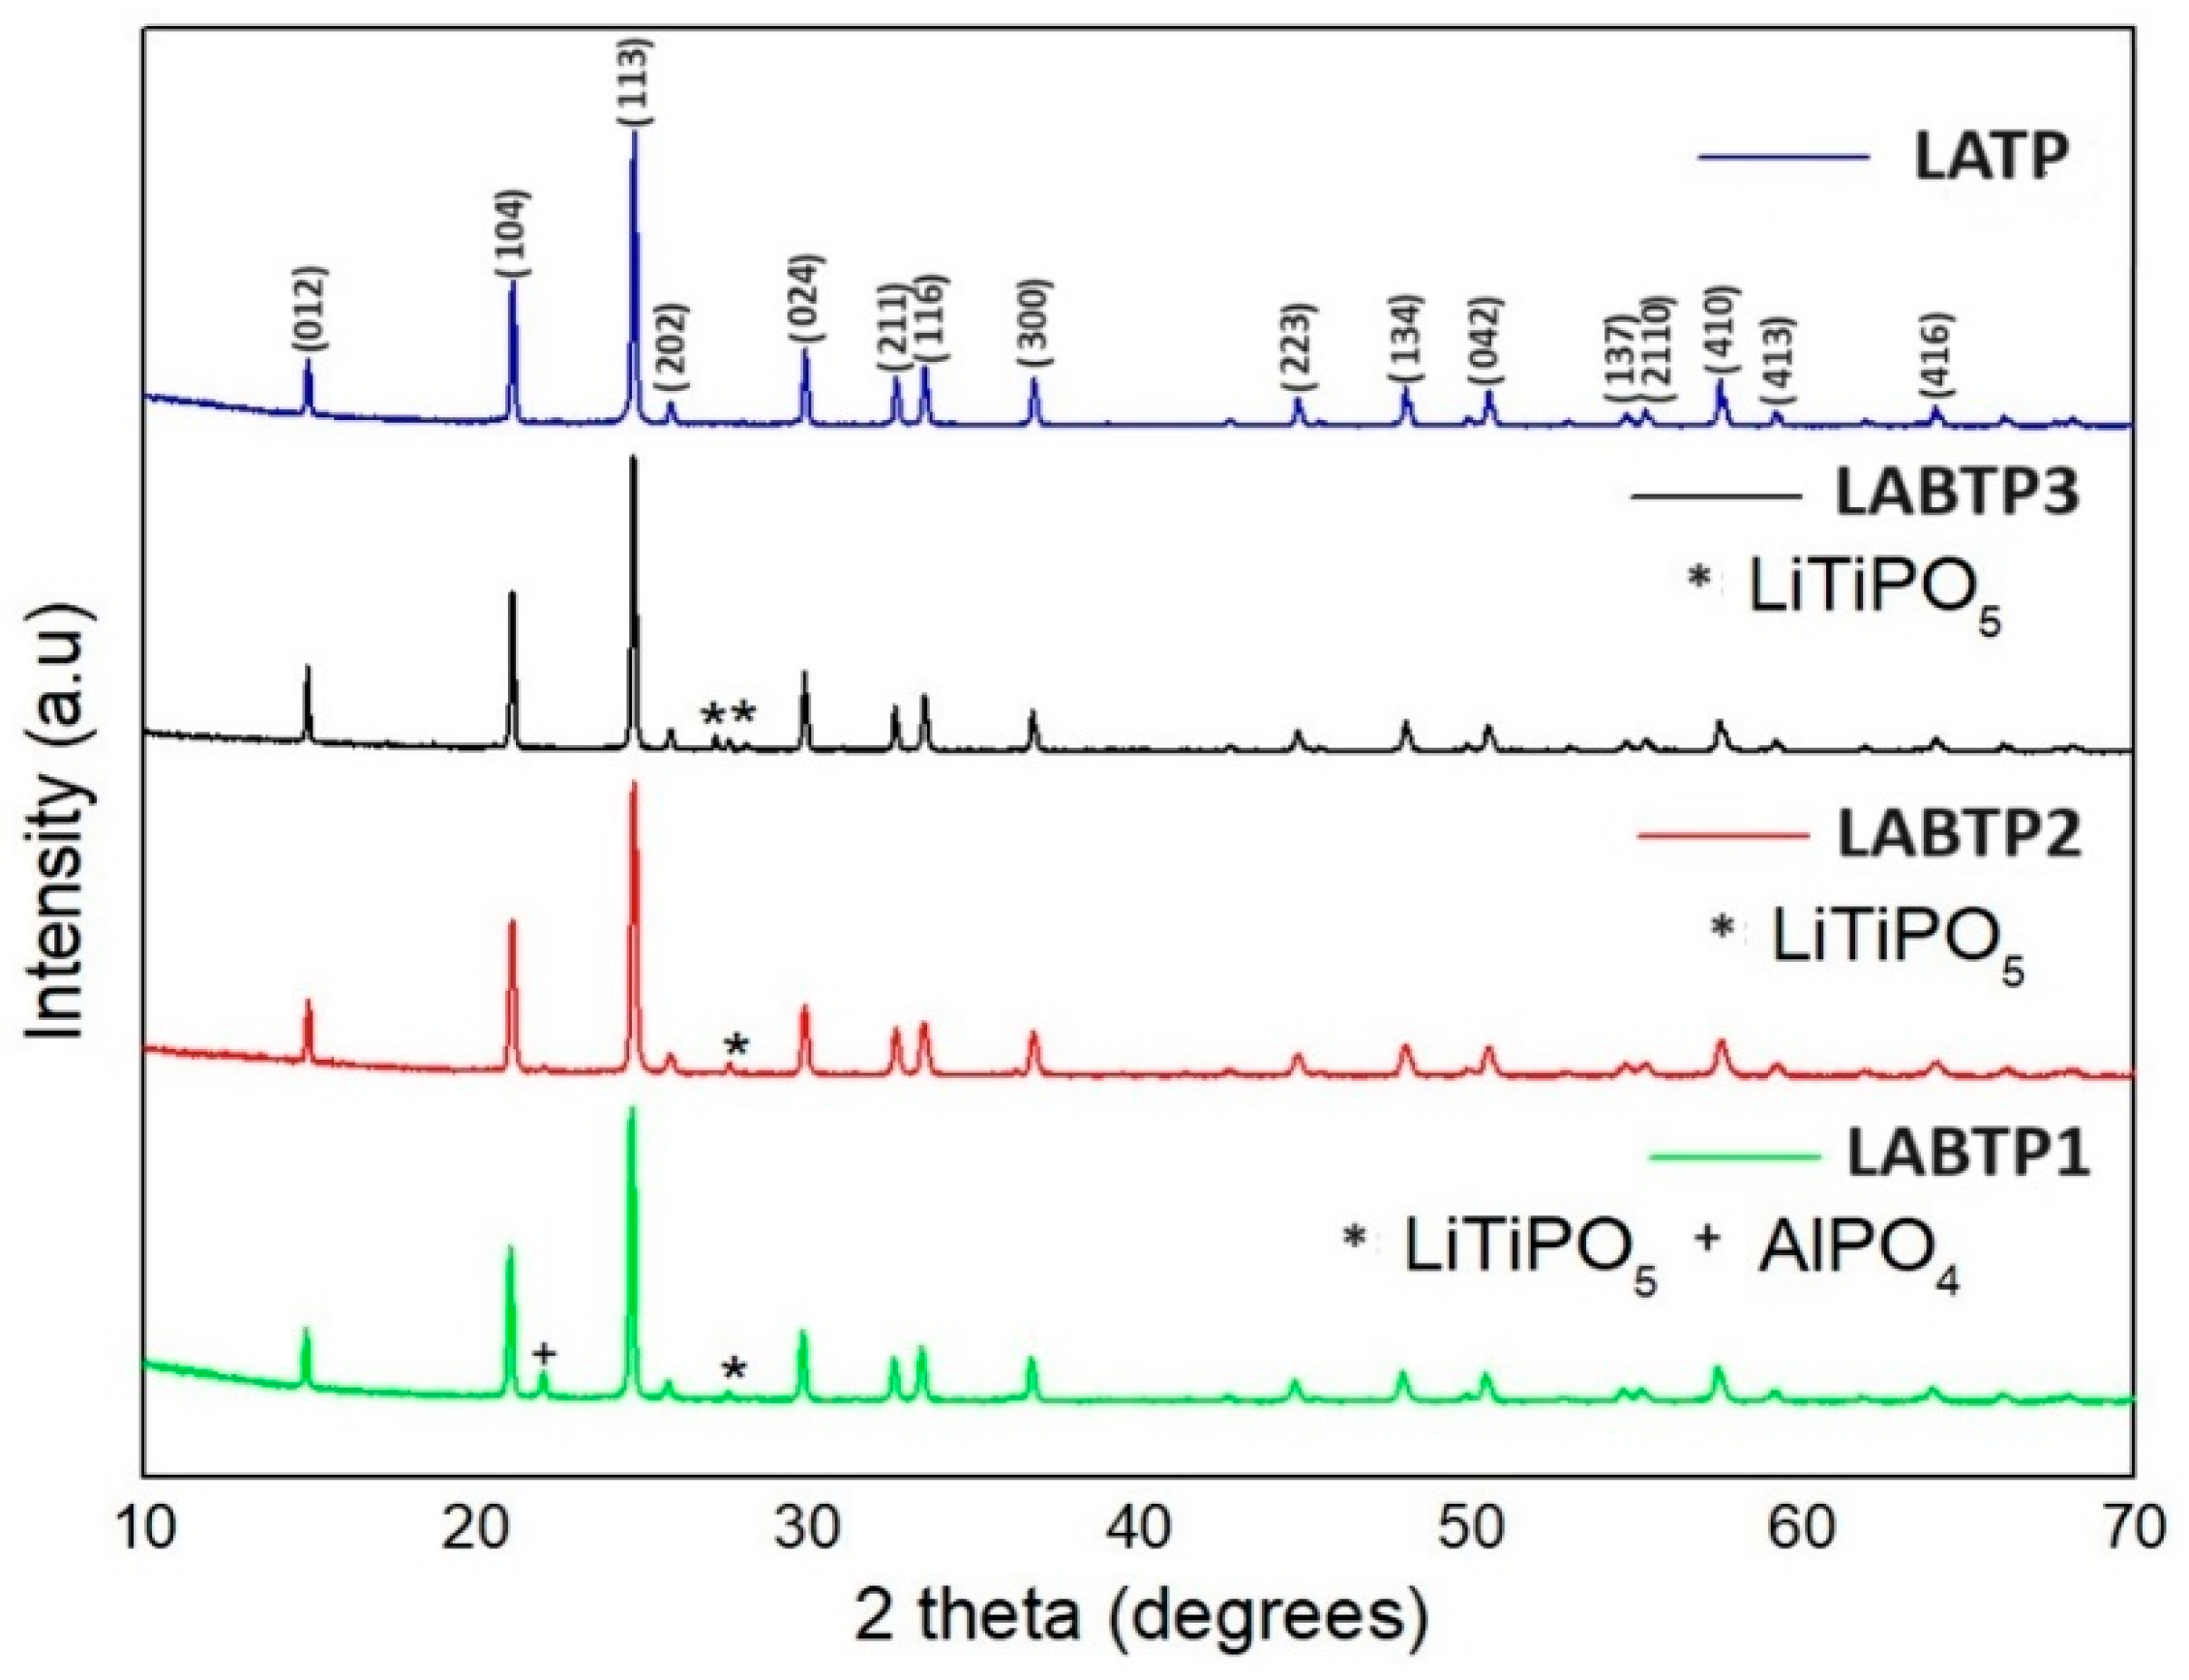
| Samples | Crystal | α | β | γ | a (Å) | b (Å) | c (Å) | Geometry | % (Weight) |
|---|---|---|---|---|---|---|---|---|---|
| LABTP1 | LiAlTi(PO4)3 | 90 | 90 | 120 | 8.5079 | 8.5079 | 20.8825 | Rhombohedral (Rc) | 98.51 ± 0.0 |
| AlPO4 | 90 | 117.81 | 90 | 37.3863 | 5.0455 | 26.2217 | Monoclinic (P1 C1) | 0.08 ± 0.36 | |
| LiTiPO5 | 90 | 90 | 90 | 7.4010 | 6.3750 | 7.2350 | Orthorhombic (Pnma) | 1.40 ± 0.63 | |
| LABTP2 | LiAlTi(PO4)3 | 90 | 90 | 120 | 8.5062 | 8.5062 | 20.8683 | Rhombohedral (Rc) | 99.45 ± 0.0 |
| LiTiPO5 | 90 | 90 | 90 | 7.4010 | 6.3750 | 7.2350 | Orthorhombic (Pnma) | 0.55 ± 0.45 | |
| LABTP3 | LiAlTi(PO4)3 | 90 | 90 | 120 | 8.5078 | 8.5078 | 20.8223 | Rhombohedral (Rc) | 95.81 ± 1.44 |
| LiTiPO5 | 90 | 90 | 90 | 7.4010 | 6.3750 | 7.2350 | Orthorhombic (Pnma) | 4.19 ± 0.53 |
| R Factor | LABTP 1 | LABTP 2 | LABTP 3 |
|---|---|---|---|
| RWP (%) | 14.73 | 12.56 | 13.32 |
| REXP (%) | 6.70 | 7.17 | 6.80 |
| GOF (χ) | 2.20 | 1.75 | 1.95 |
| Samples | Planes | (012) | (104) | (113) | (024) | (211) | (116) |
|---|---|---|---|---|---|---|---|
| LABTP1 | 2θ (degree) | 14.87 | 21.02 | 24.68 | 29.84 | 32.56 | 33.42 |
| FWHM (rad) × 10−3 | 0.14 | 0.14 | 0.14 | 0.16 | 0.19 | 0.21 | |
| D (nm) | 59.34 | 59.34 | 59.34 | 51.90 | 43.74 | 39.56 | |
| δ (1/nm2) × 10−3 | 0.283 | 0.283 | 0.283 | 0.370 | 0.522 | 0.638 | |
| ε (×10−3) | 4.674 | 3.288 | 2.788 | 2.617 | 2.833 | 3.047 | |
| LABTP2 | 2θ (degree) | 14.93 | 21.08 | 24.70 | 29.90 | 32.66 | 33.48 |
| FWHM (rad) × 10−3 | 0.16 | 0.16 | 0.17 | 0.20 | 0.20 | 0.12 | |
| D (nm) | 51.90 | 51.90 | 48.92 | 41.49 | 41.49 | 69.28 | |
| δ (1/nm2) × 10−3 | 0.371 | 0.371 | 0.417 | 0.580 | 0.580 | 0.208 | |
| ε (×10−3) | 5.323 | 3.748 | 3.379 | 3.267 | 2.981 | 1.734 | |
| LABTP3 | 2θ (degree) | 14.91 | 21.08 | 24.67 | 29.90 | 32.62 | 33.52 |
| FWHM (rad) × 10−3 | 0.09 | 0.11 | 0.12 | 0.14 | 0.15 | 0.16 | |
| D (nm) | 92.23 | 75.81 | 69.29 | 59.34 | 55.48 | 51.90 | |
| δ (1/nm2) × 10−3 | 0.117 | 0.173 | 0.208 | 0.283 | 0.324 | 0.371 | |
| ε (×10−3) | 2.999 | 2.566 | 2.389 | 2.284 | 2.229 | 2.316 |
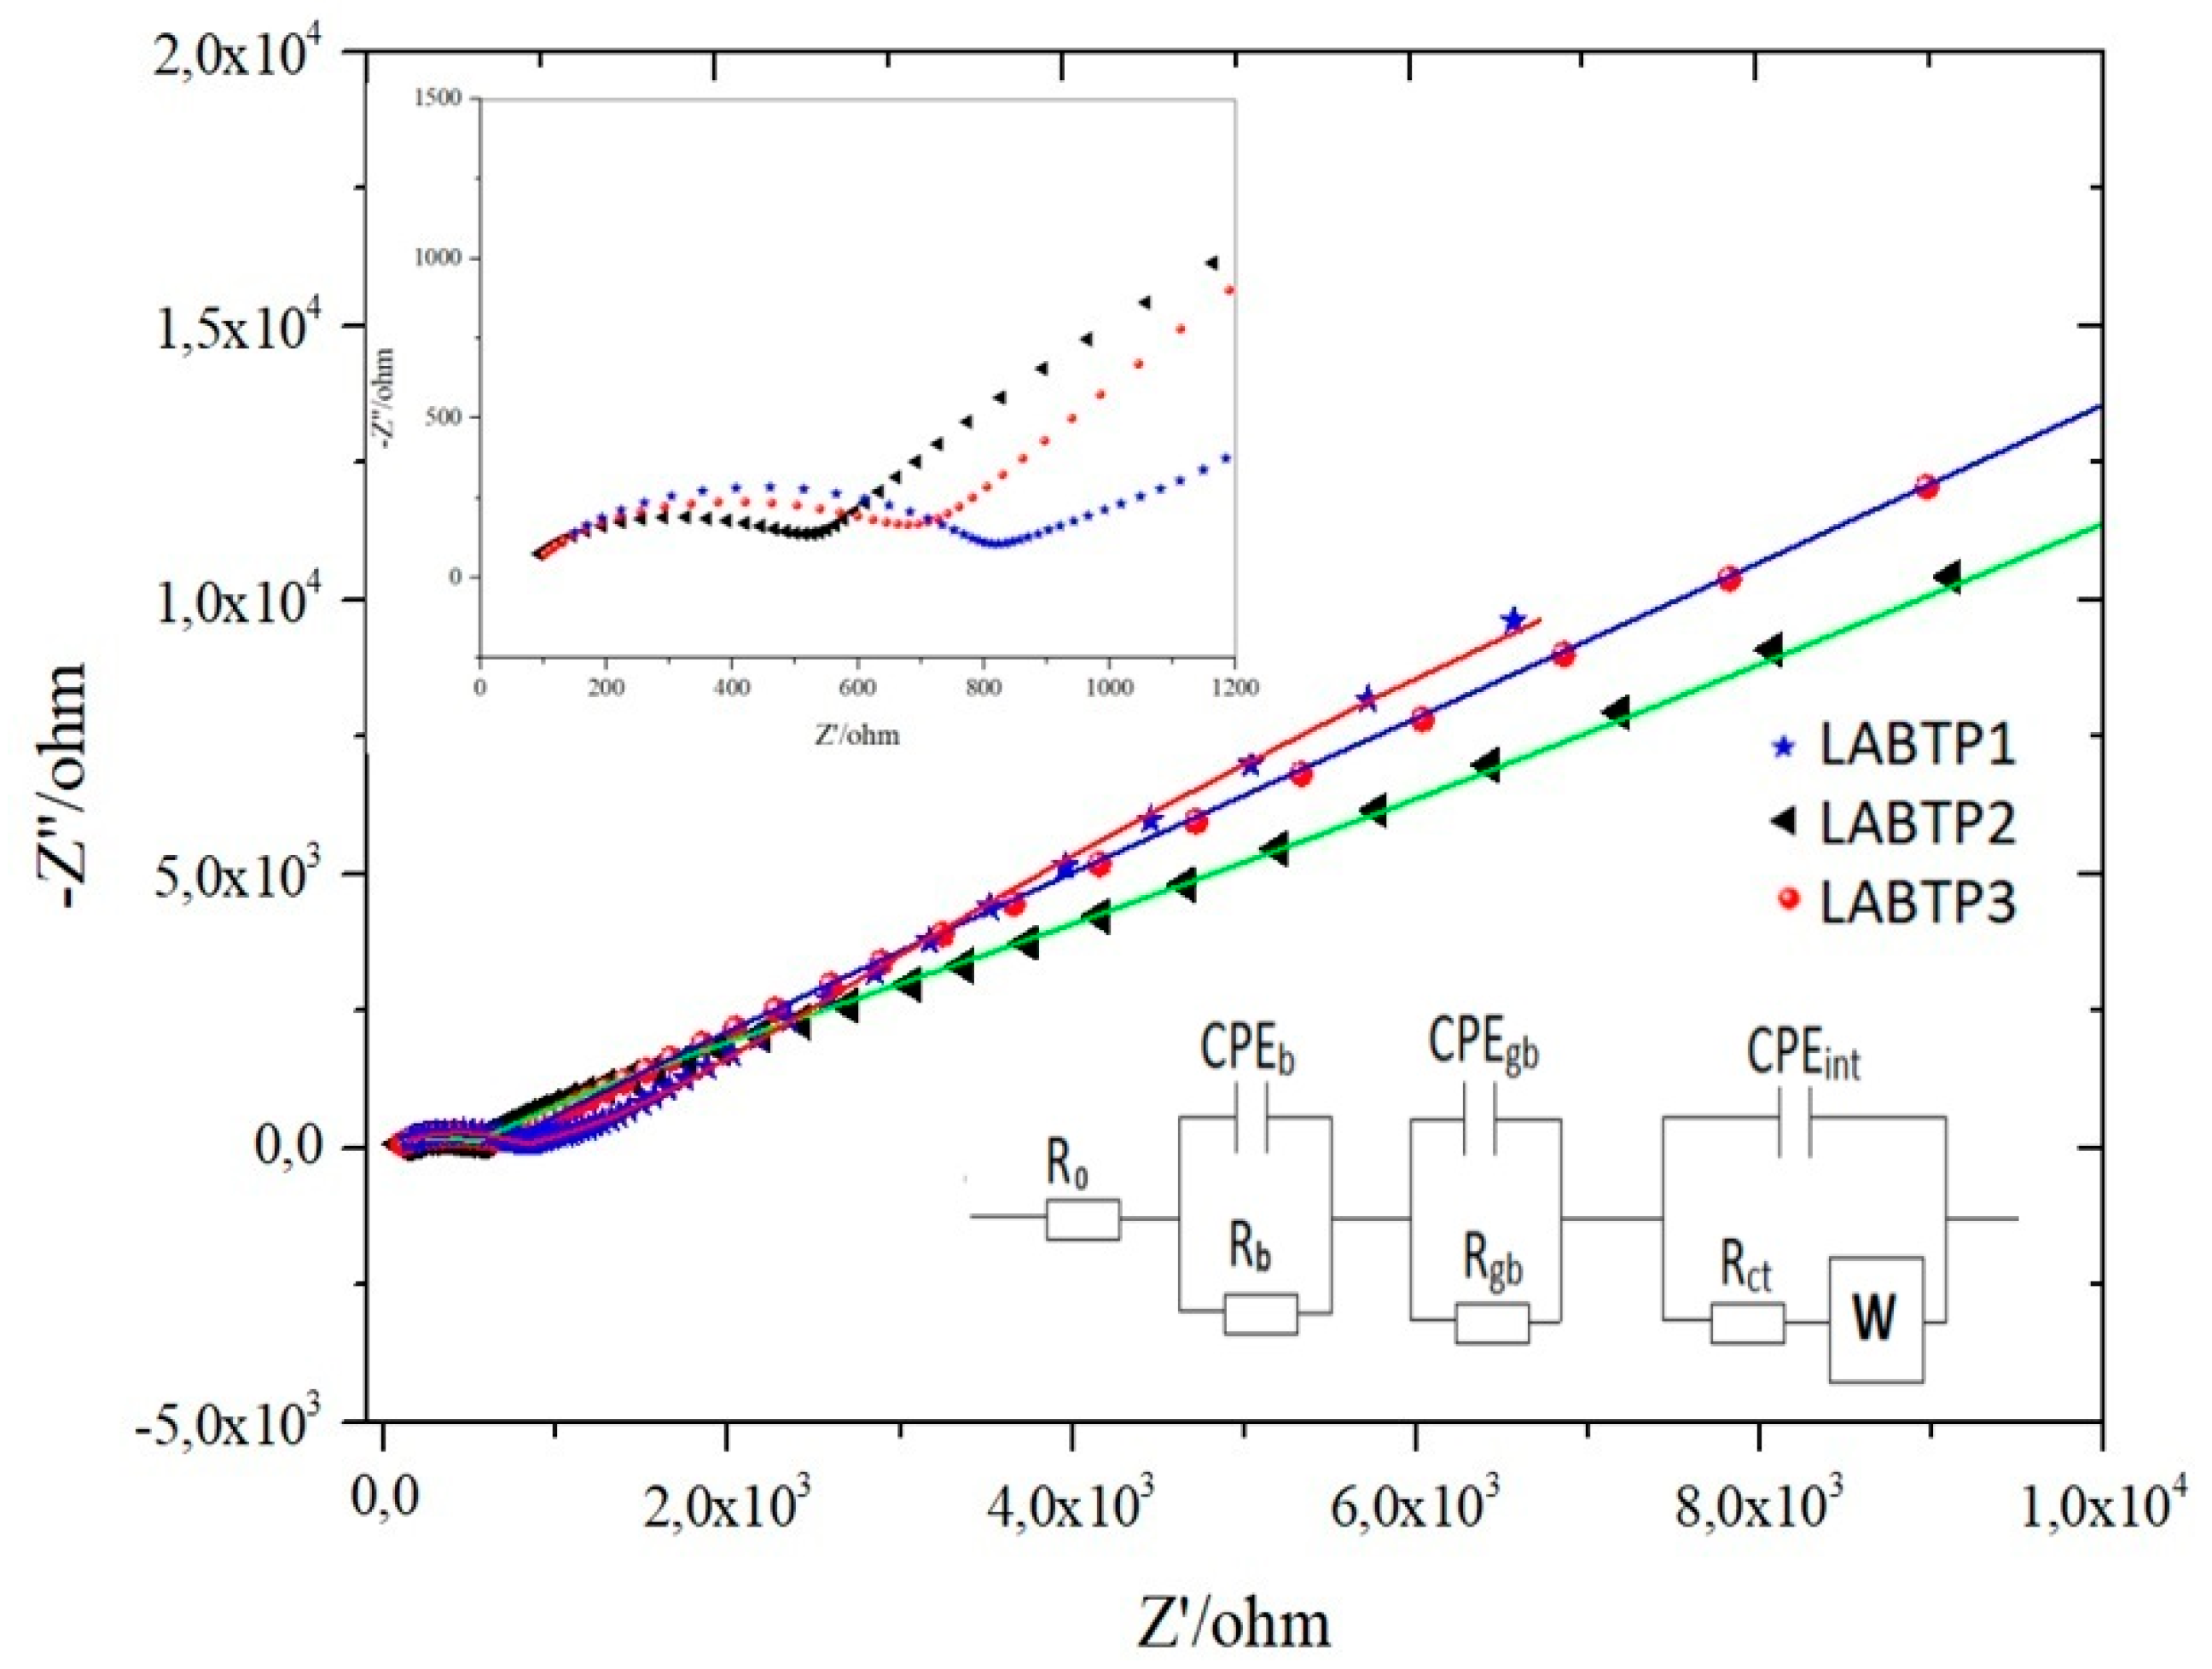
| Samples | Qb (S.sn) | Qgb (S.sn) | Qint (S.sn) | Warburg | χ2 | ||||
|---|---|---|---|---|---|---|---|---|---|
| LABTP1 | 71.96 | 729.96 | 15.13 × 10⁻⁹ | 379.50 | 12.82 × 10⁻⁶ | 8.63 × 10³ | 18.0 × 610−6 | 10.34 × 10⁻⁶ | 1.44 10−5 |
| LABTP2 | 78.15 | 374.60 | 6.90 × 10⁻⁹ | 212.50 | 82.17 × 10⁻⁹ | 1.12 × 10³ | 10.03 × 10⁻⁸ | 8.10 × 10⁻⁶ | 1.55 10−4 |
| LABTP3 | 31.82 | 313.80 | 8.15 × 10⁻⁹ | 371.10 | 4.49 × 10⁻⁸ | 18.27 × 10³ | 4.06 × 10⁻⁶ | 3.46 × 10⁻⁶ | 2.57 10−5 |
| Method | Ionic Conductivity (S cm−1) | References |
|---|---|---|
| LABTP1 (B2O3 doped) | 1.4 10−4 | This work |
| LABTP2 (H3BO3 doped) | 2.4 10−4 | |
| LABTP3 (B2O3 + H3BO3 doped) | 2.3 10−4 | |
| B2O3 doped | 1.97 10−4 | [13] |
| B2O3 doped | 6 10−5 | [21] |
| Li2O + B2O3 doped | 1.9 10−4 | [22] |
Disclaimer/Publisher’s Note: The statements, opinions and data contained in all publications are solely those of the individual author(s) and contributor(s) and not of MDPI and/or the editor(s). MDPI and/or the editor(s) disclaim responsibility for any injury to people or property resulting from any ideas, methods, instructions or products referred to in the content. |
© 2024 by the authors. Licensee MDPI, Basel, Switzerland. This article is an open access article distributed under the terms and conditions of the Creative Commons Attribution (CC BY) license (https://creativecommons.org/licenses/by/4.0/).
Share and Cite
Öksüzoğlu, F.; Ateş, Ş.; Özkendir, O.M.; Çelik, G.; Eker, Y.R.; Baveghar, H.; Basyooni-M. Kabatas, M.A. The Impact of Boron Compounds on the Structure and Ionic Conductivity of LATP Solid Electrolytes. Materials 2024, 17, 3846. https://doi.org/10.3390/ma17153846
Öksüzoğlu F, Ateş Ş, Özkendir OM, Çelik G, Eker YR, Baveghar H, Basyooni-M. Kabatas MA. The Impact of Boron Compounds on the Structure and Ionic Conductivity of LATP Solid Electrolytes. Materials. 2024; 17(15):3846. https://doi.org/10.3390/ma17153846
Chicago/Turabian StyleÖksüzoğlu, Fatih, Şule Ateş, Osman Murat Özkendir, Gültekin Çelik, Yasin Ramazan Eker, Hadi Baveghar, and Mohamed A. Basyooni-M. Kabatas. 2024. "The Impact of Boron Compounds on the Structure and Ionic Conductivity of LATP Solid Electrolytes" Materials 17, no. 15: 3846. https://doi.org/10.3390/ma17153846