
Experimental Characterization of Anisotropic Mechanical Behaviour and Failure Mechanisms of Hardened Printed Concrete

Abstract
:1. Introduction
2. Materials and Methods
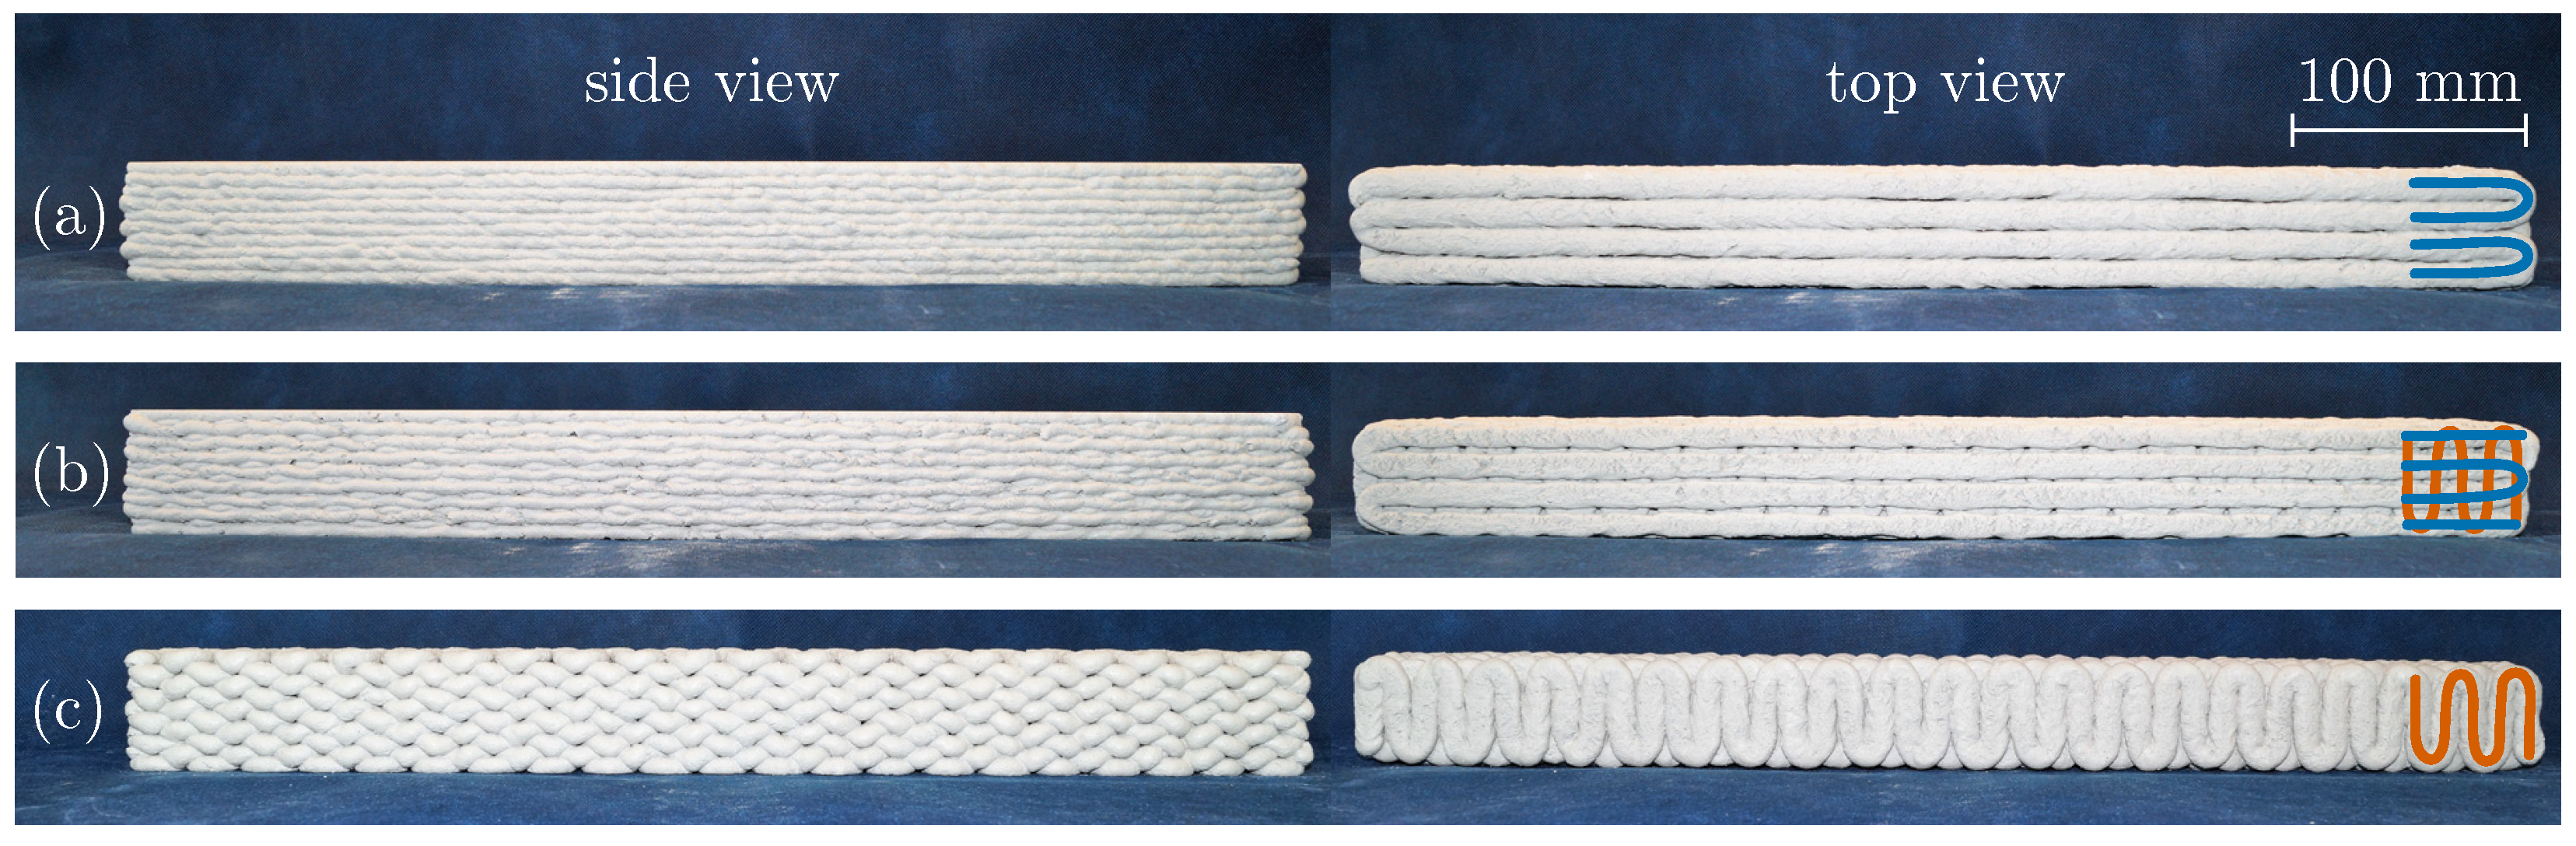
2.1. Printing System and Concrete Mix Design
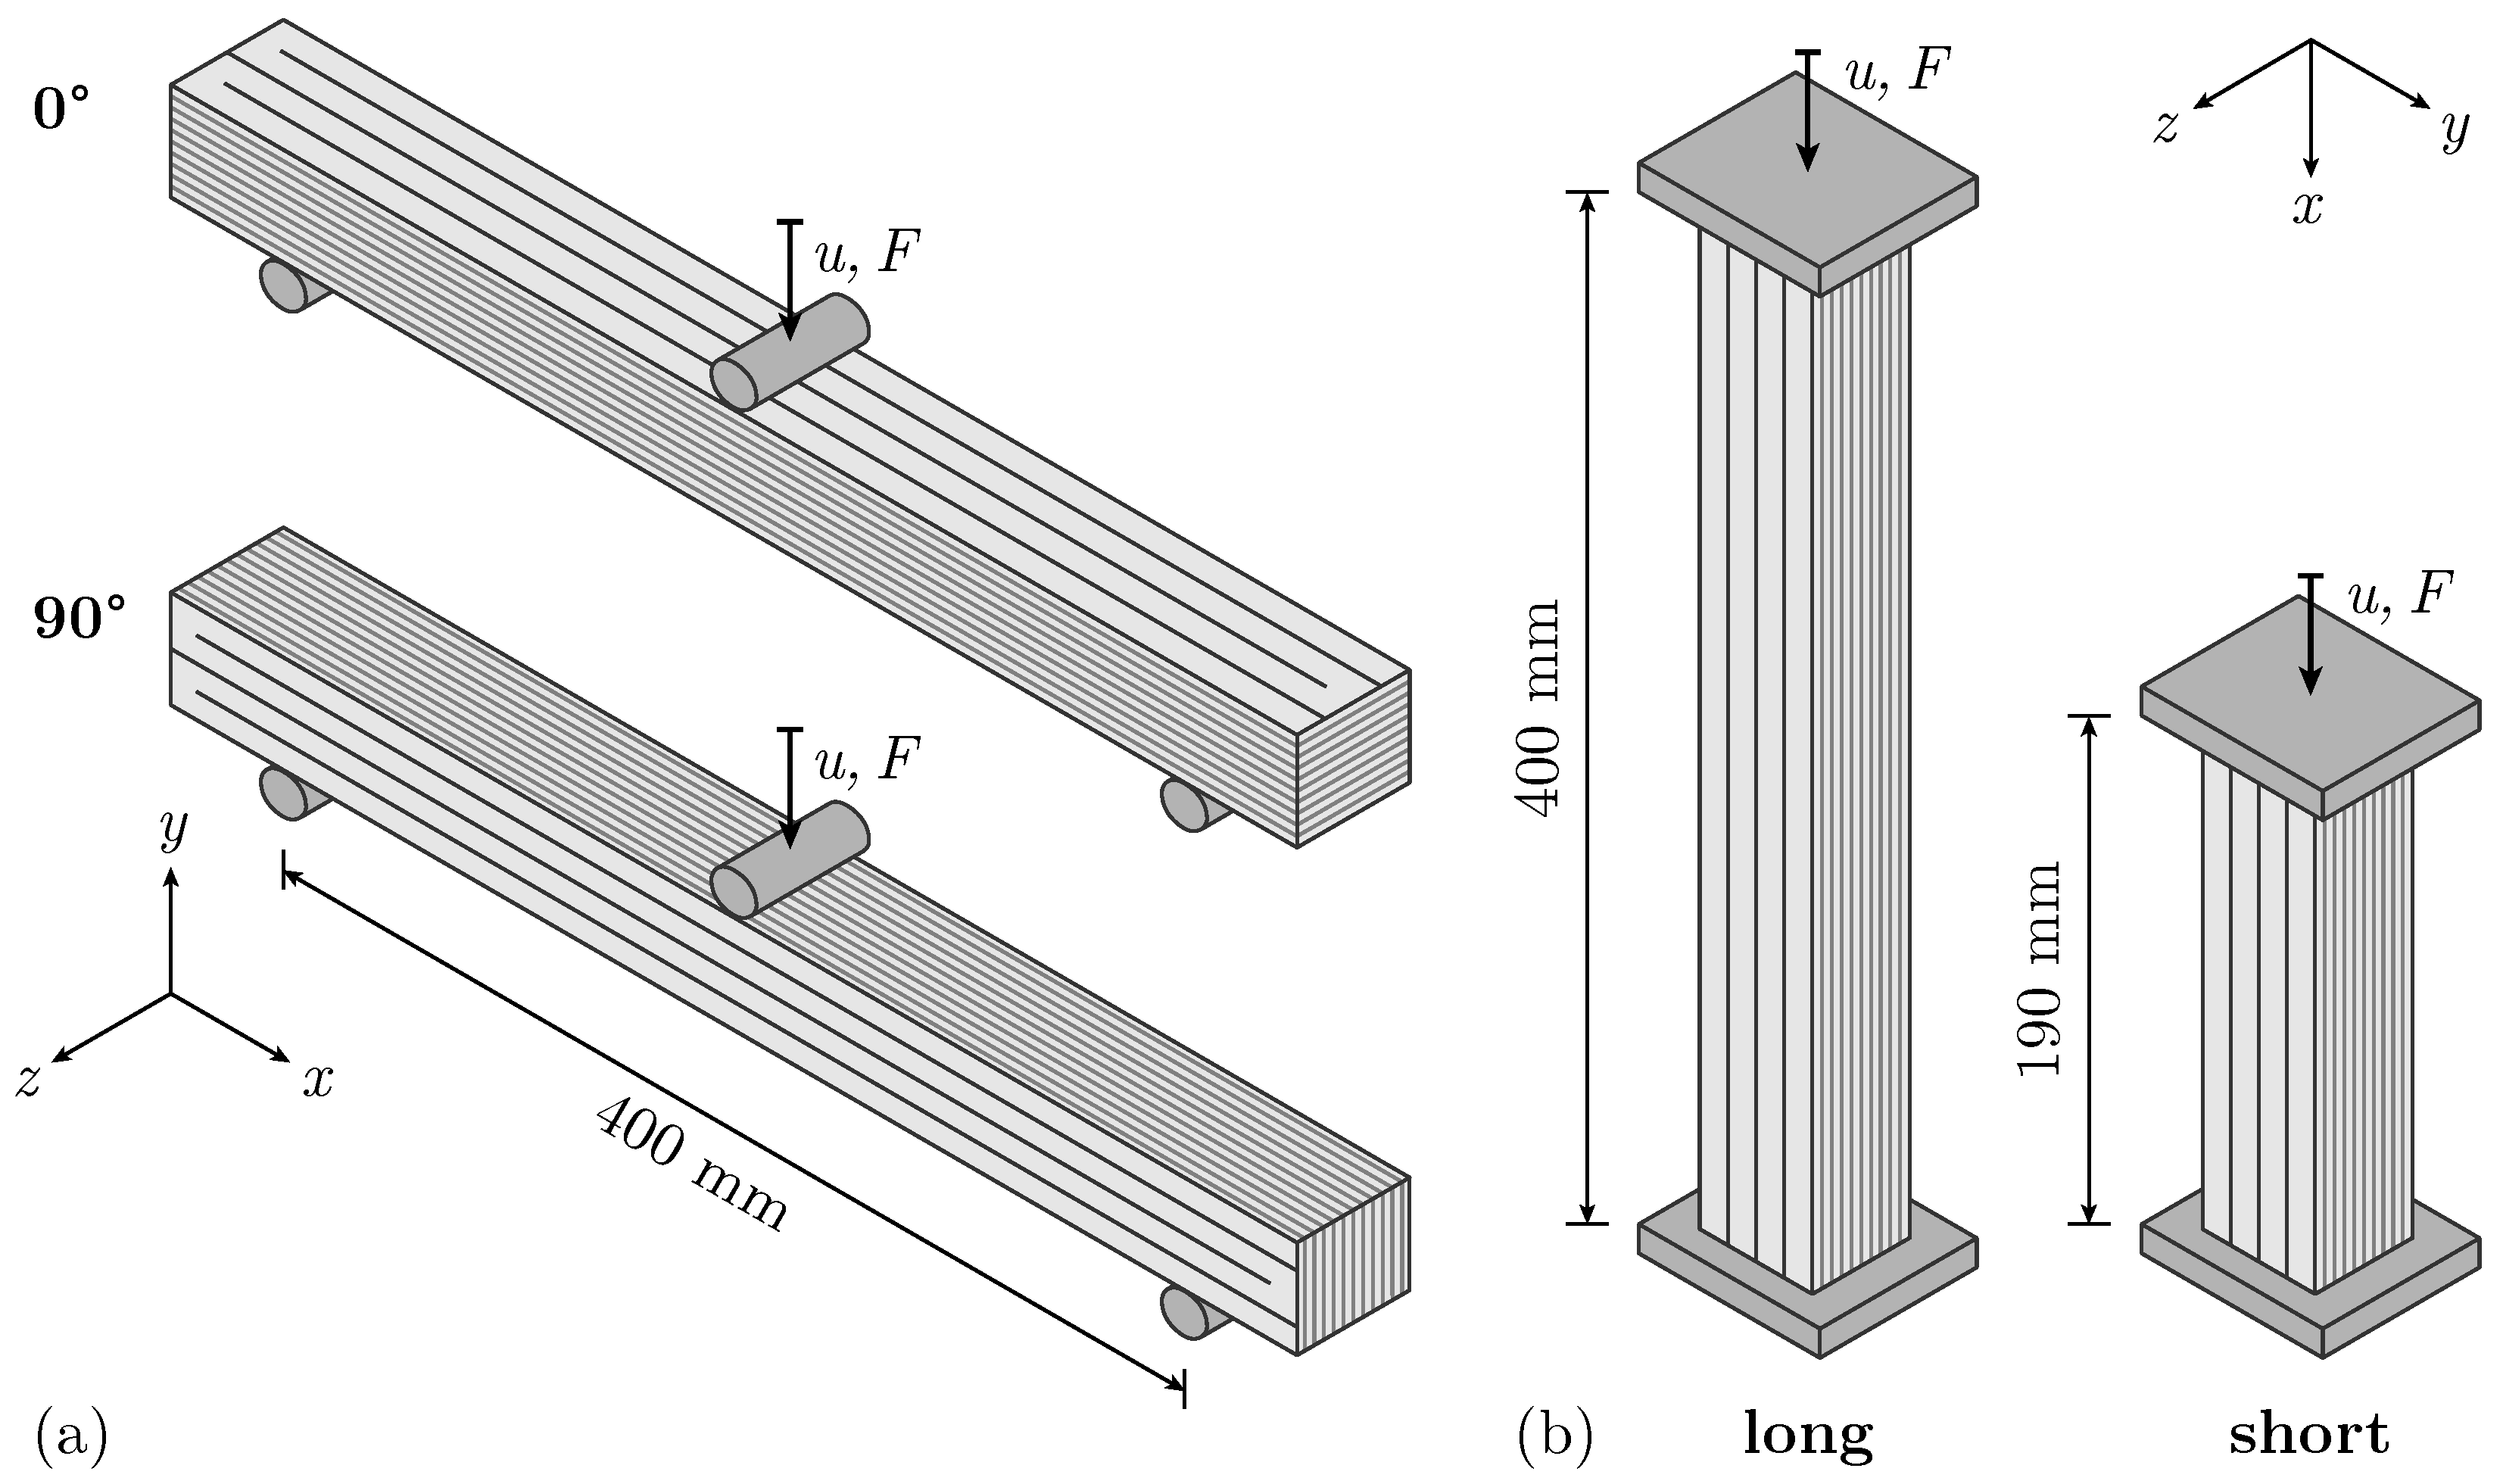
2.2. Test Series
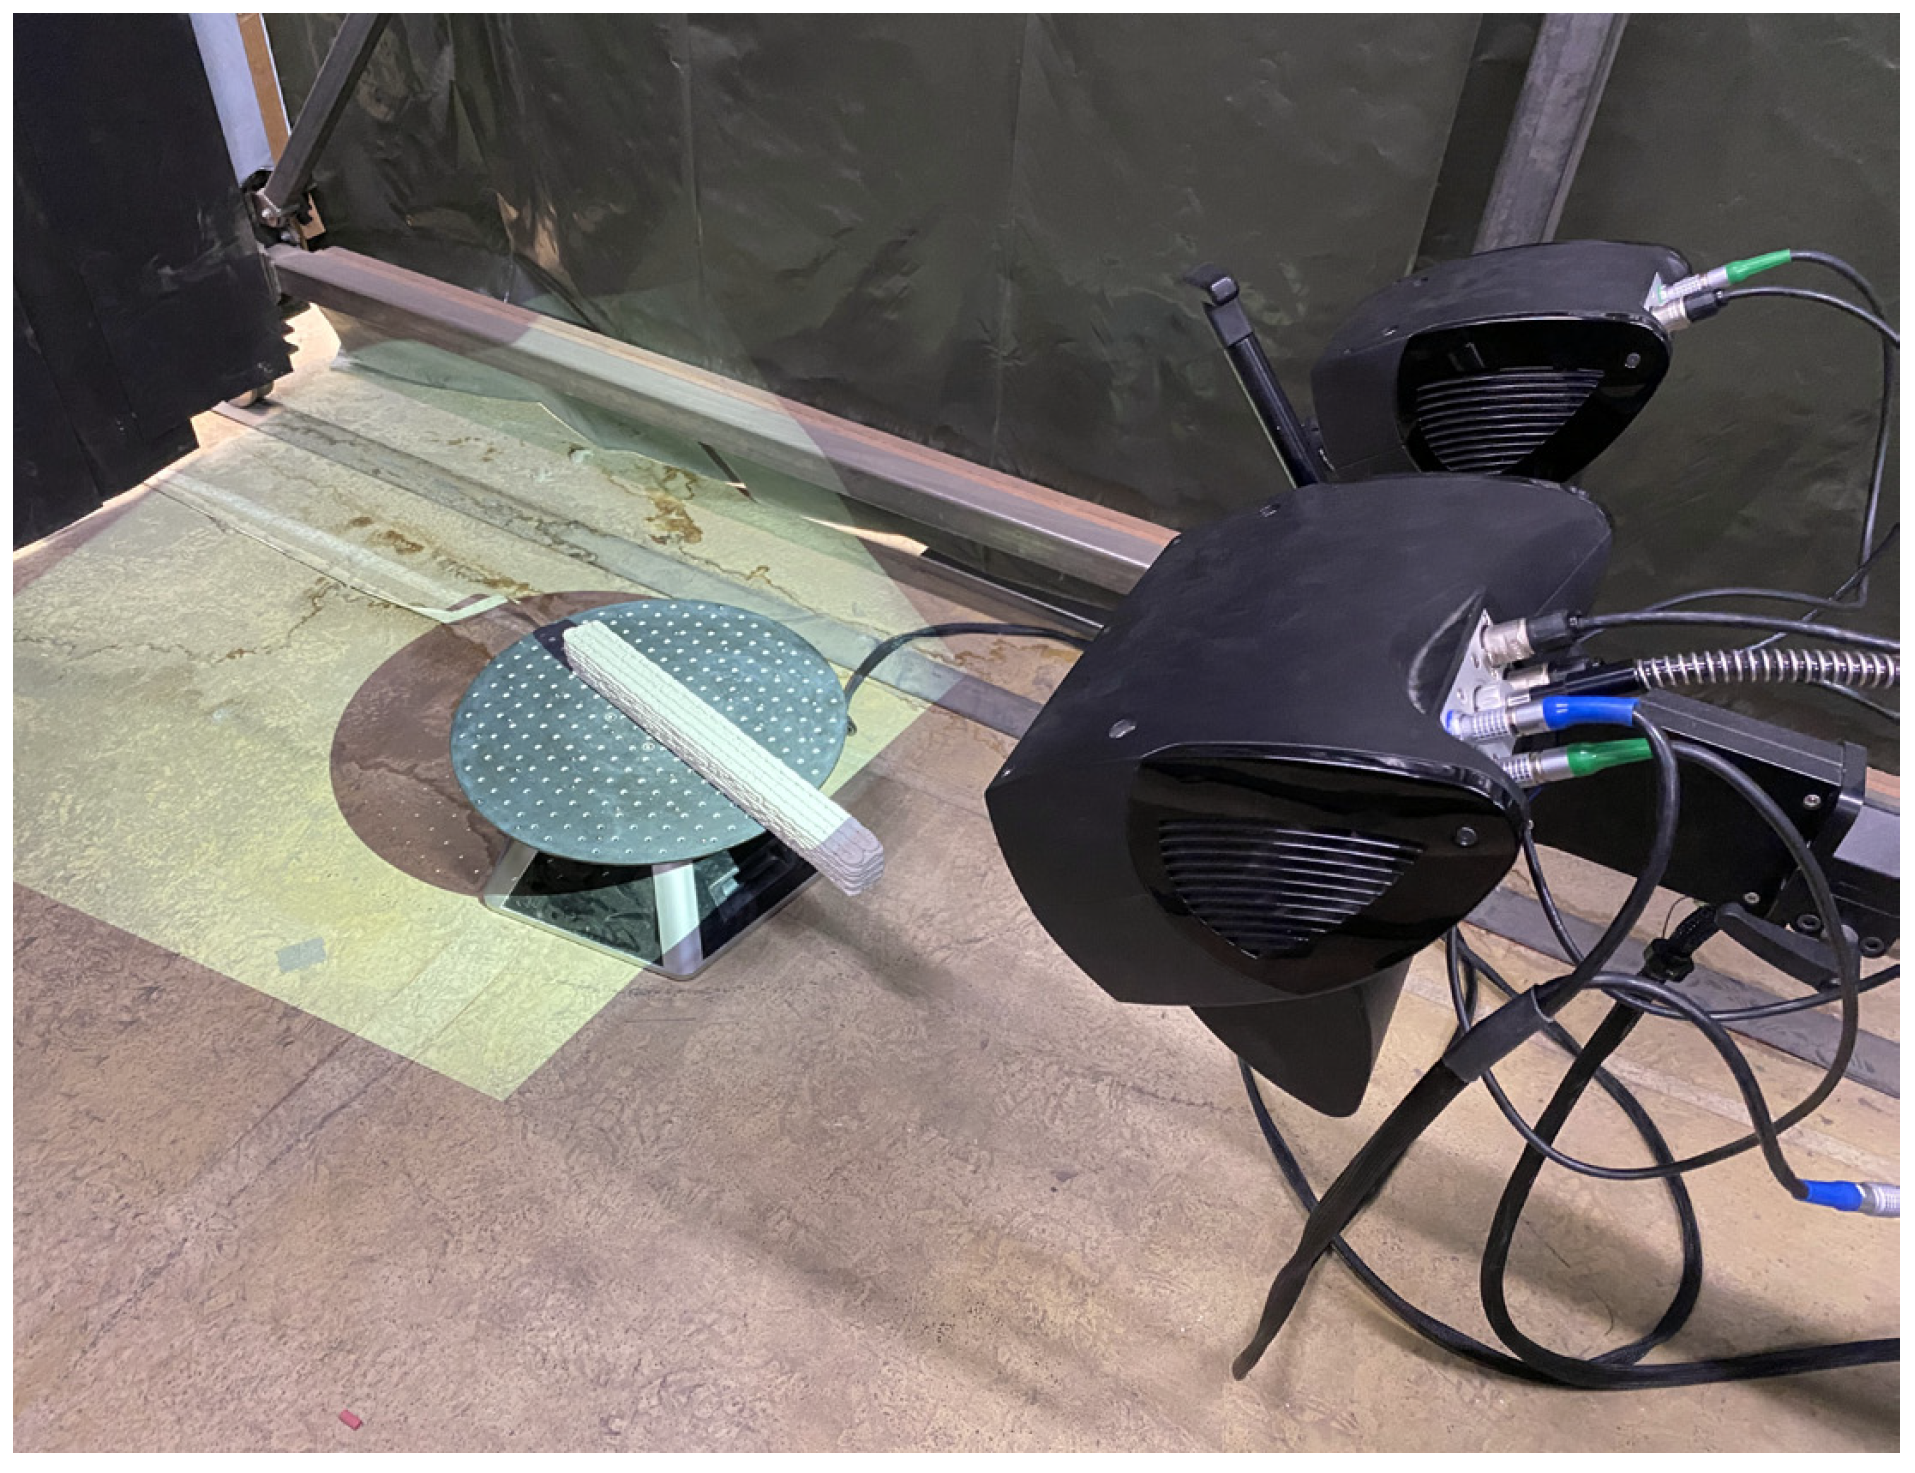
2.3. Experimental Setup
2.4. Optical Measurements
2.4.1. Geometric Surveying by Structured Light Scanning
2.4.2. Optical Deformation Measurements
3. Results
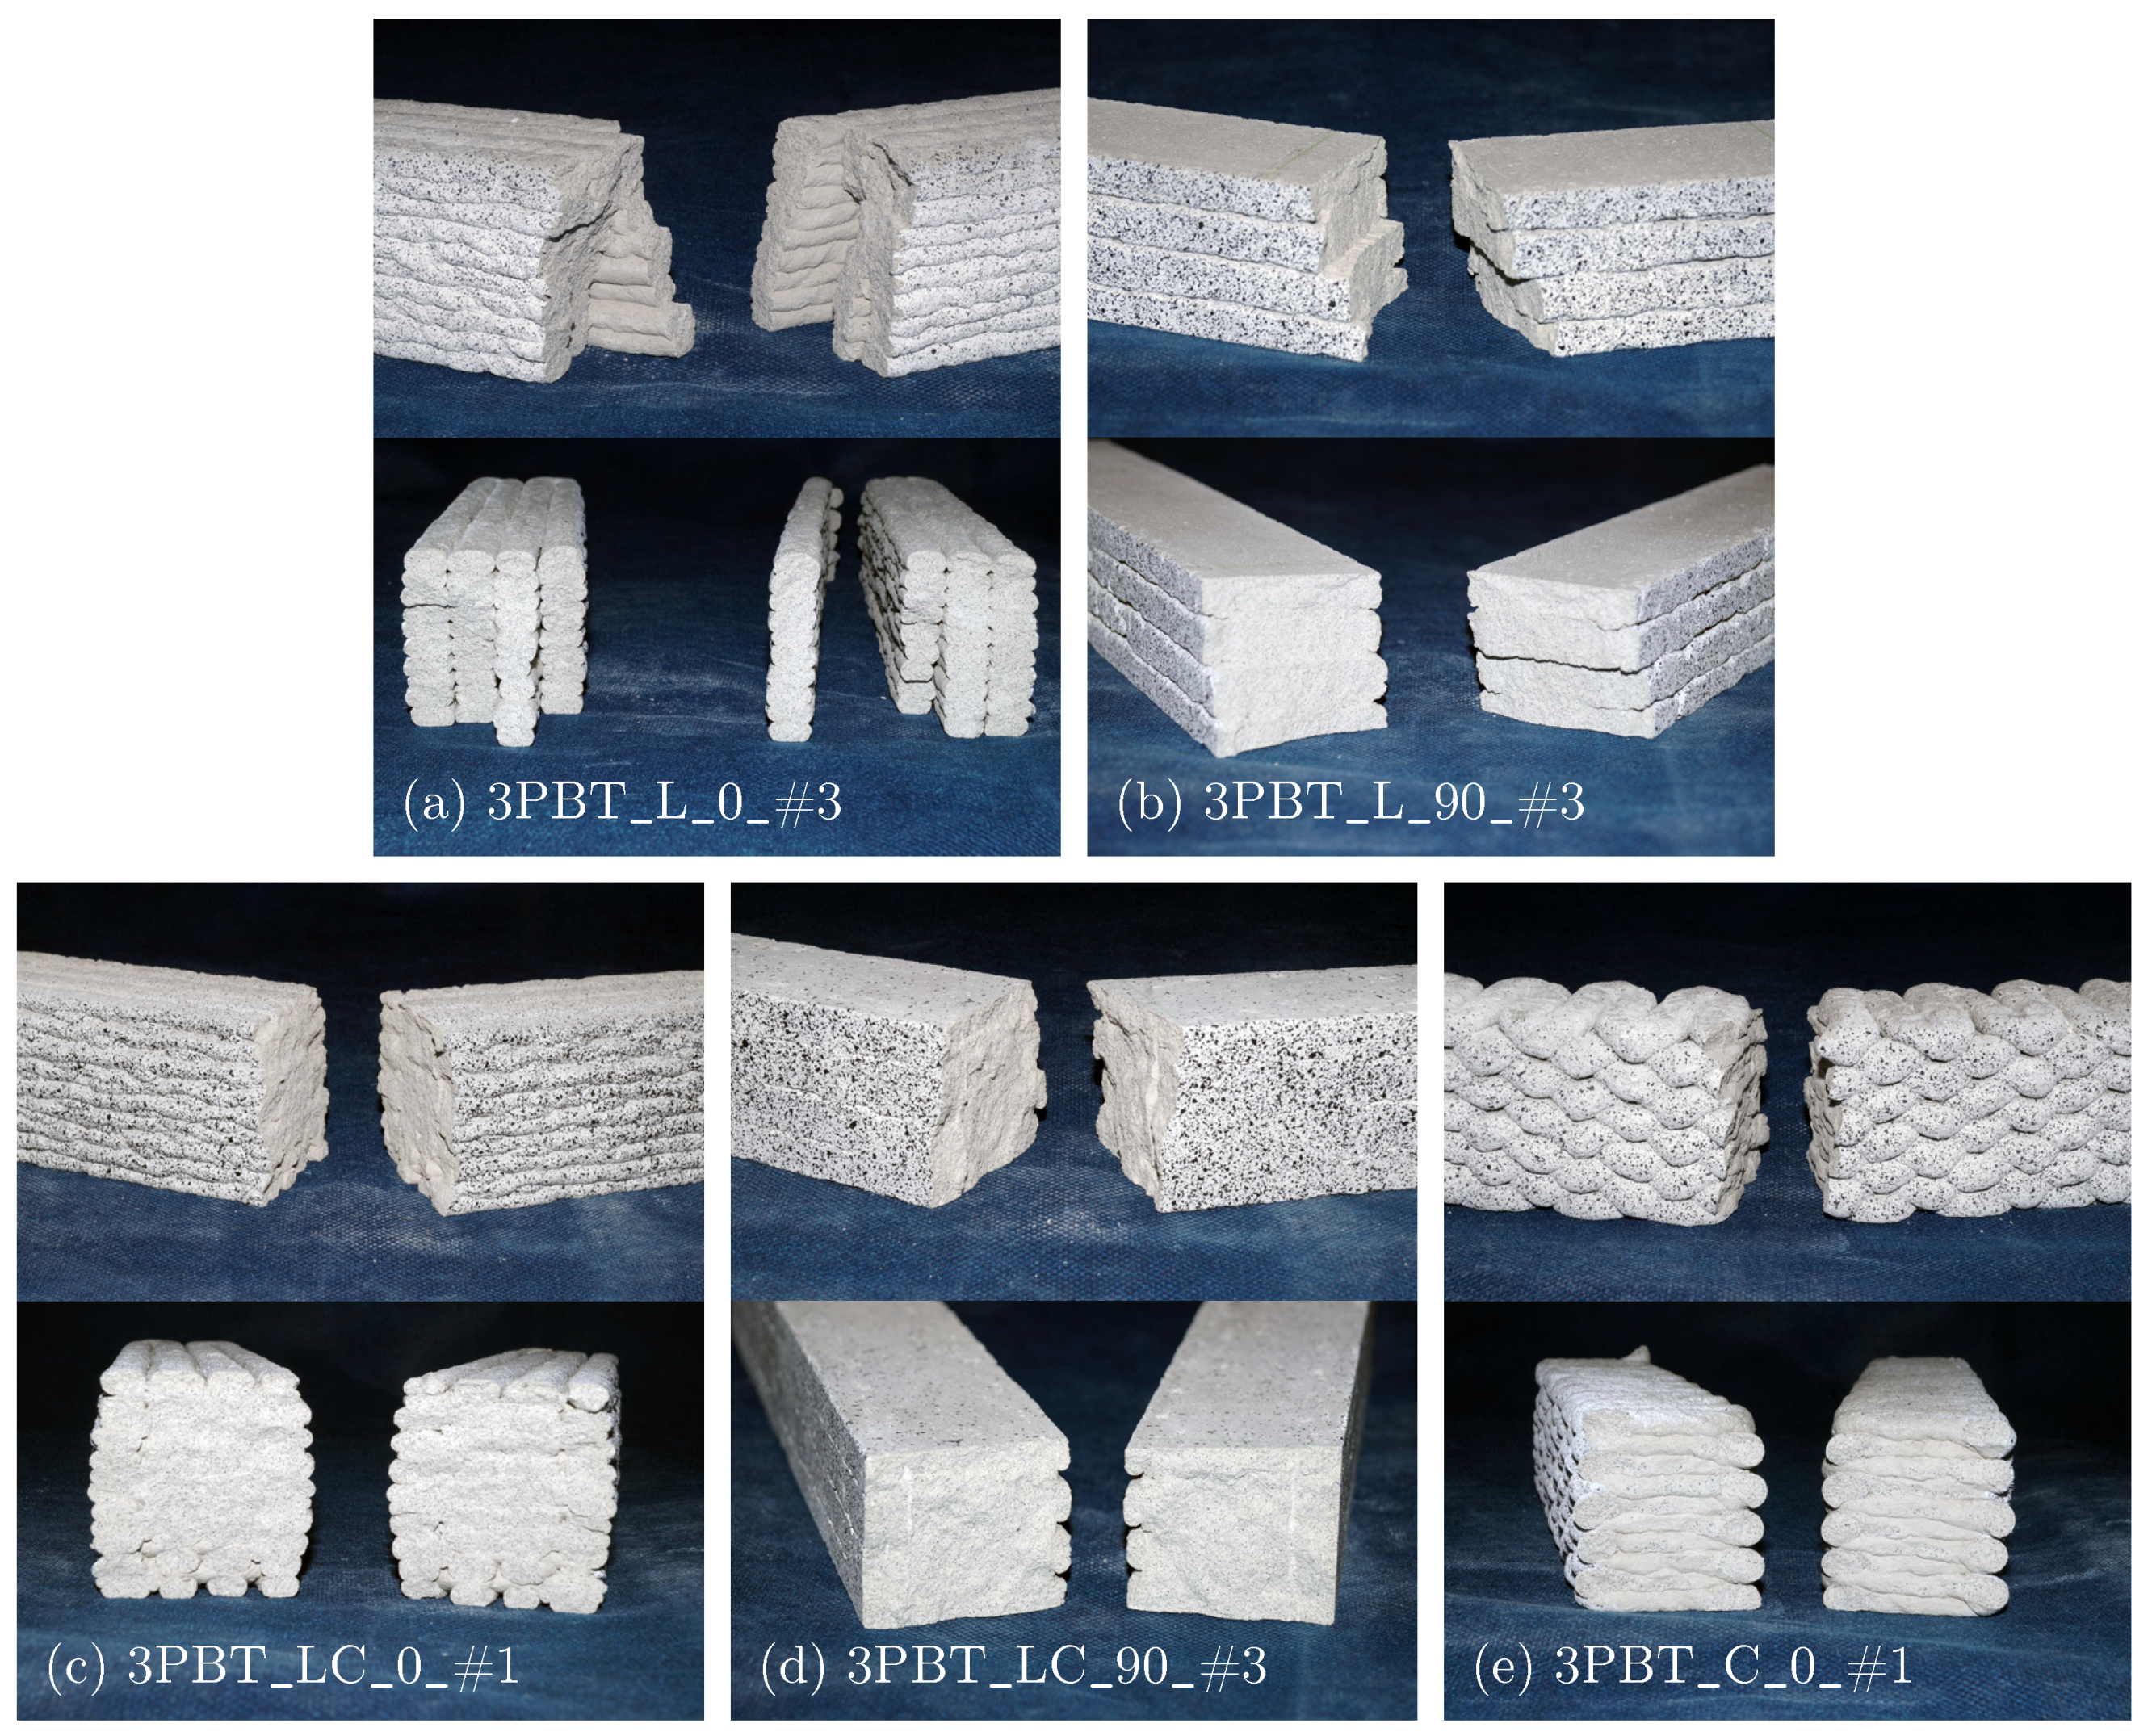
3.1. Three-Point Bending Test
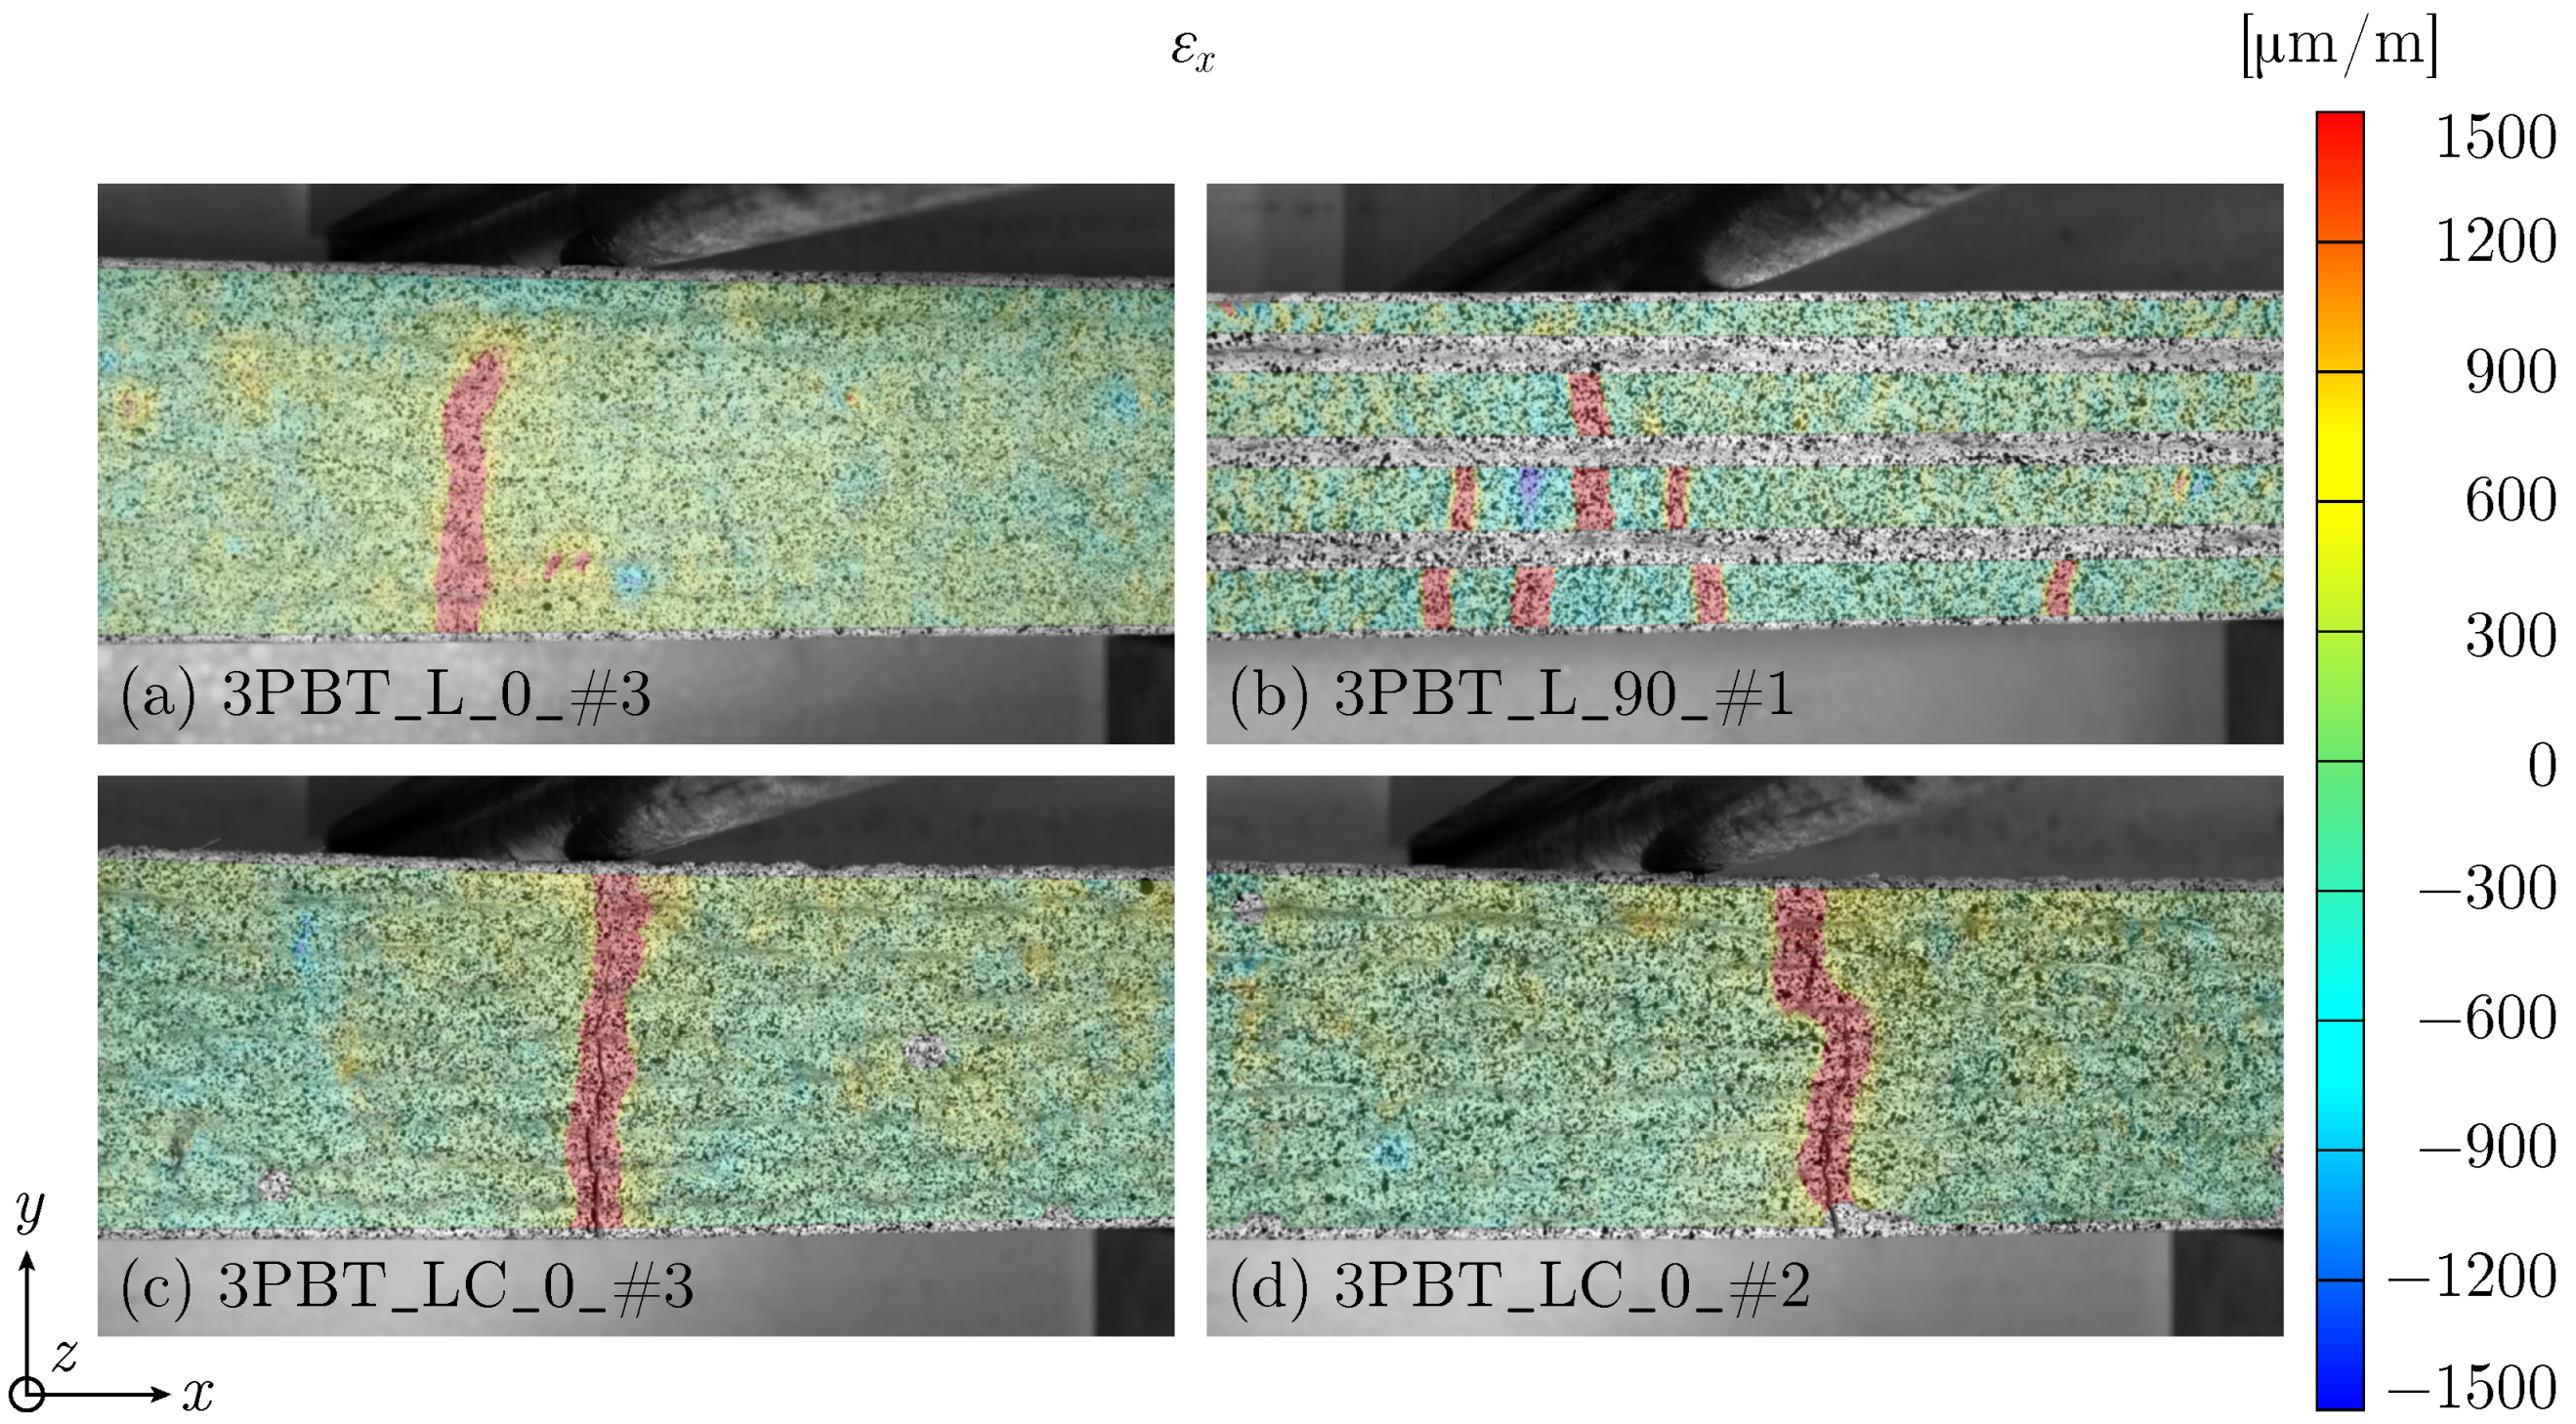
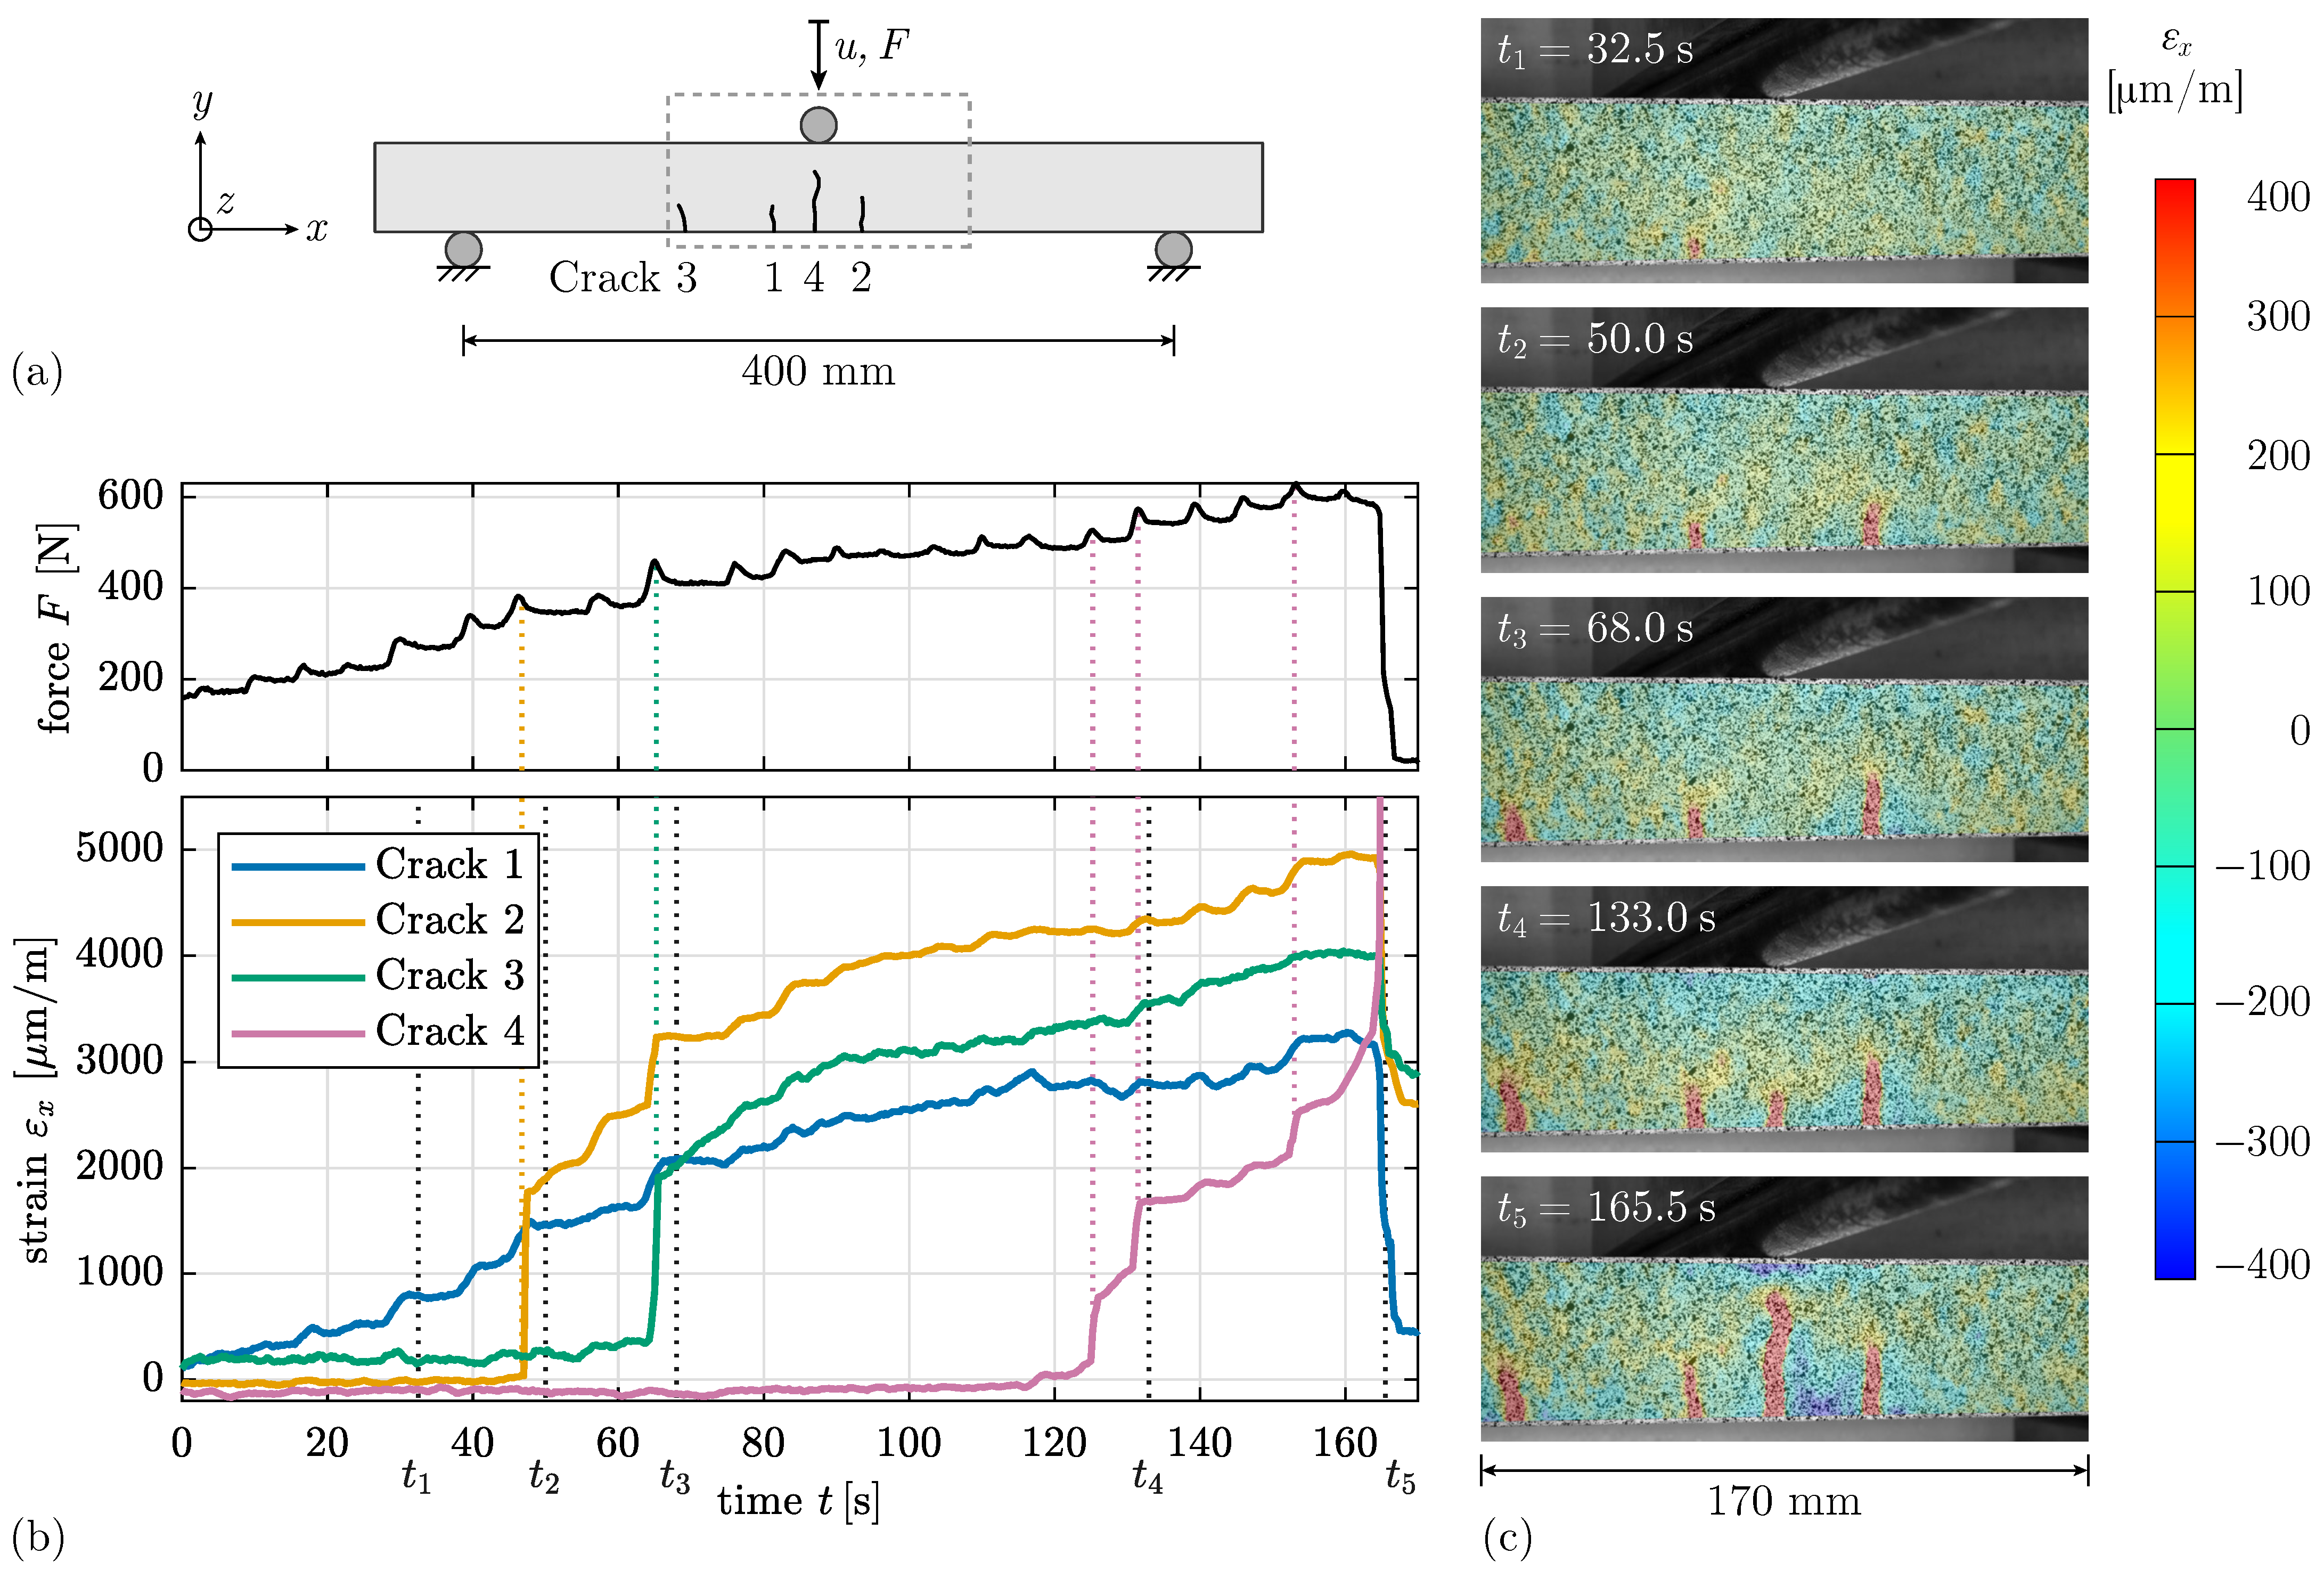
3.1.1. Failure Mechanisms
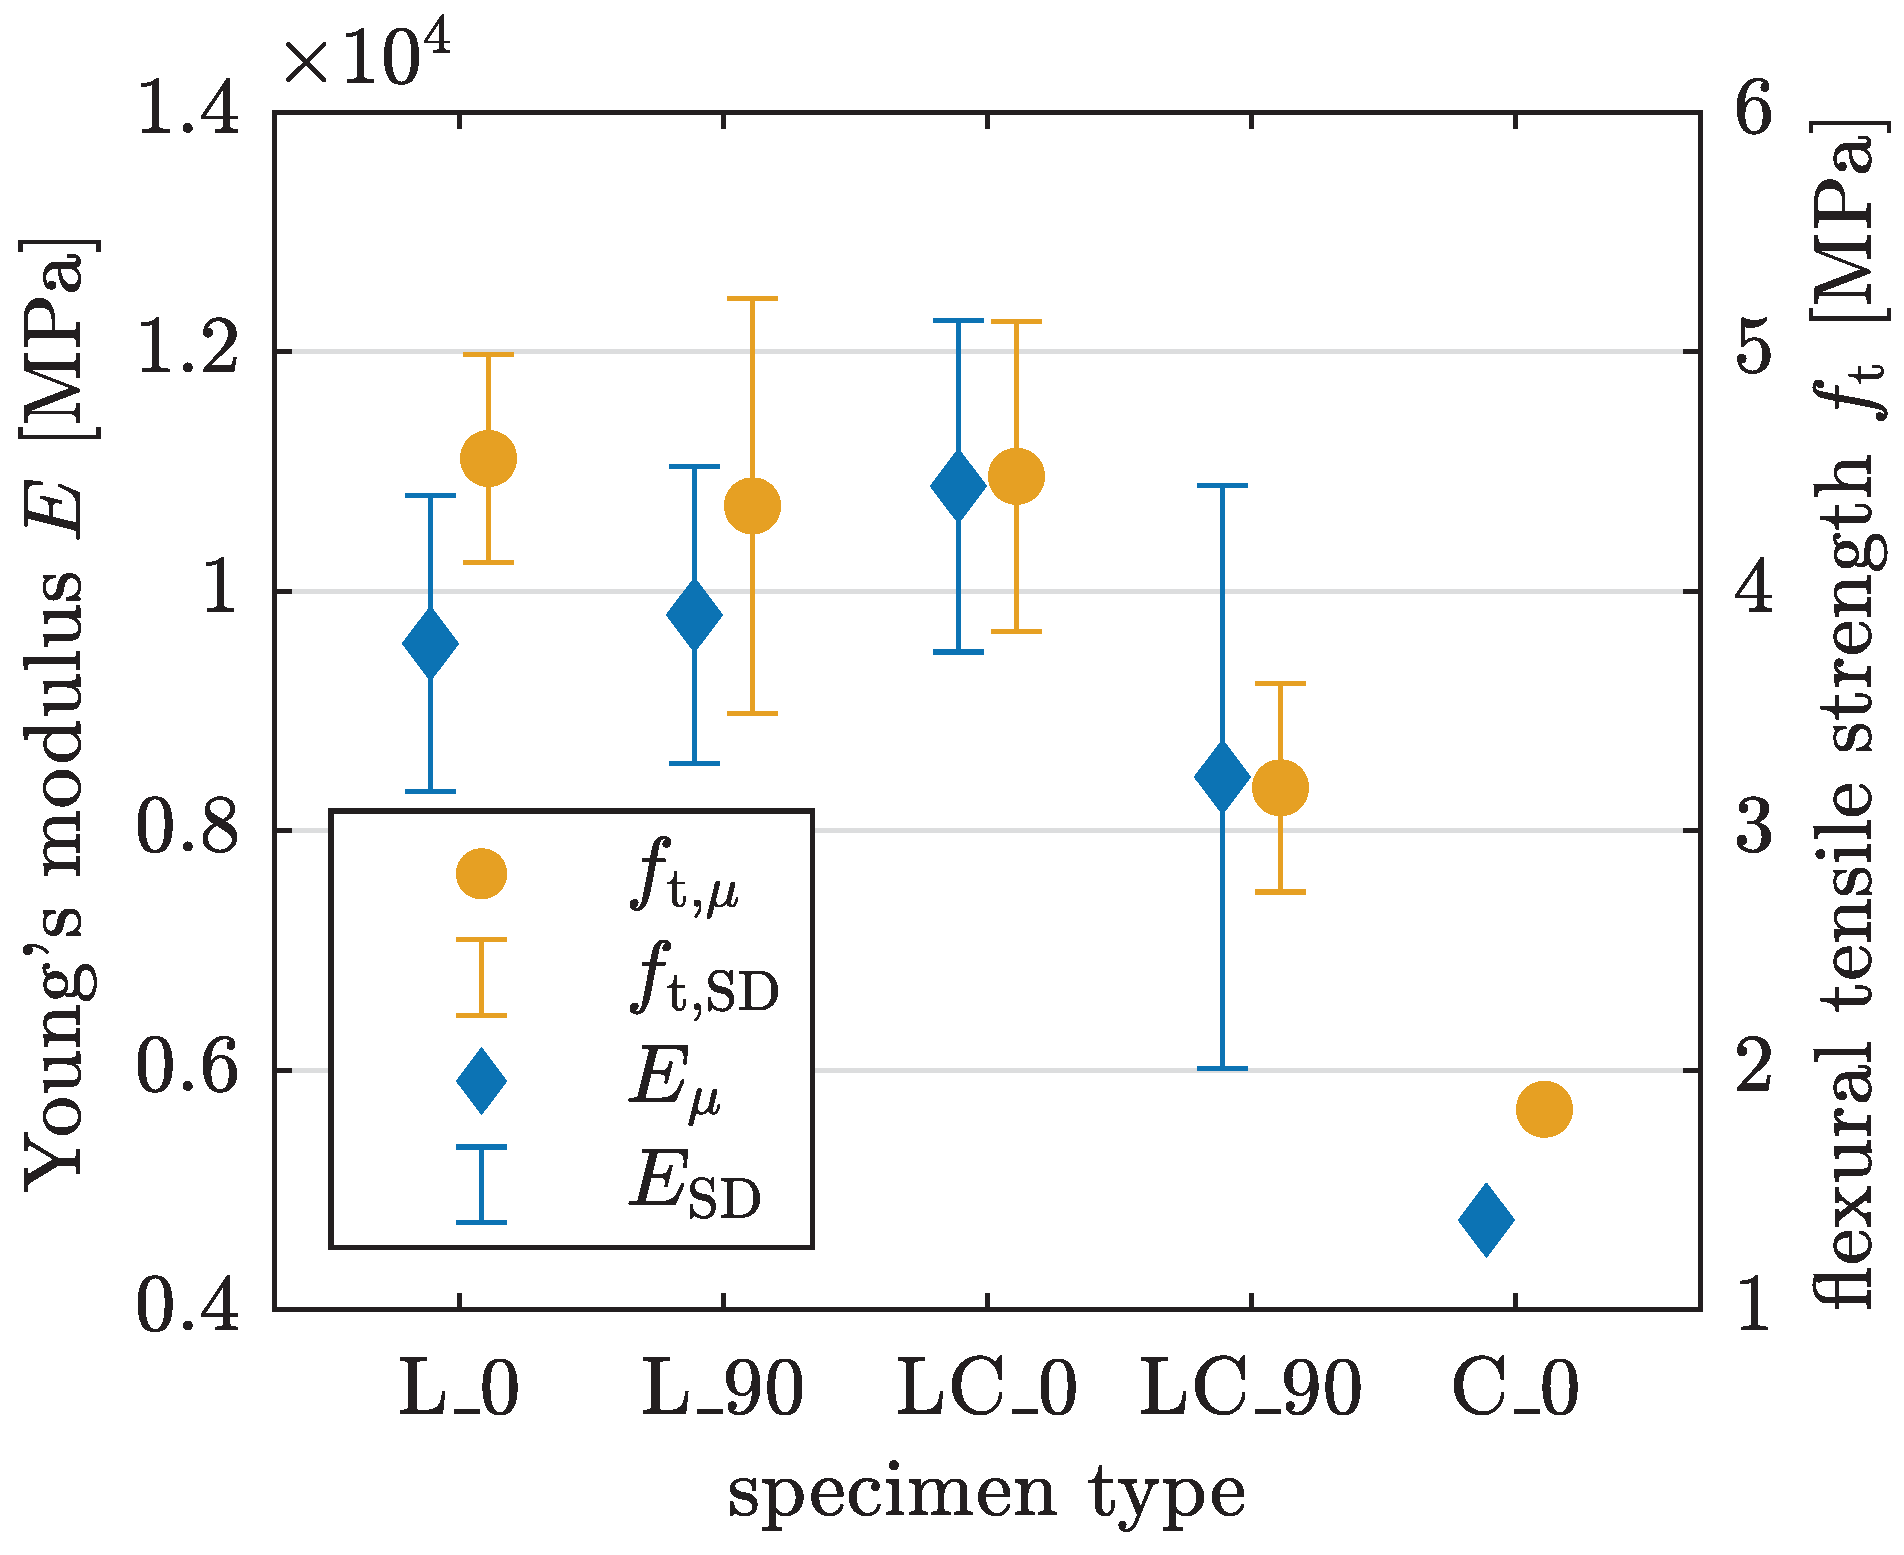
3.1.2. Material Properties
3.2. Uniaxial Compression Test
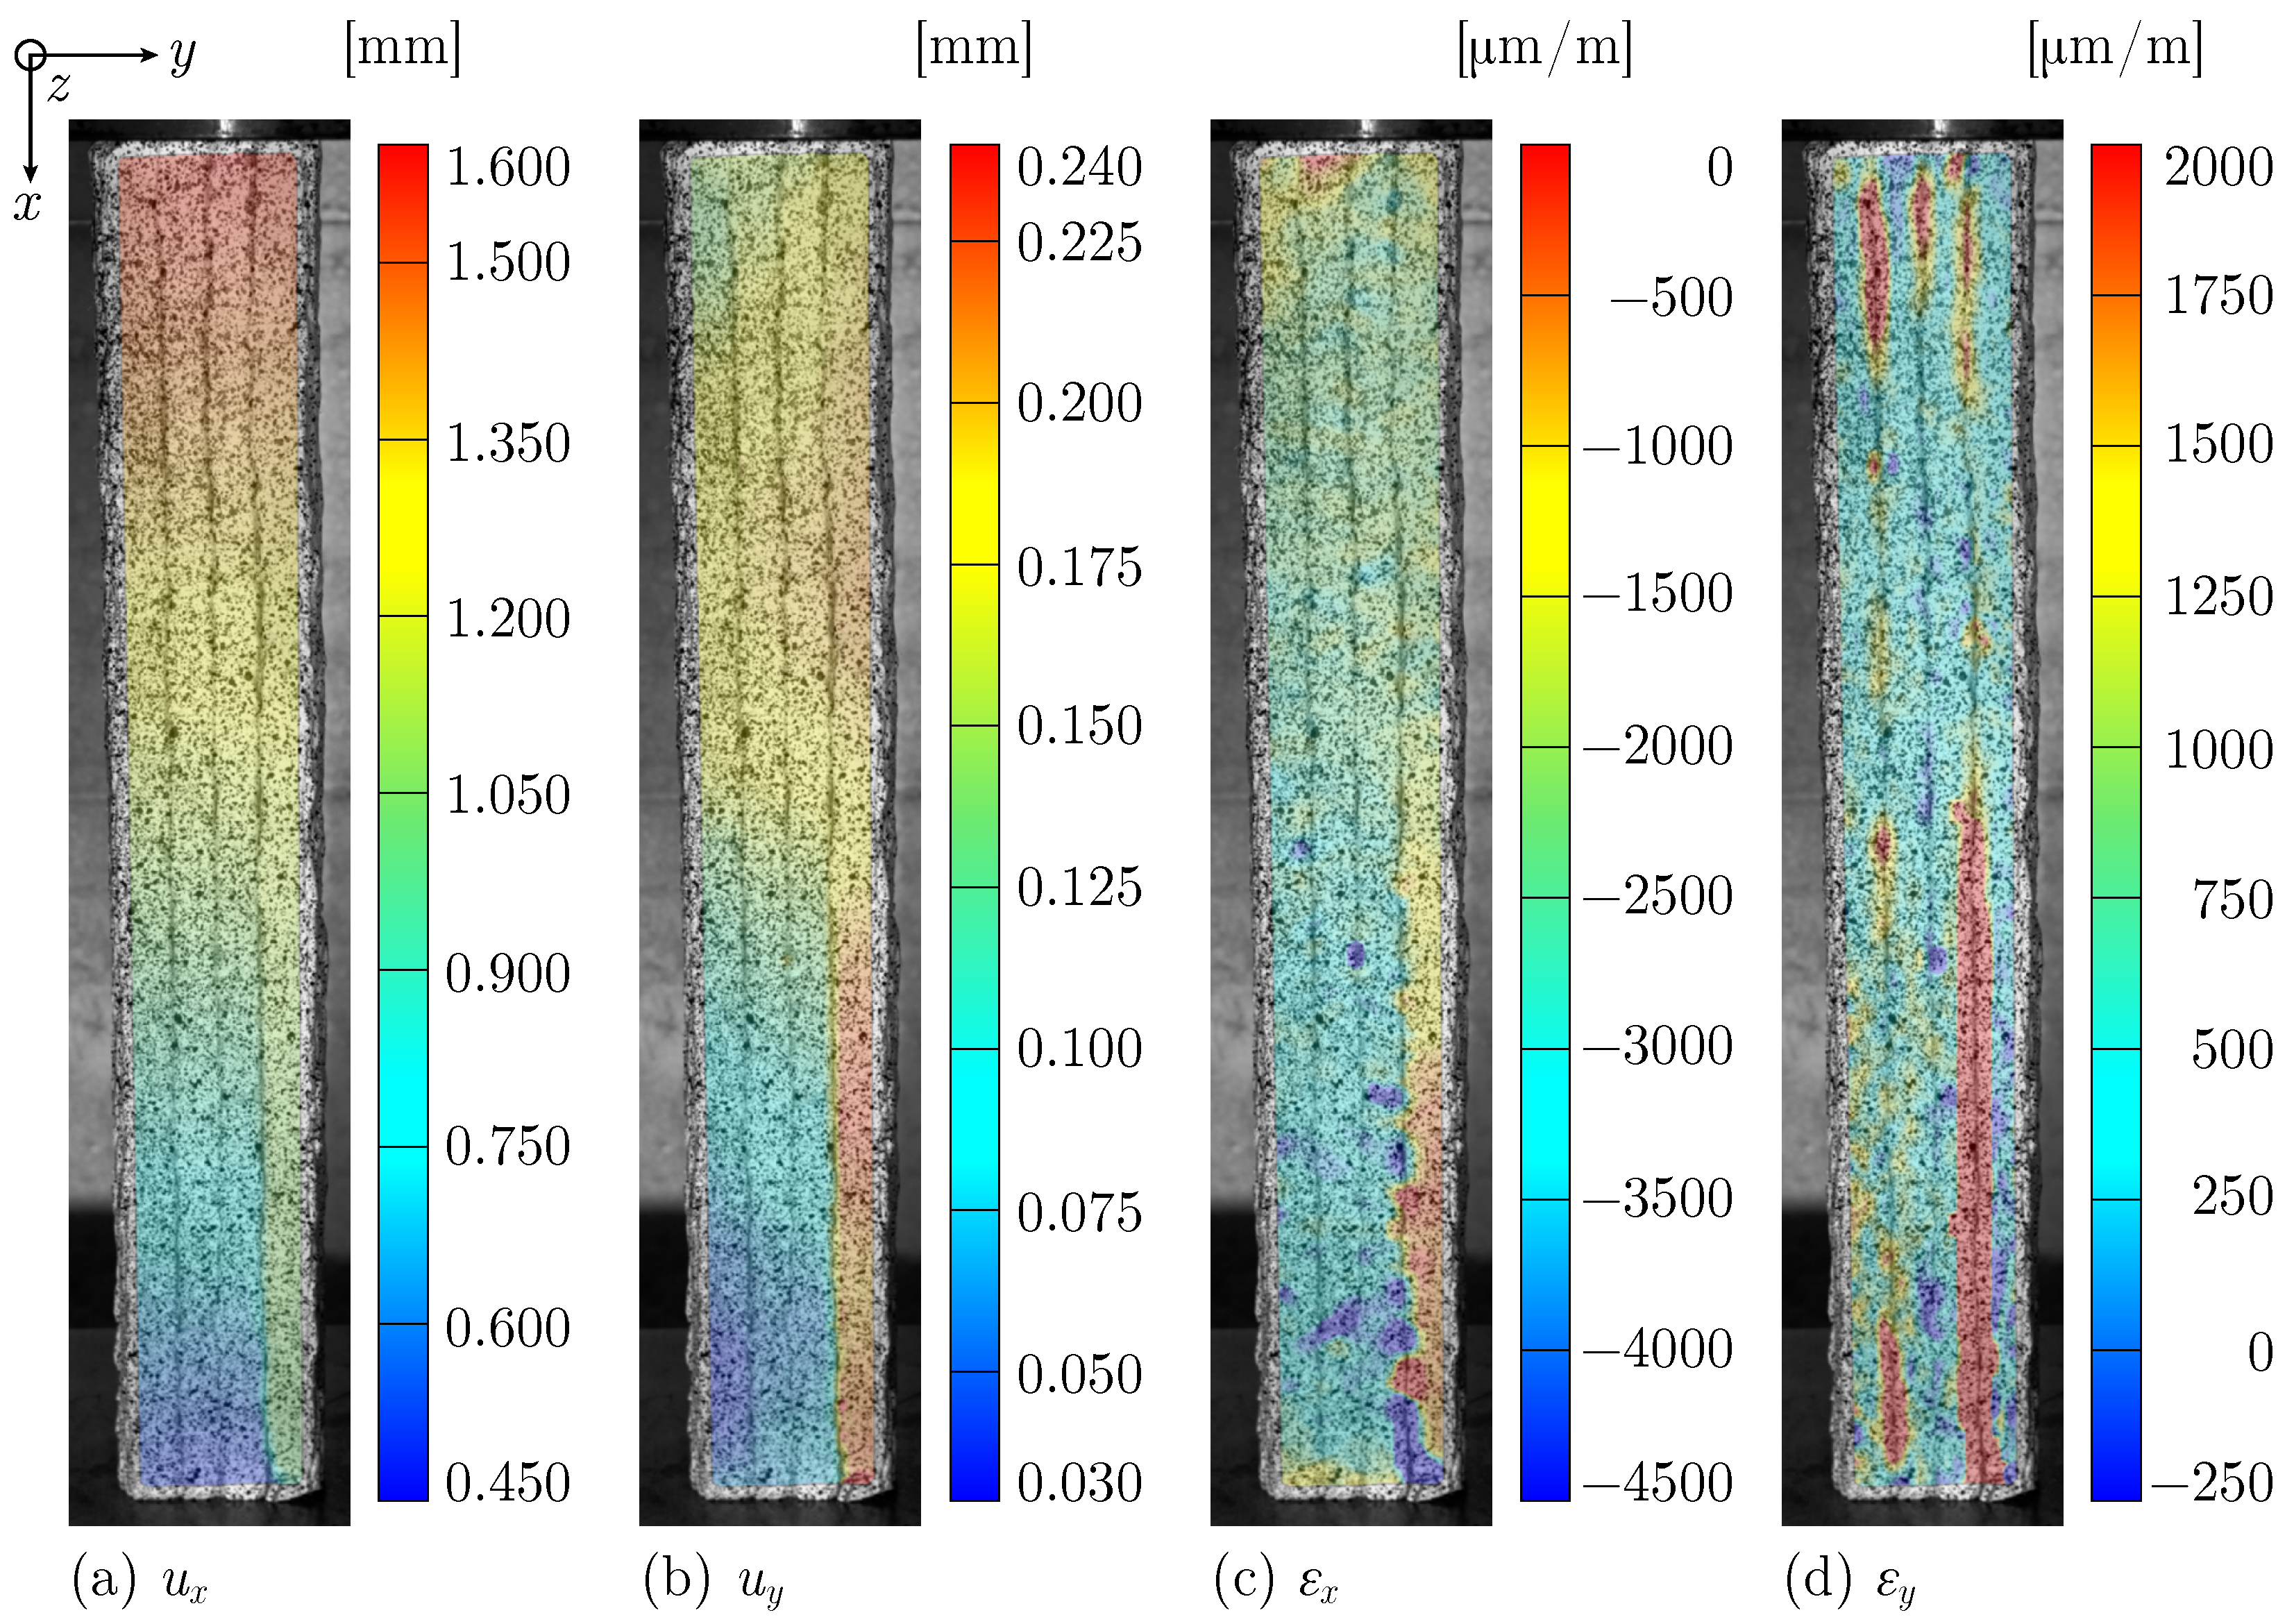
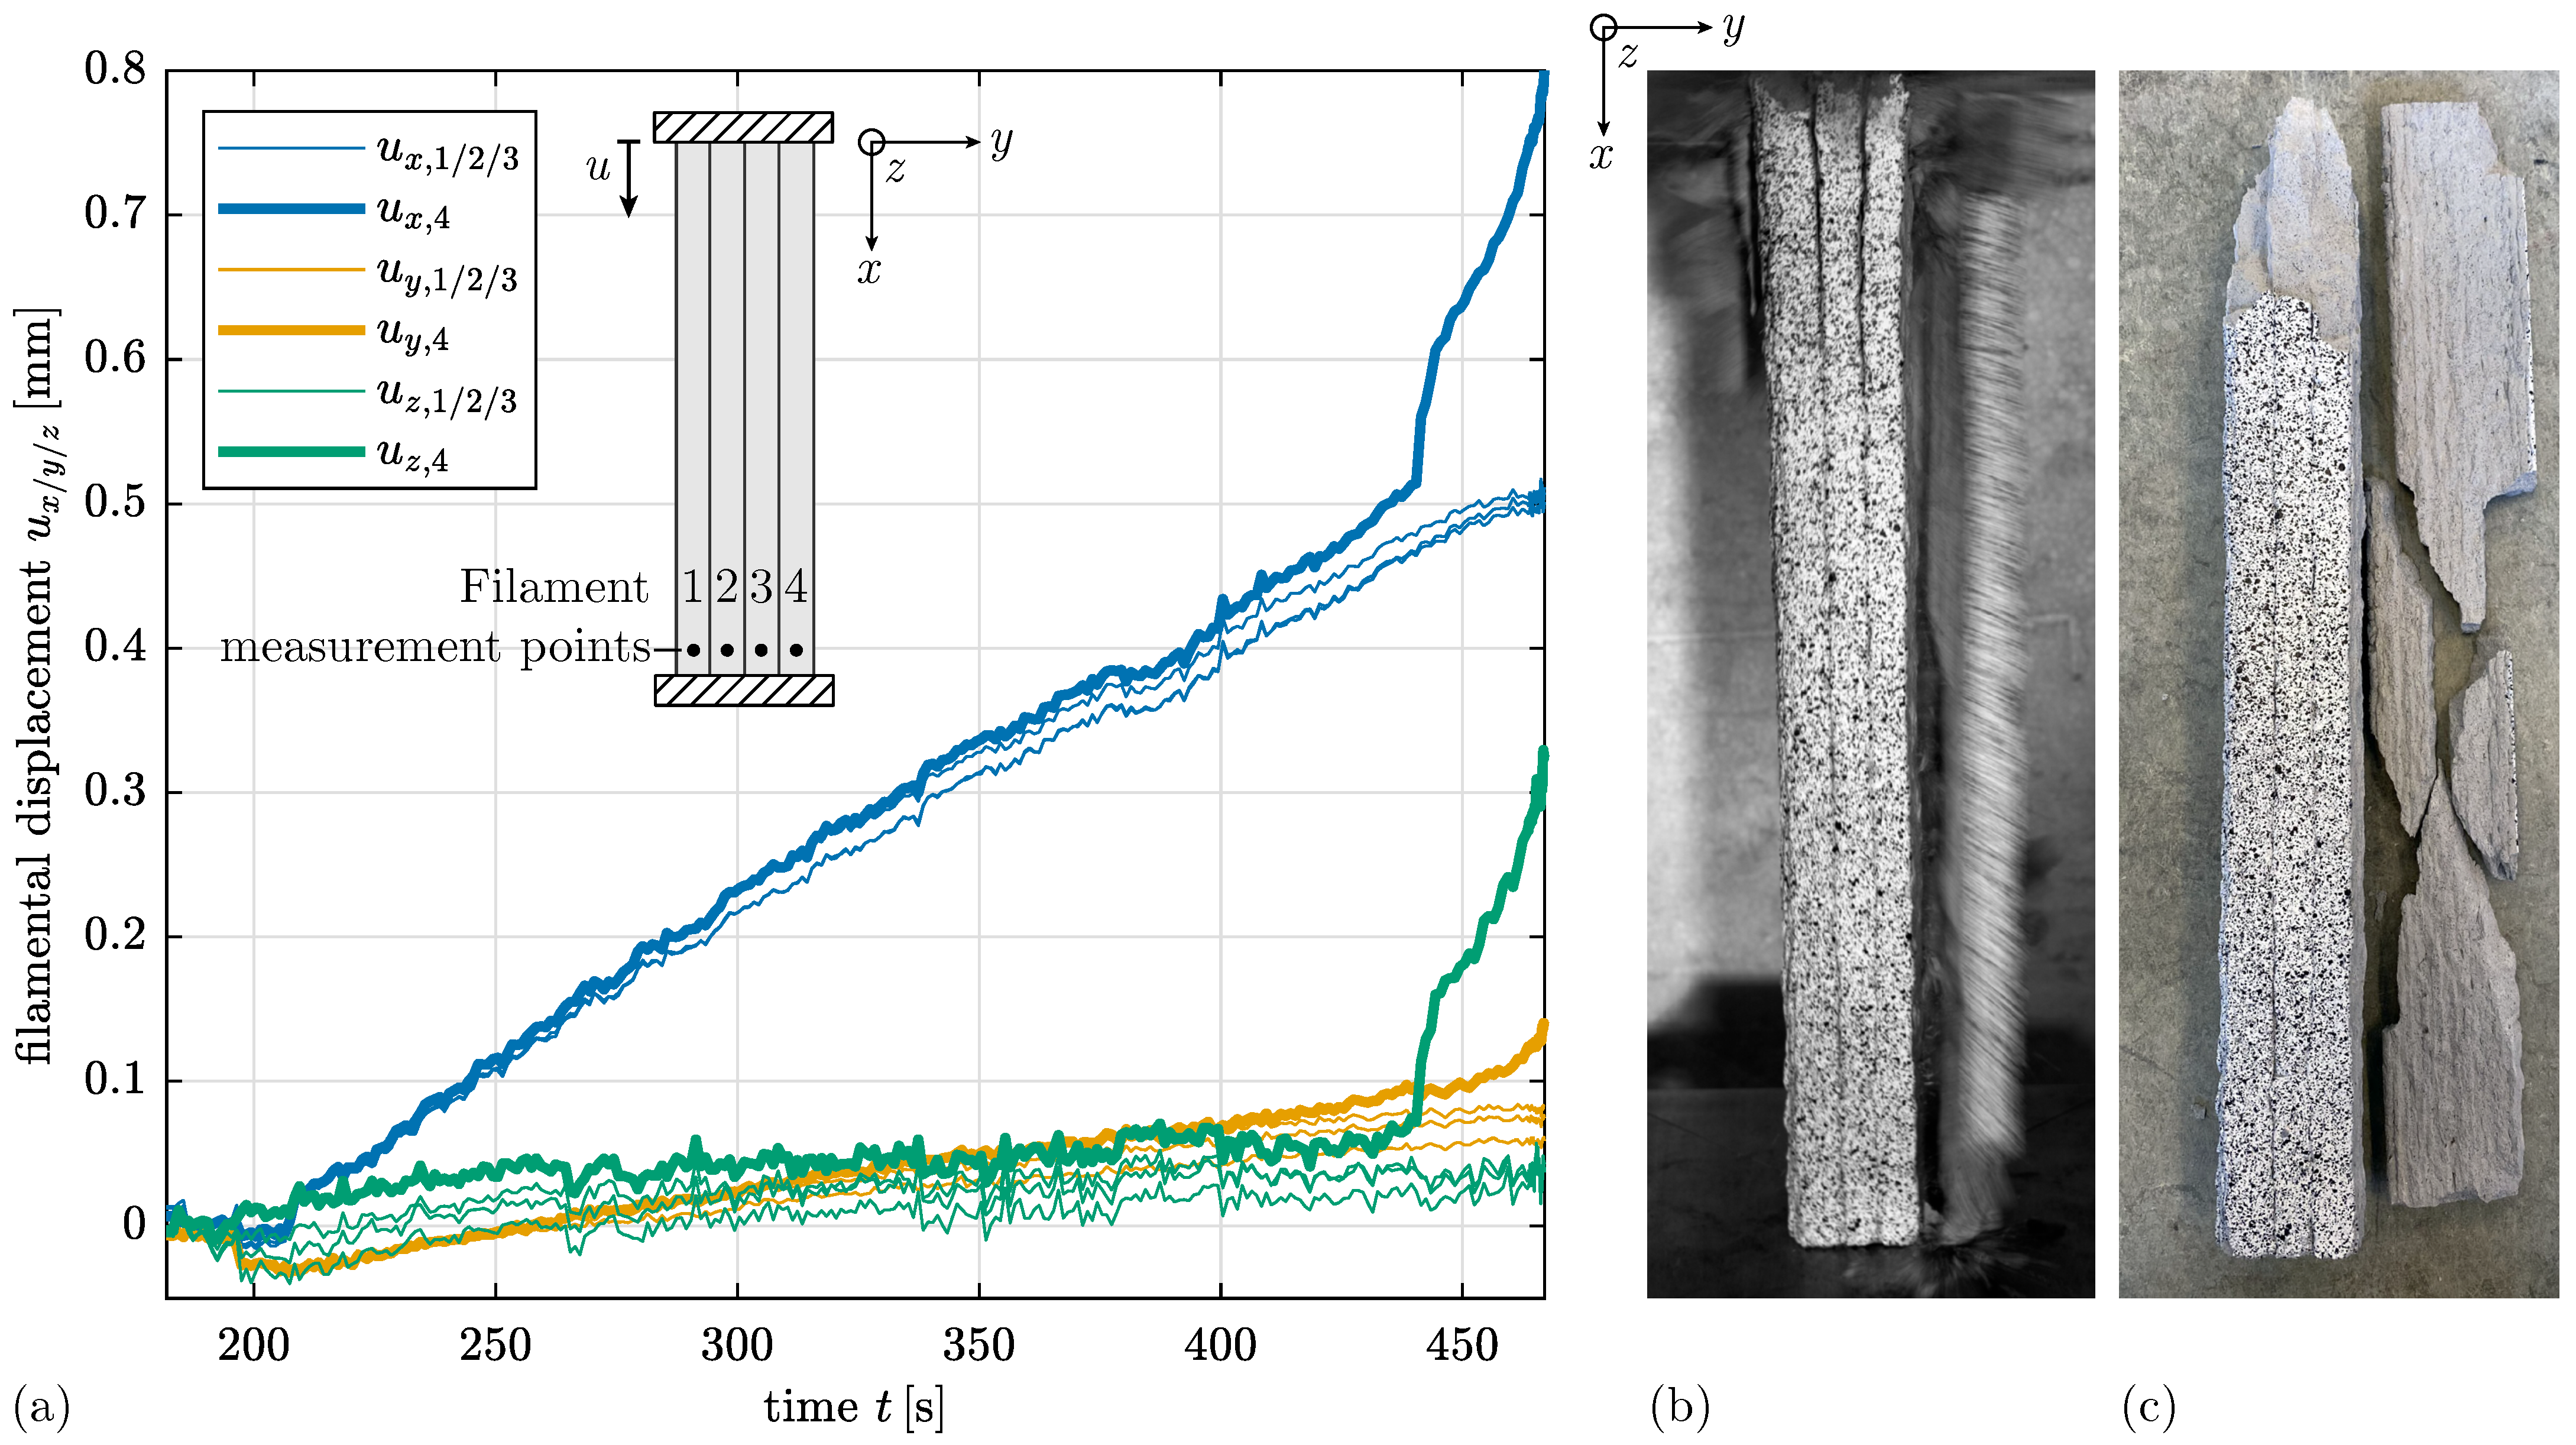
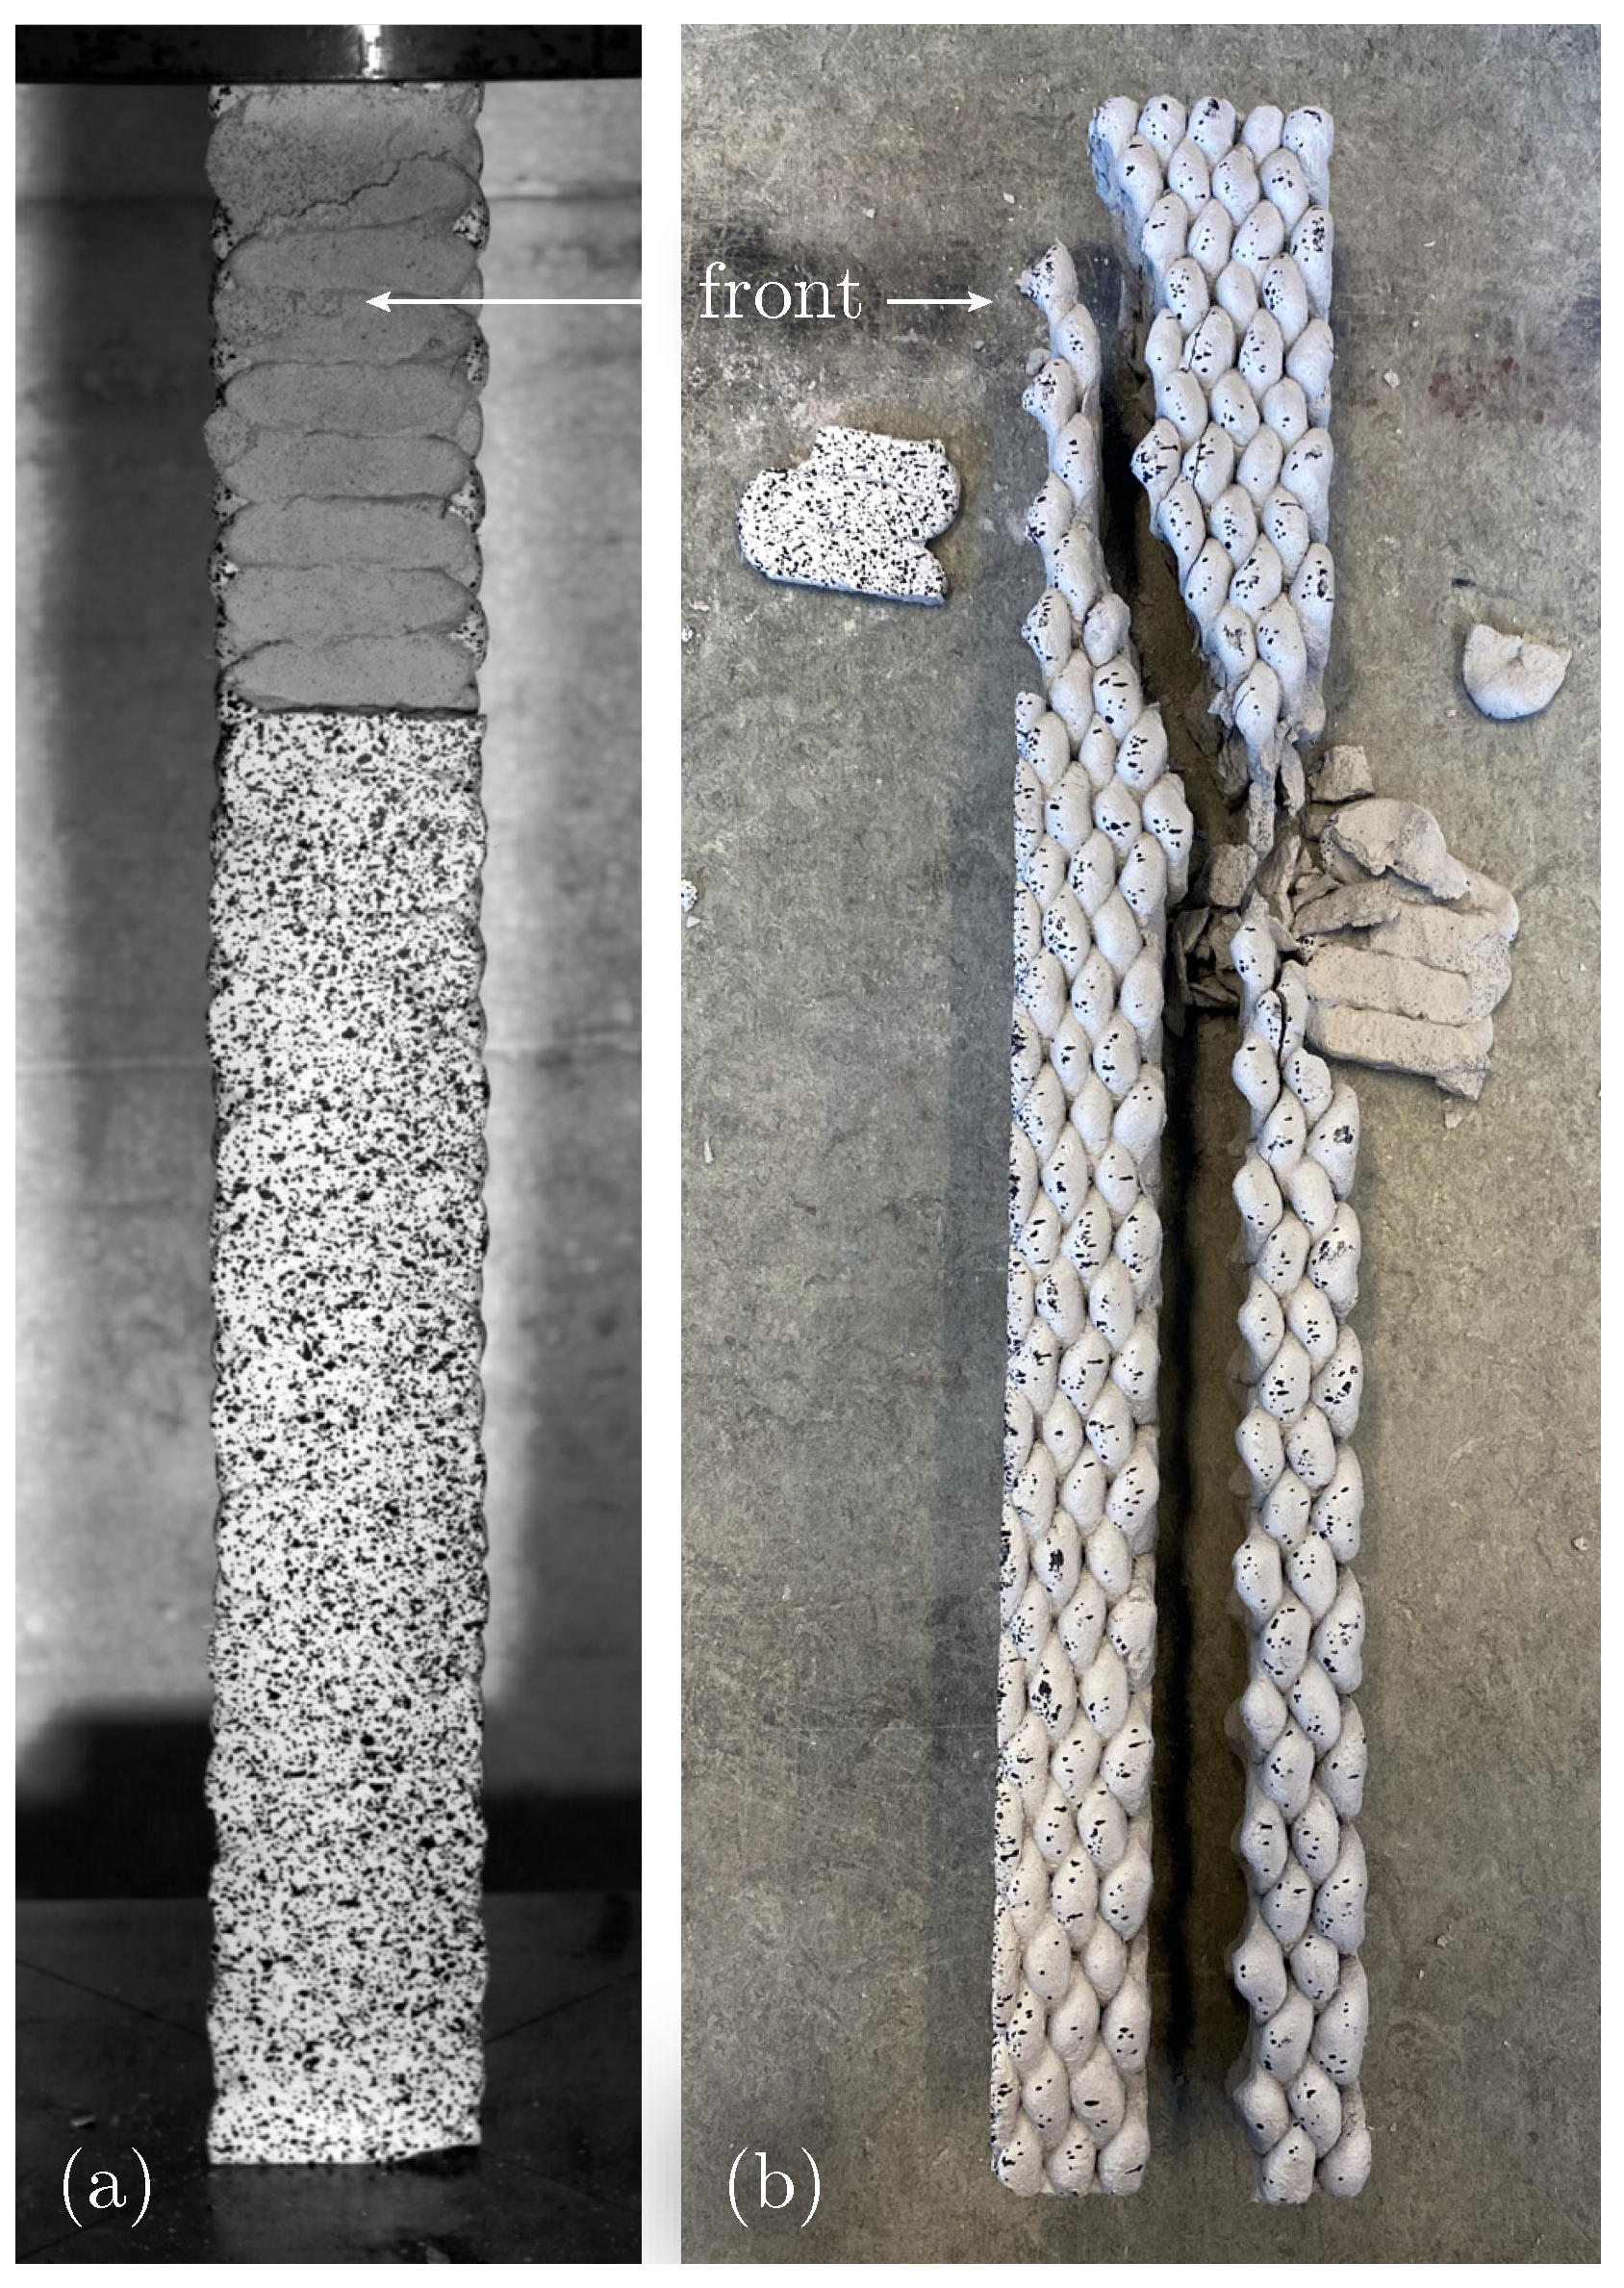
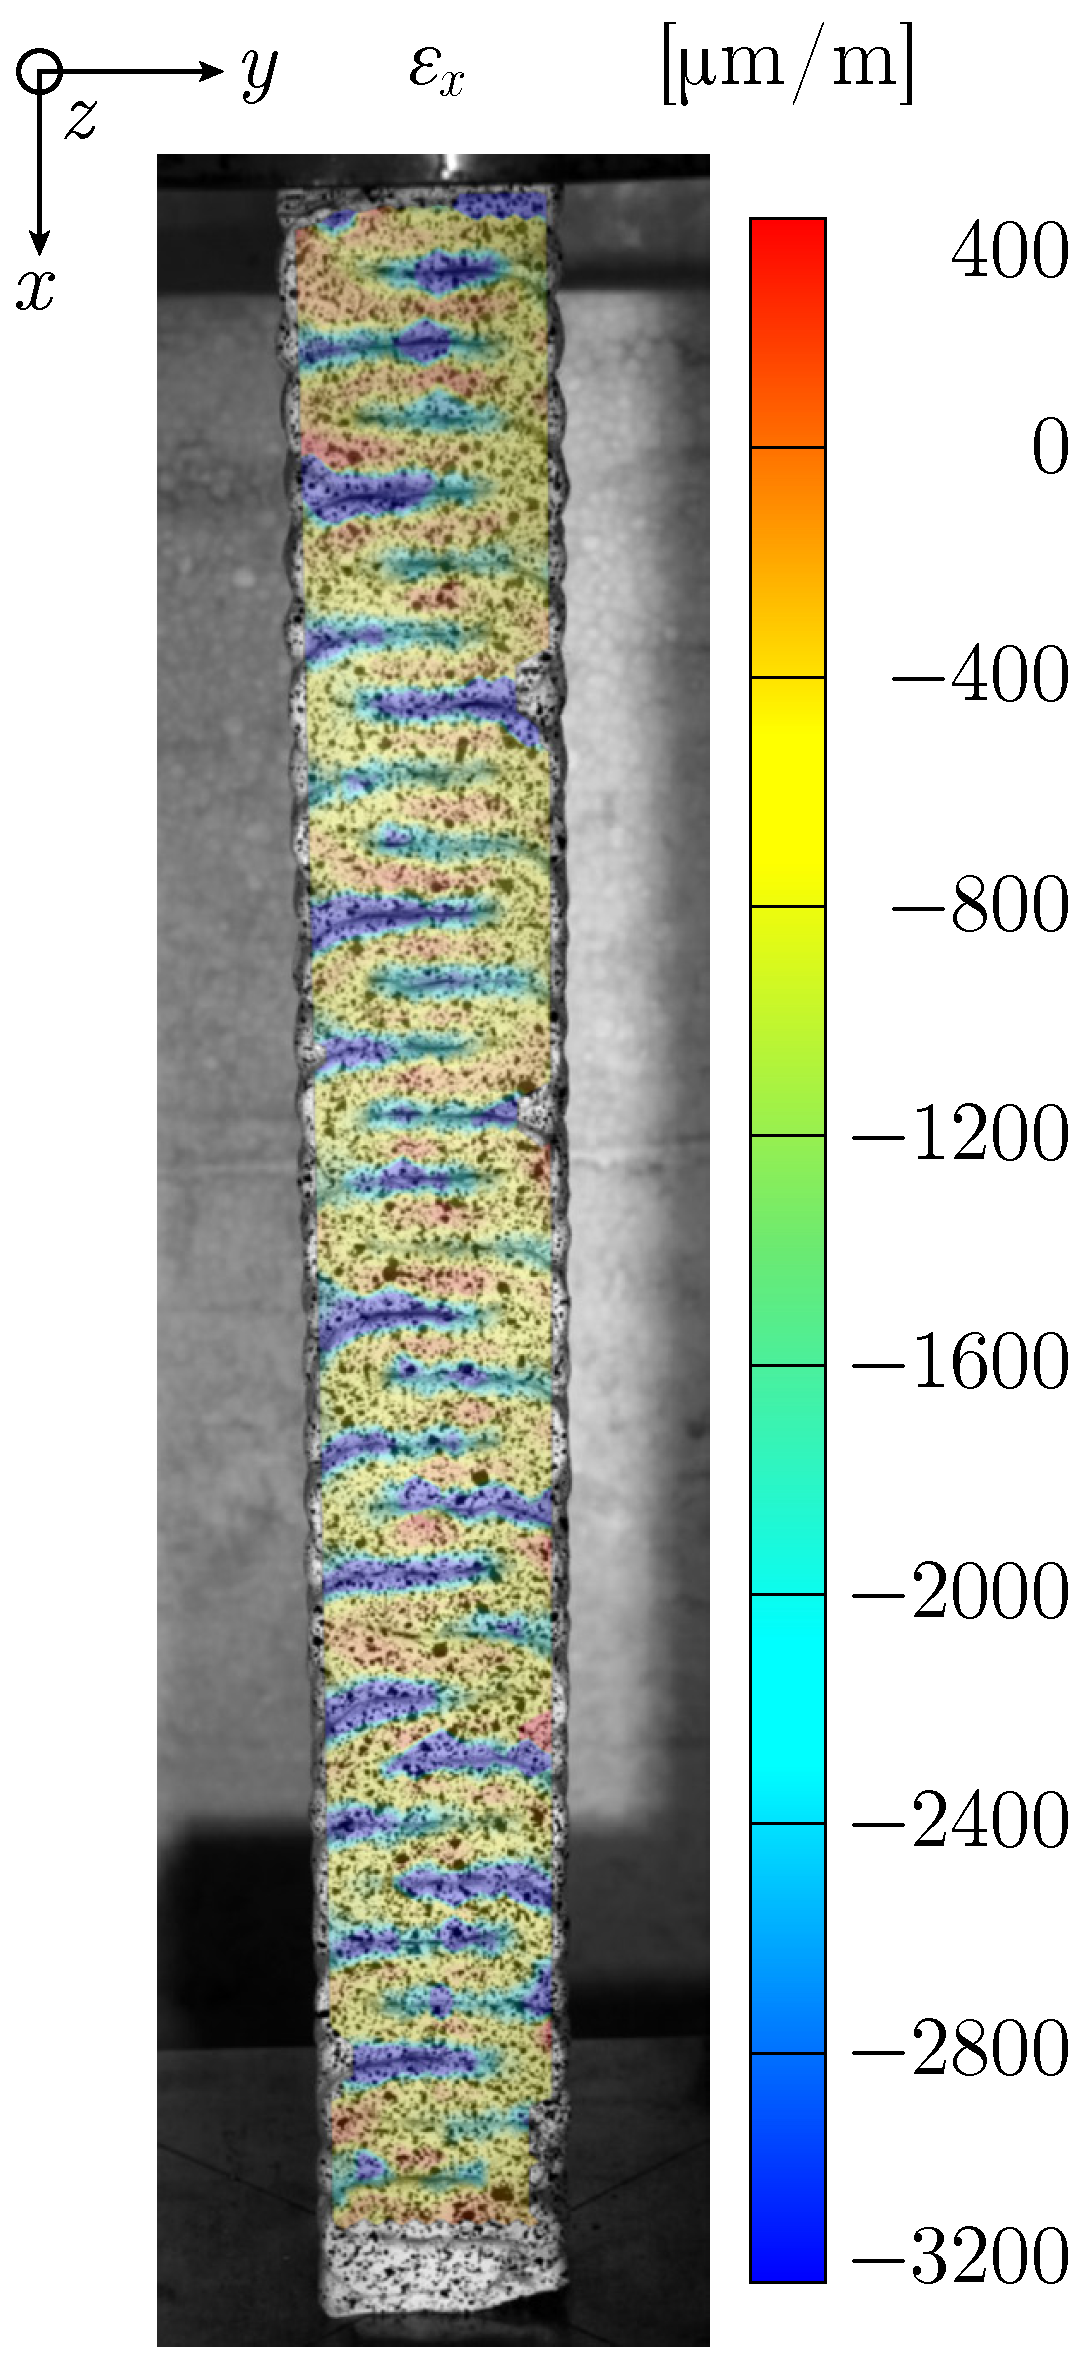
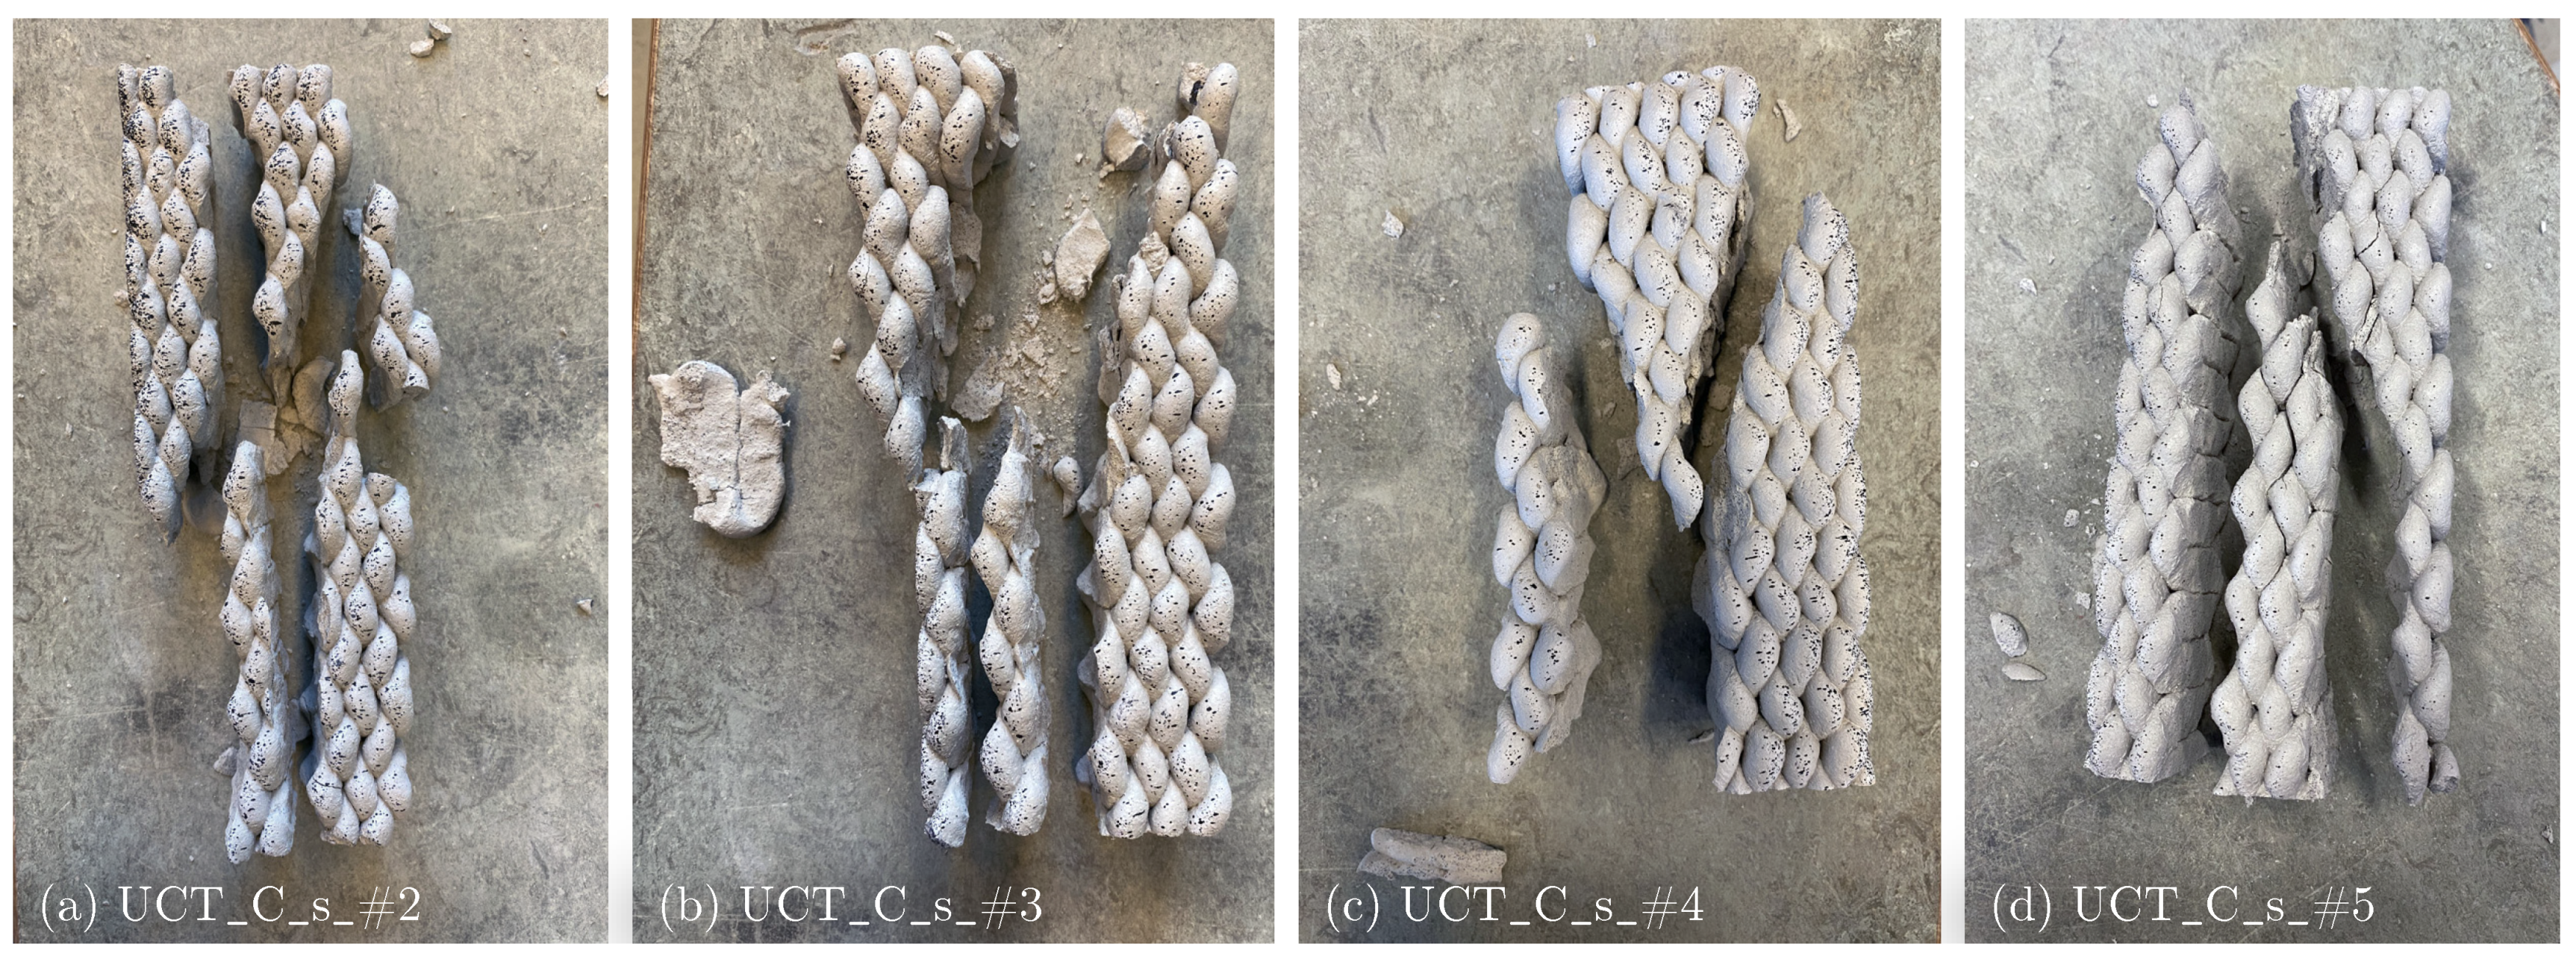
3.2.1. Failure Mechanisms
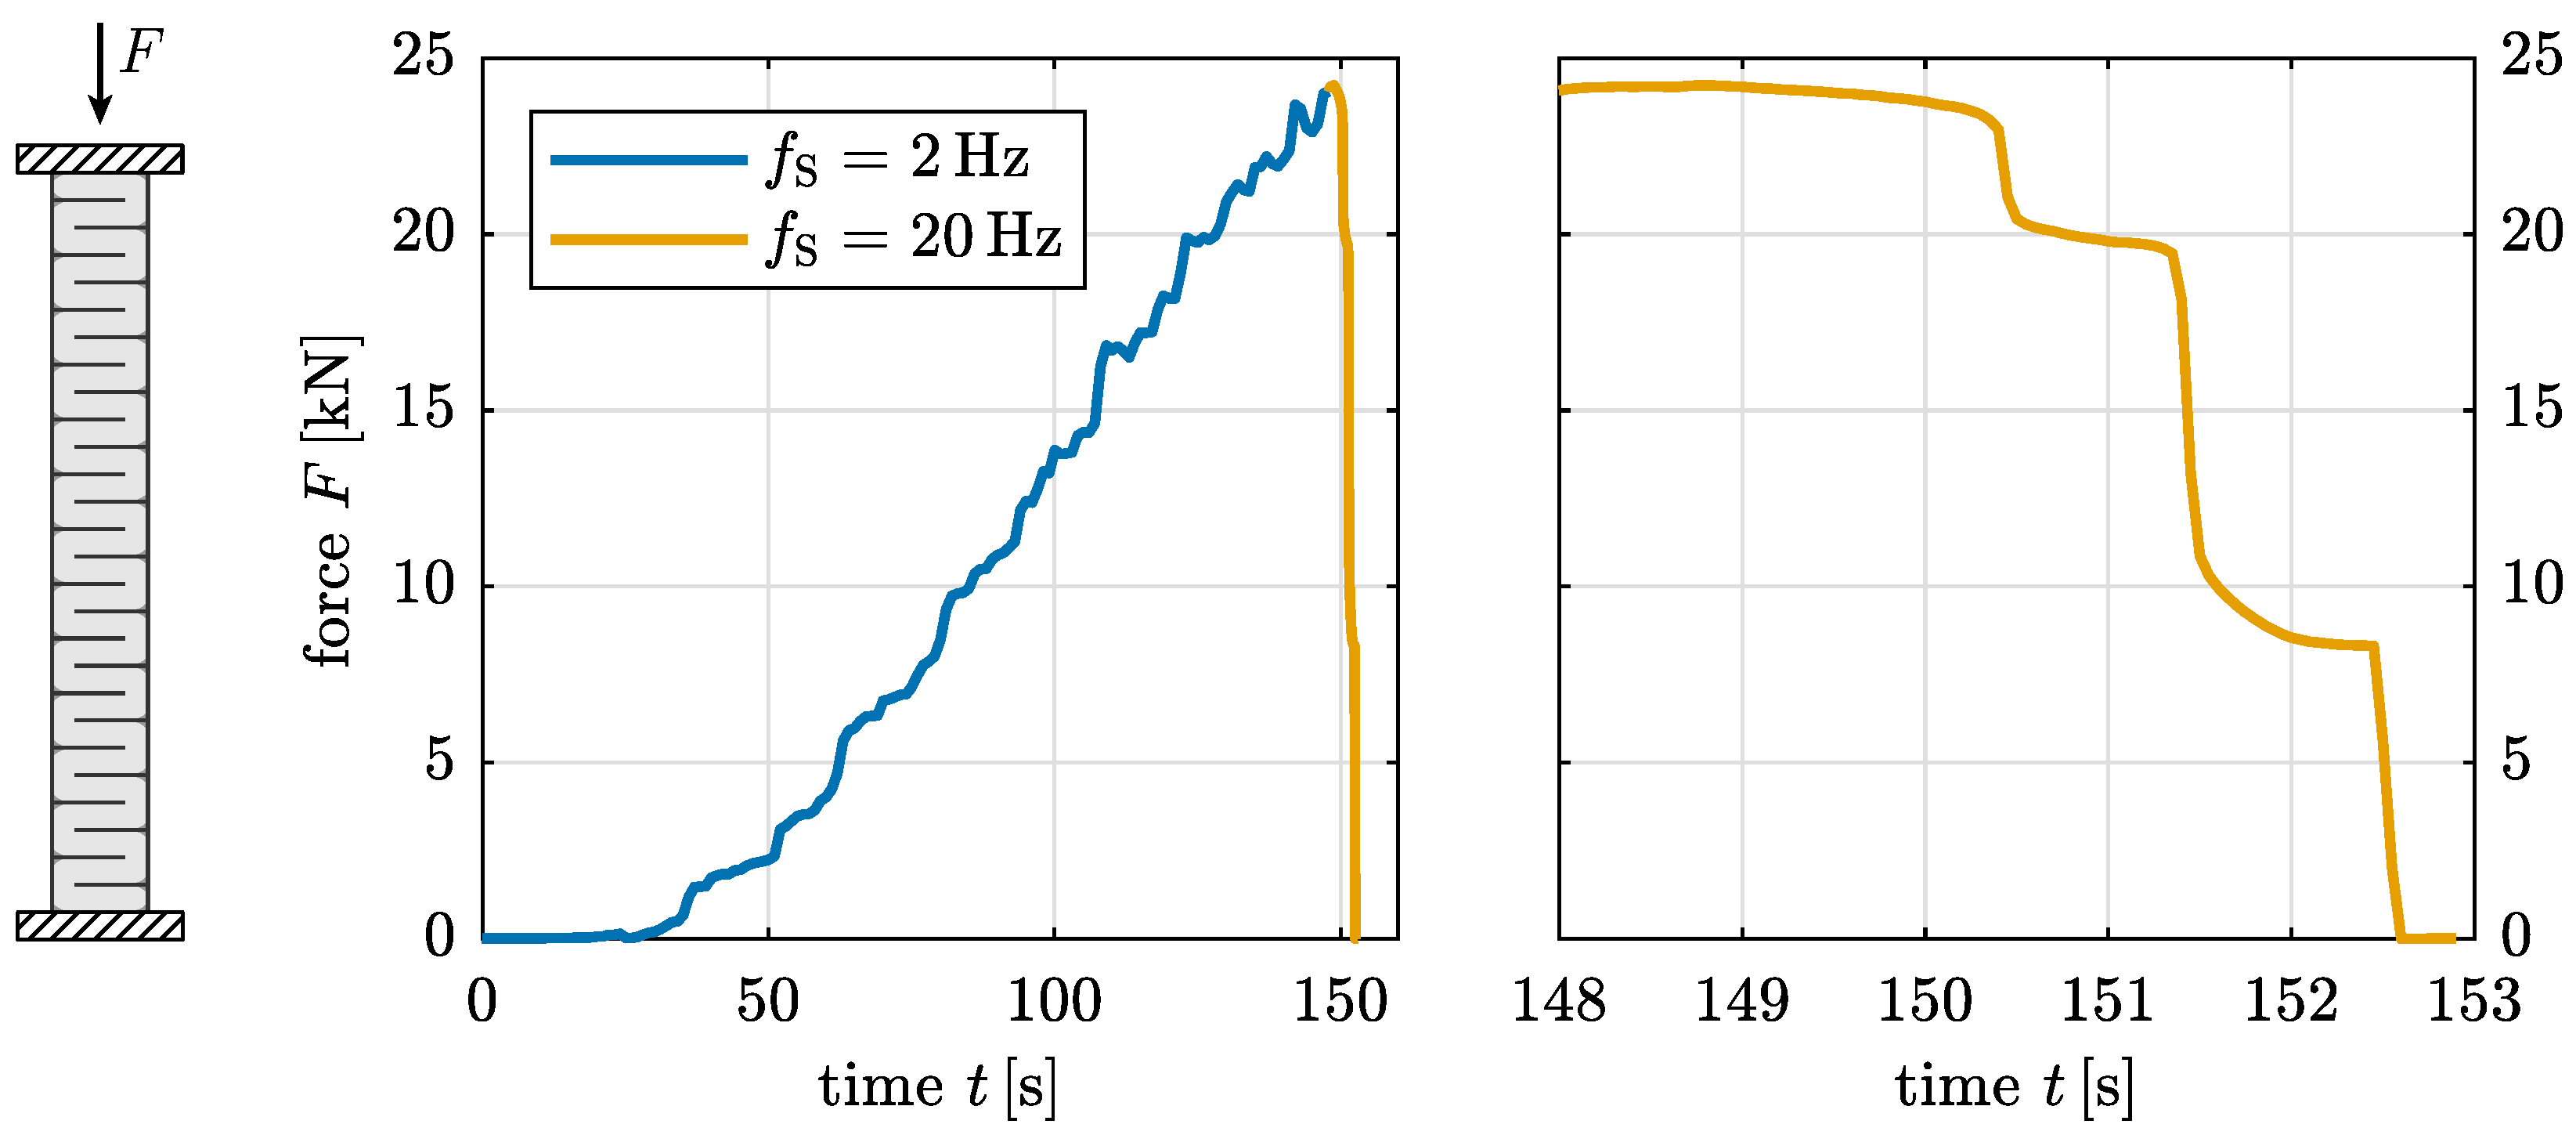
3.2.2. Material Properties
4. Discussion
5. Conclusions
Author Contributions
Funding
Institutional Review Board Statement
Informed Consent Statement
Data Availability Statement
Acknowledgments
Conflicts of Interest
Abbreviations
| 3DCP | 3D concrete printing |
| 3PBT | Three-point bending test |
| C | Crosswise printing pattern |
| DIC | Digital image correlation |
| FE | Finite element |
| l | Long specimen length |
| L | Lengthwise printing pattern |
| LC | Length-/crosswise printing pattern |
| s | Short specimen length |
| UCT | Uniaxial compression test |
References
- Khoshnevis, B. Automated Construction by Contour Crafting—Related Robotics and Information Technologies. Autom. Constr. 2004, 13, 5–19. [Google Scholar] [CrossRef]
- Khoshnevis, B.; Dutton, R. Innovative Rapid Prototyping Process Makes Large Sized, Smooth Surfaced Complex Shapes in a Wide Variety of Materials. Mater. Technol. 1998, 13, 53–56. [Google Scholar] [CrossRef]
- Bos, F.; Wolfs, R.; Ahmed, Z.; Salet, T. Additive Manufacturing of Concrete in Construction: Potentials and Challenges of 3D Concrete Printing. Virtual Phys. Prototyp. 2016, 11, 209–225. [Google Scholar] [CrossRef]
- Lim, S.; Buswell, R.A.; Le, T.T.; Austin, S.A.; Gibb, A.G.F.; Thorpe, T. Developments in Construction-Scale Additive Manufacturing Processes. Autom. Constr. 2012, 21, 262–268. [Google Scholar] [CrossRef]
- Perrot, A.; Rangeard, D.; Pierre, A. Structural Built-up of Cement-Based Materials Used for 3D-printing Extrusion Techniques. Mater. Struct. 2016, 49, 1213–1220. [Google Scholar] [CrossRef]
- Wangler, T.; Roussel, N.; Bos, F.P.; Salet, T.A.M.; Flatt, R.J. Digital Concrete: A Review. Cem. Concr. Res. 2019, 123, 105780. [Google Scholar] [CrossRef]
- Mechtcherine, V.; Nerella, V.N. 3-D-Druck mit Beton: Sachstand, Entwicklungstendenzen, Herausforderungen. Bautechnik 2018, 95, 275–287. [Google Scholar] [CrossRef]
- Buswell, R.A.; Leal de Silva, W.R.; Jones, S.Z.; Dirrenberger, J. 3D Printing Using Concrete Extrusion: A Roadmap for Research. Cem. Concr. Res. 2018, 112, 37–49. [Google Scholar] [CrossRef]
- Panda, B.; Tay, Y.; Paul, S.; Tan, M. Current Challenges and Future Potential of 3D Concrete Printing. Mater. Werkst. 2018, 49, 666–673. [Google Scholar] [CrossRef]
- Buswell, R.; Blanco, A.; Cavalaro, S.; Kinnell, P. (Eds.) Third RILEM International Conference on Concrete and Digital Fabrication: Digital Concrete 2022; RILEM Bookseries; Springer International Publishing: Cham, Switzerland, 2022; Volume 37. [Google Scholar] [CrossRef]
- Ding, T.; Xiao, J.; Mechtcherine, V. Microstructure and Mechanical Properties of Interlayer Regions in Extrusion-Based 3D Printed Concrete: A Critical Review. Cem. Concr. Compos. 2023, 141, 105154. [Google Scholar] [CrossRef]
- Le, T.T.; Austin, S.A.; Lim, S.; Buswell, R.A.; Law, R.; Gibb, A.G.F.; Thorpe, T. Hardened Properties of High-Performance Printing Concrete. Cem. Concr. Res. 2012, 42, 558–566. [Google Scholar] [CrossRef]
- Babafemi, A.J.; Kolawole, J.T.; Miah, M.J.; Paul, S.C.; Panda, B. A Concise Review on Interlayer Bond Strength in 3D Concrete Printing. Sustainability 2021, 13, 7137. [Google Scholar] [CrossRef]
- Wolfs, R.J.M.; Bos, F.P.; Salet, T.A.M. Hardened Properties of 3D Printed Concrete: The Influence of Process Parameters on Interlayer Adhesion. Cem. Concr. Res. 2019, 119, 132–140. [Google Scholar] [CrossRef]
- Meurer, M.; Classen, M. Mechanical Properties of Hardened 3D Printed Concretes and Mortars—Development of a Consistent Experimental Characterization Strategy. Materials 2021, 14, 752. [Google Scholar] [CrossRef]
- Sanjayan, J.G.; Nematollahi, B.; Xia, M.; Marchment, T. Effect of Surface Moisture on Inter-Layer Strength of 3D Printed Concrete. Constr. Build. Mater. 2018, 172, 468–475. [Google Scholar] [CrossRef]
- Panda, B.; Noor Mohamed, N.A.; Paul, S.C.; Bhagath Singh, G.V.P.; Tan, M.J.; Šavija, B. The Effect of Material Fresh Properties and Process Parameters on Buildability and Interlayer Adhesion of 3D Printed Concrete. Materials 2019, 12, 2149. [Google Scholar] [CrossRef]
- Ding, T.; Xiao, J.; Zou, S.; Wang, Y. Hardened Properties of Layered 3D Printed Concrete with Recycled Sand. Cem. Concr. Compos. 2020, 113, 103724. [Google Scholar] [CrossRef]
- Kumar, L.; Dey, D.; Panda, B.; Muthu, N. Experimental and Numerical Evaluation of Multi-Directional Compressive and Flexure Behavior of Three-Dimensional Printed Concrete. Front. Struct. Civ. Eng. 2023, 17, 1643–1661. [Google Scholar] [CrossRef]
- Chen, Y.; Çopuroğlu, O.; Romero Rodriguez, C.; Mendonca Filho, F.F.; Schlangen, E. Characterization of Air-Void Systems in 3D Printed Cementitious Materials Using Optical Image Scanning and X-ray Computed Tomography. Mater. Charact. 2021, 173, 110948. [Google Scholar] [CrossRef]
- Nerella, V.N.; Hempel, S.; Mechtcherine, V. Effects of Layer-Interface Properties on Mechanical Performance of Concrete Elements Produced by Extrusion-Based 3D-printing. Constr. Build. Mater. 2019, 205, 586–601. [Google Scholar] [CrossRef]
- Liu, H.; Liu, C.; Bai, G.; Wu, Y.; He, C.; Zhang, R.; Wang, Y. Influence of Pore Defects on the Hardened Properties of 3D Printed Concrete with Coarse Aggregate. Addit. Manuf. 2022, 55, 102843. [Google Scholar] [CrossRef]
- Marchment, T.; Sanjayan, J.; Xia, M. Method of Enhancing Interlayer Bond Strength in Construction Scale 3D Printing with Mortar by Effective Bond Area Amplification. Mater. Des. 2019, 169, 107684. [Google Scholar] [CrossRef]
- Tang, Y.; Xiao, J.; Ding, T.; Liu, H.; Zhang, M.; Zhang, J. Trans-Layer and Inter-Layer Fracture Behavior of Extrusion-Based 3D Printed Concrete under Three-Point Bending. Eng. Fract. Mech. 2024, 296, 109836. [Google Scholar] [CrossRef]
- Zareiyan, B.; Khoshnevis, B. Interlayer Adhesion and Strength of Structures in Contour Crafting-Effects of Aggregate Size, Extrusion Rate, and Layer Thickness. Autom. Constr. 2017, 81, 112–121. [Google Scholar] [CrossRef]
- Nair, S.A.O.; Tripathi, A.; Neithalath, N. Examining Layer Height Effects on the Flexural and Fracture Response of Plain and Fiber-Reinforced 3D-printed Beams. Cem. Concr. Compos. 2021, 124, 104254. [Google Scholar] [CrossRef]
- van den Heever, M.; Bester, F.; Kruger, J.; van Zijl, G. Mechanical Characterisation for Numerical Simulation of Extrusion-Based 3D Concrete Printing. J. Build. Eng. 2021, 44, 102944. [Google Scholar] [CrossRef]
- van den Heever, M.; Bester, F.; Kruger, J.; van Zijl, G. Numerical Modelling Strategies for Reinforced 3D Concrete Printed Elements. Addit. Manuf. 2022, 50, 102569. [Google Scholar] [CrossRef]
- Pi, Y.; Lu, C.; Li, B.; Zhou, J. Crack Propagation and Failure Mechanism of 3D Printing Engineered Cementitious Composites (3DP-ECC) under Bending Loads. Constr. Build. Mater. 2023, 408, 133809. [Google Scholar] [CrossRef]
- Yue, J.G.; Beskos, D.E.; Feng, C.; Wu, K. Hardened Fracture Characteristics of Printed Concrete Using Acoustic Emission Monitoring Technique. Constr. Build. Mater. 2022, 361, 129684. [Google Scholar] [CrossRef]
- Liu, K.; Takasu, K.; Jiang, J.; Zu, K.; Gao, W. Mechanical Properties of 3D Printed Concrete Components: A Review. Dev. Built Environ. 2023, 16, 100292. [Google Scholar] [CrossRef]
- Mechtcherine, V.; van Tittelboom, K.; Kazemian, A.; Kreiger, E.; Nematollahi, B.; Nerella, V.N.; Santhanam, M.; de Schutter, G.; Van Zijl, G.; Lowke, D.; et al. A Roadmap for Quality Control of Hardening and Hardened Printed Concrete. Cem. Concr. Res. 2022, 157, 106800. [Google Scholar] [CrossRef]
- Chaves Figueiredo, S.; Romero Rodríguez, C.Y.; Ahmed, Z.; Bos, D.H.; Xu, Y.; Salet, T.M.; Çopuroğlu, O.; Schlangen, E.; Bos, F.P. Mechanical Behavior of Printed Strain Hardening Cementitious Composites. Materials 2020, 13, 2253. [Google Scholar] [CrossRef] [PubMed]
- Cuevas, K.; Strzałkowski, J.; Kim, J.S.; Ehm, C.; Glotz, T.; Chougan, M.; Ghaffar, S.H.; Stephan, D.; Sikora, P. Towards Development of Sustainable Lightweight 3D Printed Wall Building Envelopes—Experimental and Numerical Studies. Case Stud. Constr. Mater. 2023, 18, e01945. [Google Scholar] [CrossRef]
- Pfeiffer, S.; Dorn, T.; Hirsch, T.; Ehm, C.; Stephan, D.; Vassiliadis, D. Architectural Applications and Workflows for Additive Fabrication with Concrete. In Proceedings of the Second RILEM International Conference on Concrete and Digital Fabrication, Eindhoven, The Netherlands, 6–8 July 2020; Bos, F.P., Lucas, S.S., Wolfs, R.J., Salet, T.A., Eds.; Springer: Cham, Switzerland, 2020; pp. 946–955. [Google Scholar] [CrossRef]
- Cuevas, K.; Chougan, M.; Martin, F.; Ghaffar, S.H.; Stephan, D.; Sikora, P. 3D Printable Lightweight Cementitious Composites with Incorporated Waste Glass Aggregates and Expanded Microspheres – Rheological, Thermal and Mechanical Properties. J. Build. Eng. 2021, 44, 102718. [Google Scholar] [CrossRef]
- Cuevas, K.; Weinhold, J.; Stephan, D.; Kim, J.S. Effect of Printing Patterns on Pore-Related Microstructural Characteristics and Properties of Materials for 3D Concrete Printing Using In Situ and Ex Situ Imaging Techniques. Constr. Build. Mater. 2023, 405, 133220. [Google Scholar] [CrossRef]
- Luhmann, T.; Robson, S.; Kyle, S.; Boehm, J. Close-Range Photogrammetry and 3D Imaging; De Gruyter: Berlin, Germany, 2023. [Google Scholar] [CrossRef]
- GOM GmbH. Digital Image Correlation and Strain Computation Basics: Technical White Paper; GOM GmbH: Braunschweig, Germany, 2018. [Google Scholar]


| Test | Printing Pattern | Orientation | Number of Specimens |
|---|---|---|---|
| Three-point bending test (3PBT) | Lengthwise (L) | 0° | 4 |
| 90° | 3 | ||
| Length-/crosswise (LC) | 0° | 3 | |
| 90° | 3 | ||
| Crosswise (C) | 0° | 1 | |
| 90° | - |
| Test | Printing Pattern | Specimen Length | Number of Specimens |
|---|---|---|---|
| Uniaxial compression test (UCT) | Lengthwise (L) | Long (l) | 2 |
| Short (s) | 2 | ||
| Length-/crosswise (LC) | l | 3 | |
| s | 2 | ||
| Crosswise (C) | l | 4 | |
| s | 6 |
| Printing Pattern | Young’s Modulus E | Flexural Tensile Strength | ||||
|---|---|---|---|---|---|---|
| [MPa] | SD [MPa] | CV [%] | [MPa] | SD [MPa] | CV [%] | |
| L_0 | 9564 | 1238 | 12.9 | 4.55 | 0.43 | 9.5 |
| L_90 | 9803 | 1243 | 12.7 | 4.36 | 0.87 | 19.9 |
| LC_0 | 10879 | 1386 | 12.7 | 4.48 | 0.65 | 14.5 |
| LC_90 | 8450 | 2433 | 28.8 | 3.18 | 0.43 | 13.7 |
| C_0 | 4750 | 0 | 0.0 | 1.84 | 0.00 | 0.0 |
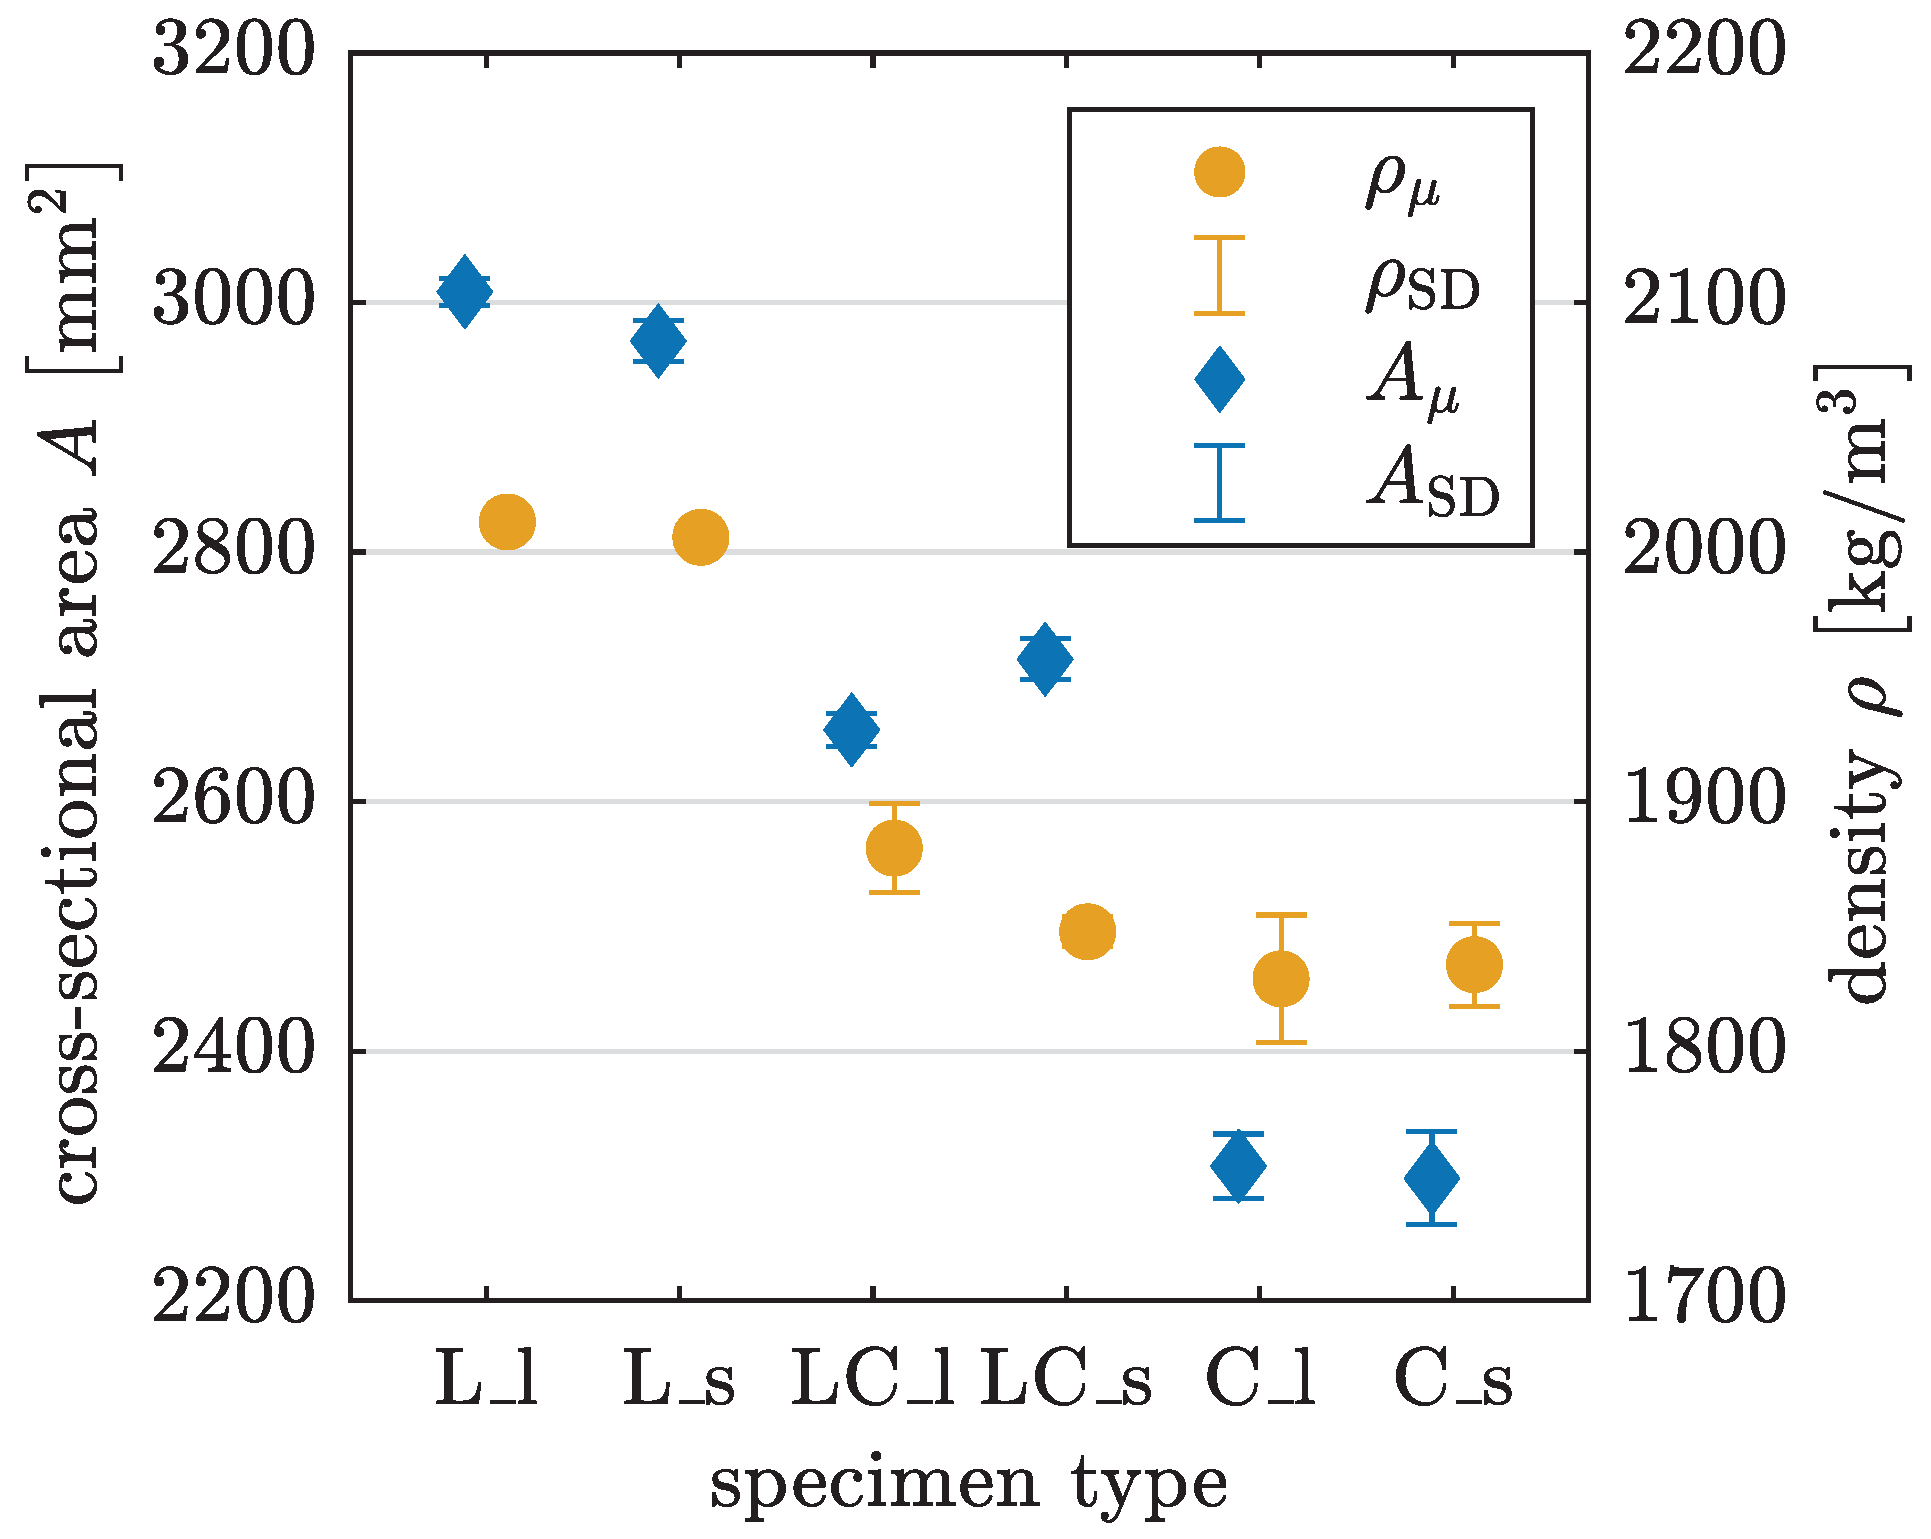
| Printing Pattern | Cross-Sectional Area A | Density | ||||
|---|---|---|---|---|---|---|
| [mm2] | SD [mm2] | CV [%] | SD | CV [%] | ||
| L_l | 3008.6 | 10.9 | 0.4 | 2012.1 | 1.8 | 0.1 |
| L_s | 2969.1 | 16.3 | 0.5 | 2005.9 | 4.5 | 0.2 |
| LC_l | 2657.5 | 13.2 | 0.5 | 1881.4 | 17.8 | 0.9 |
| LC_s | 2714.0 | 16.4 | 0.6 | 1847.8 | 6.0 | 0.3 |
| C_l | 2307.8 | 25.8 | 1.1 | 1829.0 | 25.6 | 1.4 |
| C_s | 2298.0 | 37.3 | 1.6 | 1834.7 | 16.6 | 0.9 |
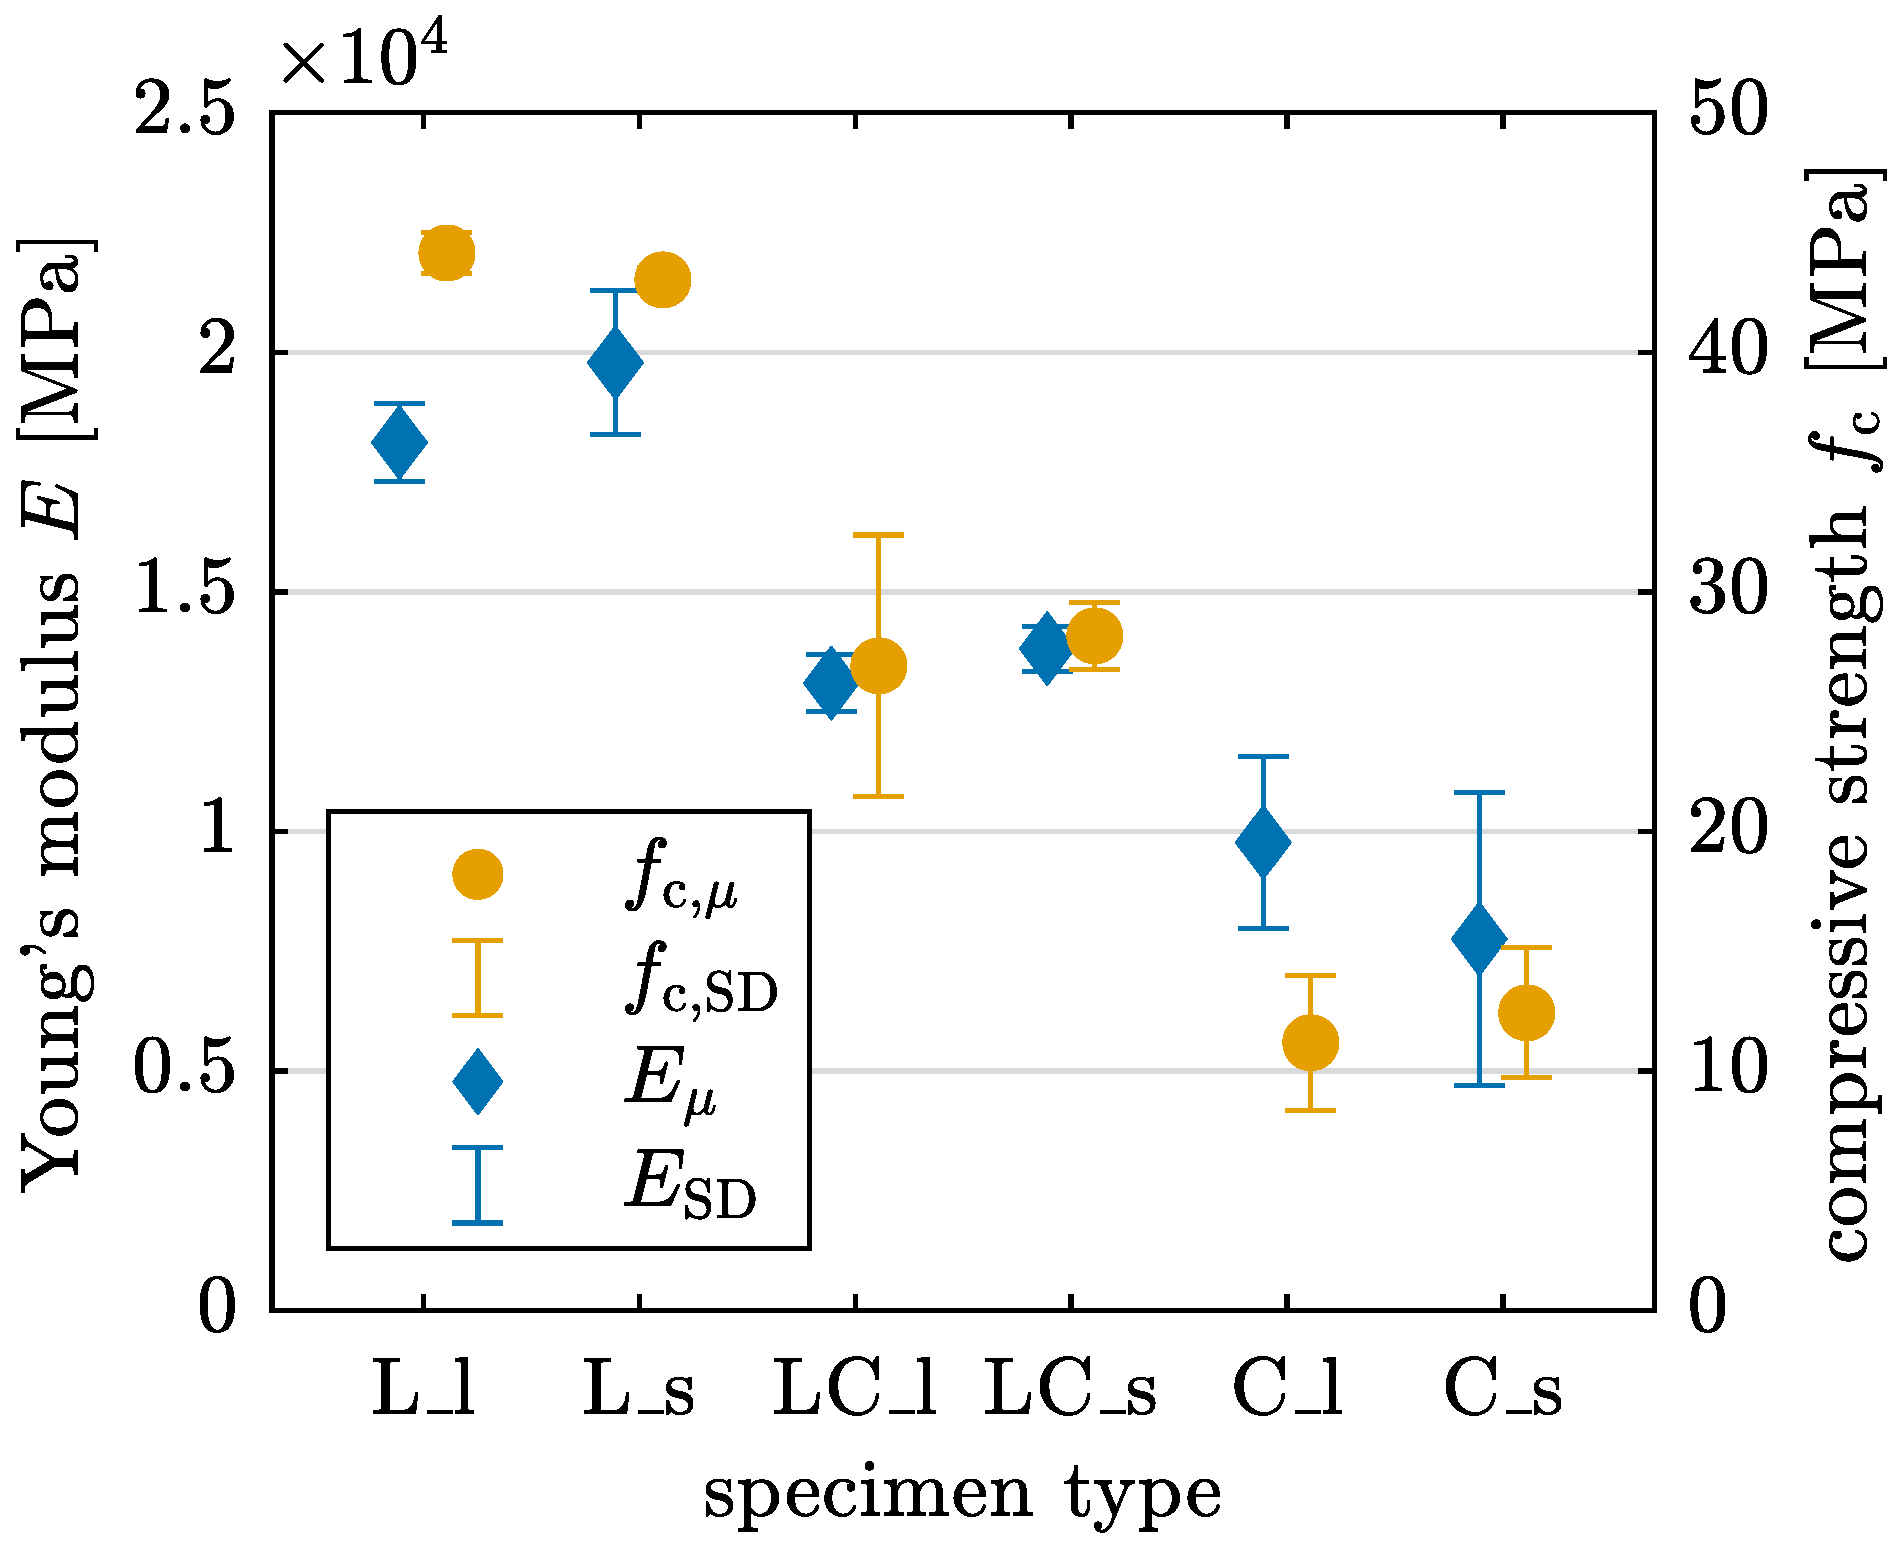
| Printing Pattern | Young’s Modulus E | Compressive Strength | ||||
|---|---|---|---|---|---|---|
| [MPa] | SD [MPa] | CV [%] | [MPa] | SD [MPa] | CV [%] | |
| L_l | 18119 | 814 | 4.5 | 44.15 | 0.84 | 1.9 |
| L_s | 19785 | 1503 | 7.6 | 43.03 | 0.49 | 1.1 |
| LC_l | 13096 | 593 | 4.5 | 26.92 | 5.46 | 20.3 |
| LC_s | 13816 | 469 | 3.4 | 28.16 | 1.40 | 5.0 |
| C_l | 9771 | 1787 | 18.3 | 11.18 | 2.82 | 25.3 |
| C_s | 7756 | 3055 | 39.4 | 12.43 | 2.71 | 21.8 |
Disclaimer/Publisher’s Note: The statements, opinions and data contained in all publications are solely those of the individual author(s) and contributor(s) and not of MDPI and/or the editor(s). MDPI and/or the editor(s) disclaim responsibility for any injury to people or property resulting from any ideas, methods, instructions or products referred to in the content. |
© 2024 by the authors. Licensee MDPI, Basel, Switzerland. This article is an open access article distributed under the terms and conditions of the Creative Commons Attribution (CC BY) license (https://creativecommons.org/licenses/by/4.0/).
Share and Cite
Glotz, T.; Petryna, Y. Experimental Characterization of Anisotropic Mechanical Behaviour and Failure Mechanisms of Hardened Printed Concrete. Materials 2024, 17, 3931. https://doi.org/10.3390/ma17163931
Glotz T, Petryna Y. Experimental Characterization of Anisotropic Mechanical Behaviour and Failure Mechanisms of Hardened Printed Concrete. Materials. 2024; 17(16):3931. https://doi.org/10.3390/ma17163931
Chicago/Turabian StyleGlotz, Theresa, and Yuri Petryna. 2024. "Experimental Characterization of Anisotropic Mechanical Behaviour and Failure Mechanisms of Hardened Printed Concrete" Materials 17, no. 16: 3931. https://doi.org/10.3390/ma17163931