Article

Electrochemical Corrosion Behavior and the Related Mechanism of Ti3SiC2/Cu Composites in a Strong Acid Environment

1
School of Mechanical Engineering, Chengdu University, Chengdu 610106, China
2
State Key Laboratory of Solid Lubrication, Lanzhou Institute of Chemical Physics, Chinese Academy of Sciences, Lanzhou 730000, China
3
School of Chemical Engineering and Materials, Changzhou Institute of Technology, Changzhou 213032, China
4
School of Mechanical Engineering, Xinjiang University, Urumqi 830000, China
*
Authors to whom correspondence should be addressed.
Materials 2024, 17(16), 4035; https://doi.org/10.3390/ma17164035
Submission received: 29 May 2024 / Revised: 5 August 2024 / Accepted: 13 August 2024 / Published: 14 August 2024
(This article belongs to the Special Issue Corrosion and Corrosion Inhibition of Materials)

Abstract

:
The electrochemical corrosion behaviors of Ti3SiC2/Cu composites in harsh media including dilute HNO3 and concentrated H2SO4 were studied in detail and the related corrosion mechanisms were explored. Under open-circuit potential, the corrosion resistance of Ti3SiC2/Cu in dilute HNO3 was worse than that in concentrated H2SO4. In dilute HNO3, Ti3SiC2/Cu exhibited a typical passivation character with a narrow passivation interval. During the corrosion process, the dissolution of Cu-Si compounds resulted in the destruction of the passivation layer on the surface. Additionally, with the increasing of the potentials, the oxidation of Cu and Si atoms led to the generation of the oxide film again on the surface. In concentrated H2SO4, the Ti3SiC2/Cu composite was covered by a double-layered passivation layer, which was composed of an internal layer of TiO2 and an external layer of Cu2O and SiO2. This was because Cu diffused into the surface and was oxidized into Cu2O, which formed a denser oxidized film with SiO2. In addition, it was found that Ti3SiC2/Cu has better corrosion resistance in concentrated H2SO4.

1. Introduction

Since the preparation of the MAX phase, research on its properties and applications, such as electrical conductivity, thermal conductivity, machinability, bending resistance, superconductivity, and optical property, has continuously emerged [1,2,3]. As an important character of ceramics, the corrosion resistances, including frictional corrosion, hydrothermal corrosion, resistance to strong acid and alkali corrosion, electrochemical corrosion, etc., have been substantially studied [4,5]. It is well known that electrochemical corrosion generally occurs in some circumstances, such as in the atmosphere, sea, acid or alkali solutions, and wastewater. Currently, metals or alloys are used as the structural parts. If corrosion happened, especially under the influence of mechanical action, the property of materials was impaired, and even some catastrophes happened [6,7]. The corrosive behaviors of Ti3SiC2 in various acid, alkali and salt solutions have been studied, and it was found that the formation of oxides in its service environment was beneficial for the improvement of its corrosion resistance. However, the effect of the passivation film on the electrochemical corrosion of Ti3SiC2 has been less studied [6,8]. Up until now, the corrosive behavior of Ti3SiC2 in HCl and H2SO4 has been thoroughly investigated. In both acids, under the open potential and high anode potential, Ti atoms were leached out and Si atoms were oxidized in situ, forming a passivation film [9]. Barsoum et al. [10] studied the electrochemical behaviors of some common MAX phases in strong acids and alkali solutions (such as HCl, H2SO4, and NaOH) and they found that the corrosion resistance of Ti3SiC2 was better than that of pure Ti, which resulted from the formation of the thin passivation film of SiO2. Ming Zhu et al. [9] investigated the electrochemical behaviors of Ti3SiC2 in the 3.5% NaCl solution, and they discovered that it exhibited excellent corrosion resistance. However, the passivation behavior of Ti3SiC2 was weaker than Ti, because the special layered structure of Ti3SiC2 provided a path for the spread of Si, which resulted in the low passivation efficiency of atoms diffusing to the obstacle layer.
Previously, we have investigated the static corrosion of Ti3SiC2/Cu composites in a strong acid environment and the electrochemical corrosion in a 3.5% NaCl environment, explaining the corrosion mechanisms involved [11,12]. However, in industrial production environments, most of the structural components are exposed to acidic conditions [13]. In this study, the electrochemical corrosion resistance of Ti3SiC2/Cu composites in the harsh media of dilute HNO3 and concentrated H2SO4 has been thoroughly investigated in the context of strong-acid and electrochemical corrosion environments, and the related corrosion mechanisms have been discussed.

2. Experimental

2.1. Sample Preparation

Ti3SiC2/Cu composites were synthesized by the spark plasma sintering (SPS) process. The original Ti3SiC2/Cu powder mixtures were composed of 15 vol.% Cu powder (average grain size: 74 μm, purity ≥ 99.9%, China Shanghai McLean Biochemical Co., Ltd., Shanghai, China) and 85 vol.% Ti3SiC2 powder (average grain size: 38 μm, purity ≥ 98%, China Jilin 11 Technology Co., Ltd., Jilin, China). The powder mixtures were uniformly mixed, then sintered by an SPS furnace (SPS, Model Labox-350, SINTER LAND INC., Niigata, Japan) and finally cooled with the furnace. The sintering temperature was 1000 °C. The sintering pressure was 35 MPa. The swelling duration was 20 min. This Ti3SiC2/Cu preparation scheme has been reported previously, and it is confirmed that it has high mechanical properties such as hardness and compressive strength. Not only that, its excellent tribological properties have been widely studied [14,15]. The diameter of the as-prepared composite was 25 mm and its thickness was 10 mm. The relative density of the composites was 95%~96%. The as-synthesized composites were processed into pieces (10 mm × 10 mm × 5 mm) by wire cutting. These pieces were polished by diamond grinding discs to 3000 mesh. Then, they were ultrasonically washed in acetone and ethanol in turn, followed by drying in air at room temperature. Finally, the pieces were linked by Cu wires and sealed with epoxy to prepare a work electrode.

2.2. Electrochemical Measurements

Electrochemical measurements were conducted on a DH7003 potentiostat/galvanostat controlled by DHMultiElec software (V6.21.9.23h) linked by a general three-electrode electrochemical cell full of dilute HNO3 (11.6 wt%) and concentrated H2SO4(98 wt%) solutions, at room temperature. The counter electrode was the Pt electrode and the reference electrode was the Ag/AgCl electrode (0.197 V vs. standard H electrode, SHE). These three electrodes were correctly positioned in the fitted locations of the cell. Potentiodynamic polarization experiments were performed from −0.3 to 3 V (vs. open-circuit potential (OCP)). The scan rate was 0.333 mV/s. It has been stated in the relevant literature that the potential scan rate plays an important role in minimizing the effects of aberrations in Tafel slope and corrosion current density analysis, and that the 0.333 mV/s used has no deleterious effect on the Tafel extrapolation method for determining the corrosion current density of test samples [16,17,18]. The electrochemical impendence spectroscopy (EIS) data gained by immersion in dilute HNO3 (11.6 wt%) and concentrated H2SO4 (98 wt%) solutions for 30 min at the open potential, or by potentiostatic polarization at different potentials for 12 h, were acquired by changing the frequency from 100 kHz to 10 mHz, with the current amplitude of 5 mV.

2.3. Characterization

The surface morphology and composition of the composites before and after immersion in harsh media were characterized by scanning electron microscope (SEM, JIB-4700F, JEOL, Akishima City, Tokyo, Japan) affiliated by an energy-dispersive spectrometer (EDS). The chemical valence states of the passivation layers generated during potentiostatic polarization were examined by X-ray photoelectron spectroscopy (XPS, PHI 5000 VersoProbe III, Ulvac-PHI, Akishima City, Tokyo, Japan). The X-ray beam spot was <10 μm. The accelerating voltage was 5 kV. Its energy resolution was <0.5 eV and its vacuum pressure was 5 × 10⁻⁸ Pa. The C 1s with a binding energy of 284.8 eV was used as a reference for all chemical elements (including Ti, Si, C, O, and Cu).

3. Results and Discussion

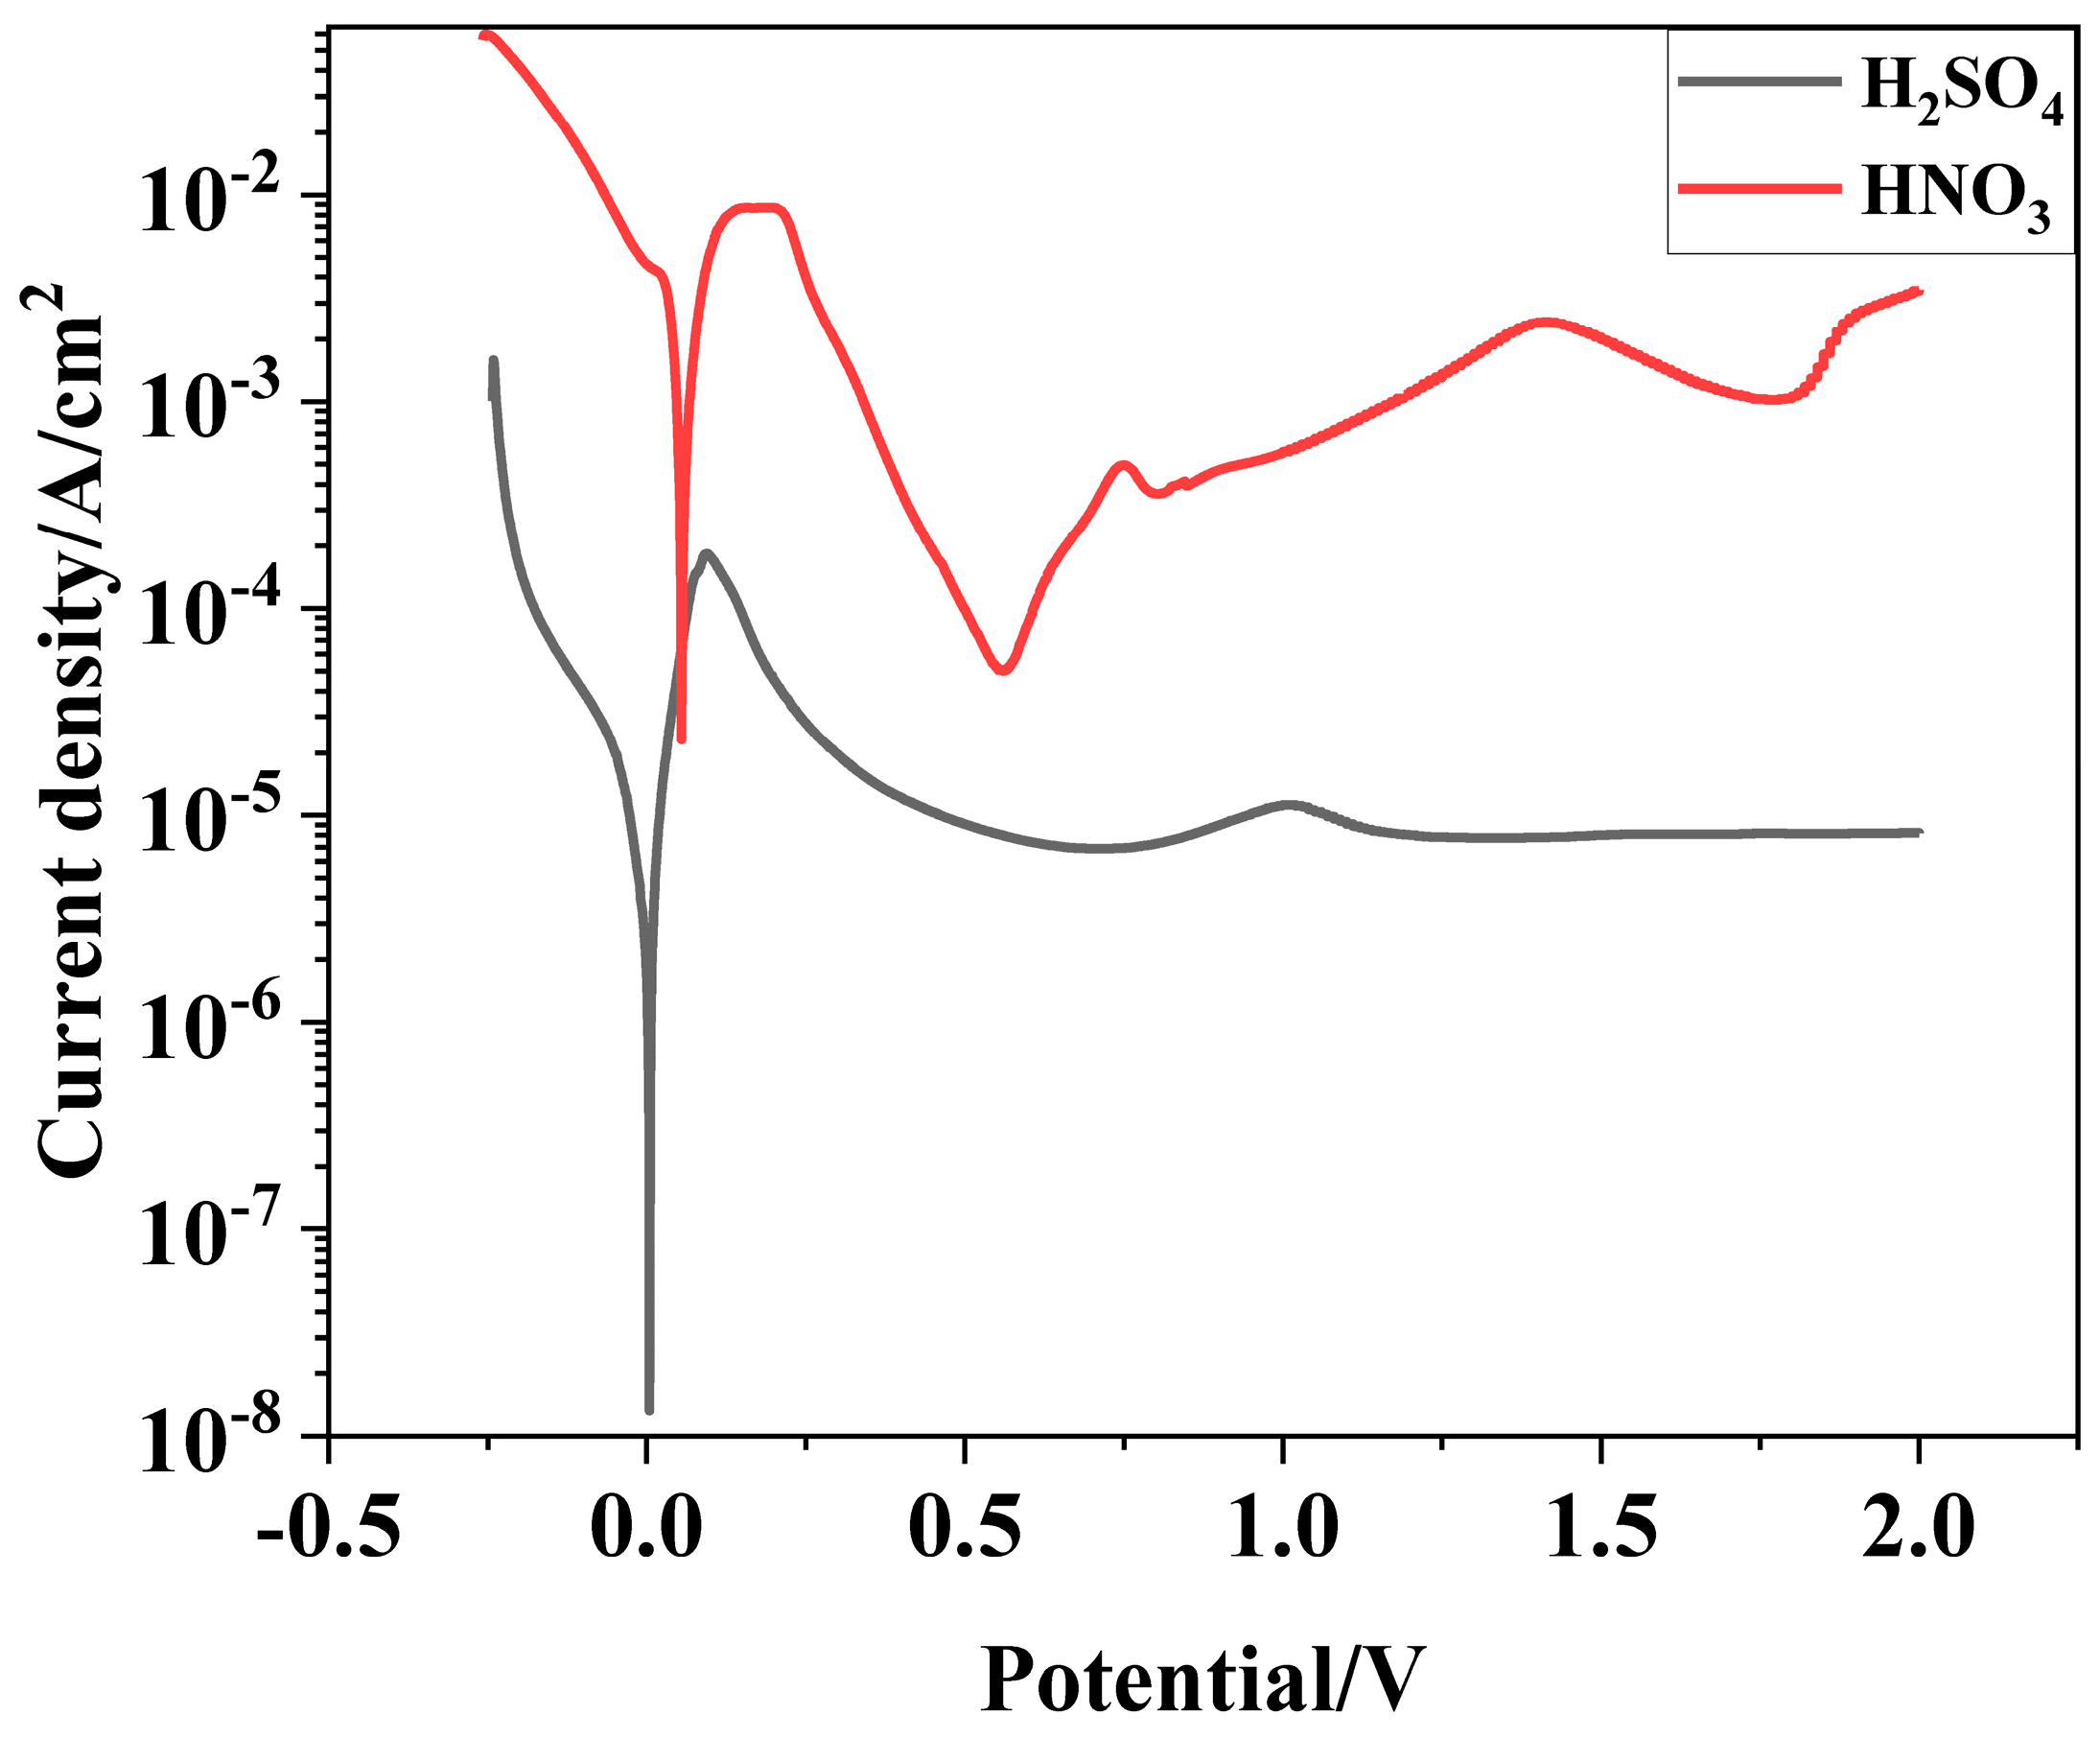
3.1. Potentiodynamic Polarization
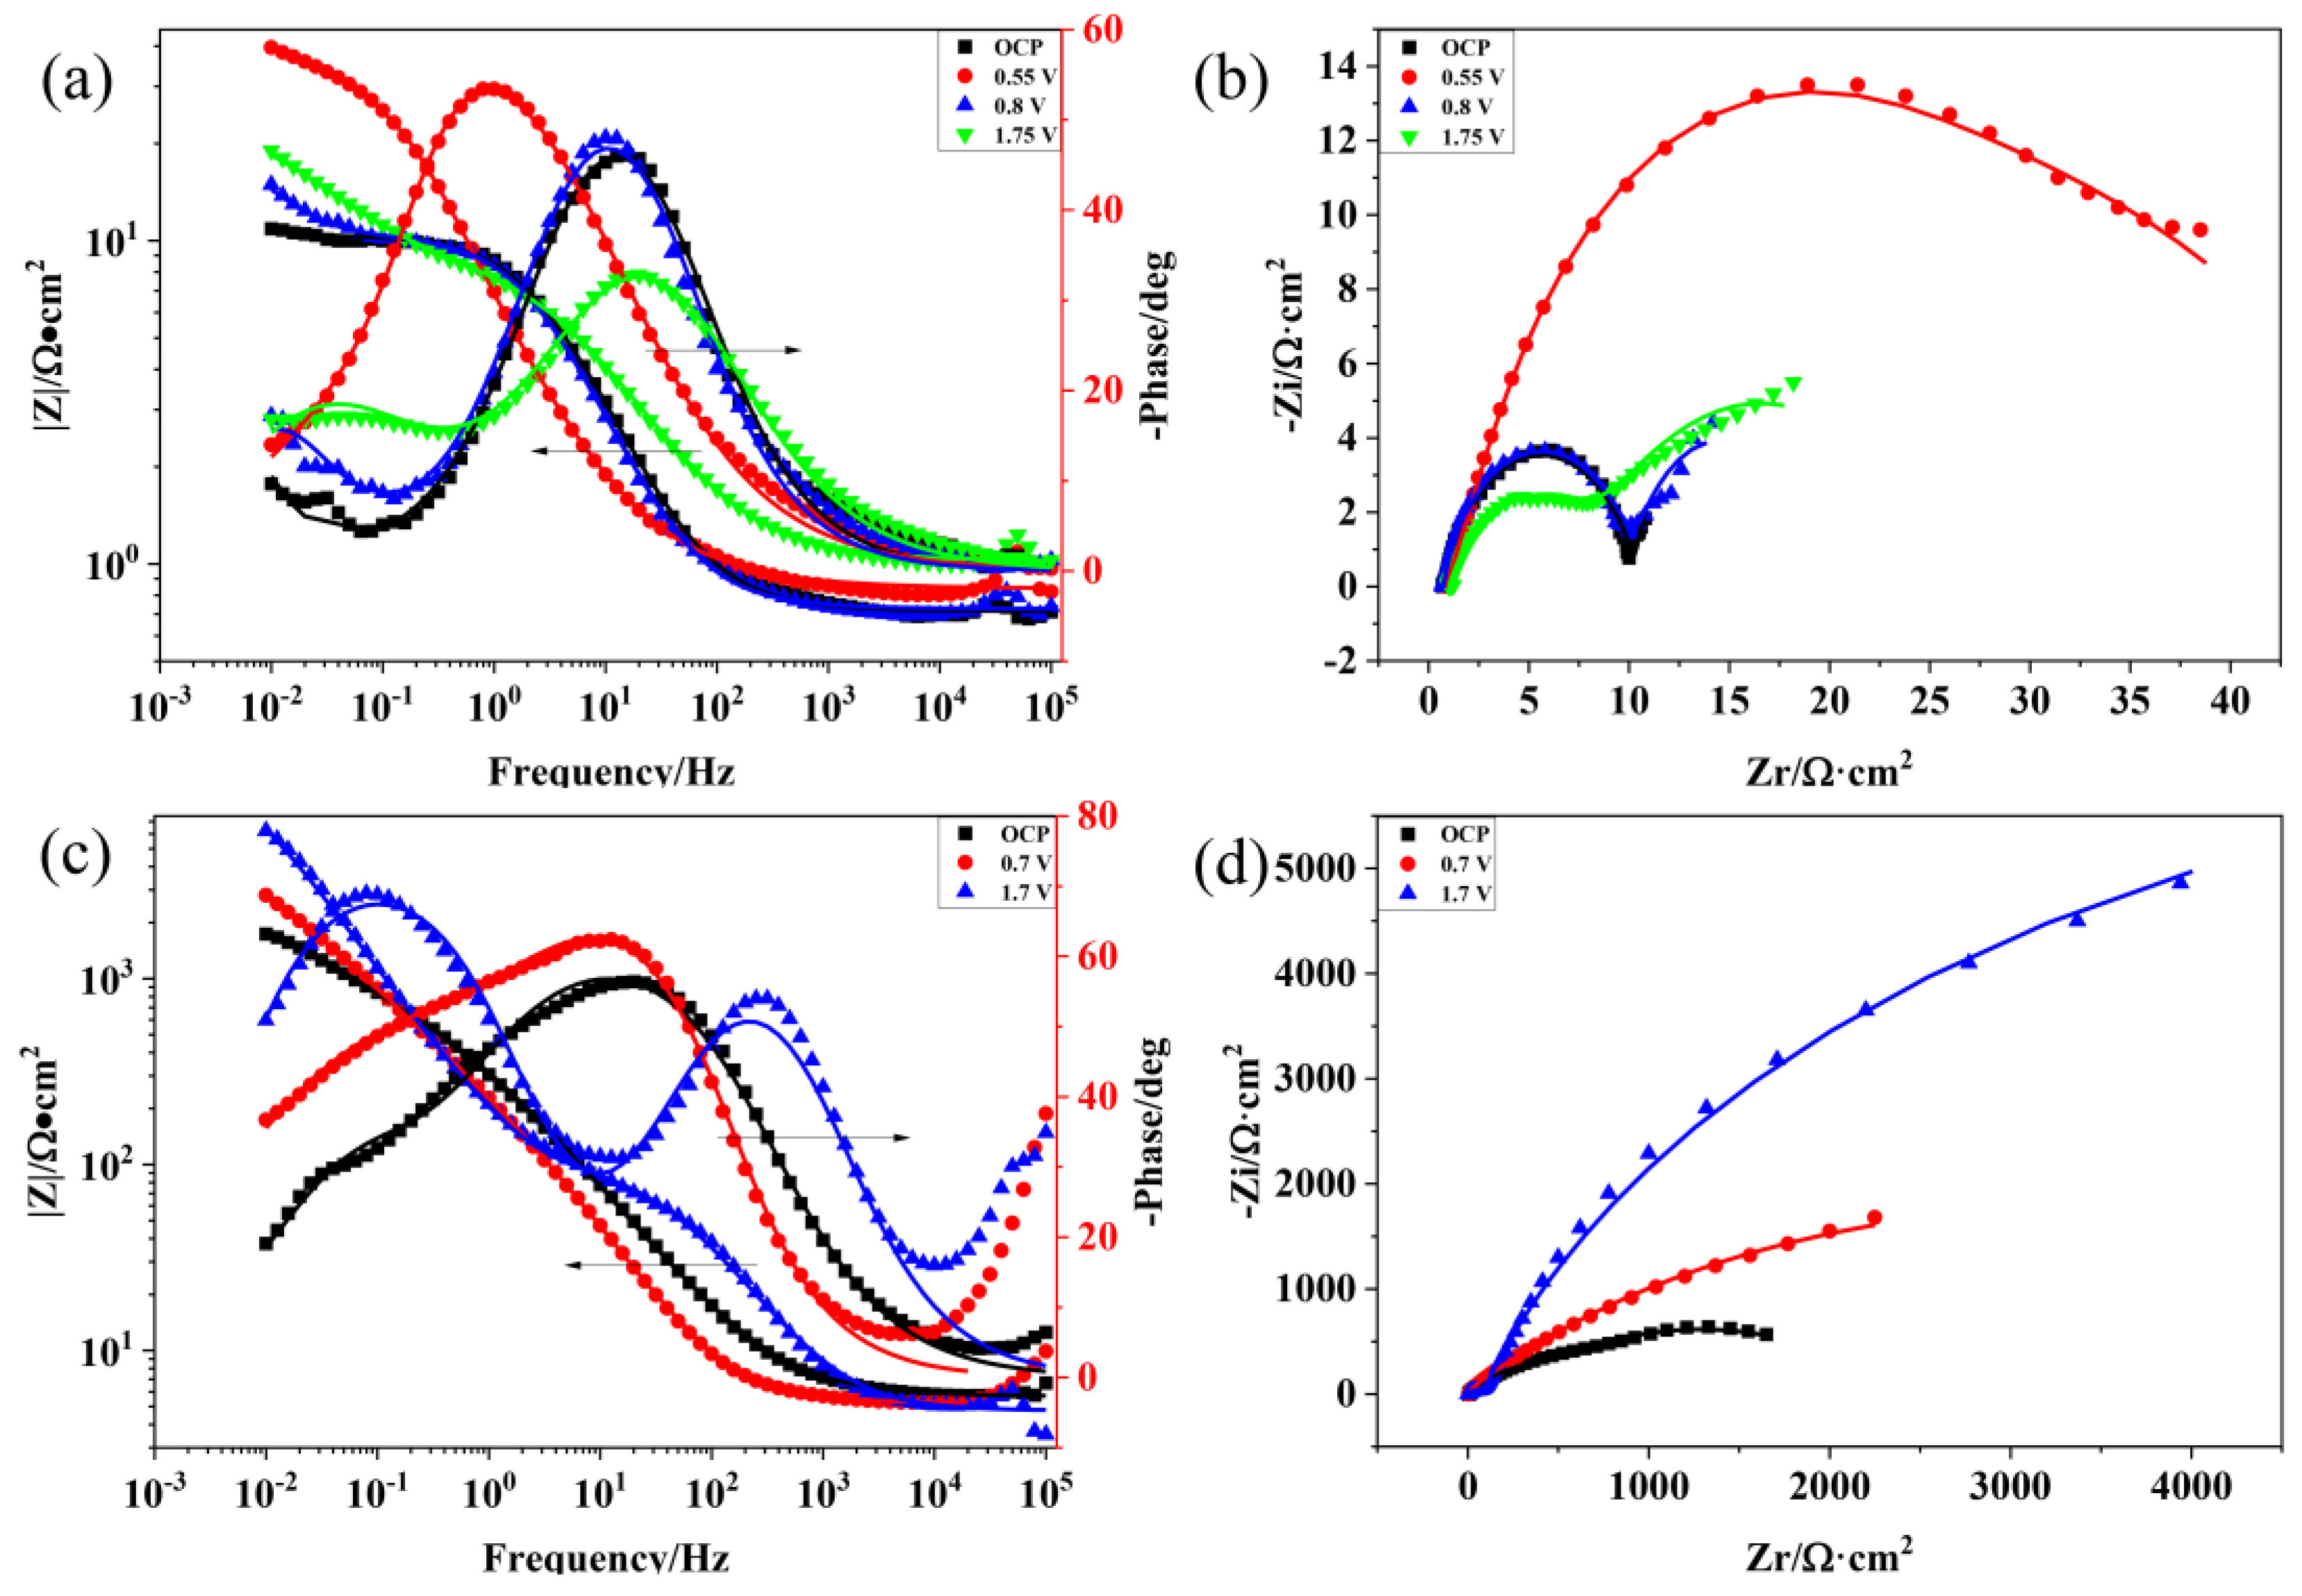
Potentiodynamic polarization curves of Ti3SiC2/Cu composites in dilute HNO3 and concentrated H2SO4 solutions are shown in Figure 1. A passivation behavior was observed for the composites under anodic polarization conditions, but the passivation gap of the composites in the dilute HNO3 was very narrow, which resulted from the weak stability of the as-formed oxide film of the composites. In dilute HNO3 (11.6%), the anodic curve of the Ti3SiC2/Cu composites exhibited a tipping point at 0.2 V, and subsequently underwent a passivation region, with a passivation current density of 5.01 × 10⁻⁵ A/cm2. When the voltage was higher than 0.55 V, the anode current density of Ti3SiC2/Cu obviously showed a quick upward tendency, which resulted from the destruction of the passivation layer, resulting in the accelerating of corrosion. When the voltage was in a range of 1.4 V–1.8 V, the anode current density of Ti3SiC2/Cu decreased. The reason was that Ti atoms were oxidized to TiO2, forming an oxide film. When the potential was greater than 1.8 V, the anodic current density showed a step-up trend, which may be due to hydrogen precipitation corrosion on the material surface. In the concentrated H2SO4 solution, the anodic curve of the Ti3SiC2/Cu composites exhibited a tipping point at 0.1 V, and it subsequently underwent a relatively wide passivation region, with a passivation current density of 6.87 × 10⁻⁶ A/cm2. This was because a double-layered passivation layer made up of TiO2 and SiO2 was formed on the surface of the composites. While the voltage was in the range of 1 V–2 V, the current density of Ti3SiC2/Cu slightly decreased and remained around 8.09 × 10⁻⁶ A/cm2, which resulted from the transformation of Ti from oxides (II) to TiO2.
As seen in Table 1, the open potentials of Ti3SiC2/Cu composites in two strong acids were similar. However, the self-corrosion current density of the composites in dilute HNO3 and concentrated H2SO4 were 7.05 × 10⁻⁴ A/cm2 and 3.01 × 10⁻⁶ A/cm2, respectively. Therefore, at the open potential, the corrosion resistance of the composites in concentrated H2SO4 was superior than that in dilute HNO3. When the potential was higher than 1 V, the Ti3SiC2/Cu composites exhibited a secondary passivation phenomenon in two strong acids.

3.2. EIS

For further investigating the corrosion process of the Ti3SiC2/Cu composites, the EIS data of the composites in two strong acids were acquired at the open potential and different polarization potentials (see Figure 2). As shown in Figure 2a,c, at high frequencies, the value of log|Z| tended to be stable and the phase angle was near zero, which indicated that the impedance was dominated by the solution resistance (Rs). As shown in Figure 2a, when the polarization potential increased, the phase curve of the composites moved to left first, and subsequently moved to right. It was speculated that the passivation layer first became thin, and then became thick [19]. At the passivation interval, the oxide film of the composites was relatively thin. There was a platform at the high frequency of the Bode diagram, which related to the solution resistance (Rs). Under the medium and low frequencies, the slope of log|Z|~logf tended to be −1 and the phase angle approached −90°. At high frequencies, a platform was seen in the Bode diagram, which was related to the solution resistance (Rs). As the voltage increased, the capacitive arc radius of the Ti3SiC2/Cu composites first rose, then declined (see Figure 2b). At 0.55 V, the corrosion resistance of the composites was the best. At the open potential (OCP) and 0.7 V, the capacitive arc radius was similar, which indicated that the composites showed a similar corrosion resistance behavior at OCP and 0.7 V.
In concentrated H2SO4, the Bode plots tend to increase at higher frequencies when the potentials are 0.7 V and 1.7 V (see Figure 2c). As seen in Figure 2d, with the increase in the potential, the capacitive arc radius of the Ti3SiC2/Cu composites in the concentrated H2SO4 increased and the corrosion resistance of the composites was the best at 1.75 V. The capacitive arc radius of the Ti3SiC2/Cu composites in dilute HNO3 was much smaller than that in concentrated H2SO4, which suggested that the corrosion resistance of the composite in concentrated H2SO4 was better. The impedance characteristics and corrosive behaviors of the composites in different situations were represented by the appropriate equivalent circuit. Based on the point-defect model (PDM), a passivation layer had a double-layered structure. In accordance with the PDM, the passivation process can be represented by the two chemical reactions below, which interpret the growth of the film and the transformation of the matrix, respectively [20].
M + x 2 H 2 O = [ M M + x 2 O O ] + x δ
M → Mδ+ (aq) + Vm + δe
Two time-constants were determined by combining PDM and the feature of impedance pattern, then a suitable equivalent circuit was applied to fit the experimental data [12,16,21]. As seen in Figure 3, the EIS data of the Ti3SiC2/Cu composites in dilute HNO3 at OCP, 0.55 V and 1.75 V, and in concentrated H2SO4 at OCP and 1.7 V were fitted by the equivalent circuit of Rs(Q1Rt)(Q2Rb). Meantime, the EIS data of the Ti3SiC2/Cu composites in dilute HNO3 at 0.8 V and in concentrated H2SO4 at 0.7 V were fitted by the equivalent circuit of Rs((Q1Rt(Q2Rb))). In dilute HNO3, when the potential was 0.55 V, the generation of a single-layer oxide film benefitted the corrosion resistance of the composites. When the potential was 0.8 V, a porous double-layer oxide film was formed, and its inner oxide film showed relatively poor corrosion resistance. At 1.75 V, the corrosive current density of the composites substantially decreased, because at low overpotentials the oxide film of the Ti-containing materials transformed from the noncrystalline state to the crystalline state, forming a densified oxide layer on the surface of the composites. In concentrated H2SO4, when the potential was 0.7 V, a double-layer oxide film was formed on the surface of the composites, which was favorable for its corrosion resistance. When the potential was 1.7 V, a single-layer oxide film was formed, and its corrosion resistance was further enhanced.
Polarization resistance (Rp) can be thought of as the association of Rb and Rt. According to the fitted results (see Table 2), the corrosion resistance of the Ti3SiC2/Cu composites in concentrated H2SO4 was superior. At 0.55 V, the Rb value of the Ti3SiC2/Cu composites in dilute HNO3 was relatively high, which was due to the generation of a single-layer oxide film on its surface. As the potential increased, for example, at 0.7 V, the oxide film of the composites converted from the single-layer film to a double-layer film, and the Rp value decreased [19]. When the potential was 1.75 V, the Rp value increased, because a dense single-layer oxide film composed of TiO2 was formed on the surface of the composites. In concentrated H2SO4, the polarization resistance of the Ti3SiC2/Cu composites increased with the increase in the potential. With the increase in the potential, the Rb value increased, because the doping ion made it thinner, with much larger surface area, causing the increase in the resistance of the positive current flow. As the potential increased, the Rt value decreased, because at the specific potentials the doping ions formed an energy barrier, which was related to the structural adjustment. On the other hand, it promoted the performance of the reverse current, decreasing the charge-transfer resistance [22,23,24].

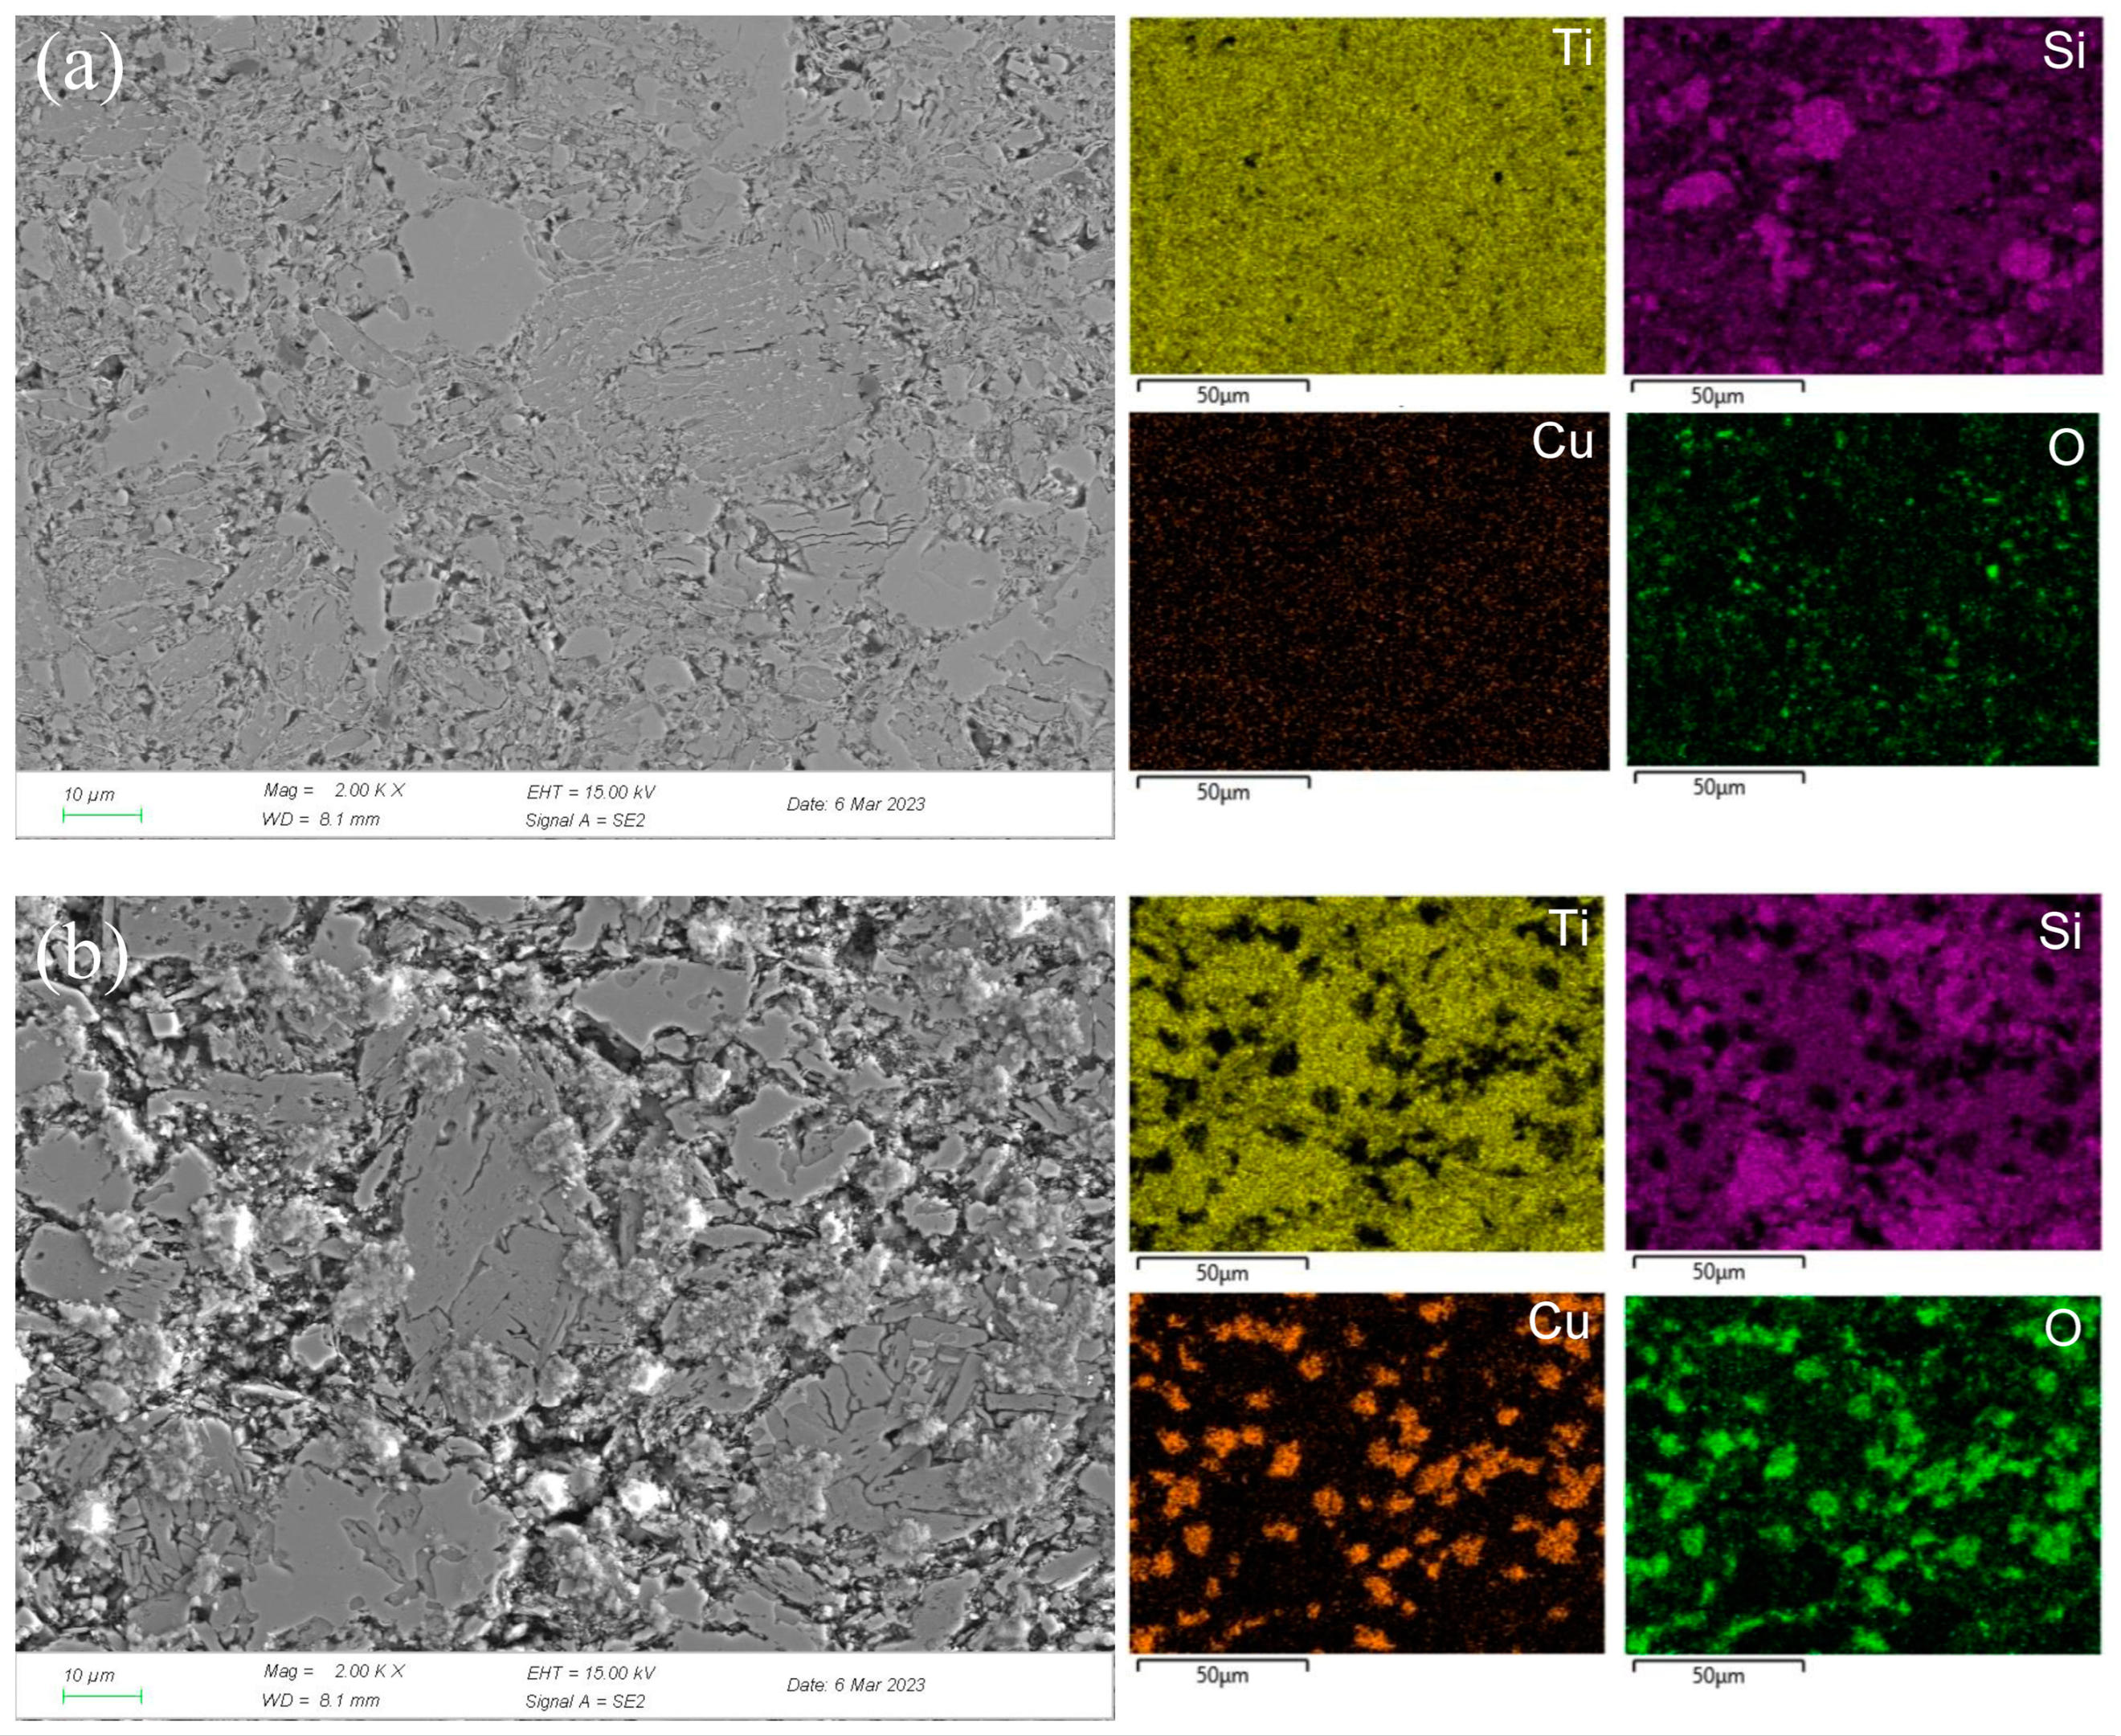
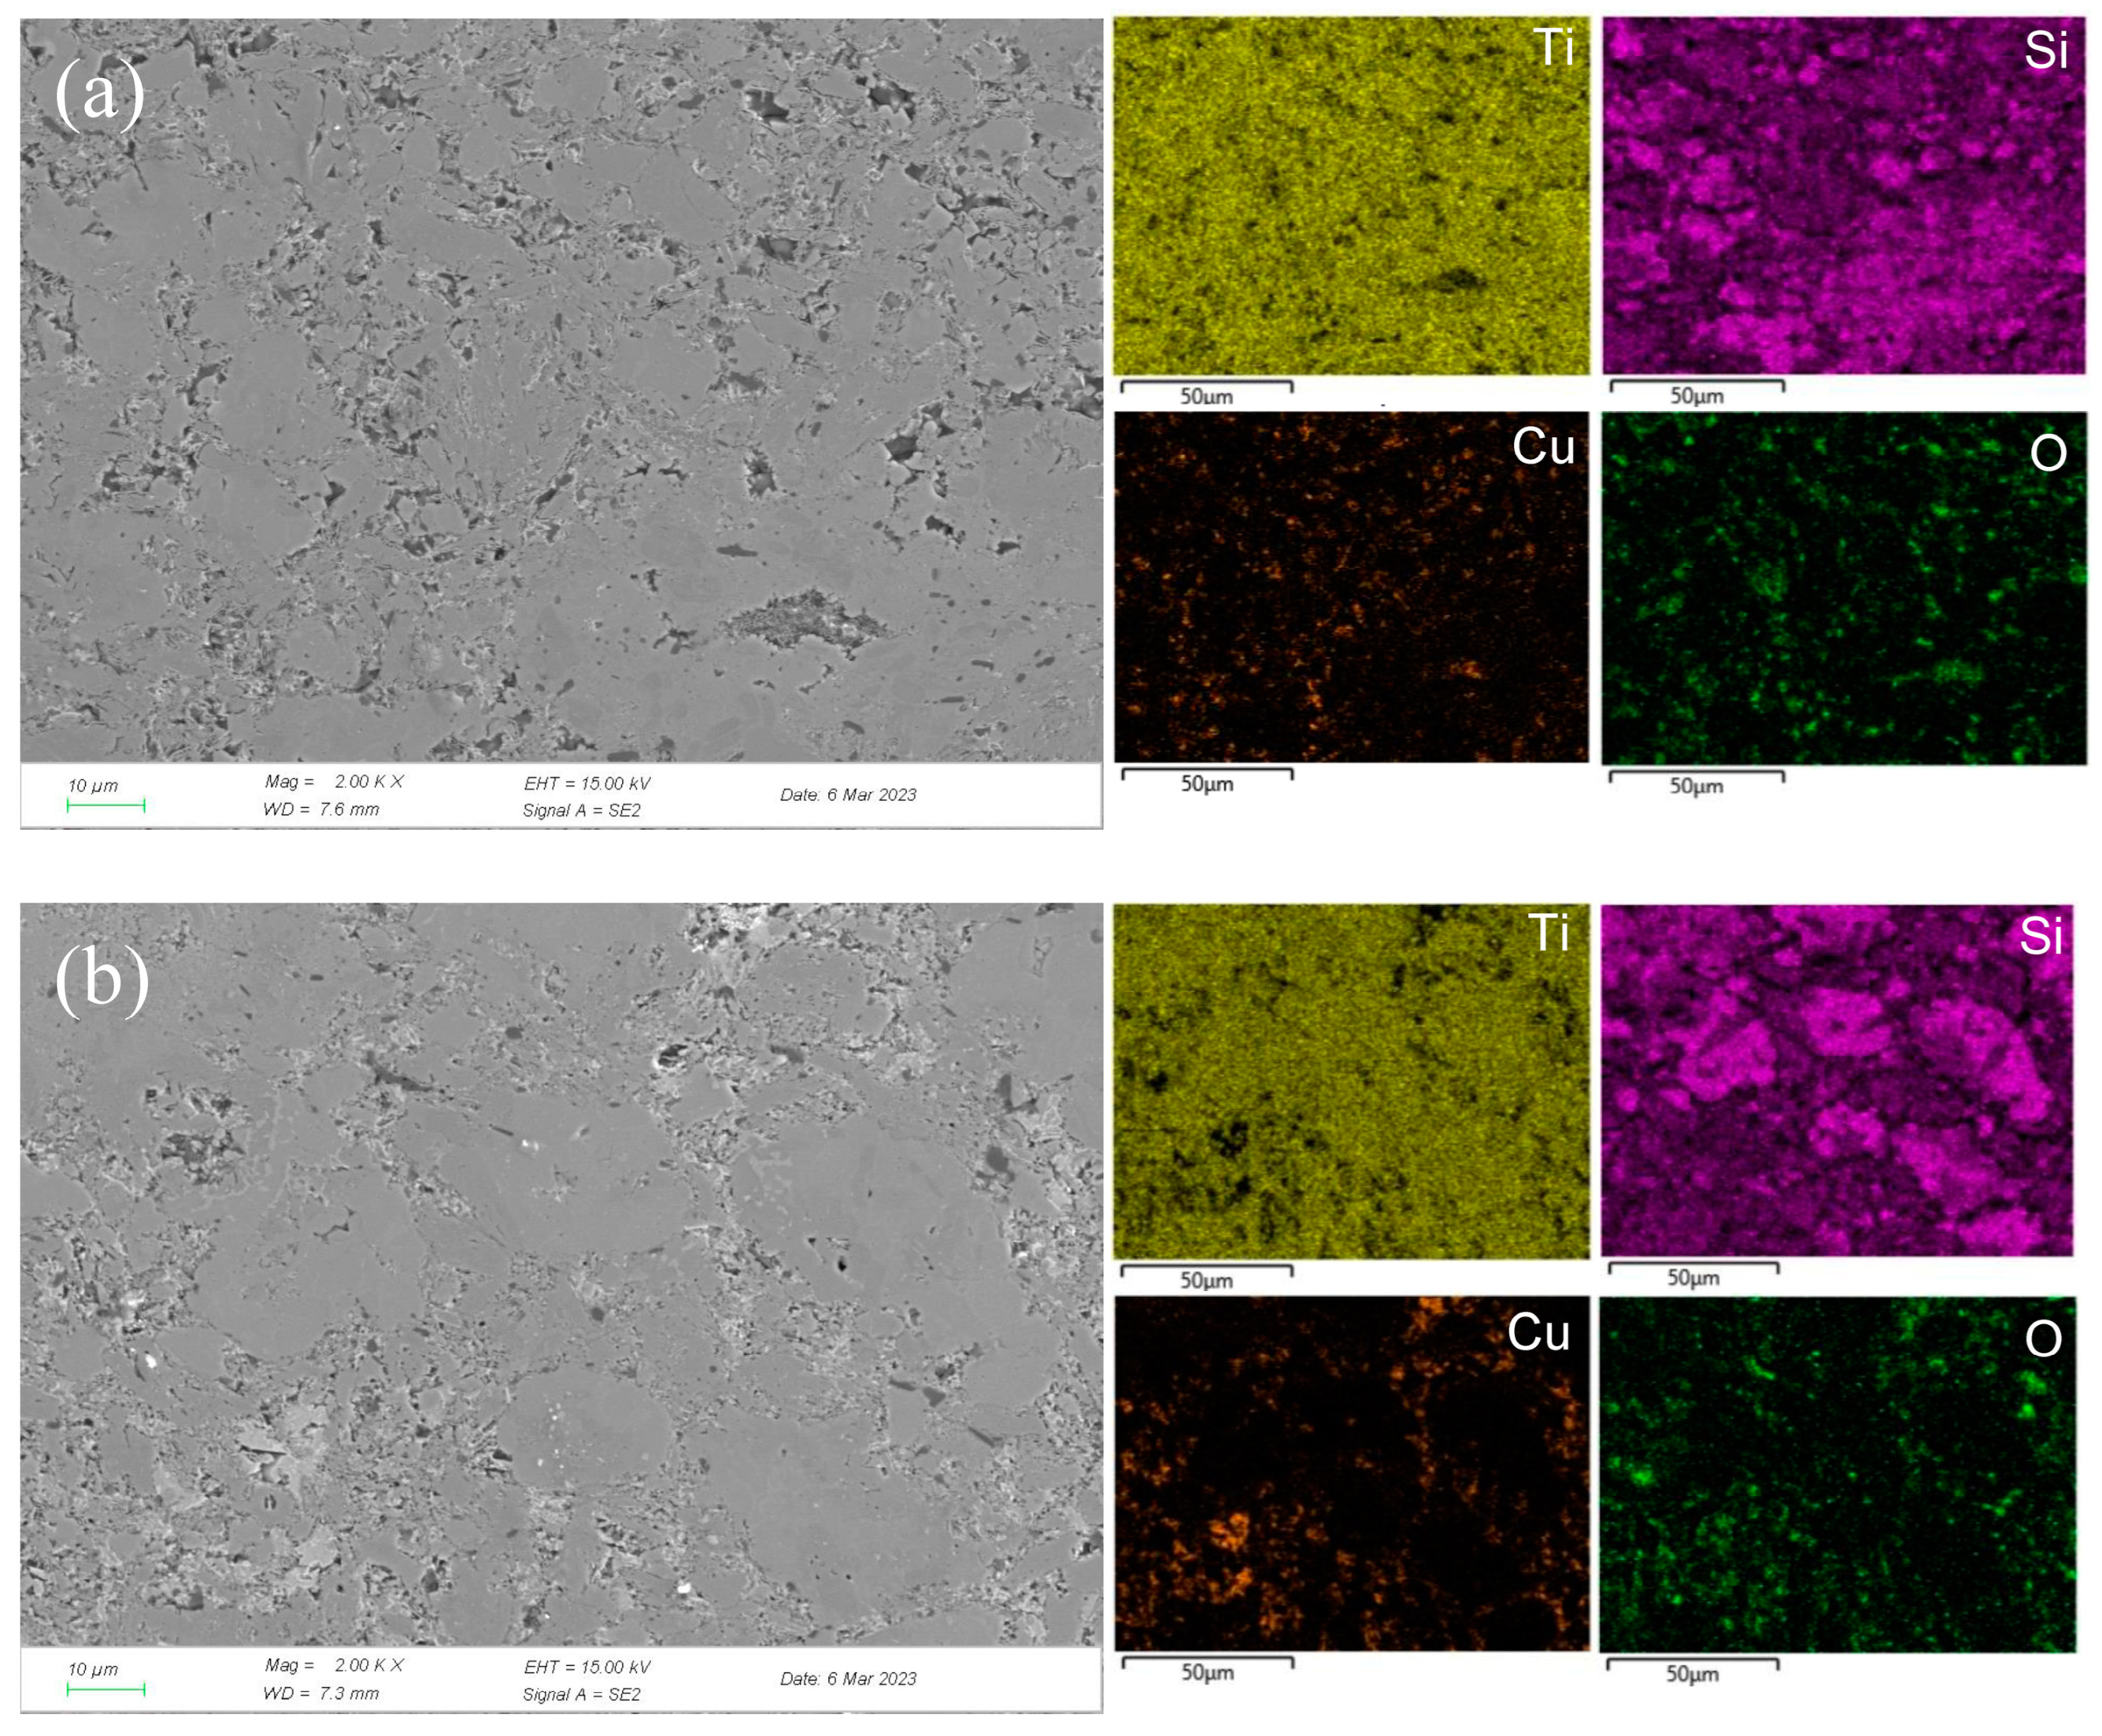
3.3. Surface Morphology and Composition of Polarization Surface

To reveal the passivation mechanism of the Ti3SiC2/Cu composites, XPS (see Figure 4 and Figure 5) was applied to investigate the chemical composition of the passivation surface under various voltages. As shown in Figure 4 and Figure 5, the chemical composition of the composites in two strong acids were obviously different. In HNO3 (11.6%), under all potentials, TiO2 positioned at 464 eV and 459 eV (see Figure 4) was detected for Ti 2p. However, in concentrated H2SO4, the Ti 2p was examined in the shape of TiO2 or TiO2−X (positioned at 455 eV and 459 eV). The Si 2p was measured in the form of SiO2 in dilute HNO3 (11.6%) (see Figure 4), while it was present as SiO2 or SiO2-X (positioned at 103 eV and 101 eV) in concentrated H2SO4 (see Figure 5). The Cu 2p was detected in the shape of CuO or Cu2O (positioned at 933 eV and 931 eV) in dilute HNO3 (11.6%), while it was present as Cu2O in concentrated H2SO4. After treatment in concentrated H2SO4, S2p was seen on the surface of the composites in the shape of SO(CH3O)2 or (CH3)2SO2 (positioned at 168 eV and 169 eV).
The chemical composition of the composites after immersion in two strong acids were compared. In dilute HNO3 (11.6%), with the increase in the potential, Ti 2p was examined only as TiO2, while those of Si and Cu varied with the potential. When the potentials were 0.55 V and 0.8 V, the Si and Cu were present in the shapes of SiO2 and CuO, respectively. As the voltage increased, for example, 1.75 V, SiO2 and CuO were transformed into SiO2−X and CuO2−X. In comparison, in concentrated H2SO4, with the increase in the potential, the Ti was always examined in the shapes of TiO2 and TiO2−X. Additionally, the Si and Cu were present as SiO2 and Cu2O, respectively. Interestingly, the S existed in different oxidation states with the change in the potential. Under low potentials (for example, 0.7 V), S 2p was present as SO(CH3O)2. When the potential increased, SO(CH3O)2 was transformed to (CH3)2SO2.

3.4. Corrosion Mechanism

To clearly explore the electrochemical corrosion mechanism in harsh media, the corrosion morphology of the Ti3SiC2/Cu composites (see Figure 6 and Figure 7) was analyzed, accompanied with a proposed-mechanism diagram (see Figure 8). In dilute HNO3, the Ti-Si bonds and Cu-Si bonds among the composites were relatively weak. During the corrosion process, Cu atoms and Si atoms were first dissolved. Then, the Si atoms diffused to the outside and were oxidized. On the other hand, the Ti atoms were oxidized in situ. Therefore, a double-layer oxide film consisting of an internal layer of TiO2 and an external layer of SiO2 formed. When the potential (from OCP to 0.2 V) was relatively low, the main reaction was reaction (1). As the voltage was >0.2 V, the dominant reaction was reaction (2) and a single-layer oxide film was generated. The character of the layered structure of the composites and the weak interaction of Cu-Si and Ti-C was beneficial for the outside diffusing of Cu and Si atoms, accelerating the reaction (2). Thus, a large amount of Cu and Si atoms was lost (see Figure 8a). At 0.55 V, the passivation gap was not wide, because the dissolution of Cu-Si compounds was favorable for the formation of holes or defects, resulting in the destruction of the passivation layer (see Figure 6a). When the potential was 0.8 V, the current density decreased again, and a passivation interval appeared, too. It was guessed that Cu atoms were oxidized around the holes or defects, repairing the passivation layer and forming a double-layer oxide film comprising an internal layer of TiO2 and an external layer of Cu2O and SiO2. However, the CuO formed was dissolved by the highly corrosive HNO3. According to Figure 1, when the potential was 1.4 V, the current density began to decrease, because the outer layer of SiO2 was dissolved and the inner layer of TiO2 was exposed.
In concentrated H2SO4, Ti-Si and Cu-Si bonds were first broken, then Cu and Si atoms diffused into the outside and were oxidized into Cu2O and SiO2, respectively. Moreover, Ti atoms were oxidized in situ. A double-layer oxide film consisting of an internal layer of TiO2 and an external layer of Cu2O and SiO2 was formed (see Figure 8b). When the potential (from OCP to 0.1 V) was relatively low, the main reaction was reaction (1). As the voltage was >0.1 V, the reaction (2) became the dominant reaction and a passivation layer was formed. With the increase in the potential, Cu-Si was seriously destroyed, resulting in the failure of the passivation layer. As shown in Figure 7 and Table 3, at 0.7 V, a few corrosion pits were detected on the surface of the Ti3SiC2/Cu composites and the atomic percentage of Cu decreased, which resulted from the dissolution of the Cu-Si compounds. In the passivation range, the surface of the composites was covered by a double-layer oxide film comprised of TiO2, SiO2 and Cu2O. Compared to the electrochemical corrosion morphology of other metal matrix composites in sulfuric acid, the corrosion samples in this experiment are more complete [25,26]. With the increase in the potential, the dissolution of Cu atoms led to the destruction of the passivation layer. As the voltage was 1.7 V, there was a large amount of Cu2O around the corrosion pits. A peak around 1 V appeared, and the generation of Cu2O on the surface repaired the oxide film. Additionally, TiO2−x was transformed into TiO2. Therefore, the corrosion resistance of the composites was improved. It was well known that it was possible for the oxide film of the Ti-containing material to transform from amorphous to crystalline under low potentials, causing the appearance of the second peak (see Figure 1). As the voltage was >1.4 V, a secondary passivation occurred for the Ti3SiC2/Cu composites. At this moment, TiO2−x began to transformed into TiO2, forming a dense single-layer oxide film.

4. Conclusions

The electrochemical corrosion behaviors of the Ti3SiC2/Cu composites in dilute HNO3 and concentrated H2SO4 were studied. The results show that the Ti3SiC2/Cu composites have better electrochemical corrosion resistance in concentrated H2SO4. In dilute HNO3 (11.6%) solution, when the potential reaches 0.55 V the formation of a single layer of oxide film occurs; when the potential continues to rise, the Ti3SiC2/Cu surface tends to stabilize, the corrosion current density appears to be substantially decreased, and the material on the surface of the oxide film gradually becomes dense. In the concentrated H2SO4 solution, when the potential reaches 0.7 V, the Ti3SiC2/Cu composite surface formed a double-layer oxide film, thus improving the corrosion resistance. With the increase in potential, the oxide film is more stable and the corrosion resistance is stronger.

Author Contributions

Conceptualization, R.Z. and C.D.; data curation, C.D. and C.W.; formal analysis, R.Z., C.D., F.L. and C.W.; investigation, R.Z., F.L., C.D. and C.W.; methodology, R.Z., C.D., F.L. and C.W.; writing—original draft, R.Z., F.L., C.D. and C.W.; writing—review and editing, R.Z., F.L. and C.D. All authors have read and agreed to the published version of the manuscript.

Funding

The author acknowledges the financial support from the Open Project of State Key Laboratory of Solid Lubrication, Chinese Academy of Sciences (LSL-2115).

Institutional Review Board Statement

There are no human subjects in this article, and ethical approval is not applicable.

Informed Consent Statement

There are no human subjects in this article, and informed consent is not applicable.

Data Availability Statement

Data are contained within the article.

Conflicts of Interest

All authors of this research paper have directly participated in the planning, execution, or analysis of the study. All authors of this paper have read and approved the final version submitted. The contents of this manuscript have not been copyrighted or published previously. The contents of this manuscript are not under consideration for publication elsewhere. The contents of this manuscript will not be copyrighted, submitted, or published elsewhere while acceptance by the manuscript is under consideration. There are no directly related manuscripts or abstracts, published or unpublished, by any author(s) of this paper.

References

  1. Bai, Y.; Srikanth, N.; Chua, C.K.; Zhou, K. Density Functional Theory Study of Mn+1AXn Phases: A Review. Crit. Rev. Solid State Mater. Sci. 2019, 44, 56–107. [Google Scholar] [CrossRef]
  2. Zhang, J.; Chen, K.; Sun, X.; Liu, M.; Hu, X.; He, L.; Huang, Z.; Chai, Z.; Xiao, X.; Song, Y.; et al. MAX Phase Ceramics/Composites with Complex Shapes. ACS Appl. Mater. Interfaces 2021, 13, 5645–5651. [Google Scholar] [CrossRef]
  3. Huang, X.; Feng, Y.; Qian, G.; Zhou, Z. Arc ablation properties of Ti3SiC2 material. Ceram. Int. 2019, 45, 20297–20306. [Google Scholar] [CrossRef]
  4. El Saeed, M.A.; Deorsola, F.A.; Rashad, R.M. Influence of SPS parameters on the density and mechanical properties of sintered Ti3SiC2 powders. Int. J. Refract. Met. Hard Mater. 2013, 41, 48–53. [Google Scholar] [CrossRef]
  5. Ghosh, N.C.; Harimkar, S.P. Microstructure and wear behavior of spark plasma sintered Ti3SiC2 and Ti3SiC2–TiC composites. Ceram. Int. 2013, 39, 4597–4607. [Google Scholar] [CrossRef]
  6. Jovic, V.D.; Jovic, B.M.; Gupta, S.; El-Raghy, T.; Barsoum, M.W. Corrosion behavior of select MAX phases in NaOH, HCl and H2SO4. Corros. Sci. 2006, 48, 4274–4282. [Google Scholar] [CrossRef]
  7. Ngai, S.; Zhang, P.; Xie, H.; Wu, H.; Ngai, T.; Li, L.; Li, W.; Vogel, F. Influence of Ti3SiC2 content on erosion behavior of Cu–Ti3SiC2 cathode under vacuum arc. Ceram. Int. 2021, 47, 25973–25985. [Google Scholar] [CrossRef]
  8. Jiang, Y.; He, Y. Electrochemical corrosion behavior of micrometer-sized porous Ti3SiC2 compounds in NaCl solution. Mater. Corros. 2020, 71, 54–59. [Google Scholar] [CrossRef]
  9. Zhu, M.; Wang, R.; Chen, C.; Zhang, H.B.; Zhang, G.J. Comparison of corrosion behavior of Ti3SiC2 and Ti3AlC2 in NaCl solutions with Ti. Ceram. Int. 2017, 43, 5708–5714. [Google Scholar] [CrossRef]
  10. Barsoum, M.W. The MN+1AXN phases: A new class of solids: Thermodynamically stable nanolaminates. Prog. Solid State Chem. 2000, 28, 201–281. [Google Scholar] [CrossRef]
  11. Zhang, R.; Sun, M.; Wu, C.; Liu, F. Corrosion behaviors of Ti3SiC2/Cu in dilute HNO3 and concentrated H2SO4 and its corrosion mechanism. Ceram. Int. 2023, 49, 37623–37629. [Google Scholar] [CrossRef]
  12. Wu, C.; Zhang, R.; Liu, F.; Chen, B. Electrochemical corrosion behaviors of Ti3SiC2/Cu composites in a 3.5% NaCl solution. Int. J. Appl. Ceram. Technol. 2023, 20, 1846–1854. [Google Scholar] [CrossRef]
  13. Jin, P.; Nesic, S. Mechanism of magnetite formation in high temperature naphthenic acid corrosion by crude oil fractions. Corros. Sci. 2017, 115, 93–105. [Google Scholar] [CrossRef]
  14. Wang, G.; Liu, X.-B.; Zhu, G.-X.; Zhu, Y.; Liu, Y.-F.; Zhang, L.; Wang, J.-L. Tribological study of Ti3SiC2/Cu5Si/TiC reinforced Co-based coatings on SUS304 steel by laser cladding. Surf. Coat. Technol. 2022, 432, 128064. [Google Scholar] [CrossRef]
  15. Ma, S.; Zhang, R.; Liu, F.; Chen, B.; Wu, C. Influence of Cu content on the microstructure and mechanical property of Ti3SiC2/Cu composites. Mater. Res. Express 2022, 9, 055603. [Google Scholar] [CrossRef]
  16. Duarte, T.; Meyer, Y.A.; Osório, W.R. The Holes of Zn Phosphate and Hot Dip Galvanizing on Electrochemical Behaviors of Multi-Coatings on Steel Substrates. Metals 2022, 12, 863. [Google Scholar] [CrossRef]
  17. McCafferty, E. Validation of corrosion rates measured by the Tafel extrapolation method. Corros. Sci. 2005, 47, 3202–3215. [Google Scholar] [CrossRef]
  18. Zhang, X.L.; Jiang, Z.H.; Yao, Z.P.; Song, Y.; Wu, Z.D. Effects of scan rate on the potentiodynamic polarization curve obtained to determine the Tafel slopes and corrosion current density. Corros. Sci. 2009, 51, 581–587. [Google Scholar] [CrossRef]
  19. Zhu, M.; Wang, R.; Chen, C.; Zhang, H.; Zhang, G. Electrochemical study on the corrosion behavior of Ti3SiC2 in 3.5% NaCl solution. RSC Adv. 2017, 7, 12534–12540. [Google Scholar] [CrossRef]
  20. Macdonald, D.D. Passivity–the key to our metals-based civilization. Pure Appl. Chem. 1999, 71, 951–978. [Google Scholar] [CrossRef]
  21. Verissimo, N.C.; Freitas, E.S.; Cheung, N.; Garcia, A.; Osório, W.R. The effects of Zn segregation and microstructure length scale on the corrosion behavior of a directionally solidified Mg-25 wt.% Zn alloy. J. Alloys Compd. 2017, 723, 649–660. [Google Scholar] [CrossRef]
  22. Huang, L.; Diao, D.; Cao, Y. Electrochemical corrosion behaviors of N-doped graphene sheets embedded carbon films in acid. Appl. Surf. Sci. 2021, 544, 148781. [Google Scholar] [CrossRef]
  23. Cao, M.; Liu, L.; Yu, Z.; Fan, L.; Li, Y.; Wang, F. Electrochemical corrosion behavior of 2A02 Al alloy under an accelerated simulation marine atmospheric environment. J. Mater. Sci. Technol. 2019, 35, 651–659. [Google Scholar] [CrossRef]
  24. Han, S.; Zhang, J.; Lei, X.; Yang, R.; Wang, N. Insight into the anisotropic electrochemical corrosion behaviors of laser metal deposited Ni-based single crystal superalloy. Corros. Sci. 2023, 217, 111111. [Google Scholar] [CrossRef]
  25. Pan, T.J.; Chen, Y.; Zhang, B.; Hu, J.; Li, C. Corrosion behavior of niobium coated 304 stainless steel in acid solution. Appl. Surf. Sci. 2016, 369, 320–325. [Google Scholar] [CrossRef]
  26. Li, Y.; Qu, L.; Wang, F. The electrochemical corrosion behavior of TiN and (Ti,Al)N coatings in acid and salt solution. Corros. Sci. 2003, 45, 1367–1381. [Google Scholar] [CrossRef]
Figure 1. Polarization curves of Ti3SiC2/Cu composites in dilute HNO3 (11.6%) and concentrated H2SO4.
Materials 17 04035 g001
Figure 2. Bode and Nyquist plots of Ti3SiC2/Cu composites soaking in dilute HNO3 (11.6%) and concentrated H2SO4 for 30 min under OCP and potentiostatic polarization under different potentials for 12 h: (a) Bode plot of Ti3SiC2/Cu in dilute HNO3 (11.6%), (b) Nyquist plot of Ti3SiC2/Cu in dilute HNO3 (11.6%), (c) Bode plot of Ti3SiC2/Cu in concentrated H2SO4 and (d) Nyquist plot of Ti3SiC2/Cu in concentrated H2SO4.
Materials 17 04035 g002
Figure 3. Equivalent circuit diagrams of Ti3SiC2/Cu composites in dilute HNO3 (11.6%) and concentrated H2SO4 at different potentials: (a) Ti3SiC2/Cu in dilute HNO3 (11.6%) at different potentials (such as OCP, 0.55 V, 1.75 V) and in concentrated H2SO4 at 1.7 V; (b) Ti3SiC2/Cu in dilute HNO3 (11.6%) at 0.8 V and in concentrated H2SO4 at OCP and 0.7 V. (Rs represents the solution resistance. Q1 and Rt represent the electric double-layer capacitance and charge-transfer resistance, respectively. Q2 and Rb represent barrier capacitance and resistance, respectively.)
Materials 17 04035 g003
Figure 4. The XPS spectra of Ti, Si and Cu for Ti3SiC2/Cu soaking in dilute HNO3 (11.6%) at 0.55 V, 0.8 V and 1.75 V.
Materials 17 04035 g004
Figure 5. The XPS spectra of Ti, Cu, Si and S for Ti3SiC2/Cu potentiostatic polarization in concentrated H2SO4 at 0.7 V and 1.7 V.
Materials 17 04035 g005
Figure 6. SEM micrographs and the corresponding elemental mapping distribution of Ti3SiC2/Cu after potentiostatic polarization in dilute HNO3 (11.6%) for 12 h at 0.55 V (a) and 0.8 V (b).
Materials 17 04035 g006
Figure 7. SEM micrographs and the corresponding elemental mapping distribution of Ti3SiC2/Cu after potentiostatic polarization in concentrated H2SO4 for 12 h at 0.7 V (a) and 1.7 V (b).
Materials 17 04035 g007
Figure 8. The passivation schematic of Ti3SiC2 in (a) dilute HNO3 (11.6%) and (b) concentrated H2SO4.
Materials 17 04035 g008
Table 1. The electrochemical parameters of Ti3SiC2 and Ti3SiC2/Cu in dilute HNO3 and concentrated H2SO4.
Ecorr (V)icorr (A/cm2)ip (A/cm2)Ep (V)
HNO3 (11.6%)0.067.05 × 10−45.01 × 10−50.55
H2SO403.01 × 10−66.87 × 10−60.6
Table 2. The equivalent circuit fitting parameters of Ti3SiC2/Cu in dilute HNO3 and concentrated H2SO4 under different conditions.
Rs (Ω·cm2)Q1 (10−4F/cm2)Rt (Ω·cm2)Q2 (10−4 F/cm2)Rb (Ω·cm2)
HNO3 (11.6%)OCP0.7151120.389.785118,6004.79
0.55 V0.84609.9614.66816.6634.75
0.8 V0.7277127.529.77817,6308.679
1.75 V1.023143.887.1292875.117.46
H2SO4OCP5.678.91430.924.1921843
0.7 V5.2516.81300.110.4176731
1.7 V4.7441.5277.811315,275
Table 3. Atomic ratios of Ti3SiC2/Cu in dilute HNO3 and concentrated H2SO4.
SamplesAtomic Percentages
HNO3 (11.6%)0.55 V37.3%Ti, 11.17%Si, 31.28%C, 0.66%Cu, 17.75%O
0.8 V22.48%Ti, 11.01%Si, 18.82%C, 4.25%Cu, 41.54%O
1.75 V38.2%Ti, 13.22%Si, 27.17%C, 0.34%Cu, 19.06%O
H2SO40.7 V34.59%Ti, 17.72%Si, 29.82%C, 2.91%Cu, 17.72%O, 0.13%S
1.7 V34.25%Ti, 13.94%Si, 31.26%C, 5.45%Cu, 13.94%O, 0.06%S
Disclaimer/Publisher’s Note: The statements, opinions and data contained in all publications are solely those of the individual author(s) and contributor(s) and not of MDPI and/or the editor(s). MDPI and/or the editor(s) disclaim responsibility for any injury to people or property resulting from any ideas, methods, instructions or products referred to in the content.

