
Evaluating the Role of Mortar Composition on the Cyclic Behavior of Unreinforced Masonry Shear Walls


Abstract
1. Introduction
2. Materials and Specimens
- Standard curing. The mixing procedures recommended by the European standards [62,63] were followed for the three mortar mixes, namely REF, L50, and L67. The cement-only mix (REF) was cured following the specifications of EN 196-1 [63]. Therefore, the molds containing this mix were covered with plastic and kept in a climatic chamber, 20 ± 1 °C and 95 ± 5% RH, for the first 24 h. After that, the REF specimens were demolded and submerged in water at 20 ± 1 °C until the time of testing. The other two mortar mixes containing lime-cement binders (L50 and L67), were cured in a climatic chamber, 20 ± 1 °C and 95 ± 5% RH, during the first 7 days, and then at 20 ± 1 °C and 65 ± 5% RH until the age of testing. The standard EN 1015-11 [62] was used to decide when to demold the lime-cement mortar specimens, recommending demolding after 2 days if the lime content in the binder is lower than 50% by mass.
- In situ conditions. The three types of mixes (REF, L50, and L67) employed for the construction of masonry specimens were cast in large quantities. During the preparation of the walls, small portions of mortar were taken from these large batches and placed into molds near the masonry specimens. Thus, these “in situ mortars” were cured under the same temperature and relative humidity conditions as the masonry walls.
3. Experimental Setup
4. Results and Discussion
5. Conclusions
Author Contributions
Funding
Institutional Review Board Statement
Informed Consent Statement
Data Availability Statement
Acknowledgments
Conflicts of Interest
Notation
| Area under resistance envelope [N·m] | |
| Cohesion [Pa] | |
| CoV | Coefficient of variation [%] |
| Crack limit lateral displacement [m] | |
| Idealized elastic displacement [m] | |
| Displacement at maximum lateral force [N] | |
| Maximum lateral displacement [m] | |
| Displacement at ultimate lateral force [m] | |
| Elastic modulus [Pa] | |
| Cumulative normalized energy [–] | |
| Crack limit lateral force [N] | |
| Force at maximum lateral displacement [N] | |
| Flexural cracking onset lateral force [N] | |
| Maximum lateral force [N] | |
| Ultimate lateral force [N] | |
| Flexural strength [Pa] | |
| Compressive strength [Pa] | |
| Tensile strength [Pa] | |
| Tensile strength of brick [Pa] | |
| Tensile strength of mortar bed joint [Pa] | |
| Characteristic shear strength [Pa] | |
| Initial shear strength [Pa] | |
| Height [m] | |
| Rectangular compressed section distribution factor [–] | |
| Effective secant stiffness [N/m] | |
| Secant stiffness at maximum capacity [N/m] | |
| Length [m] | |
| Number of load cycles [–] | |
| Height/length ratio factor [–] | |
| Thickness [m] | |
| Design shear force (maximum lateral capacity) [N] | |
| w/b | Water to binder ratio [–] |
| Height-to-length ratio | |
| Material safety coefficient [–] | |
| Friction coefficient | |
| Maximum force to crack limit displacement ratio [–] | |
| Ultimate to idealized displacement ratio [–] | |
| Compressive stress [Pa] | |
| Shear stress [Pa] | |
| Shear stress relevant to the cracked section [Pa] | |
| Shear stress at maximum lateral load capacity [Pa] | |
| Shear stress relative to the whole section [Pa] |
References
- Tomaževič, M. Shear Resistance of Masonry Walls and Eurocode 6: Shear versus Tensile Strength of Masonry. Mater. Struct. 2009, 42, 889–907. [Google Scholar] [CrossRef]
- Vasconcelos, G. Experimental Investigations on the Mechanics of Stone Masonry: Characterization of Granites and Behavior of Ancient Masonry Shear Walls. Ph.D. Dissertation, University of Minho, Guimarães, Portugal, 2005. [Google Scholar]
- Calvi, G.M.; Kingsley, G.R.; Magenes, G. Testing of Masonry Structures for Seismic Assessment. Earthq. Spectra 1996, 12, 145–162. [Google Scholar] [CrossRef]
- Shing, P.B.; Noland, J.L.; Klamerus, E.; Spaeh, H. Inelastic Behavior of Concrete Masonry Shear Walls. J. Struct. Eng. 1989, 115, 2204–2225. [Google Scholar] [CrossRef]
- Tomaževič, M.; Lutman, M.; Petković, L. Seismic Behavior of Masonry Walls: Experimental Simulation. J. Struct. Eng. 1996, 122, 1040–1047. [Google Scholar] [CrossRef]
- Tomaževič, M. Earthquake-Resistant Design of Masonry Buildings; Imperial College Press: London, UK, 1999; Volume 1, ISBN 978-1-86094-066-8. [Google Scholar]
- Tomaževič, M.; Gams, M.; Lu, S. Modelling of Shear Failure Mechanism of Masonry Walls. In Proceedings of the 11th Canadian Masonry Symposium, Toronto, ON, Canada, 31 May–3 June 2009. [Google Scholar]
- Sandoval, O.J.; Takeuchi, C.; Carrillo, J.; Barahona, B. Performance of Unreinforced Masonry Panels Strengthened with Mortar Overlays Reinforced with Welded Wire Mesh and Transverse Connectors. Constr. Build. Mater. 2021, 267, 121054. [Google Scholar] [CrossRef]
- Andreaus, U. Failure Criteria for Masonry Panels under In-Plane Loading. J. Struct. Eng. 1996, 122, 37–46. [Google Scholar] [CrossRef]
- Salmanpour, A.; Mojsilovic, N.; Schwartz, J. Deformation Capacity of Unreinforced Masonry Walls Subjected to In-Plane Loading: A State-of-the-Art Review. Int. J. Adv. Struct. Eng. 2013, 5, 22. [Google Scholar] [CrossRef]
- Balasubramanian, S.R.; Vaidyanathan, C.V.; Lakshmanan, N.; Anoop, M.B.; Balaji Rao, K. In-Plane Shear Behaviour of Unreinforced Brick Masonry—A Literature Review. In Structural Analysis of Historical Constructions 2006; Lourenço, P.B., Modena, P.R.C., Agrawal, S., Eds.; Macmillan: New Delhi, India, 2006; pp. 1041–1050. [Google Scholar]
- Javed, M. Seismic Risk Assessment of Unreinforced Brick Masonry Buildings System of Northern Pakistan. Ph.D. Dissertation, NWFP University of Engineering and Technology, Peshawar, Pakistan, 2009. [Google Scholar]
- Parisi, F.; Iovinella, I.; Balsamo, A.; Augenti, N.; Prota, A. In-Plane Behaviour of Tuff Masonry Strengthened with Inorganic Matrix–Grid Composites. Compos. B Eng. 2013, 45, 1657–1666. [Google Scholar] [CrossRef]
- Tomar, A.; Paul, D.K.; Agarwal, P. Compression and Cyclic Shear Behavior of Lime Mortar Brick Masonry. J. Earthq. Tsunami 2017, 11, 1750015. [Google Scholar] [CrossRef]
- Mercedes, L.; Bernat-Maso, E.; Gil, L. In-Plane Cyclic Loading of Masonry Walls Strengthened by Vegetal-Fabric-Reinforced Cementitious Matrix (FRCM) Composites. Eng. Struct. 2020, 221, 111097. [Google Scholar] [CrossRef]
- Turnšek, V.; Cacovic, F. Some Experimental Results on the Strength of Brick Masonry Walls. In Proceedings of the 2nd International Brick Masonry Conference, Stoke-on-Trent, UK, 12–15 April 1970; British Ceramic Society: Stoke-on-Trent, UK, 1971; pp. 149–156. [Google Scholar]
- EN 1996-1-1:2005; Eurocode 6: Design of Masonry Structures—Part 1-1: General Rules for Reinforced and Unreinforced Masonry Structures. CEN (European Committee for Standardization): Brussels, Belgium, 2005.
- Magenes, G.; Calvi, G.M. In-Plane Seismic Response of Brick Masonry Walls. Earthq. Eng. Struct. Dyn. 1997, 26, 1091–1112. [Google Scholar] [CrossRef]
- Mann, W.; Mueller, H. Failure of Shear-Stressed Masonry: An Enlarged Theory, Tests and Application to Shear Walls. Proc. Br. Ceram. Soc. 1982, 30, 223–235. [Google Scholar]
- Alecci, V.; Fagone, M.; Rotunno, T.; De Stefano, M. Shear Strength of Brick Masonry Walls Assembled with Different Types of Mortar. Constr. Build. Mater. 2013, 40, 1038–1045. [Google Scholar] [CrossRef]
- Singh, S.B.; Munjal, P. Bond Strength and Compressive Stress-Strain Characteristics of Brick Masonry. J. Build. Eng. 2017, 9, 10–16. [Google Scholar] [CrossRef]
- Dehghan, S.M.; Najafgholipour, M.A.; Baneshi, V.; Rowshanzamir, M. Mechanical and Bond Properties of Solid Clay Brick Masonry with Different Sand Grading. Constr. Build. Mater. 2018, 174, 1–10. [Google Scholar] [CrossRef]
- Ramesh, M.; Parente, M.; Azenha, M.; Lourenço, P.B. Influence of Lime on Strength of Structural Unreinforced Masonry: Toward Improved Sustainability in Masonry Mortars. Sustainability 2023, 15, 15320. [Google Scholar] [CrossRef]
- Stratford, T.; Pascale, G.; Manfroni, O.; Bonfiglioli, B. Shear Strengthening Masonry Panels with Sheet Glass-Fiber Reinforced Polymer. J. Compos. Constr. 2004, 8, 434–443. [Google Scholar] [CrossRef]
- Marcari, G.; Manfredi, G.; Prota, A.; Pecce, M. In-Plane Shear Performance of Masonry Panels Strengthened with FRP. Compos. B Eng. 2007, 38, 887–901. [Google Scholar] [CrossRef]
- Deng, M.; Zhang, W.; Li, N. In-Plane Cyclic Loading Tests of Concrete Hollow Block Masonry Walls Retrofitted with High Ductile Fiber-Reinforced Concrete. Constr. Build. Mater. 2020, 238, 117758. [Google Scholar] [CrossRef]
- Capozucca, R.; Magagnini, E. Experimental Response of Masonry Walls In-Plane Loading Strengthened with GFRP Strips. Compos. Struct. 2020, 235, 111735. [Google Scholar] [CrossRef]
- Ivorra, S.; Torres, B.; Baeza, F.J.; Bru, D. In-Plane Shear Cyclic Behavior of Windowed Masonry Walls Reinforced with Textile Reinforced Mortars. Eng. Struct. 2021, 226, 111343. [Google Scholar] [CrossRef]
- Rezaee, S.R.S.; Soltani, M.; Nikooravesh, M. Cyclic In-Plane Behavior of Unreinforced and Confined Masonry Walls Retrofitted by Shotcrete: Experimental Investigation. Eng. Struct. 2022, 264, 114432. [Google Scholar] [CrossRef]
- Jing, J.; Zhou, C.; Zhang, C.; Li, T. In-Plane Cyclic Behavior of Brick Walls Strengthened with CFRP Plates Embedded in the Horizontal Mortar Joint. J. Build. Eng. 2023, 63, 105476. [Google Scholar] [CrossRef]
- Garcia-Ramonda, L.; Pelà, L.; Roca, P.; Camata, G. Experimental and Numerical Insights on the In-Plane Behaviour of Unreinforced and TRM/SRG Retrofitted Brick Masonry Walls by Diagonal Compression and Shear-Compression Testing. Constr. Build. Mater. 2023, 402, 132997. [Google Scholar] [CrossRef]
- Vienni, C.; Salvatori, L.; Orlando, M. Cyclic Shear-Compression Tests on CRM Reinforced Brick Masonry Walls. Procedia Struct. Integr. 2022, 44, 2262–2269. [Google Scholar] [CrossRef]
- Beyer, K.; Dazio, A. Quasi-Static Cyclic Tests on Masonry Spandrels. Earthq. Spectra 2012, 28, 907–929. [Google Scholar] [CrossRef]
- Howlader, M.K.; Masia, M.J.; Griffith, M.C. Digital Image Correlation for the Analysis of In-Plane Tested Unreinforced Masonry Walls. Structures 2021, 29, 427–445. [Google Scholar] [CrossRef]
- Tripathy, D.; Singhal, V. Experimental and Analytical Investigation of Opening Effects on the In-Plane Capacity of Unreinforced Masonry Wall. Eng. Struct. 2024, 311, 118161. [Google Scholar] [CrossRef]
- Pan, J.L.; Shen, J.X.; Zhong, Z.L.; Xia, Y.; Li, X.D.; Zhang, Y.Q. Damage Evolution and Failure Mechanism of Masonry Walls under In-Plane Cyclic Loading. Eng. Fail. Anal. 2024, 161, 108240. [Google Scholar] [CrossRef]
- Vasconcelos, G.; Lourenço, P.B. In-Plane Experimental Behavior of Stone Masonry Walls under Cyclic Loading. J. Struct. Eng. 2009, 135, 1269–1277. [Google Scholar] [CrossRef]
- Salmanpour, A.H. Displacement Capacity of Structural Masonry. Ph.D. Dissertation, ETH Zürich, Zürich, Switzerland, 2017. [Google Scholar]
- EN 197-1:2011; Cement—Part 1: Composition, Specifications and Conformity Criteria for Common Cements. CEN (European Committee for Standardization): Brussels, Belgium, 2011.
- EN 459-1:2015; Building Lime—Part 1: Definitions, Specifications and Conformity Criteria. CEN (European Committee for Standardization): Brussels, Belgium, 2015.
- EN 459-2:2021; Building Lime—Part 2: Test Methods. CEN (European Committee for Standardization): Brussels, Belgium, 2021.
- Vicente, R.S.; Rodrigues, H.; Varum, H.; Costa, A.; Mendes da Silva, J.A.R. Performance of Masonry Enclosure Walls: Lessons Learned from Recent Earthquakes. Earthq. Eng. Eng. Vib. 2012, 11, 23–34. [Google Scholar] [CrossRef]
- Thomaz, E.; Sousa, H.; Roman, H.R.; Morton, J.; Silva, J.M.; Correa, M.; Pfeffermann, O.; Lourenço, P.B.; Vicente, R.S.; Sousa, R. Defects in Masonry Walls—Guidance on Cracking: Identification, Prevention and Repair; International Council for Research and Innovation in Building and Construction: Ottawa, ON, Canada, 2014. [Google Scholar]
- Lavagna, M.; Baldassarri, C.; Campioli, A.; Giorgi, S.; Dalla Valle, A.; Castellani, V.; Sala, S. Benchmarks for Environmental Impact of Housing in Europe: Definition of Archetypes and LCA of the Residential Building Stock. Build. Env. 2018, 145, 260–275. [Google Scholar] [CrossRef]
- Hooker, K.A. Mortar, Brick, and IRA. Available online: https://www.concreteconstruction.net/how-to/construction/mortar-brick-and-ira_o (accessed on 30 July 2024).
- Rots, J.G. Structural Masonry—An Experimental/Numerical Basis for Practical Design Rules (CUR Report 171), 1st ed.; CRC Press: Boca Raton, FL, USA, 1997. [Google Scholar]
- Sousa, H. Portuguese Masonry Building Enclosures. Practices and Problems. In Proceedings of the 37th Commission Meeting—CIB W023 (Wall Structures), University Park, PA, USA, August 2000. [Google Scholar]
- Lourenço, P.B.; Fernandes, F.M.; Castro, F. Handmade Clay Bricks: Chemical, Physical and Mechanical Properties. Int. J. Archit. Herit. 2010, 4, 38–58. [Google Scholar] [CrossRef]
- BDA (Brick Development Association). The UK Clay Brickmaking Process—General Guide; Brick Development Association: London, UK, 2022. [Google Scholar]
- EuLA (European Lime Association). Construction & Civil Engineering; European Lime Association: Brussels, Belgium, 2024. [Google Scholar]
- EN 771-1:2011+A1:2015; Specification for Masonry Units—Part 1: Clay Masonry Units. CEN (European Committee for Standardization): Brussels, Belgium, 2015.
- EN 772-1:2011+A1:2015; Methods of Test for Masonry Units—Part 1: Determination of Compressive Strength. CEN (European Committee for Standardization): Brussels, Belgium, 2015.
- Ramesh, M.; Azenha, M.; Lourenço, P.B. Quantification of Impact of Lime on Mechanical Behaviour of Lime Cement Blended Mortars for Bedding Joints in Masonry Systems. Constr. Build. Mater. 2019, 229, 116884. [Google Scholar] [CrossRef]
- Francis, J.A.; Horman, C.B.; Jerrems, E.L. The Effect of Joint Thickness and Other Factors on the Compressive Strength of Brickwork. In Proceedings of the Second International Brick Masonry Conference, Stoke-on-Trent, UK, 12–15 April 1971; pp. 31–37. [Google Scholar]
- Vermeltfoort, A.T. Brick-Mortar Interaction in Masonry under Compression. Ph.D. Dissertation, Eindhoven University of Technology, Eindhoven, The Netherlands, 2005. [Google Scholar]
- Vermeltfoort, A.T.; Martens, D.R.W.; van Zijl, G.P.A.G. Brick-Mortar Interface Effects on Masonry under Compression. Can. J. Civ. Eng. 2007, 34, 1475–1485. [Google Scholar] [CrossRef]
- Kaushik, H.B.; Rai, D.C.; Jain, S.K. Stress-Strain Characteristics of Clay Brick Masonry under Uniaxial Compression. J. Mater. Civ. Eng. 2007, 19, 728–739. [Google Scholar] [CrossRef]
- Costigan, A.; Pavía, S.; Kinnane, O. An Experimental Evaluation of Prediction Models for the Mechanical Behavior of Unreinforced, Lime-Mortar Masonry under Compression. J. Build. Eng. 2015, 4, 283–294. [Google Scholar] [CrossRef]
- Radovanović, Ž.; Grebović, R.S.; Dimovska, S.; Serdar, N.; Vatin, N.; Murgul, V. The Mechanical Properties of Masonry Walls—Analysis of the Test Results. Procedia Eng. 2015, 117, 865–873. [Google Scholar] [CrossRef]
- RILEM TC. LUM B1 Compressive Strength of Small Walls and Prisms, 1991. In RILEM Technical Recommendations for the Testing and Use of Constructions Materials; CRC Press: London, UK, 1994; pp. 474–477. [Google Scholar]
- LIDL PARKSIDE® Paint and Mortar Stirrer PFMR 1600 D5. Available online: https://www.lidl.de/p/parkside-farb-und-moertelruehrer-pfmr-1600-d5-1600-w-mit-softstart/p100373516 (accessed on 30 July 2024).
- EN 1015-11:2019; Methods of Test for Mortar for Masonry—Part 11: Determination of Flexural and Compressive Strength of Hardened Mortar. CEN (European Committee for Standardization): Brussels, Belgium, 2019.
- EN 196-1:2016; Methods of Testing Cement—Part 1: Determination of Strength. CEN (European Committee for Standardization): Brussels, Belgium, 2016.
- MAPEI Lampocem (Cimento Rápido). Available online: https://www.mapei.com/pt/pt-pt/produtos-e-solucoes/lista-de-produtos/detalhes-do-produto/lampocem (accessed on 30 July 2024).
- Silva, B.; Dalla Benetta, M.; da Porto, F.; Modena, C. Experimental Assessment of In-Plane Behaviour of Three-Leaf Stone Masonry Walls. Constr. Build. Mater. 2014, 53, 149–161. [Google Scholar] [CrossRef]
- Mojsilović, N.; Salmanpour, A.H. Masonry Walls Subjected to In-Plane Cyclic Loading: Application of Digital Image Correlation for Deformation Field Measurement. Int. J. Mason. Res. Innov. 2016, 1, 165–187. [Google Scholar] [CrossRef]
- Torres, B.; Varona, F.B.; Baeza, F.J.; Bru, D.; Ivorra, S. Study on Retrofitted Masonry Elements under Shear Using Digital Image Correlation. Sensors 2020, 20, 2122. [Google Scholar] [CrossRef]
- Bello, I.; Martínez-Abella, F.; Wardeh, G.; González-Fonteboa, B. Complete Stress-Strain Analysis of Masonry Prisms under Compressive Loading-Unloading Cycles through Digital Image Correlation. Eng. Struct. 2024, 298, 117088. [Google Scholar] [CrossRef]
- FEMA 461; Interim Testing Protocols for Determining the Seismic Performance Characteristics of Structural and Nonstructural Components. ATC (Applied Techhology Council): Redwood City, CA, USA, 2007.
- Schultz, A.E. Seismic Performance of Partially Grouted Masonry-Shear Walls (Paper No. 1221). In Proceedings of the Eleventh World Conference on Earthquake Engineering, Acapulco, Mexico, 23–28 June 1996; pp. 246–256. [Google Scholar]
- Mojsilović, N.; Simundic, G.; Page, A. Masonry Wallettes with Damp-Proof Course Membrane Subjected to Cyclic Shear: An Experimental Study. Constr. Build. Mater. 2010, 24, 2135–2144. [Google Scholar] [CrossRef]
- Ramesh, M. A Multi Scale Approach to the Study of Lime-Cement Mortars in Masonry. Ph.D. Dissertation, University of Minho, Braga, Portugal, 2021. [Google Scholar]
- Milosevic, J.; Lopes, M.; Gago, A.S.; Bento, R. In-Plane Seismic Response of Rubble Stone Masonry Specimens by Means of Static Cyclic Tests. Constr. Build. Mater. 2015, 82, 9–19. [Google Scholar] [CrossRef]
- Abrams, D.P. Performance-Based Engineering Concepts for Unreinforced Masonry Building Structures. Prog. Struct. Eng. Mater. 2001, 3, 48–56. [Google Scholar] [CrossRef]
- Abrams, D.P. Seismic Assessment and Rehabilitation of Unreinforced Masonry Buildings in the USA. In Proceedings of the 6th National Congress on Seismology and Seismic Engineering SÍSMICA 2004, Guimarães, Portugal, 14–16 April 2004; pp. 71–80. [Google Scholar]


| Material | Al2O3 [%] | MgO [%] | Fe2O3 [%] | SO3 [%] | SiO2 [%] | K2O [%] | CaO [%] | LOI [%] |
|---|---|---|---|---|---|---|---|---|
| Cement | 4.27 | 1.75 | 3.20 | 3.05 | 20.55 | 0.77 | 63.40 | 2.05 |
| Lime | 0.06 | 0.68 | 0.05 | 0.197 | 0.12 | 0.013 | 74.35 | 25.00 |
| Compressive Strength [MPa] | Flexural Strength [MPa] | Young’s Modulus [GPa] | Water Absorption [%] | IRA [kg/(m2·min)] | |
|---|---|---|---|---|---|
| Complete Brick | Cubic Specimen | ||||
| 22.03 (22.7) | 21.15 (13.7) | 5.41 (21.0) | 4.9 (15.7) | 10.3 (7.6) | 3.55 (15.6) |
| Cement:Lime:Sand (by Volume) | Nomenclature | Cement [kg] | Lime [kg] | Aggregate [kg] | w/b Ratio (by Volume) | w/b Ratio (by Weight) | |
|---|---|---|---|---|---|---|---|
| Sand | Filler | ||||||
| 1:0:5 | REF | 233.5 | 0.0 | 1743.6 | 206.4 | 1.20 | 1.12 |
| 1:1:6 | L50 | 192.6 | 73.4 | 1726.1 | 204.4 | 1.09 | 0.70 |
| 1:2:9 | L67 | 128.4 | 97.9 | 1726.1 | 204.4 | 1.30 | 0.71 |
| Mortar Type | Compressive Strength [MPa] | Flexural Strength [MPa] | E-Modulus [GPa] | |||||||
|---|---|---|---|---|---|---|---|---|---|---|
| Standard | In Situ | Standard | In Situ | Standard | In Situ | |||||
| REF | 10.27 | 11.21 | 10.88 | 12.08 | 3.14 | 3.53 | 3.04 | 3.78 | 19.47 | 15.21 |
| (7.3) | (2.7) | (8.9) | (6.0) | (2.4) | (7.1) | (1.0) | (11.3) | (10.5) | (5.1) | |
| L50 | 9.35 | 9.28 | 9.75 | 10.07 | 3.93 | 3.42 | 2.99 | 3.55 | 14.86 | 15.97 |
| (5.1) | (5.7) | (7.6) | (8.5) | (0.7) | (3.5) | (9.3) | (7.8) | (2.2) | (17.5) | |
| L67 | 4.35 | 4.69 | 4.12 | 5.30 | 1.88 | 1.88 | 1.57 | 1.95 | 8.54 | 7.90 |
| (10.8) | (2.1) | (3.4) | (5.2) | (5.0) | (4.5) | (3.5) | (2.1) | (1.2) | (5.3) | |
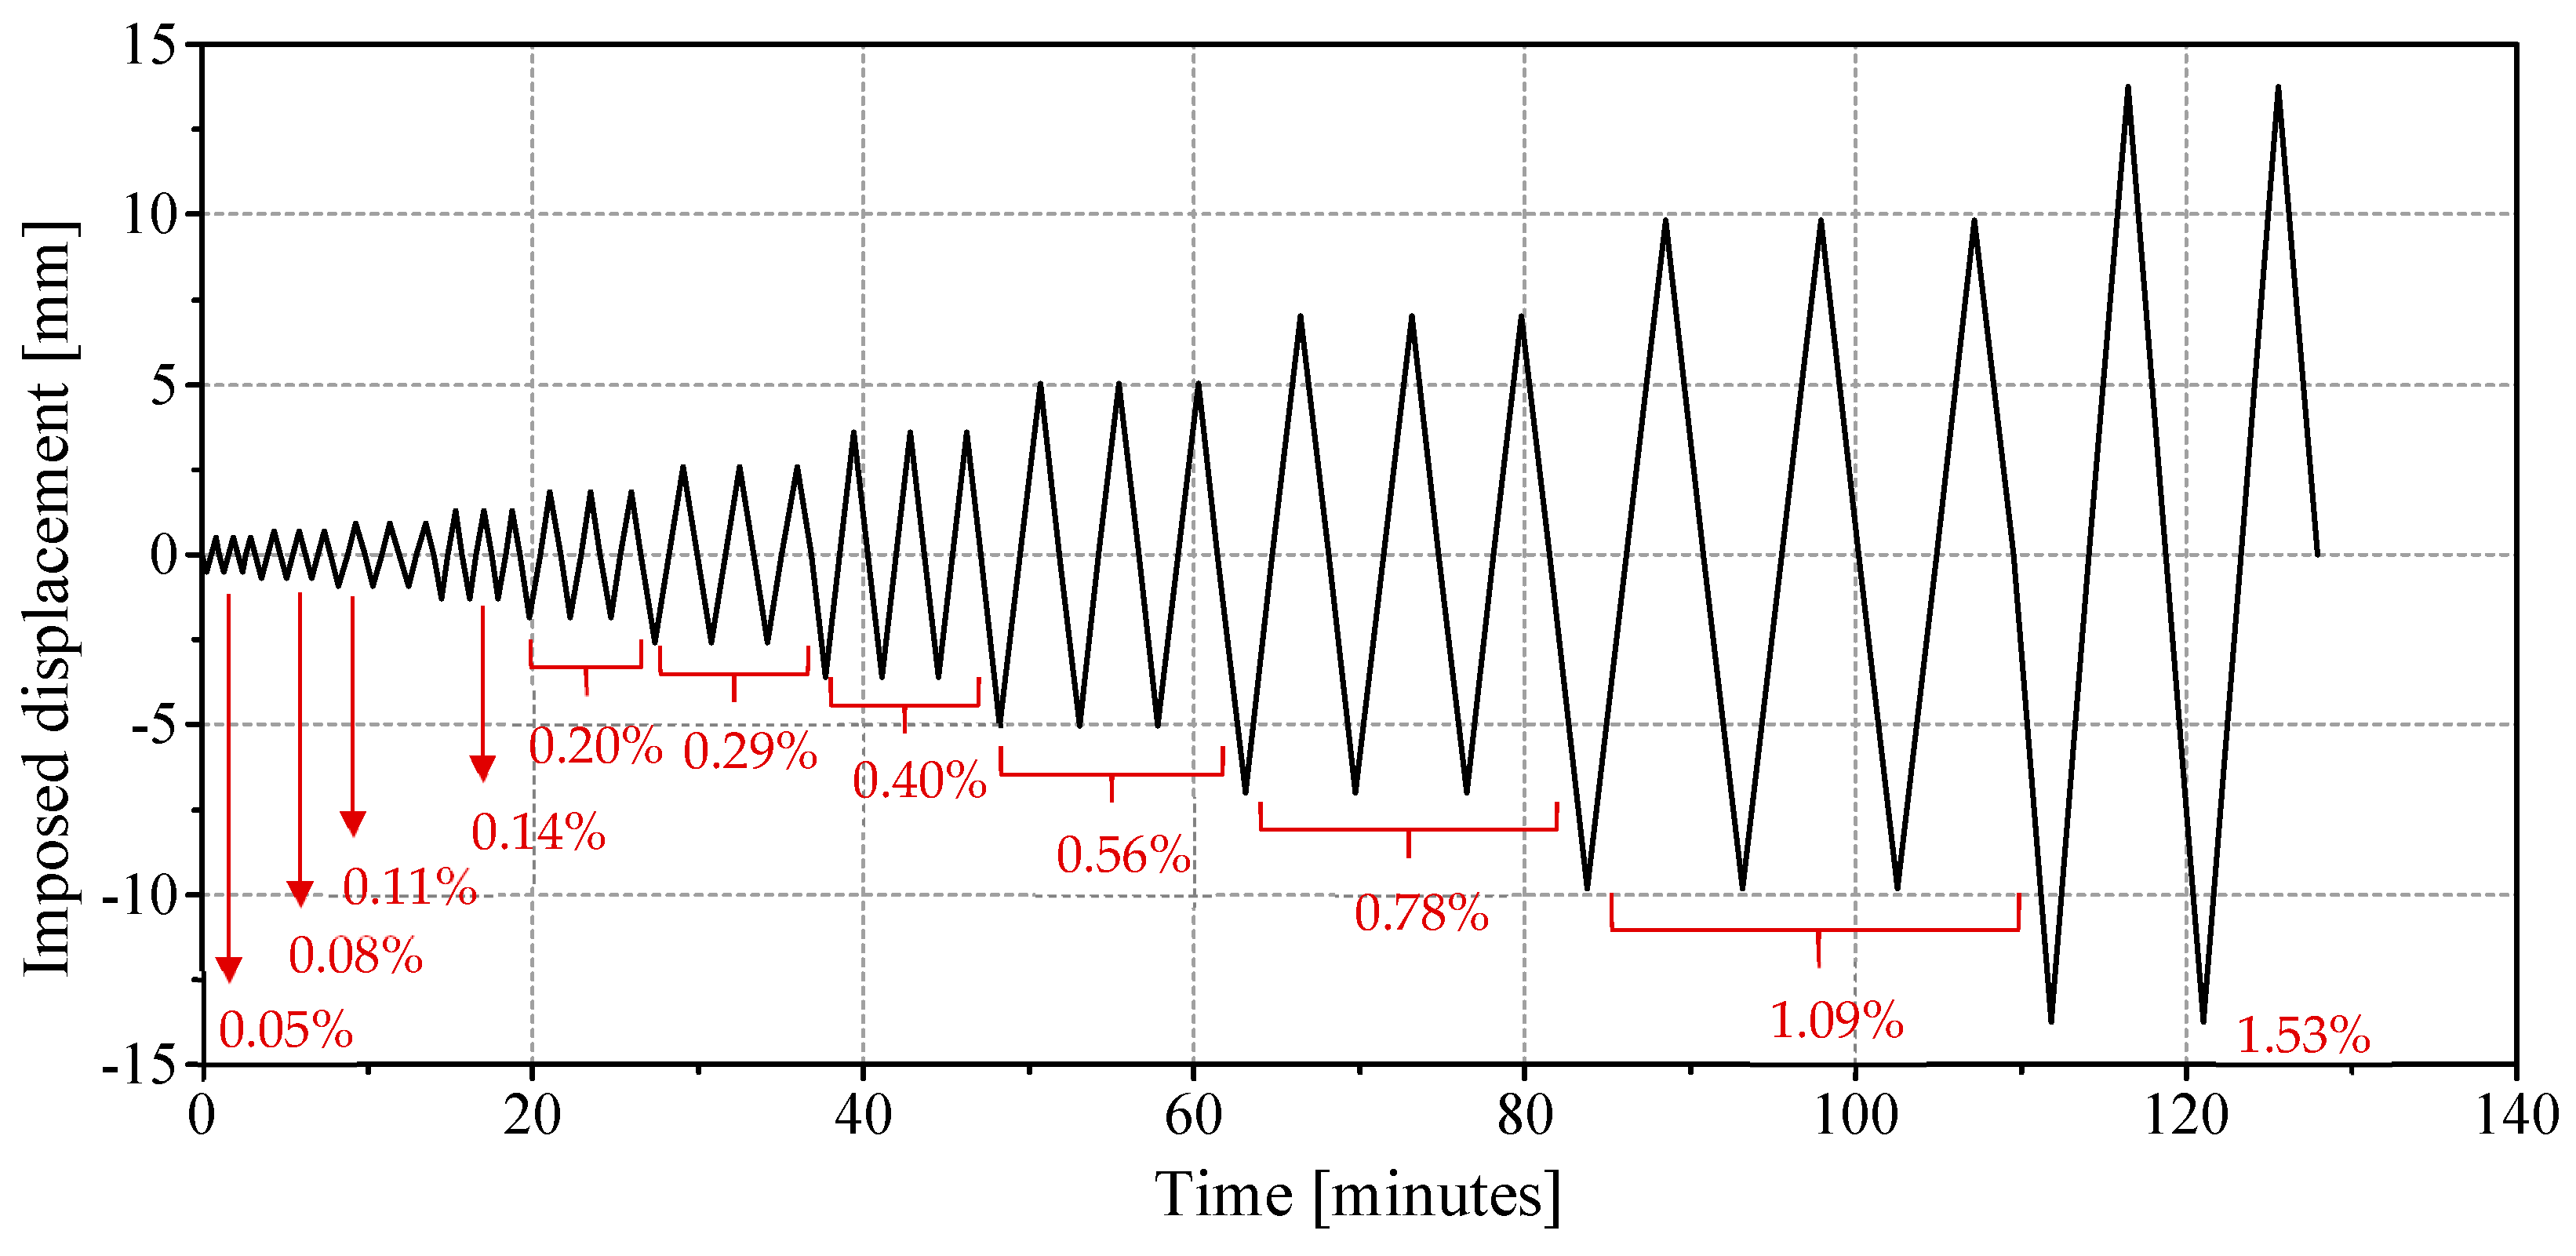
| Amplitude [mm] | 0.49 | 0.68 | 0.95 | 1.30 | 1.84 | 2.57 | 3.59 | 5.02 | 7.02 | 9.83 | 13.77 |
| Drift [%] | 0.05 | 0.08 | 0.11 | 0.14 | 0.20 | 0.29 | 0.40 | 0.56 | 0.78 | 1.09 | 1.53 |
| Speed [m/s] | 0.03 | 0.03 | 0.03 | 0.05 | 0.05 | 0.05 | 0.07 | 0.07 | 0.07 | 0.07 | 0.10 |
| Specimen | [kN] | [mm] | [kN] | [mm] | [kN] | [mm] |
|---|---|---|---|---|---|---|
| REF-1 | 18.8 | 0.40 | 39.5 | 1.74 | 33.6 | 5.19 |
| REF-2 | 25.4 | 0.55 | 50.2 | 1.89 | 42.7 | 4.06 |
| REF-3 | 25.7 | 0.44 | 47.1 | 4.17 | 40.0 | 12.21 |
| L50-1 | 35.6 | 0.67 | 51.0 | 3.09 | 43.4 | 4.97 |
| L50-2 | 31.8 | 0.96 | 54.3 | 3.37 | 46.1 | 6.64 |
| L50-3 | 25.6 | 0.51 | 45.2 | 1.85 | 38.4 | 2.86 |
| L67-1 | 23.9 | 0.54 | 43.7 | 1.91 | 37.2 | 4.06 |
| L67-2 | 21.0 | 0.46 | 42.2 | 1.72 | 35.9 | 3.31 |
| L67-3 | 25.2 | 0.63 | 40.9 | 2.33 | 34.8 | 4.71 |
| Specimen | [kN] | [mm] | [mm] | [kN/mm] | [kN/mm] | ||||
|---|---|---|---|---|---|---|---|---|---|
| REF-1 | 35.7 | 3.95 | 0.77 | 46.3 | 22.7 | 0.47 | 0.90 | 4.3 | 5.1 |
| REF-2 | 45.2 | 3.35 | 0.99 | 45.9 | 26.6 | 0.51 | 0.90 | 3.4 | 3.4 |
| REF-3 | 43.9 | 7.80 | 0.75 | 58.3 | 11.3 | 0.55 | 0.93 | 9.4 | 10.4 |
| L50-1 | 47.8 | 3.90 | 0.90 | 53.0 | 16.5 | 0.70 | 0.94 | 4.6 | 4.3 |
| L50-2 | 49.7 | 5.15 | 1.50 | 33.1 | 16.1 | 0.59 | 0.92 | 3.5 | 3.4 |
| L50-3 | 40.8 | 2.48 | 0.81 | 50.3 | 24.4 | 0.57 | 0.90 | 3.6 | 3.1 |
| L67-1 | 39.8 | 3.20 | 0.90 | 44.1 | 22.9 | 0.55 | 0.91 | 3.5 | 3.6 |
| L67-2 | 37.6 | 2.85 | 0.82 | 45.9 | 24.6 | 0.50 | 0.89 | 3.7 | 3.5 |
| L67-3 | 37.6 | 3.65 | 0.94 | 40.1 | 17.6 | 0.61 | 0.92 | 3.7 | 3.9 |
| Mortar Type | [kN] | [kN] | [kN/mm] | [kN/mm] | [%] | [%] | [%] | ||||
|---|---|---|---|---|---|---|---|---|---|---|---|
| REF | 45.6 (12.0) | 23.3 (16.9) | 46.1 (15.2) | 24.6 (11.0) | 0.05 (22.0) | 0.20 (5.9) | 0.41 (11.6) | 0.51 (7.1) | 0.91 (1.9) | 3.9 (16.3) | 4.3 (28.7) |
| L50 | 50.1 (9.2) | 31.0 (16.2) | 45.5 (23.7) | 19.0 (24.7) | 0.08 (31.9) | 0.31 (29.3) | 0.43 (34.8) | 0.62 (11.4) | 0.92 (1.8) | 3.9 (15.3) | 3.6 (18.1) |
| L67 | 42.3 (3.3) | 23.4 (9.0) | 43.4 (6.8) | 21.7 (16.9) | 0.06 (15.5) | 0.22 (15.8) | 0.36 (12.4) | 0.55 (10.5) | 0.91 (1.5) | 3.7 (3.3) | 3.6 (6.1) |
| Performance | IO | LS | CP | IO-Avg | LS-Avg | CP-Avg |
|---|---|---|---|---|---|---|
| Specimen | [%] | [%] | [%] | [%] | [%] | [%] |
| REF-1 | 0.09 | 0.19 | 0.58 | |||
| REF-2 | 0.11 | 0.21 | 0.45 | 0.10 (17.3) | 0.20 (5.9) | 0.51 (17.3) |
| REF-3 | 0.08 | 0.46 | 1.36 | |||
| L50-1 | 0.10 | 0.34 | 0.55 | |||
| L50-2 | 0.17 | 0.37 | 0.74 | 0.12 (35.0) | 0.31 (29.3) | 0.54 (39.3) |
| L50-3 | 0.09 | 0.21 | 0.32 | |||
| L67-1 | 0.10 | 0.21 | 0.45 | |||
| L67-2 | 0.09 | 0.19 | 0.37 | 0.10 (6.8) | 0.22 (15.8) | 0.45 (7.3) |
| L67-3 | 0.10 | 0.26 | 0.52 |
| Mortar Type | [kN] | [kN] | ||||||
|---|---|---|---|---|---|---|---|---|
| Experimental | EC-6 [17] |
Diff [%] | Magenes & Calvi [18] | Diff [%] | Experimental | Vasconcelos [2] | Diff [%] | |
| REF | 45.6 (12.0) | 58.9 | 29.2 | 52.7 | 15.5 | 23.3 (16.9) | 23.0 | −1.5 |
| L50 | 50.1 (9.2) | 49.8 | −0.8 | 53.4 | 6.4 | 31.0 (16.2) | 23.4 | −24.5 |
| L67 | 42.3 (3.3) | 50.7 | 19.9 | 41.4 | −2.0 | 23.4 (9.0) | 20.7 | −11.6 |
Disclaimer/Publisher’s Note: The statements, opinions and data contained in all publications are solely those of the individual author(s) and contributor(s) and not of MDPI and/or the editor(s). MDPI and/or the editor(s) disclaim responsibility for any injury to people or property resulting from any ideas, methods, instructions or products referred to in the content. |
© 2024 by the authors. Licensee MDPI, Basel, Switzerland. This article is an open access article distributed under the terms and conditions of the Creative Commons Attribution (CC BY) license (https://creativecommons.org/licenses/by/4.0/).
Share and Cite
Ramesh, M.; Ramirez, R.; Azenha, M.; Lourenço, P.B. Evaluating the Role of Mortar Composition on the Cyclic Behavior of Unreinforced Masonry Shear Walls. Materials 2024, 17, 4443. https://doi.org/10.3390/ma17184443
Ramesh M, Ramirez R, Azenha M, Lourenço PB. Evaluating the Role of Mortar Composition on the Cyclic Behavior of Unreinforced Masonry Shear Walls. Materials. 2024; 17(18):4443. https://doi.org/10.3390/ma17184443
Chicago/Turabian StyleRamesh, Meera, Rafael Ramirez, Miguel Azenha, and Paulo B. Lourenço. 2024. "Evaluating the Role of Mortar Composition on the Cyclic Behavior of Unreinforced Masonry Shear Walls" Materials 17, no. 18: 4443. https://doi.org/10.3390/ma17184443
APA StyleRamesh, M., Ramirez, R., Azenha, M., & Lourenço, P. B. (2024). Evaluating the Role of Mortar Composition on the Cyclic Behavior of Unreinforced Masonry Shear Walls. Materials, 17(18), 4443. https://doi.org/10.3390/ma17184443