

The High-Cycle Tensile–Shear Fatigue Properties and Failure Mechanism of Resistance Spot-Welded Advanced High-Strength Steel with a Zn Coating

Abstract
:1. Introduction
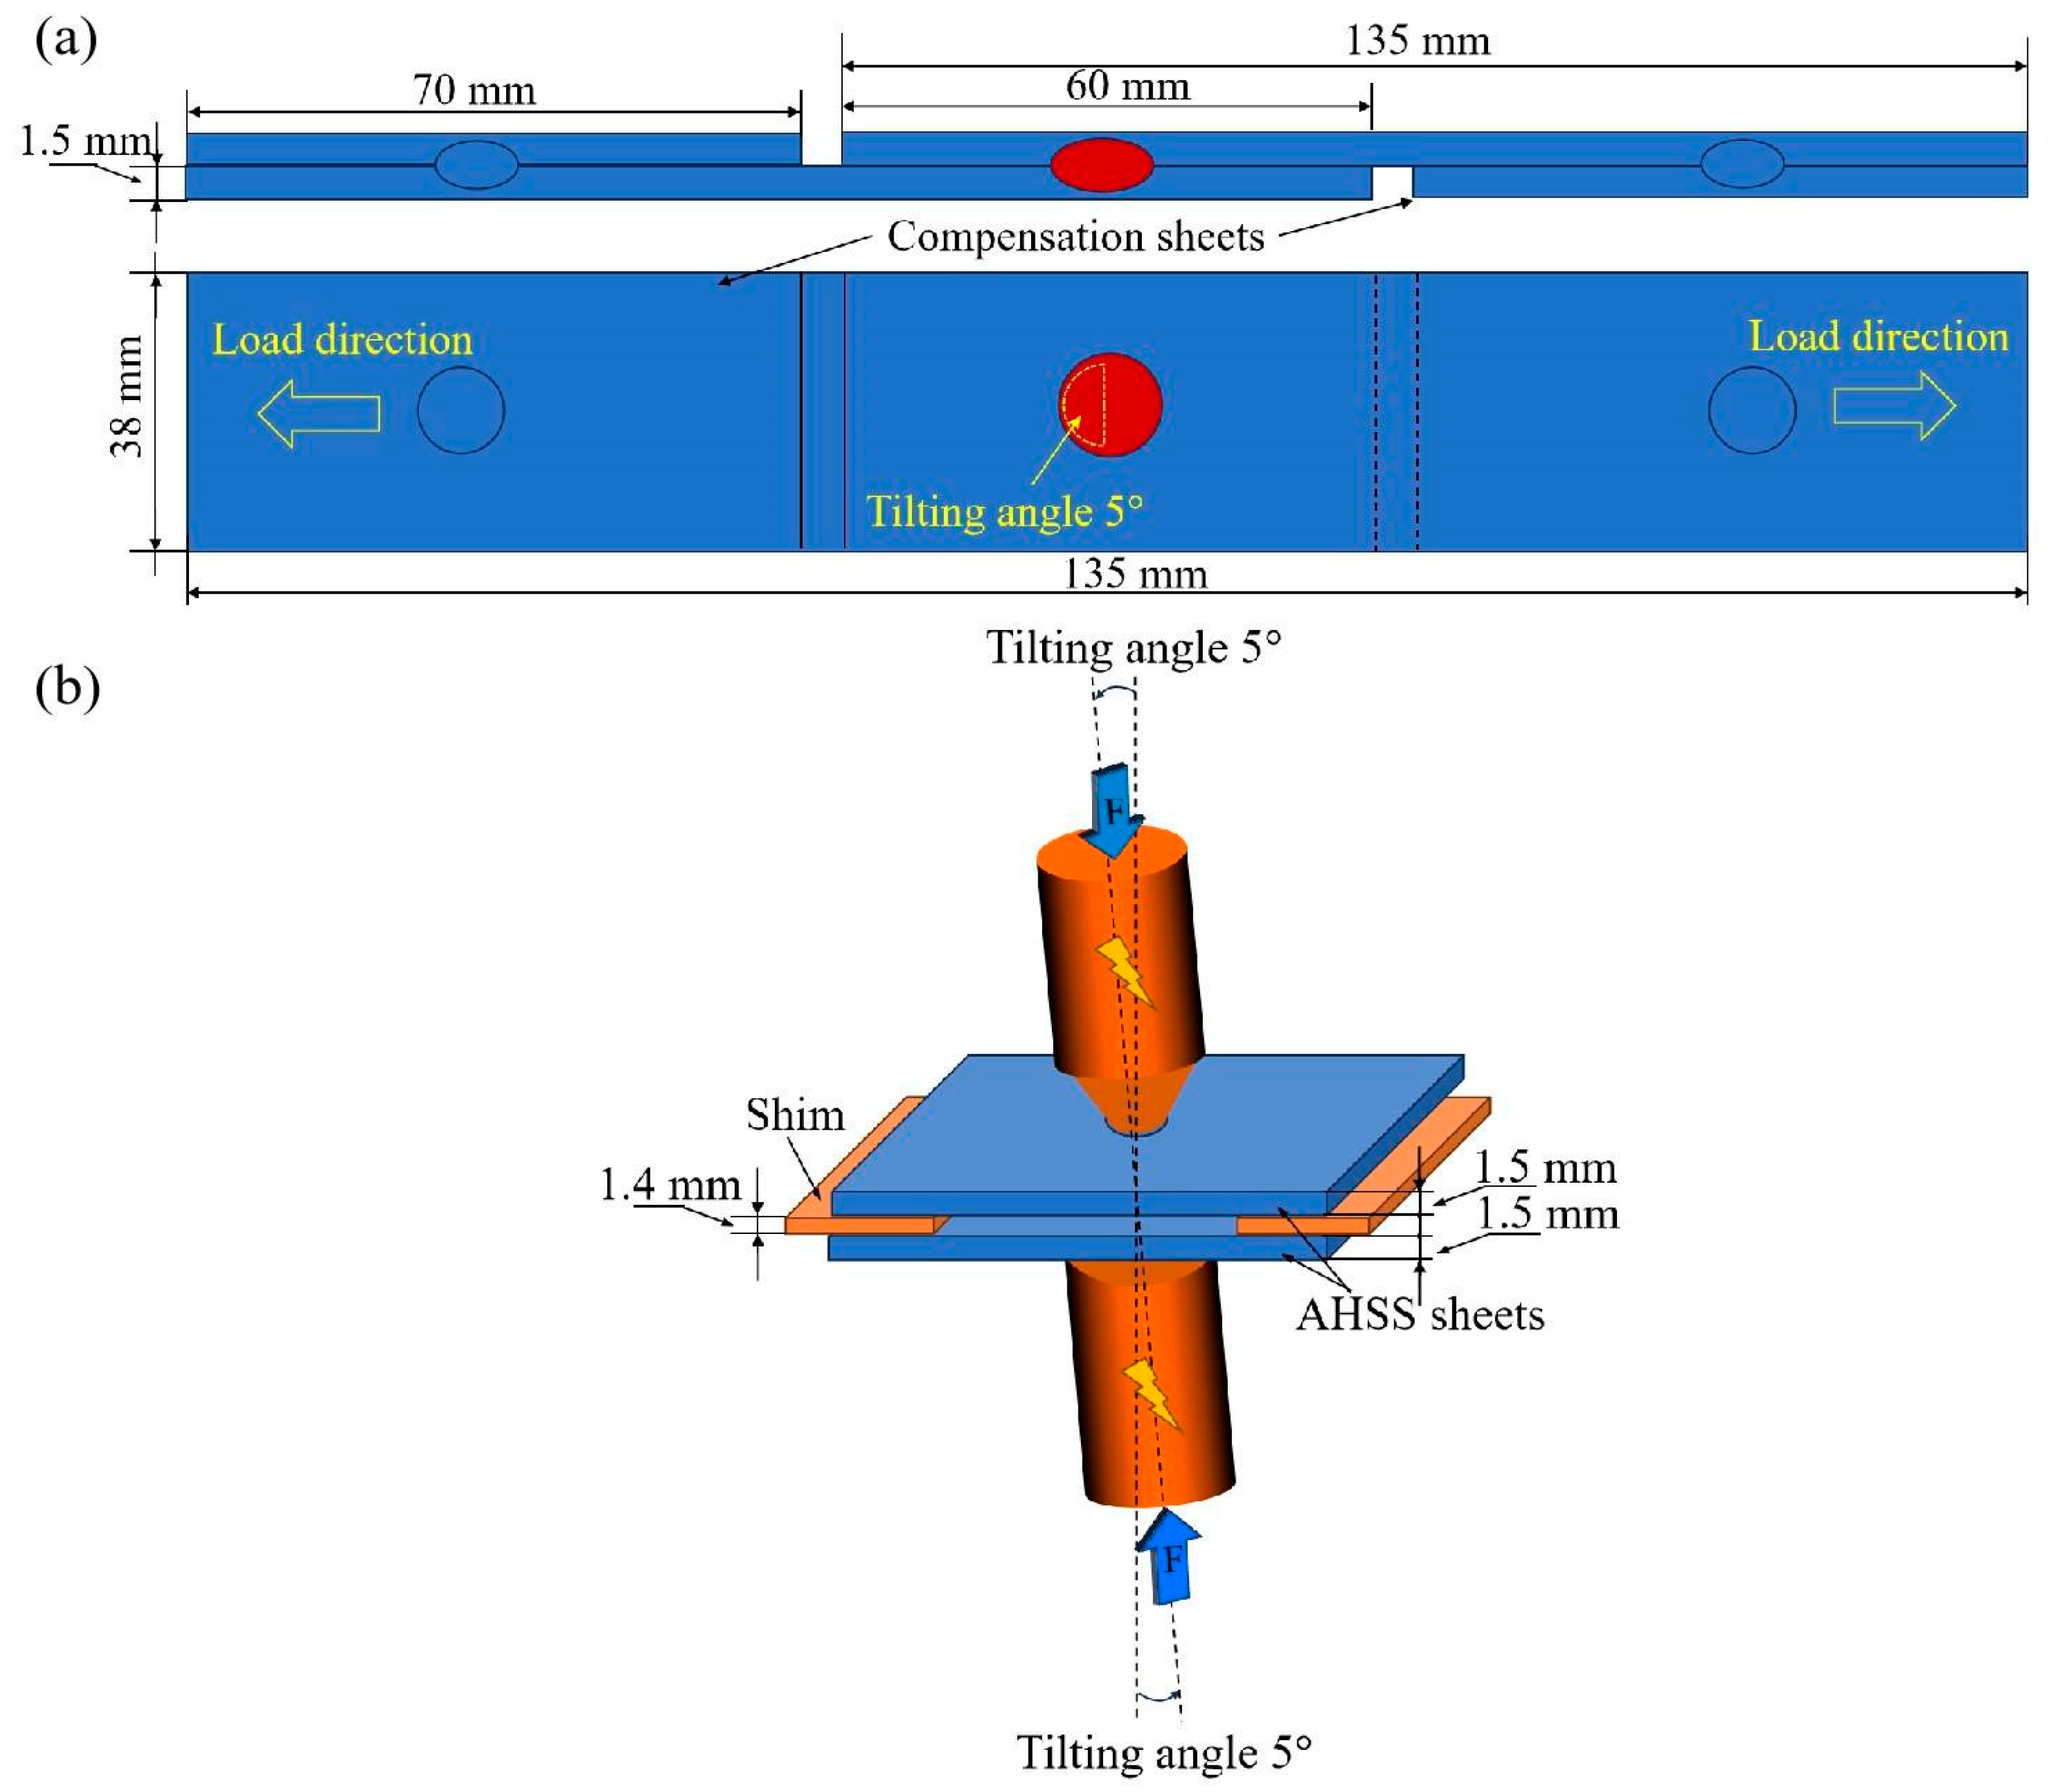
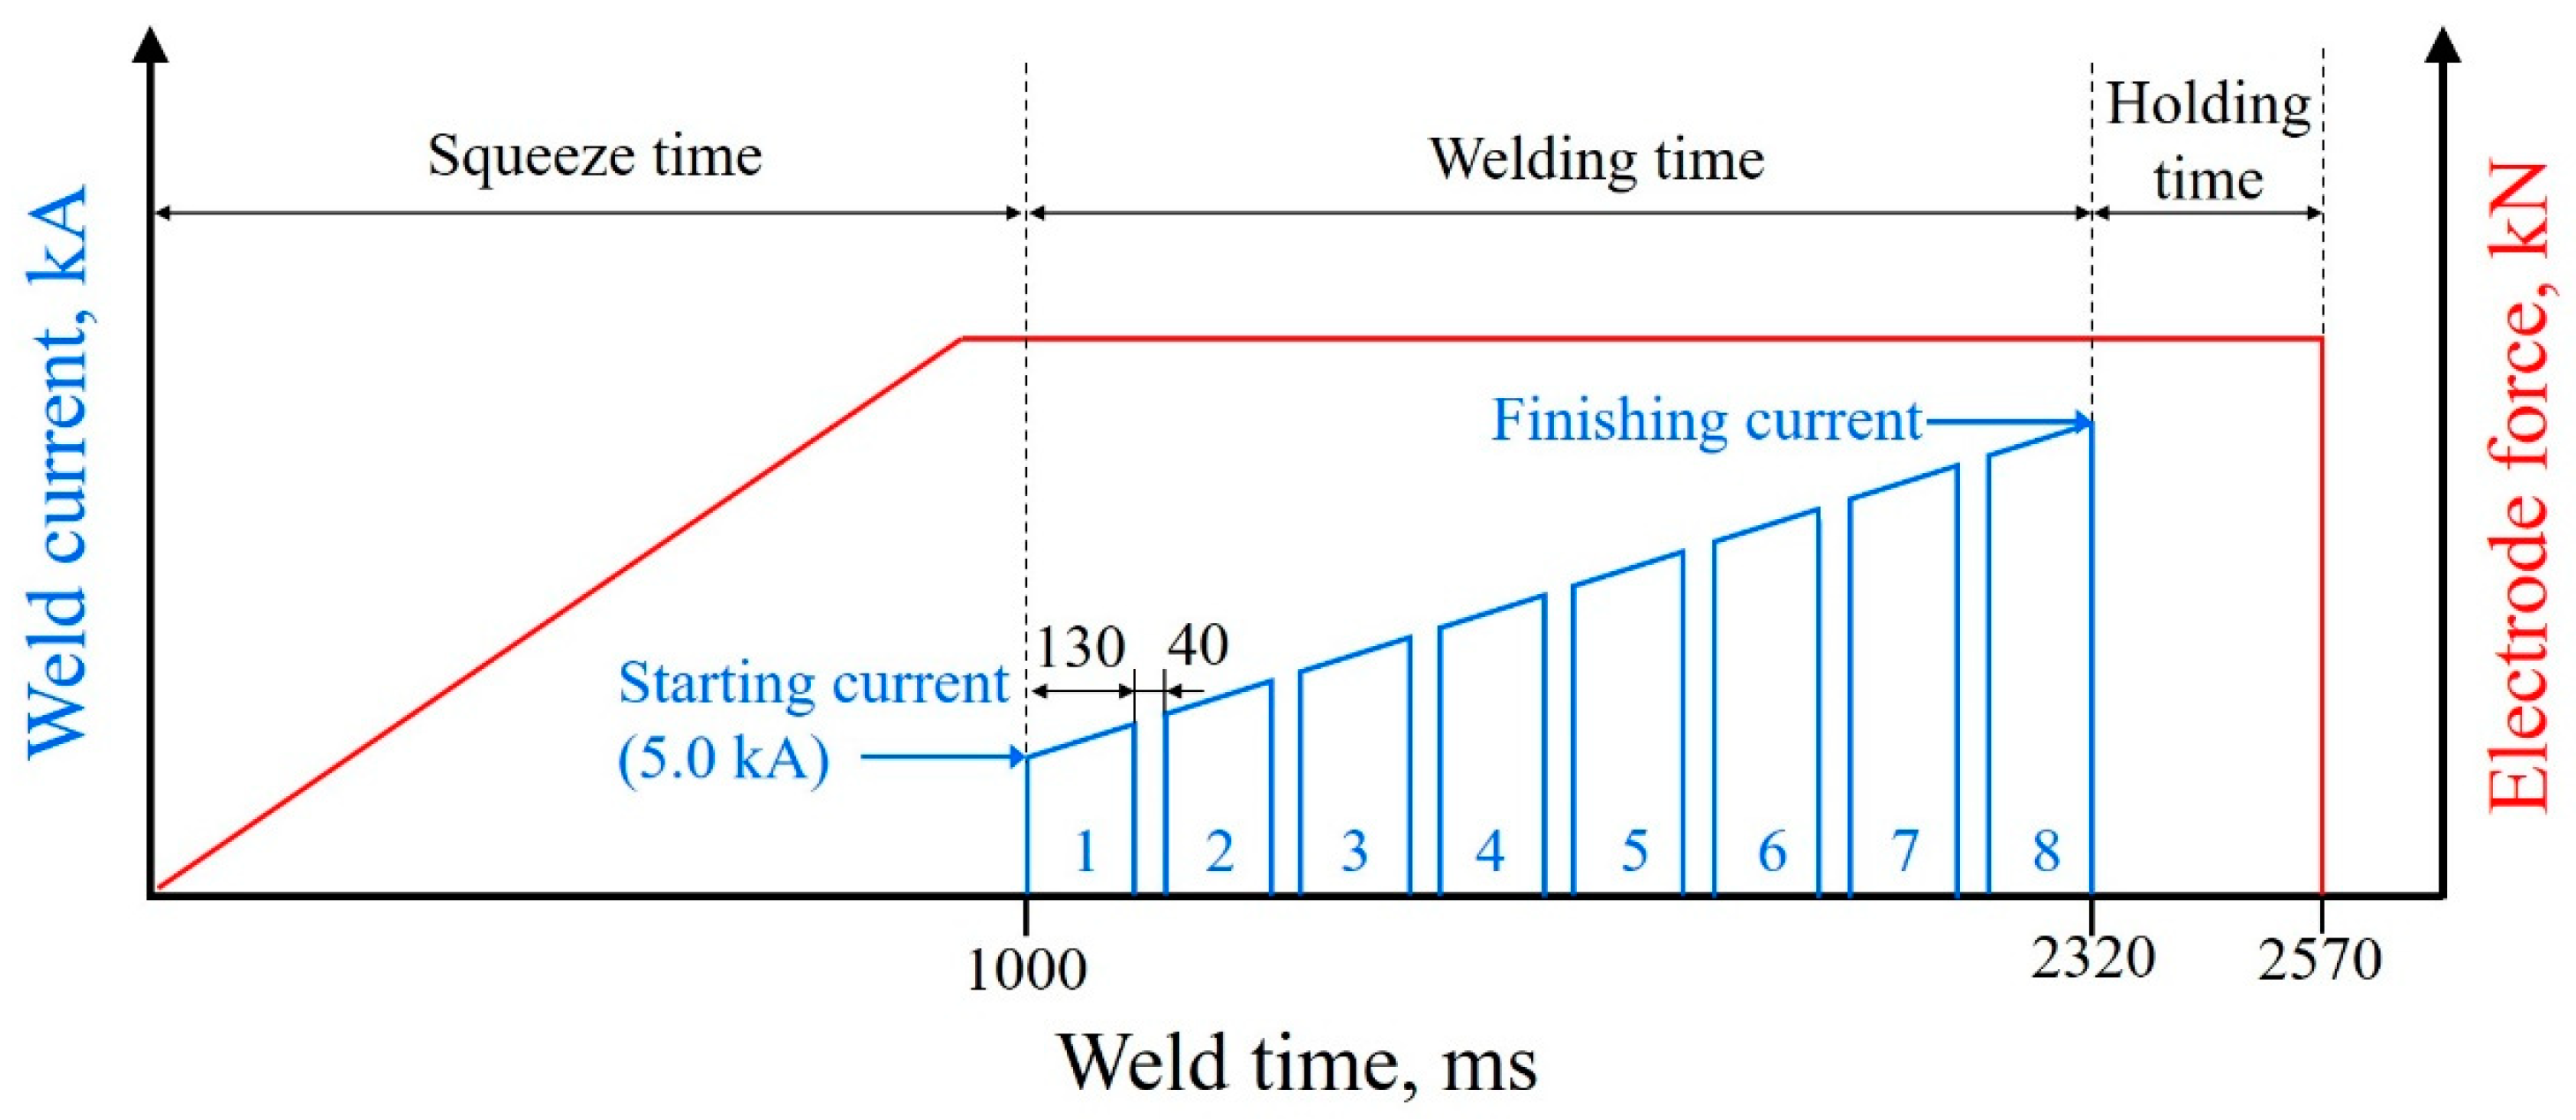
2. Materials and Experiments
3. Results and Discussion
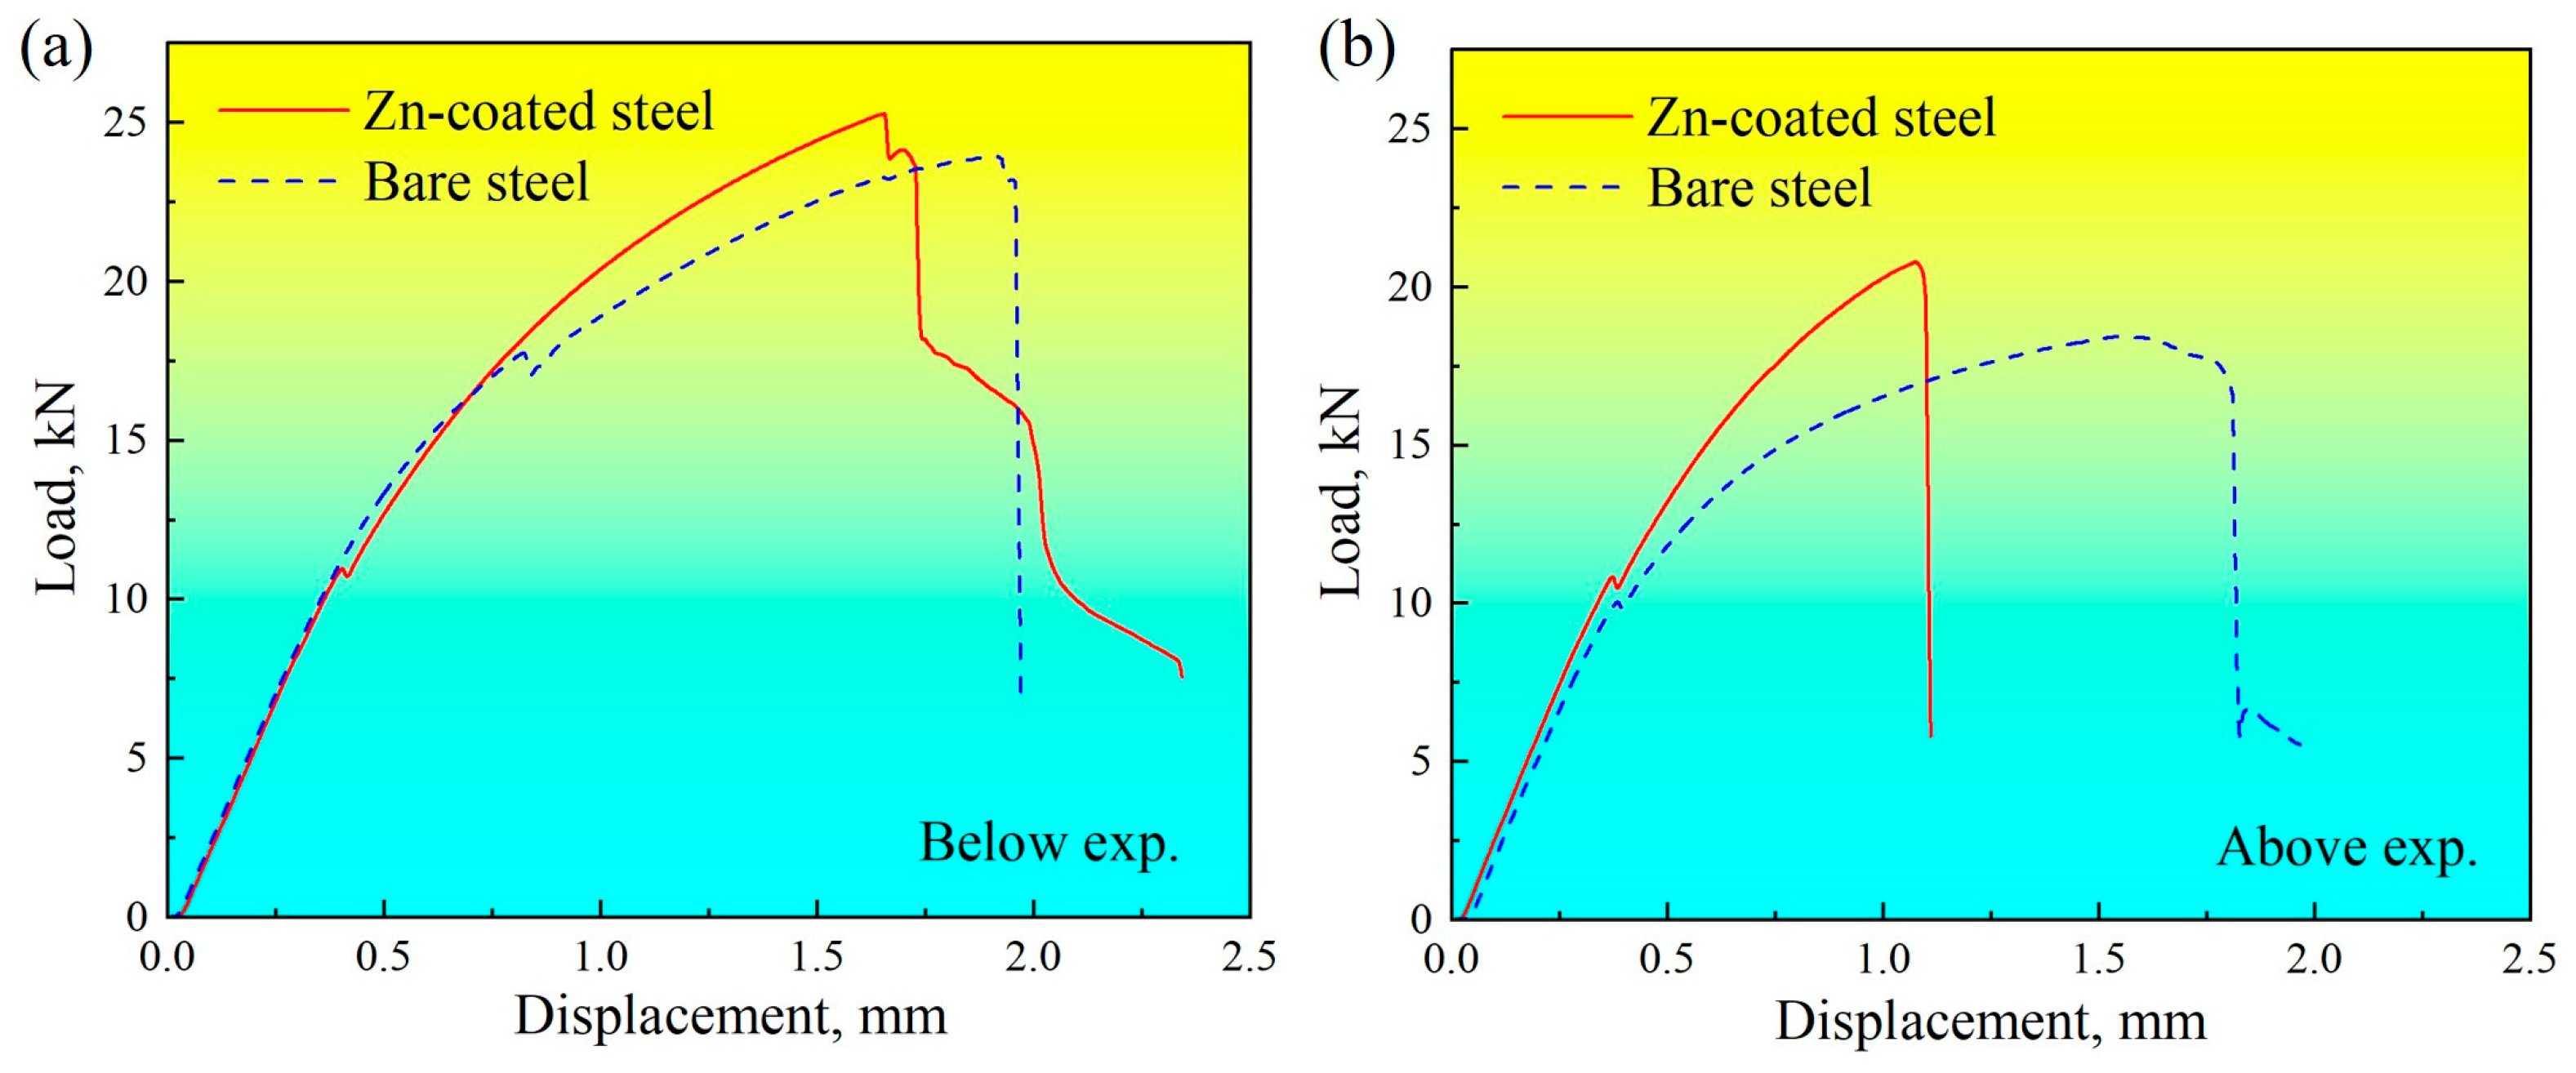
3.1. Quasi-Static Test of RSW Joints
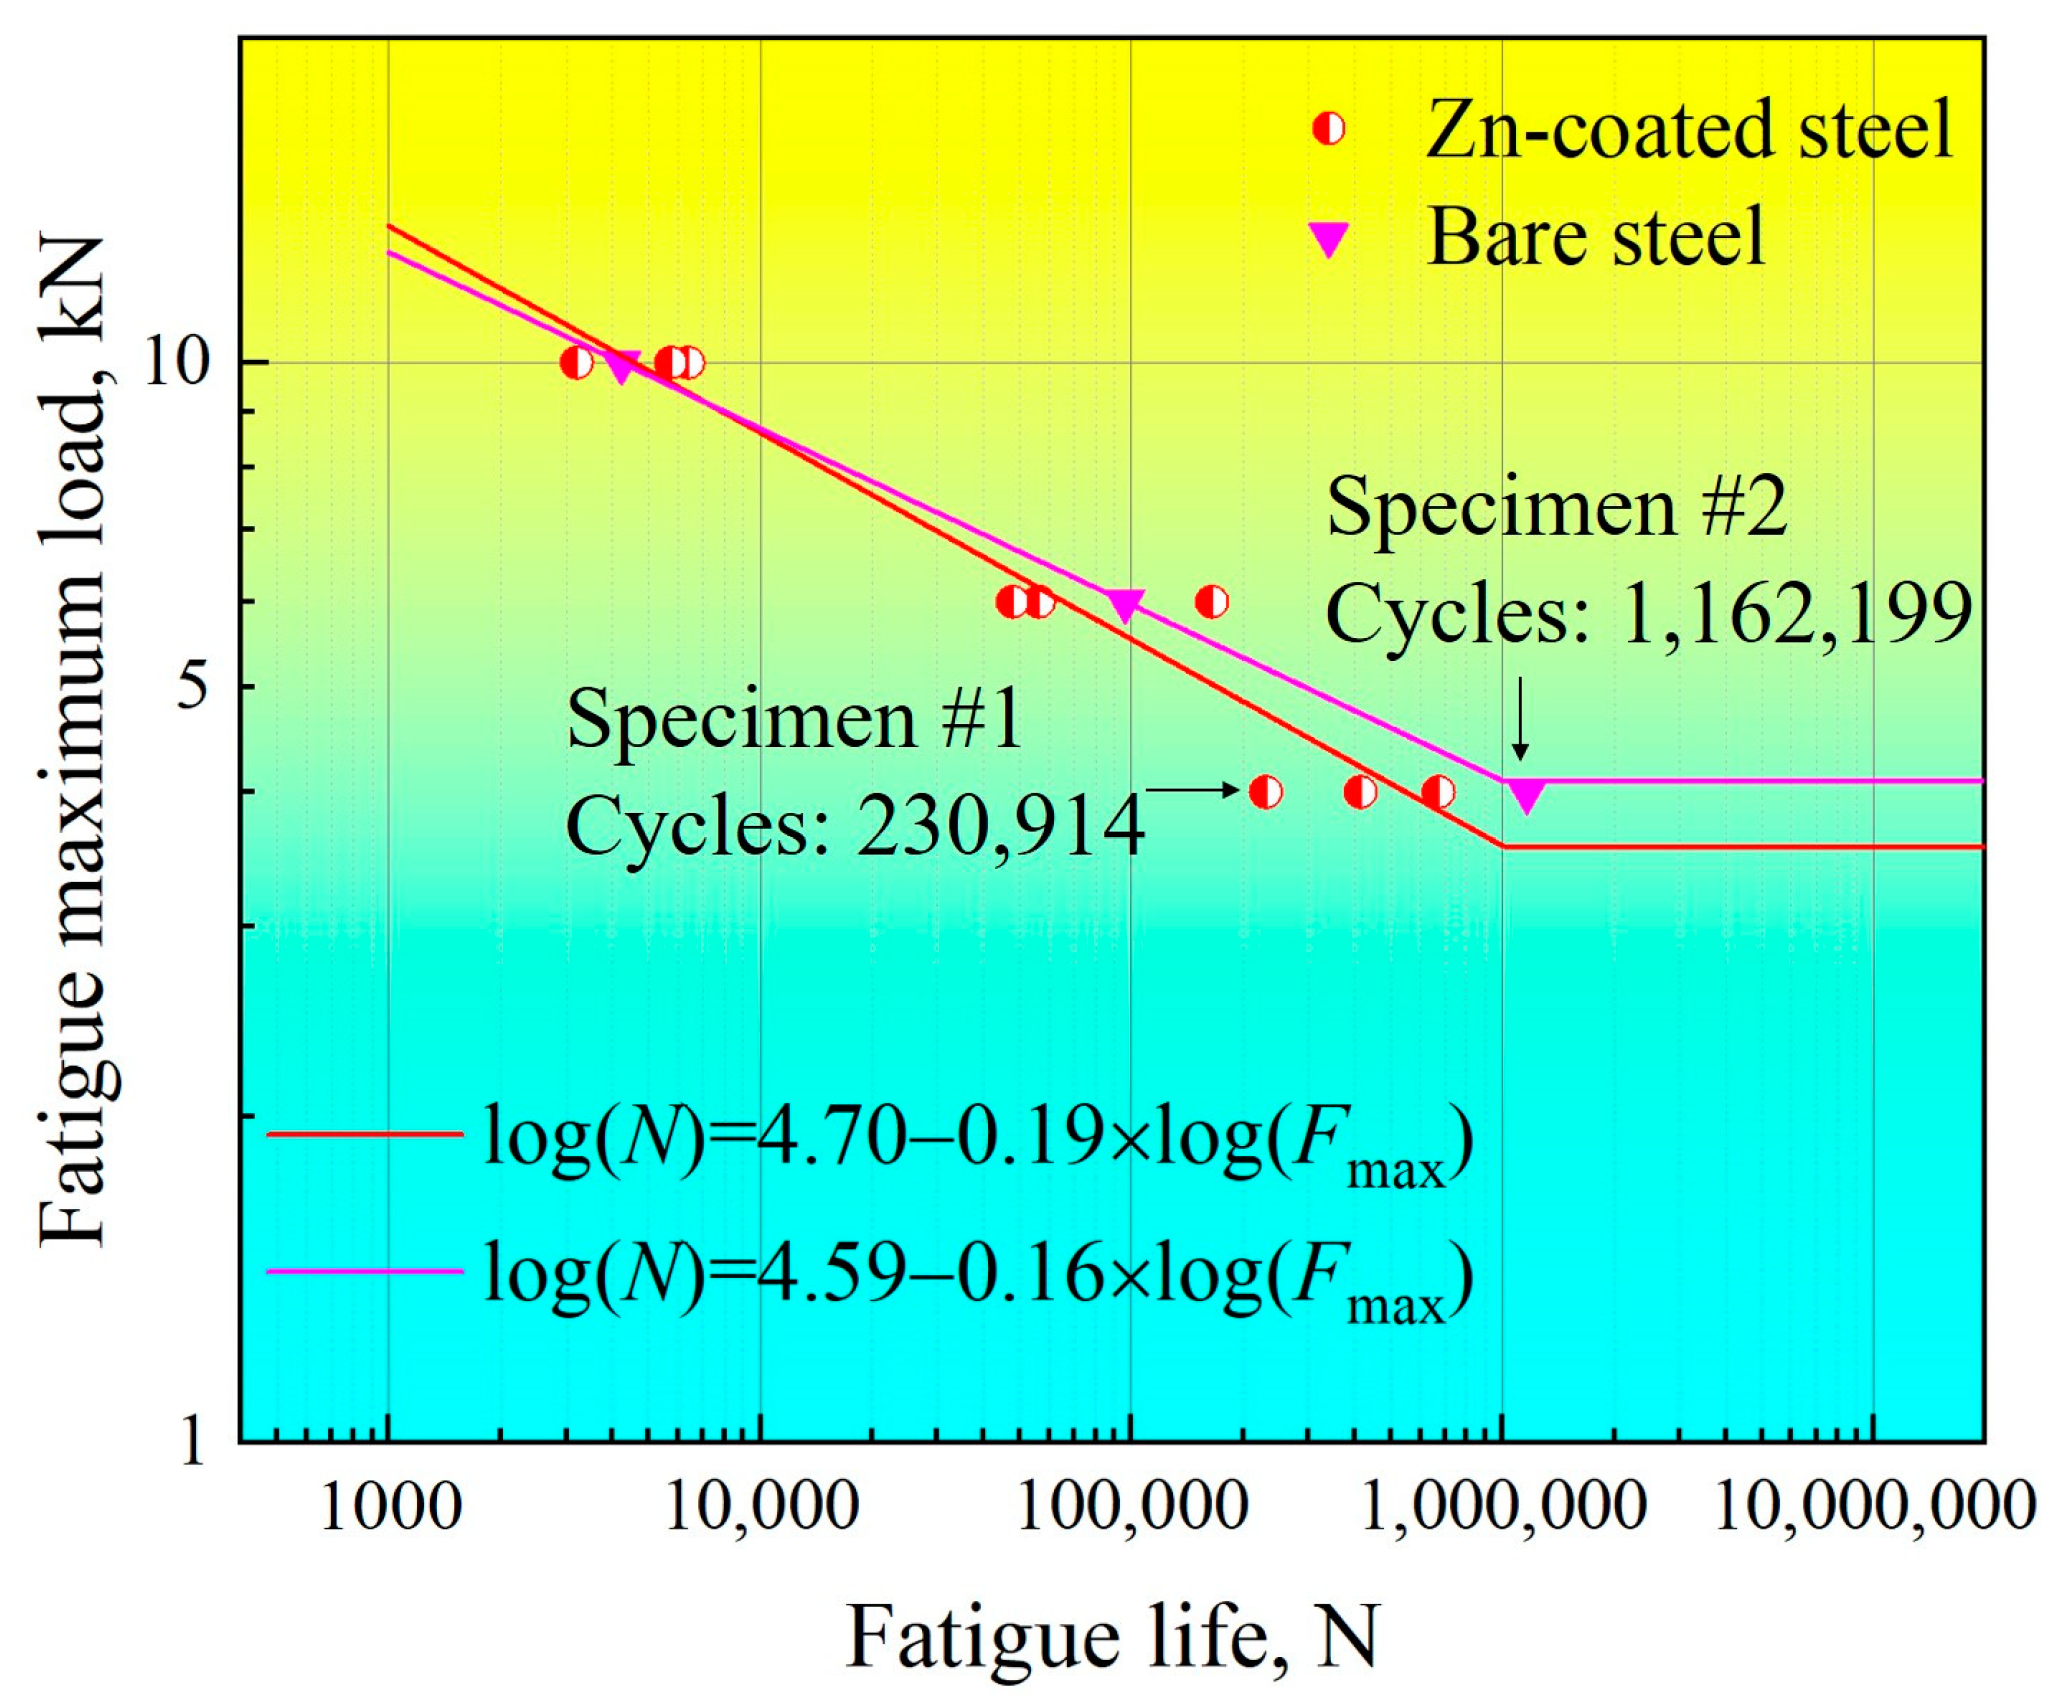
3.2. Tensile–Shear Fatigue Test of RSW Joints
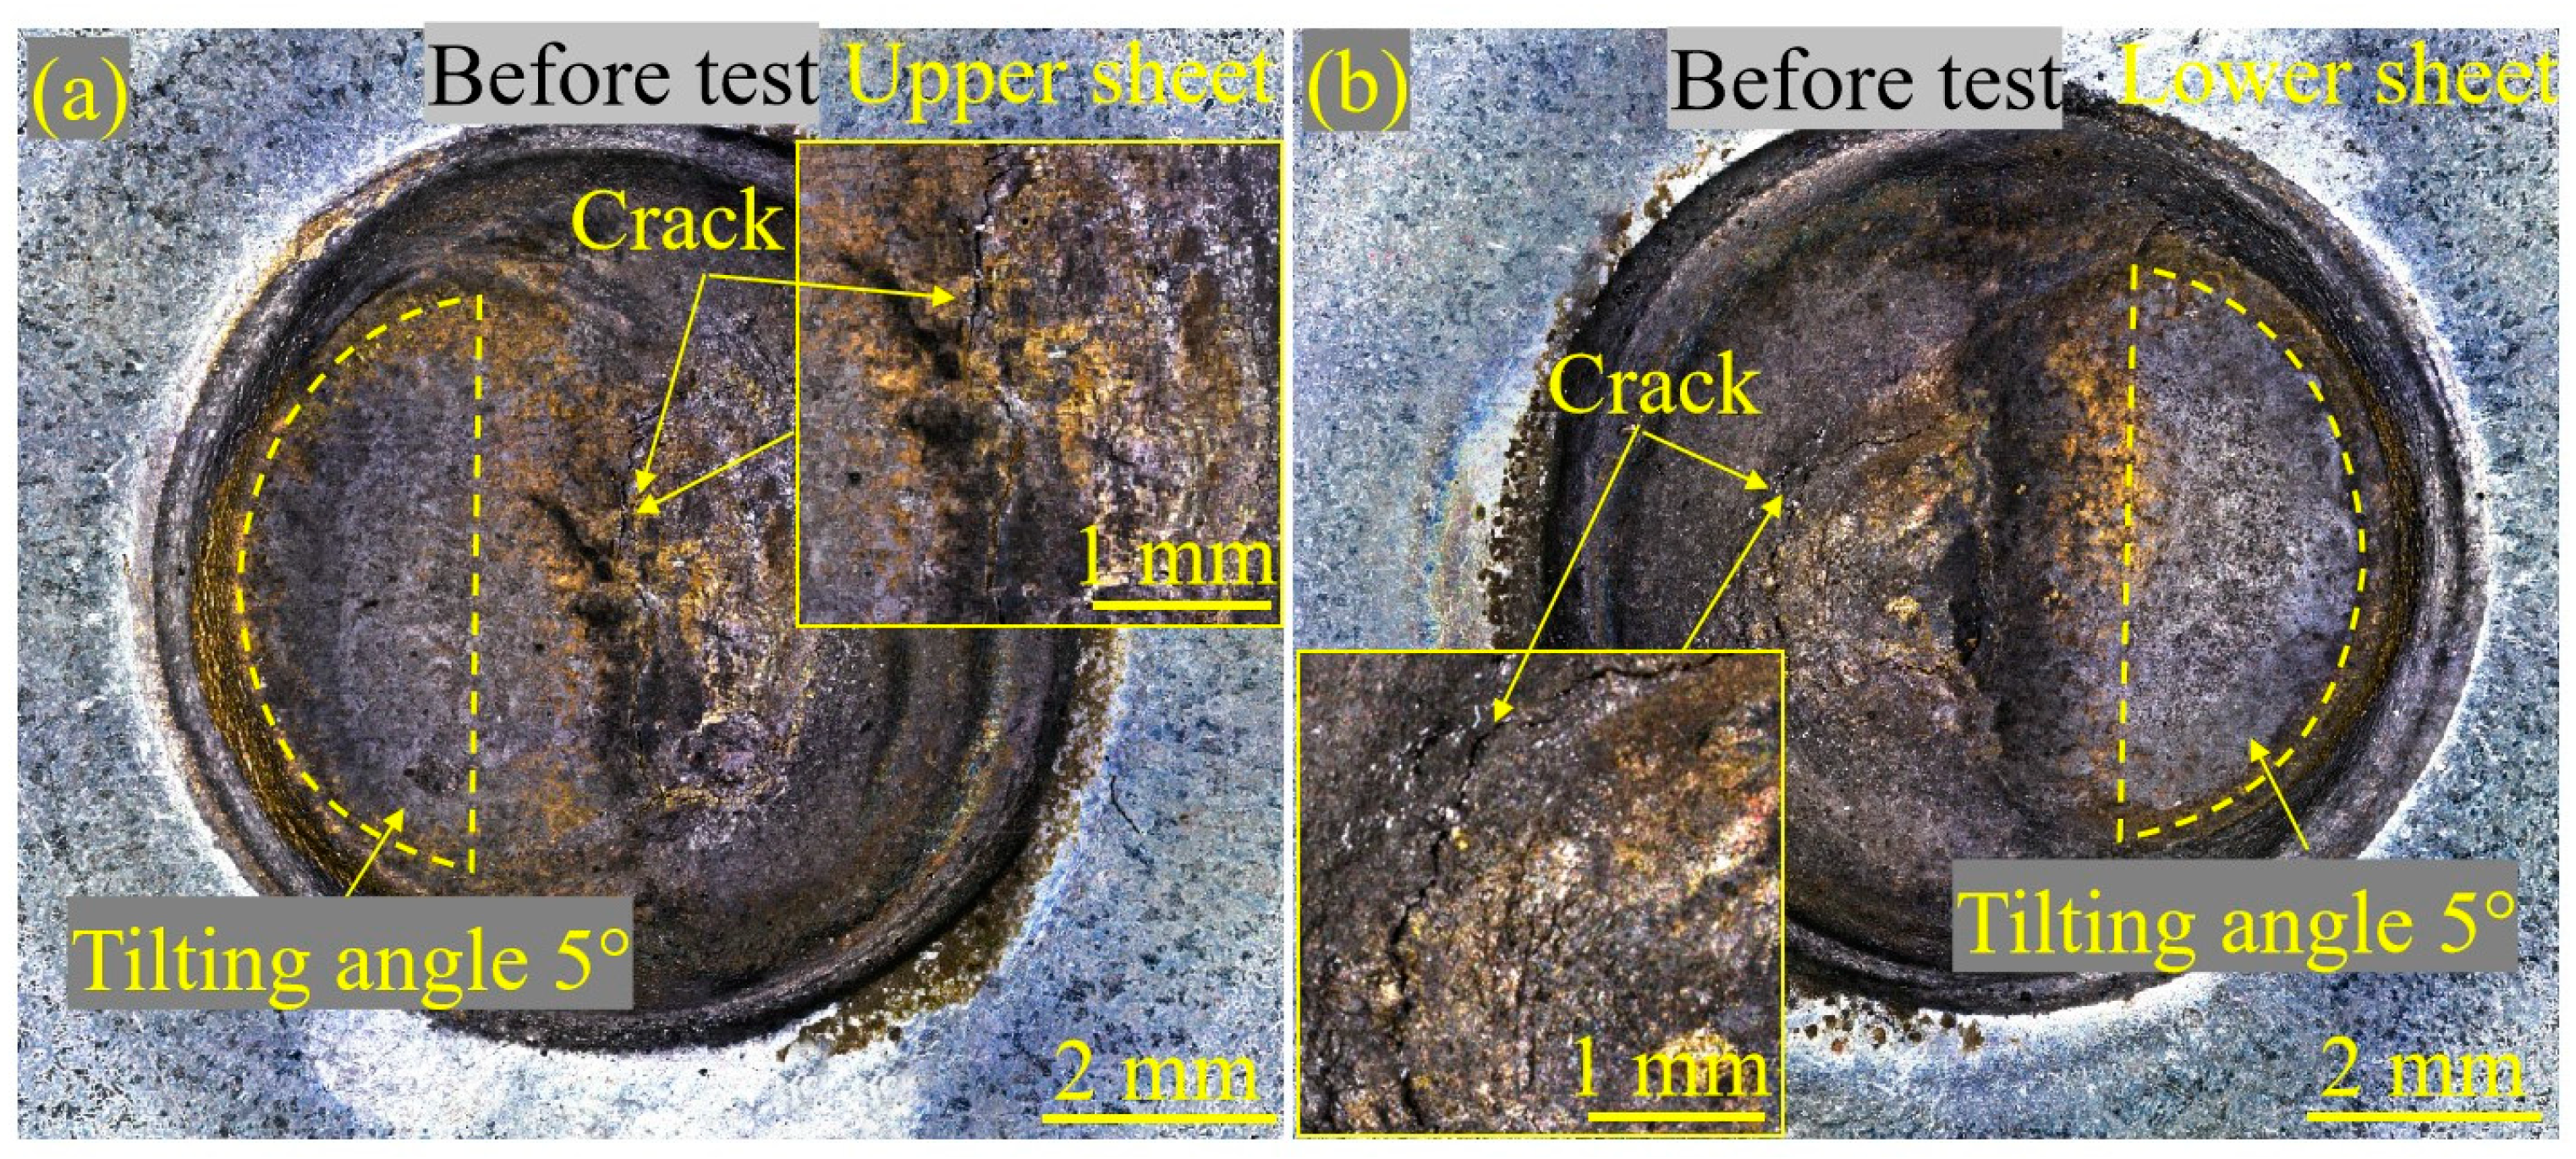
3.3. LME Observation on the Spot Surface
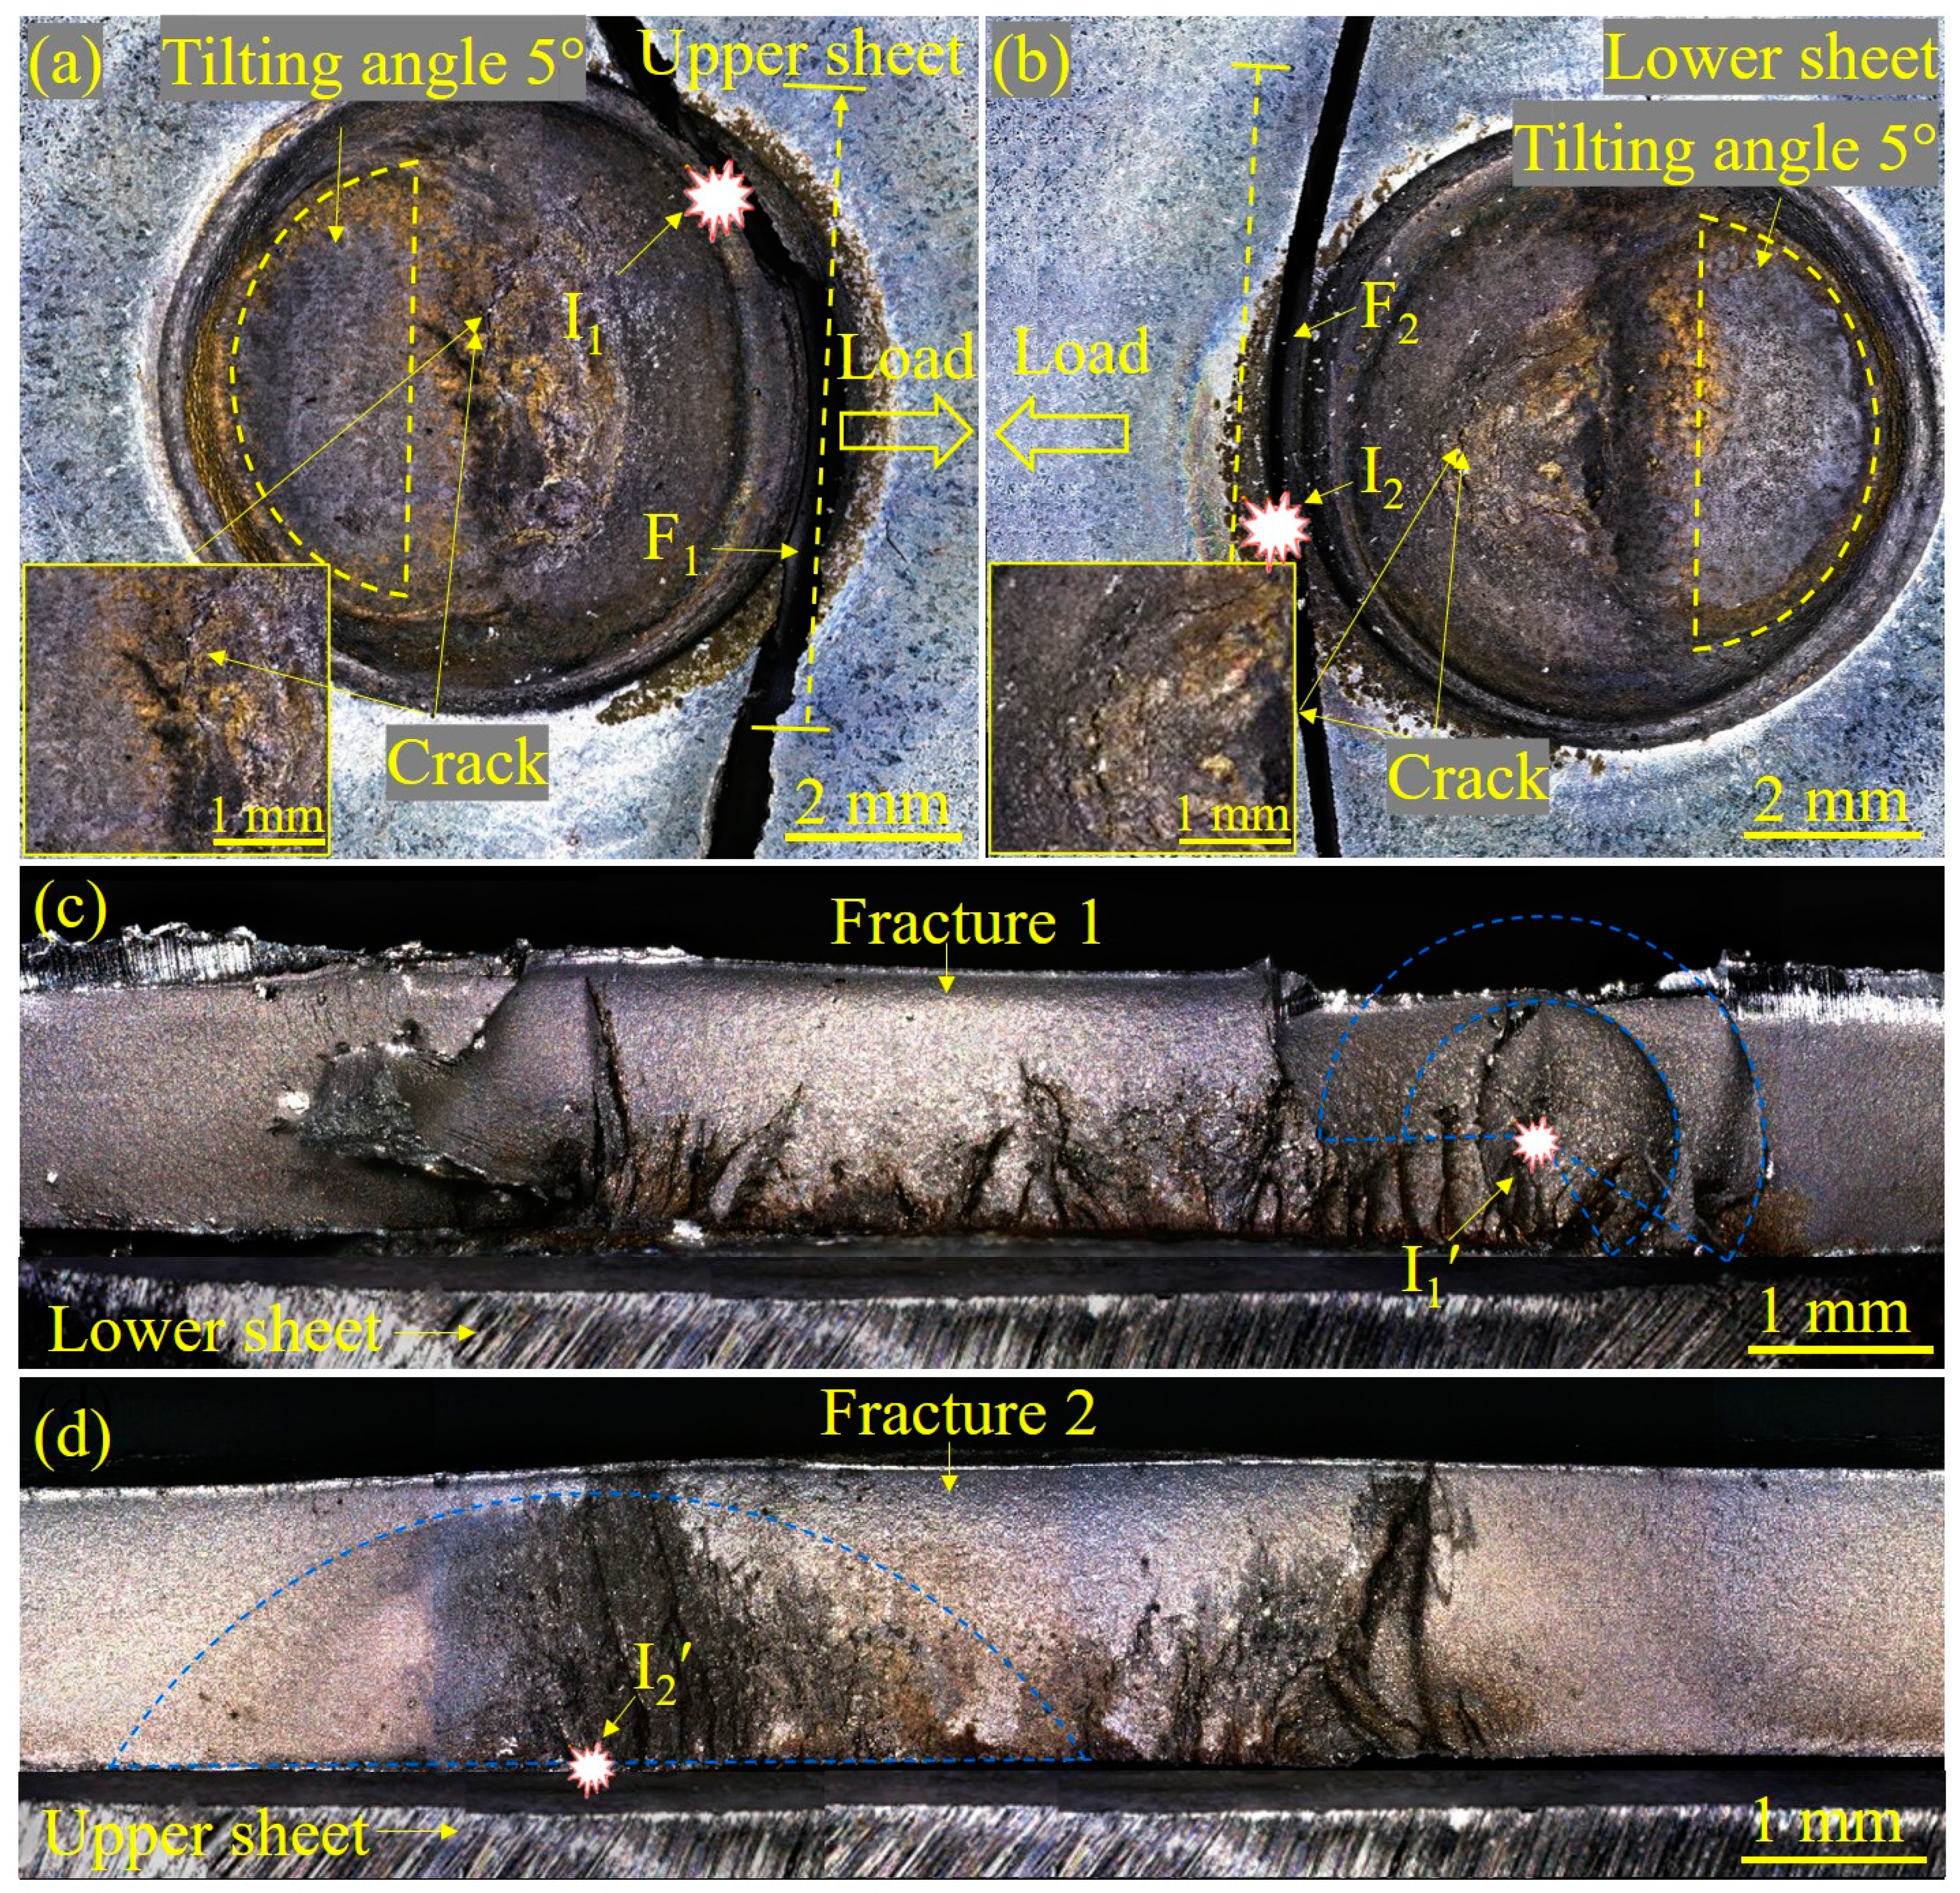
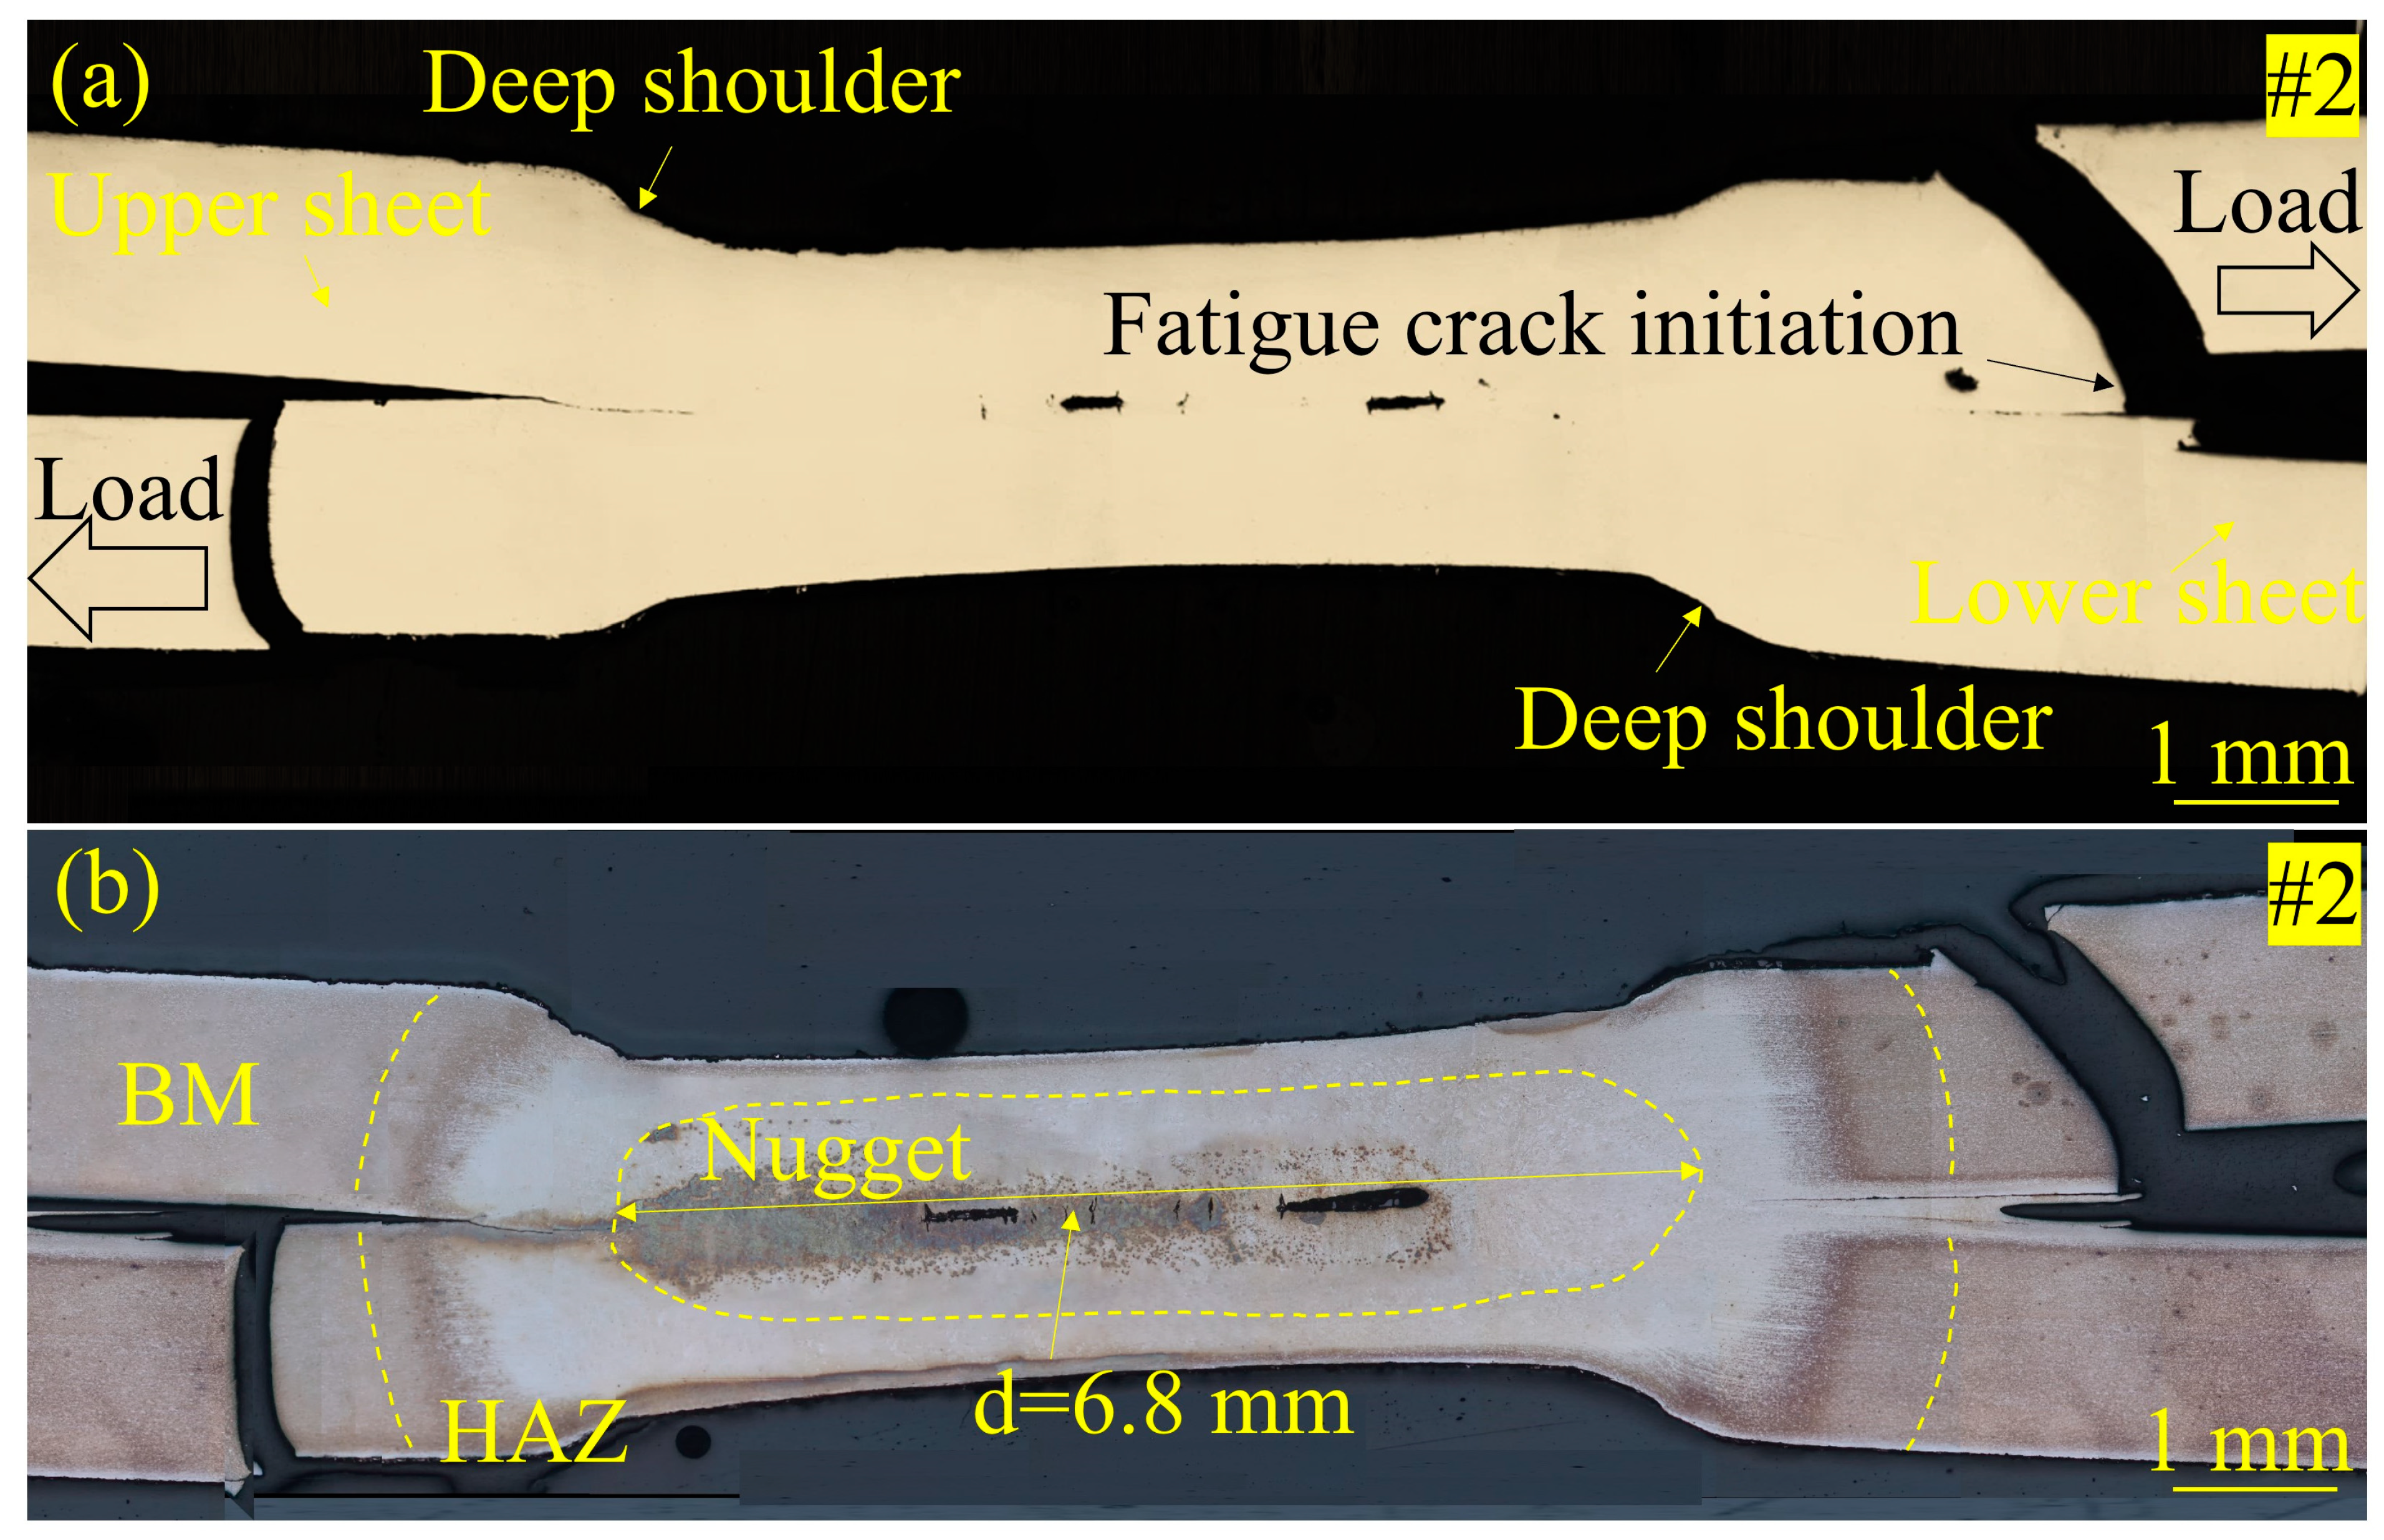
3.4. Fatigue Crack Initiation Determination
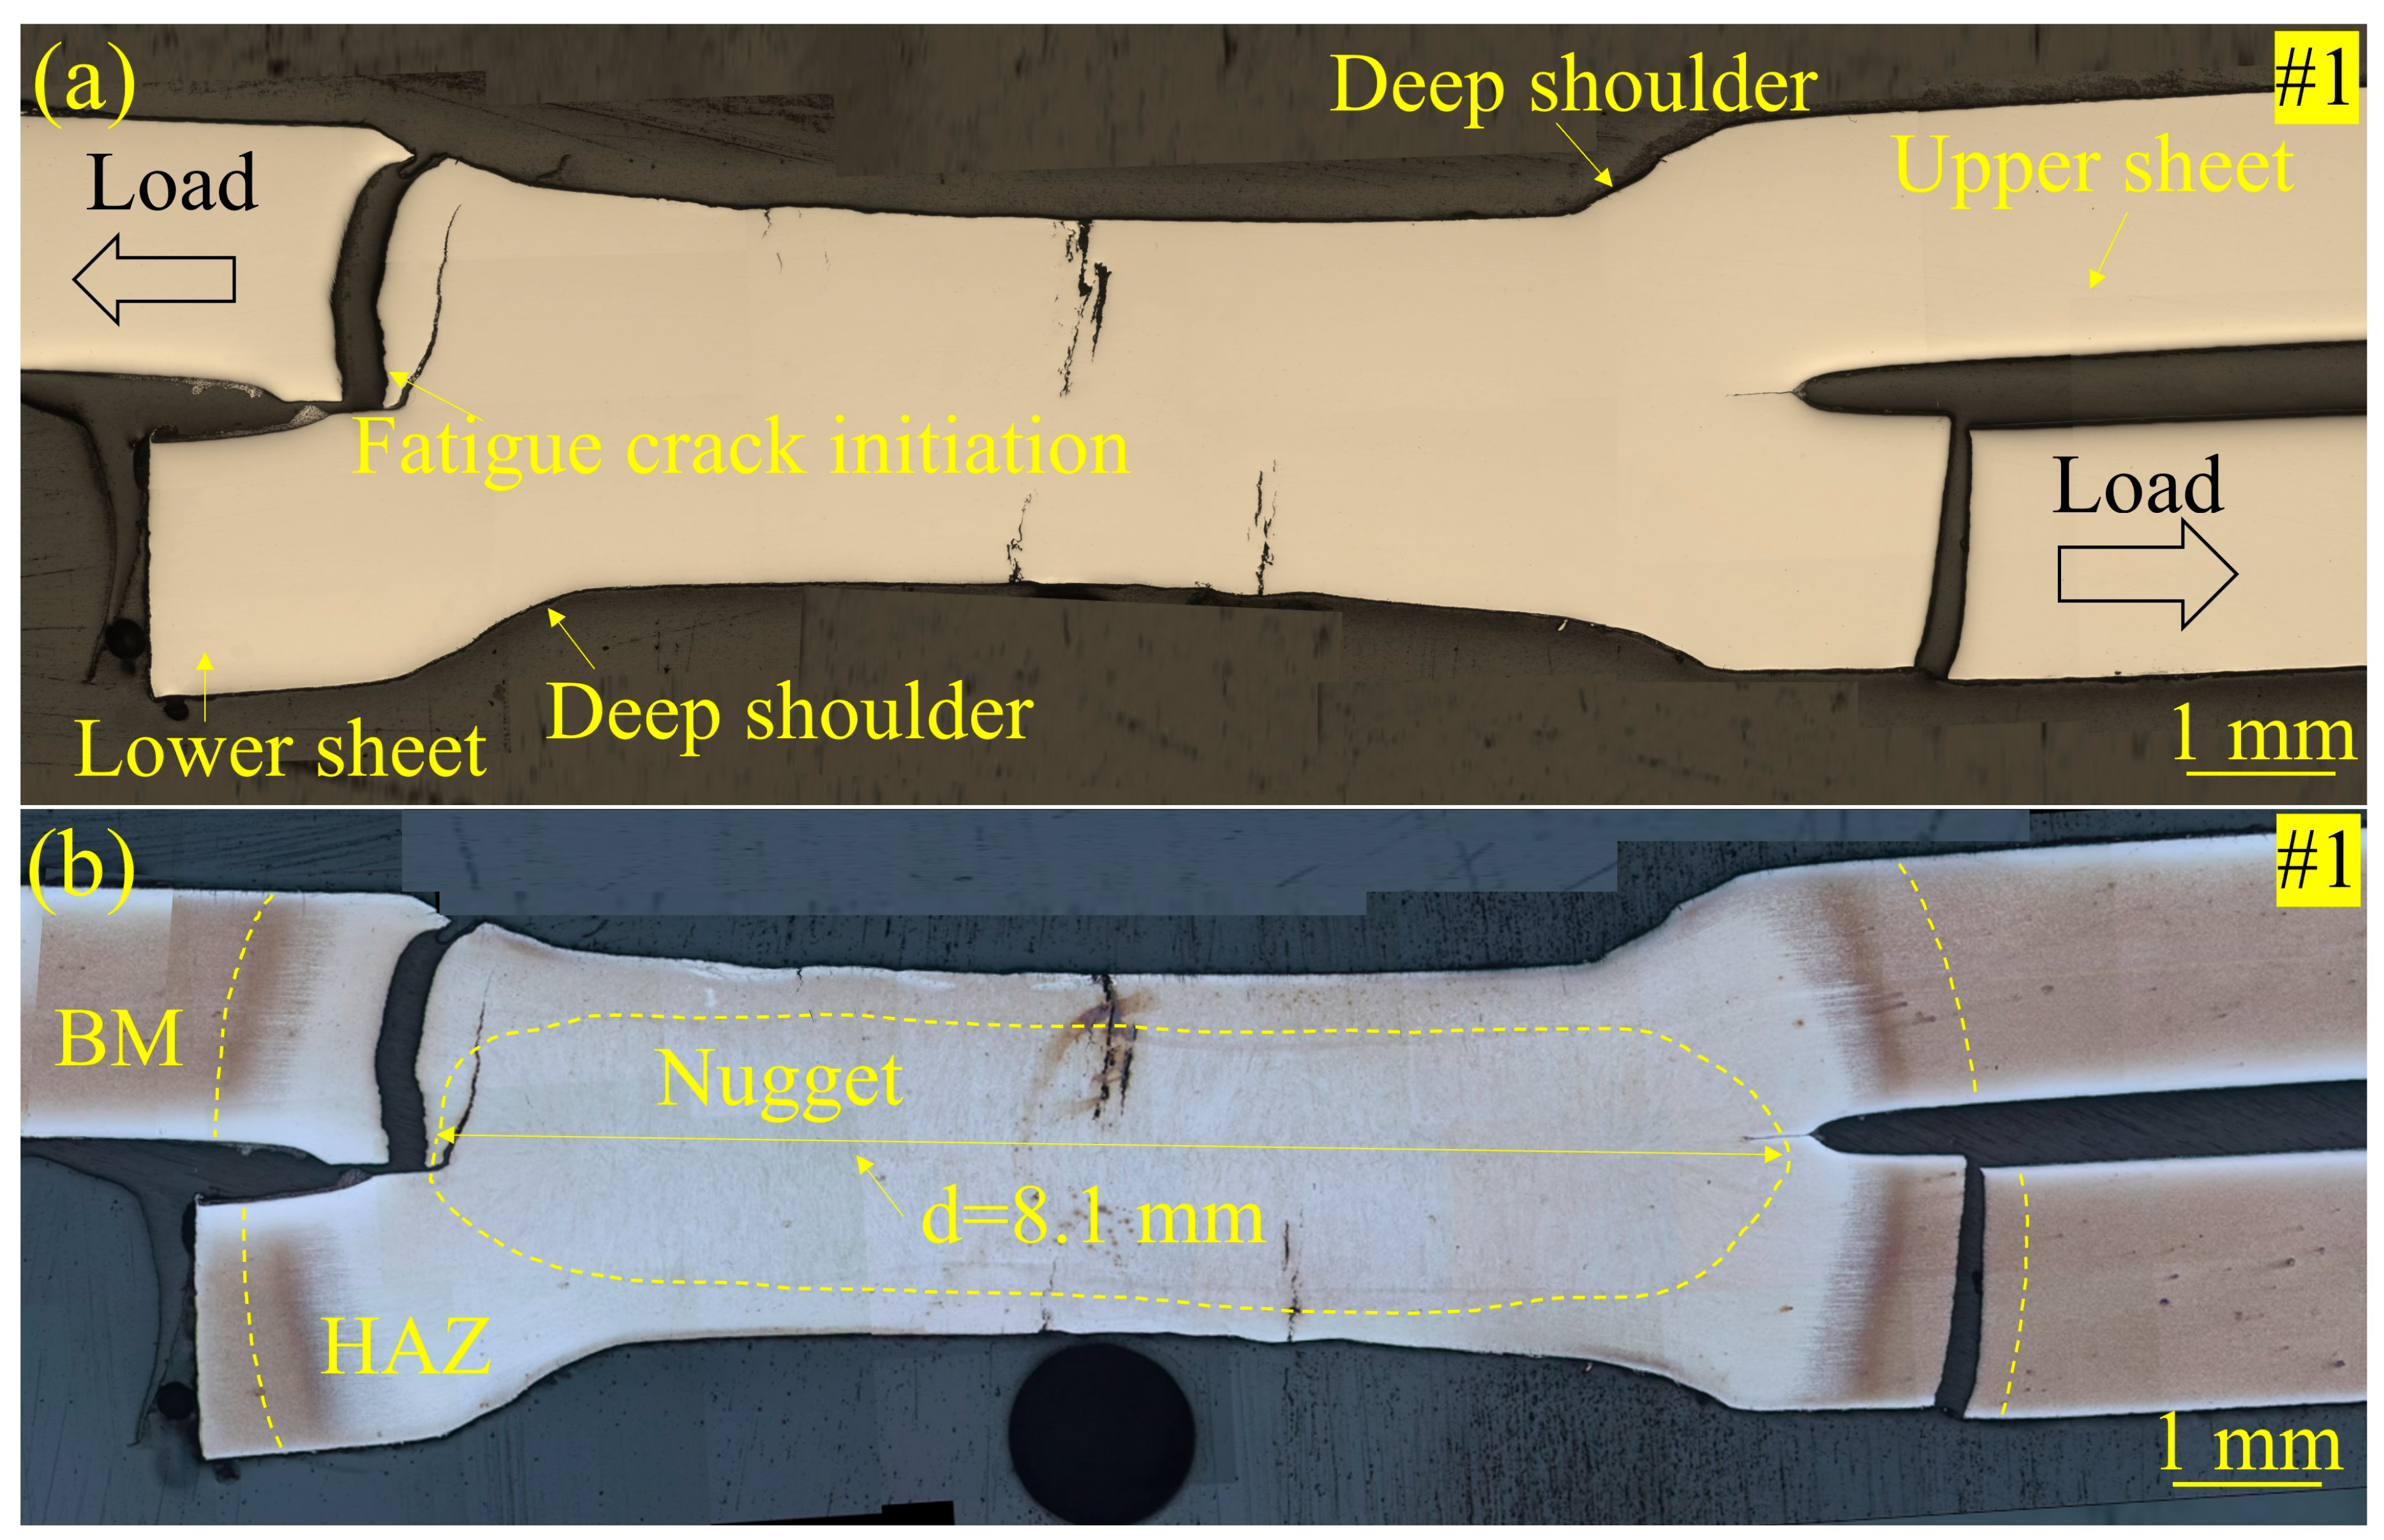
3.5. Analysis of the Failure Mechanism
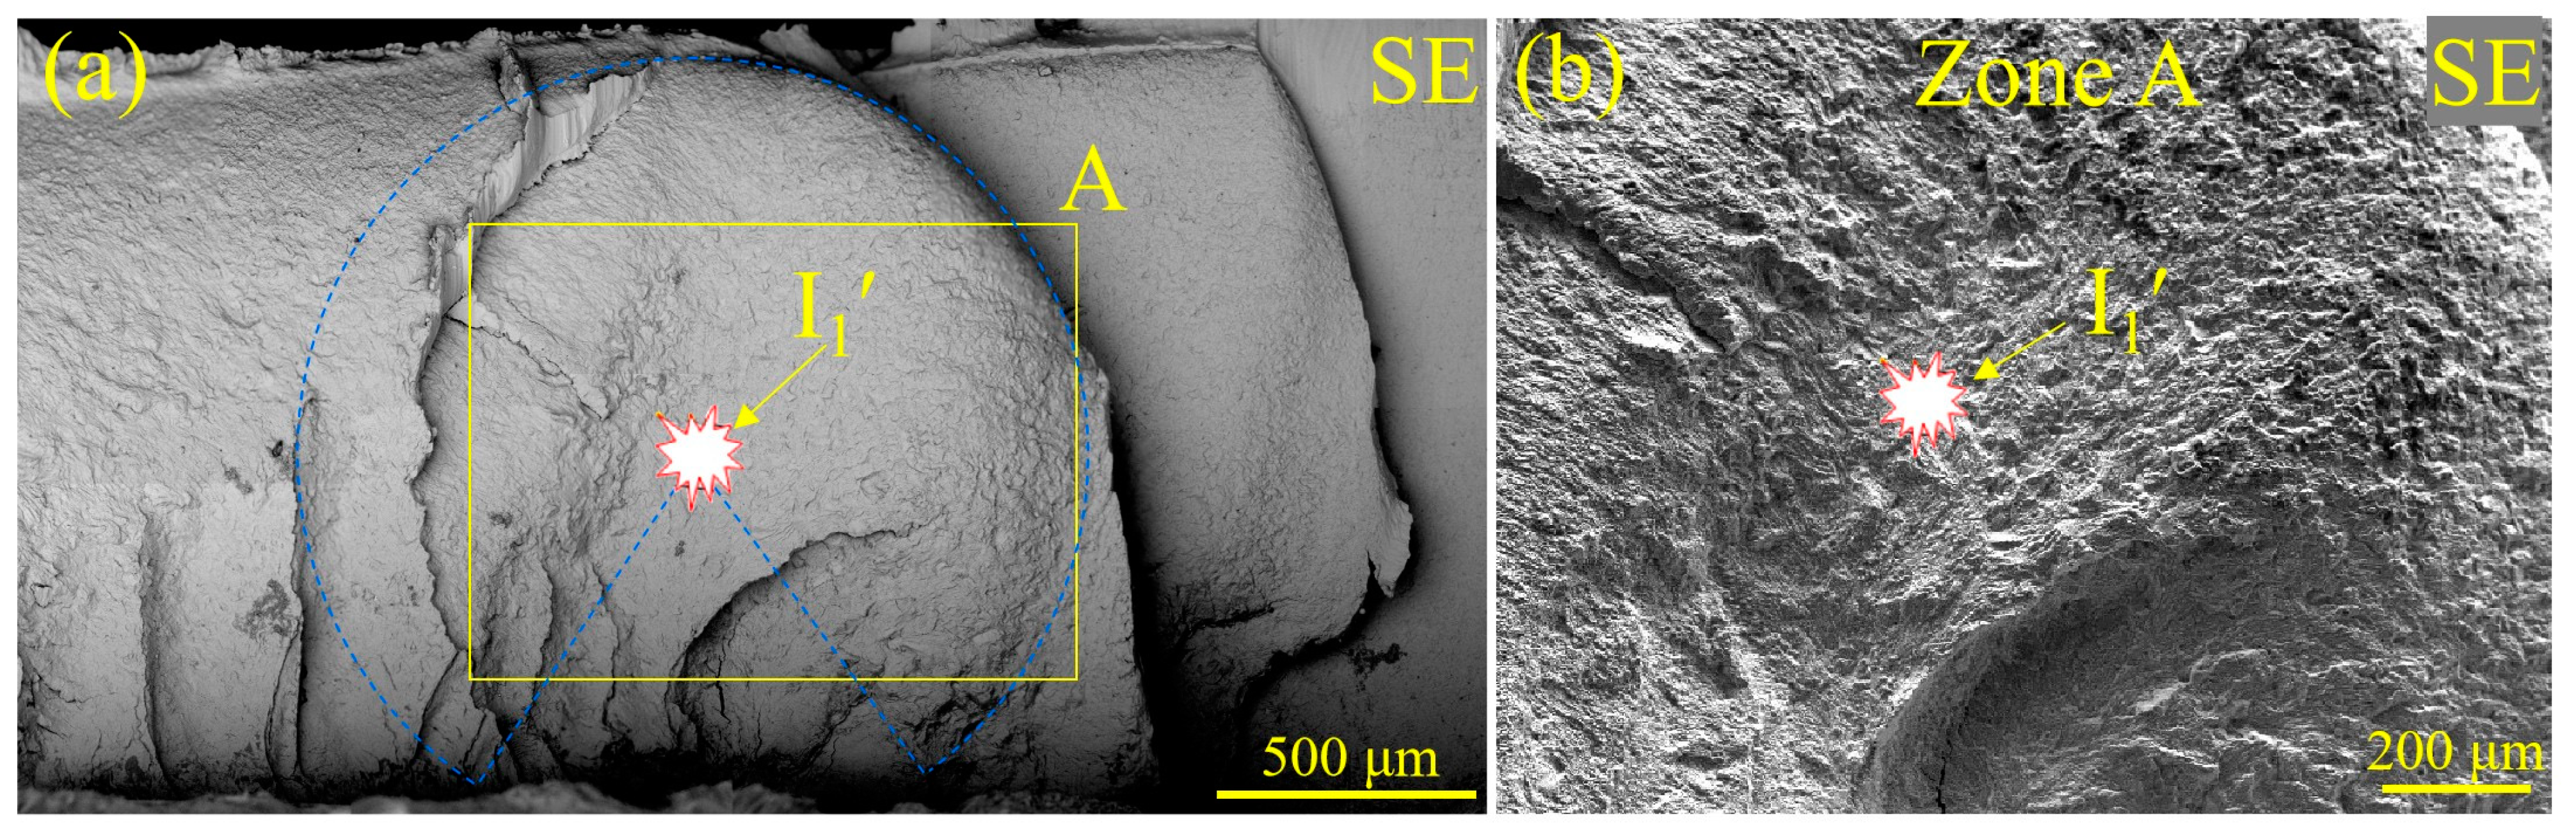
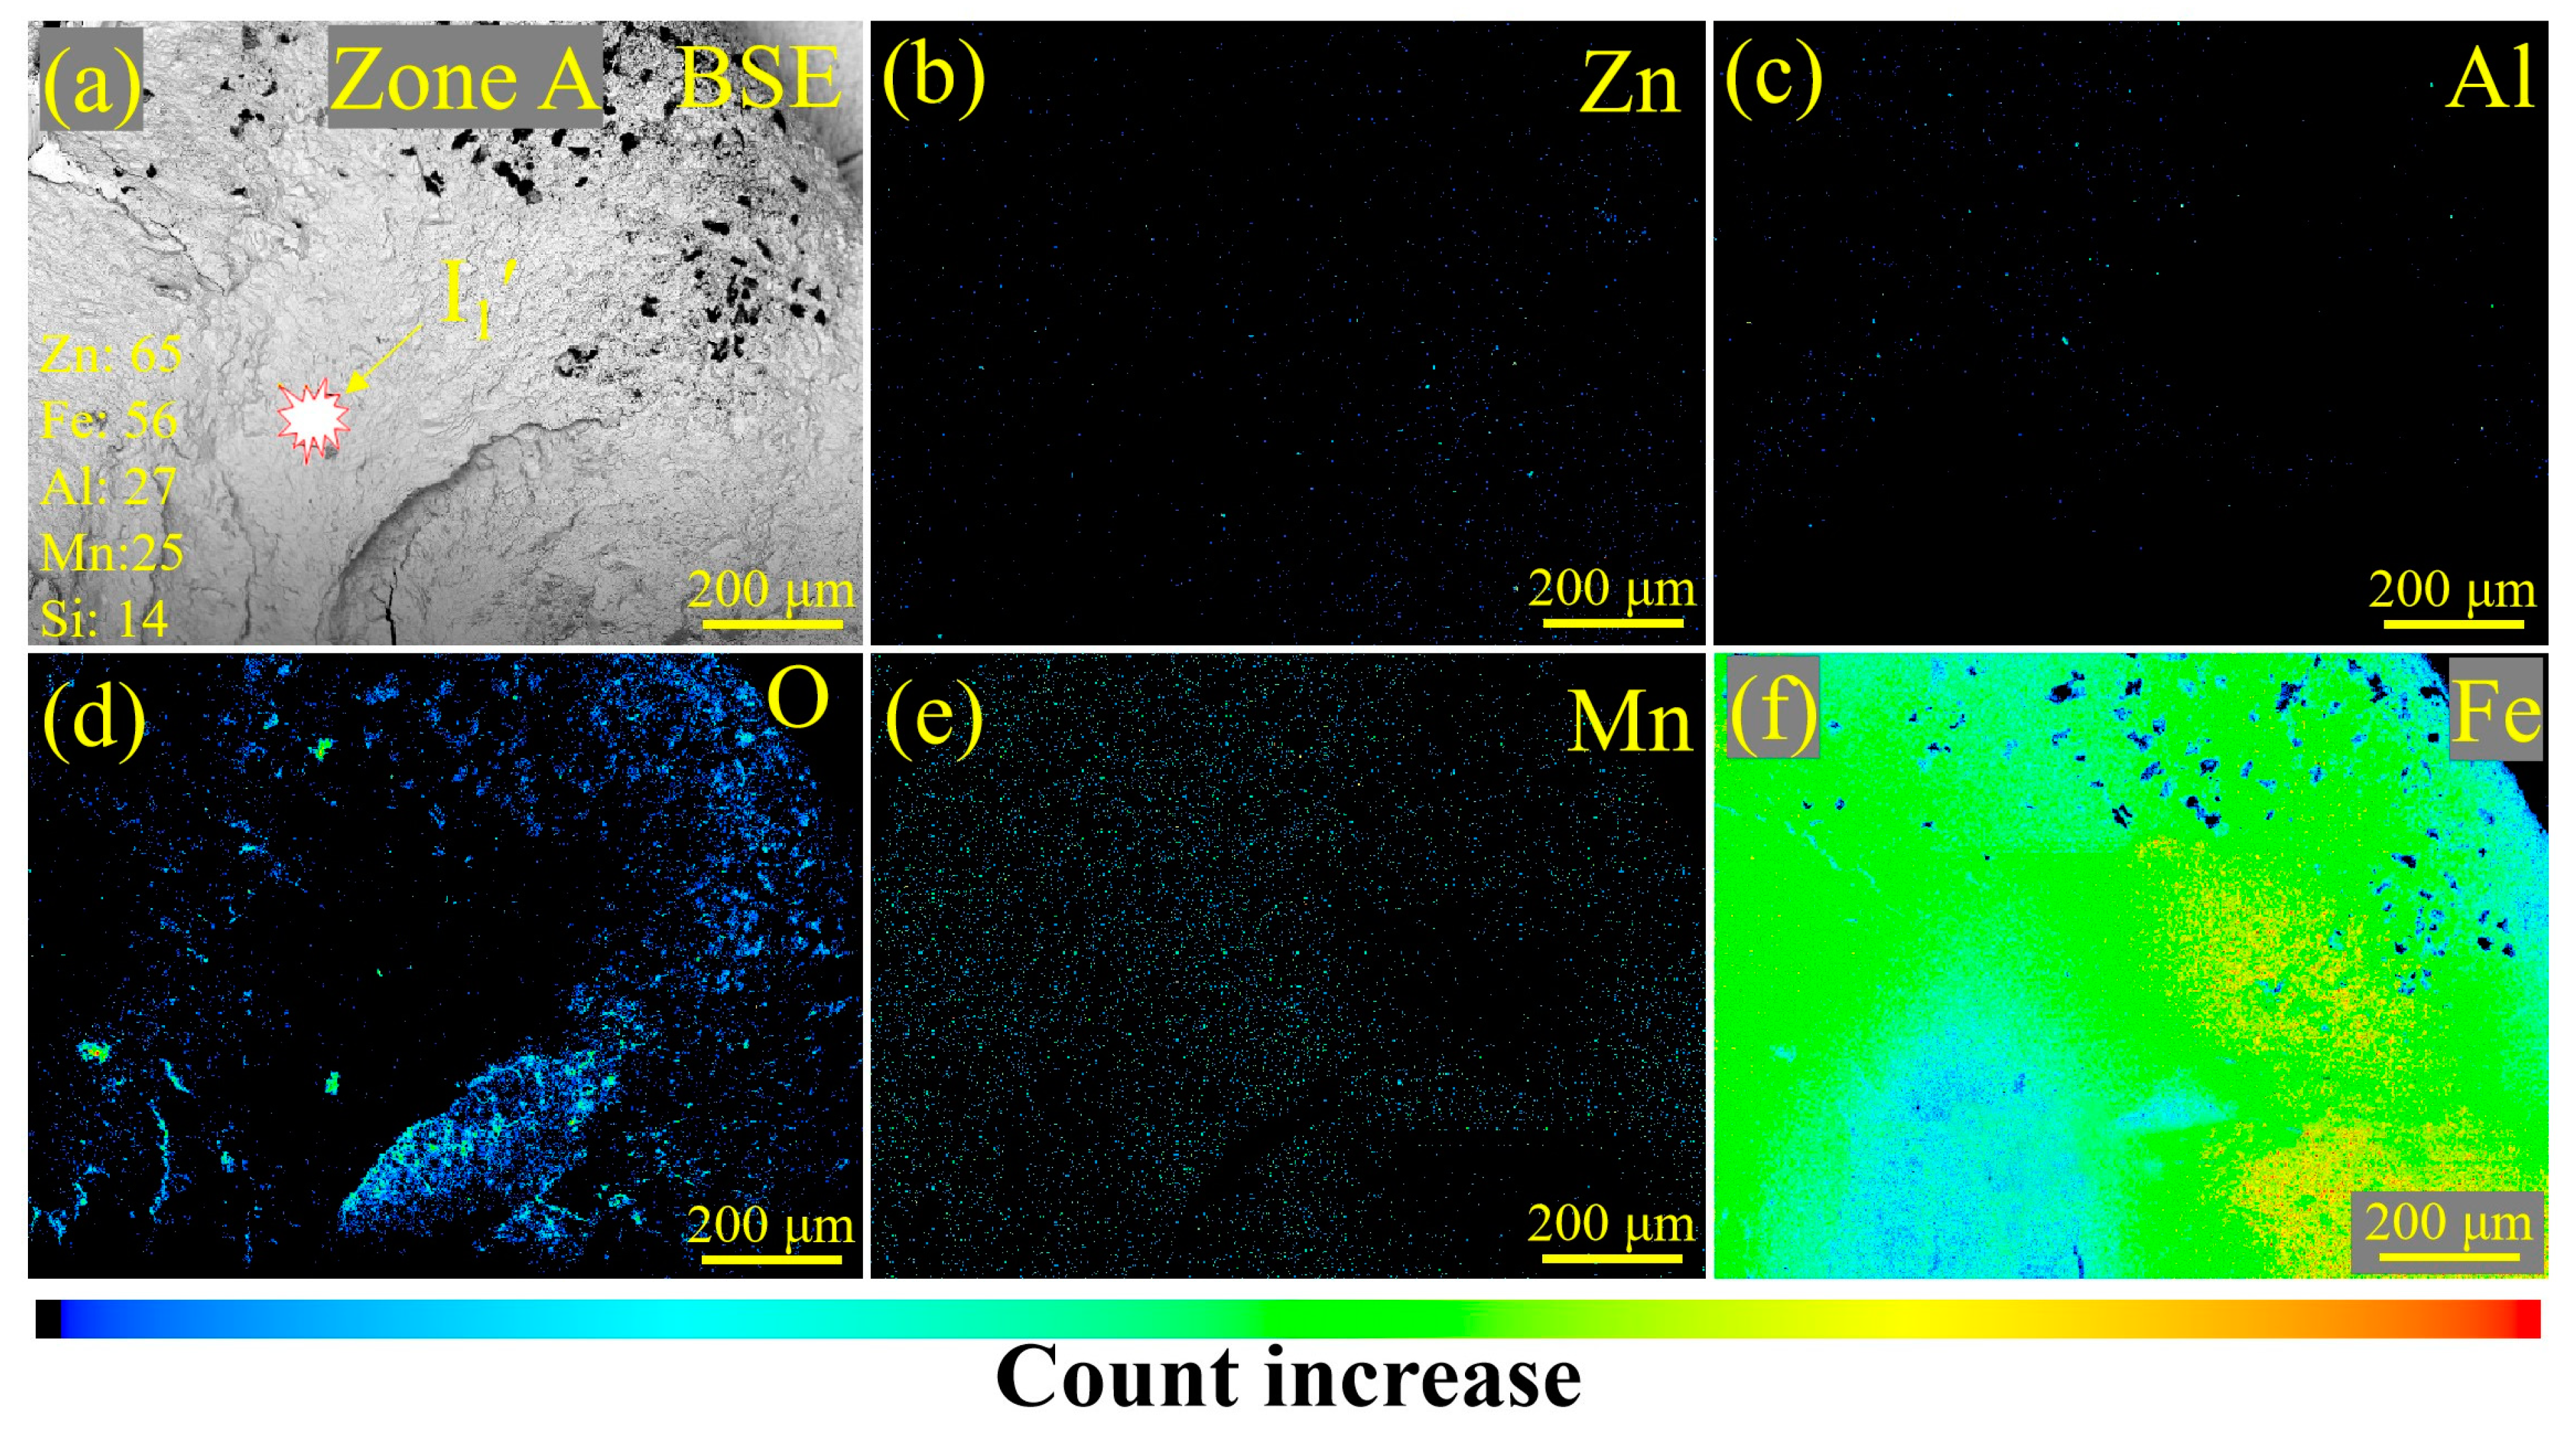
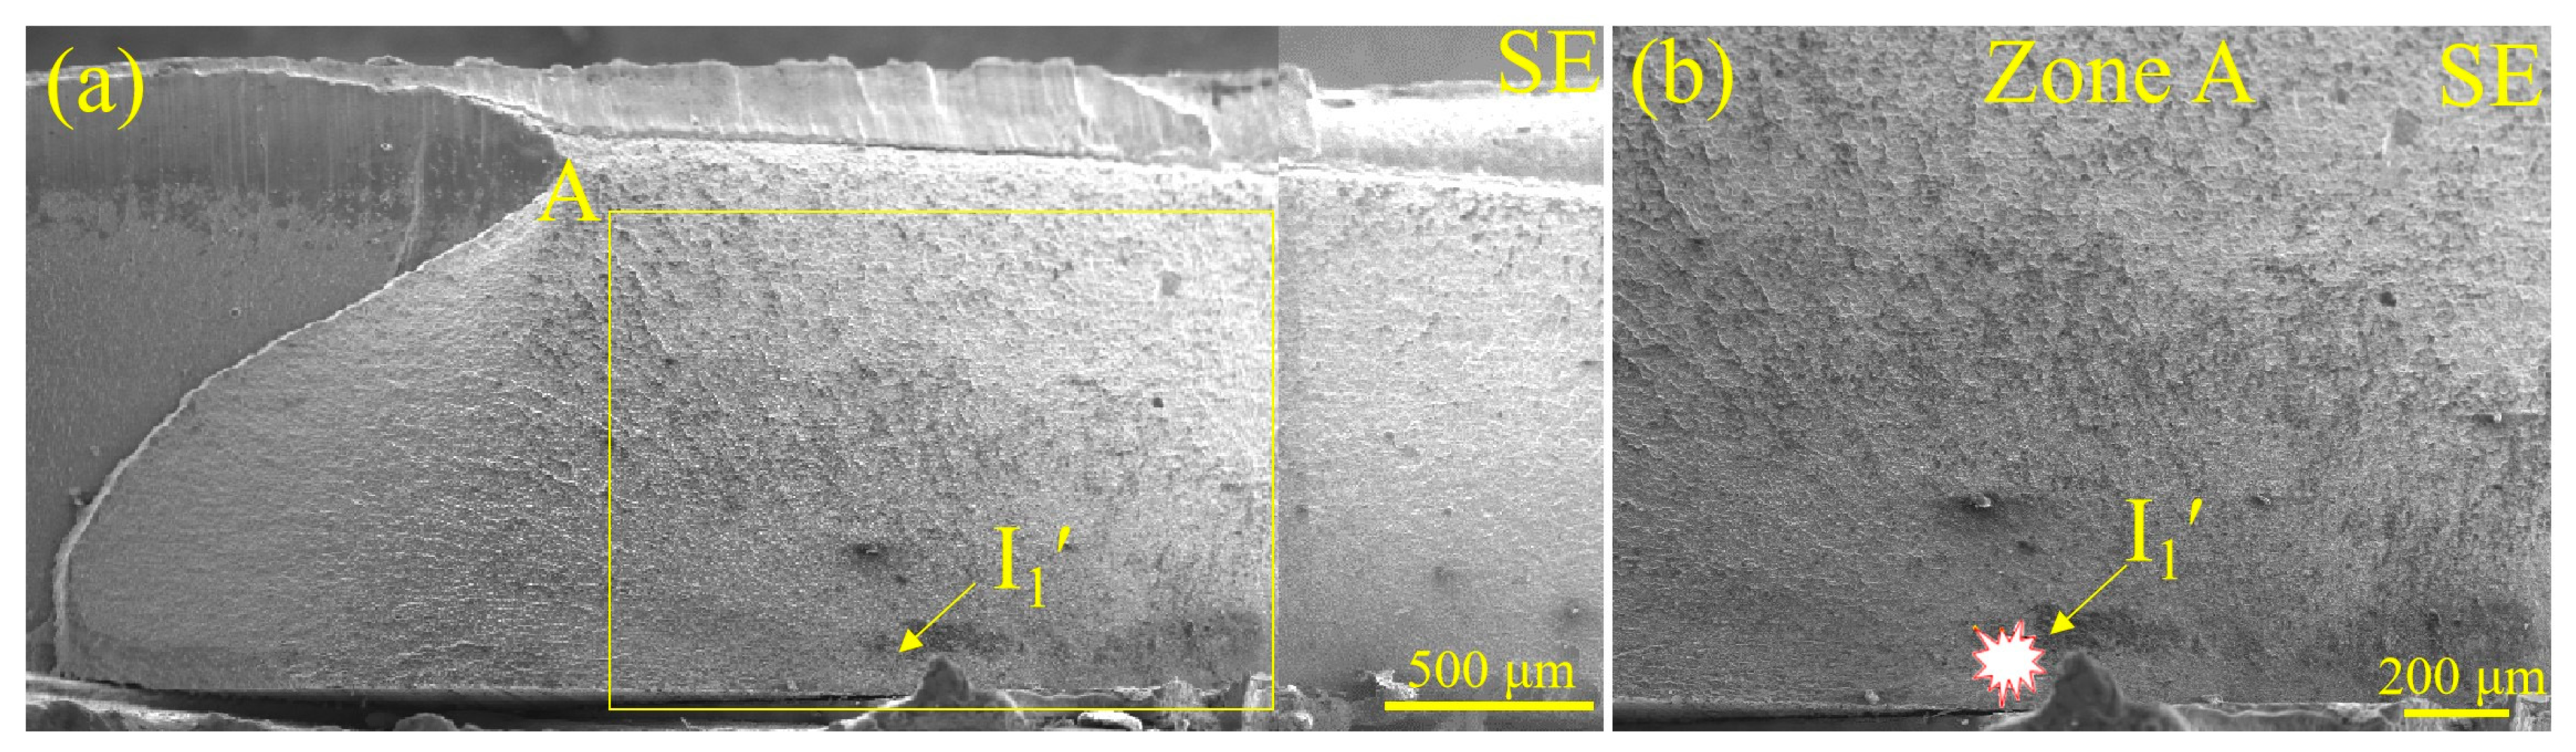
3.6. Analysis of the Fatigue Fracture
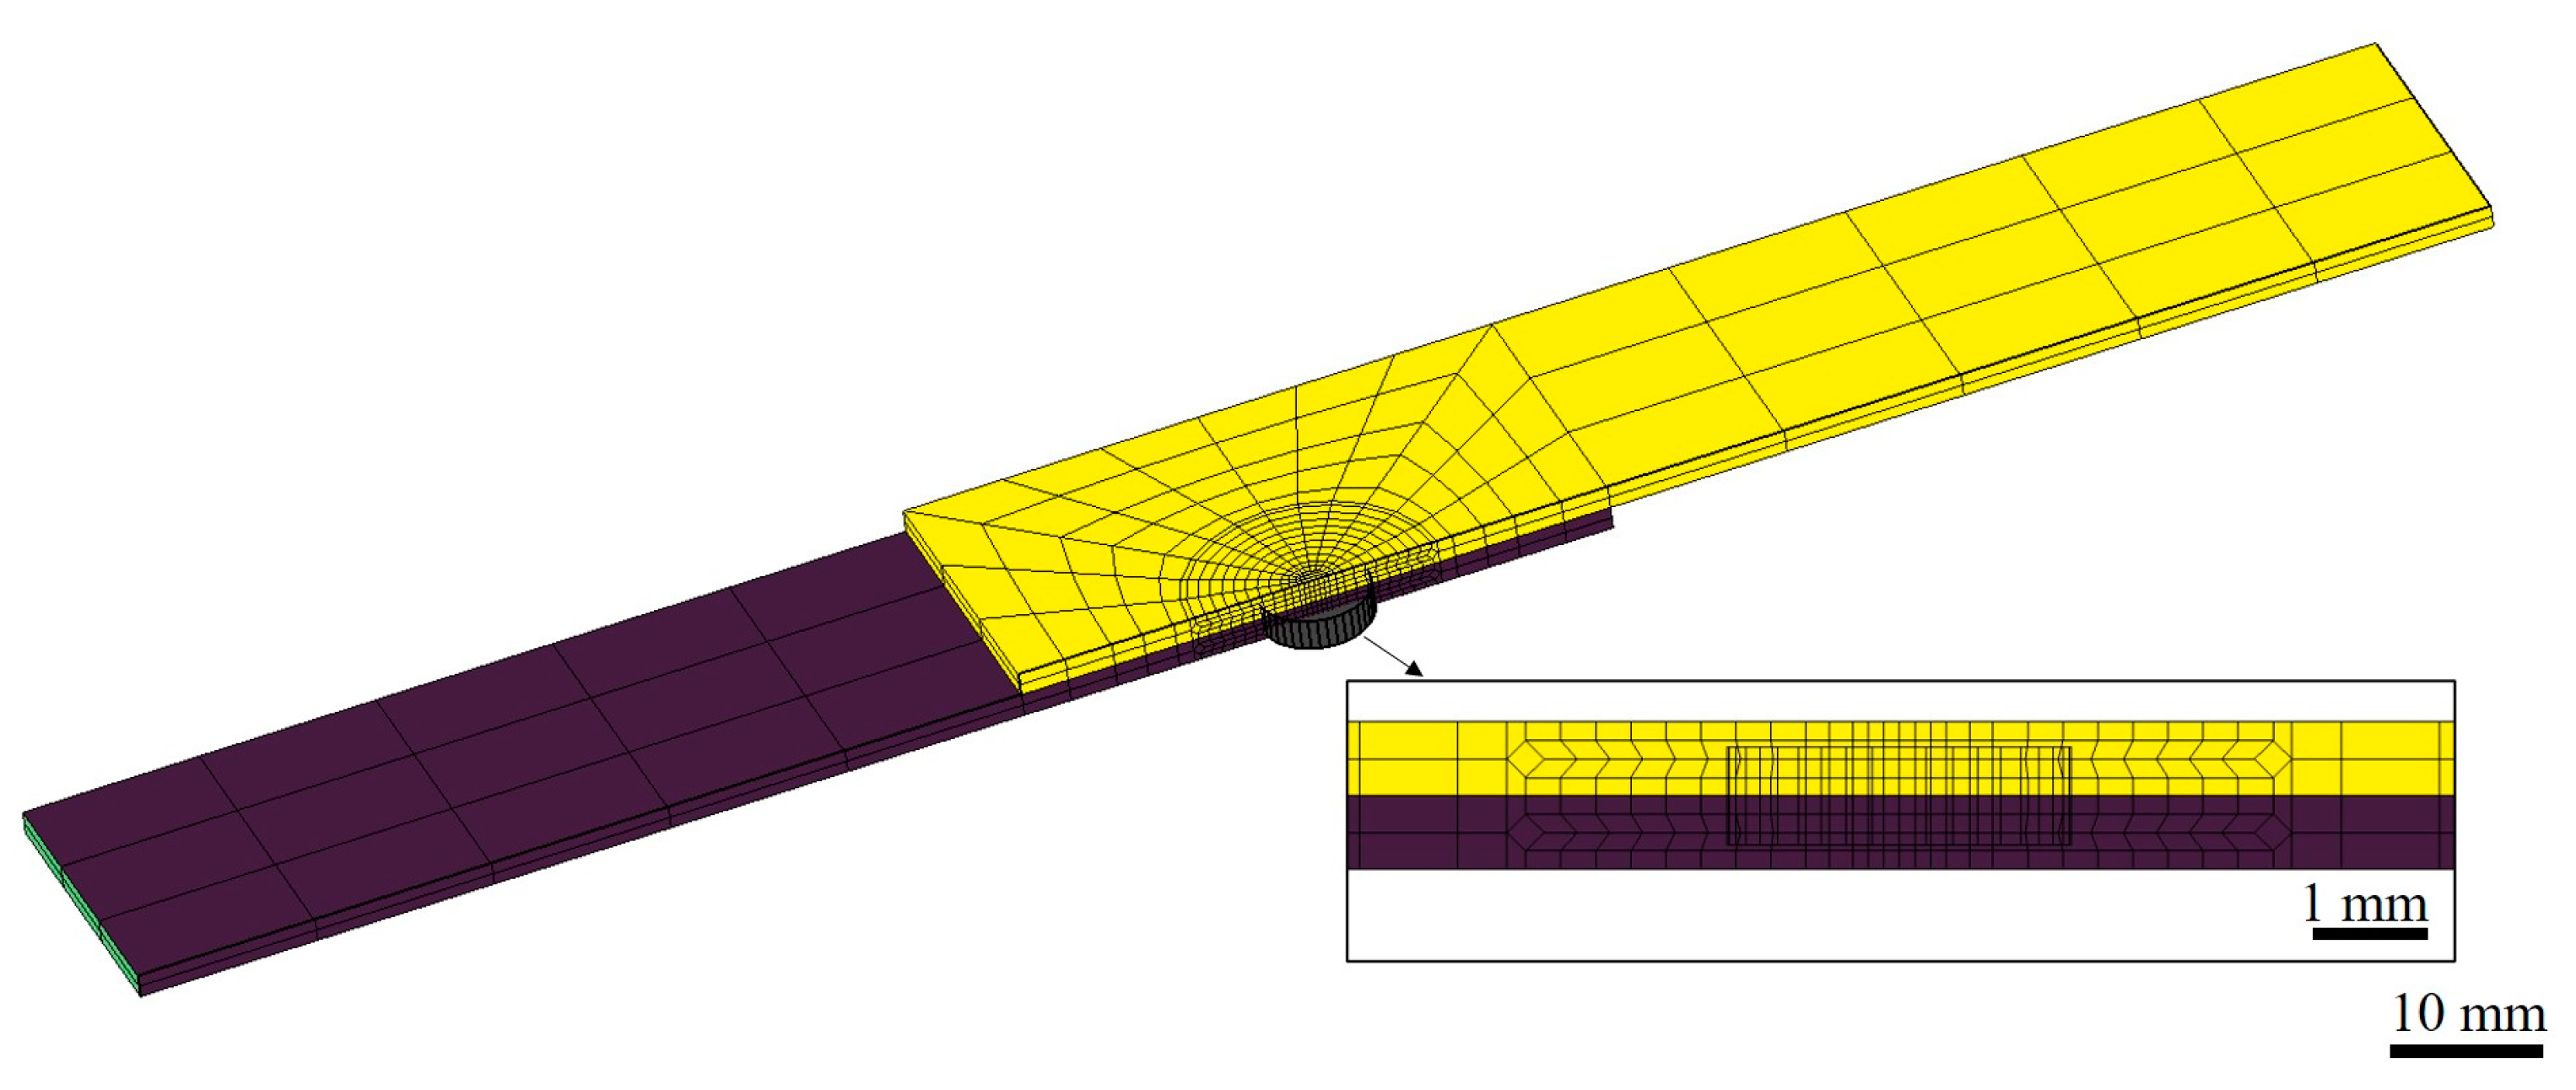
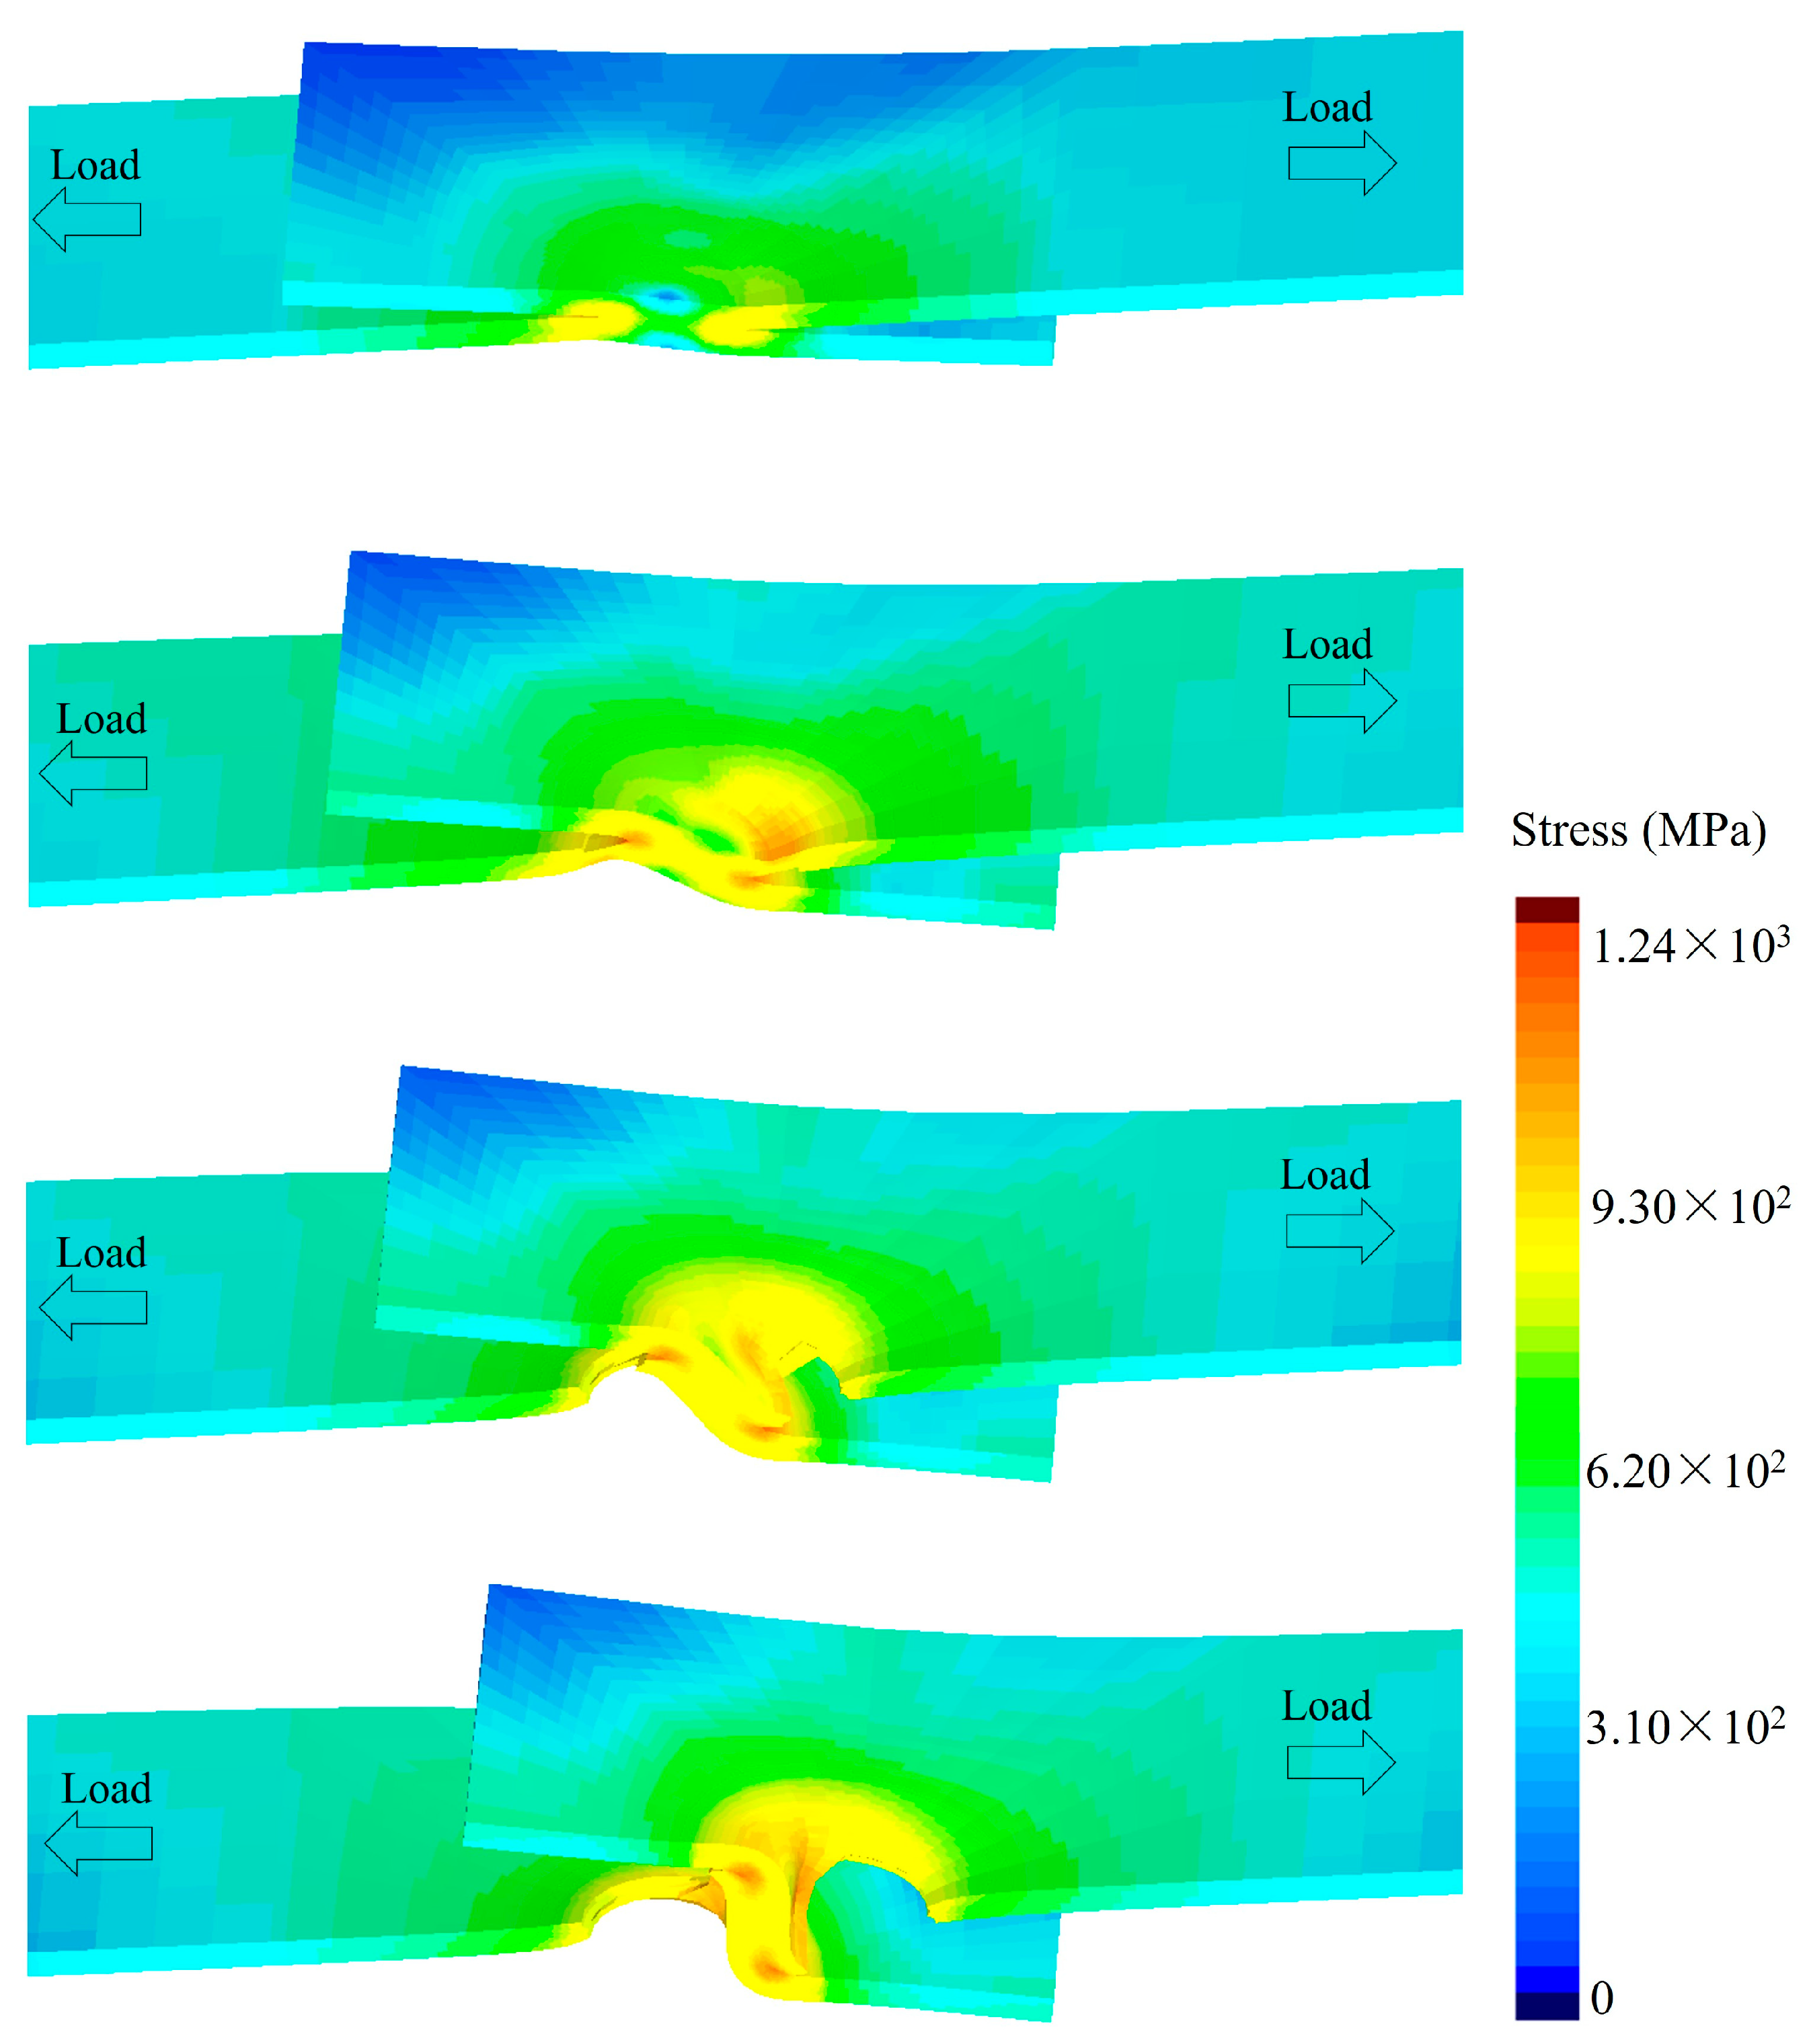
3.7. Stress Simulation for the Tensile–Shear Fatigue Test
4. Conclusions
Author Contributions
Funding
Institutional Review Board Statement
Informed Consent Statement
Data Availability Statement
Conflicts of Interest
References
- Ling, Z.; Wang, M.; Kong, L.; Chen, K. Towards an explanation of liquid metal embrittlement cracking in resistance spot welding of dissimilar steels. Mater. Des. 2020, 195, 109055. [Google Scholar] [CrossRef]
- Li, W.; Ma, L.; Peng, P.; Jia, Q.; Wan, Z.; Zhu, Y.; Guo, W. Microstructural evolution and deformation behavior of fiber laser welded QP980 steel joint. Mater. Sci. Eng. A 2018, 717, 124–133. [Google Scholar] [CrossRef]
- Li, Y.J.; Liu, D.; Zhang, W.N.; Kang, J.; Chen, D.; Yuan, G.; Wang, G.D. Quenching above martensite start temperature in quenching and partitioning (Q&P) steel through control of partial phase transformation. Mater. Lett. 2018, 230, 36–39. [Google Scholar]
- Shojaee, M.; Midawi, A.R.H.; Barber, B.; Ghassemi-Armaki, H.; Worswick, M.; Biro, E. Mechanical properties and failure behavior of resistance spot welded third-generation advanced high strength steels. J. Manuf. Process. 2021, 65, 364–372. [Google Scholar] [CrossRef]
- Pouranvari, M.; Sobhani, S.; Goodarzi, F. Resistance spot welding of MS1200 martensitic advanced high strength steel: Microstructure-properties relationship. J. Manuf. Process. 2018, 31, 867–874. [Google Scholar] [CrossRef]
- Liu, W.; Fan, H.; Guo, X.; Huang, Z.; Han, X. Mechanical properties of resistance spot welded components of high strength austenitic stainless steel. J. Mater. Sci. Technol. 2016, 32, 561–565. [Google Scholar] [CrossRef]
- Díaz, C.A.; Martínez, E.E.; De Lange, D.F.; Saldaña, R.; Guerra-Fuentes, L.; Torres-Medina, M.F.; Barreras, R.E.; Rodríguez, S.L.; Cruz, J.J.; Peña-Juarez, M.G.; et al. Development of Q&P steels of third generation under conditions simulating a continuous annealing process, and evaluation of their weldability by the RSW process. Mater. Lett. 2024, 365, 136407. [Google Scholar]
- Wei, P.S.; Wu, T.H. Electrode geometry effects on microstructure determined by heat transfer and solidification rate during resistance spot welding. Int. J. Heat. Mass. Transf. 2014, 79, 408–416. [Google Scholar] [CrossRef]
- Zhou, J.Y.; Sun, Y.; Wu, B.J.; Hu, T.H.; Lei, M.; Ding, K.; Gao, Y.L. Effect of the Welding Current on the Liquid Metal Embrittlement in the Resistance Spot Welded Galvanized DP1180 Advanced High Strength Steel. In TMS 2024 153rd Annual Meeting & Exhibition Supplemental Proceedings; Springer: Cham, Switzerland, 2024; pp. 1124–1131. [Google Scholar]
- Siar, O.; Dancette, S.; Dupuy, T.; Fabrègue, D. Impact of liquid metal embrittlement inner cracks on the mechanical behavior of 3 generation advanced high strength steel spot welds. J. Mater. Res. Technol. 2021, 15, 6678–6689. [Google Scholar] [CrossRef]
- Ma, Y.; Yu, Y.; Geng, P.; Ihara, R.; Maeda, K.; Suzuki, R.; Suga, T.; Ma, N. Fracture modeling of resistance spot welded ultra-high-strength steel considering the effect of liquid metal embrittlement crack. Mater. Des. 2021, 210, 110075. [Google Scholar] [CrossRef]
- Dong, W.F.; Pan, H.; Lei, M.; Ding, K.; Gao, Y.L. Zn penetration and its coupled interaction with the grain boundary during the resistance spot welding of the QP980 steel. Scripta Mater. 2022, 218, 114832. [Google Scholar] [CrossRef]
- Chabok, A.; Aa, E.V.; Hosson, J.D.; Pei, Y.T. Mechanical behavior and failure mechanism of resistance spot welded DP1000 dual phase steel. Mater. Des. 2017, 124, 171–182. [Google Scholar] [CrossRef]
- Dong, W.F.; Ding, K.; Pan, H.; Lei, M.; Gao, Y.L. Effect of Welding Current on Liquid Metal Embrittlement of the Resistance Spot Welded Galvanized QP980 Advanced High-Strength Steel. In TMS 2022 151st Annual Meeting & Exhibition Supplemental Proceedings; Springer: Cham, Switzerland, 2022; pp. 1254–1261. [Google Scholar]
- Razmpoosh, M.H.; DiGiovanni, C.; Zhou, Y.N.; Biro, E. Pathway to understand liquid metal embrittlement (LME) in Fe-Zn couple: From fundamentals toward application. Prog. Mater. Sci. 2021, 121, 100798. [Google Scholar] [CrossRef]
- Chen, X.F.; Li, Z.X.; Yang, D.P.; Wang, Y.Q.; Yi, H.L.; Xie, G.M. Achieving excellent properties of resistance spot welded 2GPa-grade press hardened steel and galvanized DP980 steel via double-pulse. J. Mater. Res. Technol. 2024, 28, 4475–4487. [Google Scholar] [CrossRef]
- Marya, M.; Gayden, X.Q. Development of requirements for resistance spot welding Dual-Phase (DP600) steels part 1: The causes of interfacial fracture. Weld. J. 2005, 84, 172–182. [Google Scholar]
- Sun, X.; Stephens, E.V.; Khaleel, M.A. Effects of fusion zone size and failure mode on peak load and energy absorption of advanced high strength steel spot welds under lap shear loading conditions. Eng. Fail. Anal. 2008, 15, 356–367. [Google Scholar] [CrossRef]
- Mukhopadhyay, G.; Bhattacharya, S.; Ray, K.K. Strength assessment of spot welded sheets of interstitial free steels. J. Mater. Process. Technol. 2009, 209, 1995–2007. [Google Scholar] [CrossRef]
- Zhang, S.; DiGiovanni, C.; He, L.; Zhou, N.Y. Weld hardness ratio and liquid metal embrittlement crack’s detrimental effect on resistant spot weld strength. Sci. Technol. Weld. Join. 2020, 26, 58–67. [Google Scholar] [CrossRef]
- DiGiovanni, C.; Biro, E.; Zhou, N.Y. Impact of liquid metal embrittlement cracks on resistance spot weld static strength. Sci. Technol. Weld. Join. 2018, 24, 218–224. [Google Scholar] [CrossRef]
- DiGiovanni, C.; Han, X.; Powell, A.; Biro, E.; Zhou, N.Y. Experimental and numerical analysis of liquid metal embrittlement crack location. J. Mater. Eng. Perform. 2019, 28, 2045–2052. [Google Scholar] [CrossRef]
- Wintjes, E.; DiGiovanni, C.; He, L.; Biro, E.; Zhou, N.Y. Quantifying the link between crack distribution and resistance spot weld strength reduction in liquid metal embrittlement susceptible steels. Weld. World 2019, 63, 807–814. [Google Scholar] [CrossRef]
- Benlatreche, Y.; Ghassemi-Armaki, H.; Duchet, M.; Dupuy, T.; Cornette, D.; Carollo, G. Spot-Weld Integrity of Zn-Coated 3rd Generation: Advanced High Strength Steels in Presence of LME; IABC: San Francisco, CA, USA, 2017; pp. 765–769. [Google Scholar]
- Kwon, K.; Jang, G.; Kim, W.; Uhm, S.; Lee, T.; Lee, C.S. Effect of type-C liquid metal embrittlement on mechanical properties of spot-welded TRIP steel. J. Mater. Res. Technol. 2021, 13, 2482–2490. [Google Scholar] [CrossRef]
- Kim, Y.G.; Kim, I.J.; Kim, J.S.; Chung, Y.I.; Choi, D.Y. Evaluation of surface crack in resistance spot welds of Zn-coated steel. Mater. Trans. 2014, 55, 171–175. [Google Scholar] [CrossRef]
- Gaul, H.; Weber, G.; Rethmeier, M. Influence of HAZ cracks on fatigue resistance of resistance spot welded joints made of advanced high strength steels. Sci. Technol. Weld. Join. 2011, 16, 440–445. [Google Scholar] [CrossRef]
- Jang, G.H.; Kwon, K.; Kim, W.; Uhm, S.; Lee, T.; Lee, C.S. Effect of Type-B liquid metal embrittlement cracks on high-cycle fatigue properties of spot-welded 1180 TRIP steel. Sci. Technol. Weld. Join. 2021, 26, 173–179. [Google Scholar] [CrossRef]
- ISO 14324:2003; Resistance Spot Welding—Destructive Tests of Welds—Method for the Fatigue Testing of Spot Welded Joints. ISO (International Organization for Standardization): Geneva, Switzerland, 2003; pp. 1–10.
- Basquin, O.H. The exponential law of endurance tests. Proc. Am. Soc. Tset. Mater. 1910, 10, 625–630. [Google Scholar]
- Long, X.; Khanna, S.K.; Allard, L.F. Effect of fatigue loading and residual stress on microscopic deformation mechanisms in a spot welded joint. Mater. Sci. Eng. A 2007, 454–455, 398–406. [Google Scholar] [CrossRef]
- Ma, C.; Chen, D.L.; Bhole, S.D.; Boudreau, G.; Lee, A.; Biro, E. Microstructure and fracture characteristics of spot-welded DP600 steel. Mater. Sci. Eng. A 2008, 485, 334–346. [Google Scholar] [CrossRef]
- Deng, X.; Chen, W.; Shi, G. Three-dimensional finite element analysis of the mechanical behavior of spot welds. Finite Elem. Anal. Des. 2000, 35, 17–39. [Google Scholar] [CrossRef]


| Elements | C | Mn | Si | P | S | Fe |
|---|---|---|---|---|---|---|
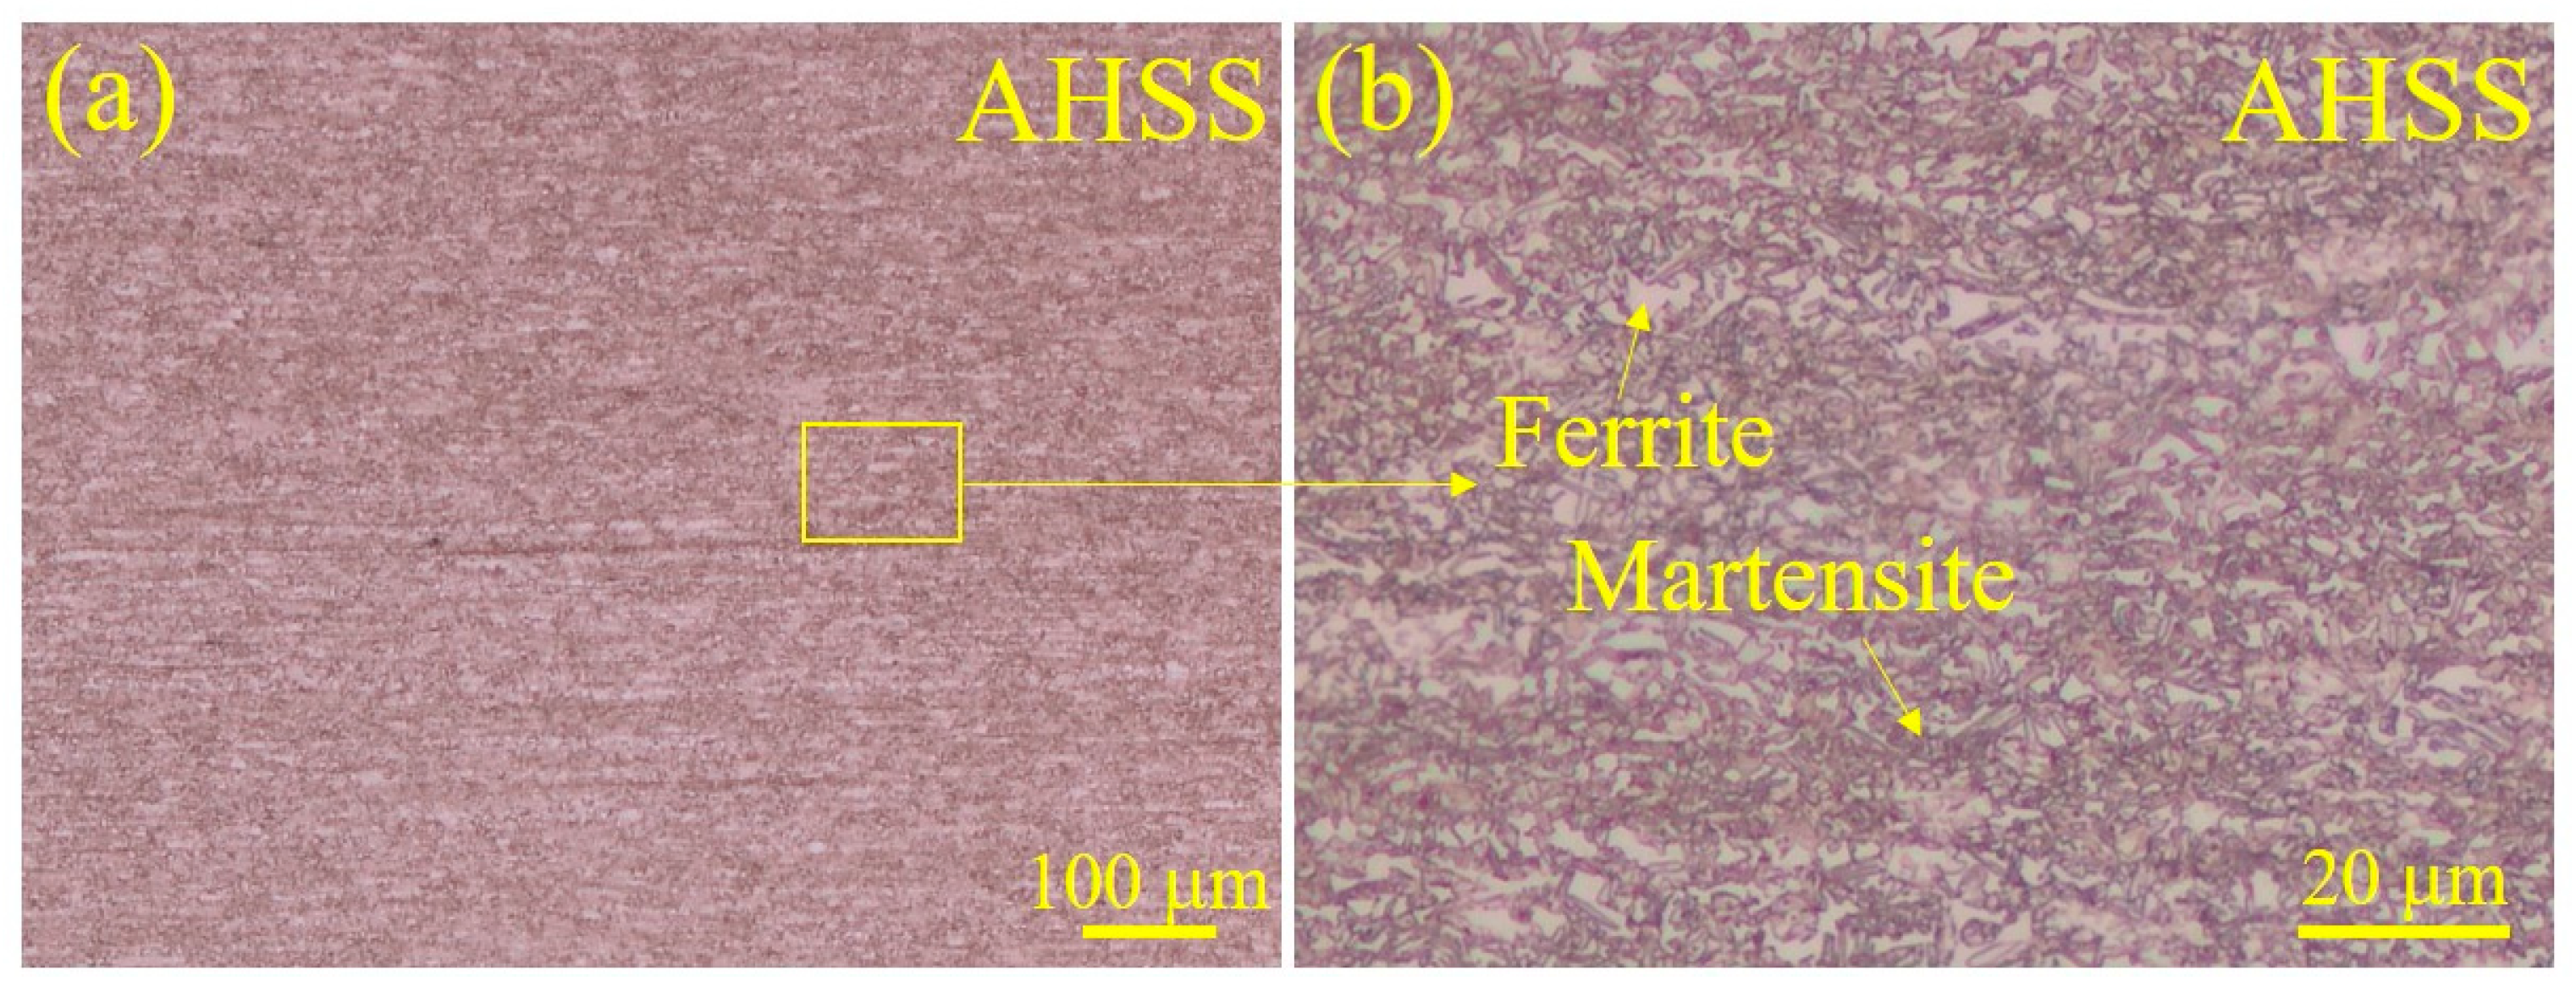
| AHSS | >0.2 | >2.2 | >0.8 | <0.03 | <0.01 | Bal. |
| Mechanical Properties | Tensile Strength (MPa) | Yield Strength (MPa) | Elongation (%) |
|---|---|---|---|
| AHSS | 1035 | 724 | 20.6 |
Disclaimer/Publisher’s Note: The statements, opinions and data contained in all publications are solely those of the individual author(s) and contributor(s) and not of MDPI and/or the editor(s). MDPI and/or the editor(s) disclaim responsibility for any injury to people or property resulting from any ideas, methods, instructions or products referred to in the content. |
© 2024 by the authors. Licensee MDPI, Basel, Switzerland. This article is an open access article distributed under the terms and conditions of the Creative Commons Attribution (CC BY) license (https://creativecommons.org/licenses/by/4.0/).
Share and Cite
Sun, Y.; Zhou, J.; Hu, R.; Pan, H.; Ding, K.; Lei, M.; Gao, Y. The High-Cycle Tensile–Shear Fatigue Properties and Failure Mechanism of Resistance Spot-Welded Advanced High-Strength Steel with a Zn Coating. Materials 2024, 17, 4463. https://doi.org/10.3390/ma17184463
Sun Y, Zhou J, Hu R, Pan H, Ding K, Lei M, Gao Y. The High-Cycle Tensile–Shear Fatigue Properties and Failure Mechanism of Resistance Spot-Welded Advanced High-Strength Steel with a Zn Coating. Materials. 2024; 17(18):4463. https://doi.org/10.3390/ma17184463
Chicago/Turabian StyleSun, Yu, Jiayi Zhou, Rongxun Hu, Hua Pan, Kai Ding, Ming Lei, and Yulai Gao. 2024. "The High-Cycle Tensile–Shear Fatigue Properties and Failure Mechanism of Resistance Spot-Welded Advanced High-Strength Steel with a Zn Coating" Materials 17, no. 18: 4463. https://doi.org/10.3390/ma17184463