
Predicting High-Strength Concrete’s Compressive Strength: A Comparative Study of Artificial Neural Networks, Adaptive Neuro-Fuzzy Inference System, and Response Surface Methodology

 , and
, and
Abstract
:1. Introduction
2. Research Significance
3. Experimental Dataset
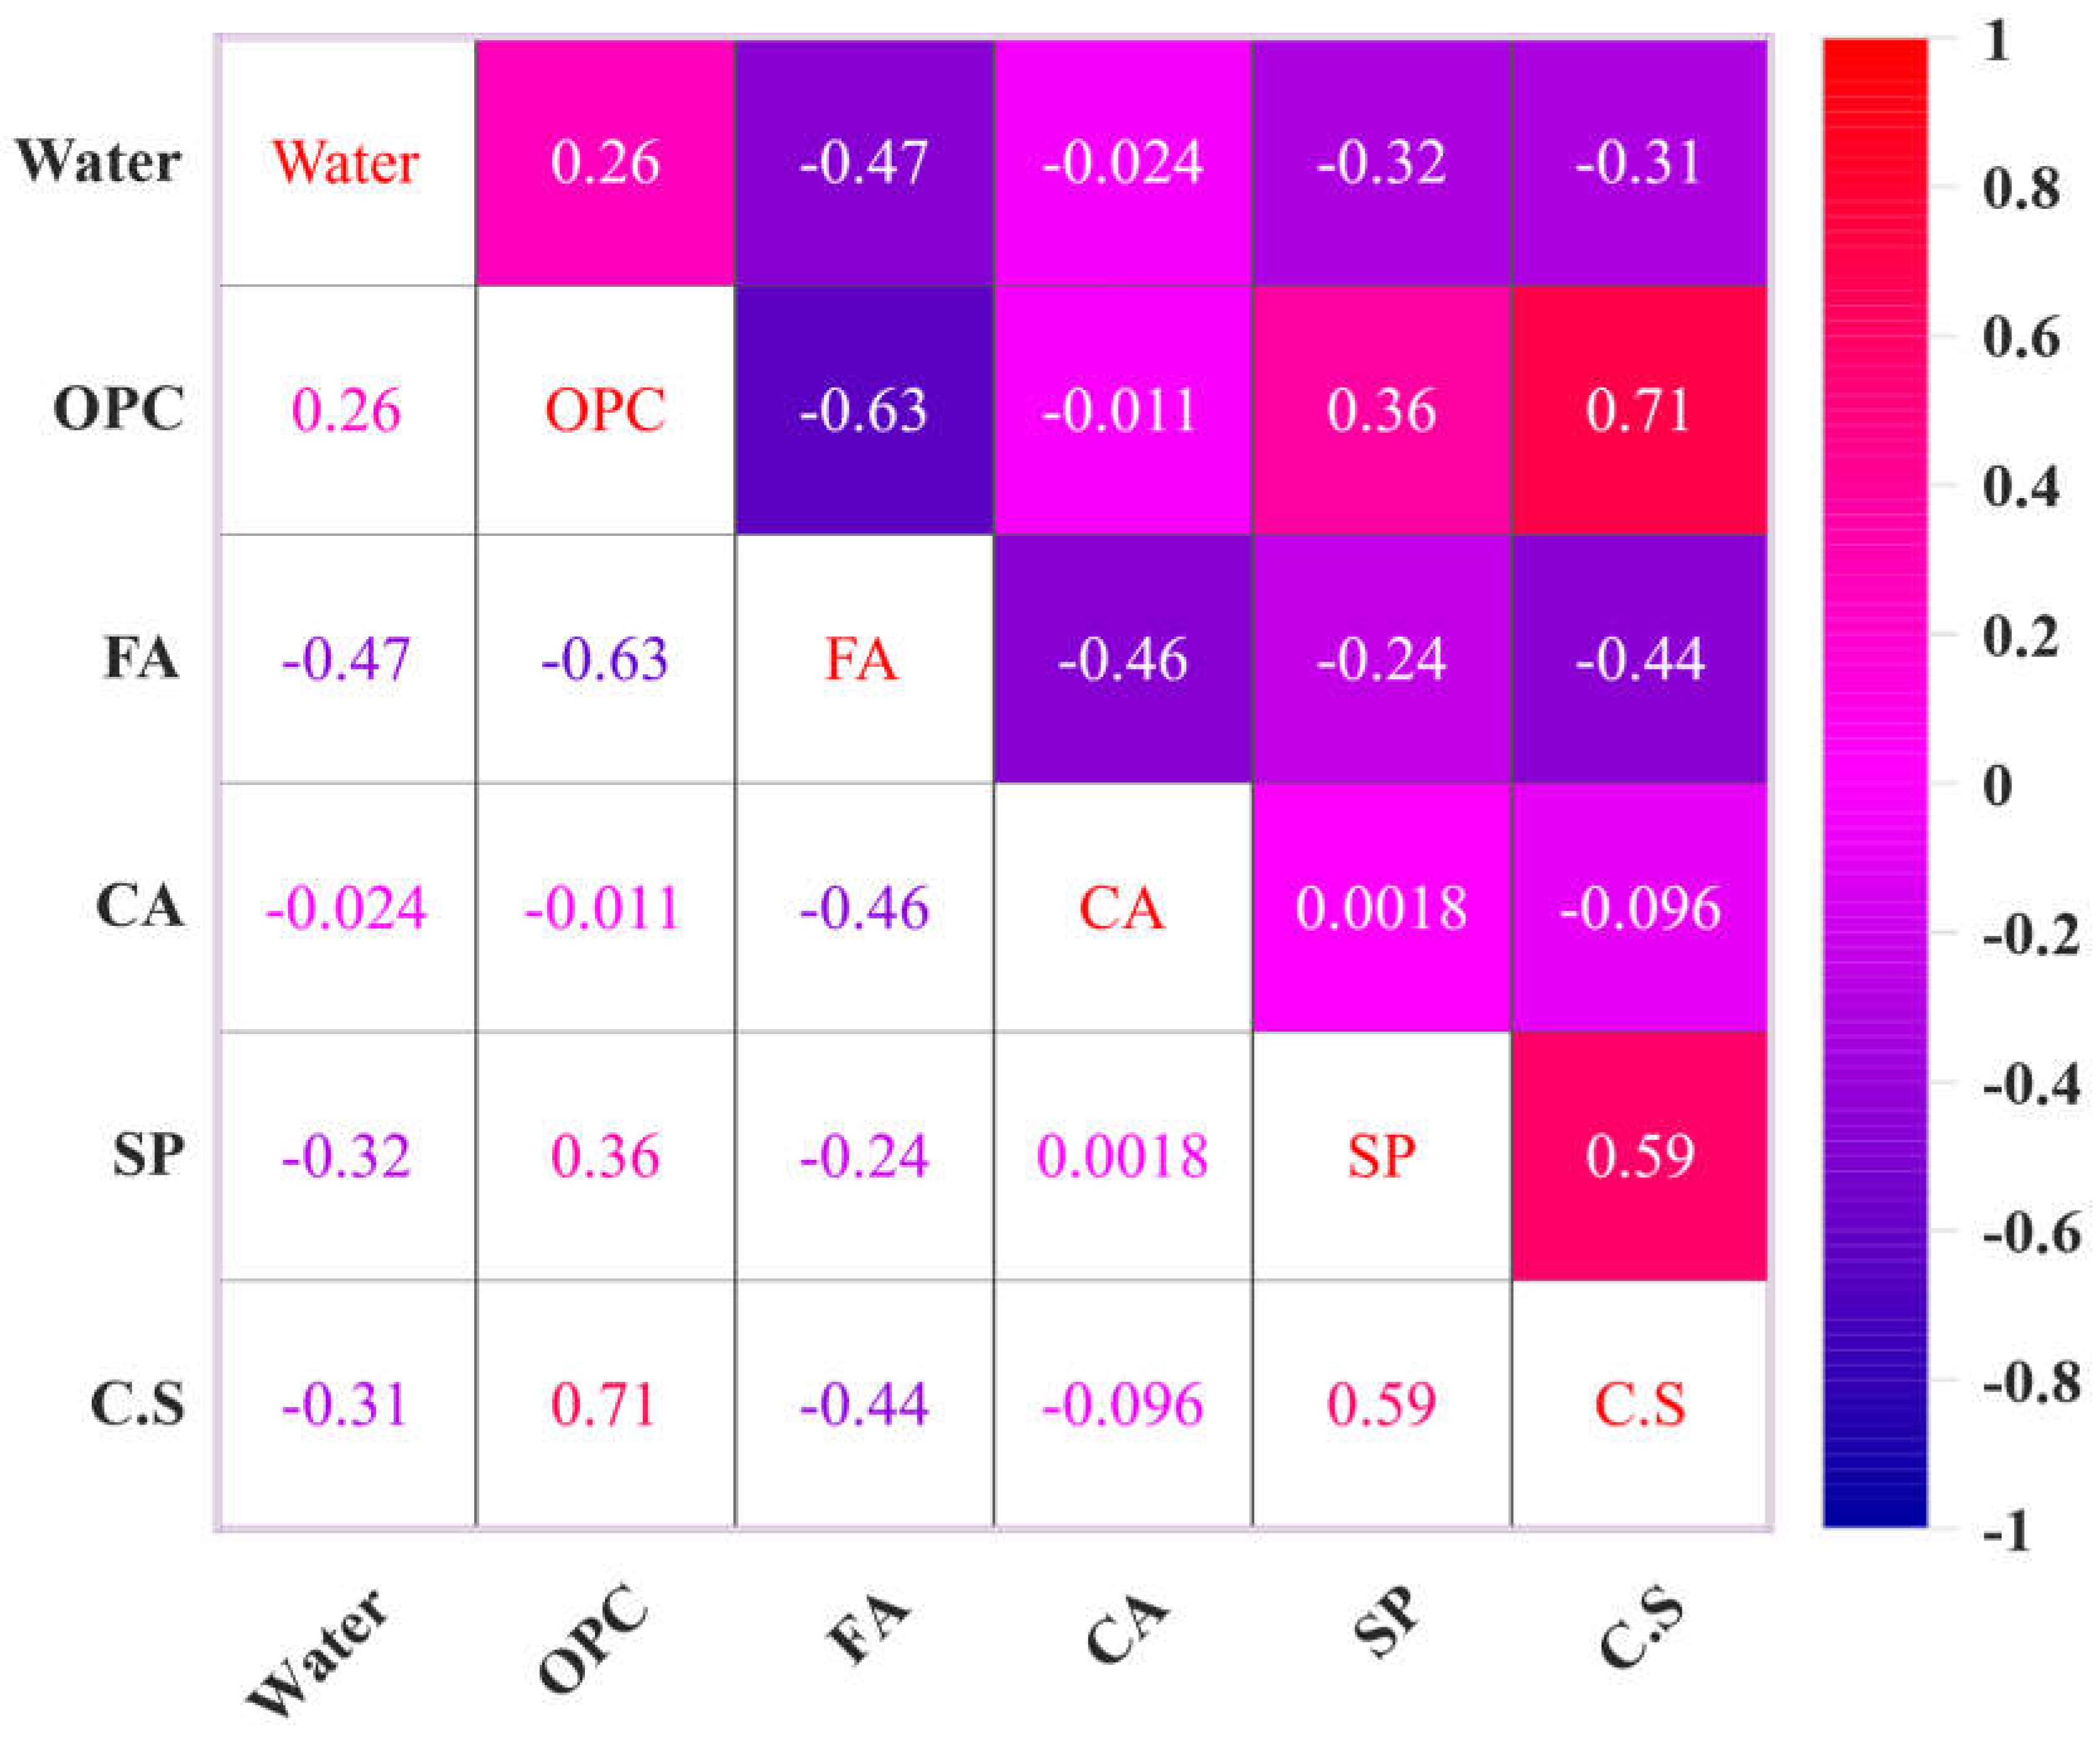
Dataset Sensitivity Analysis and Statistical Description
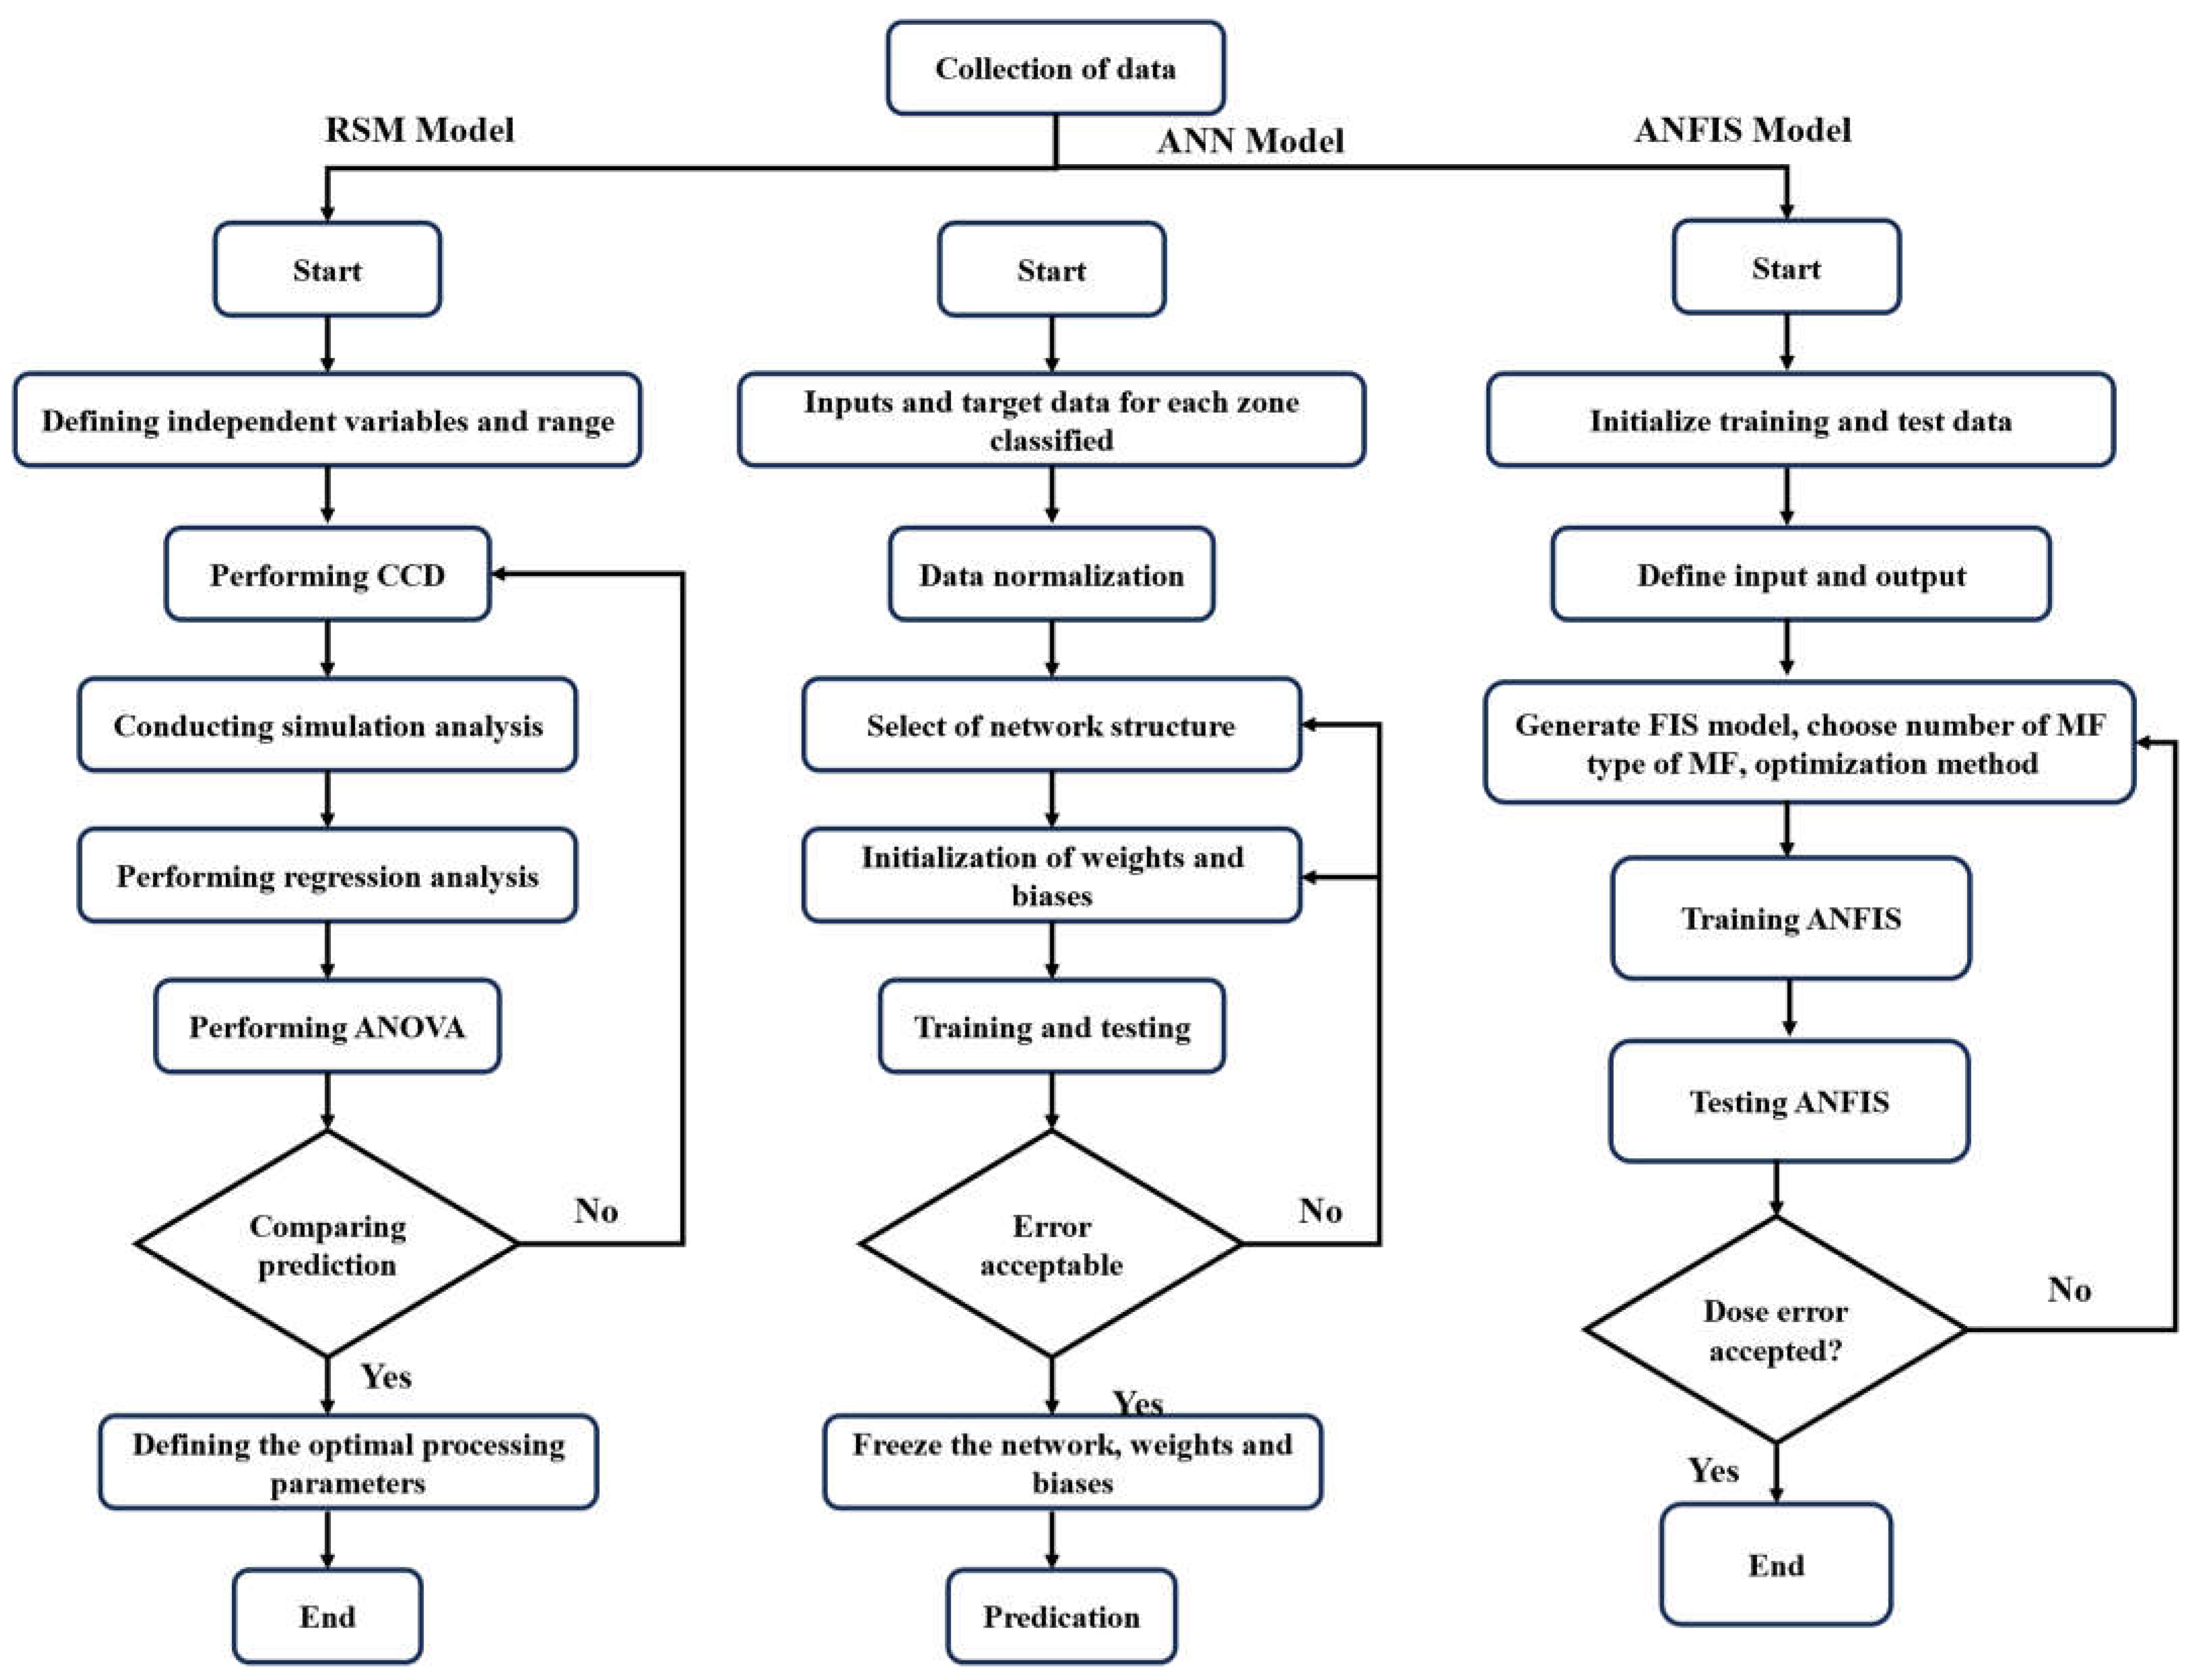
4. Methodology
4.1. Details of Response Surface Methodology (RSM)
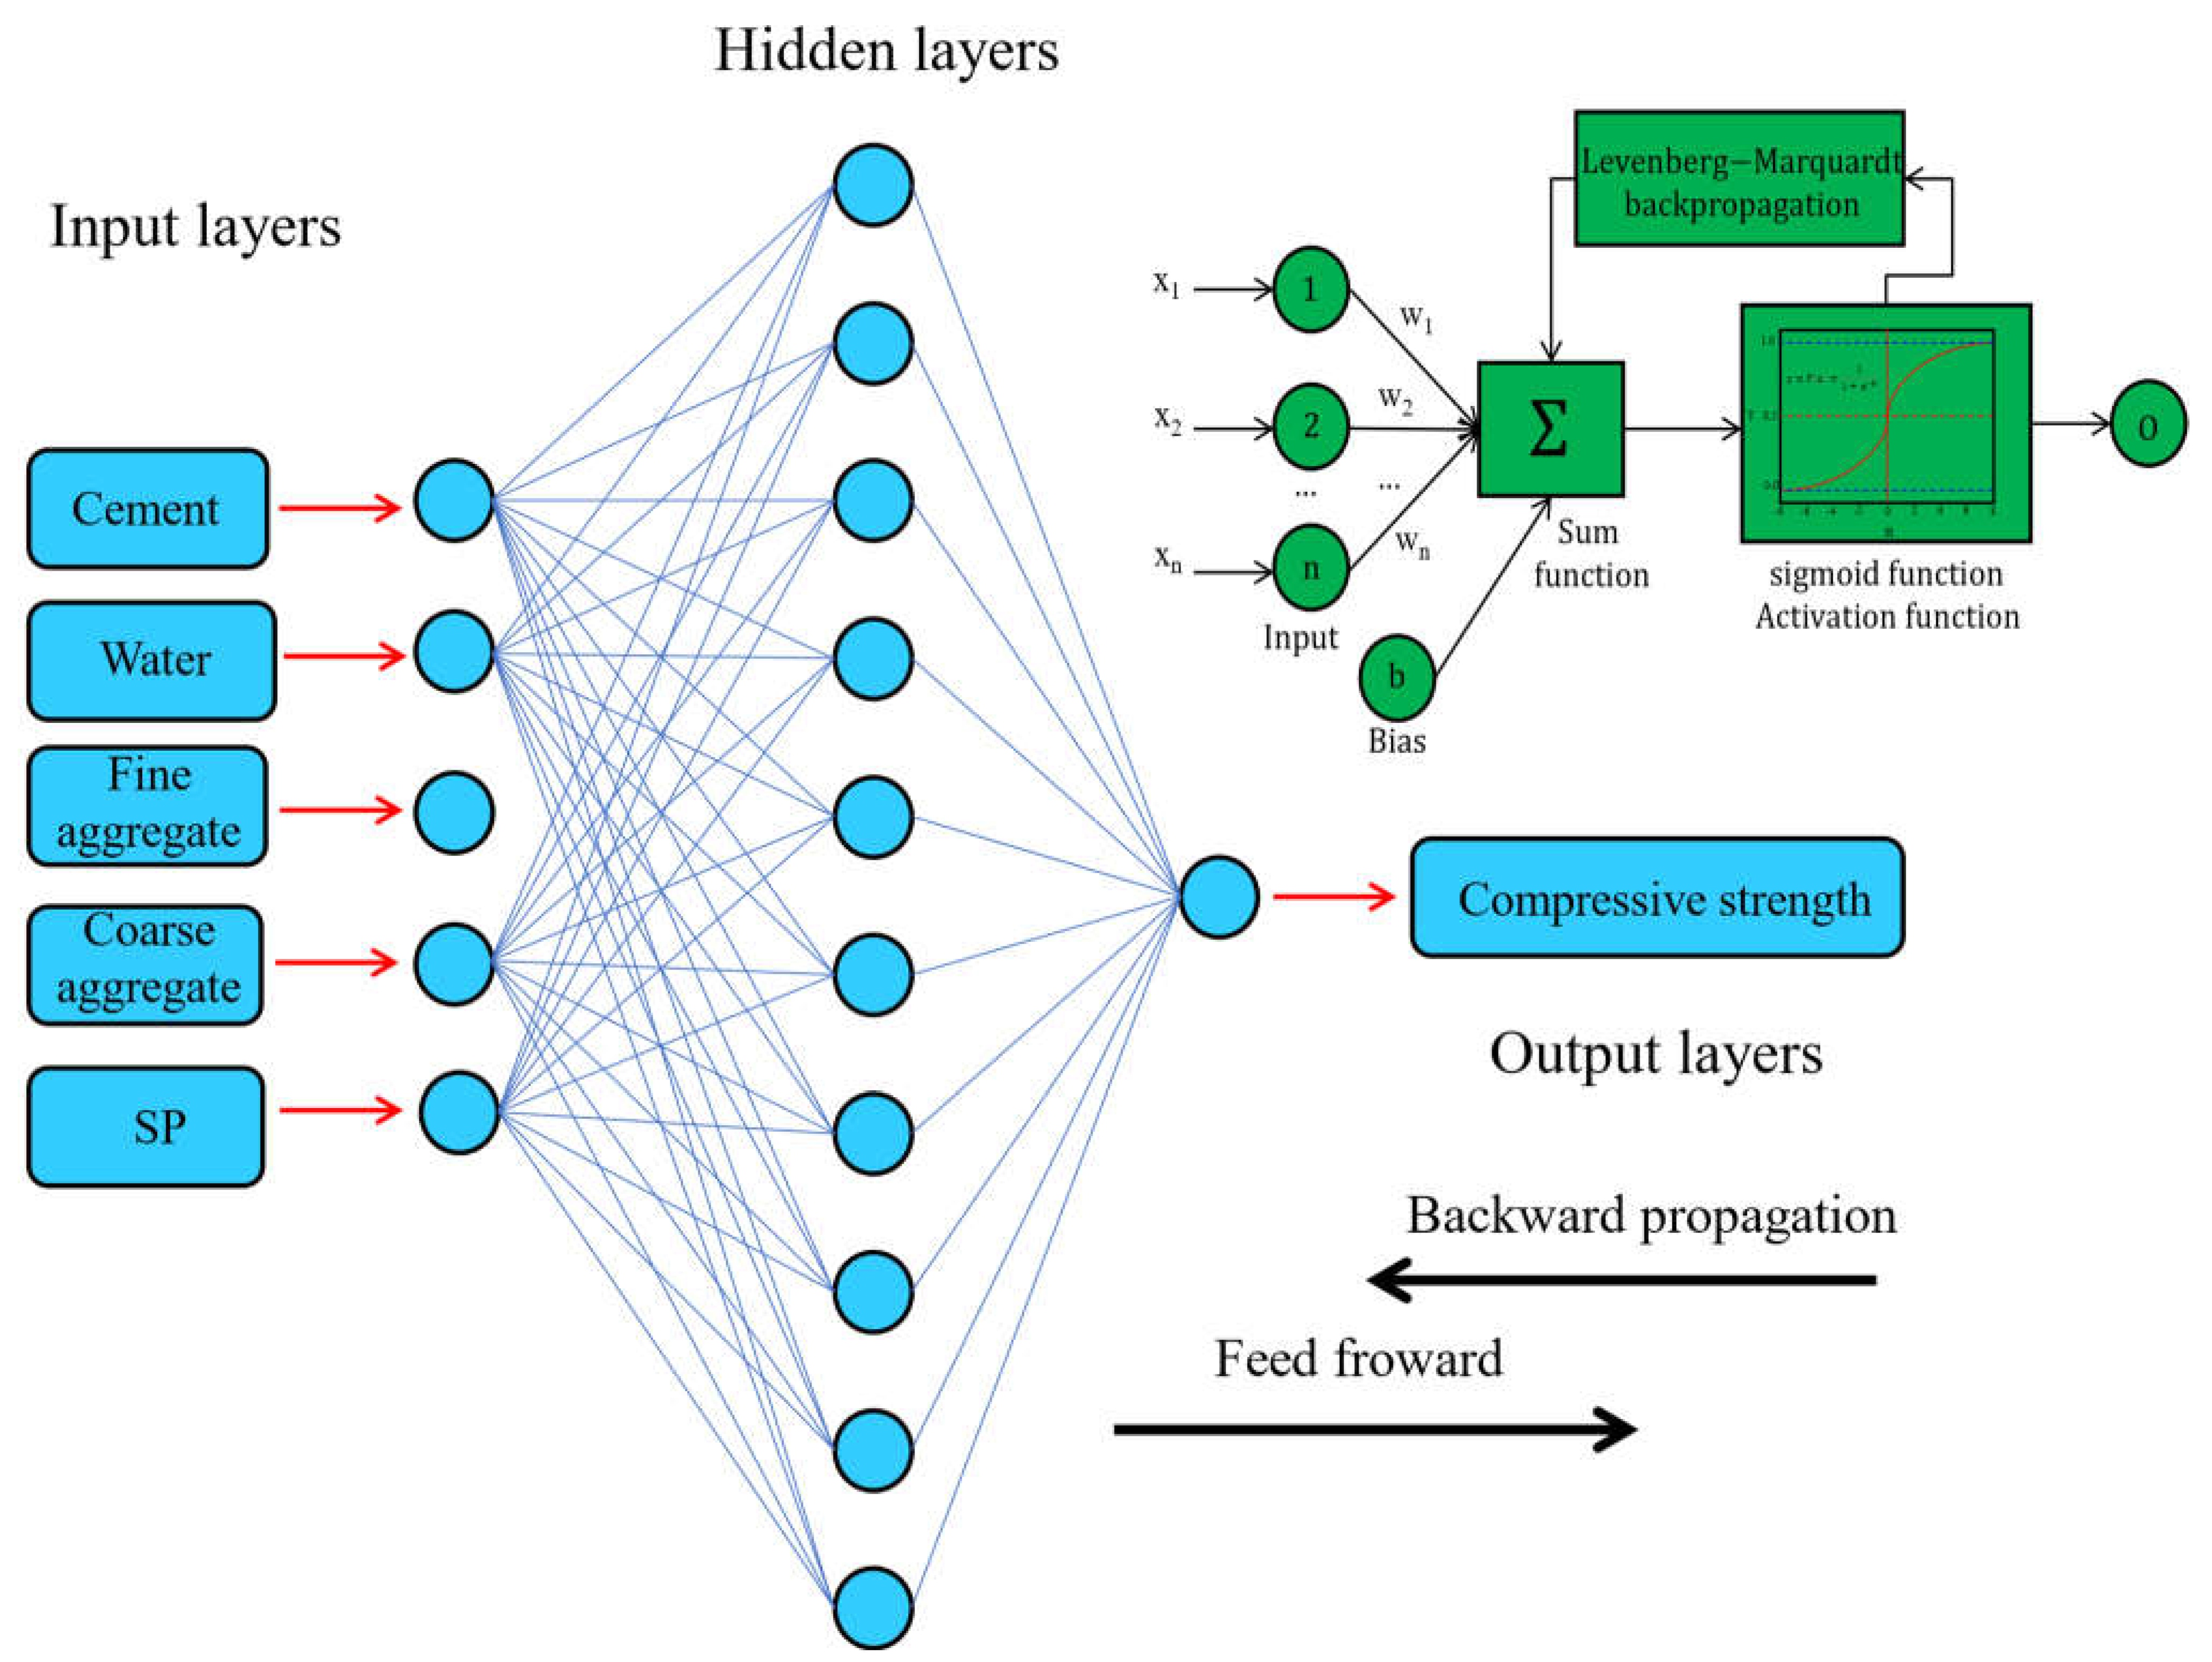
4.2. Details of Artificial Neural Network (ANN)
4.3. Details of Neuro-Fuzzy Inference System (ANFIS)
5. Results and Discussion
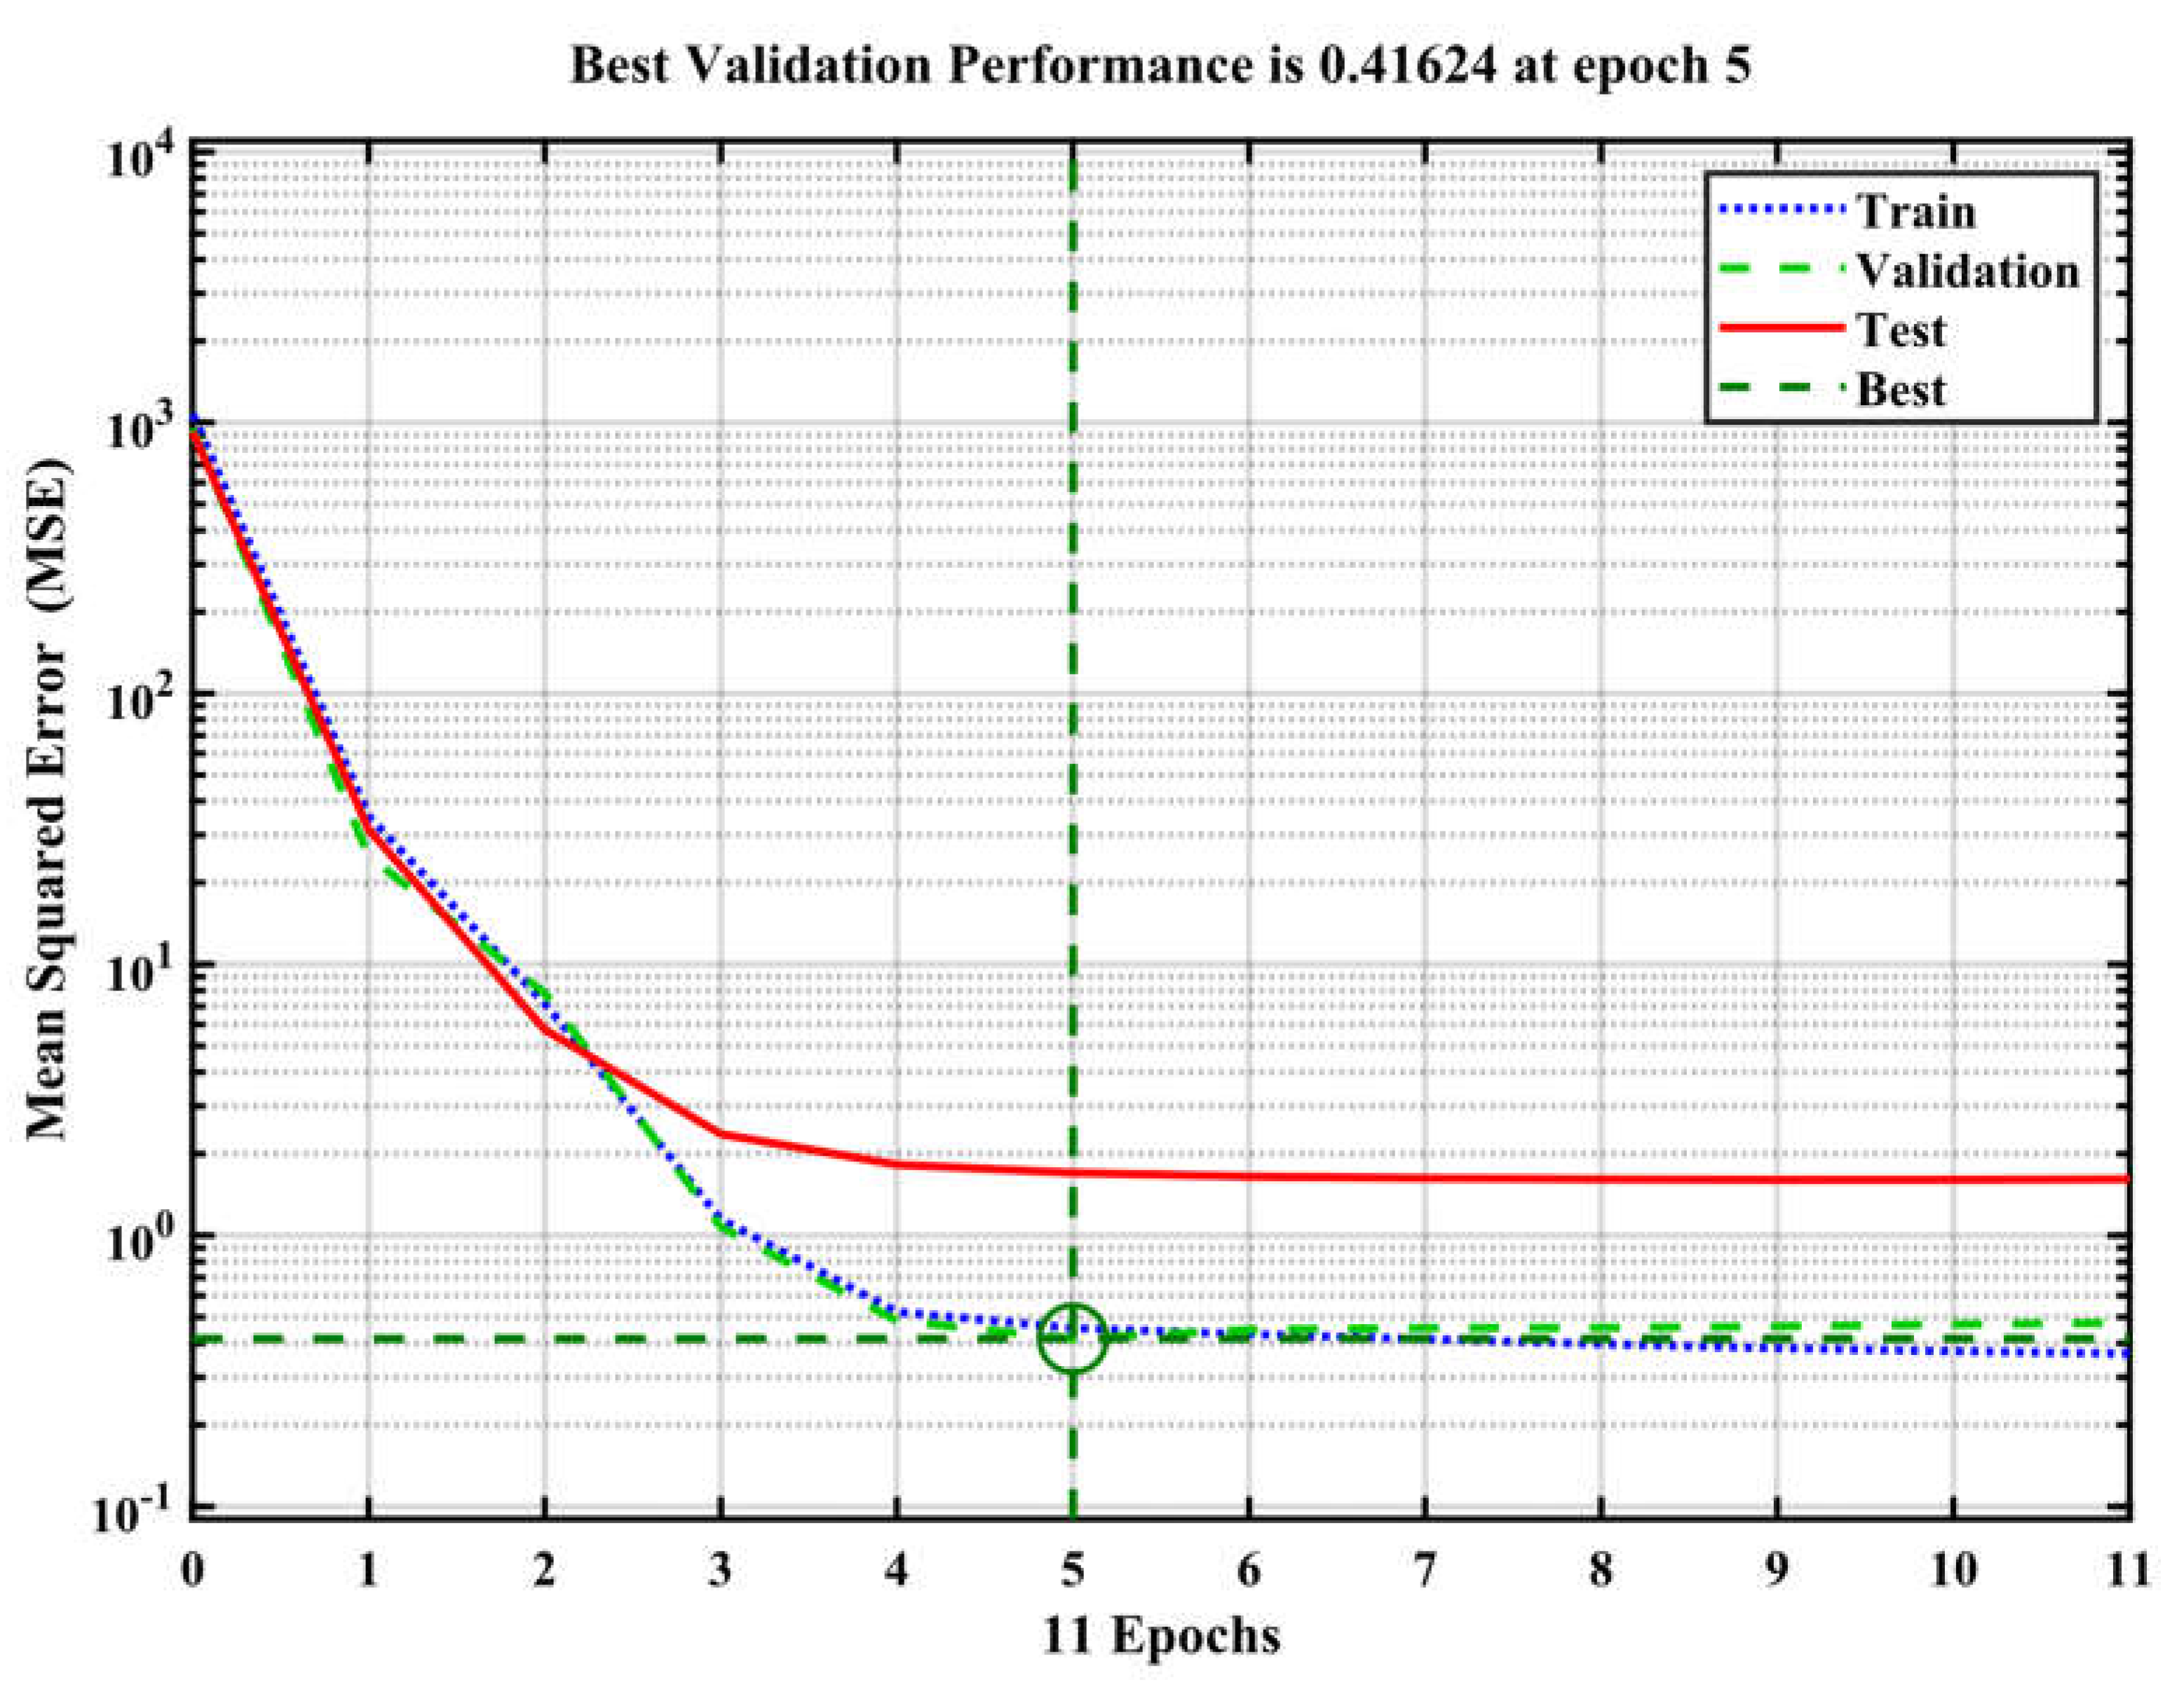
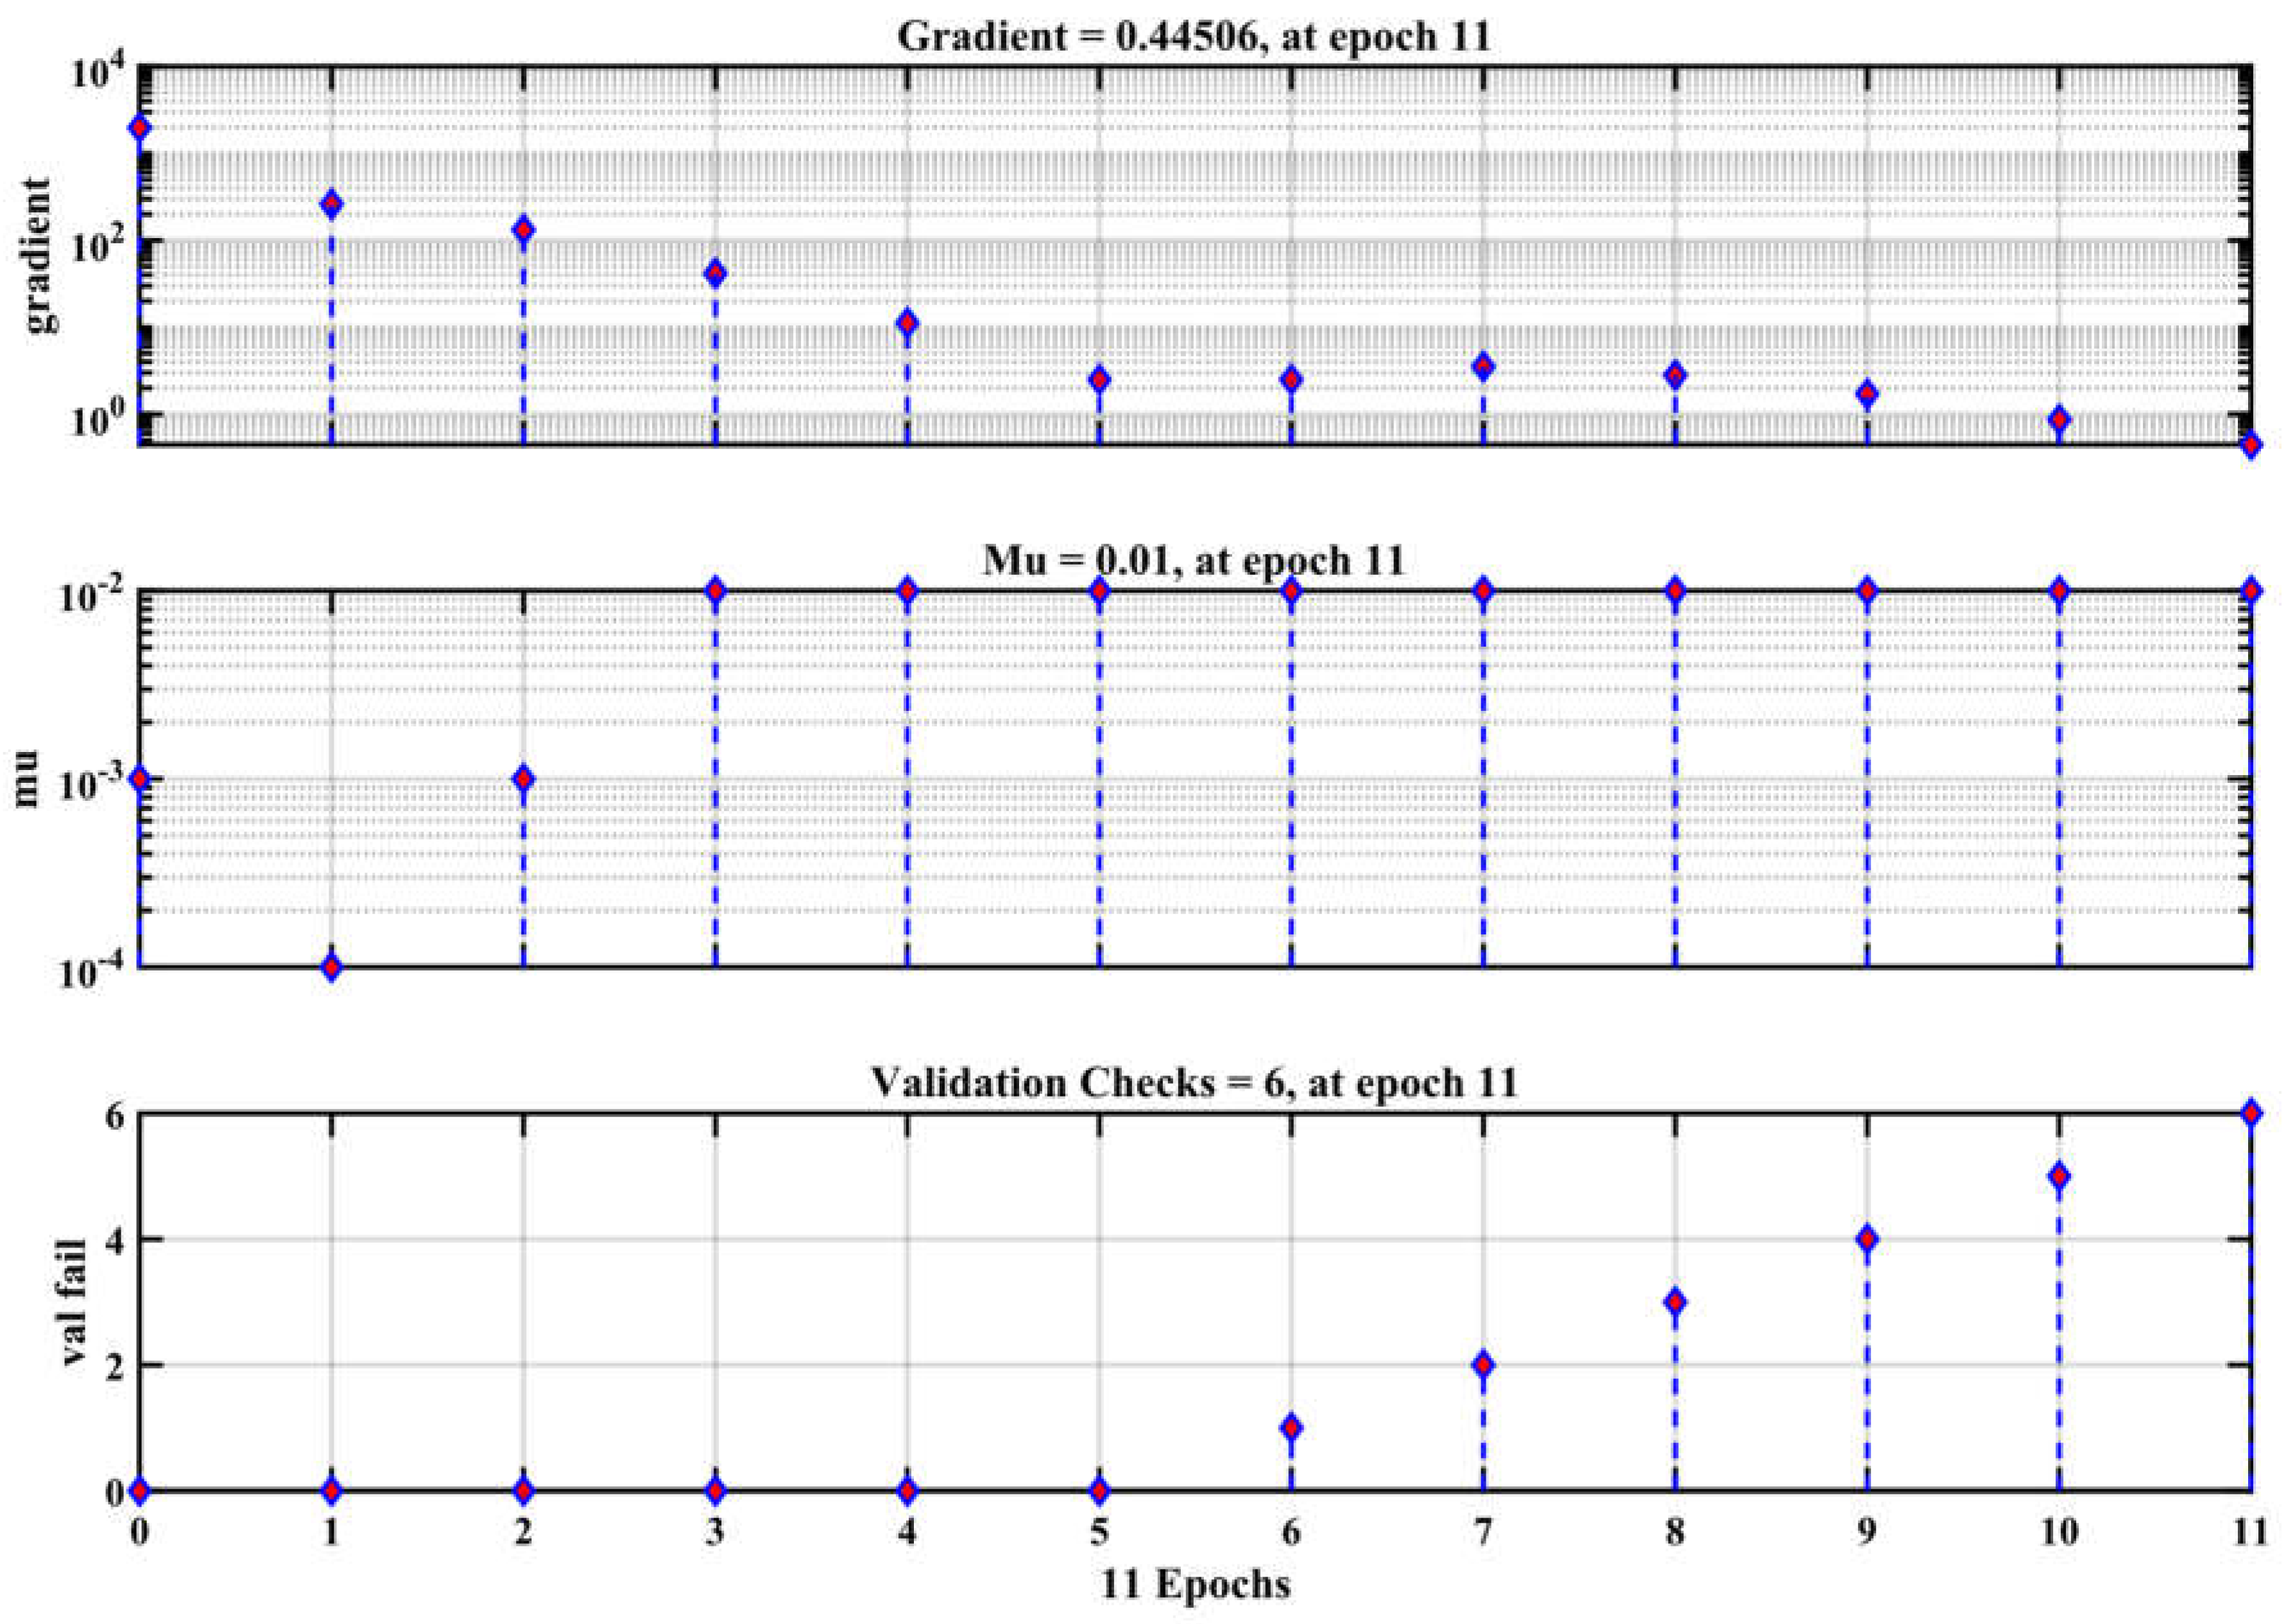
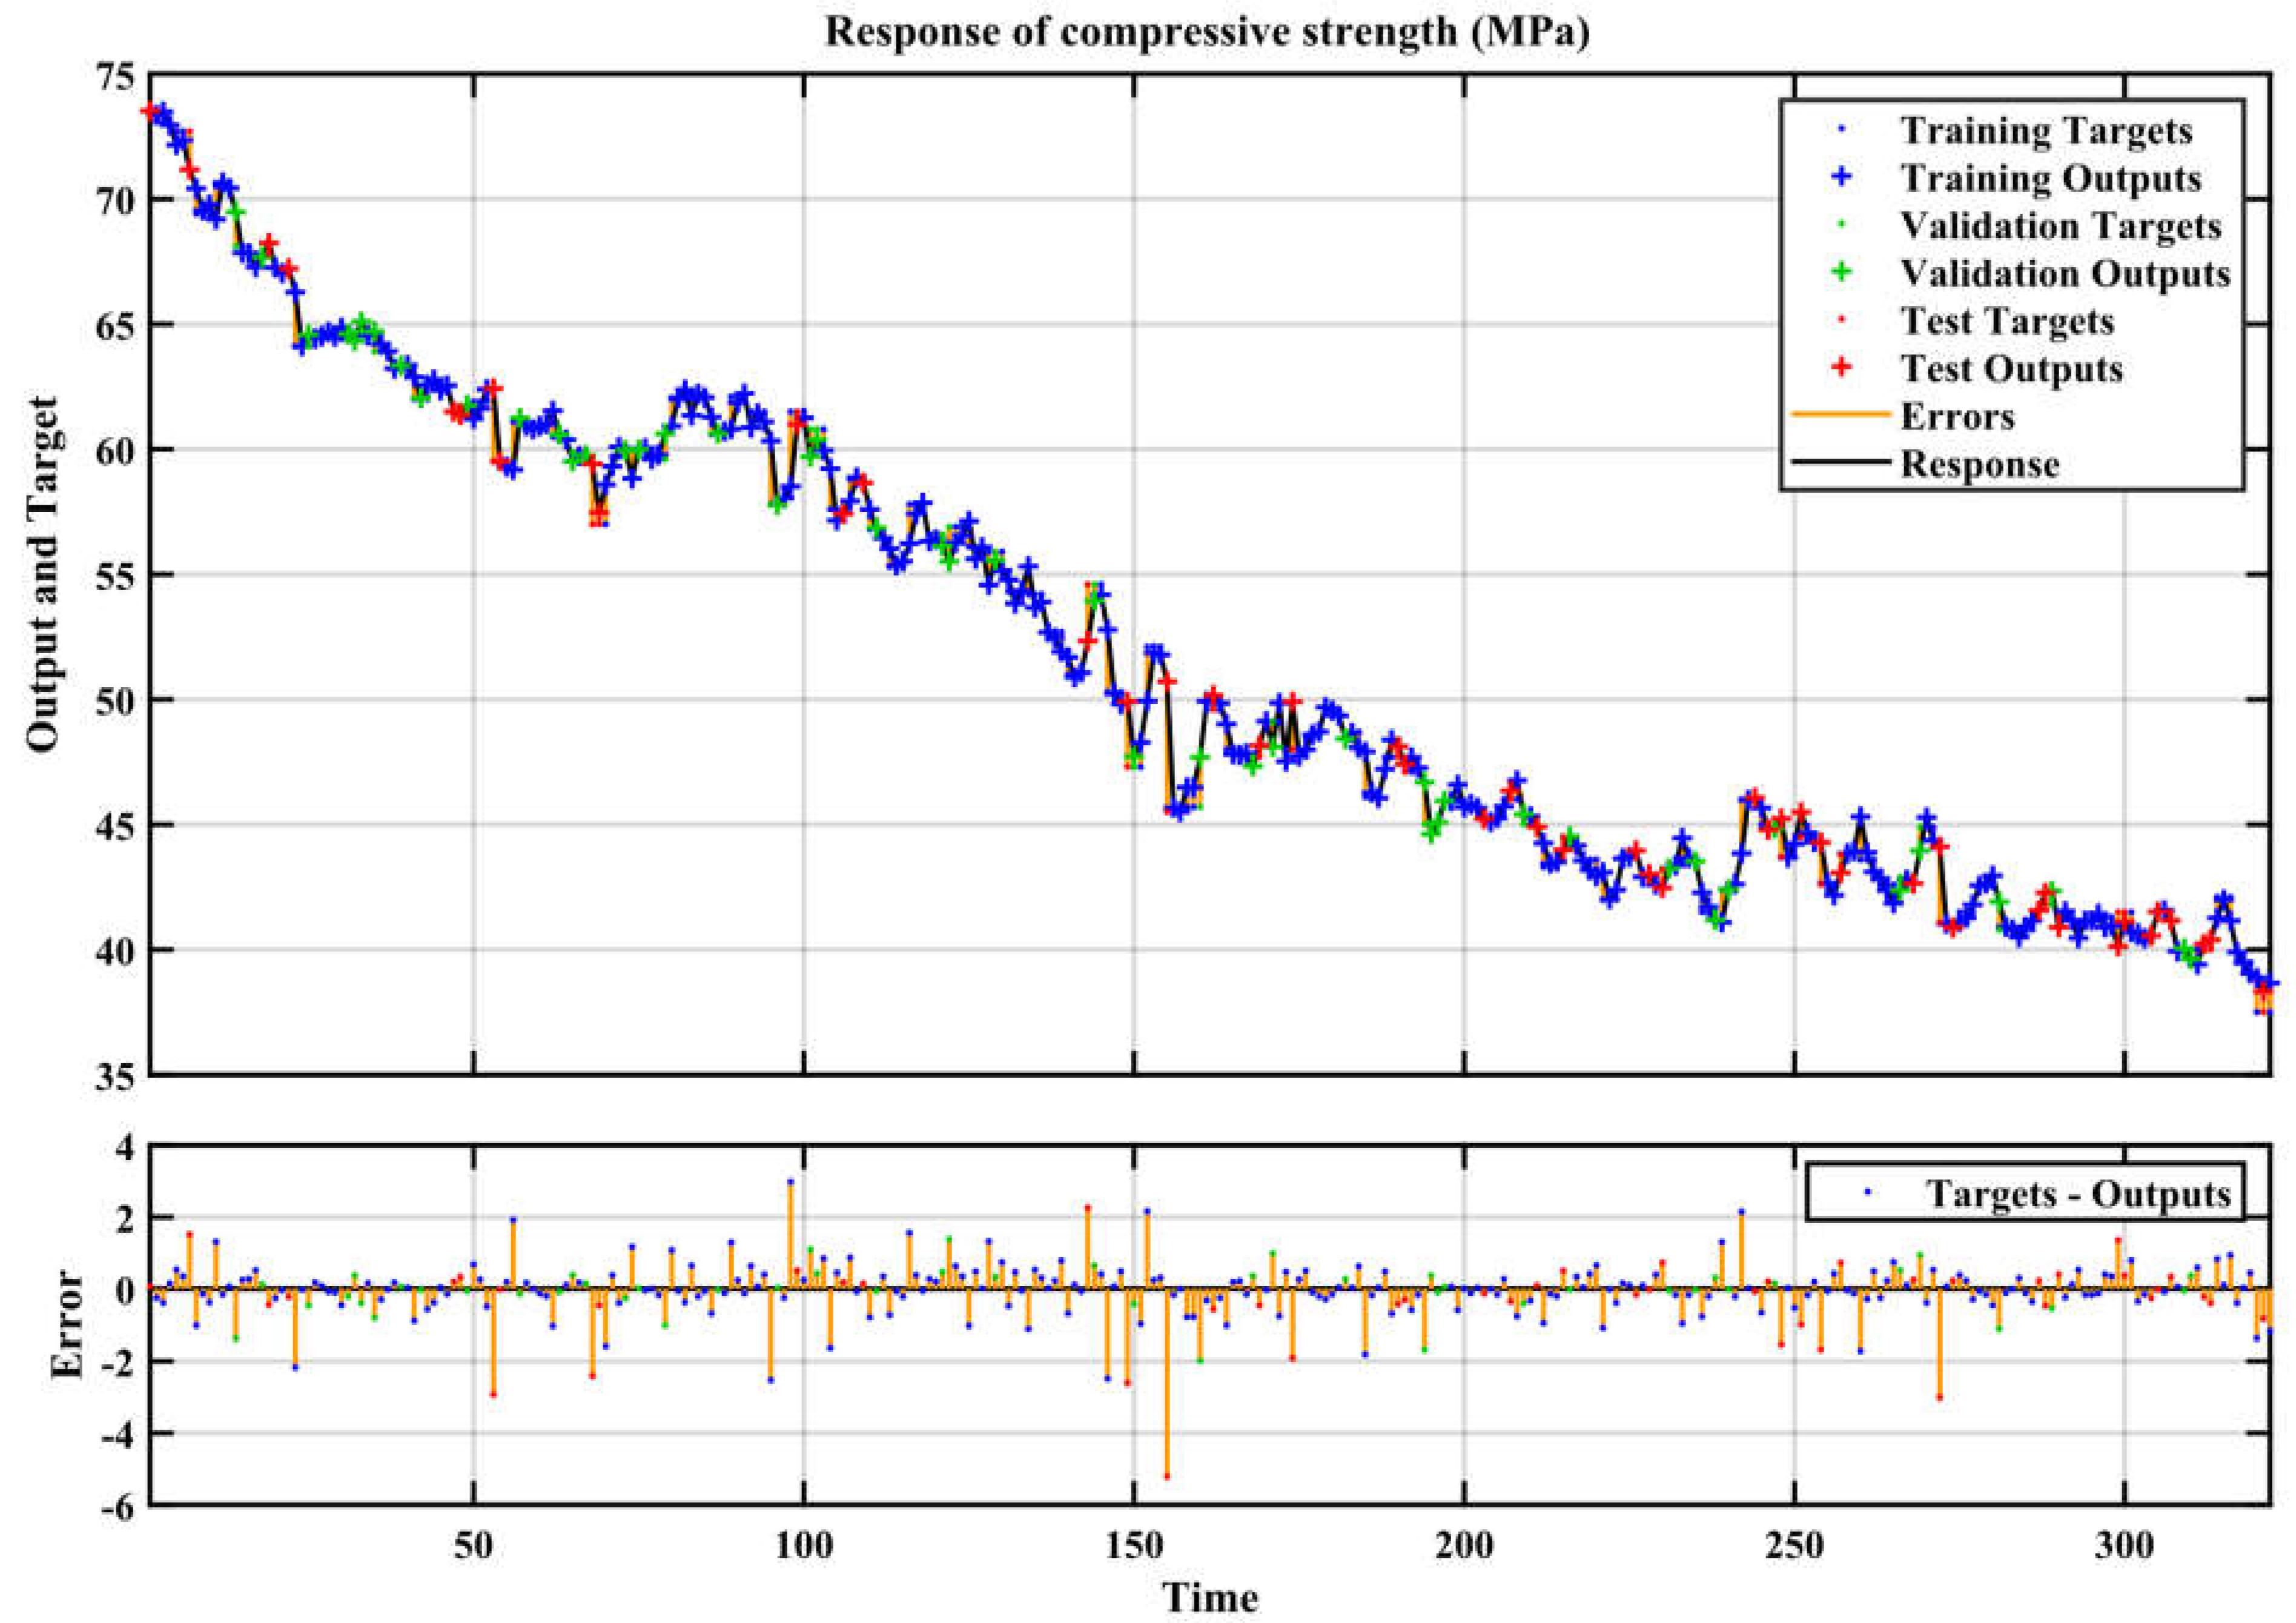
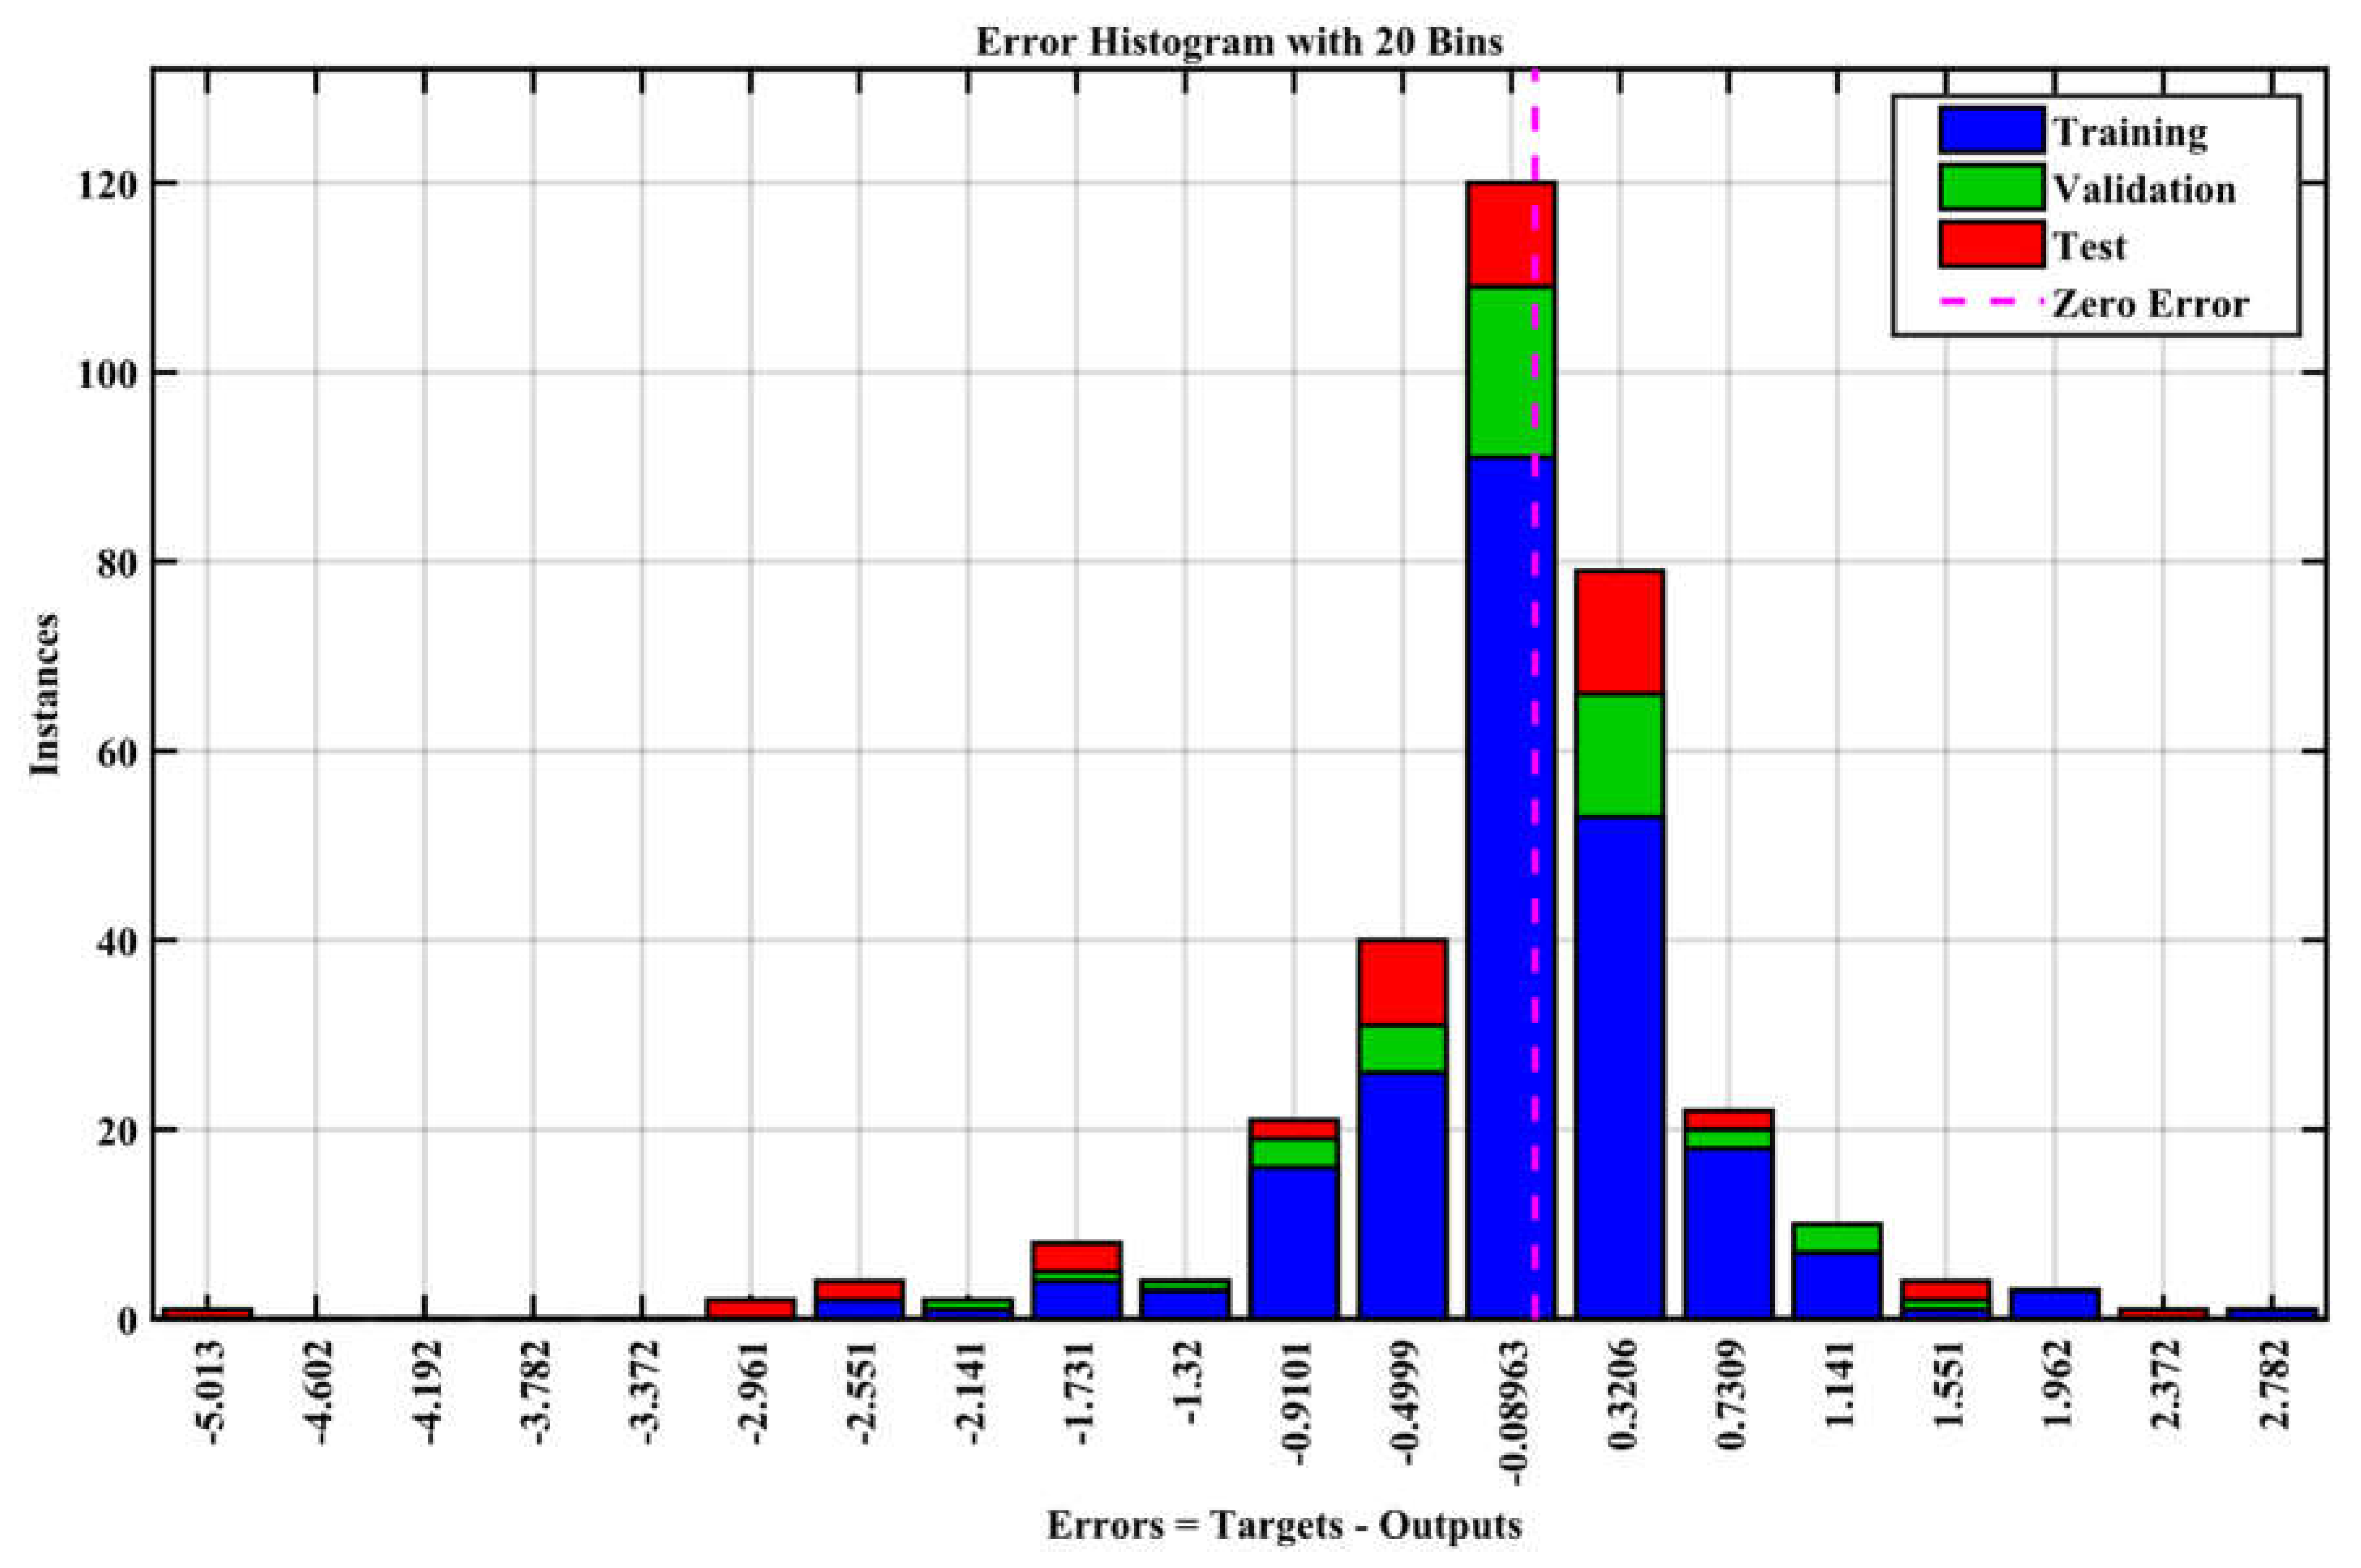
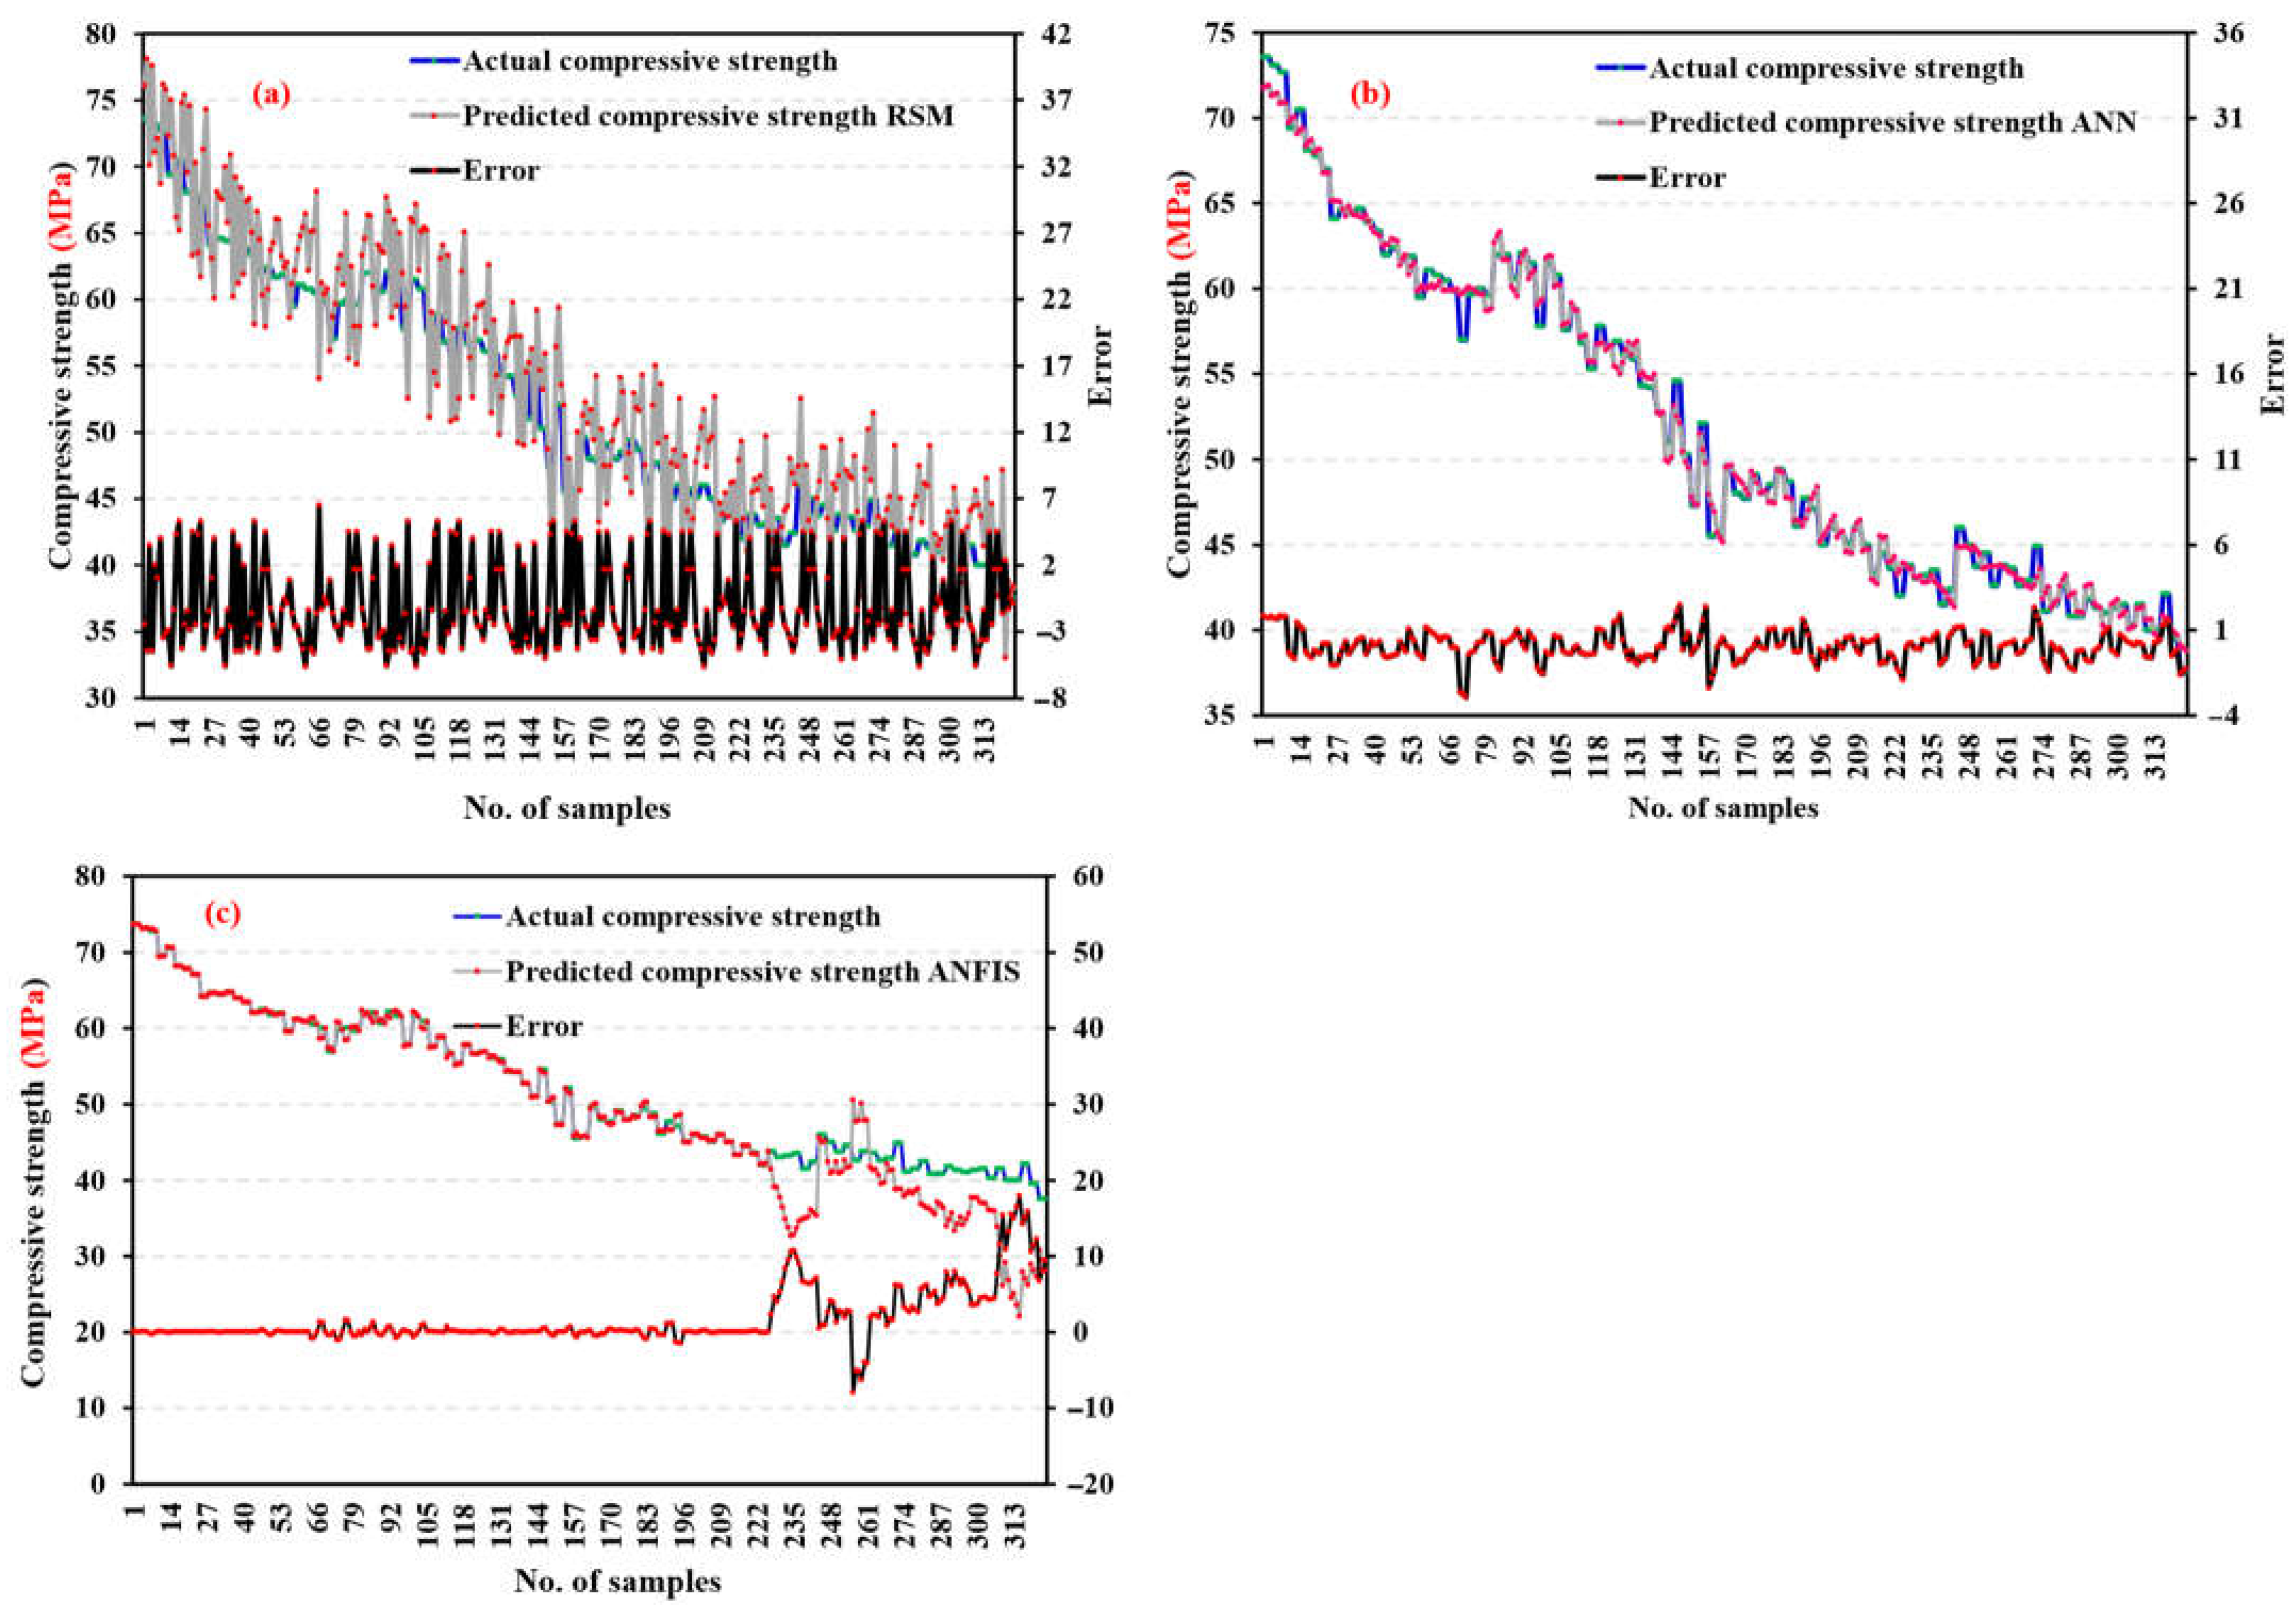
5.1. Artificial Neural Network (ANN)
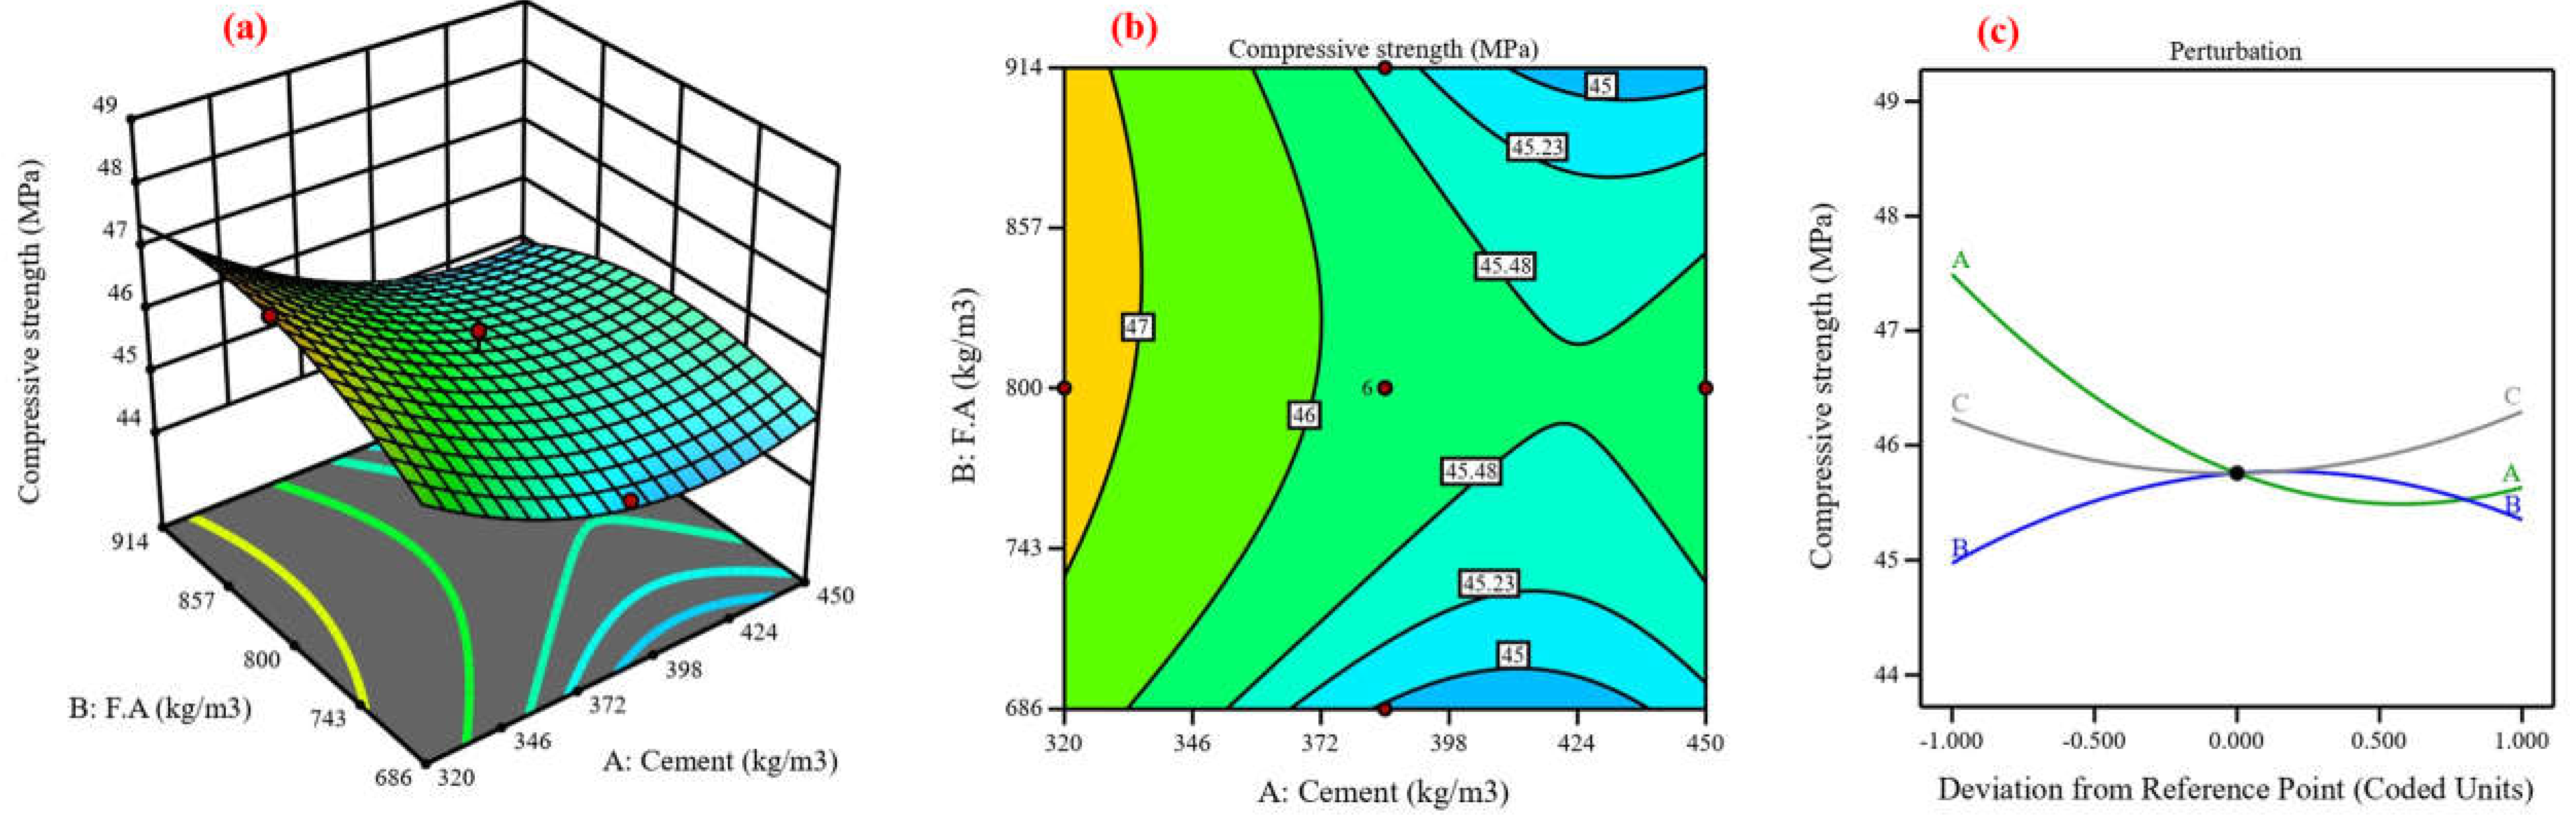
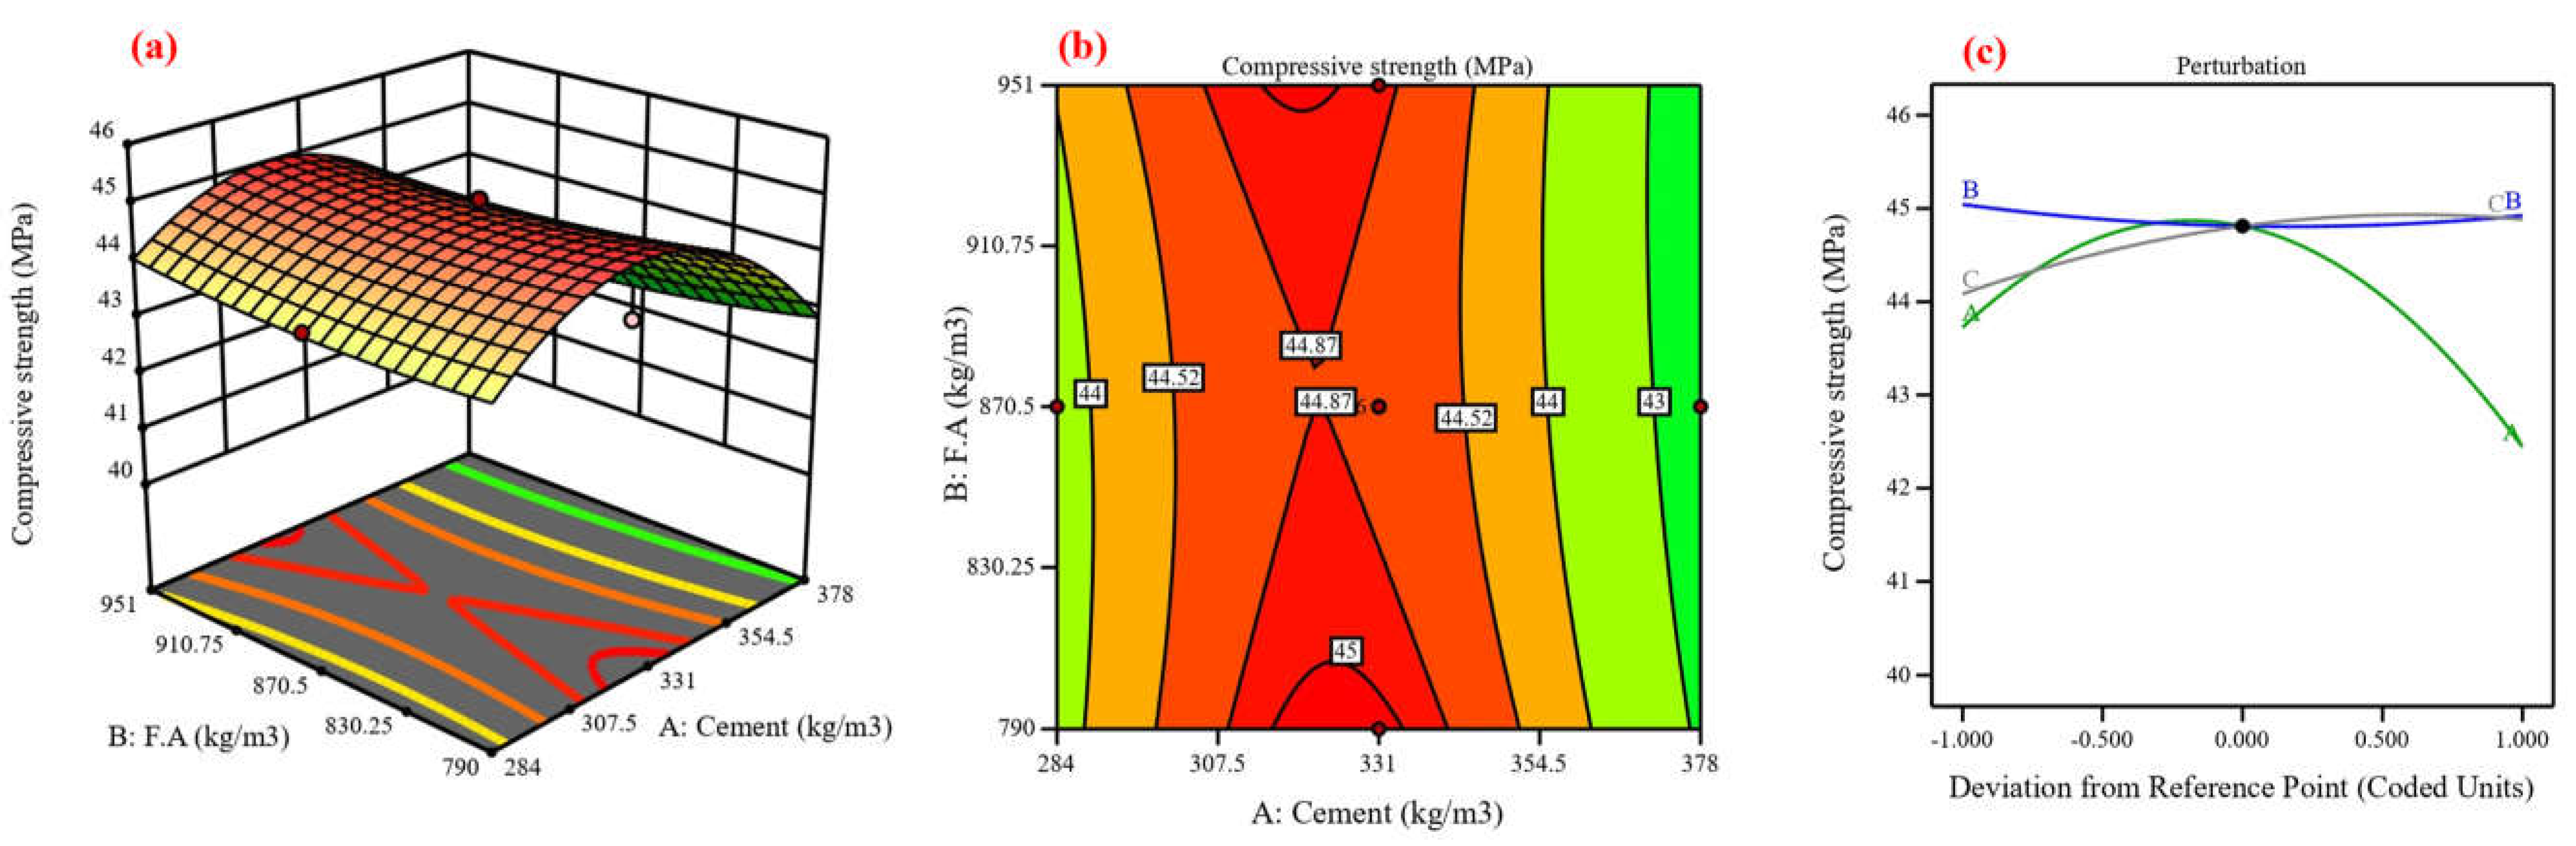
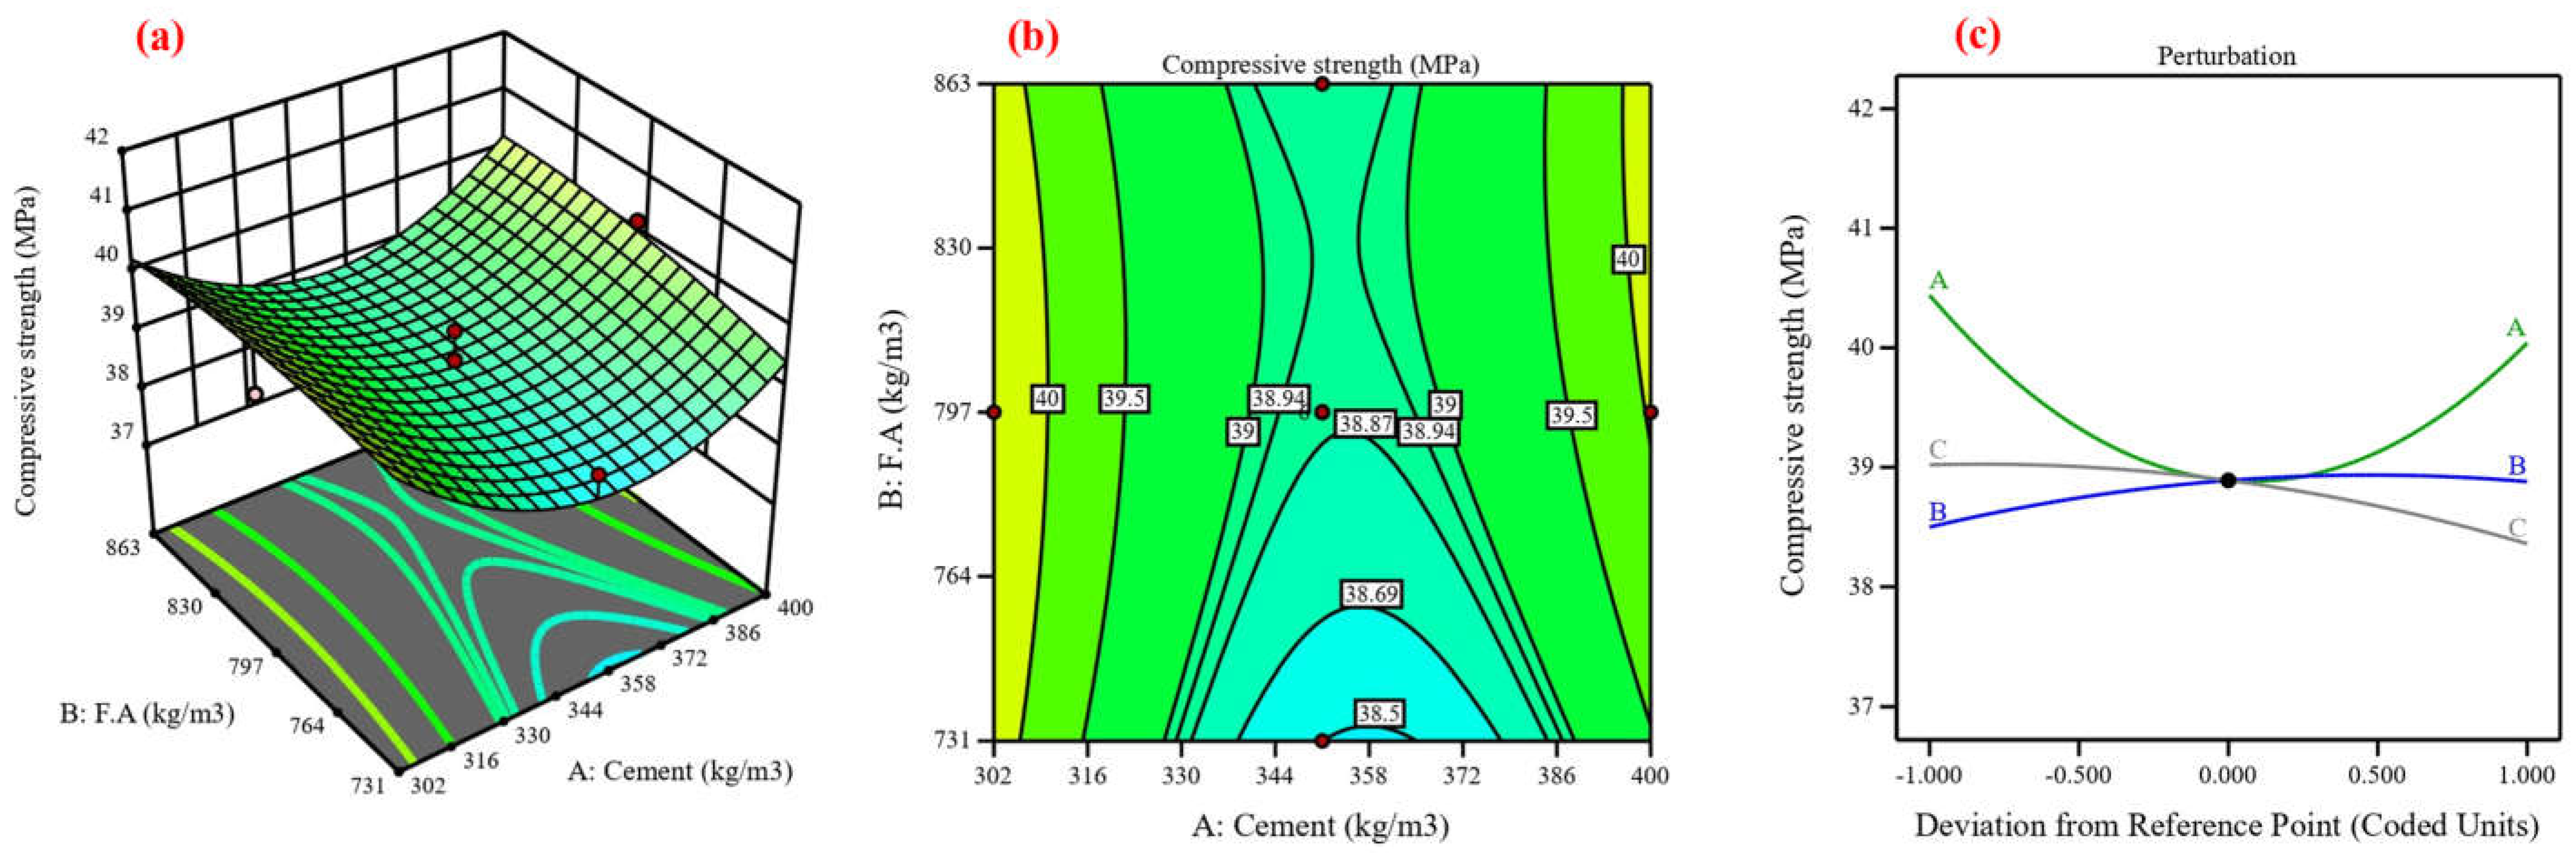
5.2. Response Surface Methodology (RSM)
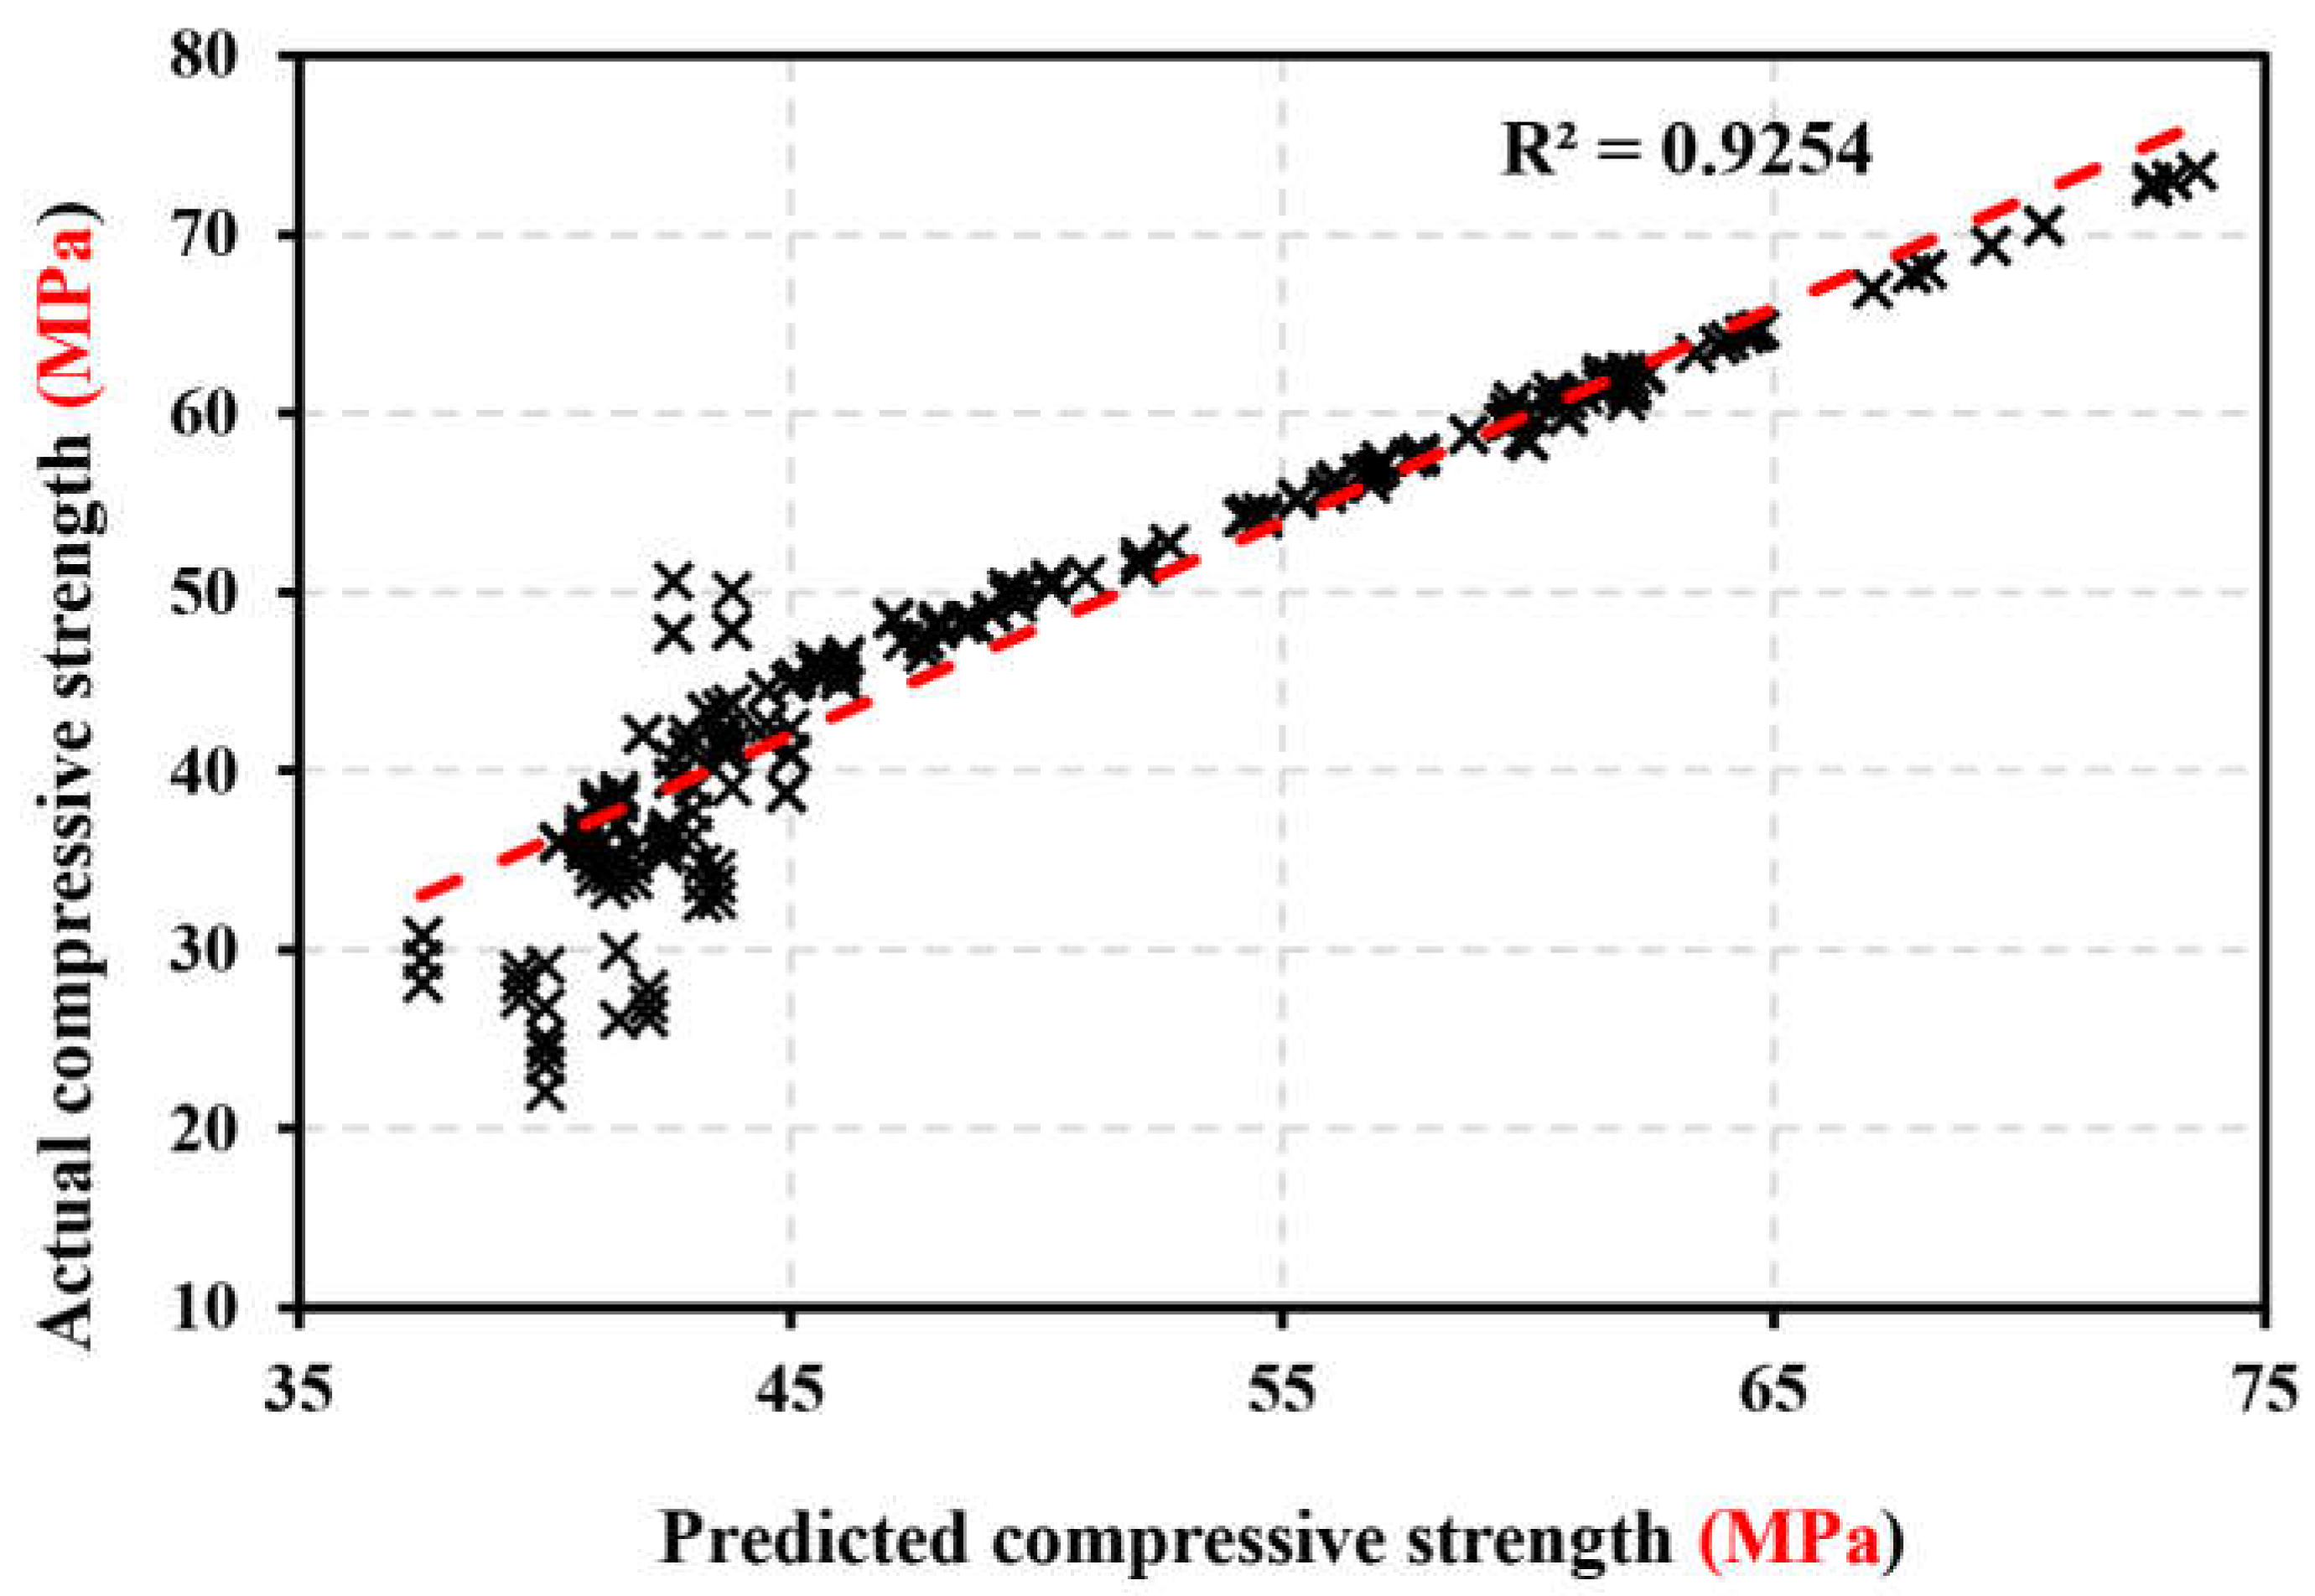
5.3. Neuro-Fuzzy Inference System (ANFIS)
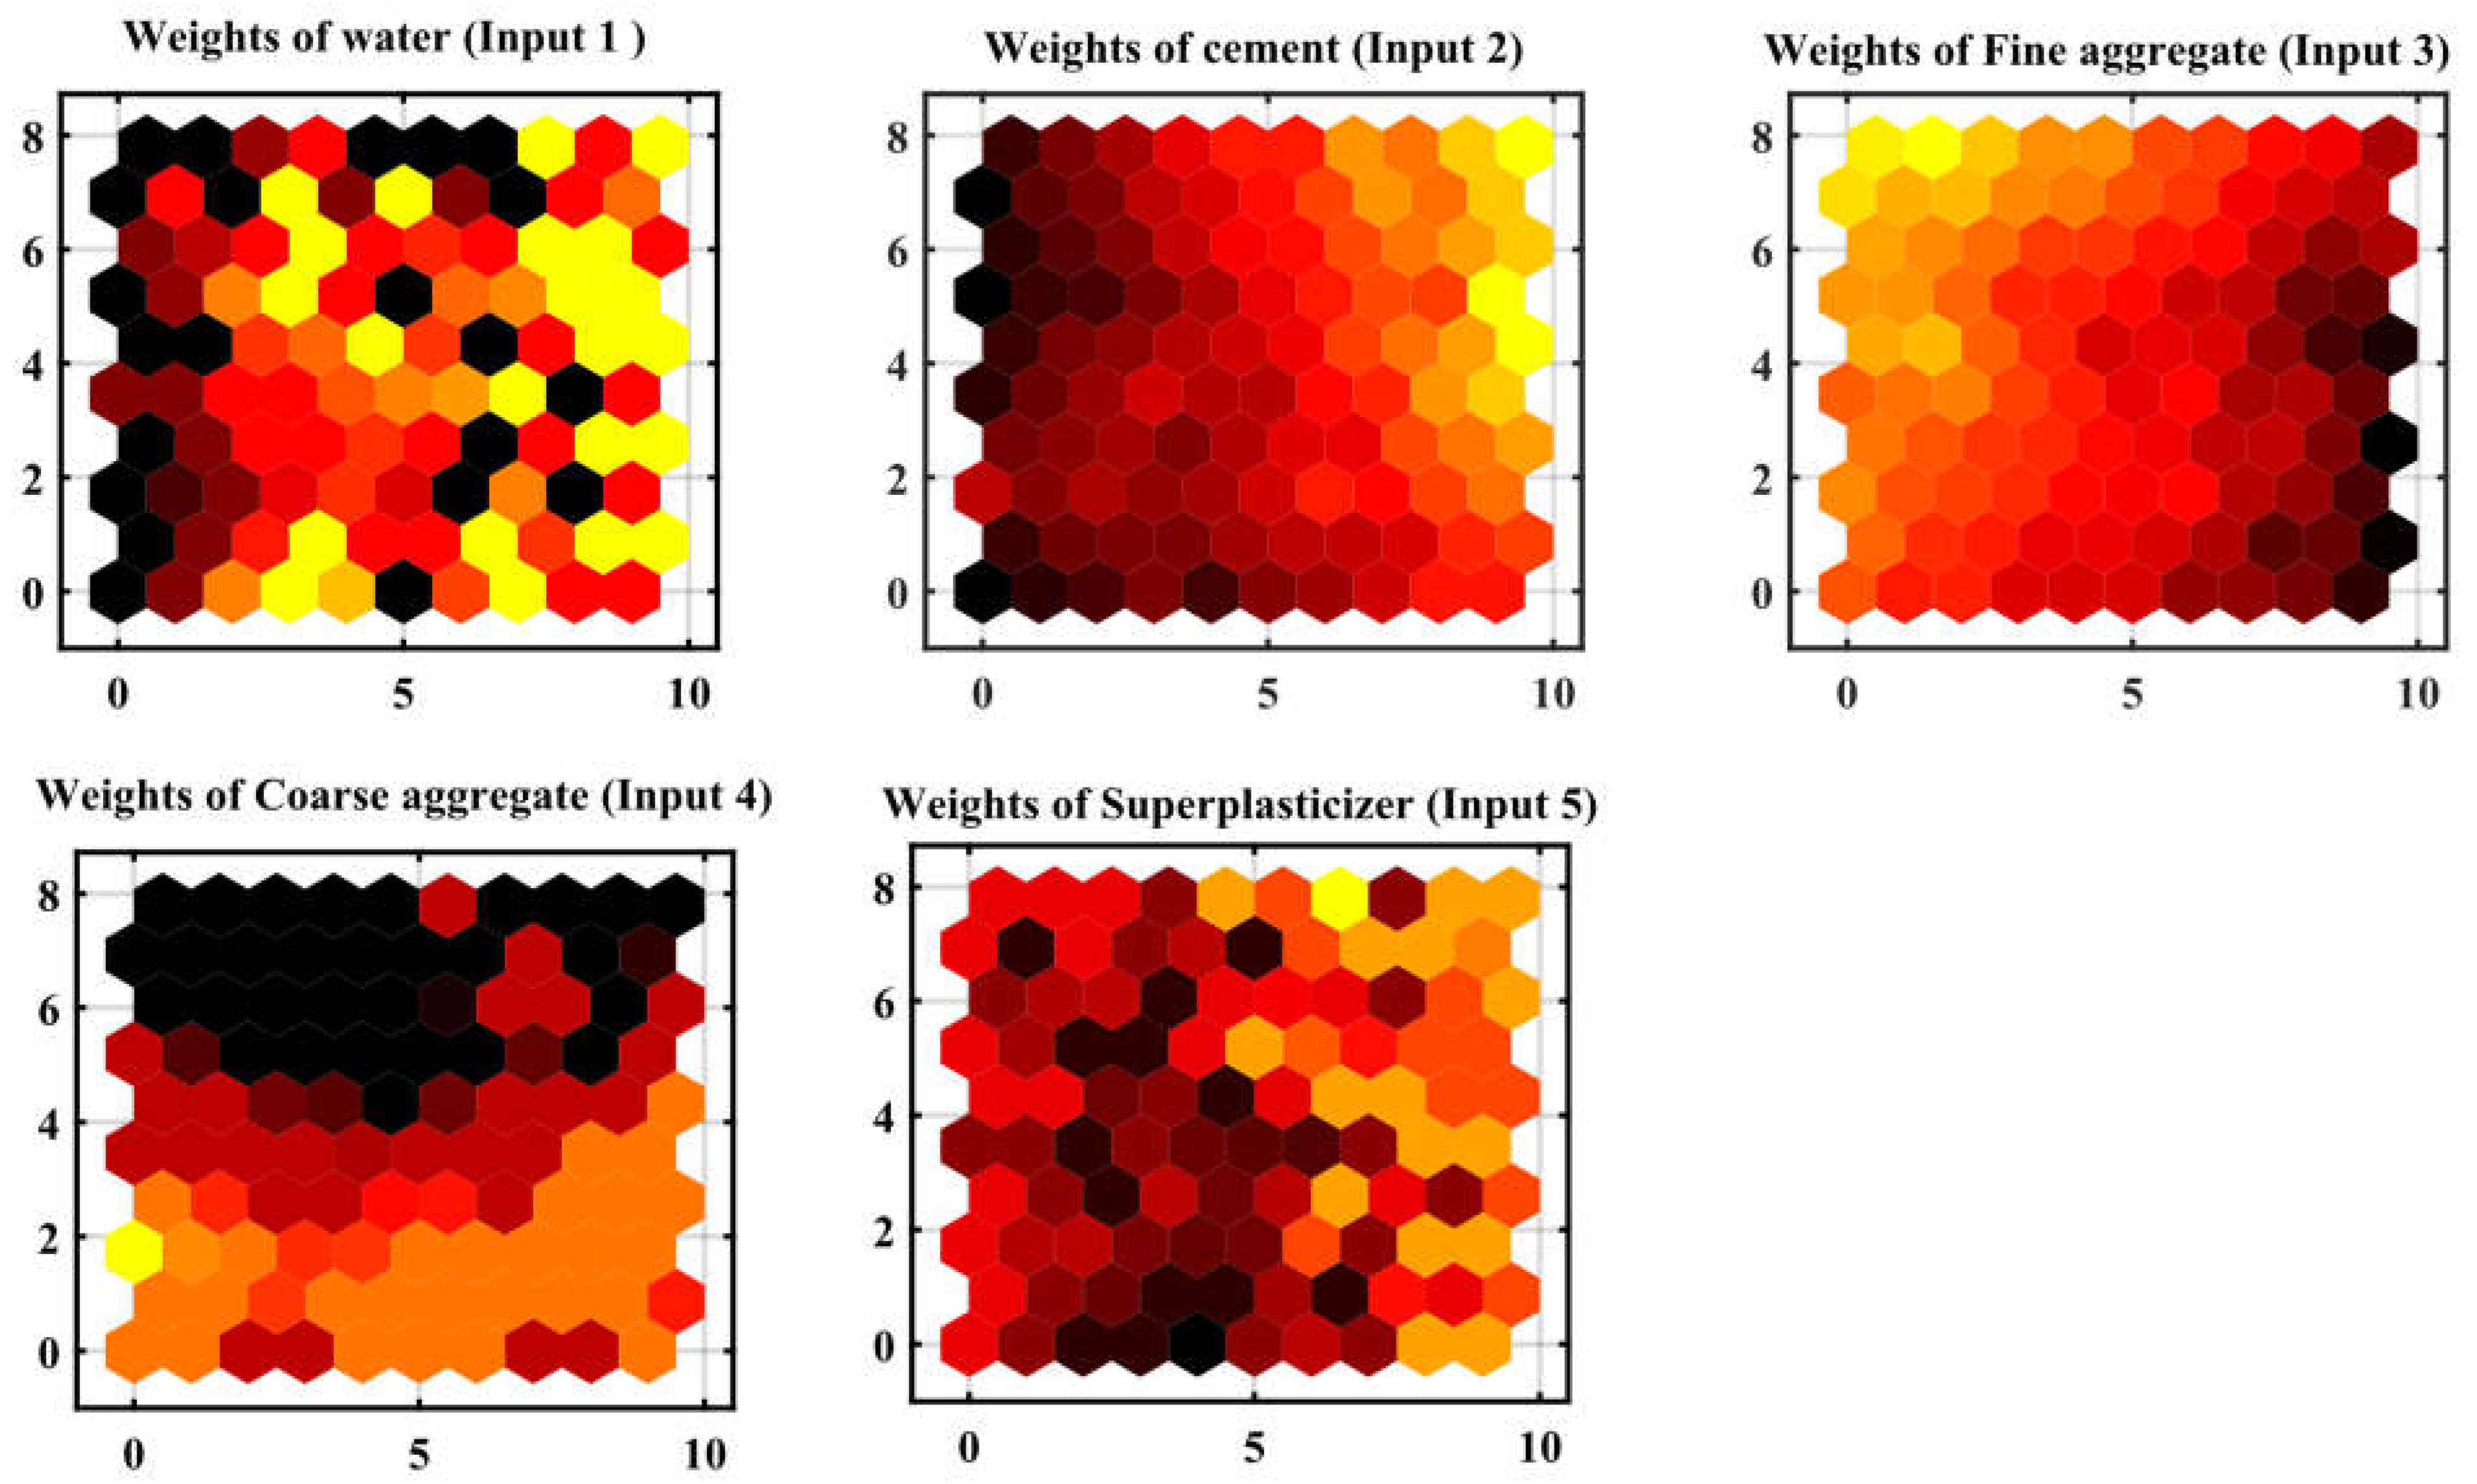
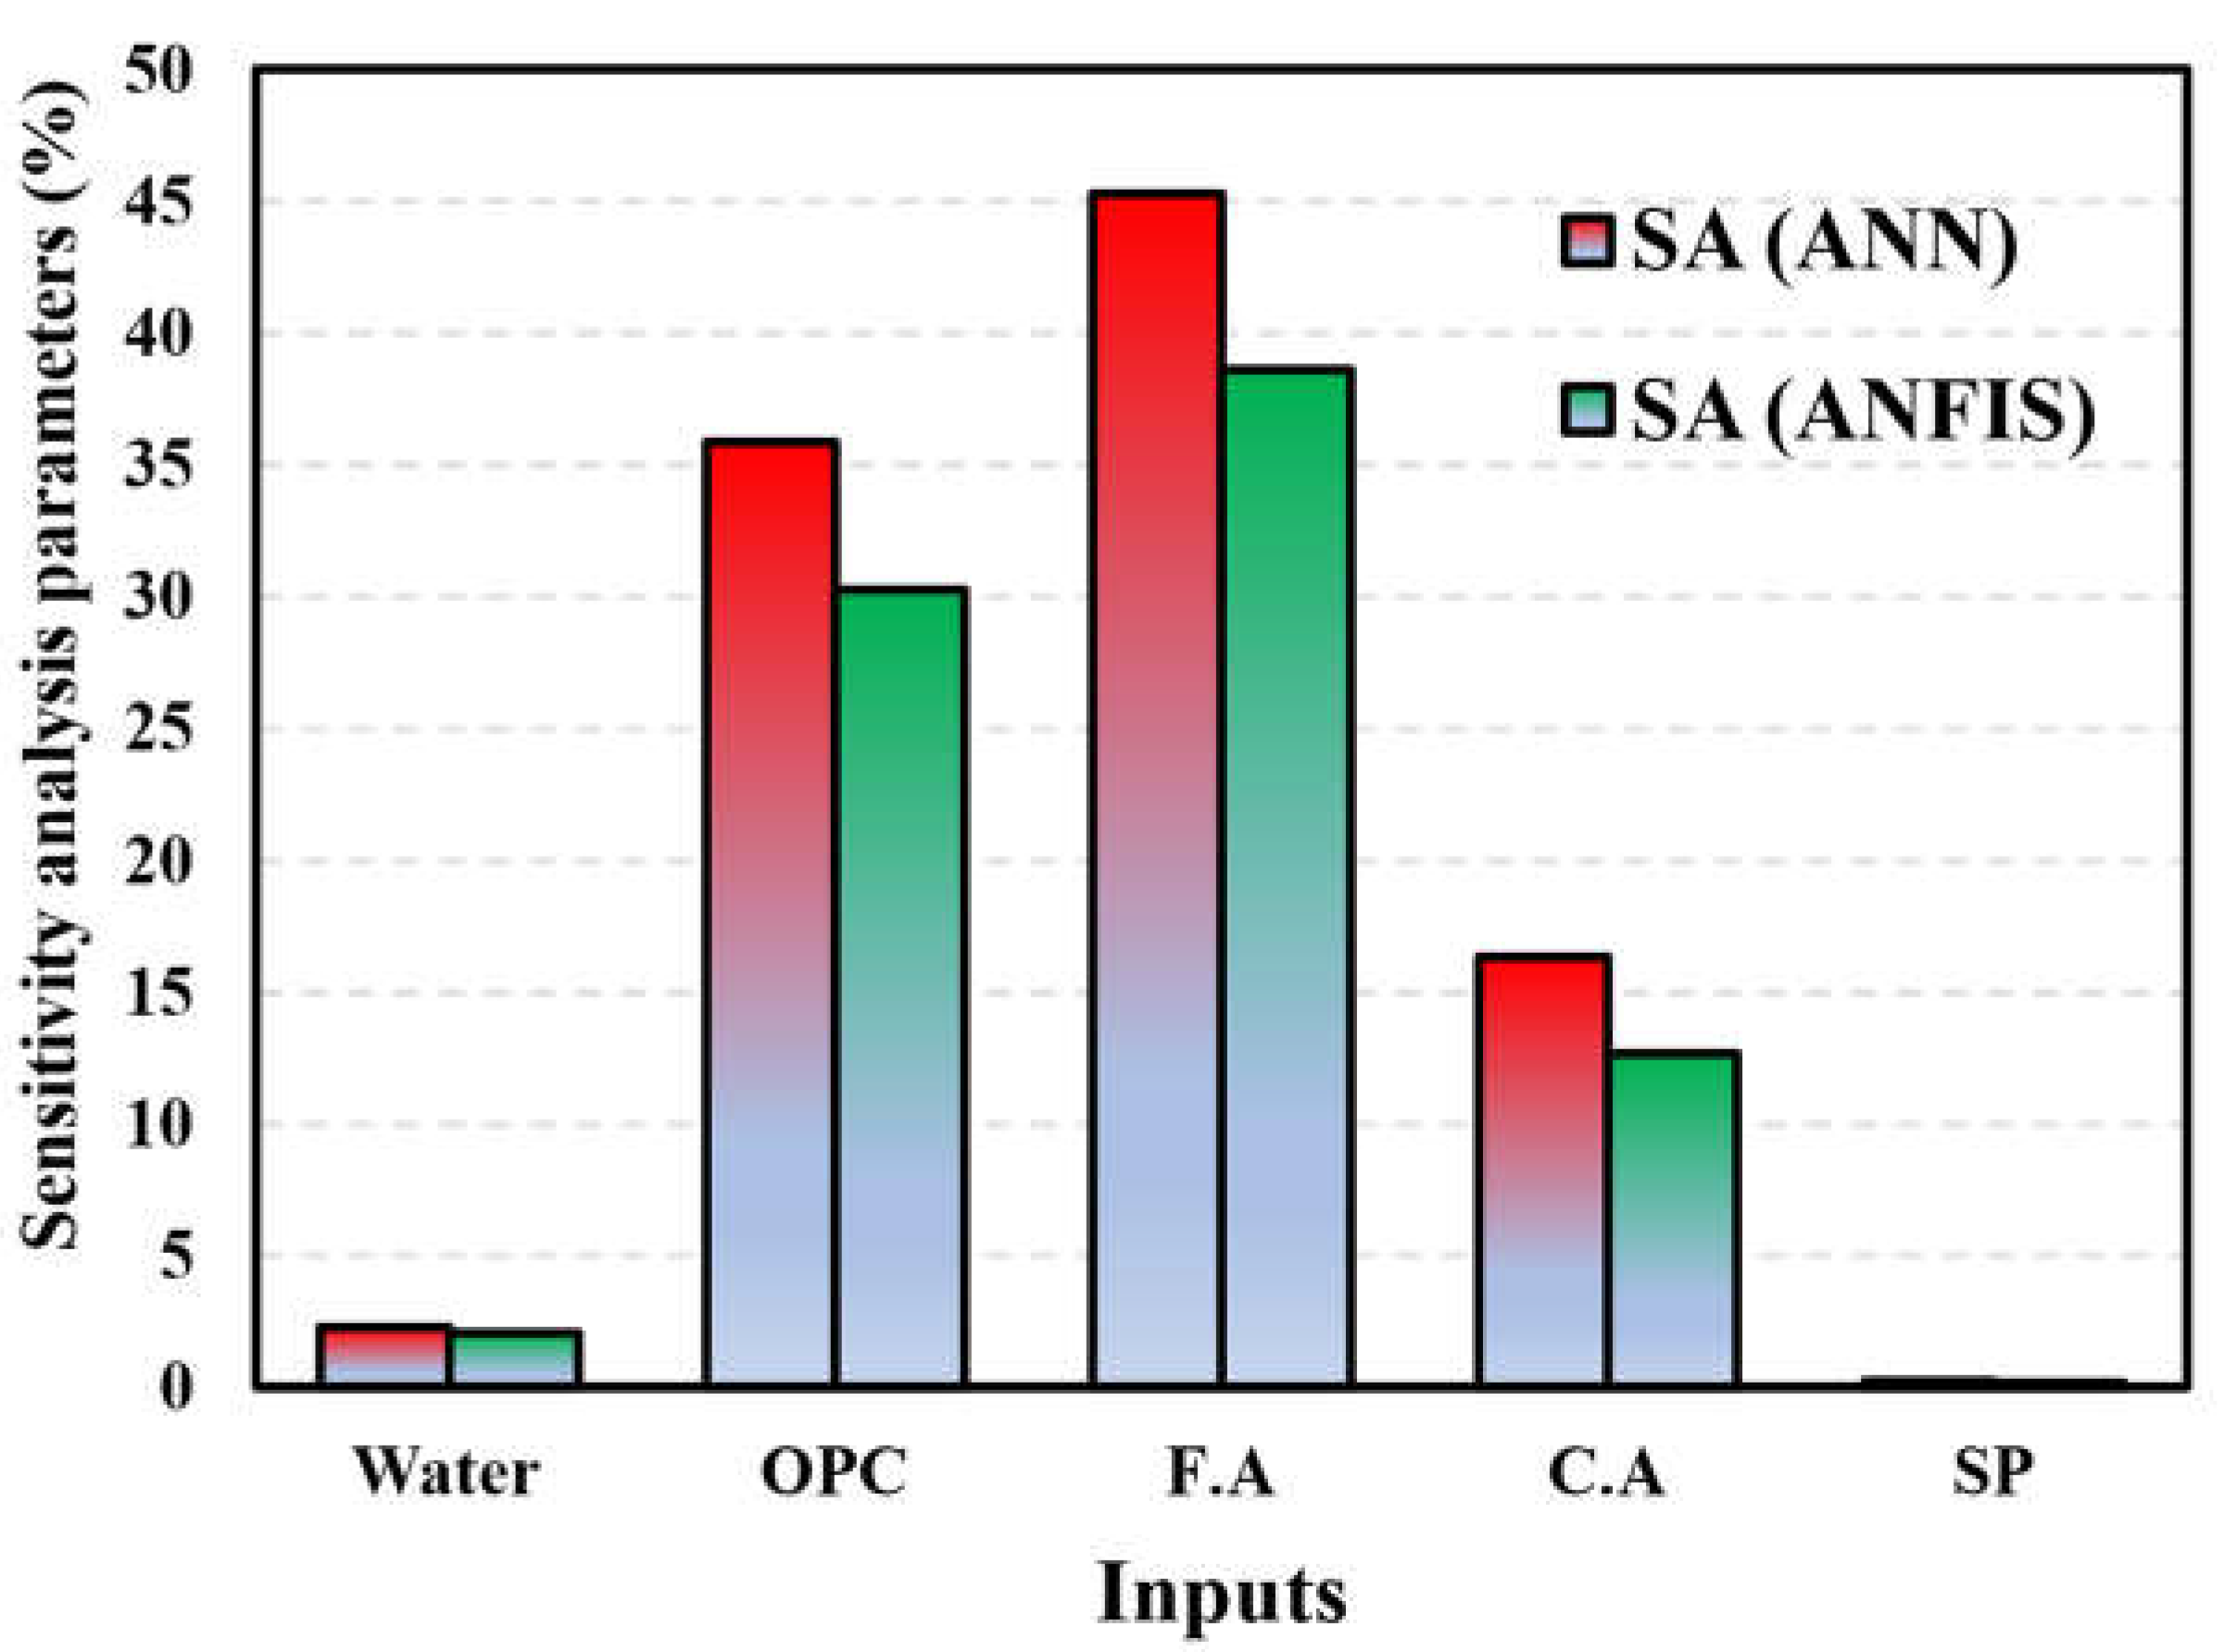
5.4. Analysis of ANN and ANFIS Model Sensitivity
5.5. Validation and Comparison of RSM, ANN, and ANFIS Models
6. Discussion
7. Limitations and Future Studies
- Make a comparison between the outputs based on the amount of data entered into the program.
- Using experimental data for prediction via genetic programming (GEP), multi-layer perceptron neural networks (MLPANNs), and GANNs to forecast the properties of concrete.
- Most of the researches focused on predicting the hardening properties of concrete, so we recommend conducting researches to predict the durability and microstructure of concretes.
- The resulting model’s prediction reliability should be tested by comparing it to the new mixture’s compressive strength.
8. Conclusions
- ANN and ANFIS models can manage large databases with many important factors and change nonlinearity with their robust computational approaches.
- Based on R2 and variance between real and predicted results, the ANN model predicted the compressive strength of HSC more accurately than the RSM model.
- Since R2 exceeds 0.99 in training and testing, the ANN model can capture the complex nonlinear connection between the five input parameters and HSC compressive strength.
- Instead of the RSM model, the ANN model is recommended for HSC strength prediction due to its greater prediction capacity. The ANN model can estimate HSC compressive strength before laboratory compression experiments, reducing time and cost.
- Testing data were used to validate the ANFIS model after it was built using training data. The RMSE was calculated to be 0.655, and the correlation coefficient was estimated to be 0.925.
- Of the five input variables for ANN and ANFIS, cement and fine aggregate are the most important and sensitive to compressive strength.
- According to the ANN model’s sensitivity analysis, cement (45.29%) is the main variable affecting compressive strength. As another major variable in compressive strength prediction, fine aggregate contributes 35.87%. However, superplasticizer (0.227%) had the lowest incidence. The compressive strength of HSC with ANN increases more with cement and fine aggregate, whereas superplasticizer decreases it.
- ANOVA results validated the statistical significance of including all model parameters due to the extraordinarily low p-value.
- The three most influential factors in HSC compressive strength prediction are cement, fine aggregate, and coarse aggregate, with R2 0.963.
- ANN, RSM, and ANFIS predicted a maximum compressive strength of 71.91, 78.1, and 73.61 MPa, and a minimum compressive strength of 38.8, 33, and 22.07 MPa, respectively.
- The proposed ANN model can be utilized to reduce the experimental specimens, required to determine the compressive strength of HSC
Supplementary Materials
Author Contributions
Funding
Institutional Review Board Statement
Informed Consent Statement
Data Availability Statement
Conflicts of Interest
Appendix A

| ID | Actual C.S | ANN | RSM | ANFIS | ID | Actual C.S | ANN | RSM | ANFIS |
|---|---|---|---|---|---|---|---|---|---|
| 1 | 73.6 | 71.78 | 76.1 | 73.60 | 51 | 61.7 | 61.98 | 66.02 | 61.70 |
| 2 | 73.6 | 71.86 | 78.1 | 73.60 | 52 | 61.9 | 60.83 | 63.226 | 61.75 |
| 3 | 73.6 | 71.92 | 70.1 | 73.60 | 53 | 61.9 | 61.32 | 62.4 | 61.76 |
| 4 | 73.1 | 71.30 | 77.6 | 73.08 | 54 | 61.9 | 61.53 | 62.8 | 61.90 |
| 5 | 73.1 | 71.41 | 71.1 | 73.08 | 55 | 59.5 | 59.87 | 58.6 | 59.50 |
| 6 | 73.1 | 71.46 | 72.1 | 73.11 | 56 | 59.5 | 60.01 | 61.15 | 59.50 |
| 7 | 72.7 | 70.86 | 68.7 | 72.99 | 57 | 59.5 | 60.17 | 62.15 | 59.50 |
| 8 | 72.7 | 70.92 | 76.2 | 72.98 | 58 | 61.1 | 59.95 | 63.748 | 61.10 |
| 9 | 72.7 | 70.91 | 75.8 | 72.69 | 59 | 61.1 | 60.07 | 64.75 | 61.10 |
| 10 | 69.4 | 69.75 | 72.3 | 69.38 | 60 | 61.1 | 60.25 | 65.42 | 61.10 |
| 11 | 69.4 | 69.95 | 75 | 69.38 | 61 | 60.8 | 60.03 | 66.45 | 60.80 |
| 12 | 69.4 | 70.09 | 70.8 | 69.40 | 62 | 60.8 | 60.20 | 62.165 | 60.80 |
| 13 | 70.5 | 69.07 | 66.2 | 70.57 | 63 | 60.8 | 60.45 | 65.125 | 60.80 |
| 14 | 70.5 | 69.29 | 65.2 | 70.57 | 64 | 60.5 | 59.91 | 65.15 | 61.34 |
| 15 | 70.5 | 69.42 | 74.8 | 70.50 | 65 | 60.5 | 59.88 | 68.15 | 61.29 |
| 16 | 68.1 | 68.38 | 75.4 | 68.10 | 66 | 60.5 | 59.95 | 54 | 60.50 |
| 17 | 68.1 | 68.60 | 69.55 | 68.10 | 67 | 59.9 | 59.92 | 61.226 | 58.64 |
| 18 | 68.1 | 68.75 | 74.6 | 68.10 | 68 | 59.9 | 59.91 | 60.4 | 58.71 |
| 19 | 67.8 | 67.98 | 63.3 | 67.80 | 69 | 59.9 | 59.99 | 60.8 | 59.90 |
| 20 | 67.8 | 68.13 | 70.3 | 67.80 | 70 | 57 | 59.67 | 56.1 | 57.42 |
| 21 | 67.8 | 68.19 | 63.5 | 67.80 | 71 | 57 | 59.74 | 58.65 | 57.40 |
| 22 | 67 | 66.78 | 61.7 | 66.99 | 72 | 57 | 59.95 | 59.65 | 57.00 |
| 23 | 67 | 66.82 | 71.3 | 66.99 | 73 | 59.7 | 60.13 | 62.348 | 60.75 |
| 24 | 67 | 66.78 | 74.3 | 67.00 | 74 | 59.7 | 60.00 | 63.35 | 60.69 |
| 25 | 64.1 | 65.15 | 65.55 | 64.10 | 75 | 59.7 | 59.92 | 61.1 | 59.70 |
| 26 | 64.1 | 65.16 | 63.1 | 64.10 | 76 | 60 | 59.78 | 66.5 | 58.41 |
| 27 | 64.1 | 65.14 | 60.1 | 64.10 | 77 | 60 | 59.70 | 55.5 | 58.50 |
| 28 | 64.6 | 65.09 | 68.1 | 64.57 | 78 | 60 | 59.68 | 62.5 | 59.99 |
| 29 | 64.6 | 64.63 | 67.7 | 64.57 | 79 | 59.6 | 58.72 | 57.95 | 60.14 |
| 30 | 64.6 | 64.26 | 67.5 | 64.60 | 80 | 59.6 | 58.72 | 55.1 | 60.11 |
| 31 | 64.4 | 64.83 | 70 | 64.46 | 81 | 59.6 | 58.83 | 57.95 | 59.60 |
| 32 | 64.4 | 64.51 | 65.8 | 64.46 | 82 | 62 | 62.71 | 63.32 | 62.36 |
| 33 | 64.4 | 64.31 | 70.9 | 64.40 | 83 | 62 | 63.11 | 64.56 | 61.68 |
| 34 | 64.7 | 64.32 | 60.2 | 64.70 | 84 | 62 | 63.36 | 66.36 | 62.01 |
| 35 | 64.7 | 64.23 | 69.2 | 64.70 | 85 | 62 | 61.70 | 66.32 | 61.31 |
| 36 | 64.7 | 64.16 | 61.2 | 64.70 | 86 | 62 | 61.75 | 61 | 60.70 |
| 37 | 63.9 | 64.34 | 68.4 | 63.90 | 87 | 62 | 61.67 | 58 | 61.95 |
| 38 | 63.9 | 63.96 | 61.9 | 63.90 | 88 | 60.6 | 60.12 | 64.1 | 60.99 |
| 39 | 63.9 | 63.57 | 67.4 | 63.90 | 89 | 60.6 | 59.90 | 63.7 | 61.05 |
| 40 | 63.4 | 63.31 | 67.6 | 63.39 | 90 | 60.6 | 59.56 | 63.5 | 60.62 |
| 41 | 63.4 | 63.20 | 65.05 | 63.39 | 91 | 62.1 | 61.54 | 67.7 | 61.53 |
| 42 | 63.4 | 63.07 | 58.1 | 63.40 | 92 | 62.1 | 61.98 | 66.6 | 61.34 |
| 43 | 62 | 62.46 | 66.6 | 62.00 | 93 | 62.1 | 62.25 | 58.6 | 62.10 |
| 44 | 62 | 62.61 | 64.5 | 62.00 | 94 | 61.5 | 60.58 | 66 | 62.30 |
| 45 | 62 | 62.59 | 60.35 | 62.00 | 95 | 61.5 | 60.90 | 59.5 | 61.99 |
| 46 | 62.4 | 62.92 | 57.9 | 62.16 | 96 | 61.5 | 61.06 | 65 | 61.49 |
| 47 | 62.4 | 62.88 | 60.75 | 62.17 | 97 | 57.8 | 59.01 | 62 | 57.57 |
| 48 | 62.4 | 62.81 | 63.72 | 62.40 | 98 | 57.8 | 59.27 | 59.45 | 57.82 |
| 49 | 61.7 | 61.38 | 64.26 | 62.09 | 99 | 57.8 | 59.38 | 52.5 | 57.81 |
| 50 | 61.7 | 61.74 | 66.06 | 62.09 | 100 | 61.5 | 61.79 | 66.1 | 62.12 |
| 101 | 61.5 | 61.93 | 65.82 | 61.96 | 151 | 47.3 | 47.75 | 48.7 | 47.30 |
| 102 | 61.5 | 61.92 | 67.15 | 61.51 | 152 | 47.3 | 47.39 | 43 | 47.30 |
| 103 | 60.8 | 60.13 | 62.165 | 59.97 | 153 | 47.3 | 47.31 | 42 | 47.30 |
| 104 | 60.8 | 60.23 | 65.125 | 59.81 | 154 | 52.1 | 51.48 | 56.4 | 52.06 |
| 105 | 60.8 | 60.22 | 65.45 | 60.78 | 155 | 52.1 | 50.55 | 59.4 | 51.62 |
| 106 | 57.6 | 57.83 | 65.25 | 57.47 | 156 | 52.1 | 49.77 | 53.55 | 51.44 |
| 107 | 57.6 | 57.95 | 51.1 | 57.55 | 157 | 45.5 | 47.91 | 52 | 45.78 |
| 108 | 57.6 | 57.99 | 59 | 57.60 | 158 | 45.5 | 47.32 | 41 | 46.21 |
| 109 | 58.8 | 59.18 | 54.5 | 58.80 | 159 | 45.5 | 46.90 | 48 | 45.69 |
| 110 | 58.8 | 58.83 | 53.5 | 58.80 | 160 | 45.7 | 45.70 | 41.4 | 45.70 |
| 111 | 58.8 | 58.72 | 63.1 | 58.86 | 161 | 45.7 | 45.40 | 40.4 | 45.81 |
| 112 | 56.8 | 57.14 | 64.1 | 56.09 | 162 | 45.7 | 45.15 | 50 | 45.59 |
| 113 | 56.8 | 57.15 | 58.25 | 56.66 | 163 | 49.6 | 49.51 | 45.6 | 49.39 |
| 114 | 56.8 | 57.29 | 63.3 | 56.70 | 164 | 49.6 | 49.60 | 51.25 | 50.05 |
| 115 | 55.3 | 55.73 | 50.8 | 55.14 | 165 | 49.6 | 49.64 | 52.25 | 50.12 |
| 116 | 55.3 | 55.73 | 57.8 | 55.34 | 166 | 48 | 49.09 | 50.648 | 48.45 |
| 117 | 55.3 | 55.67 | 51 | 55.32 | 167 | 48 | 48.93 | 51.65 | 48.19 |
| 118 | 57.8 | 56.73 | 52.5 | 57.80 | 168 | 48 | 48.74 | 49.4 | 48.29 |
| 119 | 57.8 | 56.76 | 62.1 | 57.81 | 169 | 47.7 | 48.56 | 54.2 | 47.47 |
| 120 | 57.8 | 56.82 | 65.1 | 57.79 | 170 | 47.7 | 48.24 | 43.2 | 47.31 |
| 121 | 56.6 | 56.38 | 58.05 | 56.71 | 171 | 47.7 | 47.91 | 50.2 | 47.42 |
| 122 | 56.6 | 56.59 | 55.6 | 56.61 | 172 | 49.1 | 49.29 | 47.45 | 49.01 |
| 123 | 56.6 | 56.62 | 52.6 | 56.62 | 173 | 49.1 | 48.99 | 44.6 | 48.91 |
| 124 | 56.9 | 55.43 | 58.55 | 56.79 | 174 | 49.1 | 48.61 | 47.45 | 48.83 |
| 125 | 56.9 | 55.36 | 59.55 | 56.88 | 175 | 48 | 47.99 | 49.32 | 47.90 |
| 126 | 56.9 | 54.98 | 59.548 | 56.89 | 176 | 48 | 48.09 | 50.56 | 47.89 |
| 127 | 56.1 | 55.66 | 59.75 | 56.10 | 177 | 48 | 48.10 | 50.9 | 47.97 |
| 128 | 56.1 | 56.38 | 57.5 | 56.32 | 178 | 48.5 | 47.45 | 54.1 | 48.46 |
| 129 | 56.1 | 56.85 | 62.6 | 56.33 | 179 | 48.5 | 47.49 | 53 | 48.24 |
| 130 | 55.9 | 56.10 | 51.4 | 55.90 | 180 | 48.5 | 47.42 | 46.5 | 48.31 |
| 131 | 55.9 | 56.72 | 58.4 | 55.55 | 181 | 49.4 | 49.37 | 48.4 | 49.77 |
| 132 | 55.9 | 56.92 | 54.25 | 55.54 | 182 | 49.4 | 49.34 | 45.4 | 50.25 |
| 133 | 54.3 | 54.90 | 49.8 | 54.30 | 183 | 49.4 | 49.21 | 52.9 | 50.28 |
| 134 | 54.3 | 55.07 | 52.65 | 54.43 | 184 | 48.7 | 47.73 | 51.8 | 48.31 |
| 135 | 54.3 | 54.79 | 55.62 | 54.40 | 185 | 48.7 | 47.74 | 51.6 | 48.30 |
| 136 | 54.2 | 54.71 | 56.76 | 54.20 | 186 | 48.7 | 47.65 | 54.3 | 48.36 |
| 137 | 54.2 | 54.72 | 57.1 | 54.20 | 187 | 46.1 | 46.38 | 47.5 | 46.47 |
| 138 | 54.2 | 54.98 | 59.8 | 54.20 | 188 | 46.1 | 46.41 | 41.8 | 46.45 |
| 139 | 52.7 | 52.73 | 57.2 | 52.77 | 189 | 46.1 | 46.36 | 40.8 | 46.53 |
| 140 | 52.7 | 52.59 | 49.2 | 52.73 | 190 | 47.7 | 46.08 | 52 | 46.63 |
| 141 | 52.7 | 52.75 | 57.2 | 52.72 | 191 | 47.7 | 46.49 | 55 | 46.60 |
| 142 | 51 | 49.93 | 49 | 50.94 | 192 | 47.7 | 46.99 | 49.15 | 46.57 |
| 143 | 51 | 49.83 | 54.5 | 50.97 | 193 | 47.1 | 47.69 | 53.6 | 48.46 |
| 144 | 51 | 50.09 | 55.2 | 50.98 | 194 | 47.1 | 47.99 | 42.6 | 48.54 |
| 145 | 54.6 | 53.14 | 56.25 | 54.57 | 195 | 47.1 | 48.39 | 49.6 | 48.62 |
| 146 | 54.6 | 52.50 | 49.3 | 54.22 | 196 | 45 | 45.16 | 40.7 | 44.99 |
| 147 | 54.6 | 52.13 | 59.2 | 54.07 | 197 | 45 | 45.46 | 47.648 | 44.98 |
| 148 | 50.3 | 50.46 | 54.62 | 50.33 | 198 | 45 | 45.69 | 48.65 | 44.97 |
| 149 | 50.3 | 49.83 | 53.2 | 50.68 | 199 | 46 | 45.99 | 47.4 | 46.04 |
| 150 | 50.3 | 49.49 | 55.9 | 50.83 | 200 | 46 | 46.37 | 52.5 | 46.06 |
| 201 | 46 | 46.66 | 41.5 | 46.08 | 251 | 43.7 | 44.64 | 45.02 | 40.90 |
| 202 | 45.7 | 45.41 | 48.2 | 45.57 | 252 | 43.7 | 44.44 | 46.26 | 41.08 |
| 203 | 45.7 | 45.67 | 44.05 | 45.53 | 253 | 44.5 | 43.58 | 48.86 | 42.61 |
| 204 | 45.7 | 45.77 | 41.2 | 45.49 | 254 | 44.5 | 43.64 | 48.82 | 41.67 |
| 205 | 45.1 | 44.54 | 43.45 | 45.18 | 255 | 44.5 | 43.70 | 43.5 | 41.81 |
| 206 | 45.1 | 44.59 | 47.748 | 45.21 | 256 | 42.6 | 43.74 | 38.6 | 50.61 |
| 207 | 45.1 | 44.47 | 48.75 | 45.24 | 257 | 42.6 | 43.72 | 46.1 | 47.70 |
| 208 | 46 | 45.83 | 50.32 | 46.00 | 258 | 42.6 | 43.70 | 45.7 | 47.80 |
| 209 | 46 | 46.23 | 51.65 | 46.00 | 259 | 43.8 | 43.80 | 46.7 | 50.12 |
| 210 | 46 | 46.42 | 47.365 | 46.00 | 260 | 43.8 | 43.71 | 49.4 | 47.82 |
| 211 | 45 | 44.59 | 49.325 | 45.00 | 261 | 43.8 | 43.58 | 39.8 | 47.91 |
| 212 | 45 | 44.74 | 49.65 | 45.00 | 262 | 43.6 | 43.39 | 47.1 | 41.74 |
| 213 | 45 | 44.69 | 52.65 | 45.00 | 263 | 43.6 | 43.33 | 46.7 | 41.33 |
| 214 | 43.3 | 42.93 | 36.8 | 43.30 | 264 | 43.6 | 43.24 | 46.5 | 41.45 |
| 215 | 43.3 | 42.86 | 44.626 | 43.31 | 265 | 42.6 | 43.00 | 48.2 | 40.71 |
| 216 | 43.3 | 42.65 | 43.8 | 43.32 | 266 | 42.6 | 42.95 | 44 | 39.51 |
| 217 | 44.5 | 45.50 | 45.4 | 44.55 | 267 | 42.6 | 42.86 | 38.3 | 39.68 |
| 218 | 44.5 | 45.37 | 43.6 | 44.55 | 268 | 42.9 | 42.61 | 37.6 | 42.12 |
| 219 | 44.5 | 45.45 | 46.15 | 44.55 | 269 | 42.9 | 42.55 | 47.2 | 41.22 |
| 220 | 43.6 | 43.97 | 46.25 | 43.47 | 270 | 42.9 | 42.43 | 50.2 | 41.36 |
| 221 | 43.6 | 44.02 | 38.3 | 43.46 | 271 | 44.9 | 42.59 | 46.35 | 38.73 |
| 222 | 43.6 | 44.29 | 47.9 | 43.45 | 272 | 44.9 | 43.09 | 51.4 | 38.82 |
| 223 | 42 | 43.28 | 49.3 | 42.08 | 273 | 44.9 | 43.56 | 40.4 | 38.85 |
| 224 | 42 | 43.50 | 43.45 | 42.09 | 274 | 41.1 | 41.81 | 43.6 | 37.85 |
| 225 | 42 | 43.92 | 41 | 42.10 | 275 | 41.1 | 42.18 | 36.8 | 38.19 |
| 226 | 43.8 | 43.83 | 39.8 | 43.80 | 276 | 41.1 | 42.52 | 35.8 | 38.53 |
| 227 | 43.8 | 43.59 | 45.45 | 41.45 | 277 | 41.5 | 41.30 | 44.148 | 38.22 |
| 228 | 43.8 | 43.55 | 46.45 | 39.12 | 278 | 41.5 | 41.52 | 45.15 | 38.56 |
| 229 | 43 | 43.11 | 45.648 | 39.02 | 279 | 41.5 | 41.72 | 42.9 | 38.90 |
| 230 | 43 | 43.04 | 46.65 | 37.72 | 280 | 42.5 | 42.57 | 49 | 36.86 |
| 231 | 43 | 43.14 | 44.4 | 36.43 | 281 | 42.5 | 42.93 | 38 | 36.61 |
| 232 | 43.2 | 42.79 | 49.7 | 34.85 | 282 | 42.5 | 43.21 | 45 | 36.35 |
| 233 | 43.2 | 42.77 | 38.7 | 33.75 | 283 | 40.8 | 41.94 | 39.15 | 36.25 |
| 234 | 43.2 | 42.85 | 45.7 | 32.65 | 284 | 40.8 | 42.09 | 36.3 | 35.84 |
| 235 | 43.5 | 43.17 | 41.85 | 32.82 | 285 | 40.8 | 42.17 | 39.15 | 35.44 |
| 236 | 43.5 | 42.85 | 39 | 33.69 | 286 | 40.8 | 41.04 | 43.448 | 37.12 |
| 237 | 43.5 | 42.67 | 41.85 | 34.56 | 287 | 40.8 | 41.03 | 44.45 | 36.75 |
| 238 | 41.5 | 42.54 | 42.82 | 34.82 | 288 | 40.8 | 40.98 | 45.12 | 36.38 |
| 239 | 41.5 | 42.32 | 44.06 | 34.96 | 289 | 41.8 | 42.54 | 47.45 | 33.92 |
| 240 | 41.5 | 42.17 | 44.4 | 35.10 | 290 | 41.8 | 42.63 | 43.165 | 34.80 |
| 241 | 42.4 | 41.81 | 48 | 36.10 | 291 | 41.8 | 42.66 | 46.125 | 35.67 |
| 242 | 42.4 | 41.57 | 46.9 | 35.69 | 292 | 41.3 | 41.52 | 45.95 | 33.34 |
| 243 | 42.4 | 41.32 | 46.05 | 35.29 | 293 | 41.3 | 41.42 | 48.95 | 34.22 |
| 244 | 46 | 44.86 | 47.4 | 45.53 | 294 | 41.3 | 41.28 | 34.8 | 35.09 |
| 245 | 46 | 44.84 | 52.5 | 45.02 | 295 | 41 | 40.25 | 42.326 | 34.05 |
| 246 | 46 | 44.83 | 41.5 | 45.15 | 296 | 41 | 40.06 | 41.5 | 34.82 |
| 247 | 45 | 44.92 | 47.5 | 42.38 | 297 | 41 | 39.87 | 41.9 | 35.59 |
| 248 | 45 | 44.78 | 43.35 | 40.90 | 298 | 41.3 | 41.50 | 40.4 | 37.73 |
| 249 | 45 | 44.66 | 40.5 | 41.08 | 299 | 41.3 | 41.58 | 42.95 | 37.69 |
| 250 | 43.7 | 44.88 | 42.05 | 42.38 | 300 | 41.3 | 41.78 | 43.95 | 37.64 |
| 301 | 41.5 | 40.78 | 36.2 | 37.07 | |||||
| 302 | 41.5 | 40.90 | 45.8 | 37.00 | |||||
| 303 | 41.5 | 41.11 | 44 | 36.92 | |||||
| 304 | 40.3 | 40.02 | 38.65 | 36.07 | |||||
| 305 | 40.3 | 40.10 | 35.8 | 35.99 | |||||
| 306 | 40.3 | 40.21 | 38.65 | 35.91 | |||||
| 307 | 41.5 | 41.23 | 42.82 | 33.84 | |||||
| 308 | 41.5 | 41.25 | 44.06 | 29.97 | |||||
| 309 | 41.5 | 41.35 | 44.4 | 26.11 | |||||
| 310 | 40 | 40.59 | 45.6 | 29.15 | |||||
| 311 | 40 | 40.59 | 44.5 | 26.80 | |||||
| 312 | 40 | 40.62 | 43.65 | 24.46 | |||||
| 313 | 40 | 39.77 | 41.4 | 25.04 | |||||
| 314 | 40 | 39.68 | 46.5 | 23.55 | |||||
| 315 | 40 | 39.58 | 35.5 | 22.06 | |||||
| 316 | 42.1 | 40.82 | 44.6 | 27.86 | |||||
| 317 | 42.1 | 40.69 | 40.45 | 27.03 | |||||
| 318 | 42.1 | 40.60 | 37.6 | 26.20 | |||||
| 319 | 39.5 | 40.02 | 37.85 | 28.95 | |||||
| 320 | 39.5 | 39.85 | 47.15 | 28.12 | |||||
| 321 | 39.5 | 39.70 | 33 | 27.30 | |||||
| 322 | 37.5 | 39.13 | 38.826 | 30.77 | |||||
| 323 | 37.5 | 38.95 | 38 | 29.45 | |||||
| 324 | 37.5 | 38.79 | 38.4 | 28.12 |
References
- Yuan, X.; Dai, M.; Gao, Y.; Zhou, Y.; Liu, F. Effect on mechanical properties and microstructure of high-strength eco-friendly concrete with waste glass powder-eggshell particles. J. Build. Eng. 2023, 79, 107871. [Google Scholar] [CrossRef]
- Hayatdavoodi, A.; Dehghani, A.; Aslani, F.; Nateghi-Alahi, F. The development of a novel analytical model to design composite steel plate shear walls under eccentric shear. J. Build. Eng. 2021, 44, 103281. [Google Scholar] [CrossRef]
- Aslani, F.; Deghani, A.; Gunawardena, Y. Experimental investigation of the behavior of concrete-filled high-strength glass fiber-reinforced polymer tubes under static and cyclic axial compression. Struct. Concr. 2020, 21, 1497–1522. [Google Scholar] [CrossRef]
- Shariati, M.; Sulong, N.R.; Shariati, A.; Kueh, A. Comparative performance of channel and angle shear connectors in high strength concrete composites: An experimental study. Constr. Build. Mater. 2016, 120, 382–392. [Google Scholar] [CrossRef]
- Shariati, A.; Shariati, M.; Sulong, N.R.; Suhatril, M.; Khanouki, M.A.; Mahoutian, M. Experimental assessment of angle shear connectors under monotonic and fully reversed cyclic loading in high strength concrete. Constr. Build. Mater. 2014, 52, 276–283. [Google Scholar] [CrossRef]
- Sun, J.; Huang, Y.; Aslani, F.; Wang, X.; Ma, G. Mechanical enhancement for EMW-absorbing cementitious material using 3D concrete printing. J. Build. Eng. 2021, 41, 102763. [Google Scholar] [CrossRef]
- Sun, J.; Huang, Y.; Aslani, F.; Ma, G. Electromagnetic wave absorbing performance of 3D printed wave-shape copper solid cementitious element. Cem. Concr. Compos. 2020, 114, 103789. [Google Scholar] [CrossRef]
- Sun, J.; Lin, S.; Zhang, G.; Sun, Y.; Zhang, J.; Chen, C.; Morsy, A.M.; Wang, X. The effect of graphite and slag on electrical and mechanical properties of electrically conductive cementitious composites. Constr. Build. Mater. 2021, 281, 122606. [Google Scholar] [CrossRef]
- Mostafaei, H.; Bahmani, H.; Mostofinejad, D.; Wu, C. A novel development of HPC without cement: Mechanical properties and sustainability evaluation. J. Build. Eng. 2023, 76, 107262. [Google Scholar] [CrossRef]
- Sun, J.; Ma, Y.; Li, J.; Zhang, J.; Ren, Z.; Wang, X. Machine learning-aided design and prediction of cementitious composites containing graphite and slag powder. J. Build. Eng. 2021, 43, 102544. [Google Scholar] [CrossRef]
- Khan, A.Q.; Awan, H.A.; Rasul, M.; Siddiqi, Z.A.; Pimanmas, A. Optimized artificial neural network model for accurate prediction of compressive strength of normal and high strength concrete. Clean. Mater. 2023, 10, 100211. [Google Scholar] [CrossRef]
- Ofuyatan, O.M.; Agbawhe, O.B.; Omole, D.O.; Igwegbe, C.A.; Ighalo, J.O. RSM and ANN modelling of the mechanical properties of self-compacting concrete with silica fume and plastic waste as partial constituent replacement. Clean. Mater. 2022, 4, 100065. [Google Scholar] [CrossRef]
- Qu, G.; Zheng, M.; Zhang, W.; Jing, H.; Ou, Z. Preparation and acceleration mechanism of a ternary hardening accelerator for high-performance concrete with full aeolian sand. Constr. Build. Mater. 2023, 369, 130629. [Google Scholar] [CrossRef]
- Azimi-Pour, M.; Eskandari-Naddaf, H. ANN and GEP prediction for simultaneous effect of nano and micro silica on the compressive and flexural strength of cement mortar. Constr. Build. Mater. 2018, 189, 978–992. [Google Scholar] [CrossRef]
- Siddique, R.; Aggarwal, P.; Aggarwal, Y. Prediction of compressive strength of self-compacting concrete containing bottom ash using artificial neural networks. Adv. Eng. Softw. 2011, 42, 780–786. [Google Scholar] [CrossRef]
- Ramrakhiani, L.; Ghosh, S.; Mandal, A.K.; Majumdar, S. Utilization of multi-metal laden spent biosorbent for removal of glyphosate herbicide from aqueous solution and its mechanism elucidation. Chem. Eng. J. 2018, 361, 1063–1077. [Google Scholar] [CrossRef]
- Azimi-Pour, M.; Eskandari-Naddaf, H.; Pakzad, A. Linear and non-linear SVM prediction for fresh properties and compressive strength of high volume fly ash self-compacting concrete. Constr. Build. Mater. 2019, 230, 117021. [Google Scholar] [CrossRef]
- Song, H.; Ahmad, A.; Farooq, F.; Ostrowski, K.A.; Maślak, M.; Czarnecki, S.; Aslam, F. Predicting the compressive strength of concrete with fly ash admixture using machine learning algorithms. Constr. Build. Mater. 2021, 308, 125021. [Google Scholar] [CrossRef]
- Pepard, J.; Rinchon, M. Strength Durability-Based Design Mix of Self-Compacting Concrete with Cementitious Blend using Hybrid Neural Network-Genetic Algorithm. Reg. Conf. Civ. Eng. 2017, 1. [Google Scholar]
- Awoyera, P.O.; Kirgiz, M.S.; Viloria, A.; Ovallos-Gazabon, D. Estimating strength properties of geopolymer self-compacting concrete using machine learning techniques. J. Mater. Res. Technol. 2020, 9, 9016–9028. [Google Scholar] [CrossRef]
- Asteris, P.G.; Kolovos, K. Self-compacting concrete strength prediction using surrogate models. Neural Comput. Appl. 2019, 31, 409–424. [Google Scholar] [CrossRef]
- Sahraoui, M.; Bouziani, T. ANN modelling approach for predicting SCC properties—Research considering Algerian experience. Part I. Development and analysis of models. J. Build. Mater. Struct. 2020, 7, 188–198. [Google Scholar] [CrossRef]
- Shamsabadi, E.A.; Roshan, N.; Hadigheh, S.A.; Nehdi, M.L.; Khodabakhshian, A.; Ghalehnovi, M. Machine learning-based compressive strength modelling of concrete incorporating waste marble powder. Constr. Build. Mater. 2022, 324, 126592. [Google Scholar] [CrossRef]
- Sadowski, Ł.; Piechówka-Mielnik, M.; Widziszowski, T.; Gardynik, A.; Mackiewicz, S. Hybrid ultrasonic-neural prediction of the compressive strength of environmentally friendly concrete screeds with high volume of waste quartz mineral dust. J. Clean. Prod. 2019, 212, 727–740. [Google Scholar] [CrossRef]
- Alyouef, R.; Algaifi, H.A.; Alaskar, A. Engineering Properties of Waste Sawdust-Based Assessment and Numerical Prediction. Materials 2020, 13, 5490. [Google Scholar]
- Ly, H.B.; Pham, B.T.; Dao, D.V.; Le, V.M.; Le, L.M.; Le, T.T. Improvement of ANFIS Model for Prediction of Compressive Strength of Manufactured Sand Concrete. Appl. Sci. 2019, 9, 3841. [Google Scholar] [CrossRef]
- Kumar, A.; Arora, H.C.; Kumar, K.; Garg, H. Performance prognosis of FRCM-to-concrete bond strength using ANFIS-based fuzzy algorithm. Expert Syst. Appl. 2023, 216, 119497. [Google Scholar] [CrossRef]
- Liu, L.; Li, J.; Mohammed, K.J.; Ali, E.; Alkhalifah, T.; Alturise, F.; Marzouki, R. Novel modified ANFIS based fuzzy logic model for performance prediction of FRCM-to-concrete bond strength. Adv. Eng. Softw. 2023, 182, 103474. [Google Scholar] [CrossRef]
- Pei, Z.; Wei, Y. Prediction of the bond strength of FRP-to-concrete under direct tension by ACO-based ANFIS approach. Compos. Struct. 2021, 282, 115070. [Google Scholar] [CrossRef]
- Mishra, M.; Bhatia, A.S.; Maity, D. A comparative study of regression, neural network and neuro-fuzzy inference system for determining the compressive strength of brick–mortar masonry by fusing nondestructive testing data. Eng. Comput. 2019, 37, 77–91. [Google Scholar] [CrossRef]
- Sadrmomtazi, A.; Sobhani, J.; Mirgozar, M. Modeling compressive strength of EPS lightweight concrete using regression, neural network and ANFIS. Constr. Build. Mater. 2013, 42, 205–216. [Google Scholar] [CrossRef]
- Ferdosian, I.; Camões, A. Eco-efficient ultra-high performance concrete development by means of response surface methodology. Cem. Concr. Compos. 2017, 84, 146–156. [Google Scholar] [CrossRef]
- Rantung, D.; Supit, S.W.; Nicolaas, S. Effects of different size of fly ash as cement replacement on self-compacting concrete properties. J. Sustain. Eng. Proc. Ser. 2019, 1, 180–186. [Google Scholar] [CrossRef]
- Rezaifar, O.; Hasanzadeh, M.; Gholhaki, M. Concrete made with hybrid blends of crumb rubber and metakaolin: Optimization using Response Surface Method. Constr. Build. Mater. 2016, 123, 59–68. [Google Scholar] [CrossRef]
- Al-Rihimy, A.S.; Al-Shathr, B.S.; Al-Attar, T.S. Prediction of Creep Strain for Self-Compacting Concrete by Artificial Neural Networks. Kufa J. Eng. 2019, 10, 90–100. [Google Scholar] [CrossRef]
- Bui, N.K.; Satomi, T.; Takahashi, H. Recycling woven plastic sack waste and PET bottle waste as fiber in recycled aggregate concrete: An experimental study. Waste Manag. 2018, 78, 79–93. [Google Scholar] [CrossRef]
- Shah, S.A.R.; Ben Kahla, N.; Atig, M.; Anwar, M.K.; Azab, M.; Mahmood, A. Optimization of fresh and mechanical properties of sustainable concrete composite containing ARGF and fly ash: An application of response surface methodology. Constr. Build. Mater. 2023, 362, 129722. [Google Scholar] [CrossRef]
- Hamada, H.M.; Al-Attar, A.A.; Tayeh, B.; Yahaya, F.B.M. Optimizing the concrete strength of lightweight concrete containing nano palm oil fuel ash and palm oil clinker using response surface method. Case Stud. Constr. Mater. 2022, 16, e01061. [Google Scholar] [CrossRef]
- Hacene, S.M.A.B.; Ghomari, F.; Schoefs, F.; Khelidj, A. Probabilistic Modelling of Compressive Strength of Concrete Using Response Surface Methodology and Neural Networks. Arab. J. Sci. Eng. 2014, 39, 4451–4460. [Google Scholar] [CrossRef]
- Sun, J.; Wang, J.; Zhu, Z.; He, R.; Peng, C.; Zhang, C.; Huang, J.; Wang, Y.; Wang, X. Mechanical Performance Prediction for Sustainable High-Strength Concrete Using Bio-Inspired Neural Network. Buildings 2022, 12, 65. [Google Scholar] [CrossRef]
- Al-Shamiri, A.K.; Kim, J.H.; Yuan, T.-F.; Yoon, Y.S. Modeling the compressive strength of high-strength concrete: An extreme learning approach. Constr. Build. Mater. 2019, 208, 204–219. [Google Scholar] [CrossRef]
- Schober, P.; Boer, C.; Schwarte, L.A. Correlation Coefficients: Appropriate Use and Interpretation. Anesth. Analg. 2018, 126, 1763–1768. [Google Scholar] [CrossRef]
- Liu, Q.-F.; Iqbal, M.F.; Yang, J.; Lu, X.-Y.; Zhang, P.; Rauf, M. Prediction of chloride diffusivity in concrete using artificial neural network: Modelling and performance evaluation. Constr. Build. Mater. 2020, 268, 121082. [Google Scholar] [CrossRef]
- Jagadesh, P.; de Prado-Gil, J.; Silva-Monteiro, N.; Martínez-García, R. Assessing the compressive strength of self-compacting concrete with recycled aggregates from mix ratio using machine learning approach. J. Mater. Res. Technol. 2023, 24, 1483–1498. [Google Scholar] [CrossRef]
- Ma, H.; Sun, Z. Research on Compressive Strength of Manufactured Sand Concrete Based on Response Surface Methodology (RSM). Appl. Sci. 2022, 12, 3506. [Google Scholar] [CrossRef]
- Boudali, S.; Abdulsalam, B.; Rafiean, A.H.; Poncet, S.; Soliman, A.; ElSafty, A. Influence of Fine Recycled Concrete Powder on the Compressive Strength of Self-Compacting Concrete (SCC) Using Artificial Neural Network. Sustainability 2021, 13, 3111. [Google Scholar] [CrossRef]
- Chen, H.; Li, X.; Wu, Y.; Zuo, L.; Lu, M.; Zhou, Y. Compressive Strength Prediction of High-Strength Concrete Using Long Short-Term Memory and Machine Learning Algorithms. Buildings 2022, 12, 302. [Google Scholar] [CrossRef]
- Ali, M.; Kumar, A.; Yvaz, A.; Salah, B. Central composite design application in the optimization of the effect of pumice stone on lightweight concrete properties using RSM. Case Stud. Constr. Mater. 2023, 18, e01958. [Google Scholar] [CrossRef]
- He, H.; Cheng, S.; Chen, Y.; Lan, B. Compression performance analysis of multi-scale modified concrete based on response surface method. Case Stud. Constr. Mater. 2022, 17, e01312. [Google Scholar] [CrossRef]
- Kursuncu, B.; Gencel, O.; Bayraktar, O.Y.; Shi, J.; Nematzadeh, M.; Kaplan, G. Optimization of foam concrete characteristics using response surface methodology and artificial neural networks. Constr. Build. Mater. 2022, 337, 127575. [Google Scholar] [CrossRef]
- Adamu, M.; Marouf, M.L.; Ibrahim, Y.E.; Ahmed, O.S.; Alanazi, H.; Marouf, A.L. Modeling and optimization of the mechanical properties of date fiber reinforced concrete containing silica fume using response surface methodology. Case Stud. Constr. Mater. 2022, 17, e01633. [Google Scholar] [CrossRef]
- Tenza-Abril, A.; Villacampa, Y.; Solak, A.; Baeza-Brotons, F. Prediction and sensitivity analysis of compressive strength in segregated lightweight concrete based on artificial neural network using ultrasonic pulse velocity. Constr. Build. Mater. 2018, 189, 1173–1183. [Google Scholar] [CrossRef]
- Shbeeb, N.I.; Katash, A.A.; Oguzmert, M.; Barham, W.S. Estimation of the Bond Strength of Fiber-Reinforced Polymer Bars in Concrete Using Artificial Intelligence Systems. Buildings 2024, 14, 369. [Google Scholar] [CrossRef]
- Al-Jamimi, H.A.; Al-Kutti, W.A.; Alwahaishi, S.; Alotaibi, K.S. Prediction of compressive strength in plain and blended cement concretes using a hybrid artificial intelligence model. Case Stud. Constr. Mater. 2022, 17, e01238. [Google Scholar] [CrossRef]
- Luo, X.; Xing, G.; Qiao, L.; Miao, P.; Yu, X.; Ma, K. Multi-objective optimization of the mix proportion for dune sand concrete based on response surface methodology. Constr. Build. Mater. 2023, 366, 129928. [Google Scholar] [CrossRef]
- Aziminezhad, M.; Mahdikhani, M.; Memarpour, M.M. RSM-based modeling and optimization of self-consolidating mortar to predict acceptable ranges of rheological properties. Constr. Build. Mater. 2018, 189, 1200–1213. [Google Scholar] [CrossRef]
- Amiri, H.; Azadi, S.; Karimaei, M.; Sadeghi, H.; Dabbaghi, F. Multi-objective optimization of coal waste recycling in concrete using response surface methodology. J. Build. Eng. 2021, 45, 103472. [Google Scholar] [CrossRef]
- Behnood, A.; Golafshani, E.M. Predicting the compressive strength of silica fume concrete using hybrid artificial neural network with multi-objective grey wolves. J. Clean. Prod. 2018, 202, 54–64. [Google Scholar] [CrossRef]
- Hammoudi, A.; Moussaceb, K.; Belebchouche, C.; Dahmoune, F. Comparison of artificial neural network (ANN) and response surface methodology (RSM) prediction in compressive strength of recycled concrete aggregates. Constr. Build. Mater. 2019, 209, 425–436. [Google Scholar] [CrossRef]
- Essam, A.; Mostafa, S.A.; Khan, M.; Tahwia, A.M. Modified particle packing approach for optimizing waste marble powder as a cement substitute in high-performance concrete. Constr. Build. Mater. 2023, 409, 133845. [Google Scholar] [CrossRef]
- Schilling, A.; Maier, A.; Gerum, R.; Metzner, C.; Krauss, P. Quantifying the separability of data classes in neural networks. Neural Networks 2021, 139, 278–293. [Google Scholar] [CrossRef] [PubMed]
- Jagadesh, P.; Khan, A.H.; Priya, B.S.; Asheeka, A.; Zoubir, Z.; Magbool, H.M.; Alam, S.; Bakather, O.Y. Artificial neural network, machine learning modelling of compressive strength of recycled coarse aggregate based self-compacting concrete. PLoS ONE 2024, 19, e0303101. [Google Scholar] [CrossRef] [PubMed]
- Mathur, N.; Glesk, I.; Buis, A. Comparison of adaptive neuro-fuzzy inference system (ANFIS) and Gaussian processes for machine learning (GPML) algorithms for the prediction of skin temperature in lower limb prostheses. Med. Eng. Phys. 2016, 38, 1083–1089. [Google Scholar] [CrossRef] [PubMed]
- Alyousef, R.; Nassar, R.-U.; Fawad, M.; Farooq, F.; Gamil, Y.; Najeh, T. Predicting the properties of concrete incorporating graphene nano platelets by experimental and machine learning approaches. Case Stud. Constr. Mater. 2024, 20, e03018. [Google Scholar] [CrossRef]
- Paruthi, S.; Rahman, I.; Husain, A. Utilizing ANFIS for strength characteristics forecasting in variable heat-cured geopolymer composites. Mater. Today Proc. 2024. [Google Scholar] [CrossRef]
- Concrete, F.; Multiple, U.; Learning, M. Predicting the Compressive Strength of Environmentally. Buildings 2024, 14, 190. [Google Scholar] [CrossRef]
- Van Dao, D.; Ly, H.; Vu, H.T.; Le, T. Investigation and Optimization of the C-ANN Structure in Predicting the Com-pressive Strength of Foamed Concrete. Materials 2020, 13, 1072. [Google Scholar] [CrossRef]
- Hoang, N.-D.; Pham, A.-D.; Nguyen, Q.-L.; Pham, Q.-N. Estimating Compressive Strength of High Performance Concrete with Gaussian Process Regression Model. Adv. Civ. Eng. 2016, 2016, 2861380. [Google Scholar] [CrossRef]
- Biswas, R.; Kumar, M.; Singh, R.K.; Alzara, M.; El Sayed, S.; Abdelmongy, M.; Yosri, A.M.; Yousef, S.E.A. A novel integrated approach of RUNge Kutta optimizer and ANN for estimating compressive strength of self-compacting concrete. Case Stud. Constr. Mater. 2023, 18, e02163. [Google Scholar] [CrossRef]
- Chen, L.; Fakharian, P.; Eidgahee, D.R.; Haji, M.; Arab, A.M.A.; Nouri, Y. Axial compressive strength predictive models for recycled aggregate concrete filled circular steel tube columns using ANN, GEP, and MLR. J. Build. Eng. 2023, 77, 107439. [Google Scholar] [CrossRef]
- Ray, S.; Haque, M.; Ahmed, T.; Nahin, T.T. Comparison of artificial neural network (ANN) and response surface methodology (RSM) in predicting the compressive and splitting tensile strength of concrete prepared with glass waste and tin (Sn) can fiber. J. King Saud Univ.-Eng. Sci. 2021, 35, 185–199. [Google Scholar] [CrossRef]
- Rahman, S.K.; Al-Ameri, R. Structural assessment of Basalt FRP reinforced self-compacting geopolymer concrete using artificial neural network (ANN) modelling. Constr. Build. Mater. 2023, 397, 132464. [Google Scholar] [CrossRef]
- Paruthi, S.; Khan, A.H.; Kumar, A.; Kumar, F.; Hasan, M.A.; Magbool, H.M.; Manzar, M.S. Sustainable cement replacement using waste eggshells: A review on mechanical properties of eggshell concrete and strength prediction using artificial neural network. Case Stud. Constr. Mater. 2023, 18, e02160. [Google Scholar] [CrossRef]
- Reddy, Y.S.; Sekar, A.; Nachiar, S.S. A Validation Study on Mechanical Properties of Foam Concrete with Coarse Ag-gregate Using ANN Model. Buildings 2023, 13, 218. [Google Scholar] [CrossRef]
- De-Prado-Gil, J.; Martínez-García, R.; Jagadesh, P.; Juan-Valdés, A.; Gónzalez-Alonso, M.-I.; Palencia, C. To determine the compressive strength of self-compacting recycled aggregate concrete using artificial neural network (ANN). Ain Shams Eng. J. 2024, 15, 102548. [Google Scholar] [CrossRef]
- Kandiri, A.; Sartipi, F.; Kioumarsi, M. Predicting Compressive Strength of Concrete Containing Recycled Aggregate Using Modified ANN with Different Optimization Algorithms. Appl. Sci. 2021, 11, 485. [Google Scholar] [CrossRef]
- Song, H.; Ahmad, A.; Ostrowski, K.A.; Dudek, M. Analyzing the Compressive Strength of Ceramic Waste-Based Concrete Using Experiment and Artificial Neural Network (ANN) Approach. Materials 2021, 14, 4518. [Google Scholar] [CrossRef]
- Adamu, M.; Trabanpruek, P.; Jongvivatsakul, P.; Likitlersuang, S.; Iwanami, M. Mechanical performance and optimization of high-volume fly ash concrete containing plastic wastes and graphene nanoplatelets using response surface methodology. Constr. Build. Mater. 2021, 308, 125085. [Google Scholar] [CrossRef]
- Igwegbe, C.A.; Mohmmadi, L.; Ahmadi, S.; Rahdar, A.; Khadkhodaiy, D.; Dehghani, R.; Rahdar, S. Modeling of adsorption of Methylene Blue dye on Ho-CaWO4 nanoparticles using Response Surface Methodology (RSM) and Artificial Neural Network (ANN) techniques. MethodsX 2019, 6, 1779–1797. [Google Scholar] [CrossRef]
- Chindasiriphan, P.; Meenyut, B.; Orasutthikul, S.; Jongvivatsakul, P.; Tangchirapat, W. Influences of high-volume coal bottom ash as cement and fine aggregate replacements on strength and heat evolution of eco-friendly high-strength concrete. J. Build. Eng. 2023, 65, 105791. [Google Scholar] [CrossRef]
- Awolusi, T.; Oke, O.; Akinkurolere, O.; Sojobi, A. Application of response surface methodology: Predicting and optimizing the properties of concrete containing steel fibre extracted from waste tires with limestone powder as filler. Case Stud. Constr. Mater. 2018, 10, e00212. [Google Scholar] [CrossRef]
- Ayanlere, S.; Ajamu, S.; Odeyemi, S.; Ajayi, O.; Kareem, M. Effects of water-cement ratio on bond strength of concrete. Mater. Today Proc. 2023, 86, 134–139. [Google Scholar] [CrossRef]
- Habibi, A.; Ramezanianpour, A.M.; Mahdikhani, M.; Bamshad, O. RSM-based evaluation of mechanical and durability properties of recycled aggregate concrete containing GGBFS and silica fume. Constr. Build. Mater. 2020, 270, 121431. [Google Scholar] [CrossRef]
- Murali, M.; Mohammed, B.S.; Abdulkadir, I.; Liew, M.S.; Alaloul, W.S. Utilization of Crumb Rubber and High-Volume Fly Ash in Concrete for Environmental Sustainability: RSM-Based. Materials 2021, 14, 3322. [Google Scholar] [CrossRef]
- Ali, M.; Khan, M.I.; Masood, F.; Alsulami, B.T.; Bouallegue, B.; Nawaz, R.; Fediuk, R. Central composite design application in the optimization of the effect of waste foundry sand on concrete properties using RSM. Structures 2022, 46, 1581–1594. [Google Scholar] [CrossRef]
- Mohammed, B.S.; Abdulkadir, I.; Ali, M.O.A.; Liew, M.S. Mechanical, Microstructural and Drying Shrinkage Properties of NaOH-Pretreated Crumb Rubber Concrete: RSM-Based. Materials 2022, 15, 2588. [Google Scholar] [CrossRef]
- Bheel, N.; Waqar, A.; Radu, D.; Benjeddou, O.; Alwetaishi, M.; Almujibah, H.R. A comprehensive study on the impact of nano-silica and ground granulated blast furnace slag on high strength concrete characteristics: RSM modeling and optimization. Structures 2024, 62, 106160. [Google Scholar] [CrossRef]
- Shi, J.; Zhao, L.; Han, C.; Han, H. The effects of silanized rubber and nano-SiO2 on microstructure and frost resistance characteristics of concrete using response surface methodology (RSM). Constr. Build. Mater. 2022, 344, 128226. [Google Scholar] [CrossRef]
- Ho, C.; Doh, S.; Chin, S.; Li, X. Prediction of concrete residual compressive strength under elevated temperatures: Response surface methodology (RSM) approach. Mater. Today Proc. 2023. [Google Scholar] [CrossRef]
- Keshavarz, Z. Application of ANN and ANFIS Models in Determining Compressive Strength of Concrete. J. Soft Comput. Civ. Eng. 2018, 1, 62–70. [Google Scholar]
- Armaghani, D.J.; Asteris, P.G. A comparative study of ANN and ANFIS models for the prediction of cement-based mortar materials compressive strength. Neural Comput. Appl. 2020, 33, 4501–4532. [Google Scholar] [CrossRef]
- Qiao, L.; Miao, P.; Xing, G.; Luo, X.; Ma, J.; Farooq, M.A. Interpretable machine learning model for predicting freeze-thaw damage of dune sand and fiber reinforced concrete. Case Stud. Constr. Mater. 2023, 19, e02453. [Google Scholar] [CrossRef]
- Ahmad, W.; Ahmad, A.; Ostrowski, K.A.; Aslam, F.; Joyklad, P.; Zajdel, P. Application of Advanced Machine Learning Approaches to Predict the Compressive Strength of Concrete Containing Supplementary Cementitious Materials. Materials 2021, 14, 5762. [Google Scholar] [CrossRef]
- De-Prado-Gil, J.; Palencia, C.; Silva-Monteiro, N.; Martínez-García, R. To predict the compressive strength of self compacting concrete with recycled aggregates utilizing ensemble machine learning models. Case Stud. Constr. Mater. 2022, 16, e01046. [Google Scholar] [CrossRef]
- Long, X.; Cai, L.; Li, W. RSM-based assessment of pavement concrete mechanical properties under joint action of corrosion, fatigue, and fiber content. Constr. Build. Mater. 2019, 197, 406–420. [Google Scholar] [CrossRef]
- Rizalman, A.N.; Lee, C.C. Comparison of Artificial Neural Network (ANN) and Response Surface Methodology (RSM) in Predicting the Compressive Strength of POFA Concrete. Appl. Model. Simul. 2020, 4, 210–216. [Google Scholar]
- ACI 440.1R-15; Guide for the Design and Construction of Structural Concrete Reinforced with FRP Bars. ACI Committee 440: Farmington Hills, MI, USA, 2015.
- Lee, J.-Y.; Kim, T.-Y.; Kim, T.-J.; Yi, C.-K.; Park, J.-S.; You, Y.-C.; Park, Y.-H. Interfacial bond strength of glass fiber reinforced polymer bars in high-strength concrete. Compos. Part B Eng. 2008, 39, 258–270. [Google Scholar] [CrossRef]
- Maguteeswaran, R.; Sridhar, J.; Gangadevi, R.; Malathi, N.; Sujatha, M.; Sivakumar, V. Prediction of moment capacity of ferrocement composites with chicken mesh and steel slag using response surface methodology and artificial neural network. Rev. Mater. 2024, 29. [Google Scholar] [CrossRef]
- Zaid, O.; Palencia, C. Prediction of Splitting Tensile Strength of Self-Compacting Recycled Aggregate Concrete Using Novel Deep Learning Methods. Mathematics 2022, 10, 2245. [Google Scholar] [CrossRef]
- Nguyen, T.A.; Ly, H.B. Estimation of the bond strength between FRP and concrete using ANFIS and hybridized ANFIS machine learning models. J. Sci. Transp. Technol. 2021, 1, 36–47. [Google Scholar] [CrossRef]
- Shafighfard, T.; Kazemi, F.; Asgarkhani, N.; Yoo, D.Y. Machine-learning methods for estimating compressive strength of high-performance alkali-activated concrete. Eng. Appl. Artif. Intell. 2024, 136, 109053. [Google Scholar] [CrossRef]
- Kumar, S.; Ranjan, D.; Wipulanusat, W. Development of ANN-based metaheuristic models for the study of the durability characteristics of high-volume fly ash self-compacting concrete with silica fume. J. Build. Eng. 2024, 94, 109844. [Google Scholar] [CrossRef]
- Zamir Hashmi, S.R.; Khan, M.I.; Khahro, S.H.; Zaid, O.; Shahid Siddique, M.; Md Yusoff, N.I. Prediction of Strength Properties of Concrete Containing Waste Marble Aggregate and Stone Dust—Modeling and Optimization Using RSM. Materials 2022, 15, 8024. [Google Scholar] [CrossRef]
- Ali, S.; Afzali, E.; Ali, M.; Ghanooni-bagha, M.; Golafshani, E.; Ngo, T. The use of machine learning techniques to investigate the properties of metakaolin-based geopolymer concrete. J. Clean. Prod. 2024, 446, 141305. [Google Scholar] [CrossRef]
- Jahangir, H.; Rezazadeh, D. A new and robust hybrid artificial bee colony algorithm—ANN model for FRP-concrete bond strength evaluation. Compos. Struct. 2021, 257, 113160. [Google Scholar] [CrossRef]
- Farooq, F.; Nasir Amin, M.; Khan, K.; Rehan Sadiq, M.; Faisal Javed, M.; Aslam, F.; Alyousef, R. A Comparative Study of Random Forest and Genetic Engineering Programming for the Prediction of Compressive Strength of High Strength Concrete (HSC). Appl. Sci. 2020, 10, 7330. [Google Scholar] [CrossRef]
- Liu, K.; Alam, M.S.; Zhu, J.; Zheng, J.; Chi, L. Prediction of carbonation depth for recycled aggregate concrete using ANN hybridized with swarm intelligence algorithms. Constr. Build. Mater. 2021, 301, 124382. [Google Scholar] [CrossRef]
- Parhi, S.K.; Patro, S.K. Application of R-curve, ANCOVA, and RSM techniques on fracture toughness enhancement in PET fiber-reinforced concrete. Constr. Build. Mater. 2024, 411, 134644. [Google Scholar] [CrossRef]
- Asif, U.; Javed, M.F.; Abuhussain, M.; Ali, M.; Khan, W.A.; Mohamed, A. Predicting the mechanical properties of plastic concrete: An optimization method by using genetic programming and ensemble learners. Case Stud. Constr. Mater. 2024, 20, e03135. [Google Scholar] [CrossRef]
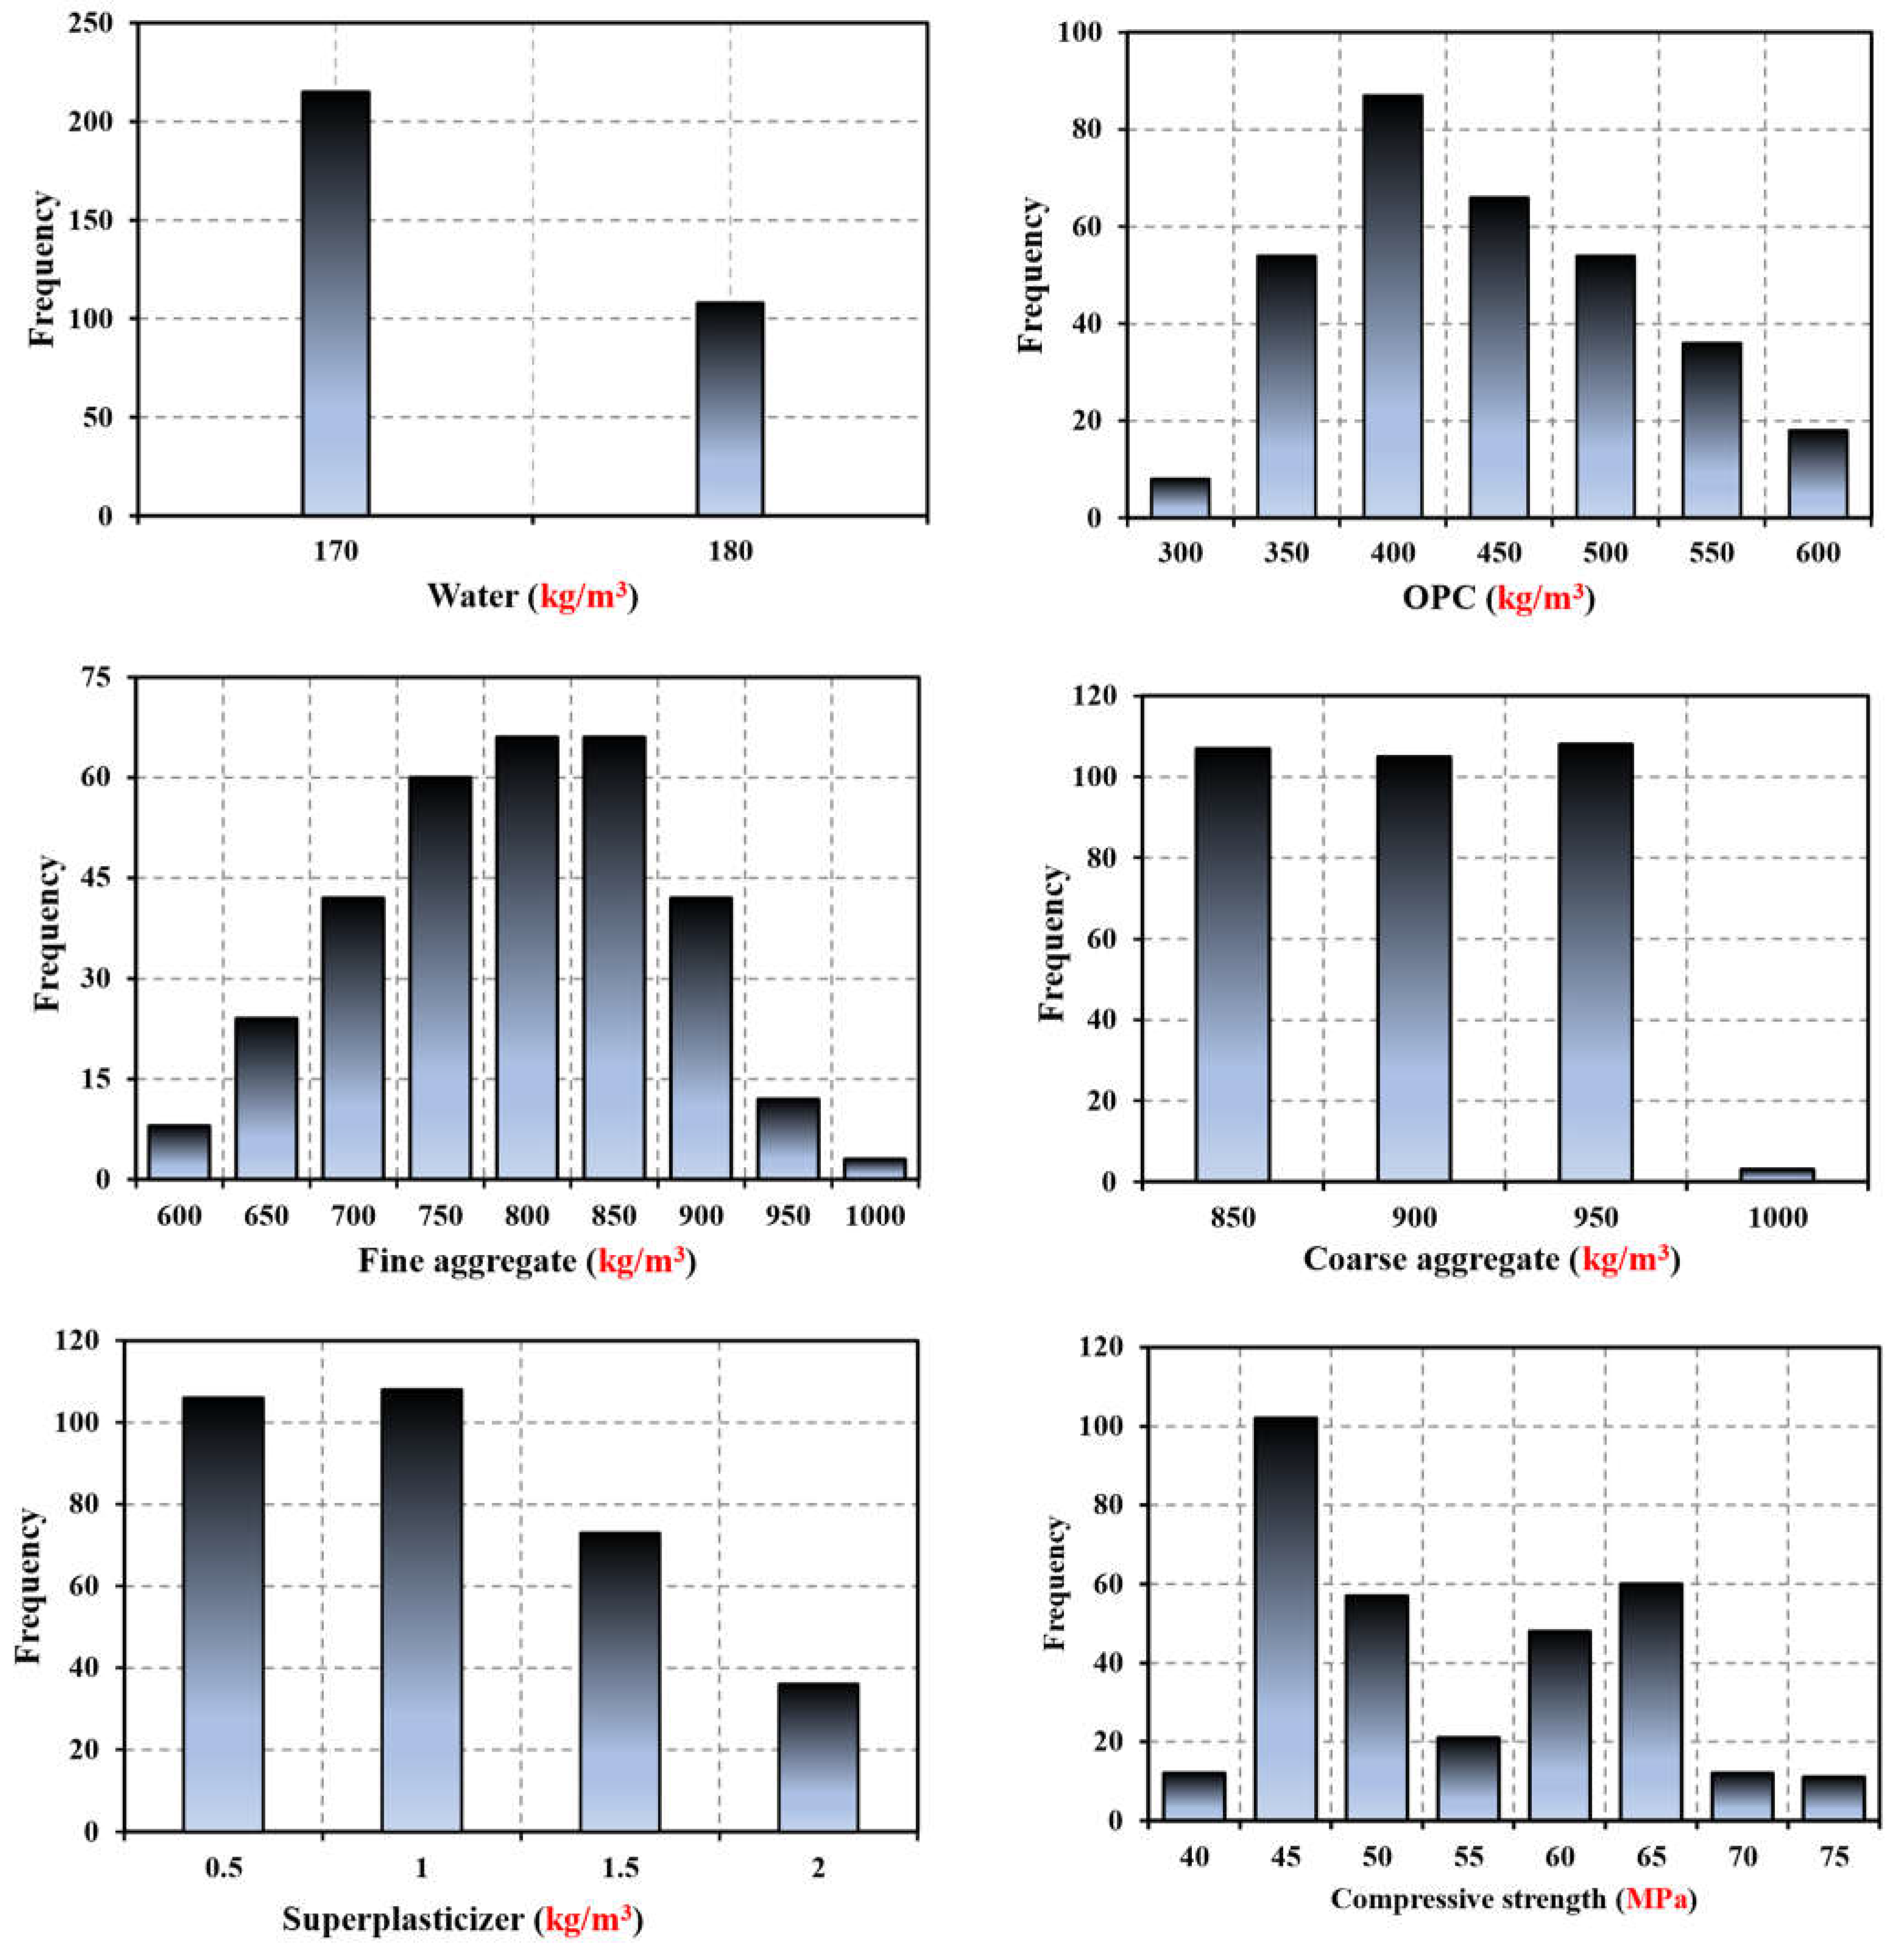


| Water (kg/m3) | OPC (kg/m3) | F.A (kg/m3) | C.A (kg/m3) | SP (kg/m3) | CS (MPa) | |
|---|---|---|---|---|---|---|
| Mean | 170 | 417.81 | 767.71 | 898.51 | 0.95 | 51.93 |
| Median | 170 | 411 | 769.5 | 898 | 1 | 48.9 |
| SD | 8.18 | 77.03 | 85.45 | 43.82 | 0.55 | 9.45 |
| Minimum | 160 | 284 | 552 | 845 | 0 | 37.5 |
| Maximum | 180 | 600 | 951 | 989 | 2 | 73.6 |
| Type | Input | Input | Input | Input | Input | Output |
| Response | Factor | Code | Factors Level of Code | |||
|---|---|---|---|---|---|---|
| Low Level −1 | Intermediate Level 0 | High Level +1 | ||||
| Compressive strength | Response 1 | Cement (kg/m3) | A | 427 | 497 | 567 |
| F.A (kg/m3) | B | 608 | 706.5 | 805 | ||
| C.A (kg/m3) | C | 845 | 897.5 | 950 | ||
| Response 2 | Cement (kg/m3) | A | 366 | 483 | 600 | |
| F.A (kg/m3) | B | 522 | 694.5 | 867 | ||
| C.A (kg/m3) | C | 845 | 897.5 | 950 | ||
| Response 3 | Cement (kg/m3) | A | 389 | 451.5 | 514 | |
| F.A (kg/m3) | B | 628 | 723 | 818 | ||
| C.A (kg/m3) | C | 845 | 897.5 | 950 | ||
| Response 4 | Cement (kg/m3) | A | 320 | 385 | 450 | |
| F.A (kg/m3) | B | 686 | 800 | 914 | ||
| C.A (kg/m3) | C | 845 | 917 | 989 | ||
| Response 5 | Cement (kg/m3) | A | 284 | 331 | 378 | |
| F.A (kg/m3) | B | 790 | 870.5 | 951 | ||
| C.A (kg/m3) | C | 845 | 897.5 | 950 | ||
| Response 6 | Cement (kg/m3) | A | 302 | 351 | 400 | |
| F.A (kg/m3) | B | 731 | 797 | 863 | ||
| C.A (kg/m3) | C | 845 | 897.5 | 950 | ||
| R | MSE | |
|---|---|---|
| Training | 0.996 | 0.987 |
| Validation | 0.995 | 0.417 |
| Testing | 0.995 | 0.457 |
| All | 0.998 | --- |
| Machine Learning Algorithm | NO. Sample | Variable Concrete Content | R2-Value | Ref. |
|---|---|---|---|---|
| ANN | 150 | Waste marble powder, cement, superplasticizer, silica fume, fly ash, water. | 0.976 | [60] |
| ANN | 239 | Cement, coarse, fine aggregate, and w/c | 0.85 | [71] |
| ANN | 300 | Cement, fly ash, coarse, fine aggregate, superplasticizer, and w/c | 0.933 | [72] |
| ANN | 103 | External diameter of CFST composite column filled with recycled concrete, the thickness of the steel tube, length of specimen, the proportion of replaced recycled coarse aggregates, compressive strength of recycled concrete, and yield stress of the steel tube | 0.988 | [73] |
| ANN | 13 | W/c, cement, water, coarse, fine aggregate, and condensed milk can (tin) fibers | 0.982 | [74] |
| ANN | 40 | Beam dimensions, compressive strength of SCGC under ambient and marine exposure conditions, time of exposure, the tensile strength of the BFRP bar, tensile strength of steel reinforcement bar, and shear span–depth ratio | 0.958 | [75] |
| ANN | 50 | Cement, water, sand, aggregate, w/b, and eggshell powder | 0.825 | [76] |
| ANN | 17 | Cement, w/c, coarse, fine aggregate, and foam volume | 0.98 | [77] |
| ANN | 55 | Cement, admixtures, water, coarse, fine aggregate, and superplasticizer | 0.929 | [78] |
| ANN | 234 | Testing age, OPC, sand, coarse aggregate, fine aggregate, w/c, SP/C, CRA/total coarse aggregate, and FRA/total fine aggregate | 0.984 | [79] |
| ANN | 17 | Cement, water, natural coarse aggregates, recycled coarse aggregates, and natural sand | 0.994 | [80] |
| ANN | 60 | Cement, admixtures, water, coarse, fine aggregate, and waste | 0.67 | [61] |
| ANN | 220 | Sand/cement ratio, dry density, and water/cement ratio | 0.972 | [81] |
| ANN | 324 | Cement, water, coarse, fine aggregate, and superplasticizer | 0.998 | The current study |
| Response 1 | Response 2 | ||||||||||
| Source | S.S | M.S | F-value | p-value | Source | S.S | M.S | F-value | p-value | ||
| Model | 169.21 | 18.00 | 1.48 | 0.028 | Significant | Model | 20.55 | 2.280 | 4.92 | 0.01 | Significant |
| A-cement | 20.74 | 20.740 | 1.63 | 0.231 | A-Cement | 4.76 | 4.76 | 10.27 | 0.00 | ||
| B-FA | 0.441 | 0.441 | 0.035 | 0.856 | B-FA | 0.025 | 0.025 | 0.054 | 0.822 | ||
| C-CA | 0.081 | 0.081 | 0.006 | 0.938 | C-CA | 0.001 | 0.001 | 0.002 | 0.964 | ||
| AB | 0.061 | 0.061 | 0.005 | 0.946 | AB | 0.101 | 0.101 | 0.218 | 0.651 | ||
| AC | 9.46 | 9.46 | 0.744 | 0.409 | AC | 0.151 | 0.151 | 0.326 | 0.581 | ||
| BC | 6.66 | 6.66 | 0.524 | 0.486 | BC | 0.151 | 0.151 | 0.326 | 0.581 | ||
| A2 | 7.28 | 7.28 | 0.572 | 0.467 | A2 | 6 | 6 | 12.940 | 0.005 | ||
| B2 | 15.54 | 15.54 | 1.22 | 0.295 | B2 | 3.19 | 3.19 | 6.88 | 0.026 | ||
| C2 | 10.75 | 10.75 | 0.845 | 0.38 | C2 | 3.47 | 3.470 | 7.47 | 0.022 | ||
| Residual | 127.24 | 12.72 | R2 | 0.986 | Residual | 4.64 | 0.464 | R2 | 0.916 | ||
| Lack of Fit | 127.24 | 25.45 | Adj. R2 | 0.973 | Lack of Fit | 4.64 | 0.928 | Adj. R2 | 0.901 | ||
| Cor Total | 296.45 | Pred. R2 | 0.963 | Cor Total | 25.190 | Pred. R2 | 0.887 | ||||
| Response 3 | Response 4 | ||||||||||
| Source | S.S | M.S | F-value | p-value | Source | S.S | M.S | F-value | p-value | ||
| Model | 268.15 | 89.38 | 6.96 | 0.003 | Significant | Model | 14.51 | 1.61 | 3.880 | 0.023 | Significant |
| A-Cement | 258.06 | 258.06 | 20.1 | 0.001 | A-Cement | 8.65 | 8.65 | 20.81 | 0.001 | ||
| B-FA | 4.76 | 4.76 | 0.371 | 0.551 | B-FA | 0.361 | 0.361 | 0.869 | 0.373 | ||
| C-CA | 5.33 | 5.33 | 0.415 | 0.529 | C-CA | 0.009 | 0.009 | 0.022 | 0.886 | ||
| Residual | 205.38 | 12.84 | AB | 0.72 | 0.72 | 1.73 | 0.218 | ||||
| Lack of Fit | 109.97 | 10 | 0.524 | 0.827 | AC | 0.125 | 0.125 | 0.301 | 0.595 | ||
| Pure Error | 95.41 | 19.08 | R2 | 0.956 | BC | 0.605 | 0.605 | 1.46 | 0.255 | ||
| Cor Total | 473.53 | Adj. R2 | 0.9431 | Pred. R2 | 0.933 | A2 | 1.78 | 1.78 | 4.28 | 0.065 | |
| B2 | 0.975 | 0.975 | 2.35 | 0.157 | |||||||
| C2 | 0.7 | 0.7 | 1.68 | 0.224 | |||||||
| Residual | 4.16 | 0.416 | R2 | 0.942 | |||||||
| Lack of Fit | 4.16 | 0.832 | Adj. R2 | 0.924 | |||||||
| Cor Total | 18.67 | Pred. R2 | 0.90 | ||||||||
| Response 5 | Response 6 | ||||||||||
| Model | 28.570 | 3.17 | 7.940 | 0.002 | Significant | Model | 13.480 | 1.500 | 3.730 | 0.026 | Significant |
| A-Cement | 4.100 | 4.1 | 10.250 | 0.01 | A-Cement | 0.400 | 0.400 | 0.998 | 0.341 | ||
| B-FA | 0.036 | 0.036 | 0.09 | 0.77 | B-FA | 0.361 | 0.361 | 0.900 | 0.365 | ||
| C-CA | 1.600 | 1.6 | 4 | 0.073 | C-CA | 1.090 | 1.090 | 2.720 | 0.13 | ||
| AB | 0.320 | 0.32 | 0.801 | 0.392 | AB | 0.281 | 0.281 | 0.702 | 0.422 | ||
| AC | 4.810 | 4.81 | 12.03 | 0.006 | AC | 1.050 | 1.050 | 2.620 | 0.137 | ||
| BC | 0.845 | 0.845 | 2.11 | 0.177 | BC | 3.780 | 3.780 | 9.430 | 0.012 | ||
| A2 | 8.200 | 8.2 | 20.53 | 0.001 | A2 | 5.010 | 5.010 | 12.500 | 0.005 | ||
| B2 | 0.082 | 0.082 | 0.205 | 0.66 | B2 | 0.110 | 0.110 | 0.274 | 0.612 | ||
| C2 | 0.295 | 0.295 | 0.737 | 0.411 | C2 | 0.110 | 0.110 | 0.274 | 0.612 | ||
| Residual | 4 | 0.4 | R2 | 0.912 | Residual | 4.010 | 0.401 | R2 | 0.902 | ||
| Lack of Fit | 4 | 0.799 | Adj. R2 | 0.876 | Lack of Fit | 3.8 | 0.760 | Adj. R2 | 0.924 | ||
| Cor Total | 32.56 | Pred. R2 | 0.856 | Cor Total | 17.49 | Pred. R2 | 0.9 | ||||
| Variable Concrete Content | R2-Value | Ref. | |
|---|---|---|---|
| RSM | Cement, recycled concrete aggregates, and slump | 0.95 | [89] |
| RSM | Pulverized fuel ash (PFA), stone powder (SP), and silicon fume (SC) | 0.85 | [45] |
| RSM | Recycled concrete aggregates, silica fume, and ground-granulated blast-furnace slag | 0.95 | [90] |
| RSM | Crumb rubber and fly ash | 0.95 | [91] |
| RSM | Waste foundry sand and curing | 0.90 | [85] |
| RSM | Waste marble aggregate and stone dust | 0.94 | |
| RSM | Plastic, silica fume, and time | 0.94 | [92] |
| RSM | Crumb rubber (CR)–NaOH pretreatment, NaOH, and crumb rubber | 0.97 | [93] |
| RSM | Ground granulated blast furnace slag and nano silica | 0.93 | [94] |
| RSM | Content of SR, content of NS, and water binder ratio | 0.93 | [95] |
| RSM | Foam, waste marble powder, and rice husk ash | 0.94 | [96] |
| RSM | Heating temperatures, soaked time, and cooling methods | 0.79 | [97] |
| RSM | Cement, water, coarse, fine aggregate, and superplasticizer | 0.963 | The current study |
| Model | ANN | ANFIS | [53] | [93] | [103] | [97] |
|---|---|---|---|---|---|---|
| R2 | 0.998 | 0.925 | 0.92 | 0.07 | 0.89 | 0.76 |
| R | 0.998 | 0.962 | 0.959 | 0.265 | 0.944 | 0.871 |
| MSE | 0.416 | 0.655 | 1.15 | 23.05 | 5.024 | 2.8 |
| R | R2 | MSE | RMSE | MAE | erMAX | EPR | |
|---|---|---|---|---|---|---|---|
| ANN | 0.9989 | 0.98 | 0.417 | 0.646 | 0.035 | 0.045 | 1.05 |
| ANFIS | 0.926 | 0.962 | 0.655 | 0.809 | 0.045 | 0.019 | 1.813 |
Disclaimer/Publisher’s Note: The statements, opinions and data contained in all publications are solely those of the individual author(s) and contributor(s) and not of MDPI and/or the editor(s). MDPI and/or the editor(s) disclaim responsibility for any injury to people or property resulting from any ideas, methods, instructions or products referred to in the content. |
© 2024 by the authors. Licensee MDPI, Basel, Switzerland. This article is an open access article distributed under the terms and conditions of the Creative Commons Attribution (CC BY) license (https://creativecommons.org/licenses/by/4.0/).
Share and Cite
Li, T.; Yang, J.; Jiang, P.; AlAteah, A.H.; Alsubeai, A.; Alfares, A.M.; Sufian, M. Predicting High-Strength Concrete’s Compressive Strength: A Comparative Study of Artificial Neural Networks, Adaptive Neuro-Fuzzy Inference System, and Response Surface Methodology. Materials 2024, 17, 4533. https://doi.org/10.3390/ma17184533
Li T, Yang J, Jiang P, AlAteah AH, Alsubeai A, Alfares AM, Sufian M. Predicting High-Strength Concrete’s Compressive Strength: A Comparative Study of Artificial Neural Networks, Adaptive Neuro-Fuzzy Inference System, and Response Surface Methodology. Materials. 2024; 17(18):4533. https://doi.org/10.3390/ma17184533
Chicago/Turabian StyleLi, Tianlong, Jianyu Yang, Pengxiao Jiang, Ali H. AlAteah, Ali Alsubeai, Abdulgafor M. Alfares, and Muhammad Sufian. 2024. "Predicting High-Strength Concrete’s Compressive Strength: A Comparative Study of Artificial Neural Networks, Adaptive Neuro-Fuzzy Inference System, and Response Surface Methodology" Materials 17, no. 18: 4533. https://doi.org/10.3390/ma17184533