

Degree of Hydration, Microstructure, and Mechanical Properties of Cement-Modified TiO2 Nanoparticles

Abstract
1. Introduction
2. Experimental Details
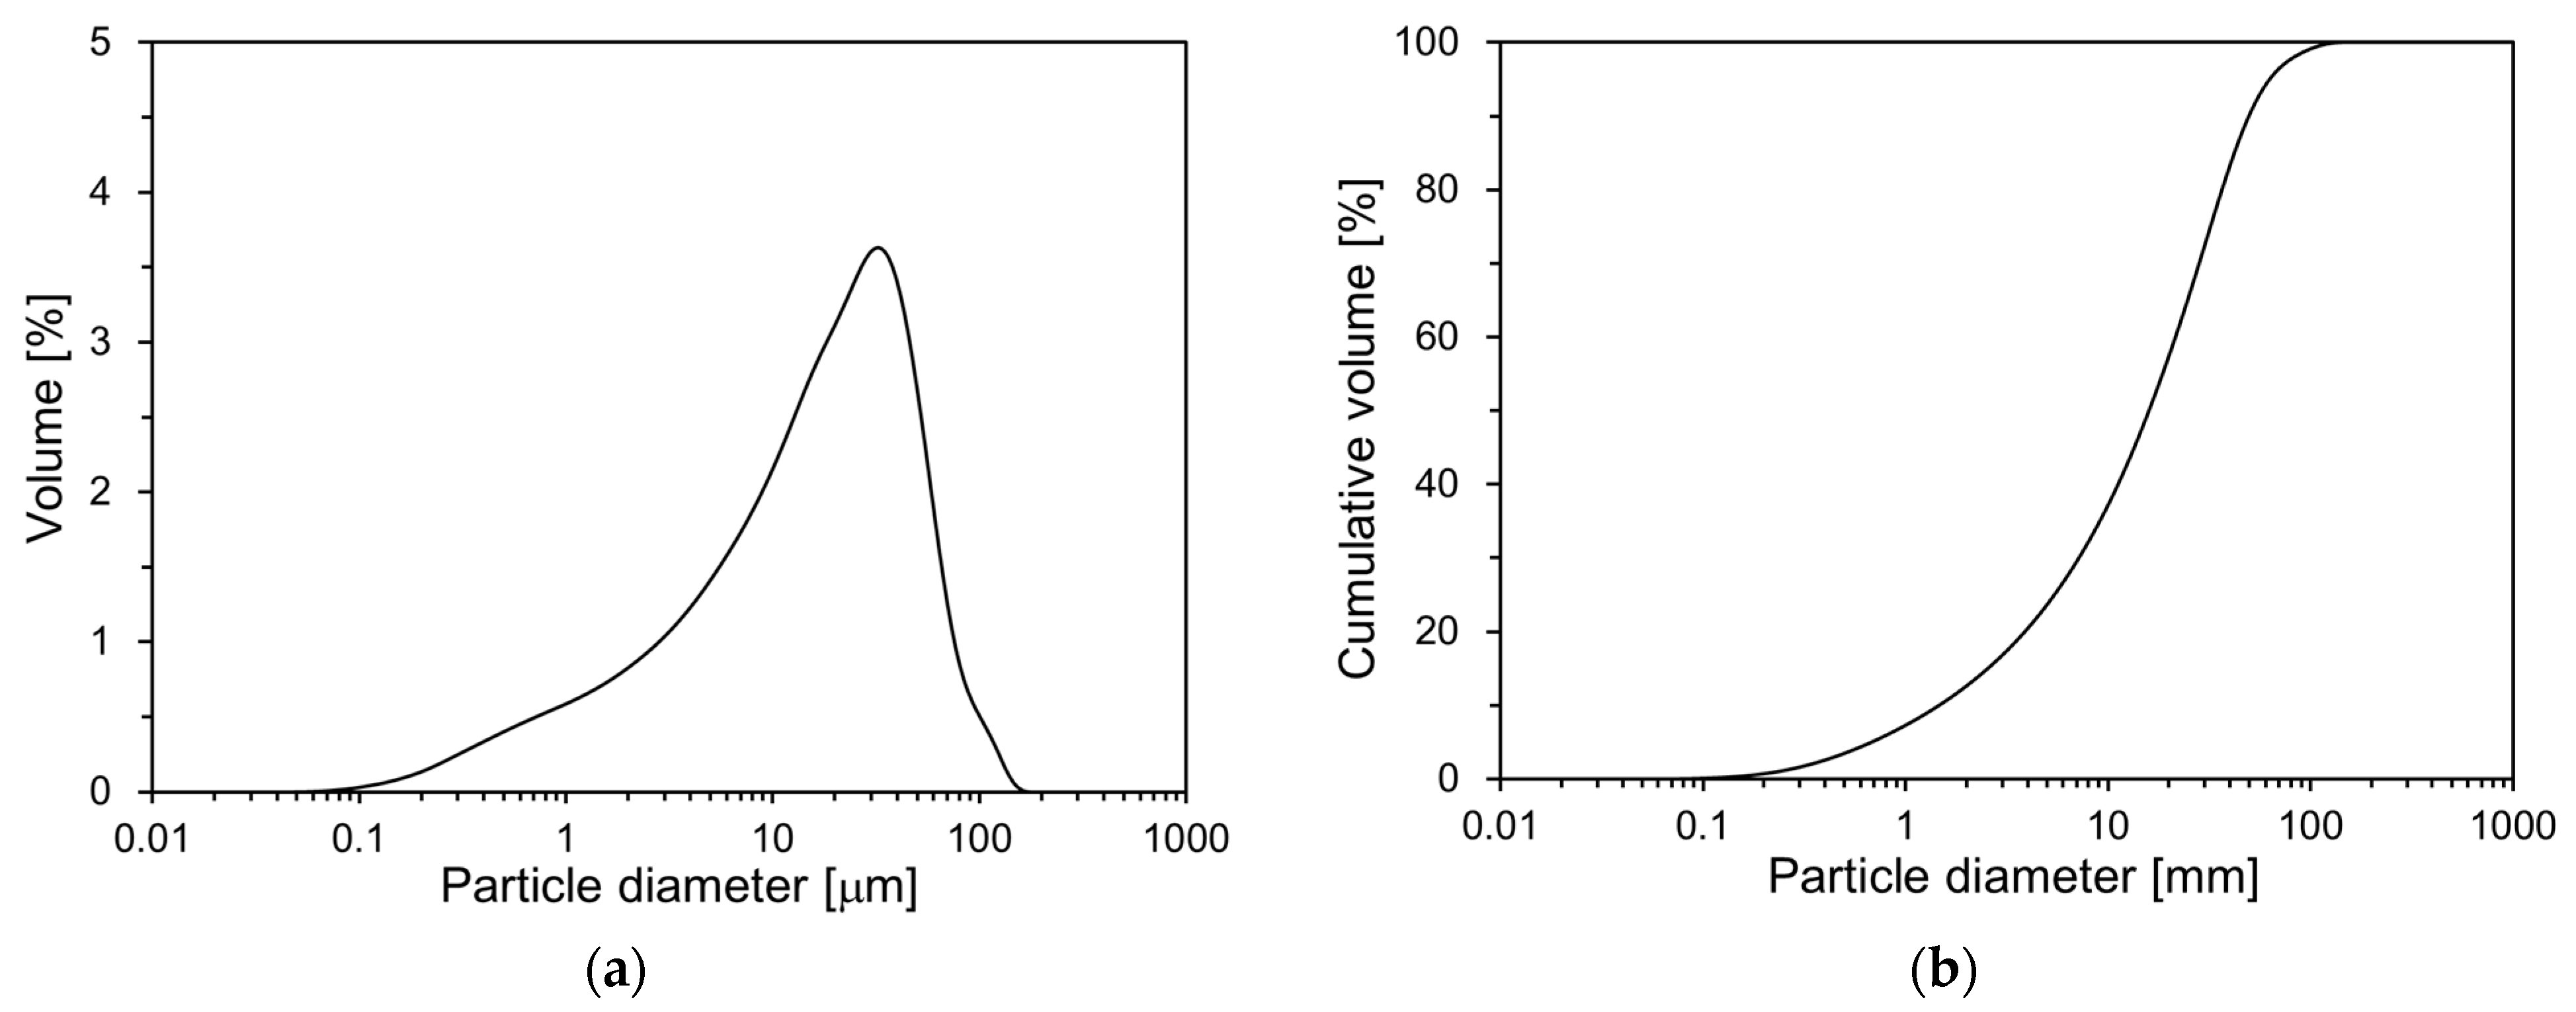
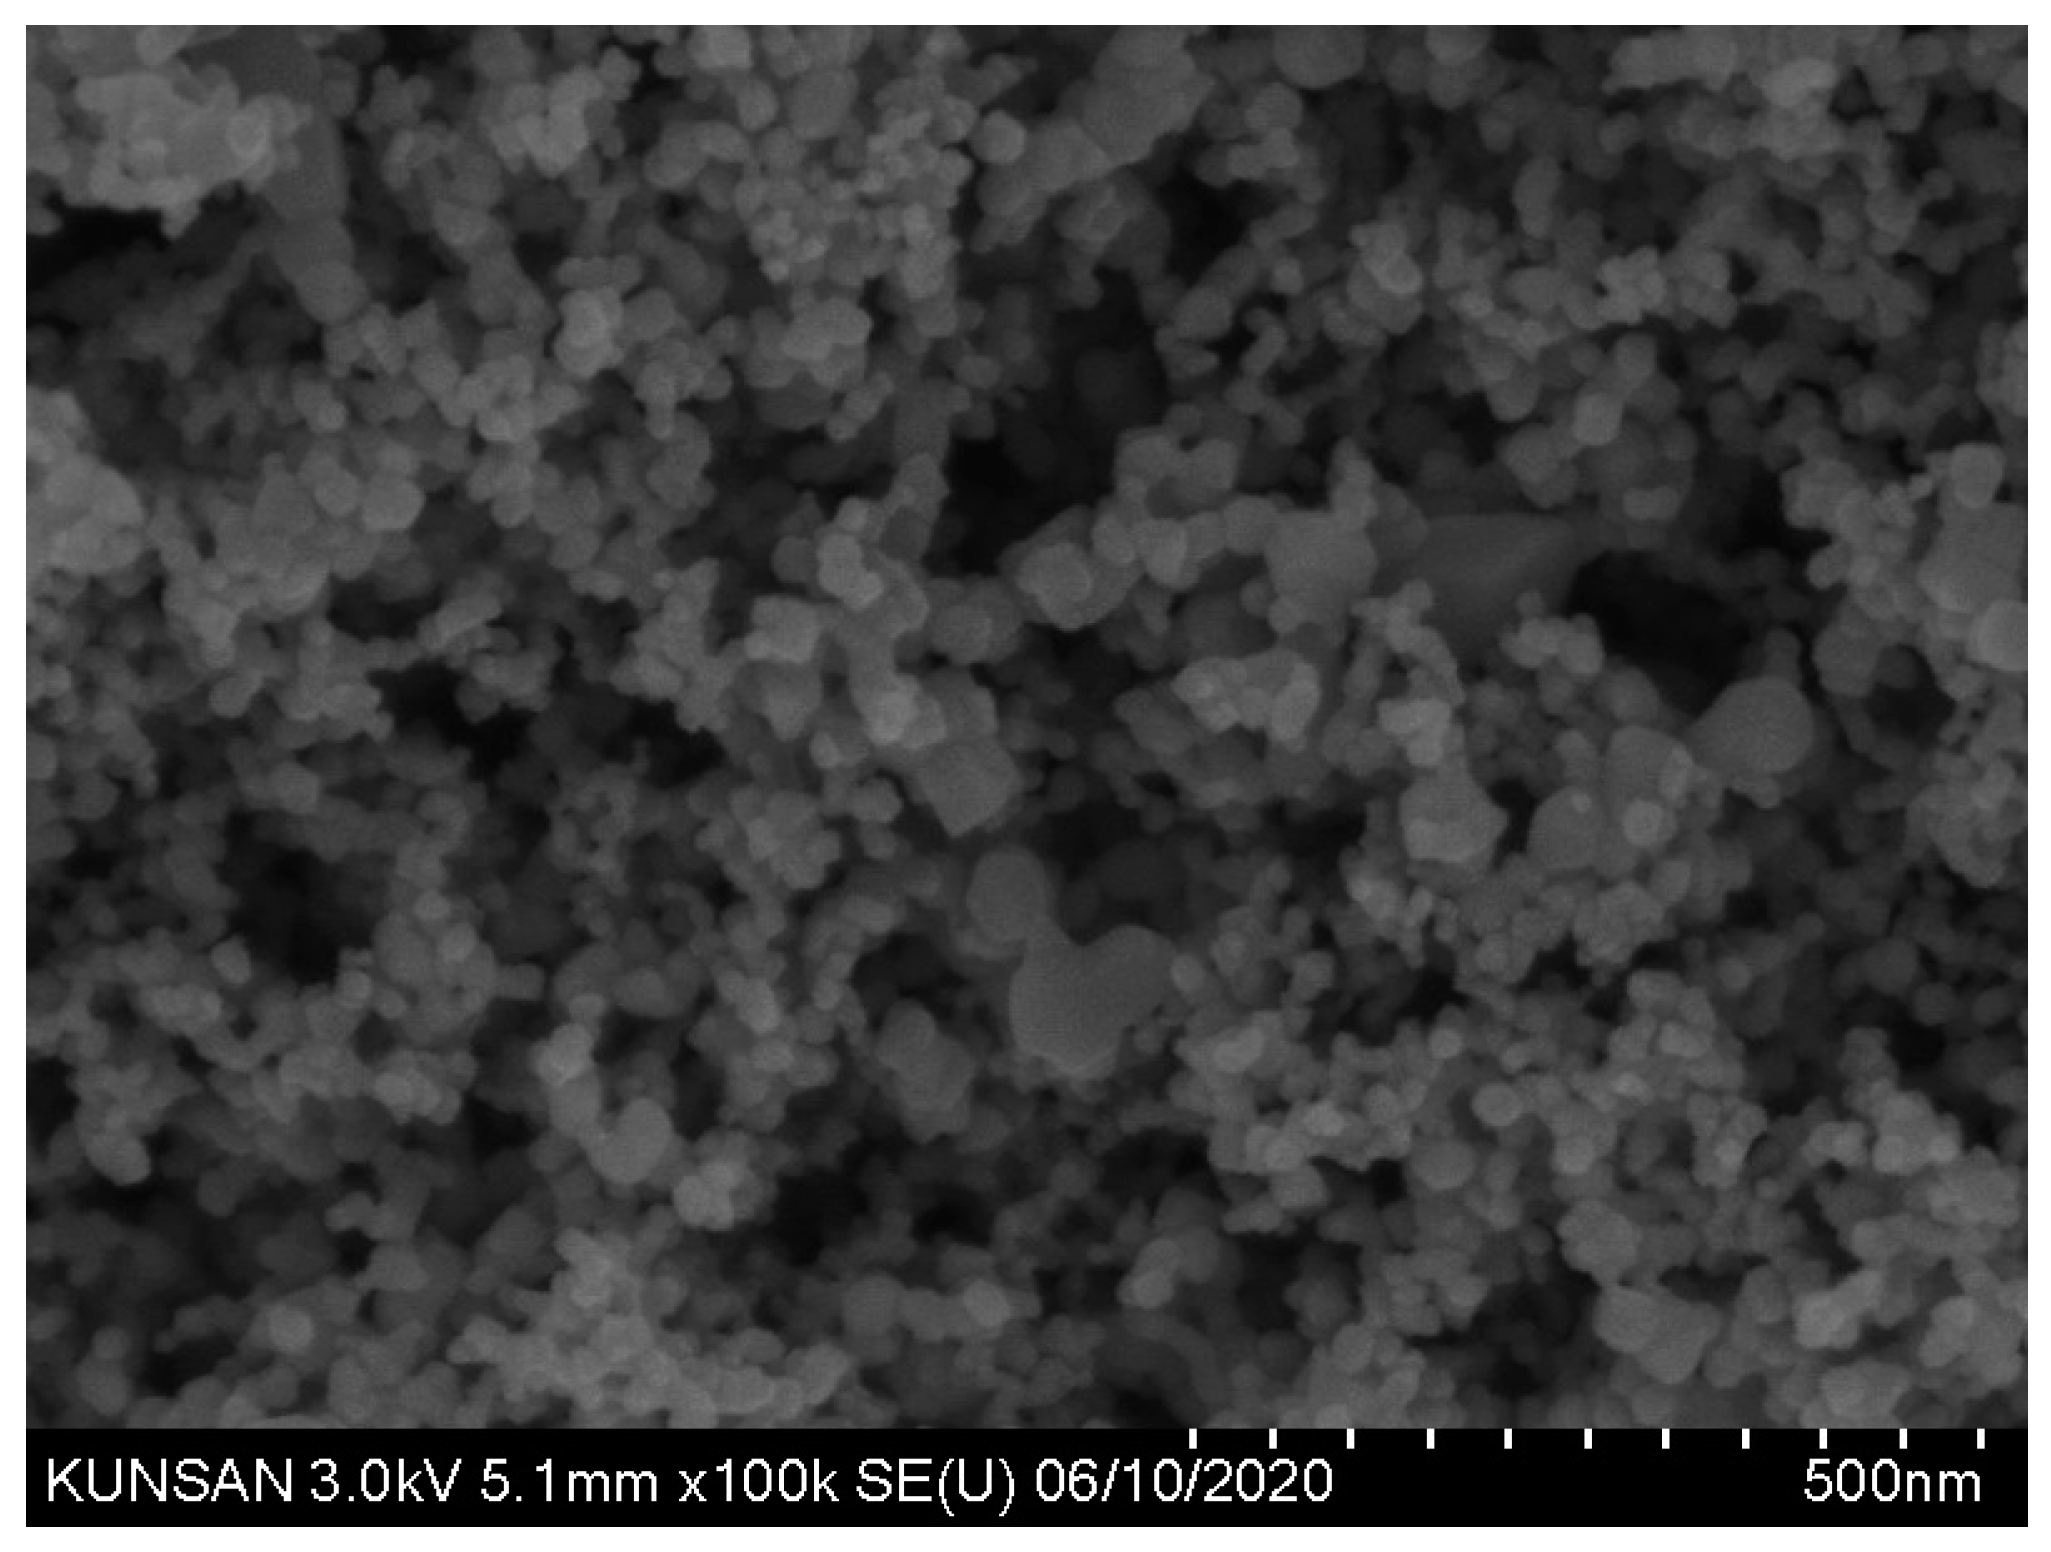
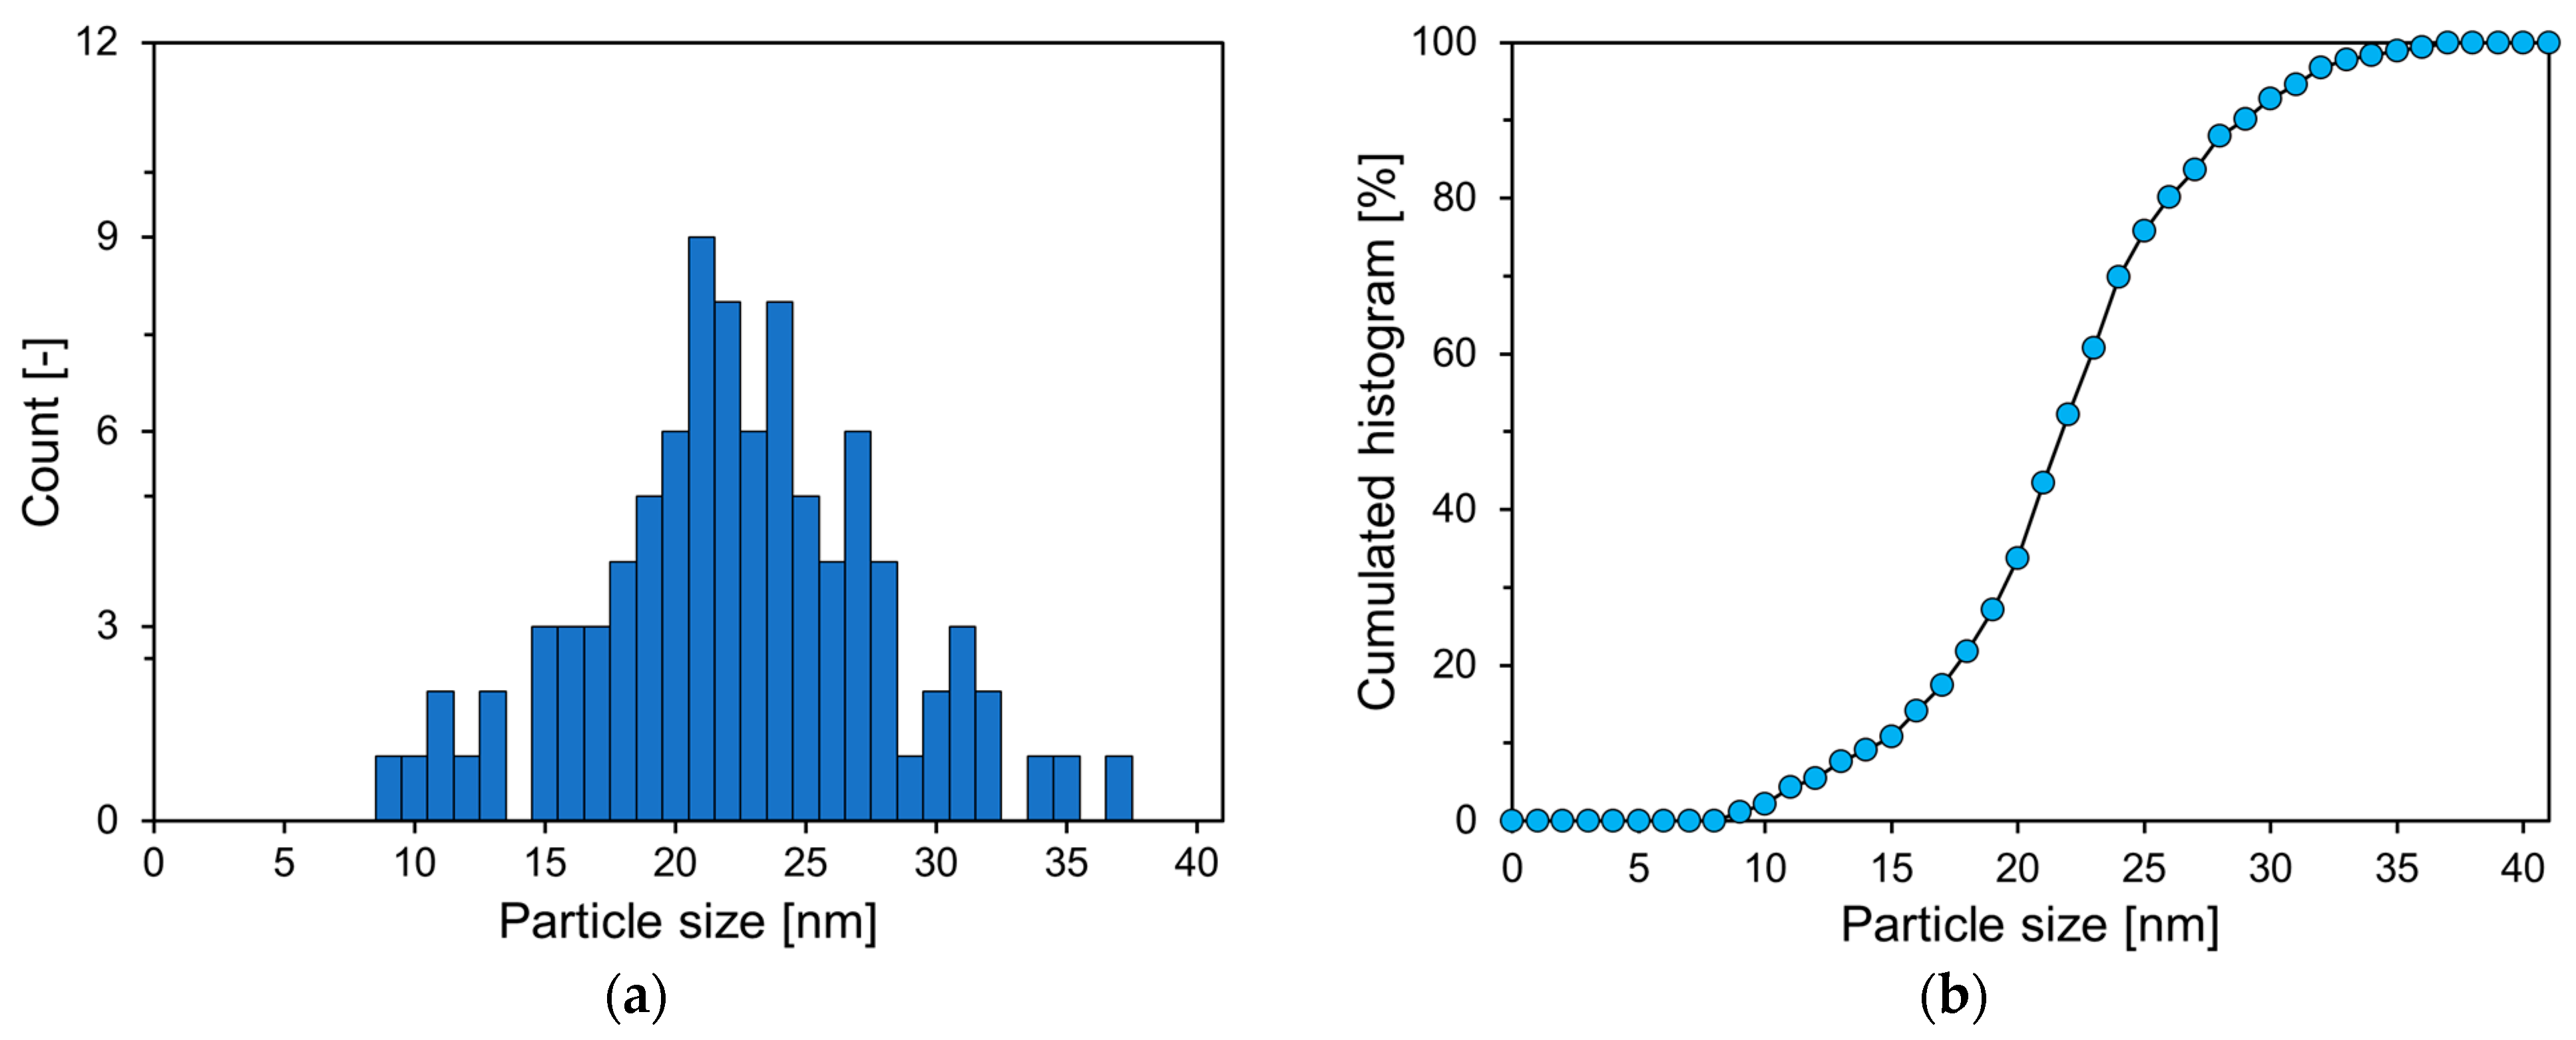
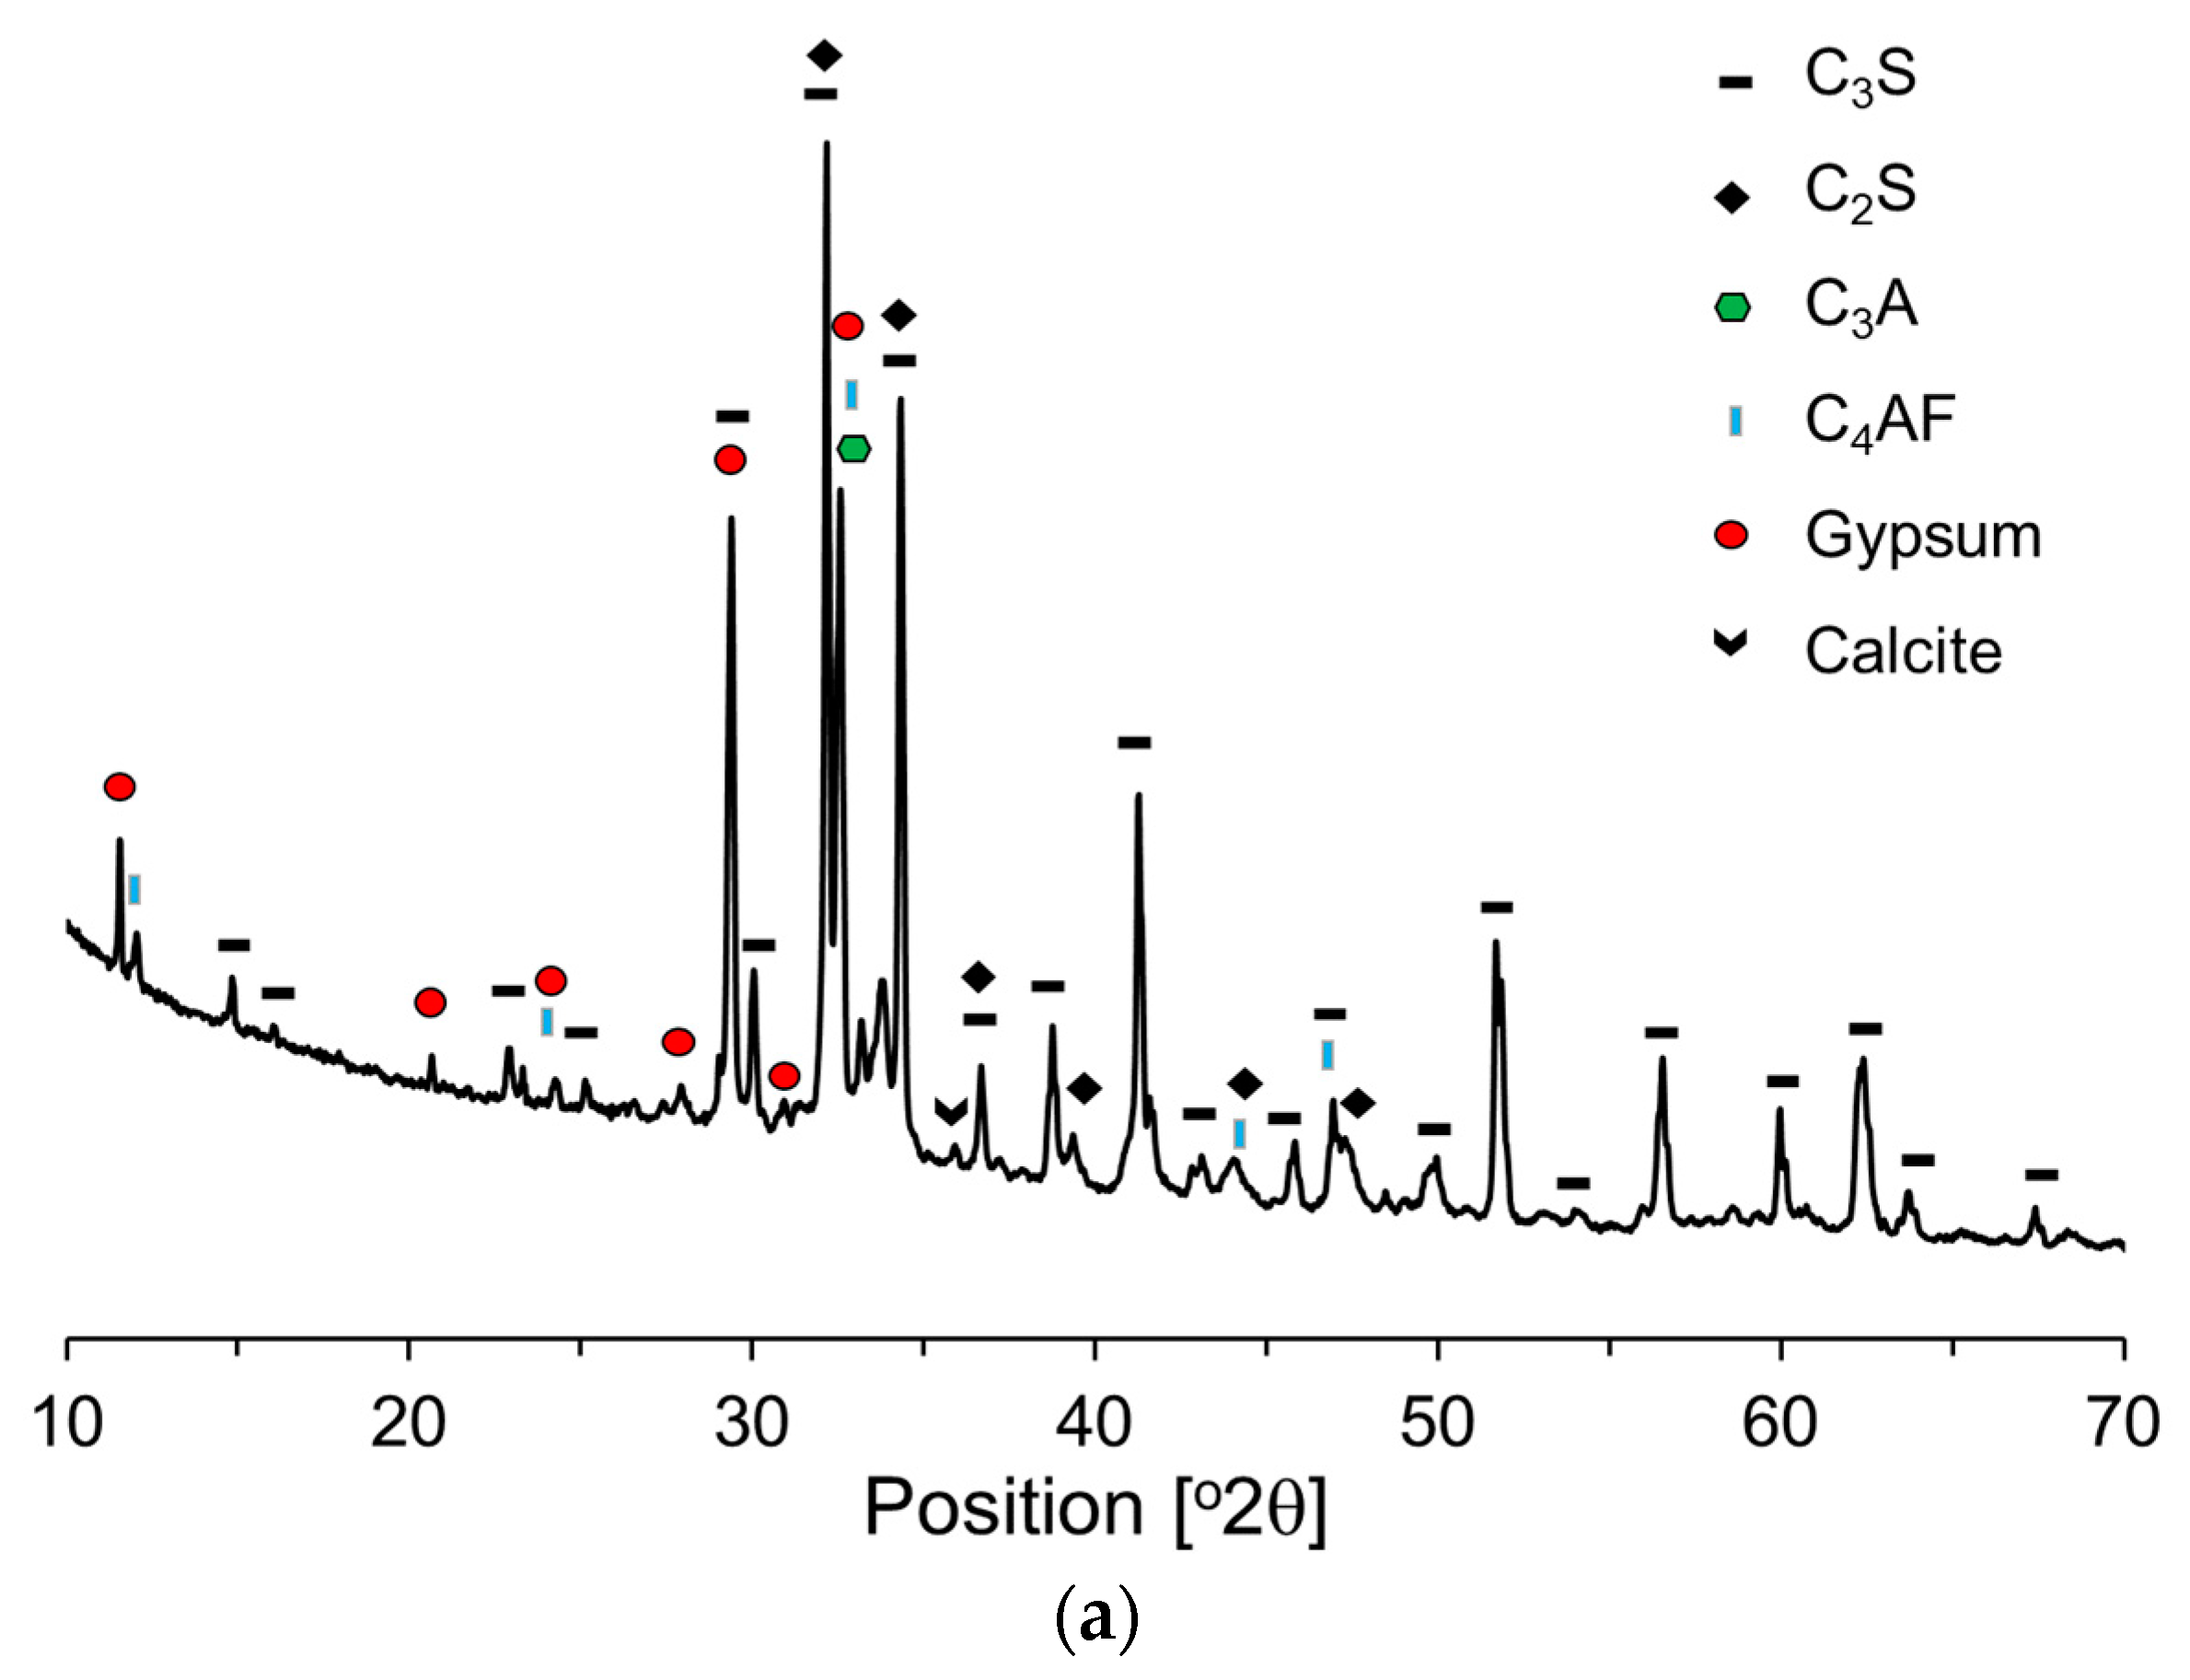
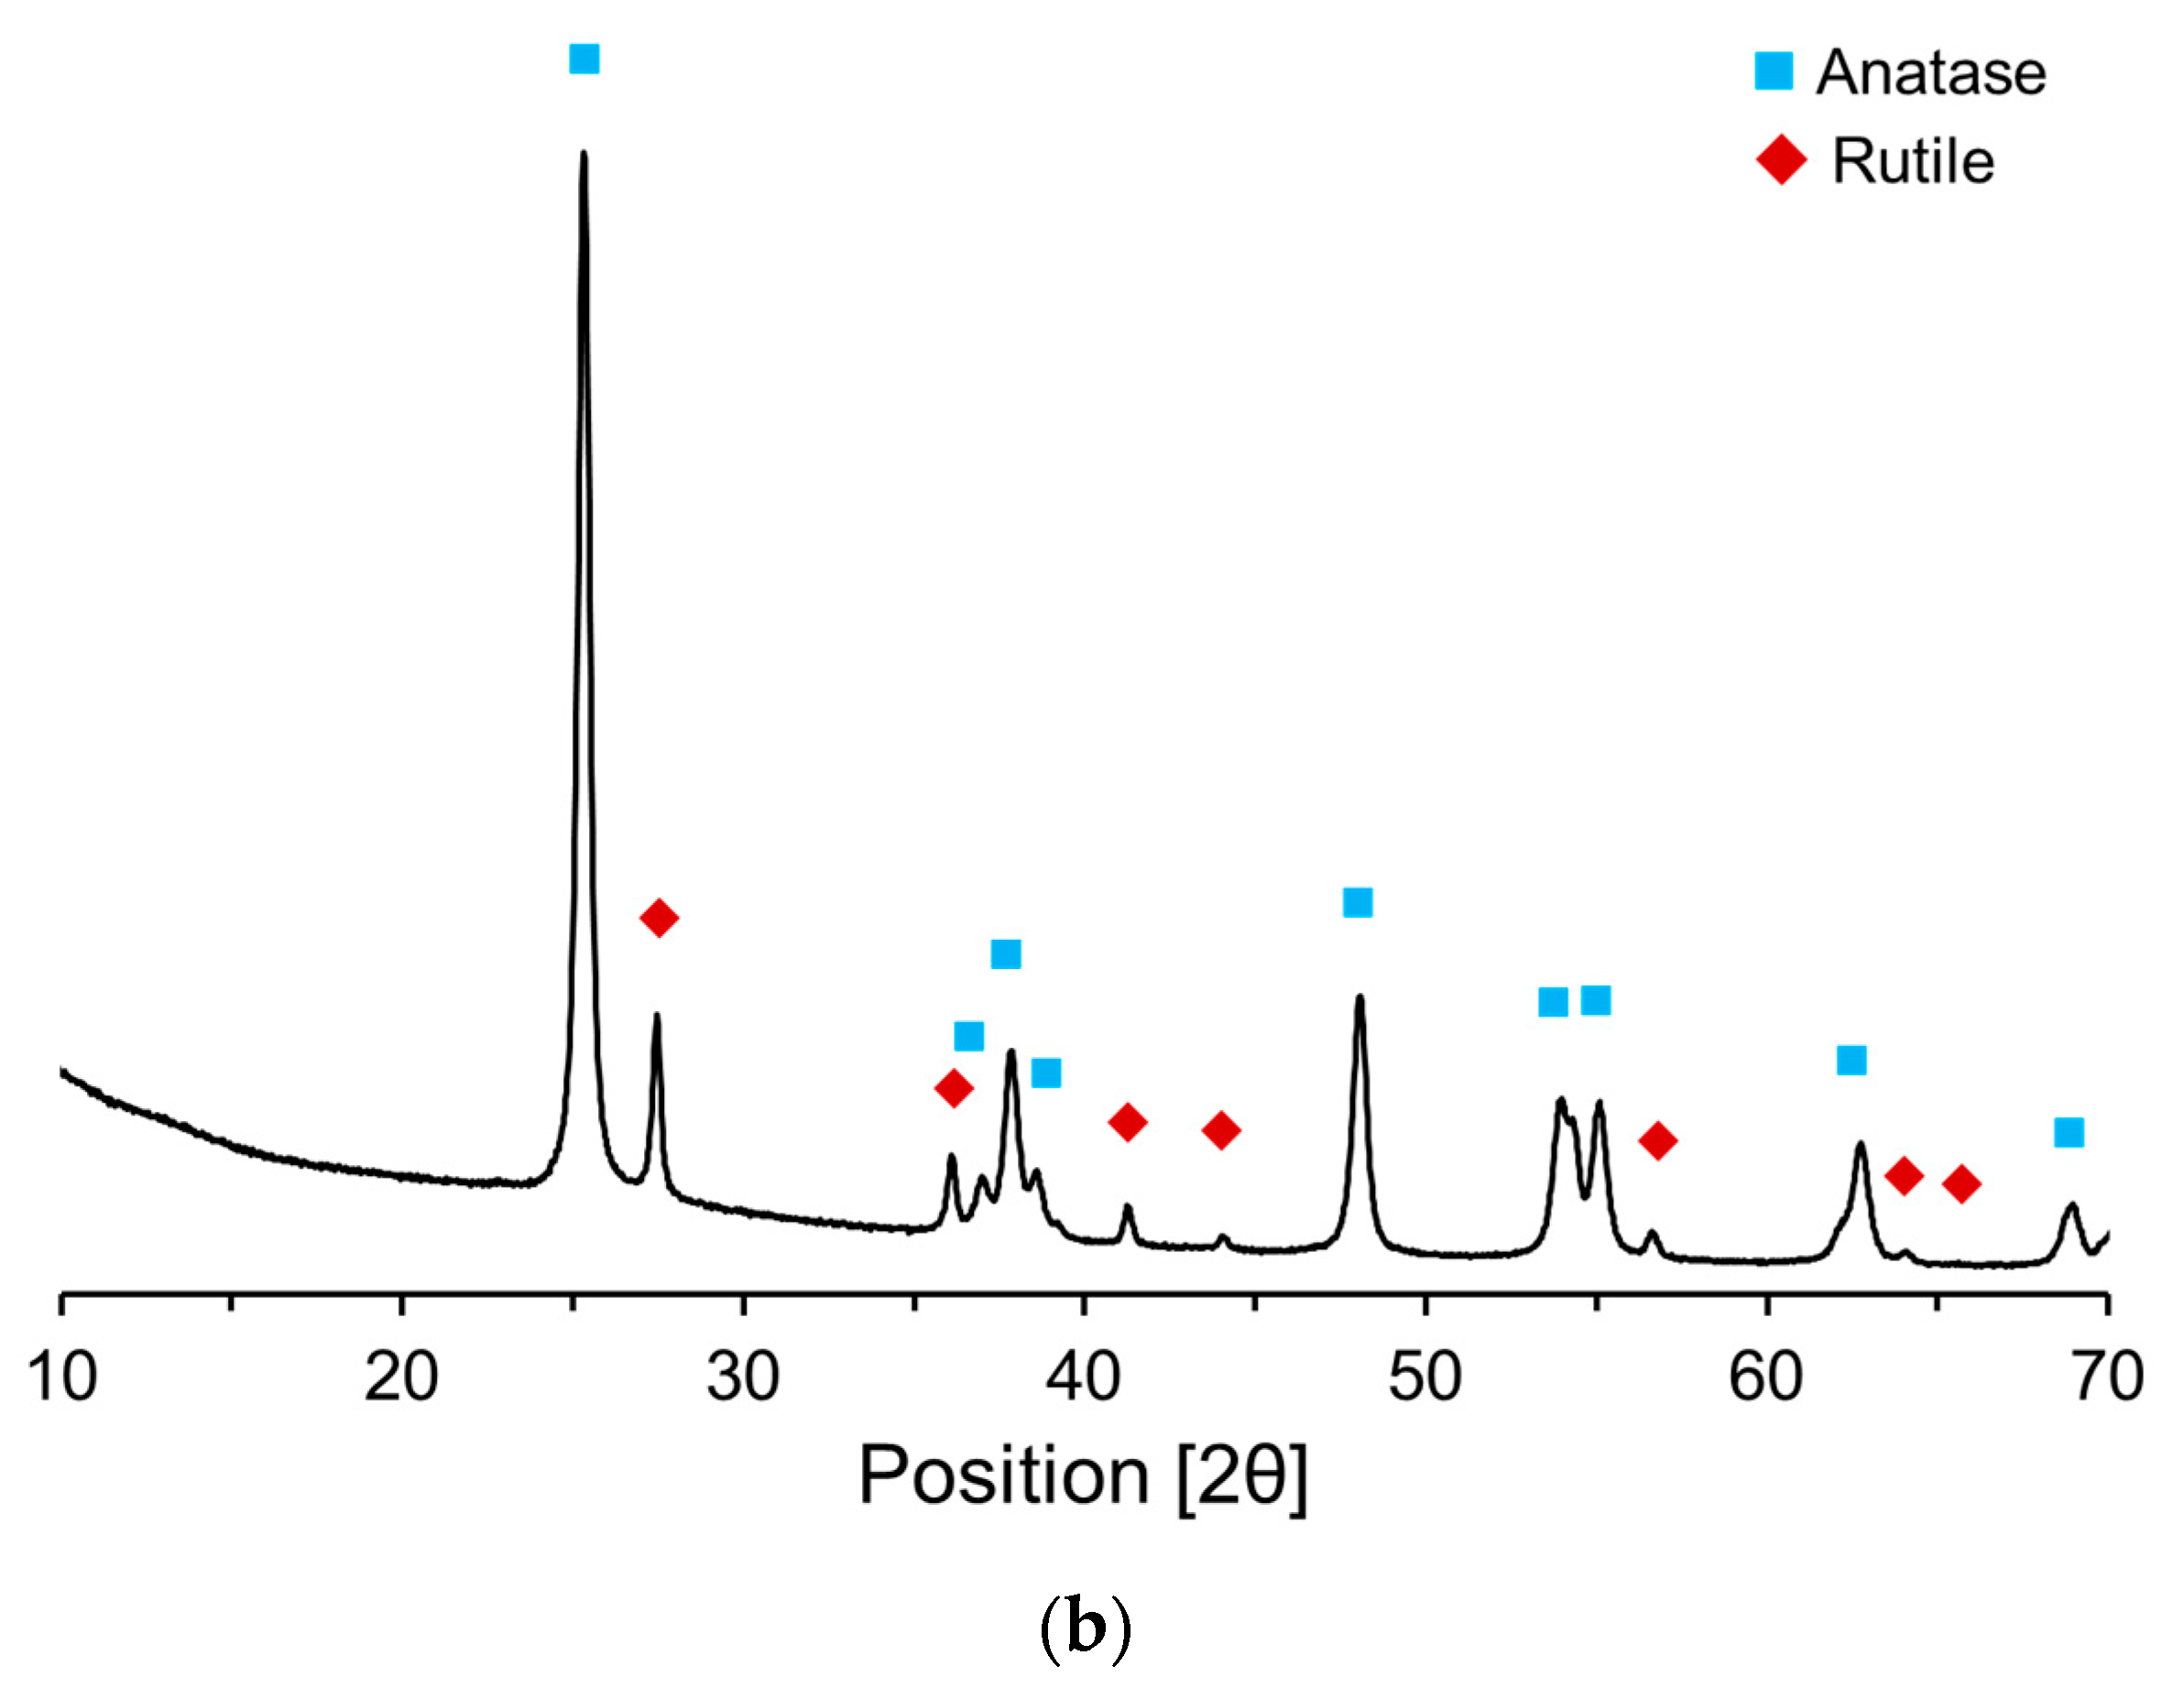
2.1. Materials
2.2. Mixture Proportions
2.3. Test Methods
3. Results and Discussion
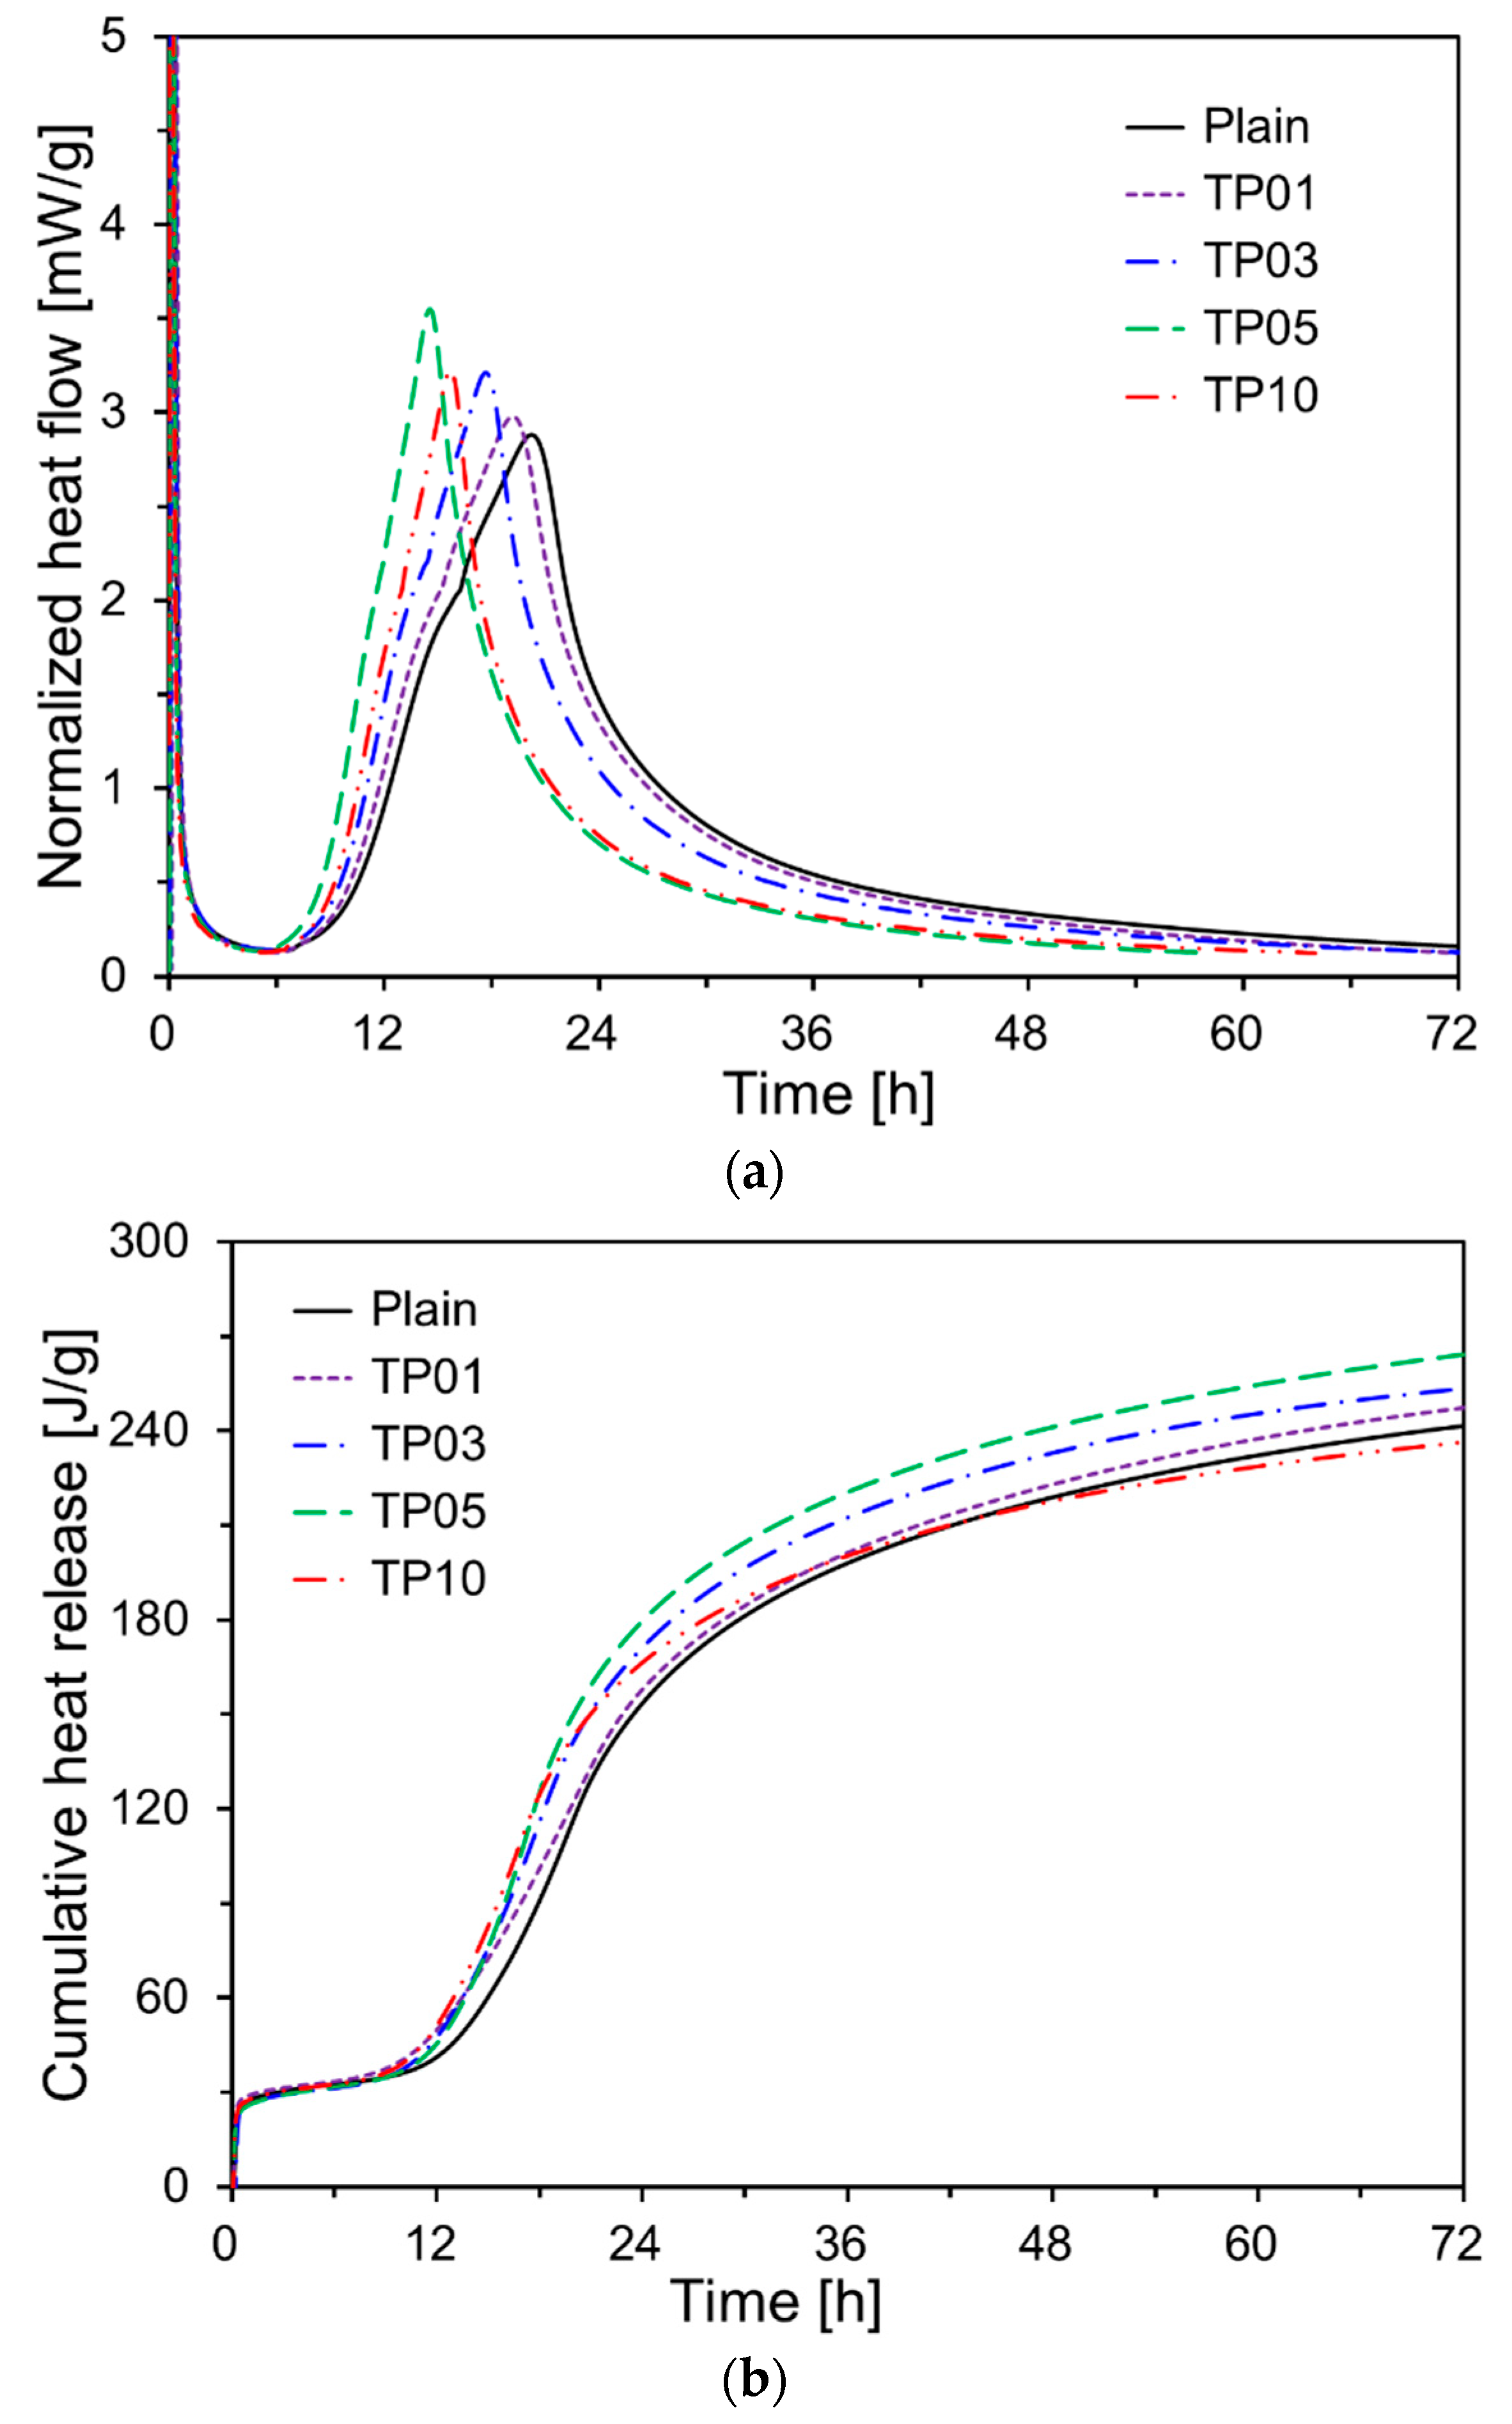
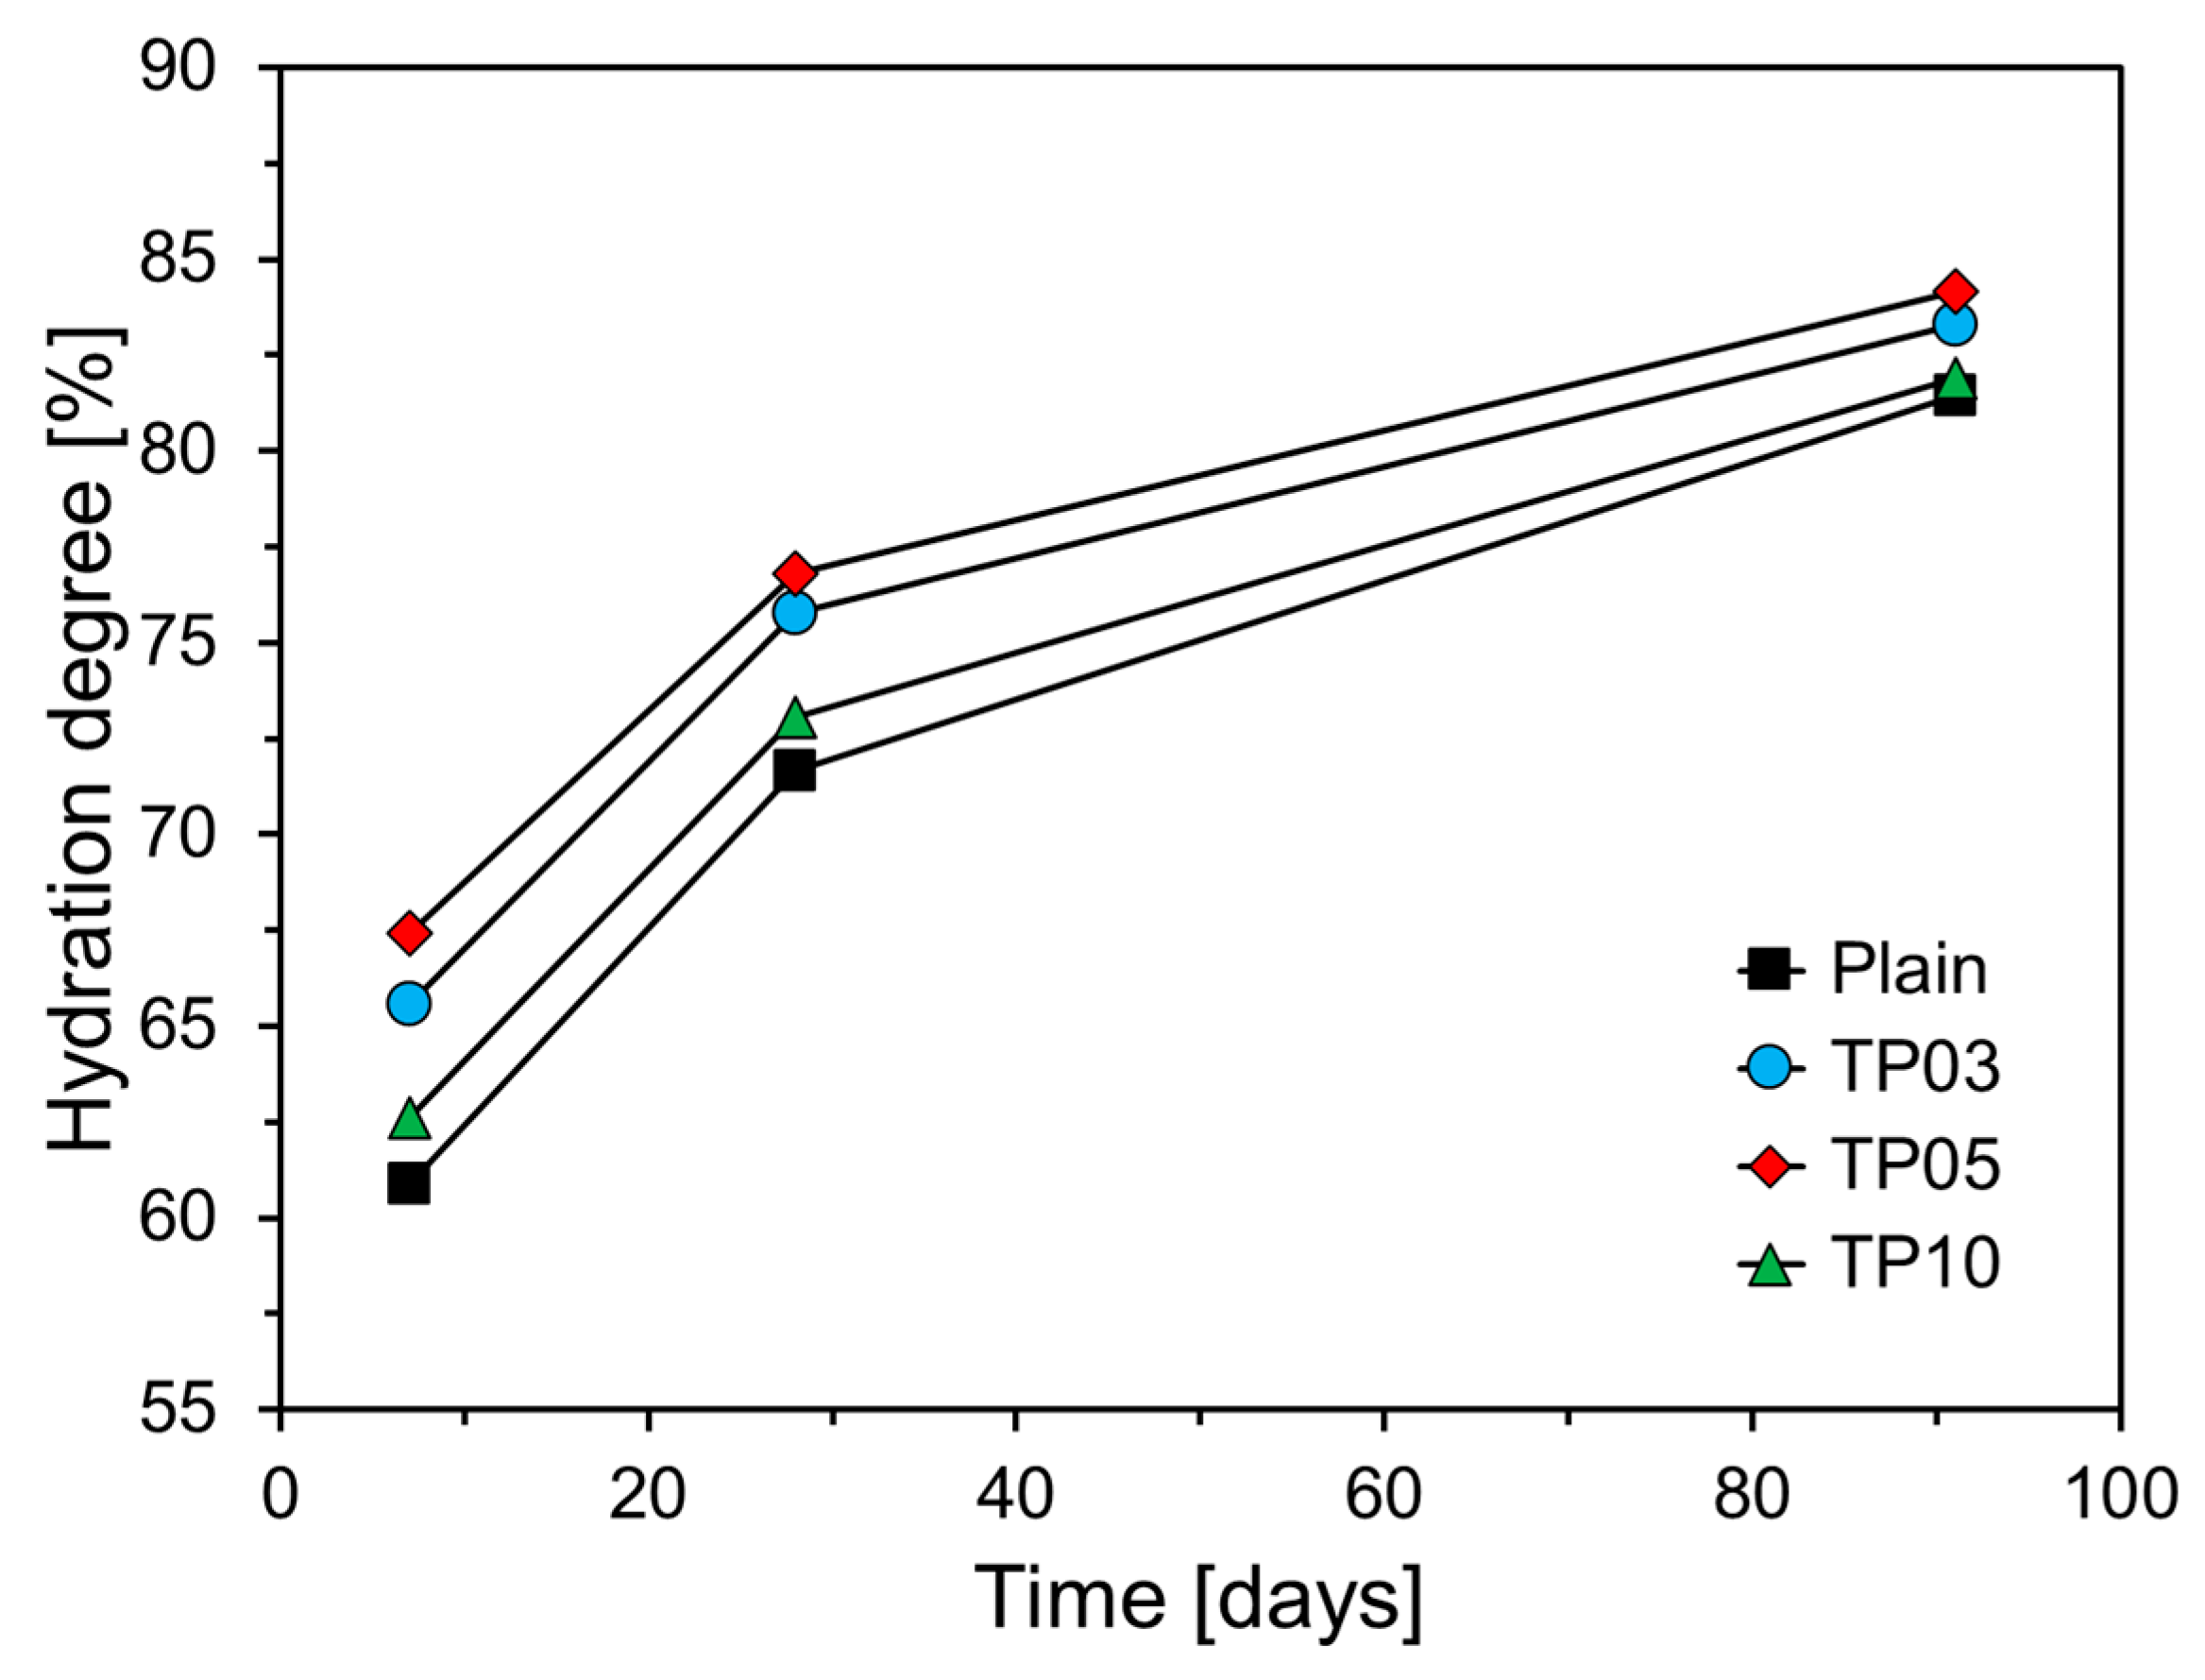
3.1. Hydration Characteristics
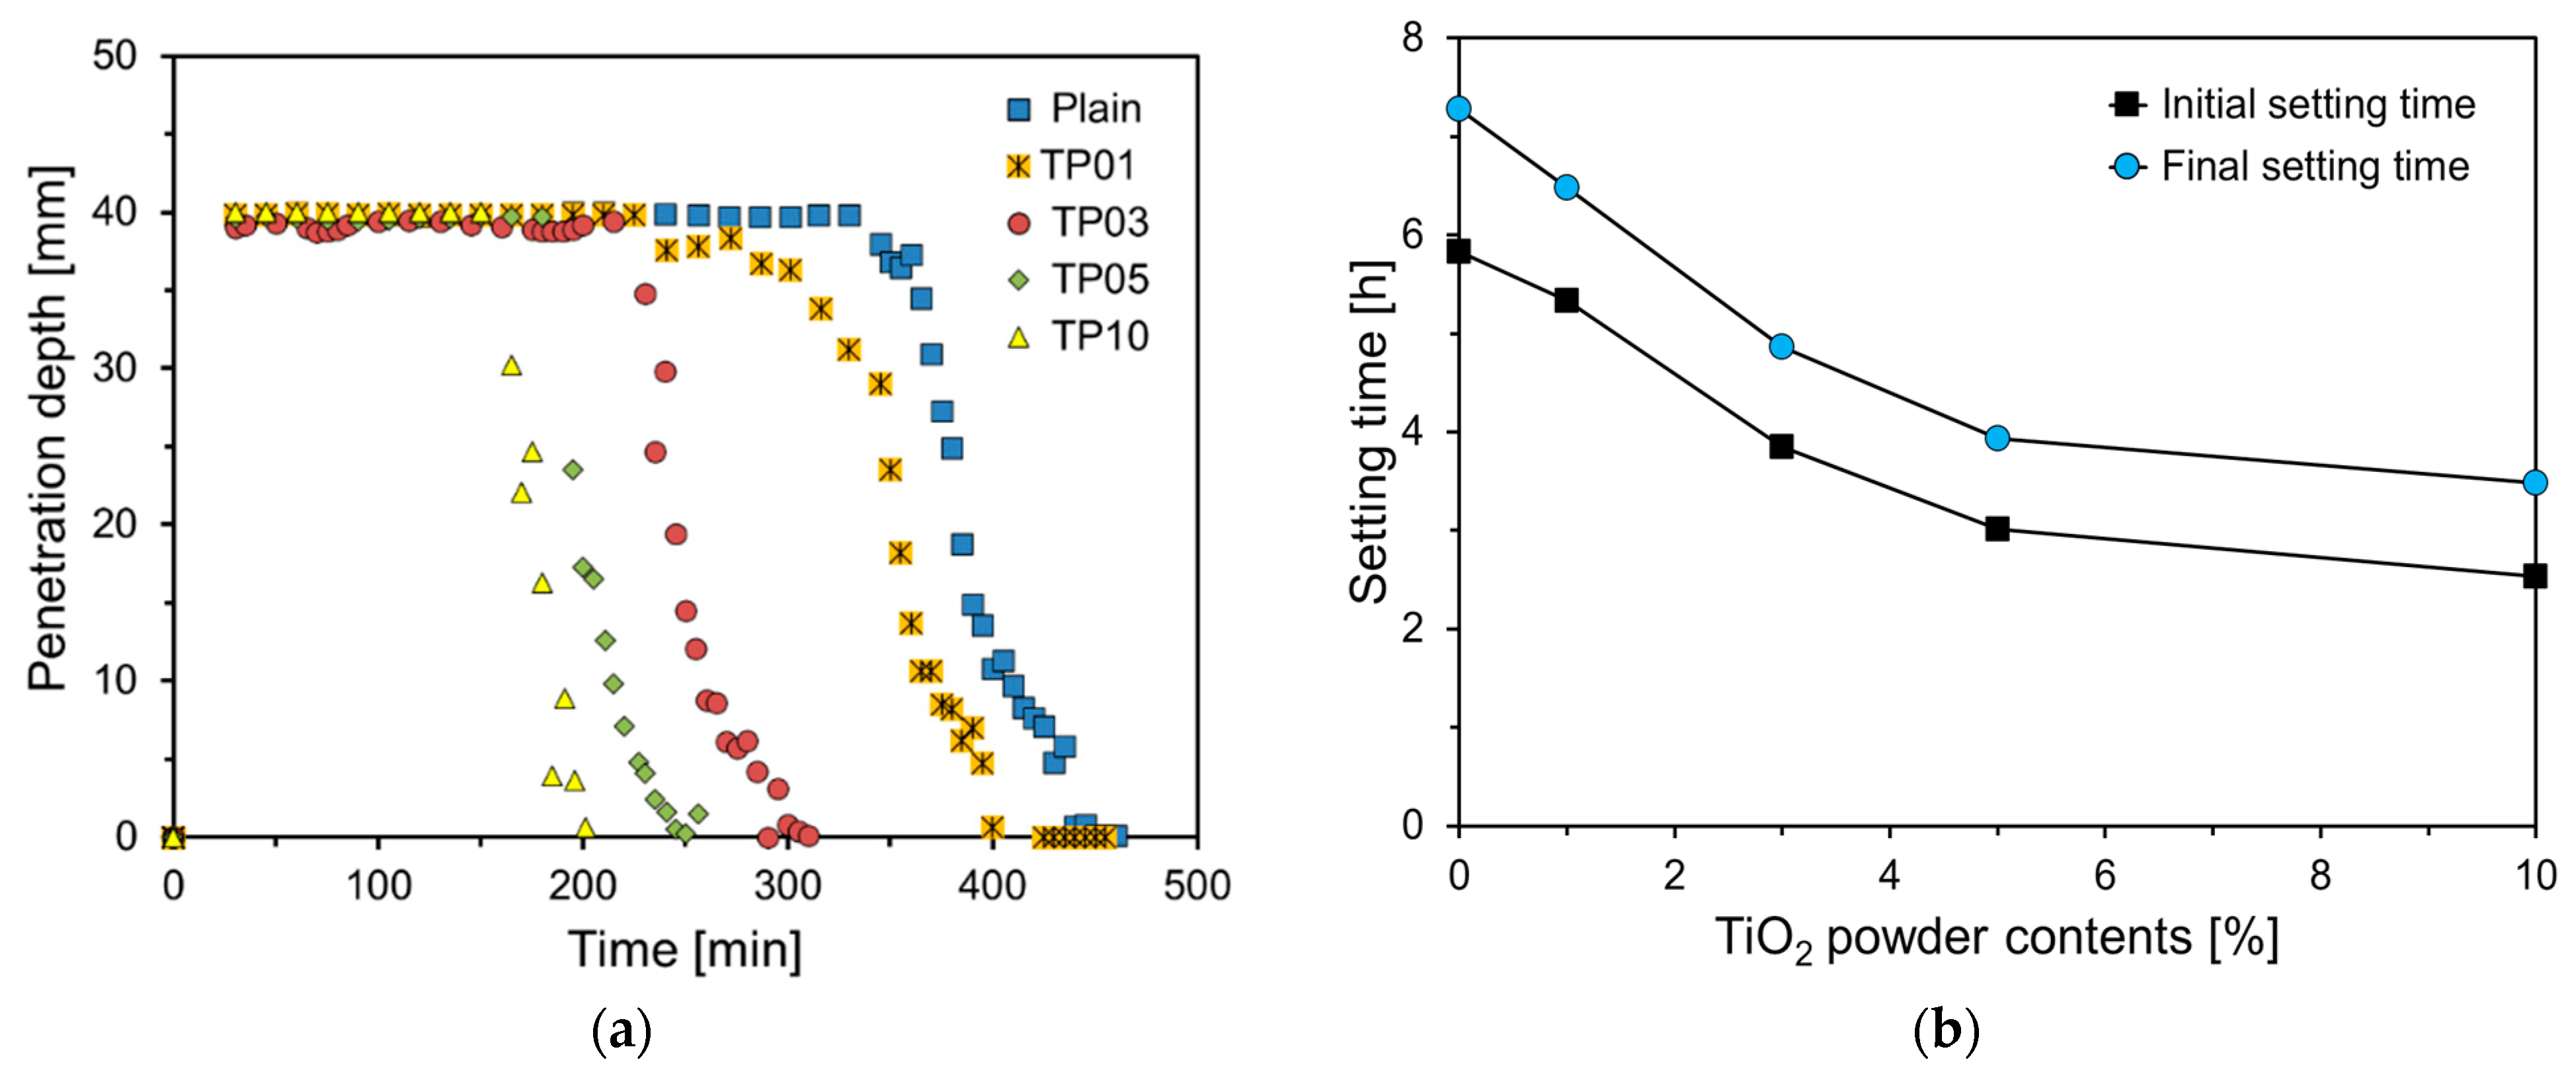
3.2. Setting Behavior of Specimens
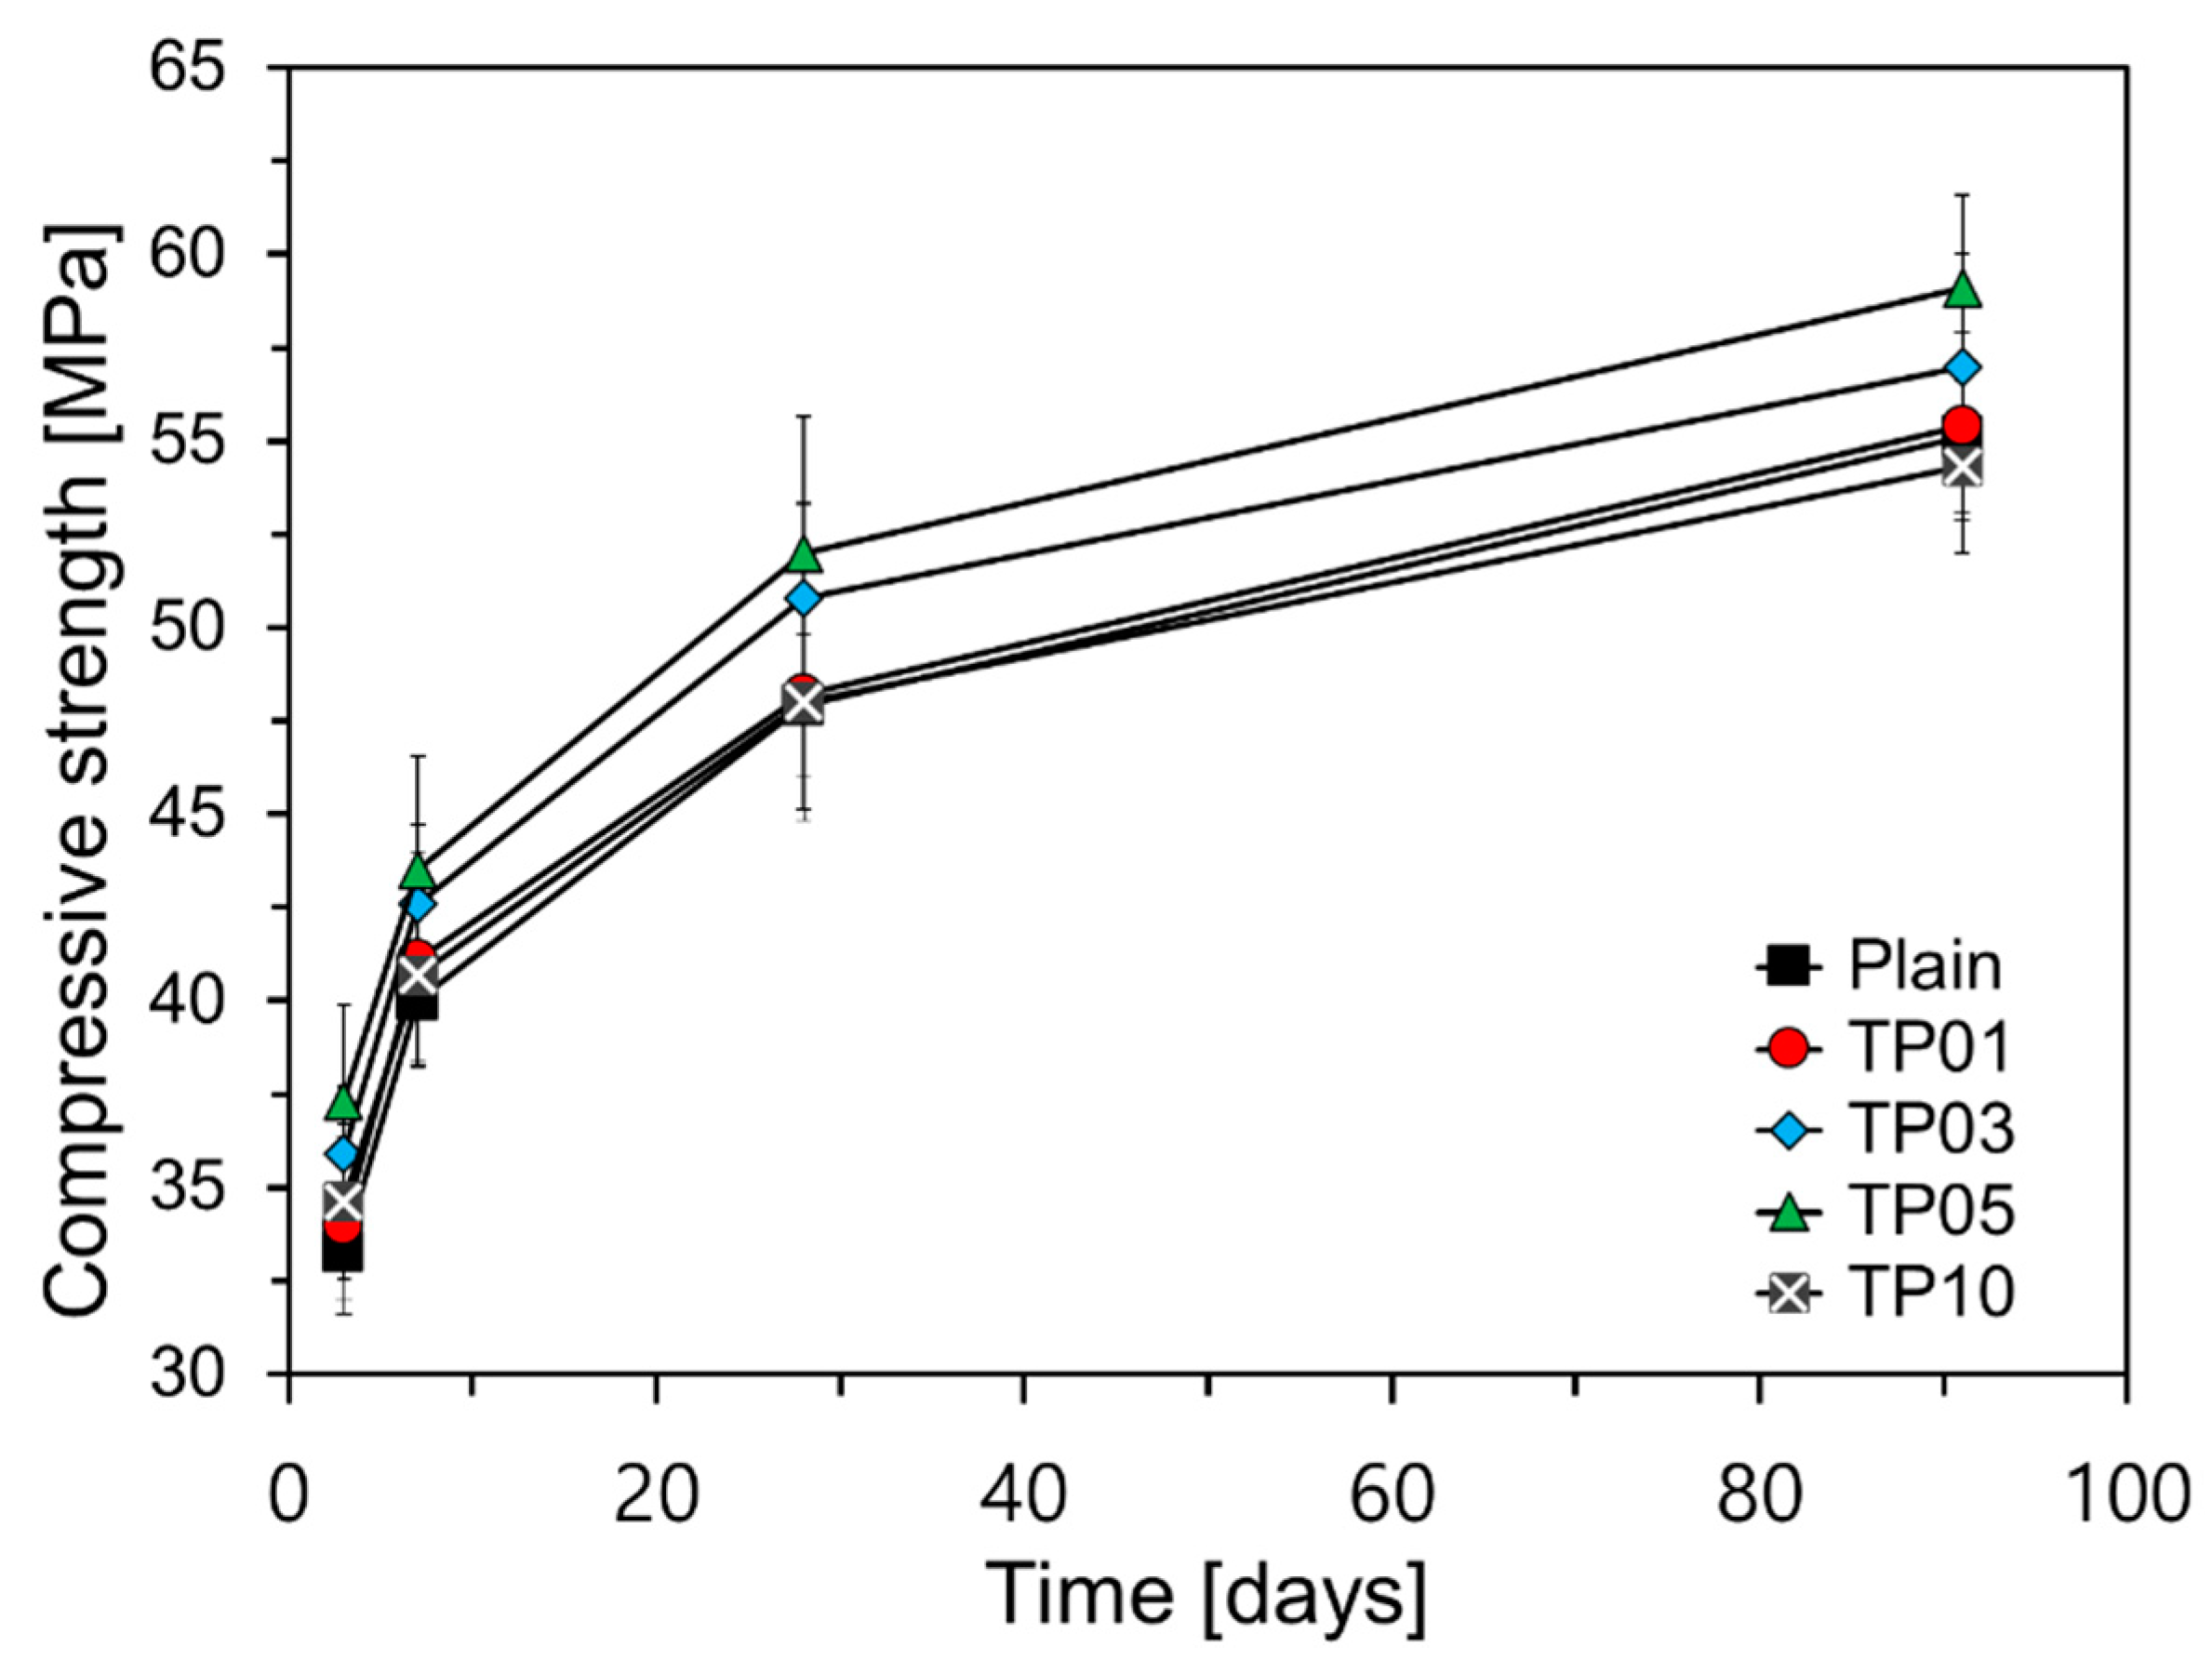
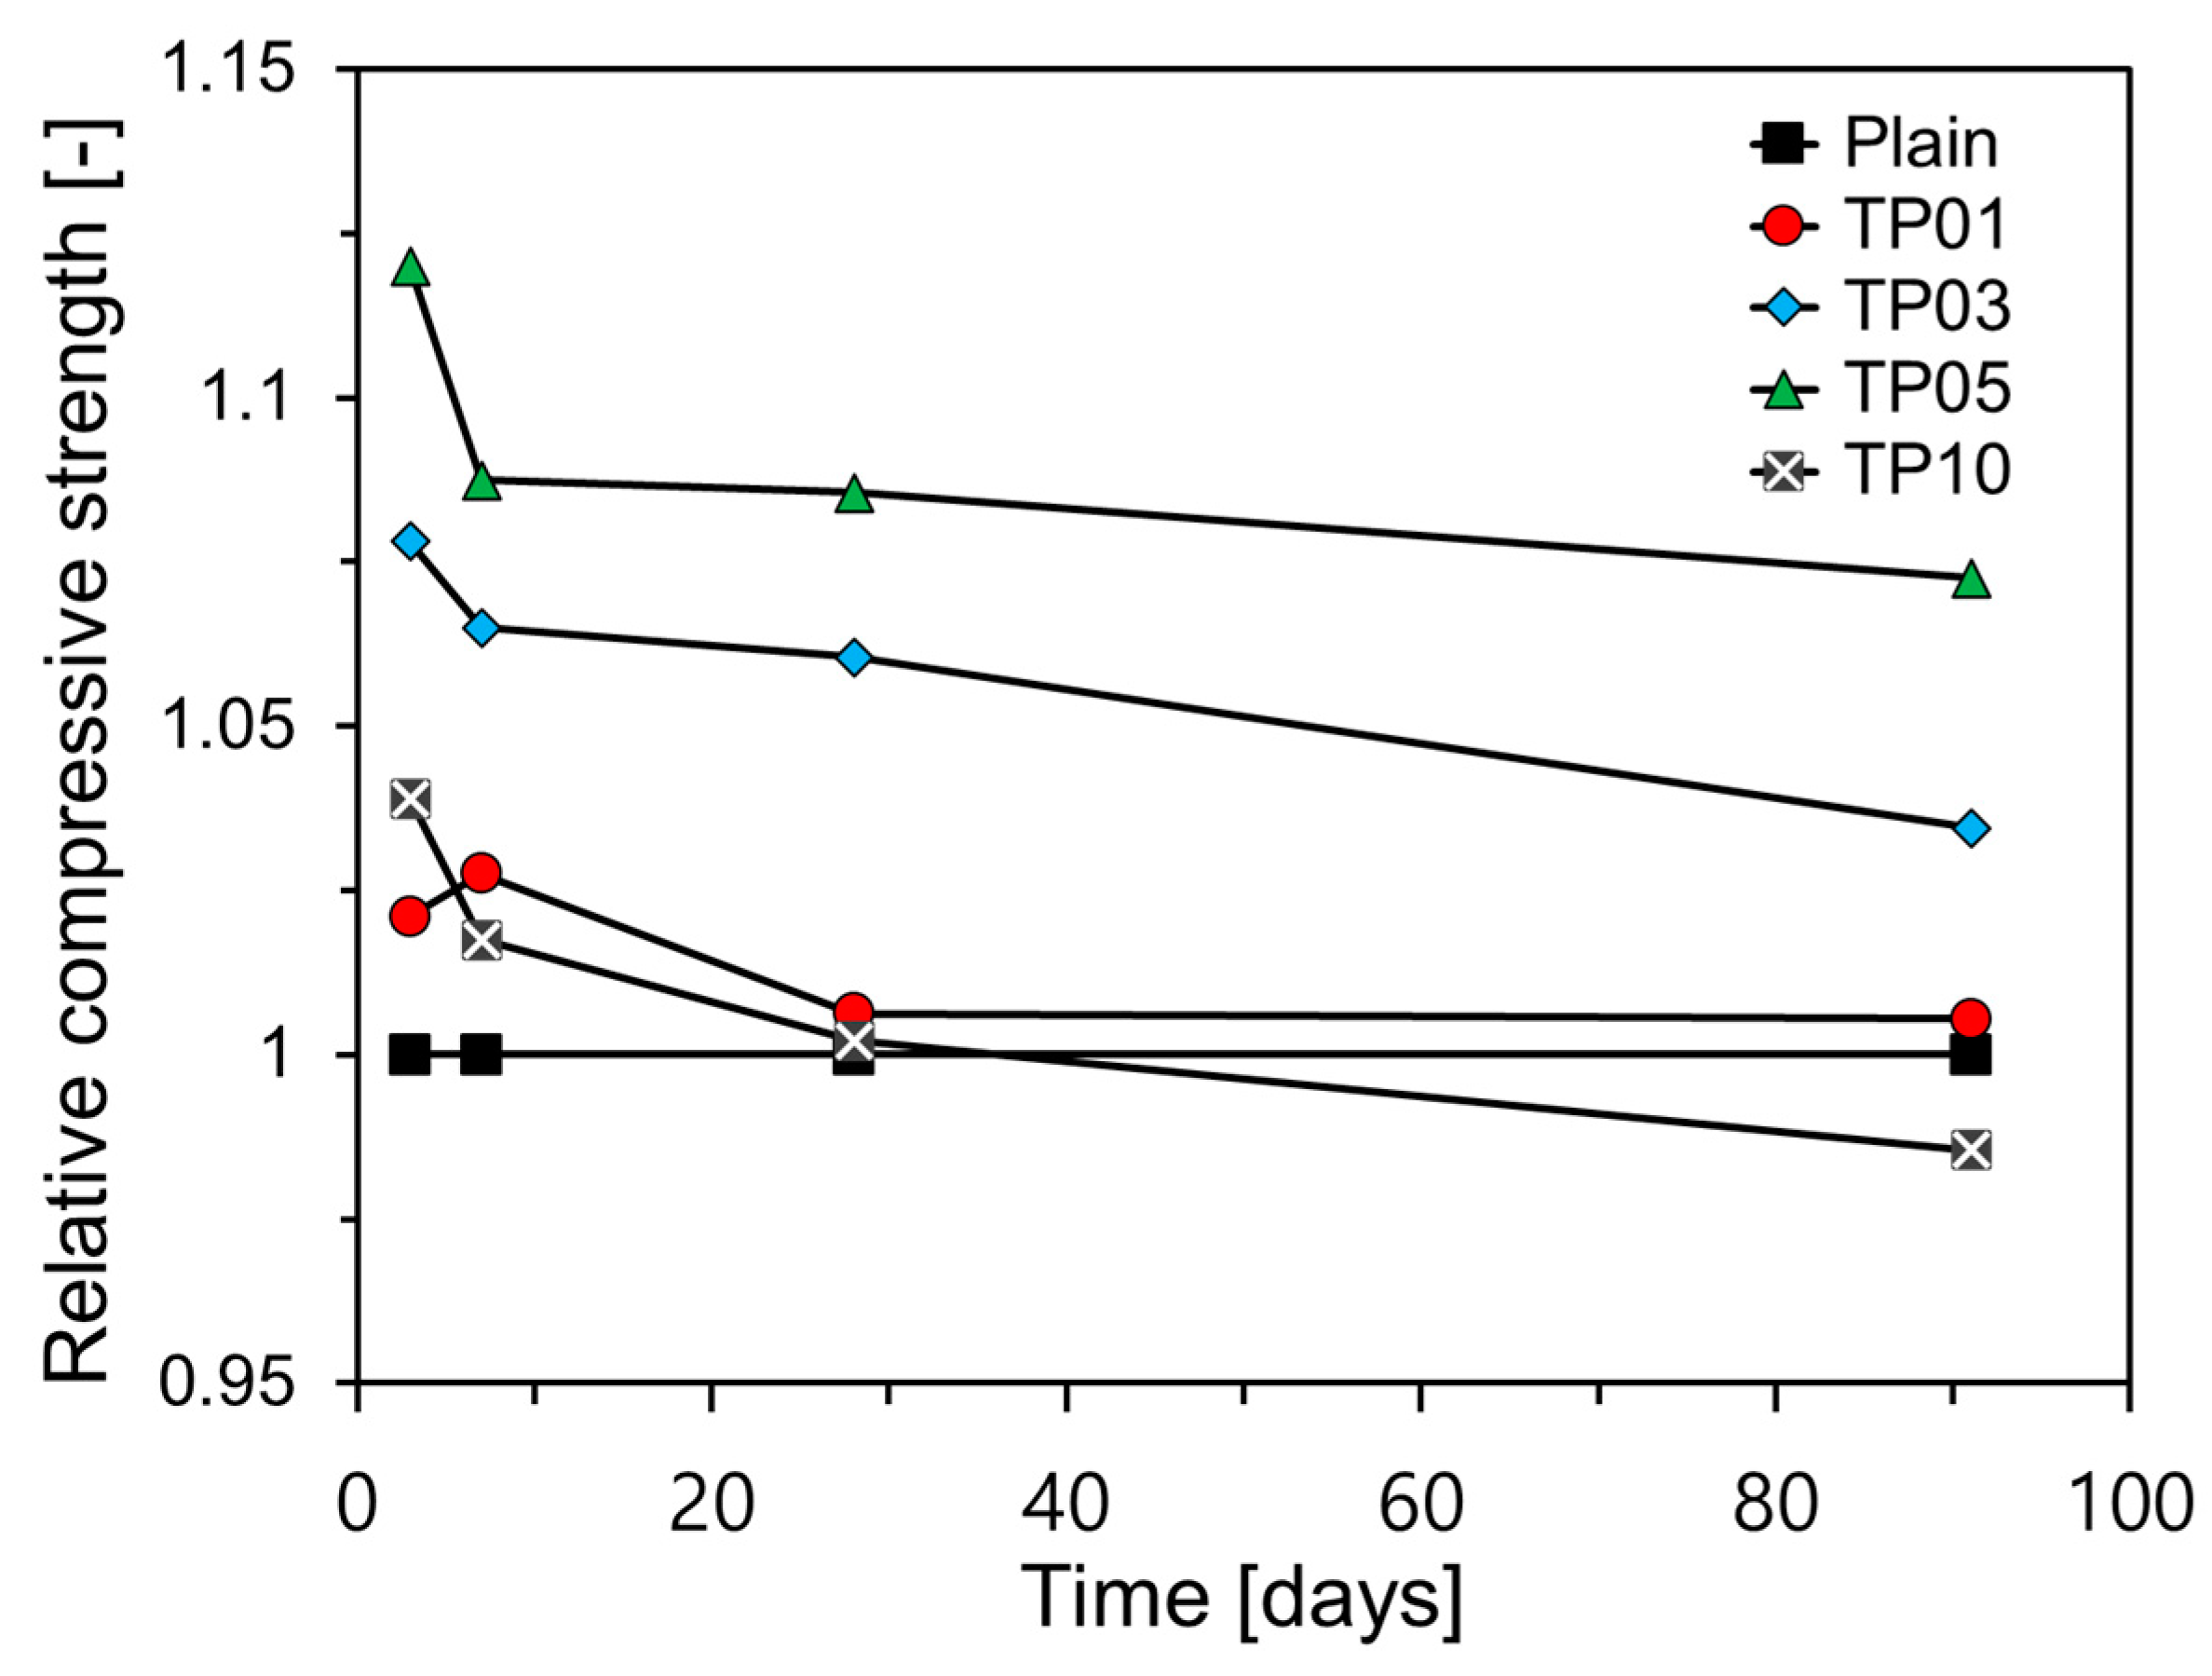
3.3. Compressive Strength
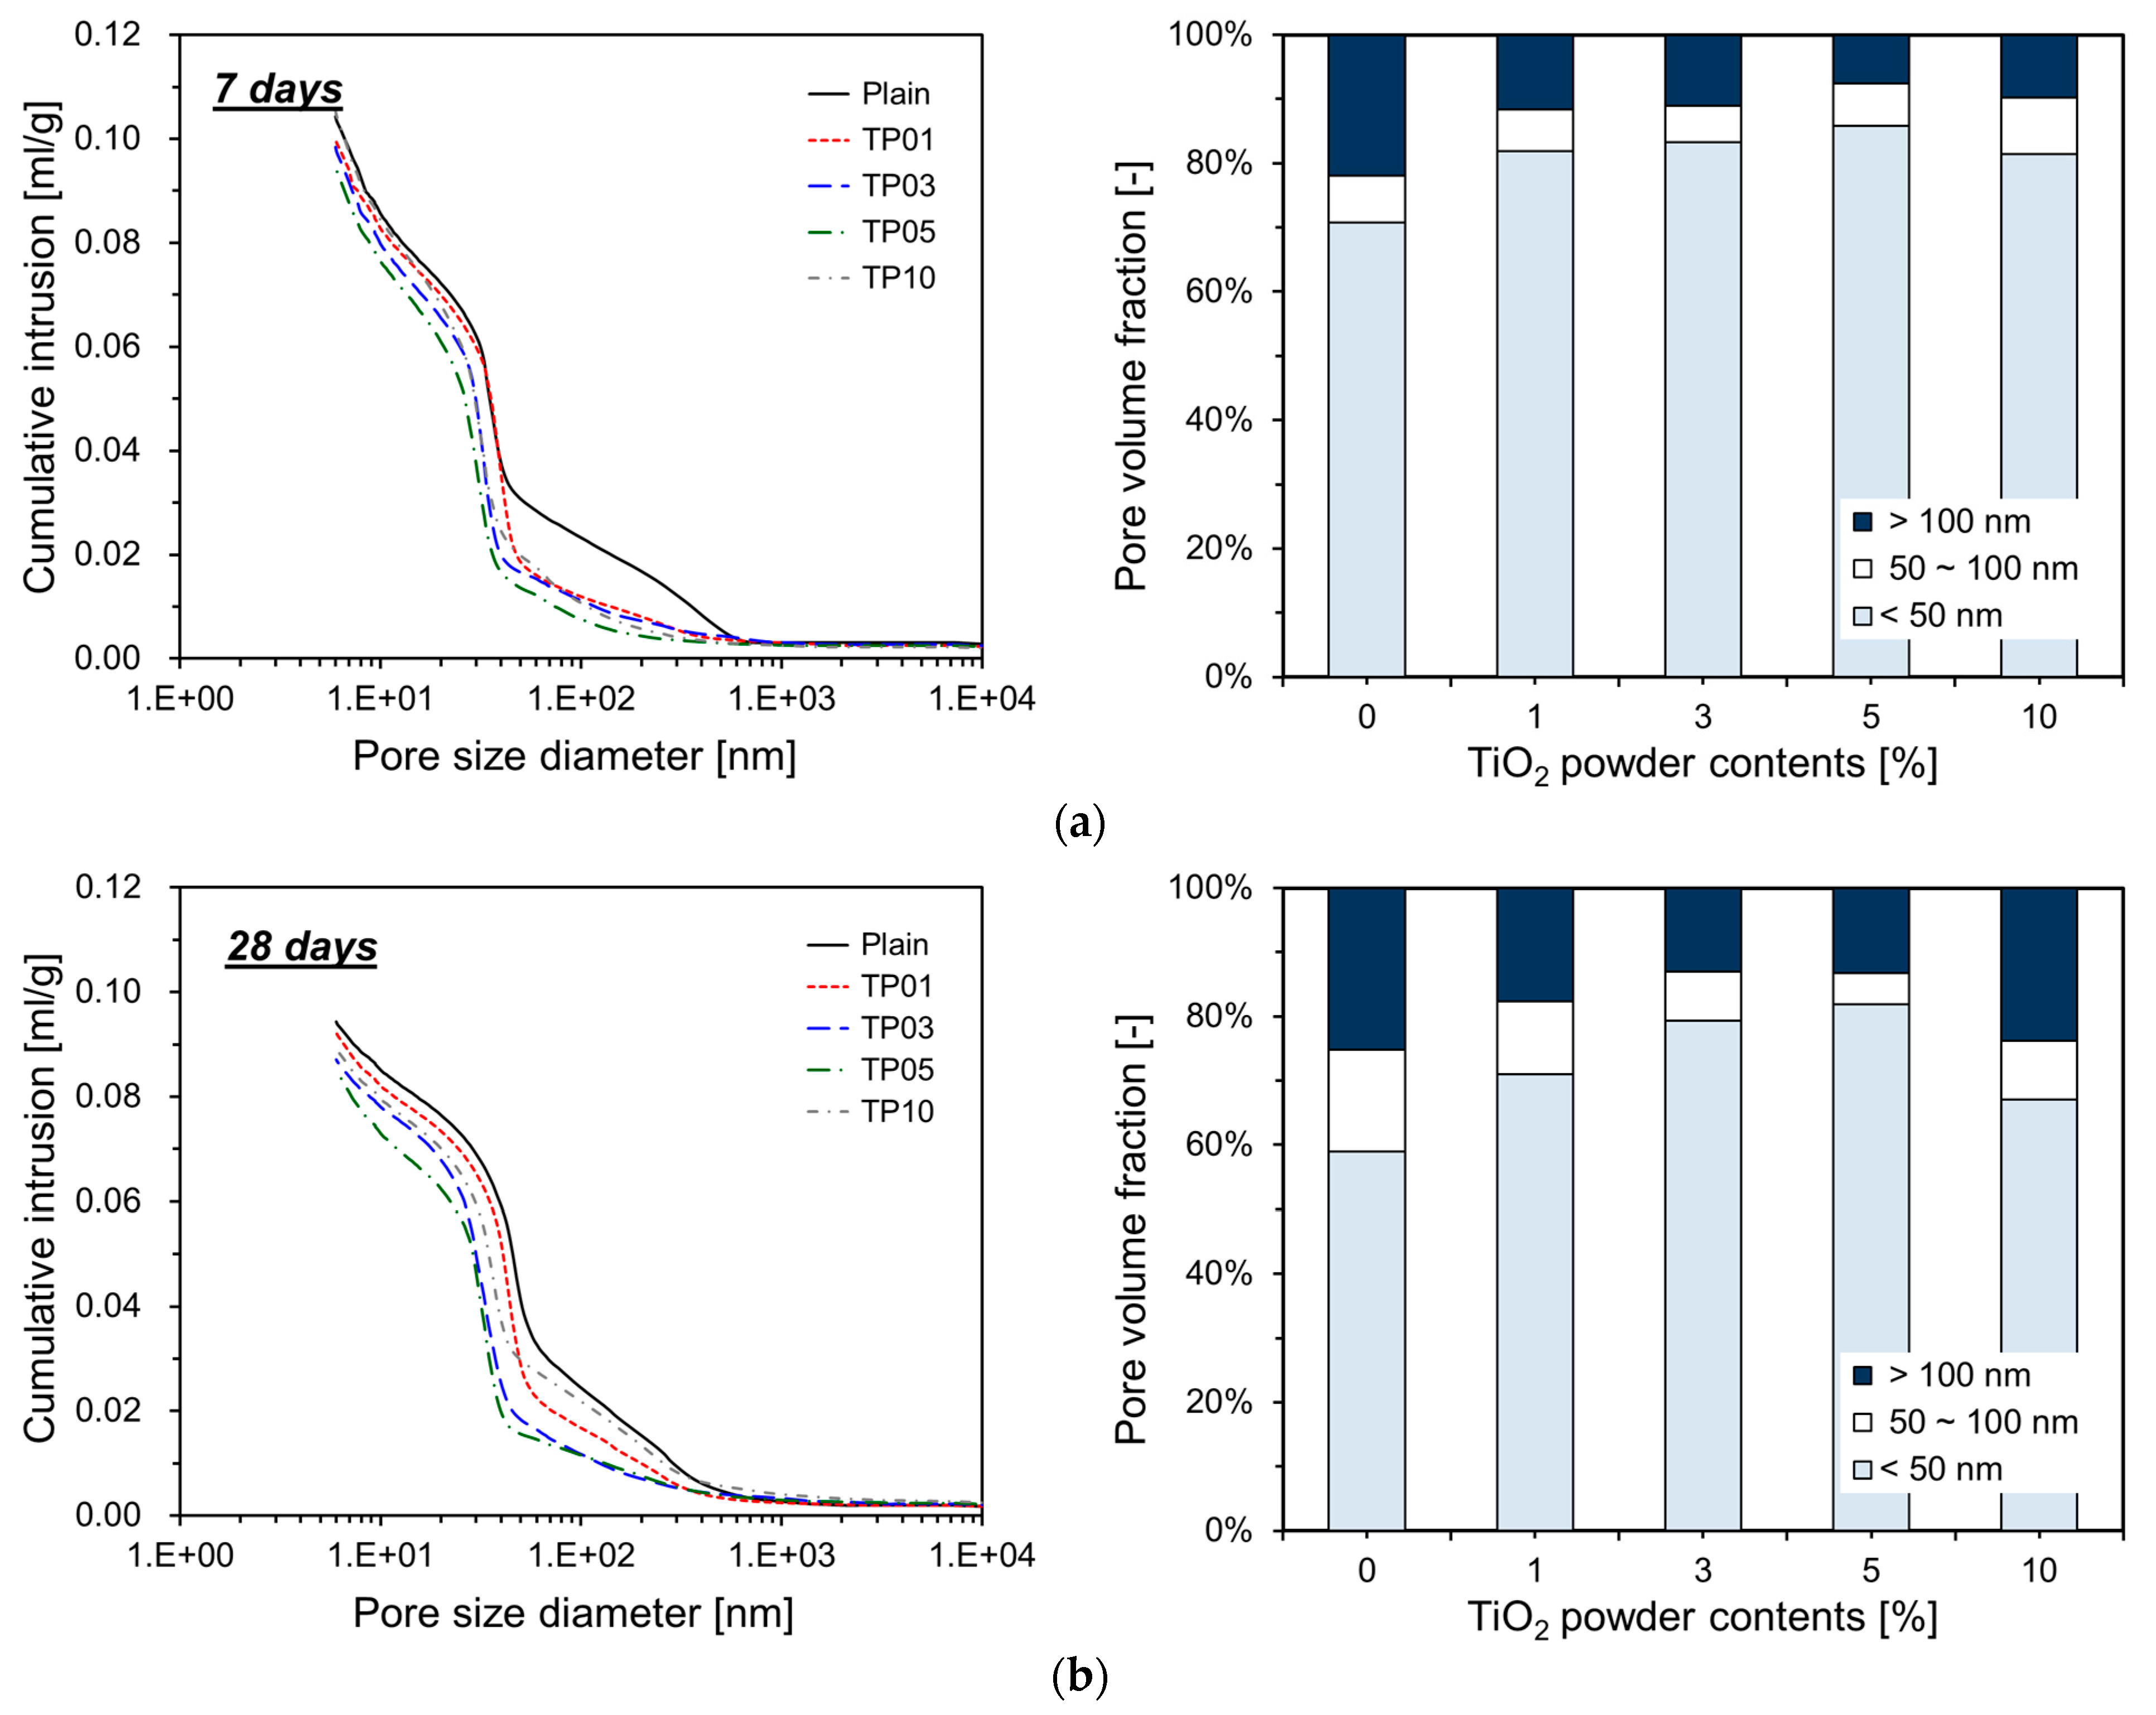
3.4. Pore Structure
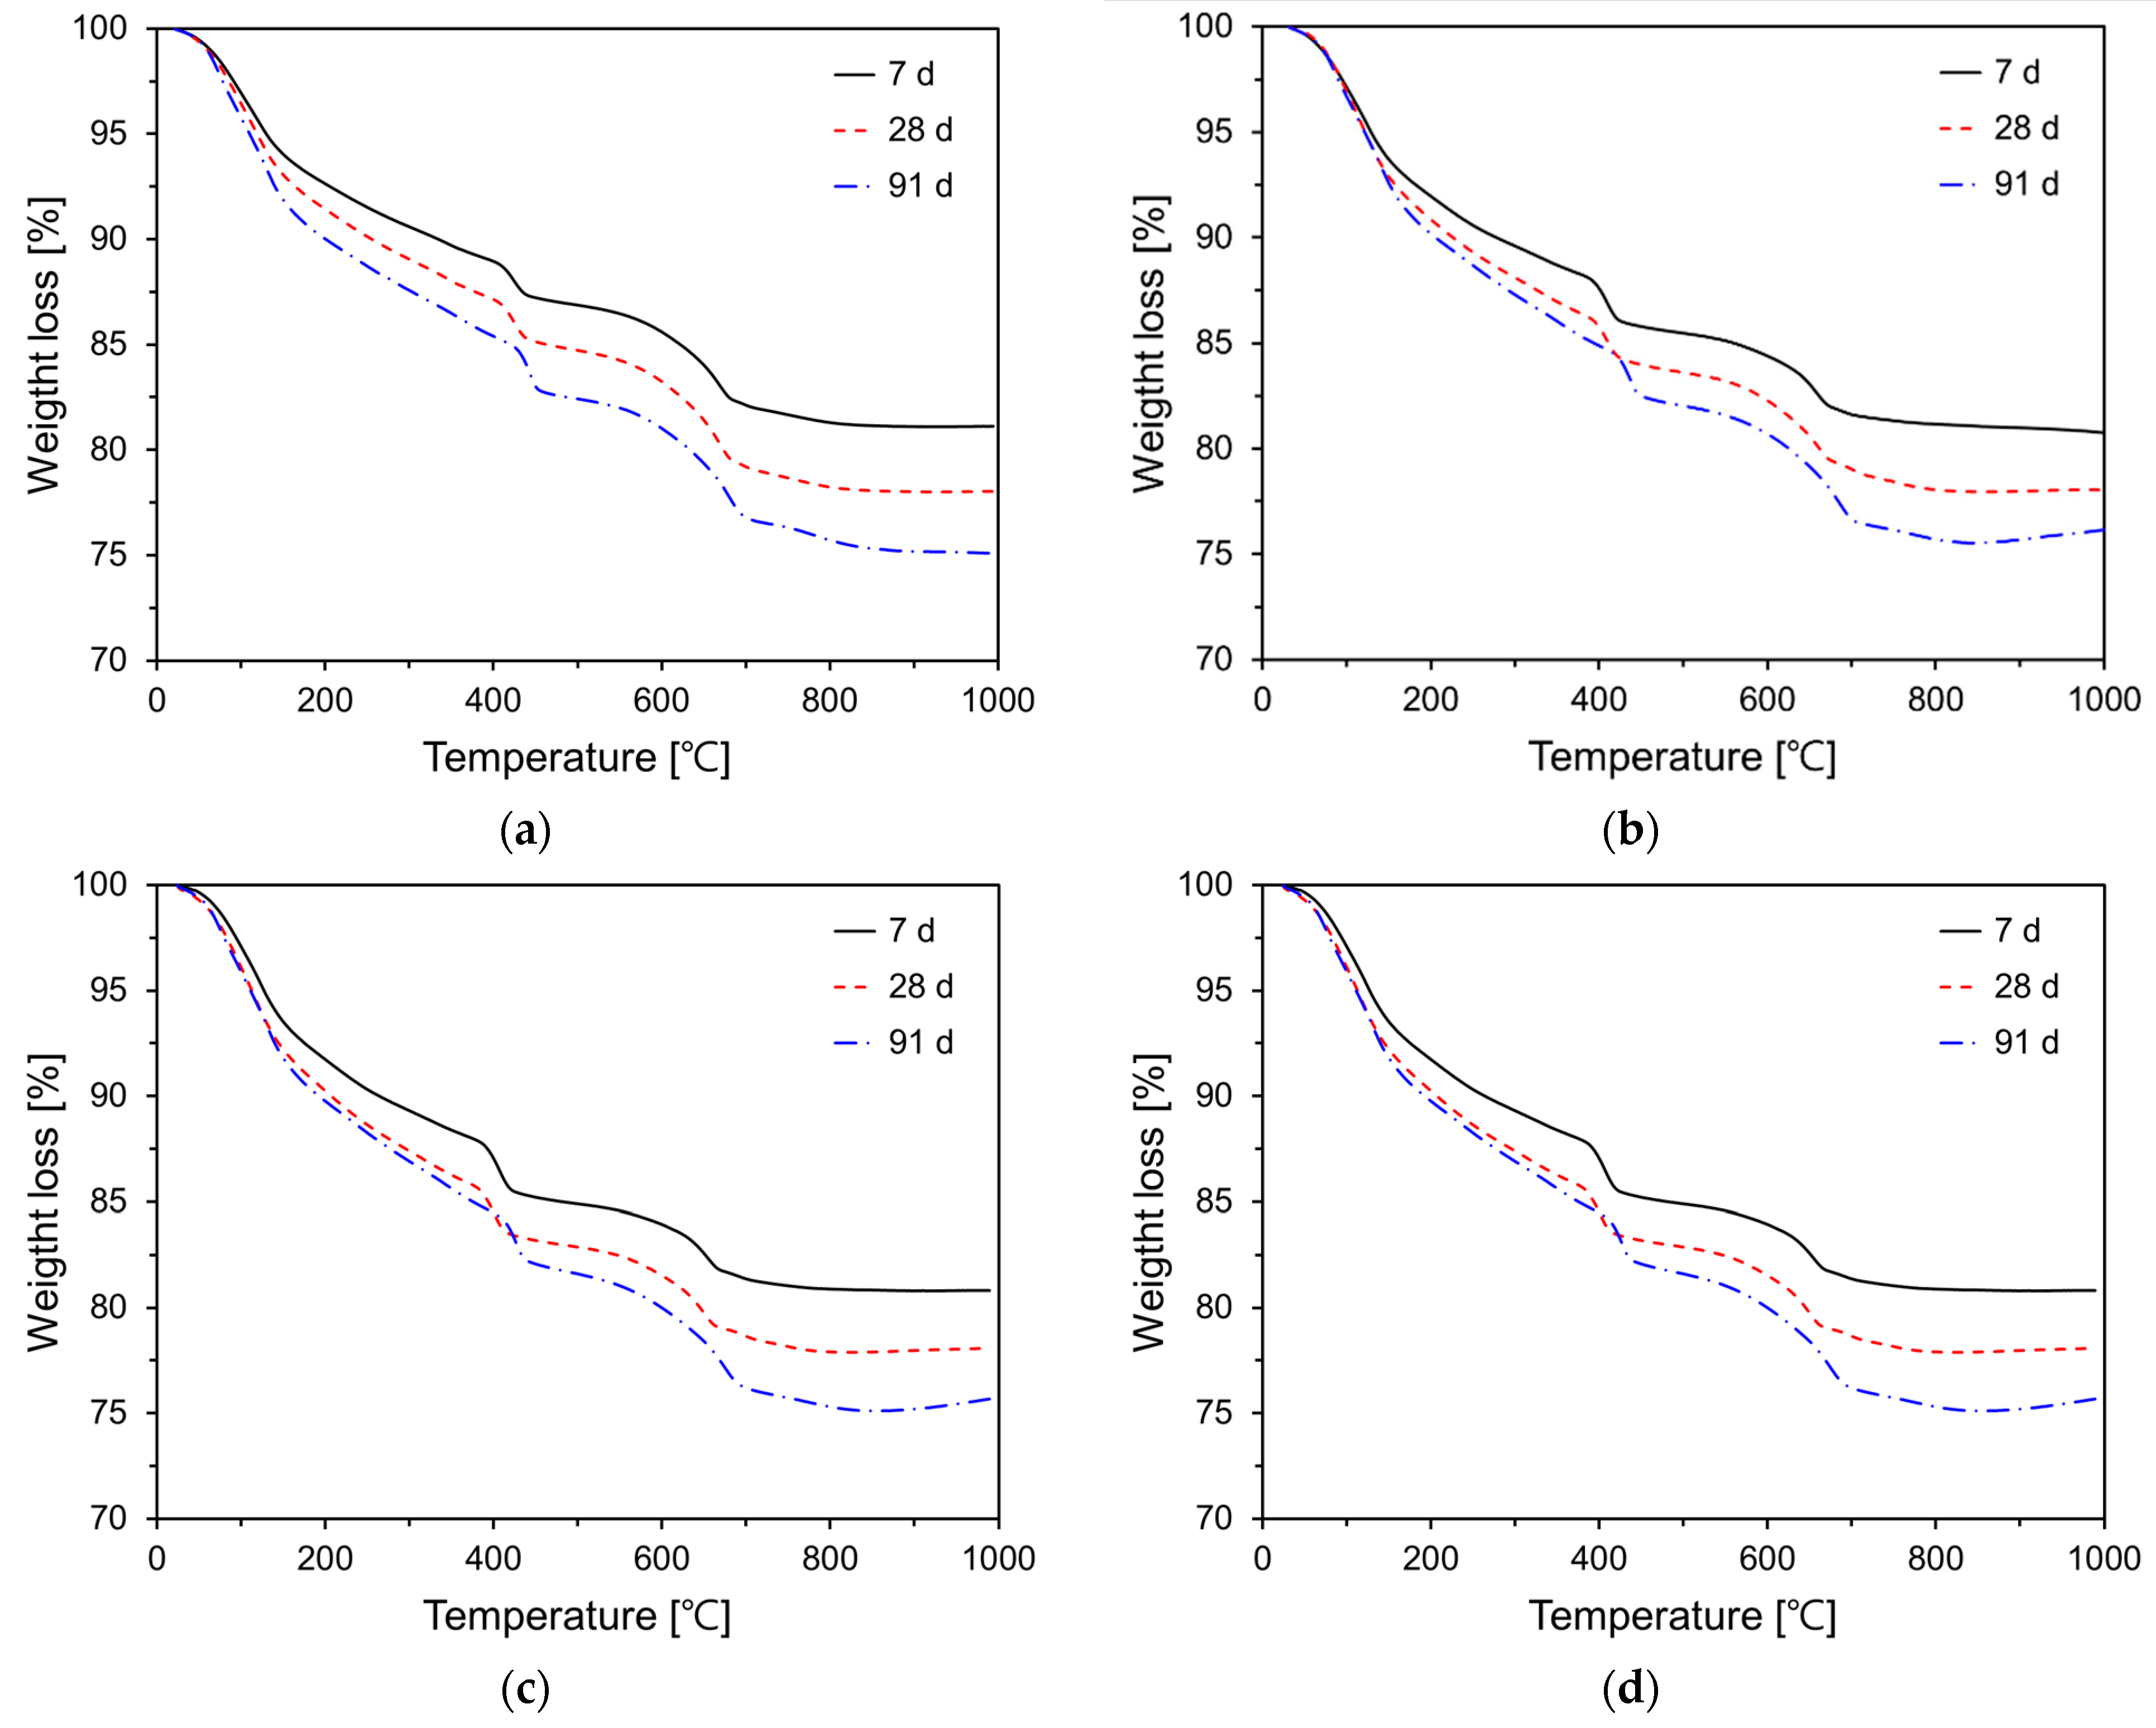
3.5. TG Analysis
4. Conclusions
Funding
Institutional Review Board Statement
Informed Consent Statement
Data Availability Statement
Acknowledgments
Conflicts of Interest
References
- Zhang, H.; Yang, Z.; Su, Y. Hydration kinetics of cement-quicklime system at different temperatures. Thermochim. Acta 2019, 673, 1–11. [Google Scholar] [CrossRef]
- Loh, K.; Gaylarde, C.C.; Shirakawa, M.A. Photocatalytic activity of ZnO and TiO2 ‘nanoparticles’ for use in cement mixes. Constr. Build. Mater. 2018, 167, 853–859. [Google Scholar] [CrossRef]
- Liu, M.; Tan, H.; He, X. Effects of nano-SiO2 on early strength and microstructure of steam-cured high volume fly ash cement system. Constr. Build. Mater. 2019, 194, 350–359. [Google Scholar] [CrossRef]
- Xu, Z.; Ji, Y.; Zhang, J.; Zhang, Z.; Xue, Q.; Gao, F. Mechanism of nano-SiO2 internal generation for modification of cement-based materials. J. Build. Eng. 2023, 76, 107247. [Google Scholar] [CrossRef]
- Ng, D.S.; Paul, S.C.; Anggraini, V.; Kong, S.Y.; Qureshi, T.S.; Rodriguez, C.R.; Liu, Q.; Šavija, B. Influence of SiO2, TiO2 and Fe2O3 nanoparticles on the properties of fly ash blended cement mortars. Constr. Build. Mater. 2020, 258, 119627. [Google Scholar] [CrossRef]
- Llano-Guerrero, E.A.; Gómez-Zamorano, L.Y.; Jiménez-Relinque, E. Effect of the addition of TiO2 nanoparticles in alkali-activated materials. Constr. Build. Mater. 2020, 245, 118370. [Google Scholar] [CrossRef]
- Duan, P.; Yan, C.J.; Luo, W.J.; Zhou, W. Effects of adding nano-TiO2 on compressive strength, drying shrinkage, carbonation and microstructure of fluidized bed fly ash based geopolymer paste. Constr. Build. Mater. 2016, 106, 115–125. [Google Scholar] [CrossRef]
- Li, Z.; Wang, J.L.; Li, Y.; Yu, X.; Han, B.G. Investigating size effect of anatase phase nano-TiO2 on the property of cement-based composites. Mater. Res. Express. 2018, 5, 11. [Google Scholar] [CrossRef]
- Mustafa, T.S.; El Hariri, M.O.R.; Nader, M.A.; Montaser, W.M. Enhanced shear behaviour of reinforced concrete beams containing nano-titanium. Eng. Struct. 2022, 257, 114082. [Google Scholar] [CrossRef]
- Zhang, R.; Cheng, X.; Hou, P.; Ye, Z. Influences of nano-TiO2 on the properties of cement-based materials: Hydration and drying shrinkage. Constr. Build. Mater. 2015, 81, 35–41. [Google Scholar] [CrossRef]
- Noorvand, H.; Abang Ali, A.A.; Demirboga, R.; Farzadnia, N.; Noorvand, H. Incorporation of nano TiO2 in black rice husk ash mortars. Constr. Build. Mater. 2013, 47, 1350–1361. [Google Scholar] [CrossRef]
- Meng, T.; Yu, Y.; Qian, X.; Zhan, S.; Qian, K. Effect of nano-TiO2 on the mechanical properties of cement mortar. Constr. Build. Mater. 2012, 29, 241–245. [Google Scholar] [CrossRef]
- Han, B.; Wang, Y.; Dong, S.; Zhang, L.; Ding, S.; Yu, X.; Ou, J. Smart concretes and structures: A review. J. Intell. Mater. Syst. Struct. 2015, 26, 1303–1345. [Google Scholar] [CrossRef]
- Jiang, S.; Zhou, D.; Zhang, L.; Ouyang, J.; Yu, X.; Cui, X.X.; Han, B. Comparison of compressive strength and electrical resistivity of cementitious composites with different nano- and micro-fillers. Arch. Civ. Mech. Eng. 2018, 18, 60–68. [Google Scholar] [CrossRef]
- Ma, B.G.; Li, H.N.; Li, X.G.; Mei, J.P.; Lv, Y. Influence of nano-TiO2 on physical and hydration characteristics of fly ash-cement systems. Constr. Build. Mater. 2016, 122, 242–253. [Google Scholar] [CrossRef]
- Francioso, V.; Moro, C.; Martinez-Lage, I.; Velay-Lizancos, M. Curing temperature: A key factor that changes the effect of TiO2 nanoparticles on mechanical properties, calcium hydroxide formation and pore structure of cement mortars. Cem. Concr. Compos. 2019, 104, 103374. [Google Scholar] [CrossRef]
- Mohseni, E.; Miyandehi, B.M.; Yang, J.; Yazdi, M.A. Single and combined effects of nano-SiO2, nano-Al2O3 and nano-TiO2 on the mechanical, rheological and durability properties of self-compacting mortar containing fly ash. Constr. Build. Mater. 2015, 84, 331–340. [Google Scholar] [CrossRef]
- Aïssa, A.H.; Puzenat, E.; Plassais, A.; Herrmann, J.M.; Haehnel, C.; Guillard, C. Characterization and photocatalytic performance in air of cementitious materials containing TiO2. Case study of formaldehyde removal. Appl. Catal. B 2011, 107, 1–8. [Google Scholar] [CrossRef]
- Yousefi, A.; Allahverdi, A.; Hejazi, P. Effective dispersion of nano-TiO2 powder for enhancement of photocatalytic properties in cement mixes. Constr. Build. Mater. 2013, 41, 224–230. [Google Scholar] [CrossRef]
- Reches, Y. Nanoparticles as concrete additives: Review and perspectives. Constr. Build. Mater. 2018, 175, 483–495. [Google Scholar] [CrossRef]
- Guo, C.; Wang, E.; Hou, X.; Chen, J.; Zhang, W.; Ye, J.; Qin, S. Characterization and mechanism of early hydration of calcium aluminate cement with anatase-TiO2 nanospheres additive. Constr. Build. Mater. 2020, 261, 119922. [Google Scholar] [CrossRef]
- Chen, J.; Kou, S.C.; Poon, C.S. Hydration and properties of nano-TiO2 blended cement composites. Cem. Concr. Compos. 2012, 34, 642–649. [Google Scholar] [CrossRef]
- Singh, L.P.; Karade, S.R.; Bhattacharyya, S.K.; Yousuf, M.M.; Ahalawat, S. Beneficial role of nanosilica in cement based materials—A review. Constr. Build. Mater. 2013, 47, 1069–1077. [Google Scholar] [CrossRef]
- Rahim, A.; Nair, R. Influence of nanomaterials in high strength concrete. J. Chem. Pharm. Sci. 2016, 974, 15–21. [Google Scholar]
- Essawy, A.A.; El, S.A. Physico-mechanical properties, potent adsorptive and photocatalytic efficacies of sulfate resisting cement blends containing micro silica and nano-TiO2. Constr. Build. Mater. 2014, 52, 1–8. [Google Scholar] [CrossRef]
- Yoo, S.W.; Lee, J.W.; Park, B.; Choi, Y.C. Photocatalytic NOx degradation performance of TiO2-nanofiber-spray-coated foam composite according to saturated conditions. Constr. Build. Mater. 2022, 358, 129414. [Google Scholar] [CrossRef]
- Xu, F. Review of analytical studies on TiO2 nanoparticles and particle aggregation, coagulation, flocculation, sedimentation, stabilization. Chemosphere 2018, 212, 662–677. [Google Scholar] [CrossRef]
- Hou, P.; Kawashima, S.; Wang, K.; Corr, D.J.; Qian, J.; Shah, S.P. Effects of colloidal nanosilica on rheological and mechanical properties of fly ash-cement mortar. Cem. Concr. Compos. 2013, 35, 12–22. [Google Scholar] [CrossRef]
- Pellegrino, F.; Pellutiè, L.; Sordello, F.; Minero, C.; Ortel, E.; Hodoroaba, V.D.; Maurino, V. Influence of agglomeration and aggregation on the photocatalytic activity of TiO2 nanoparticles. Appl. Catal. B 2017, 216, 80–87. [Google Scholar] [CrossRef]
- Li, V.C. Multi-functional engineered cementitious composites (ECC). In Engineered Cementitious Composites (ECC); Springer: Berlin/Heidelberg, Germany, 2019; pp. 371–411. [Google Scholar] [CrossRef]
- Gutteridge, W.A.; Dalziel, J.A. Filler cement: The effect of the secondary component on the hydration of Portland cement. Cem. Concr. Res. 1990, 20, 778–782. [Google Scholar] [CrossRef]
- Poppe, A.M.; De Schutter, G.D. Cement hydration in the presence of high filler contents. Cem. Concr. Res. 2005, 35, 2290–2299. [Google Scholar] [CrossRef]
- Kadri, E.H.; Duval, R. Hydration heat kinetics of concrete with silica fume. Constr. Build. Mater. 2009, 23, 3388–3392. [Google Scholar] [CrossRef]
- Gartner, E.M.; Young, J.F.; Damidot, D.A.; Jawed, I. Hydration of Portland cement. In Structure and Performance of Cements; Bensted, J., Barnes, P., Eds.; Spon Press: London, UK, 2002; pp. 57–108. [Google Scholar]
- Lee, B.Y.; Kurtis, K.E. Influence of TiO2 nanoparticles on early C3S hydration. J. Am. Ceram. Soc. 2010, 93, 3399–3405. [Google Scholar] [CrossRef]
- Thomas, J.J. A new approach to modeling the nucleation and growth kinetics of tricalcium silicate hydration. J. Am. Ceram. Soc. 2007, 90, 3282–3288. [Google Scholar] [CrossRef]
- Ji, T. Preliminary study on the water permeability and microstructure of concrete incorporating nano-SiO2. Cem. Concr. Res. 2005, 35, 1943–1947. [Google Scholar] [CrossRef]
- Björnström, J.; Martinelli, A.; Matic, A.; Börjesson, L.; Panas, I. Accelerating effects of colloidal nano-silica for beneficial calcium–silicate–hydrate formation in cement. Chem. Phys. Lett. 2004, 392, 242–248. [Google Scholar] [CrossRef]
- Ye, Q.; Zhang, Z.; Kong, D.; Chen, R. Influence of nano-SiO2 addition on properties of hardened cement paste as compared with silica fume. Constr. Build. Mater. 2007, 21, 539–545. [Google Scholar] [CrossRef]
- Senff, L.; Labrincha, J.A.; Ferreira, V.M.; Hotza, D.; Repette, W.L. Effect of nano-silica on rheology and fresh properties of cement pastes and mortars. Constr. Build. Mater. 2009, 23, 2487–2491. [Google Scholar] [CrossRef]
- Li, G. Properties of high-volume fly ash concrete incorporating nano-SiO2. Cem. Concr. Res. 2004, 34, 1043–1049. [Google Scholar] [CrossRef]
- Jo, B.W.; Kim, C.H.; Tae, G.H.; Park, J.B. Characteristics of cement mortar with nano-SiO2 particles. Constr. Build. Mater. 2007, 21, 1351–1355. [Google Scholar] [CrossRef]
- Lucas, S.S.; Ferreira, V.M.; De Aguiar, J.L.B. Incorporation of titanium dioxide nanoparticles in mortars—Influence of microstructure in the hardened state properties and photocatalytic activity. Cem. Concr. Res. 2013, 43, 112–120. [Google Scholar] [CrossRef]
- Shafaei, D.; Yang, S.; Berlouis, L.; Minto, J. Multiscale pore structure analysis of nano titanium dioxide cement mortar composite. Mater. Today Commun. 2020, 22, 100779. [Google Scholar] [CrossRef]
- Yu, R.; Spiesz, P.; Brouwers, H.J.H. Effect of nano silica on the hydration and microstructure development of ultra-high performance concrete (UHPC) with a low binder amount. Constr. Build. Mater. 2014, 65, 140–150. [Google Scholar] [CrossRef]
- Chen, L.; Lin, D.F. Application of sewage sludge ash and nano-SiO2 to manufacture tile as construction material. Constr. Build. Mater. 2009, 23, 3312–3320. [Google Scholar] [CrossRef]
- Pane, I.; Hansen, W. Investigation of blended cement hydration by isothermal calorimetry and thermal analysis. Cem. Concr. Res. 2005, 35, 1155–1164. [Google Scholar] [CrossRef]
- Monteagudo, S.M.; Moragues, A.; Gálvez, J.C.; Casati, M.J.; Reyes, E. The degree of hydration assessment of blended cement pastes by differential thermal and thermogravimetric analysis. Morphological evolution of the solid phases. Thermochim. Acta 2014, 592, 37–51. [Google Scholar] [CrossRef]
- Sun, J.; Tian, L.; Yu, Z.; Zhang, Y.; Li, C.; Hou, G.; Shen, X. Studies on the size effects of nano-TiO2 on Portland cement hydration with different water to solid ratios. Constr. Build. Mater. 2020, 259, 120390. [Google Scholar] [CrossRef]
- Xu, Z.; Li, W.; Sun, J.; Hu, Y.; Xu, K.; Ma, S.; Shen, X. Research on cement hydration and hardening with different alkanolamines. Constr. Build. Mater. 2017, 141, 296–306. [Google Scholar] [CrossRef]


| CaO | MgO | Al2O3 | Fe2O3 | SiO2 | K2O | Na2O | SO3 | LOI | |
|---|---|---|---|---|---|---|---|---|---|
| OPC | 61.6 | 2.9 | 4.5 | 3.6 | 19.8 | 1.2 | 0.3 | 2.1 | 1.2 |
| Specimens | W/B (-) | OPC (g) | P25 (g) | Sand (g) | SP (wt.% by Binder) | Slump (mm) |
|---|---|---|---|---|---|---|
| Plain | 0.5 | 1000 | - | 3000 | 0.3 | 120 |
| TP01 | 990 | 10 | 88 | |||
| TP03 | 970 | 30 | 66 | |||
| TP05 | 950 | 50 | 62 | |||
| TP10 | 900 | 100 | 60 |
| Sample | Porosity (%) | ||||
|---|---|---|---|---|---|
| Plain | TP1 | TP3 | TP5 | TP10 | |
| 7 days | 20.40 | 19.57 | 19.27 | 18.55 | 20.61 |
| 28 days | 18.46 | 18.07 | 17.05 | 17.05 | 17.48 |
| 91 days | 14.15 | 13.90 | 13.15 | 13.15 | 13.89 |
Disclaimer/Publisher’s Note: The statements, opinions and data contained in all publications are solely those of the individual author(s) and contributor(s) and not of MDPI and/or the editor(s). MDPI and/or the editor(s) disclaim responsibility for any injury to people or property resulting from any ideas, methods, instructions or products referred to in the content. |
© 2024 by the author. Licensee MDPI, Basel, Switzerland. This article is an open access article distributed under the terms and conditions of the Creative Commons Attribution (CC BY) license (https://creativecommons.org/licenses/by/4.0/).
Share and Cite
Choi, Y.-C. Degree of Hydration, Microstructure, and Mechanical Properties of Cement-Modified TiO2 Nanoparticles. Materials 2024, 17, 4541. https://doi.org/10.3390/ma17184541
Choi Y-C. Degree of Hydration, Microstructure, and Mechanical Properties of Cement-Modified TiO2 Nanoparticles. Materials. 2024; 17(18):4541. https://doi.org/10.3390/ma17184541
Chicago/Turabian StyleChoi, Young-Cheol. 2024. "Degree of Hydration, Microstructure, and Mechanical Properties of Cement-Modified TiO2 Nanoparticles" Materials 17, no. 18: 4541. https://doi.org/10.3390/ma17184541
APA StyleChoi, Y.-C. (2024). Degree of Hydration, Microstructure, and Mechanical Properties of Cement-Modified TiO2 Nanoparticles. Materials, 17(18), 4541. https://doi.org/10.3390/ma17184541