Study on Prestressed Concrete Beams Strengthened with External Unbonded CFRP Tendons


Abstract
1. Introduction
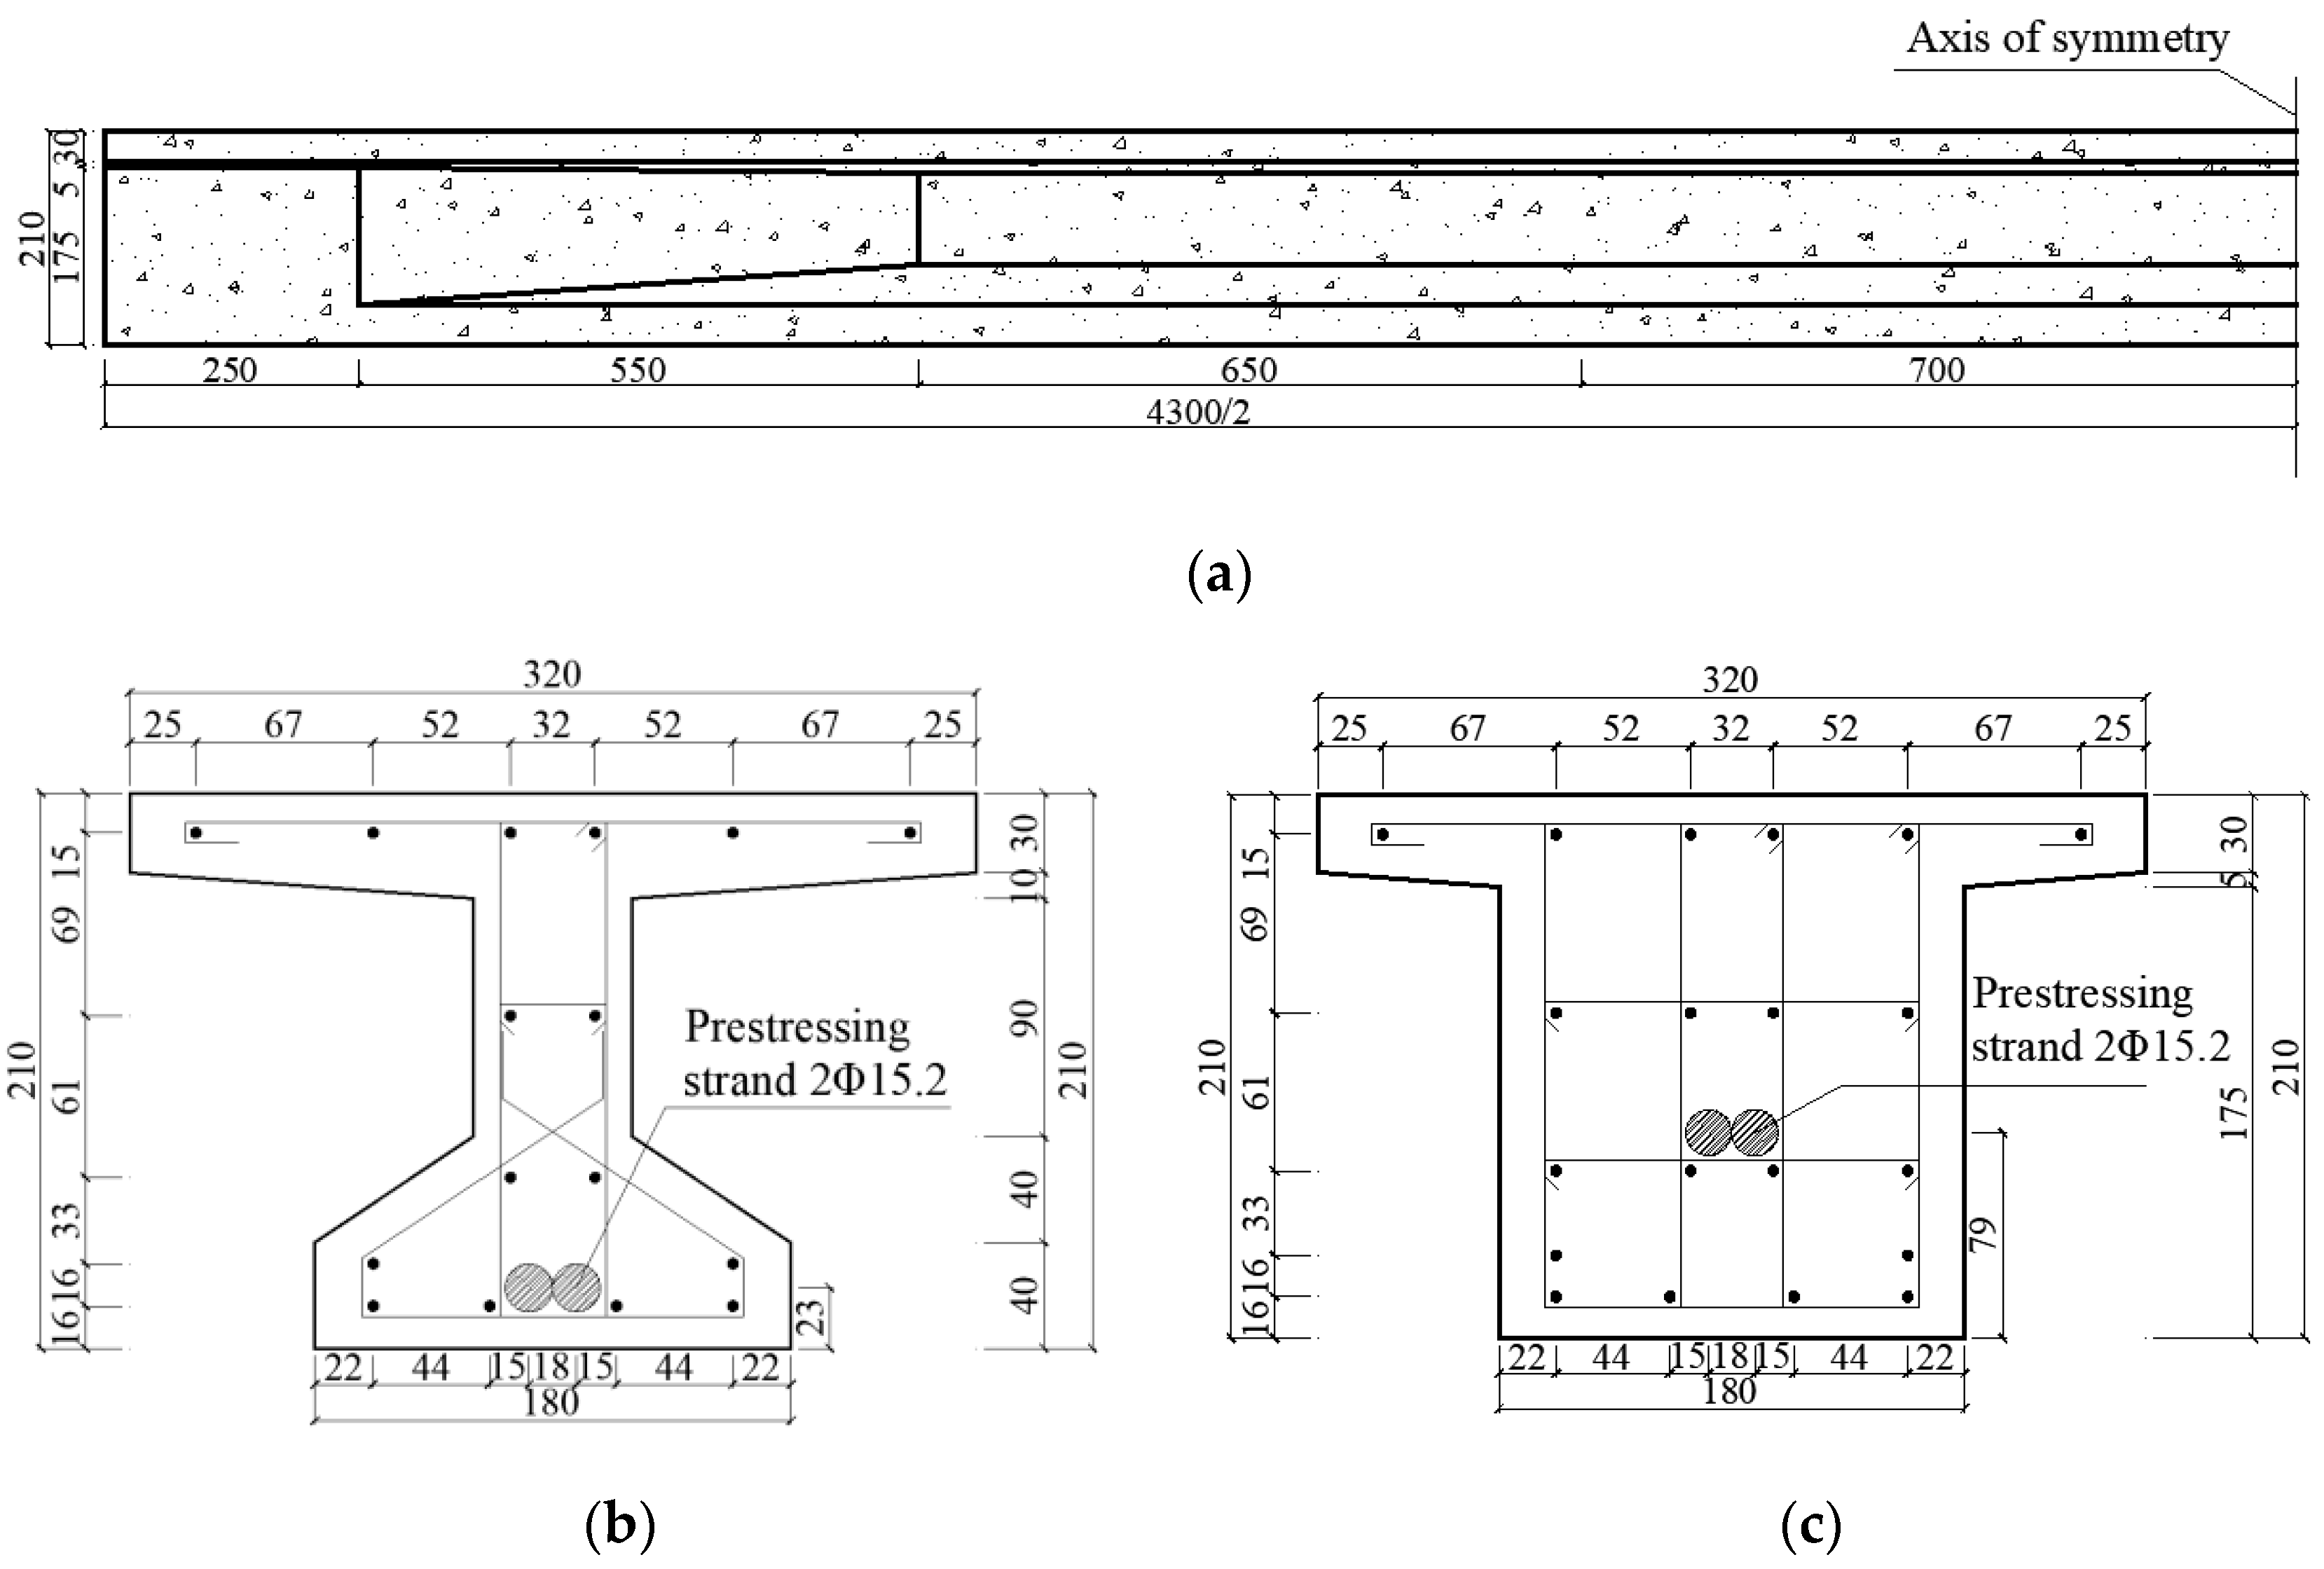
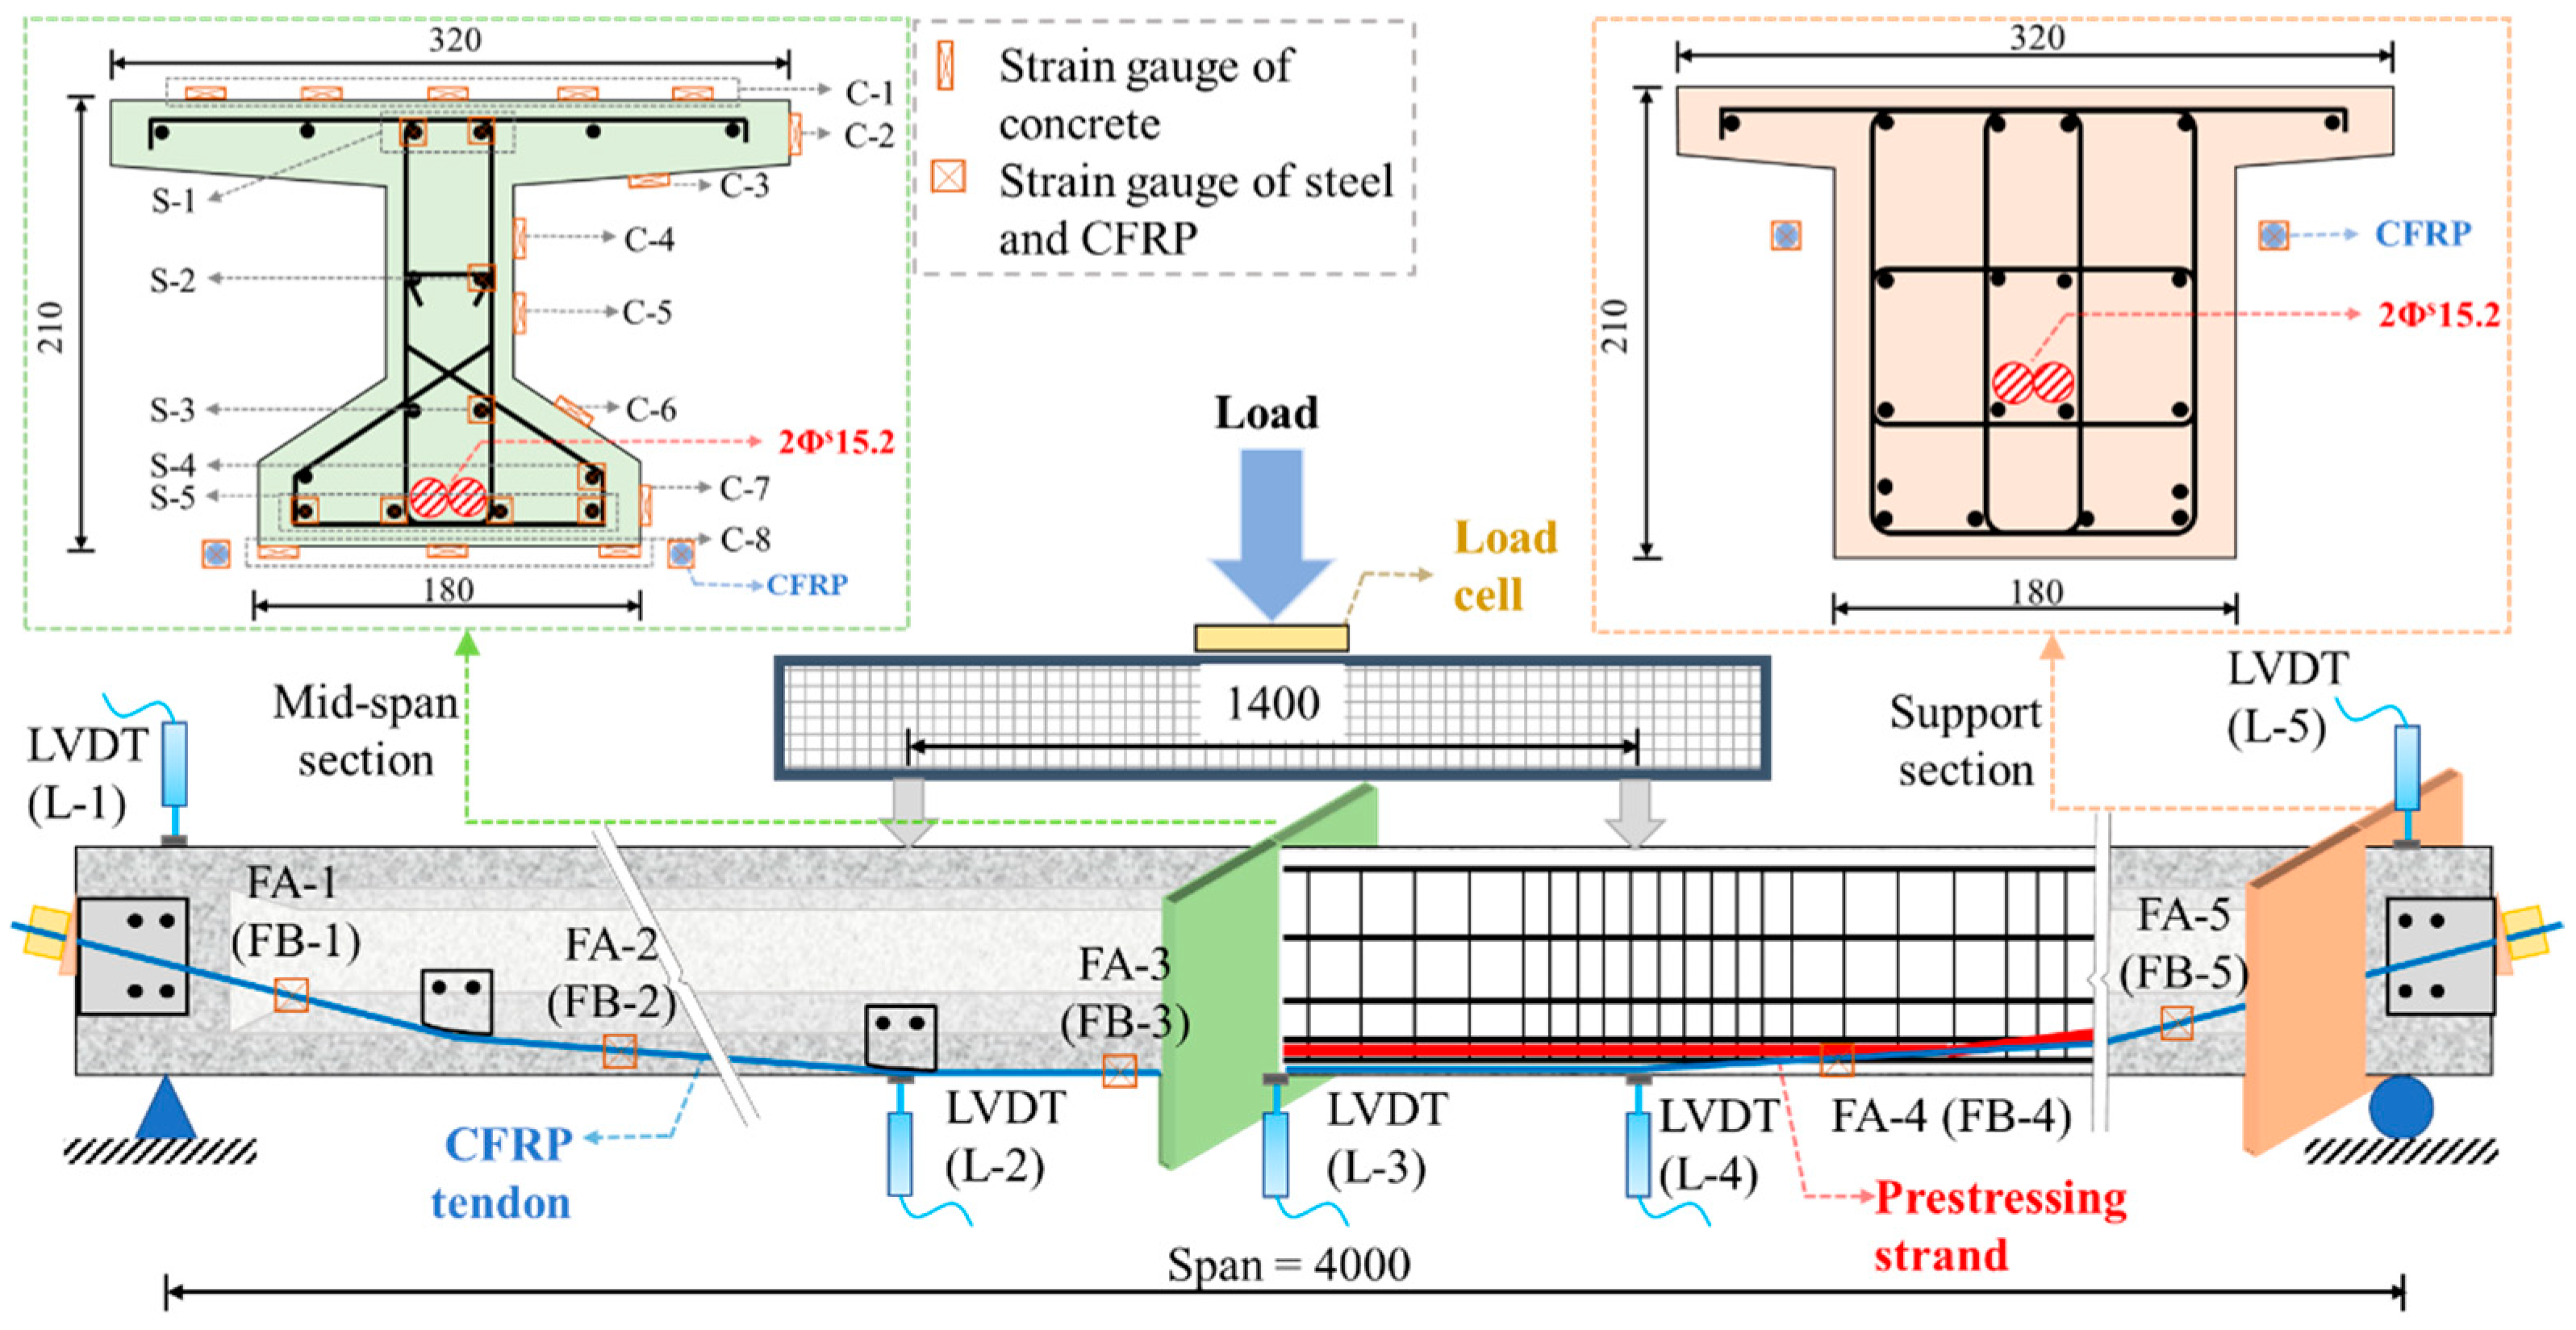
2. Experimental Work
3. Numerical Model
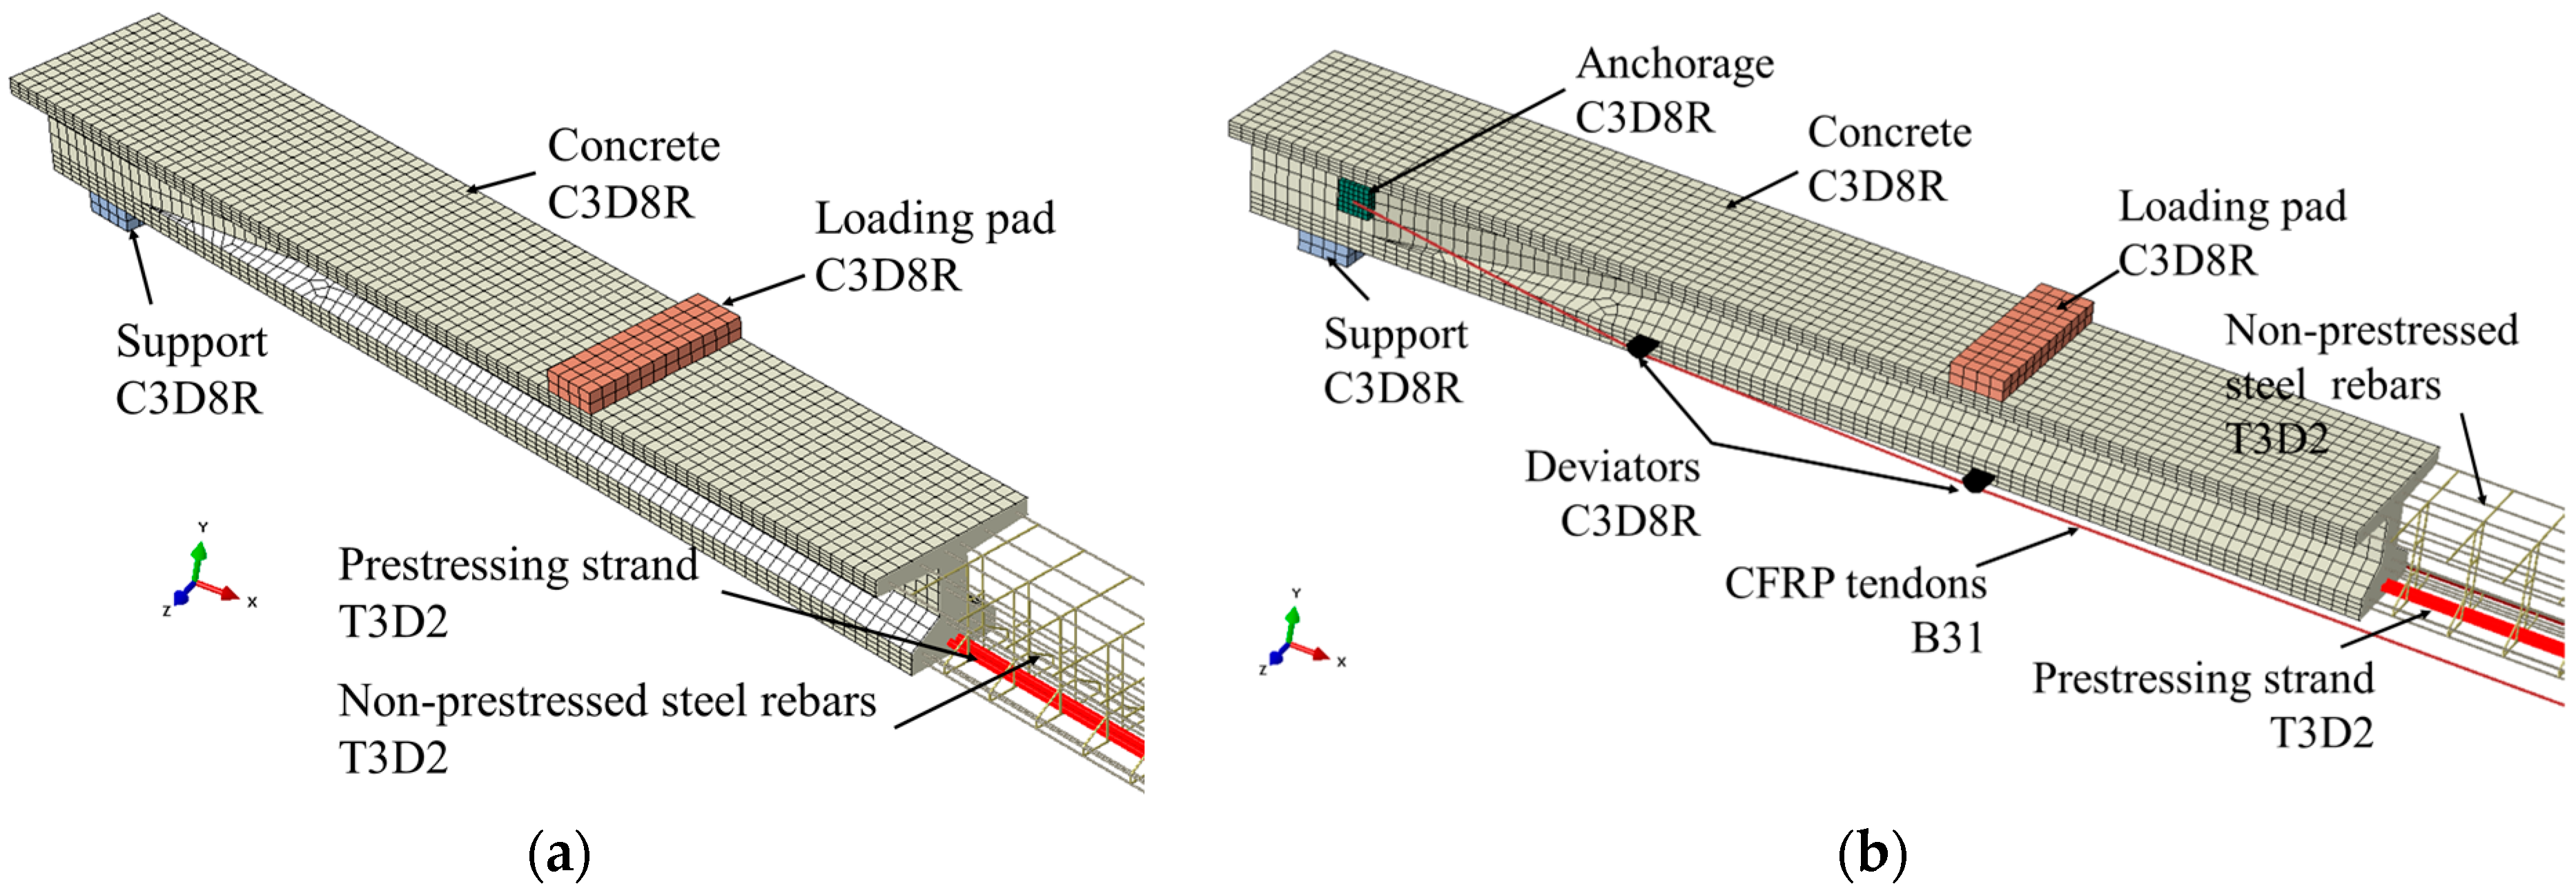
3.1. FE Model
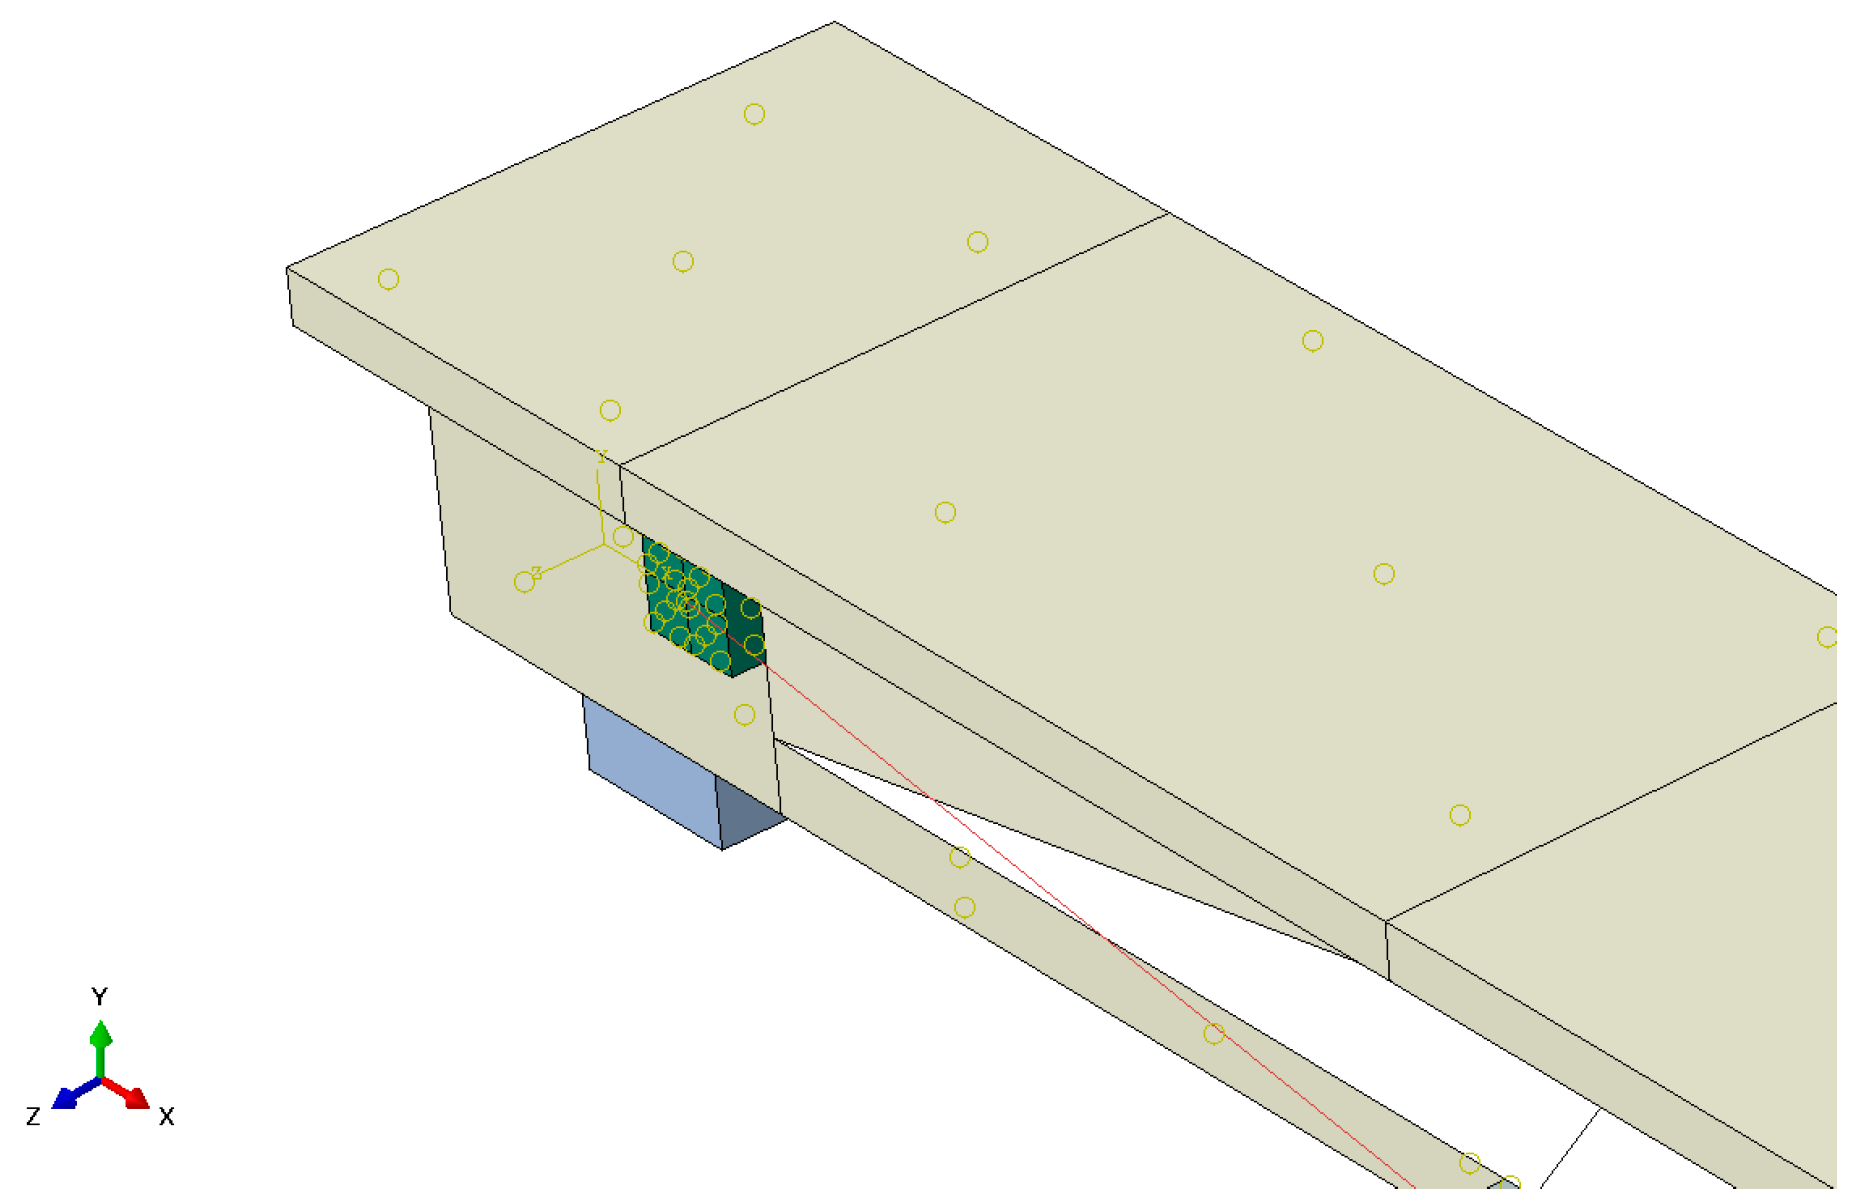
3.2. Element Types and Mesh
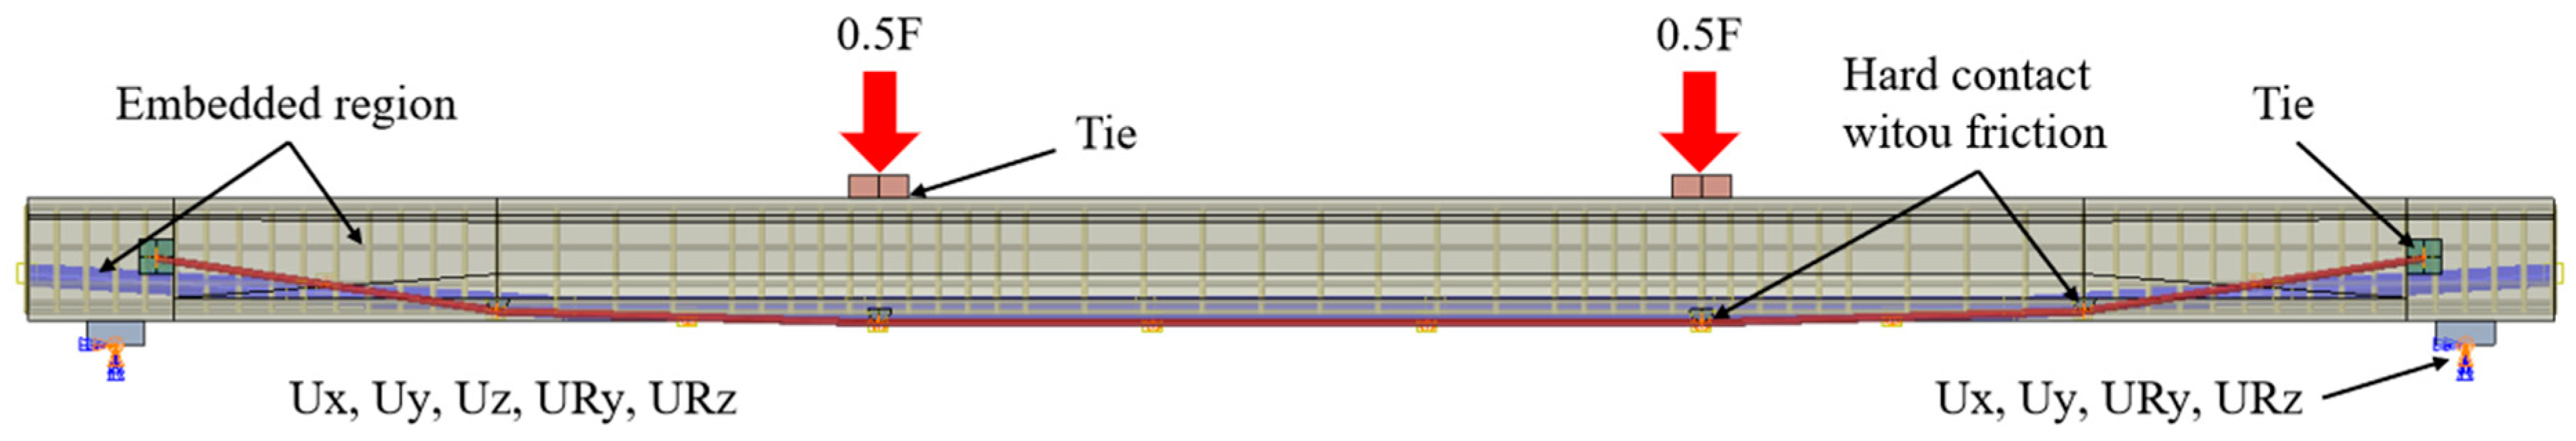
3.3. Constraints, Boundary and Loading Conditions
3.4. Material Characteristics
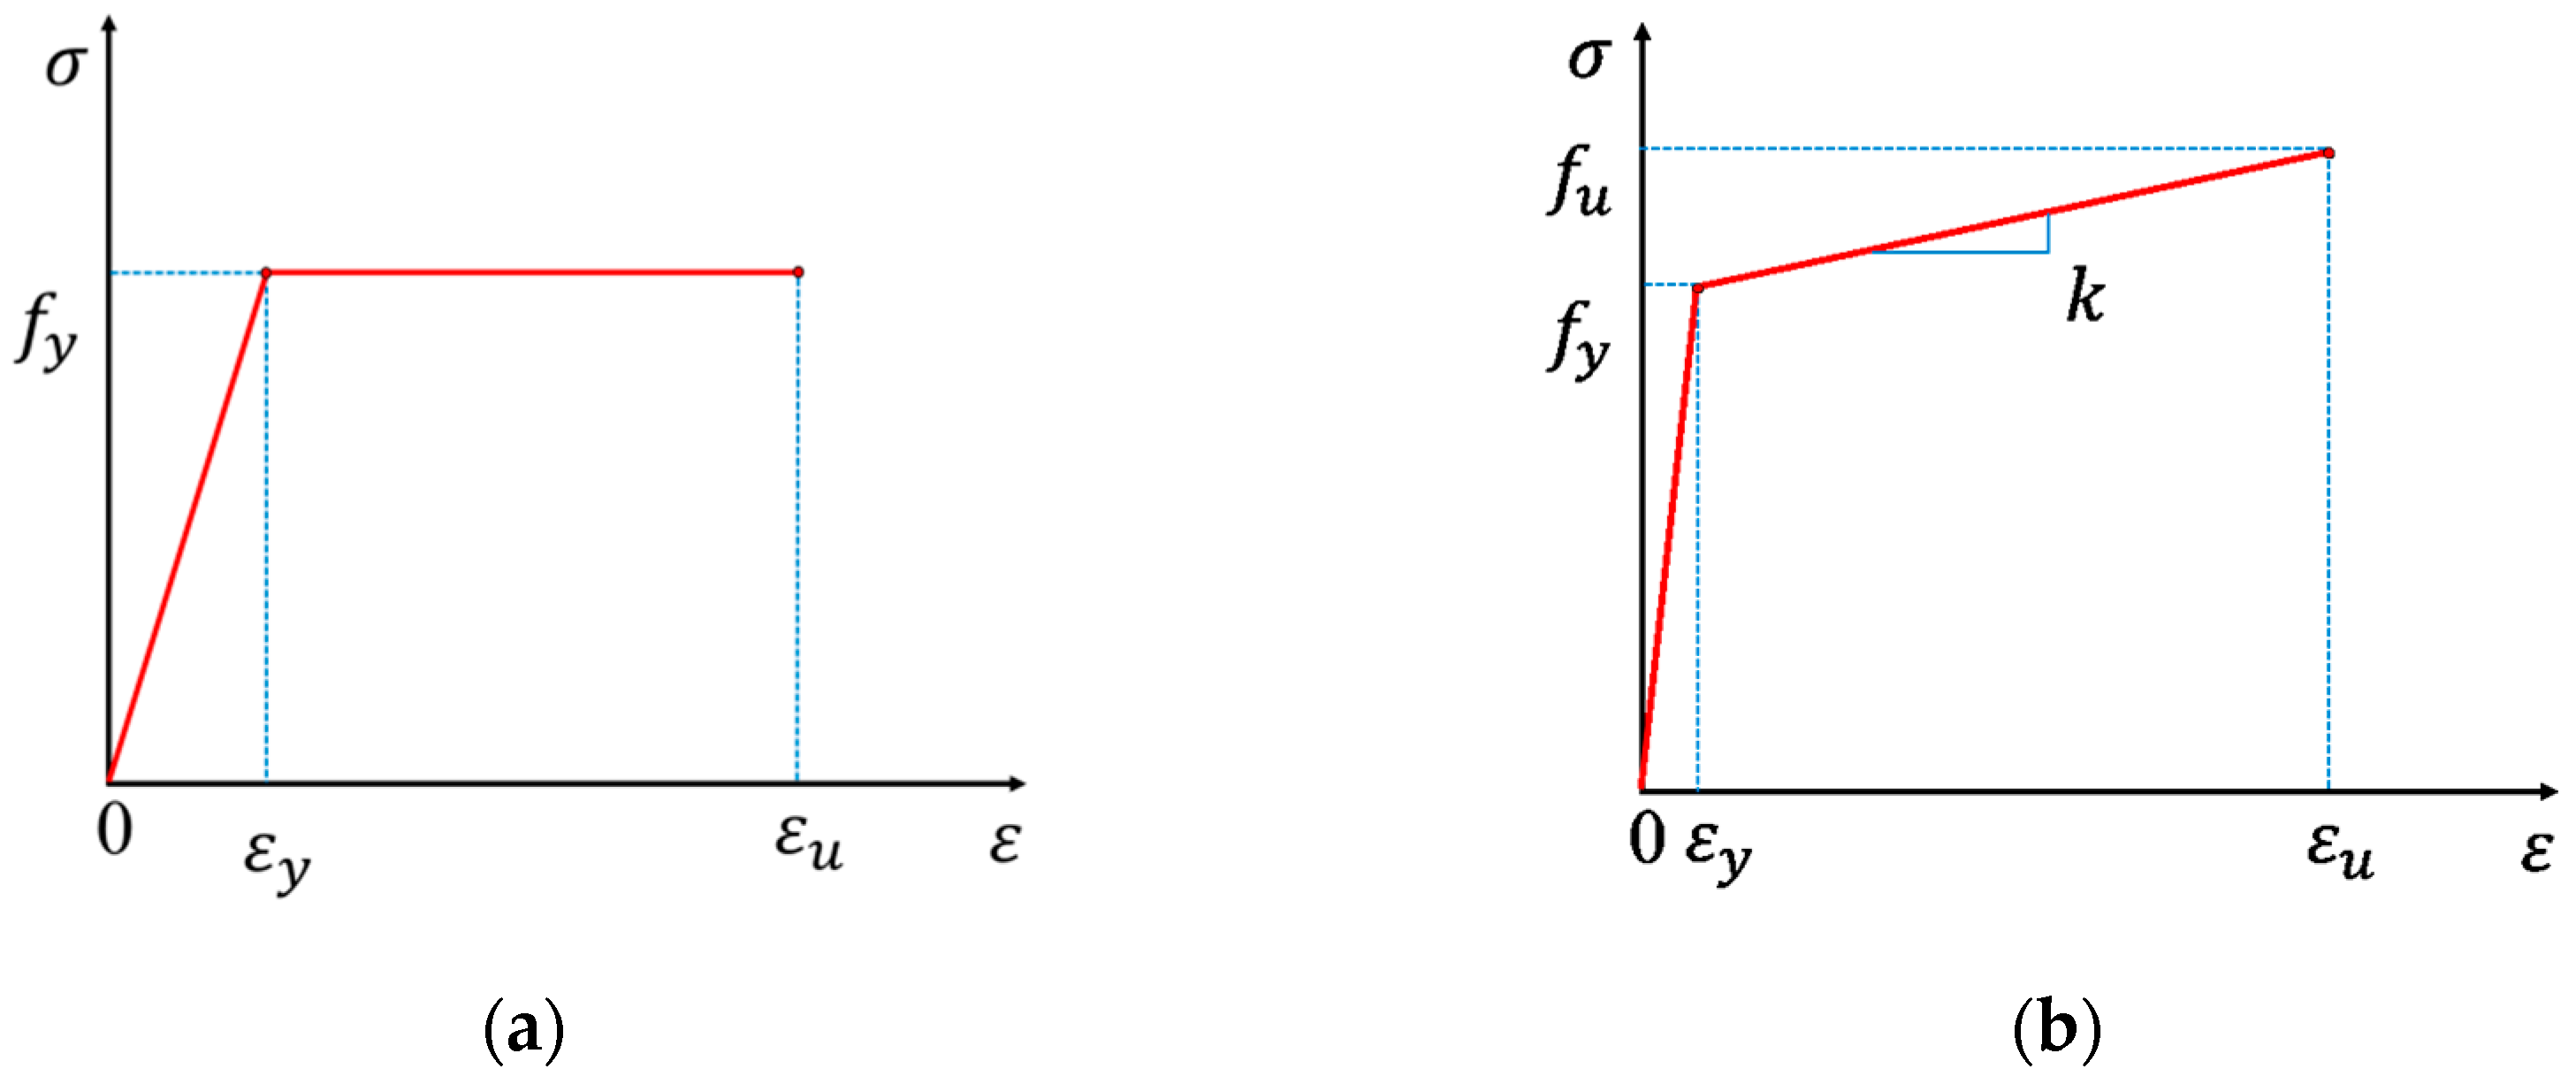
3.4.1. Steel
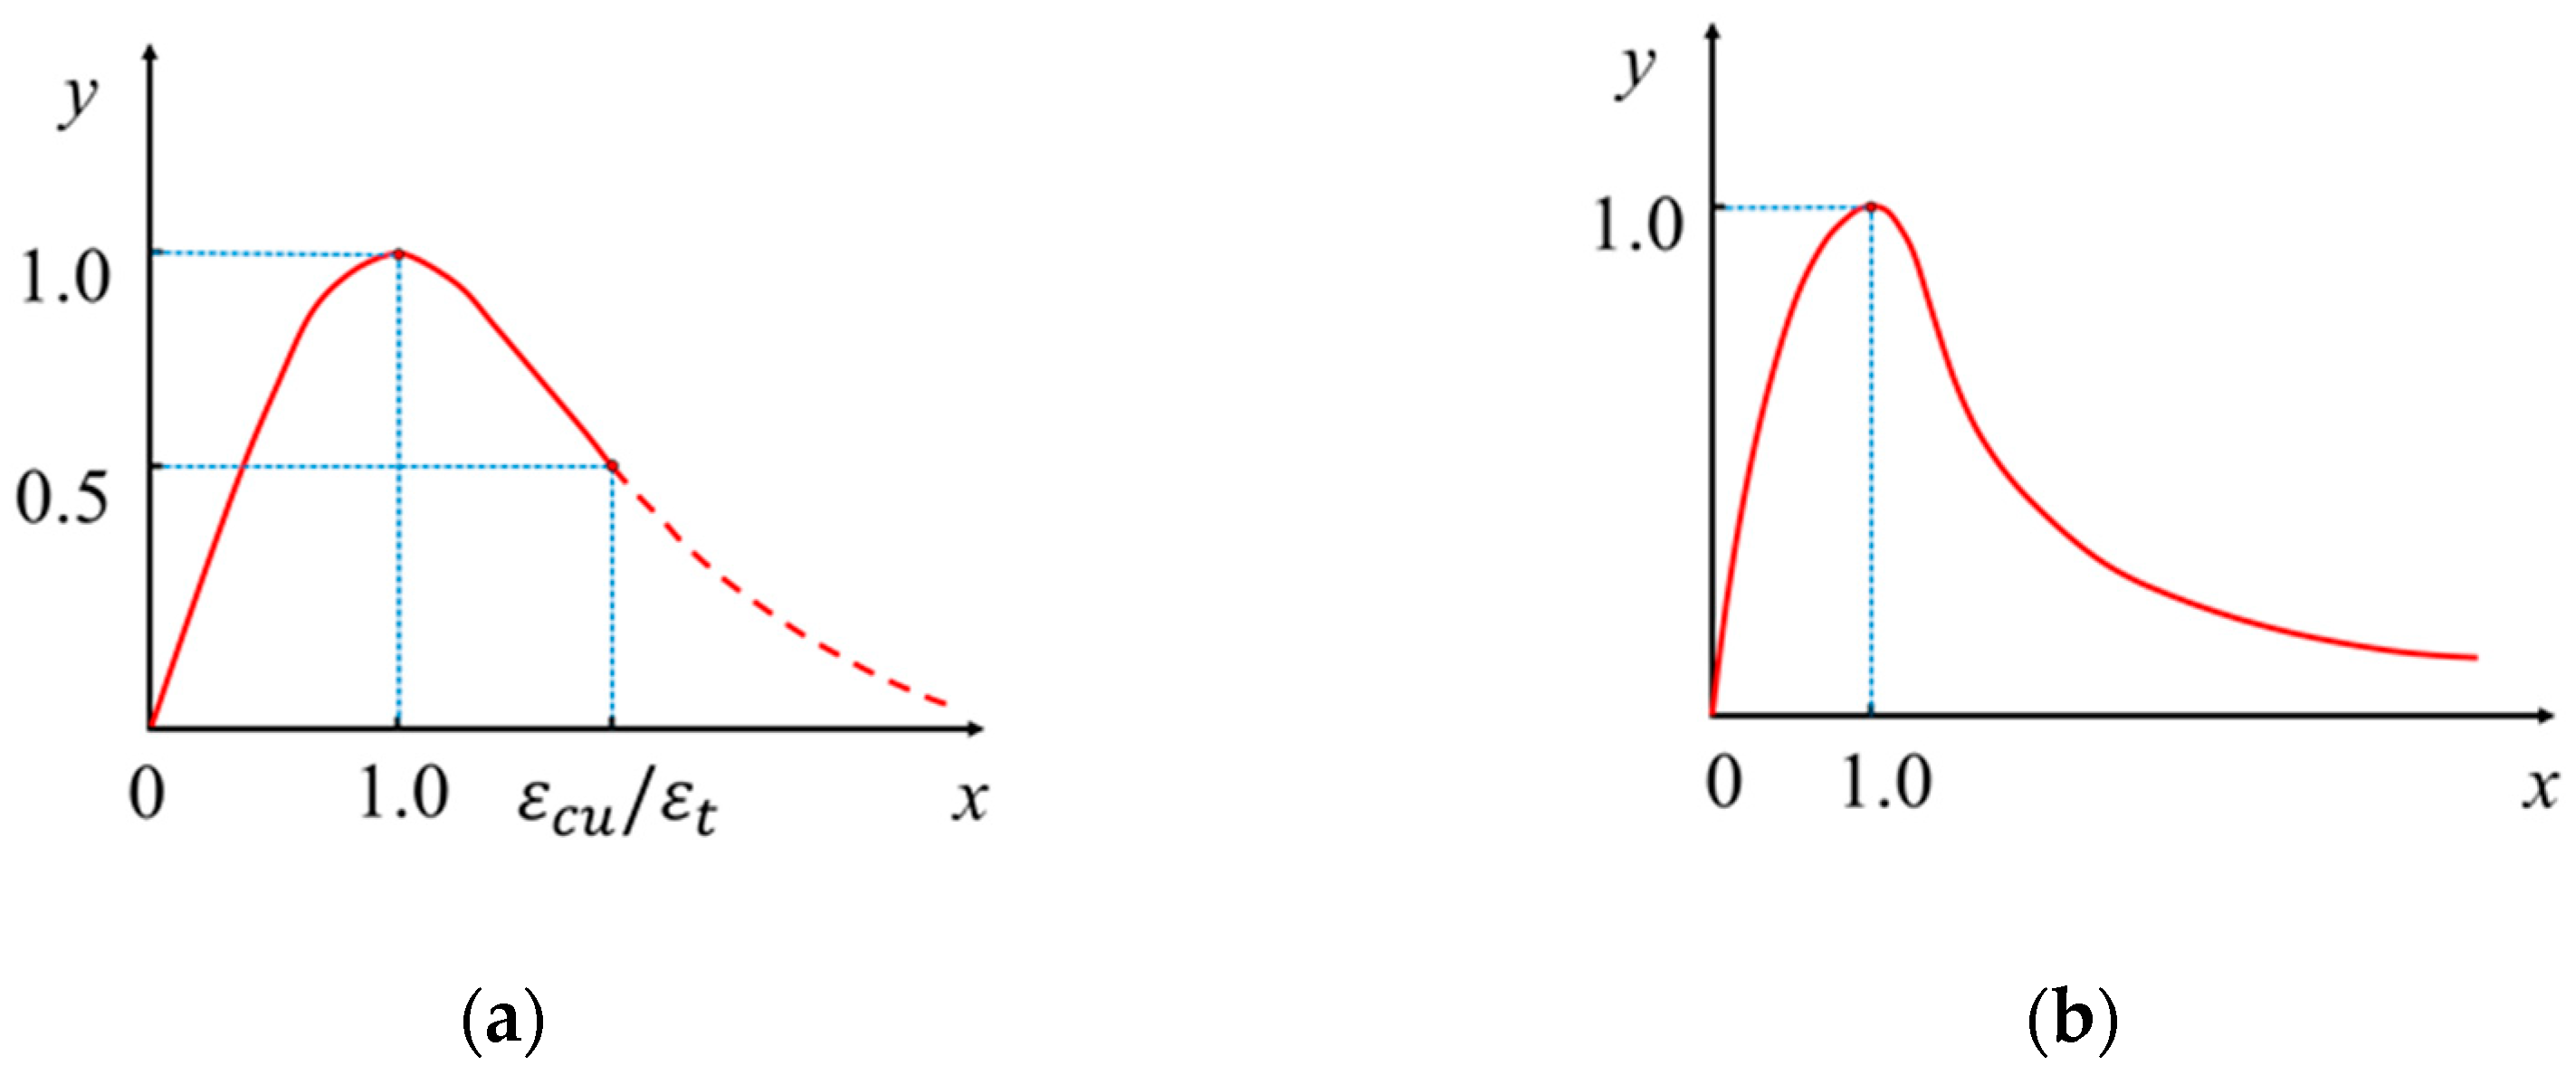
3.4.2. Concrete
3.4.3. CFRP
4. Validation of the Numerical Model
4.1. Primary Results
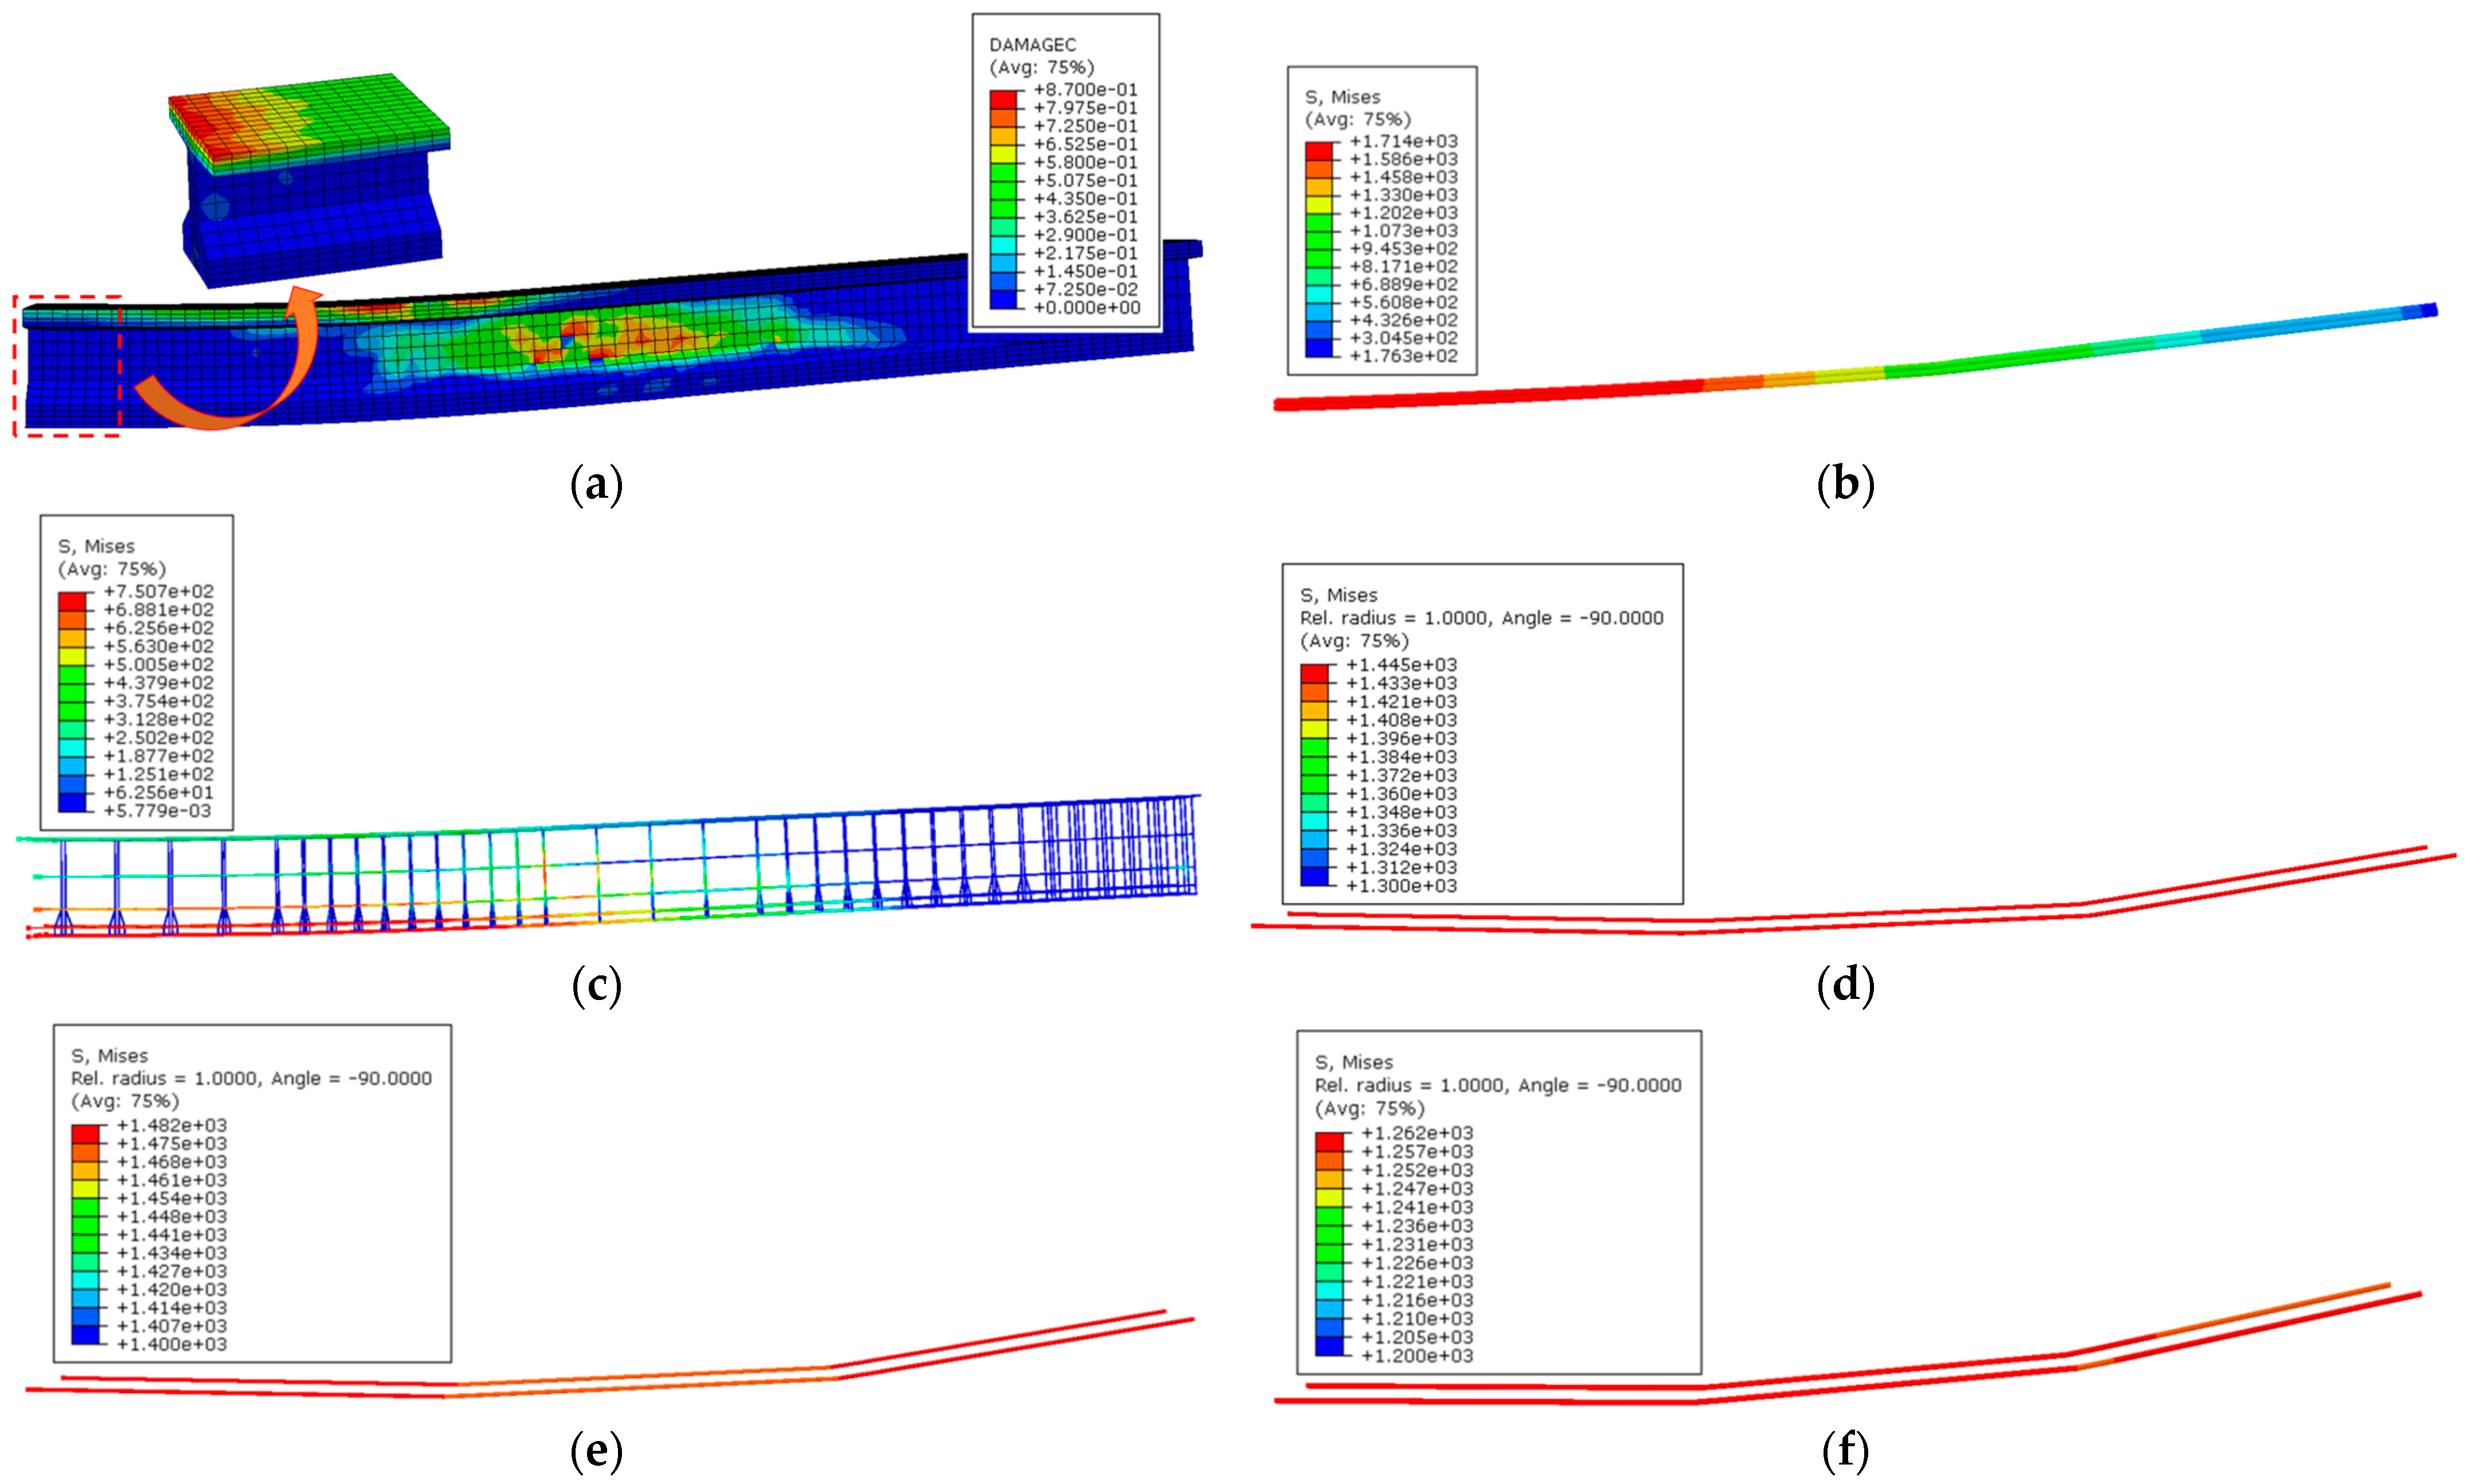
4.2. Failure Mode
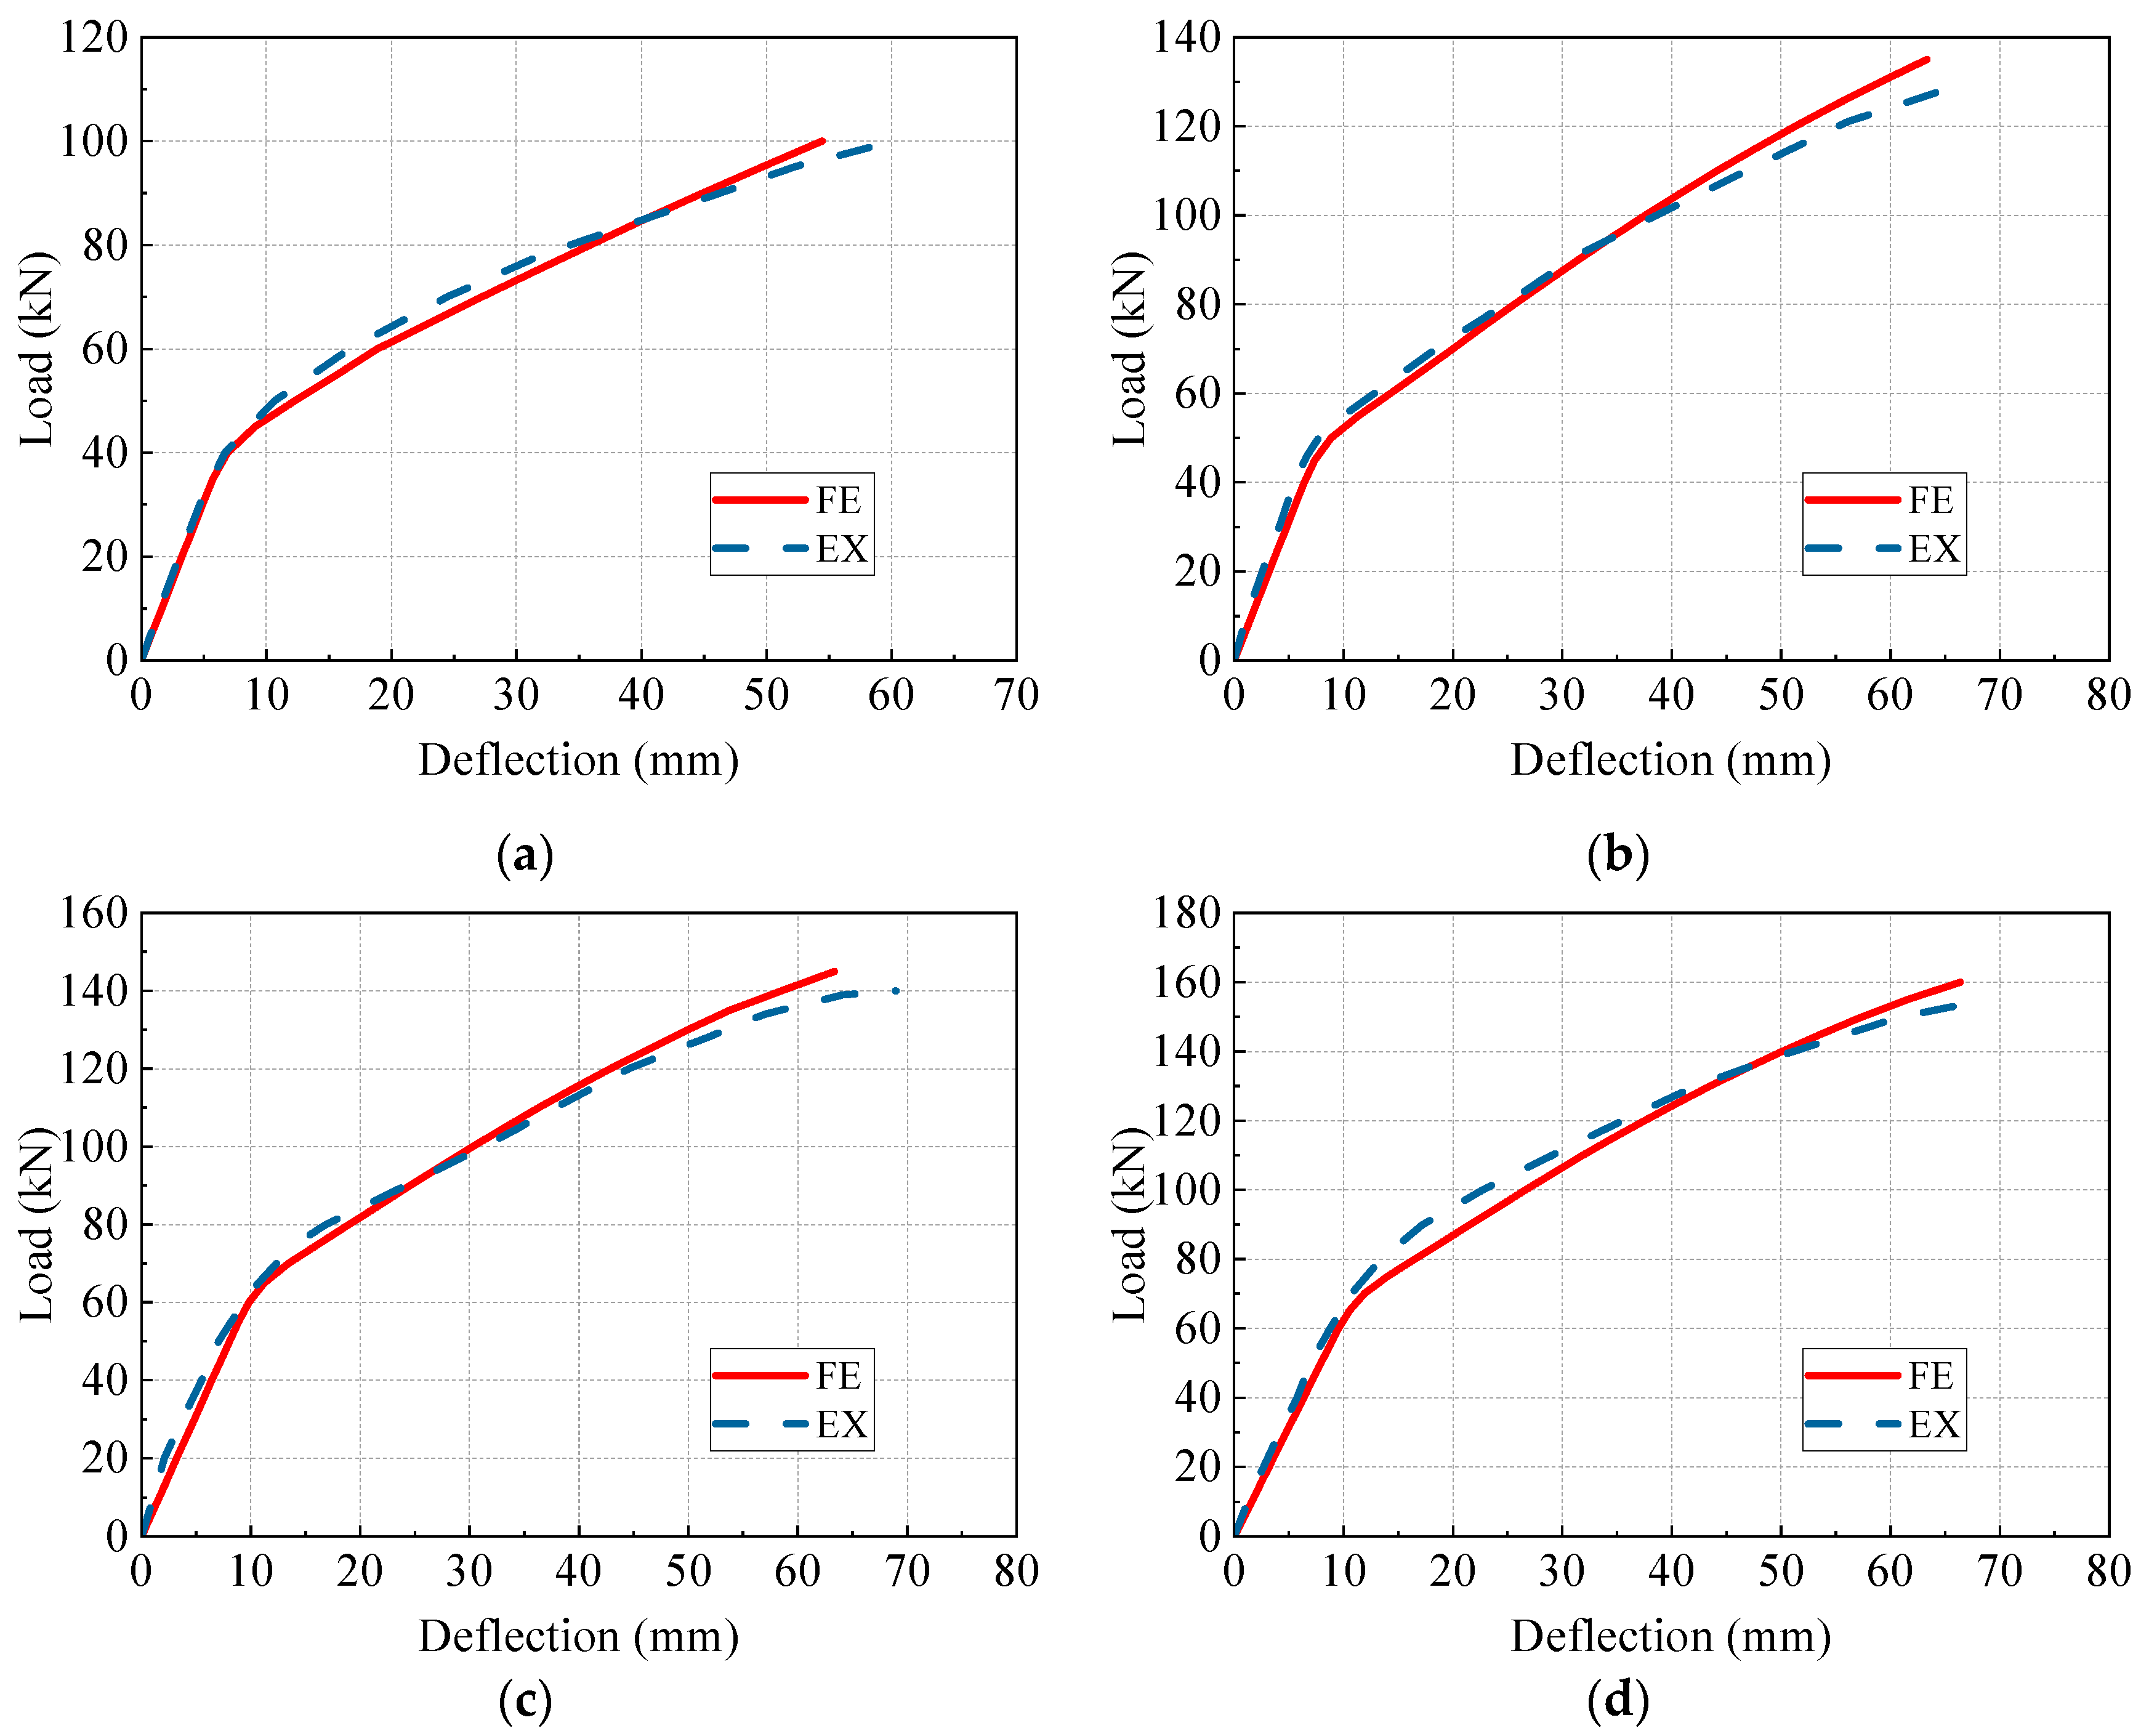
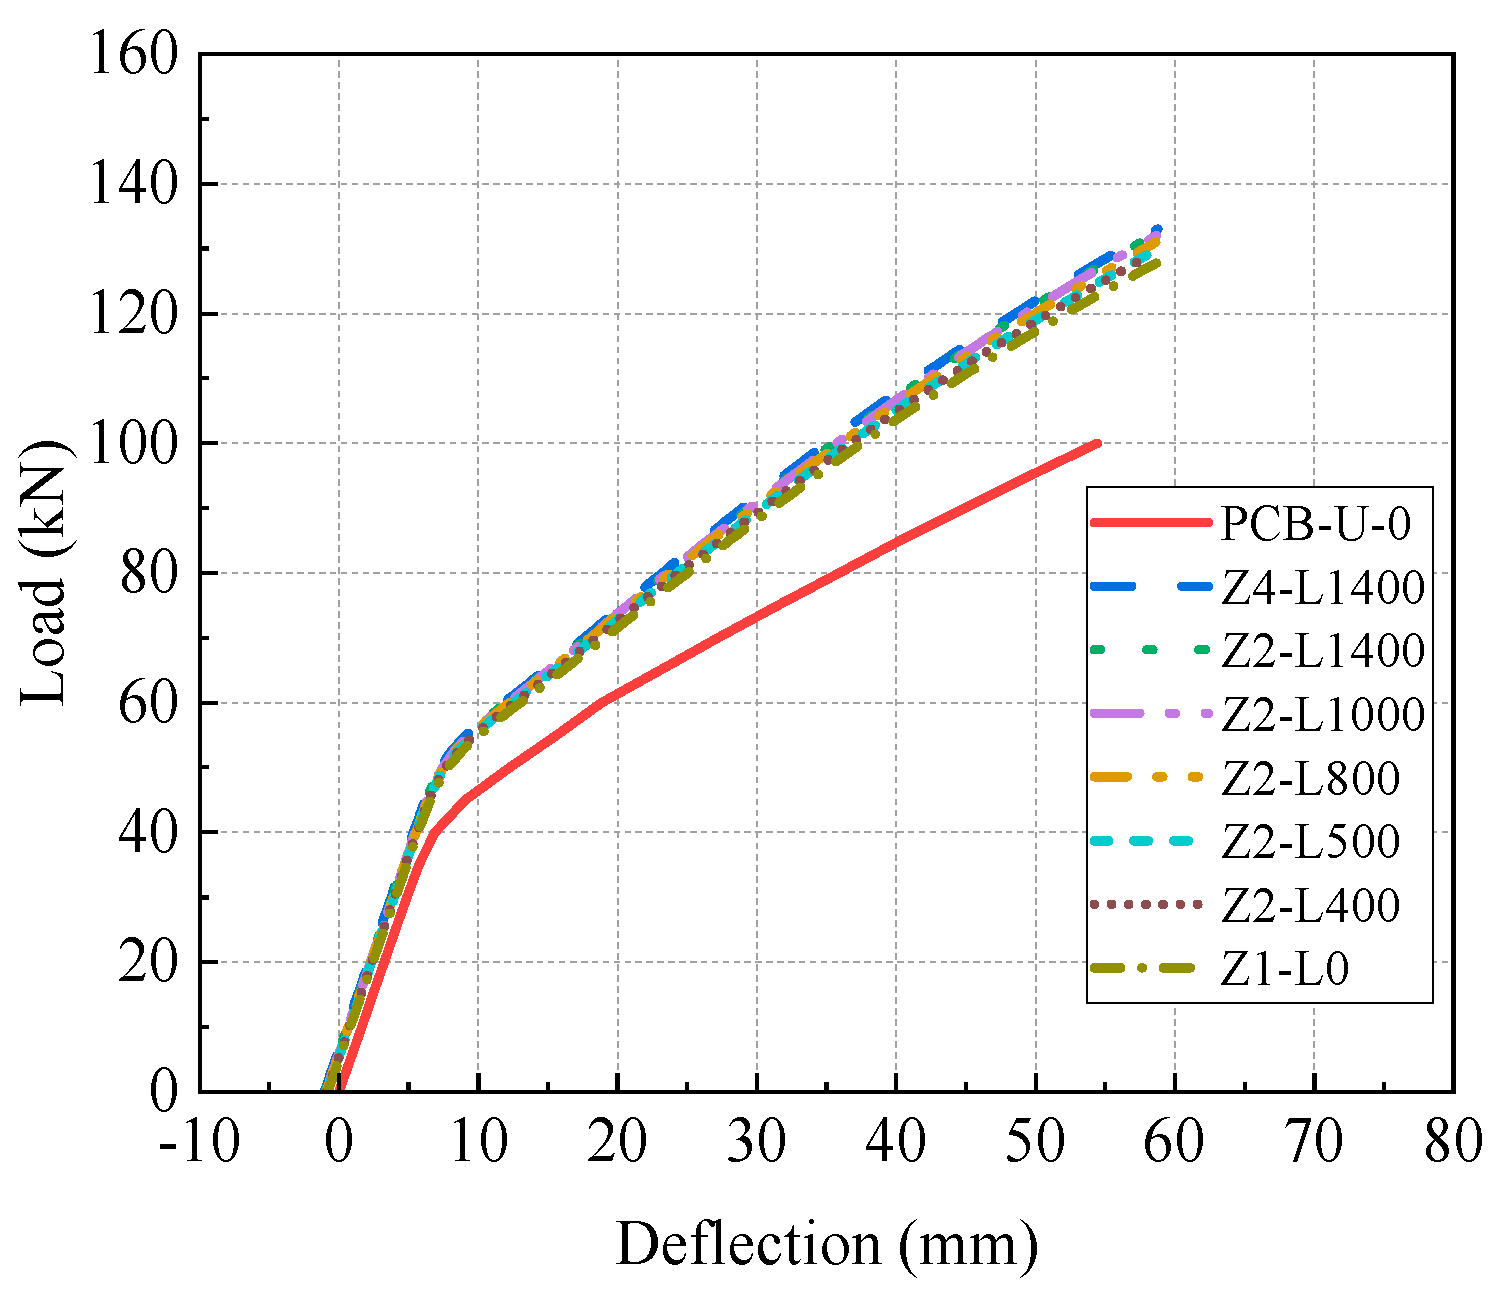
4.3. Load-Deflection Curves
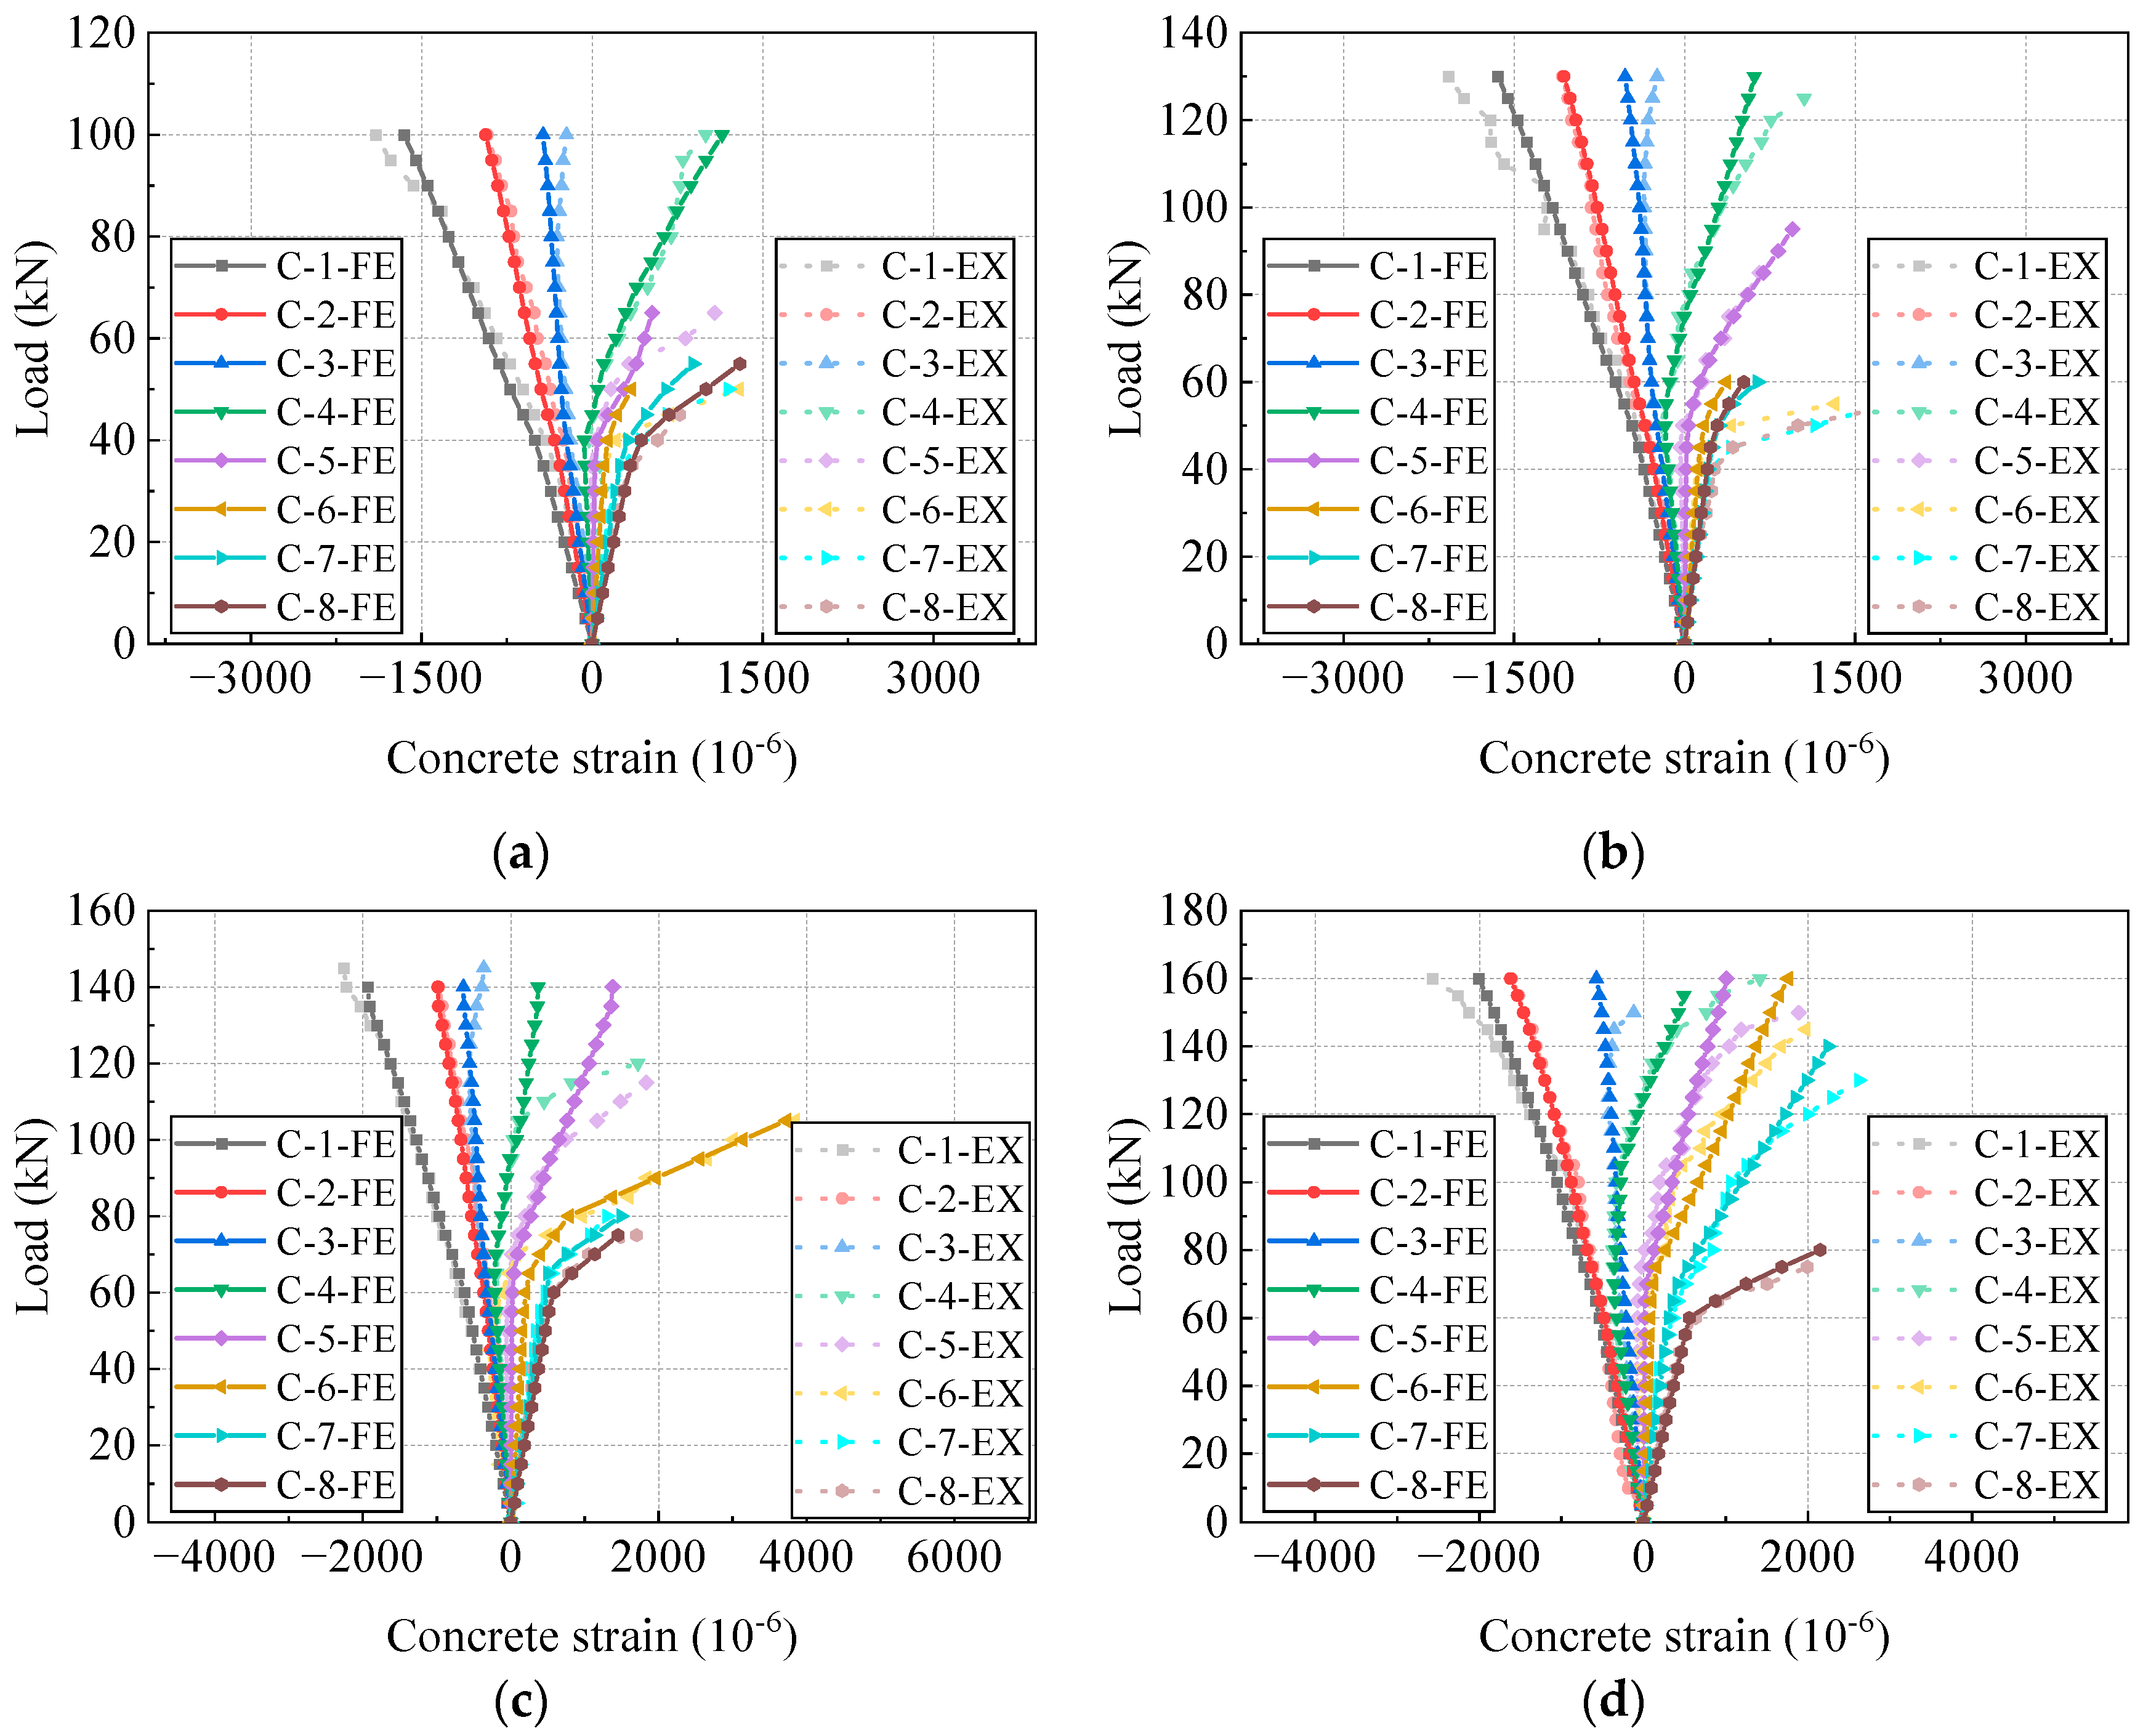
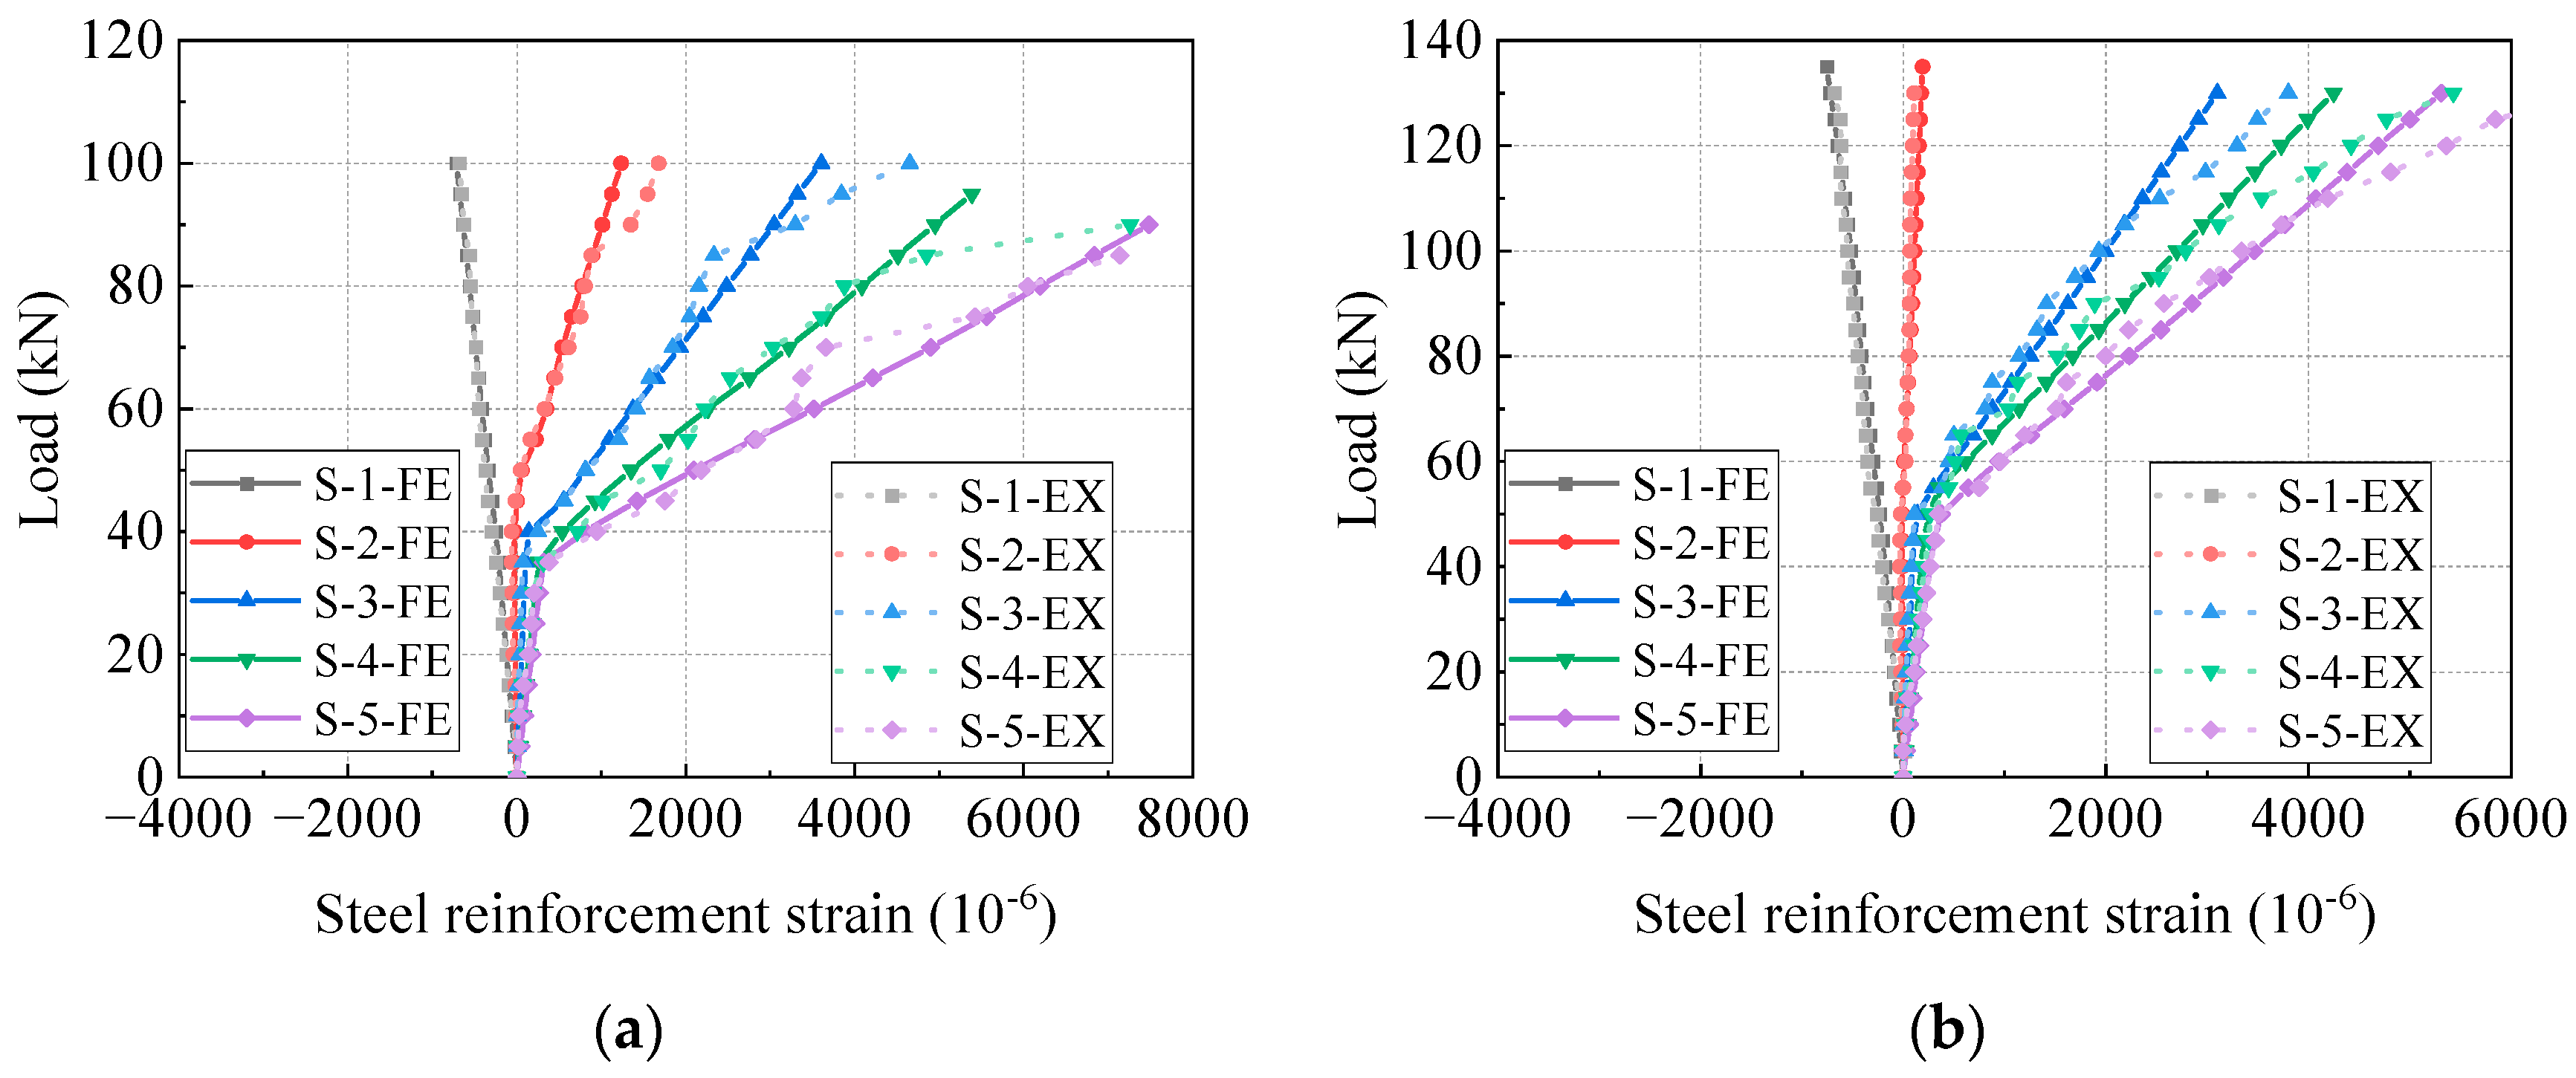
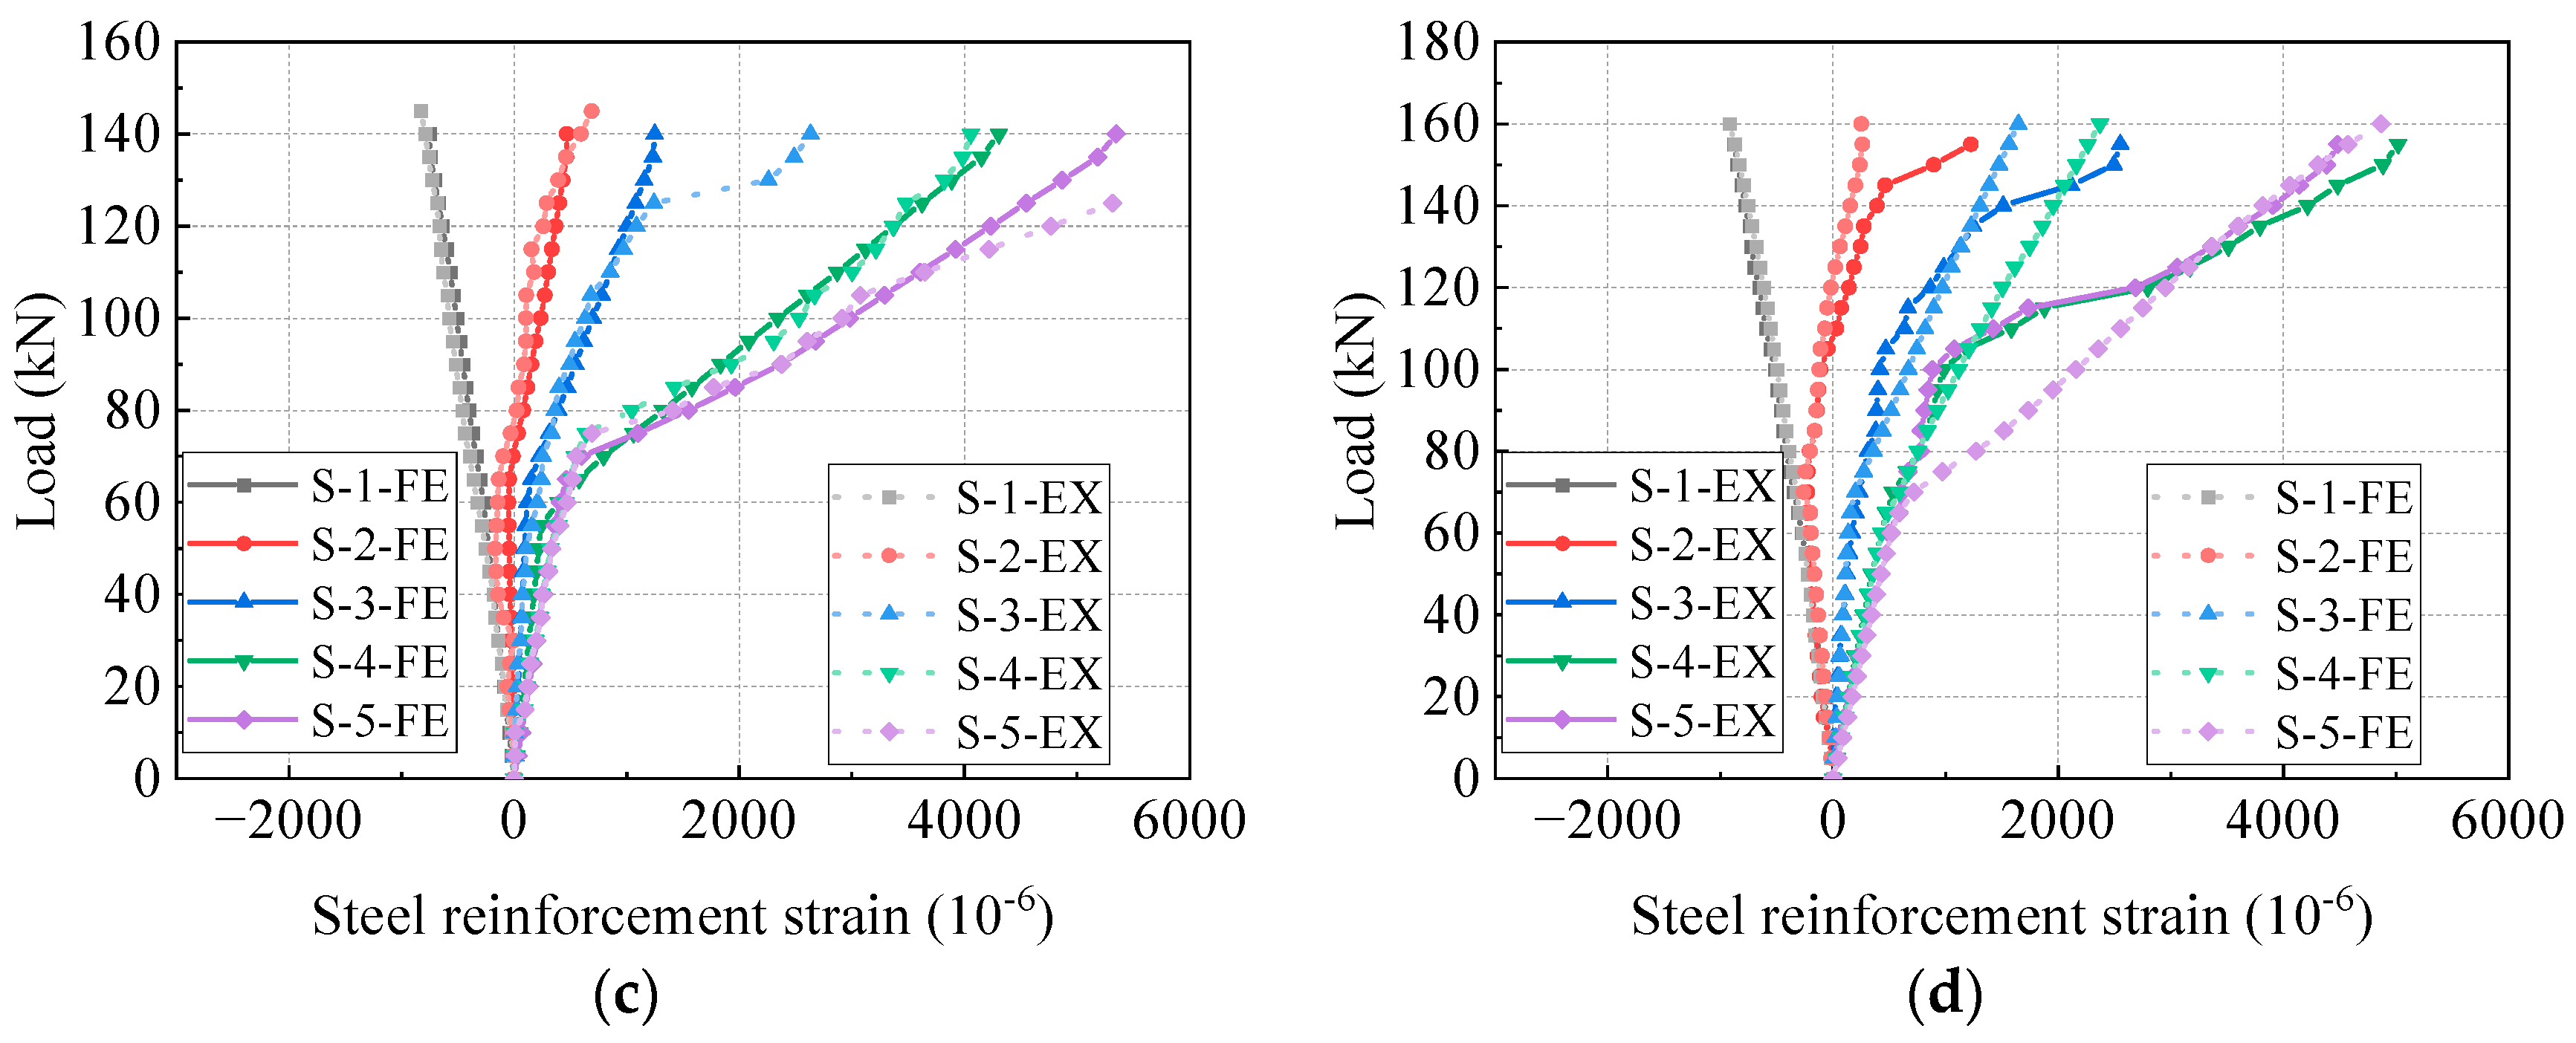
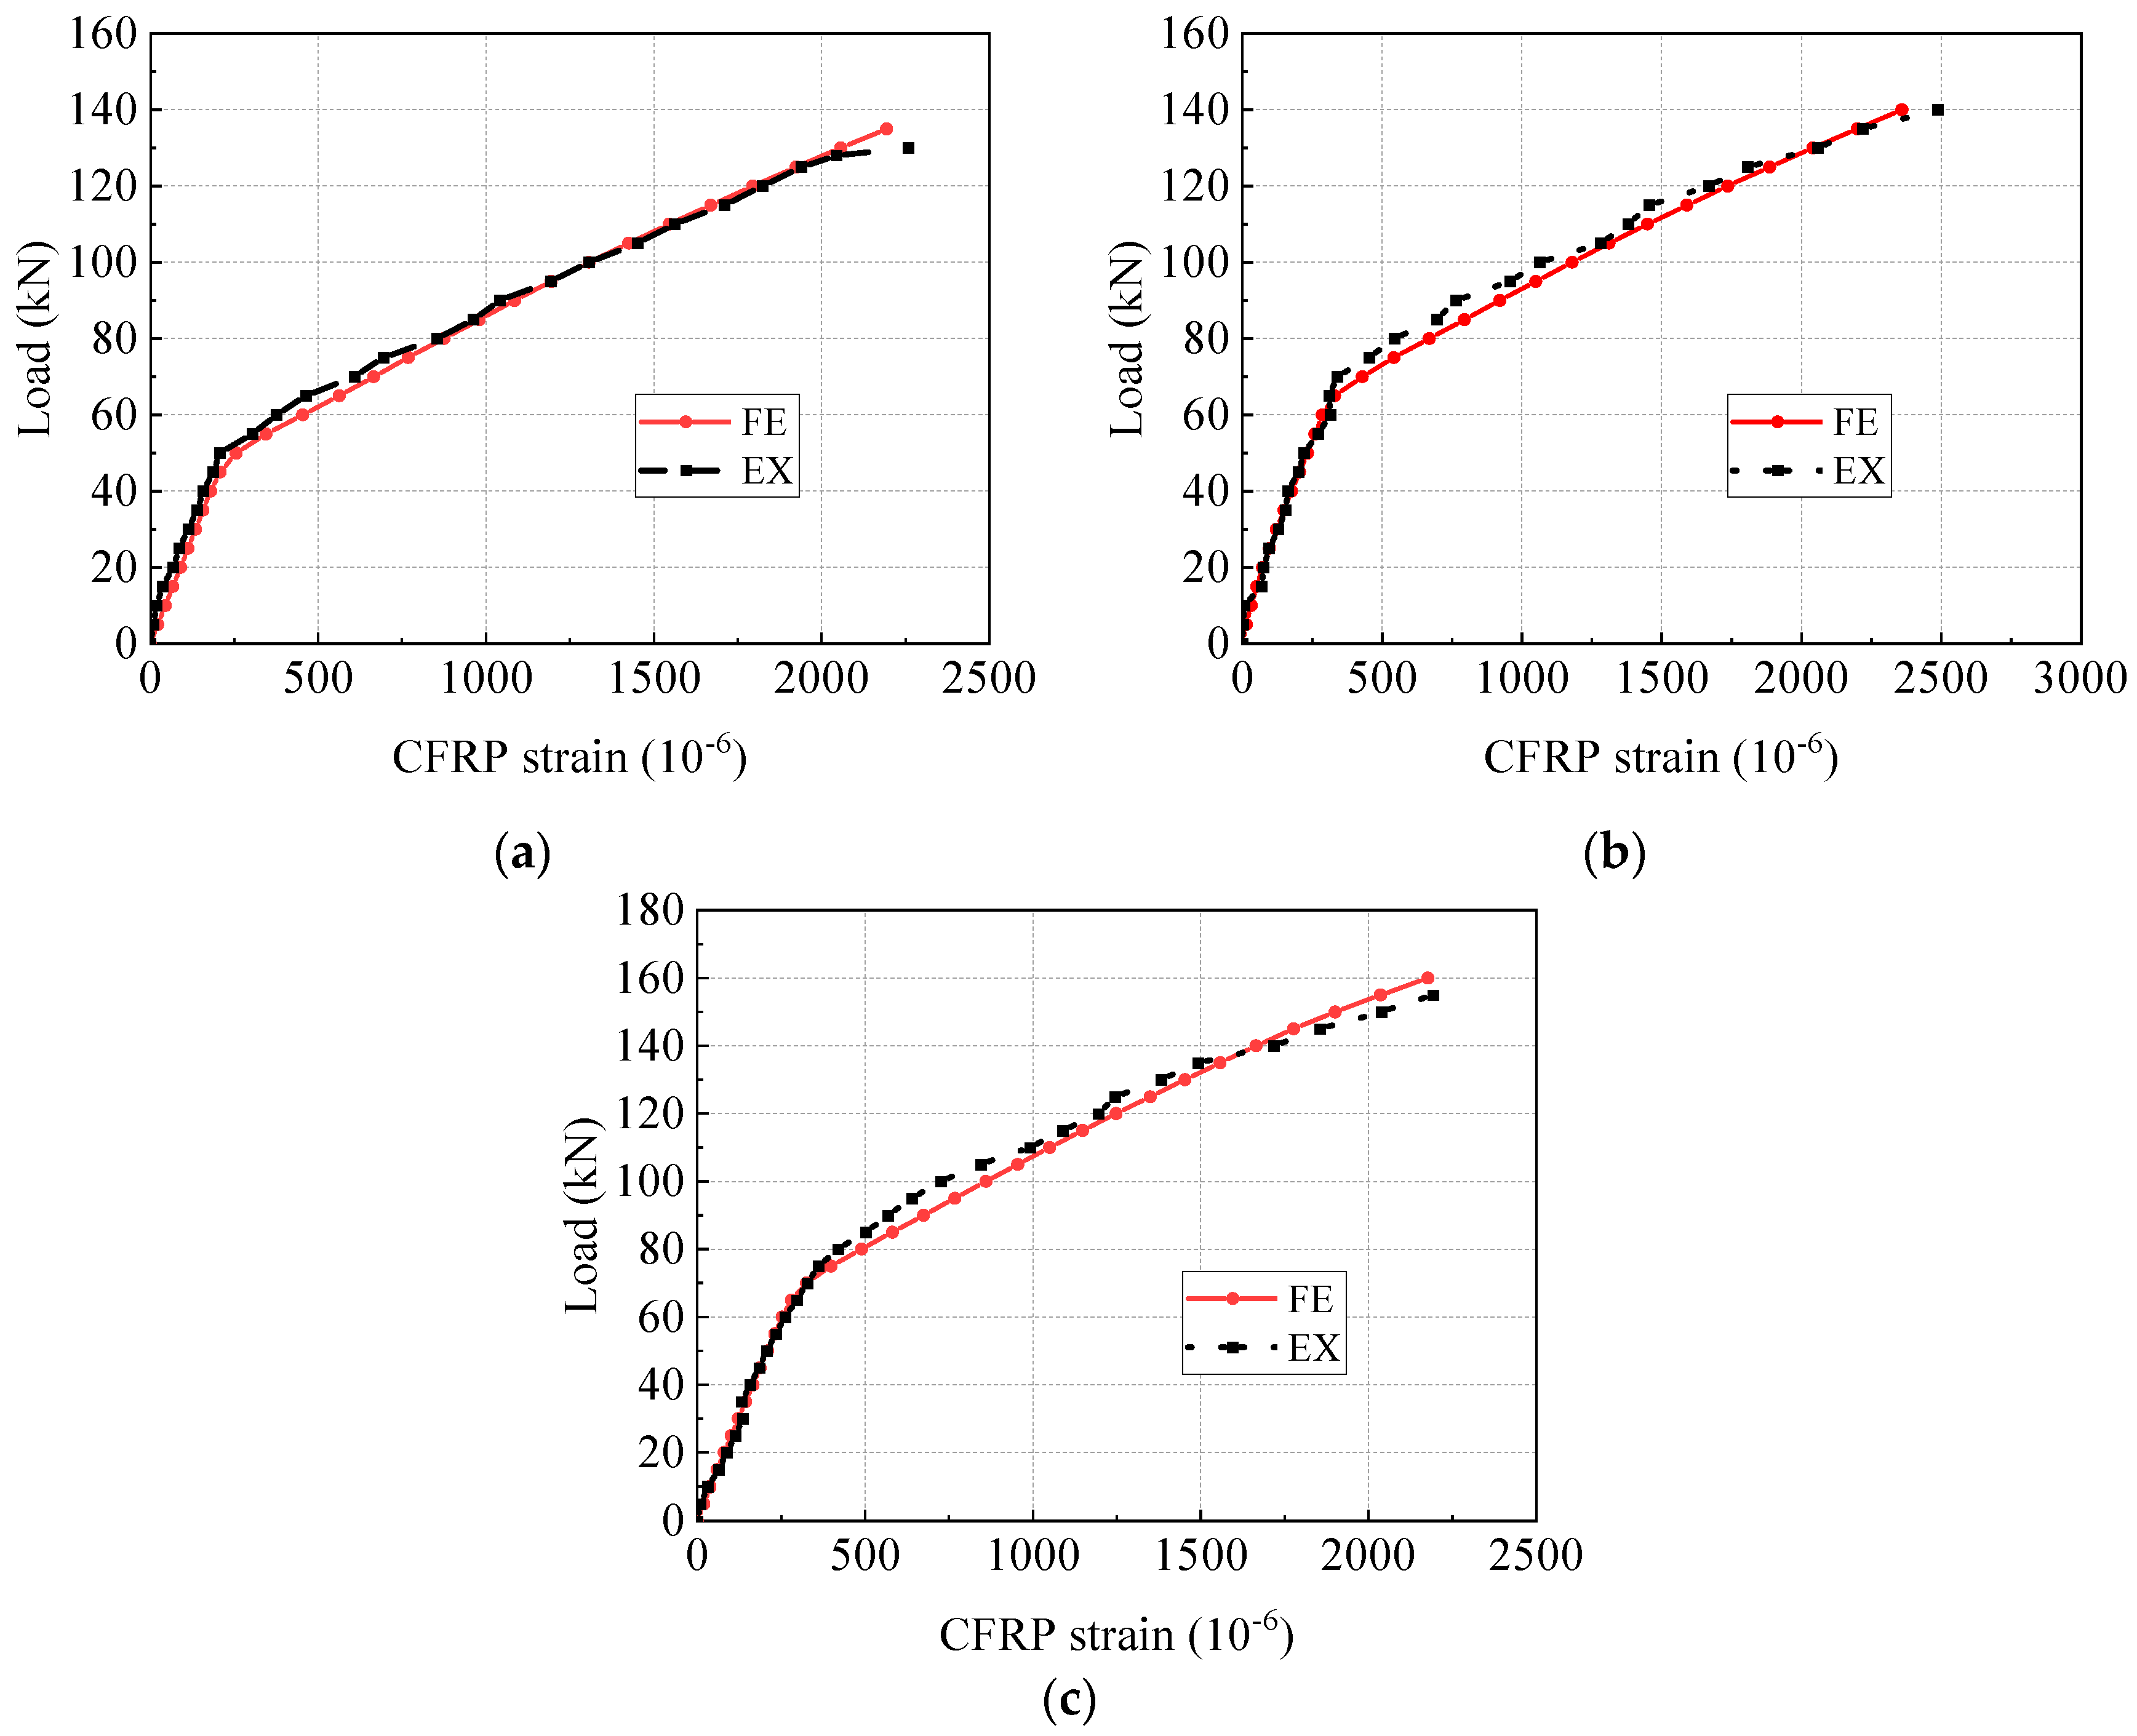
4.4. Load-Strain Curves
5. Parametric Study
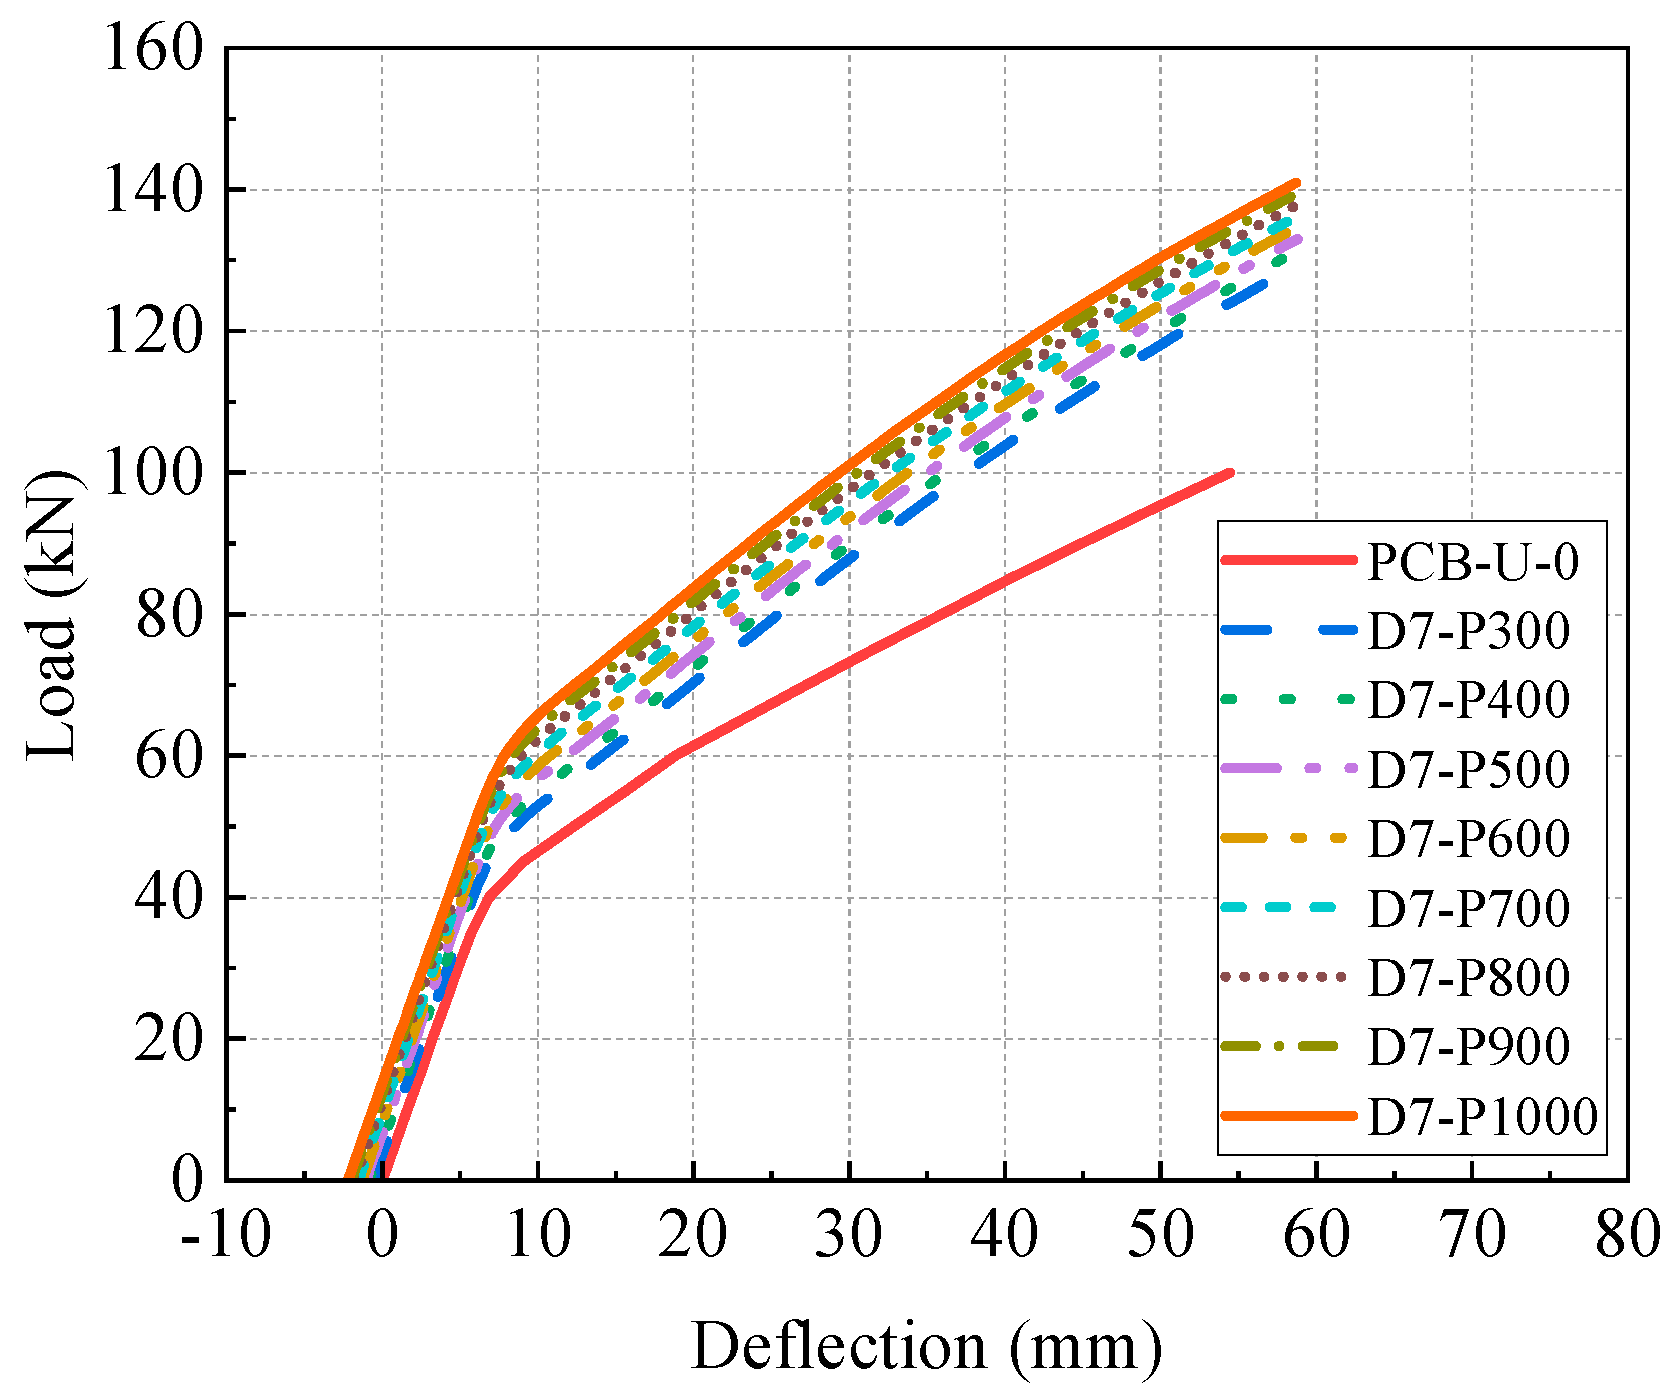
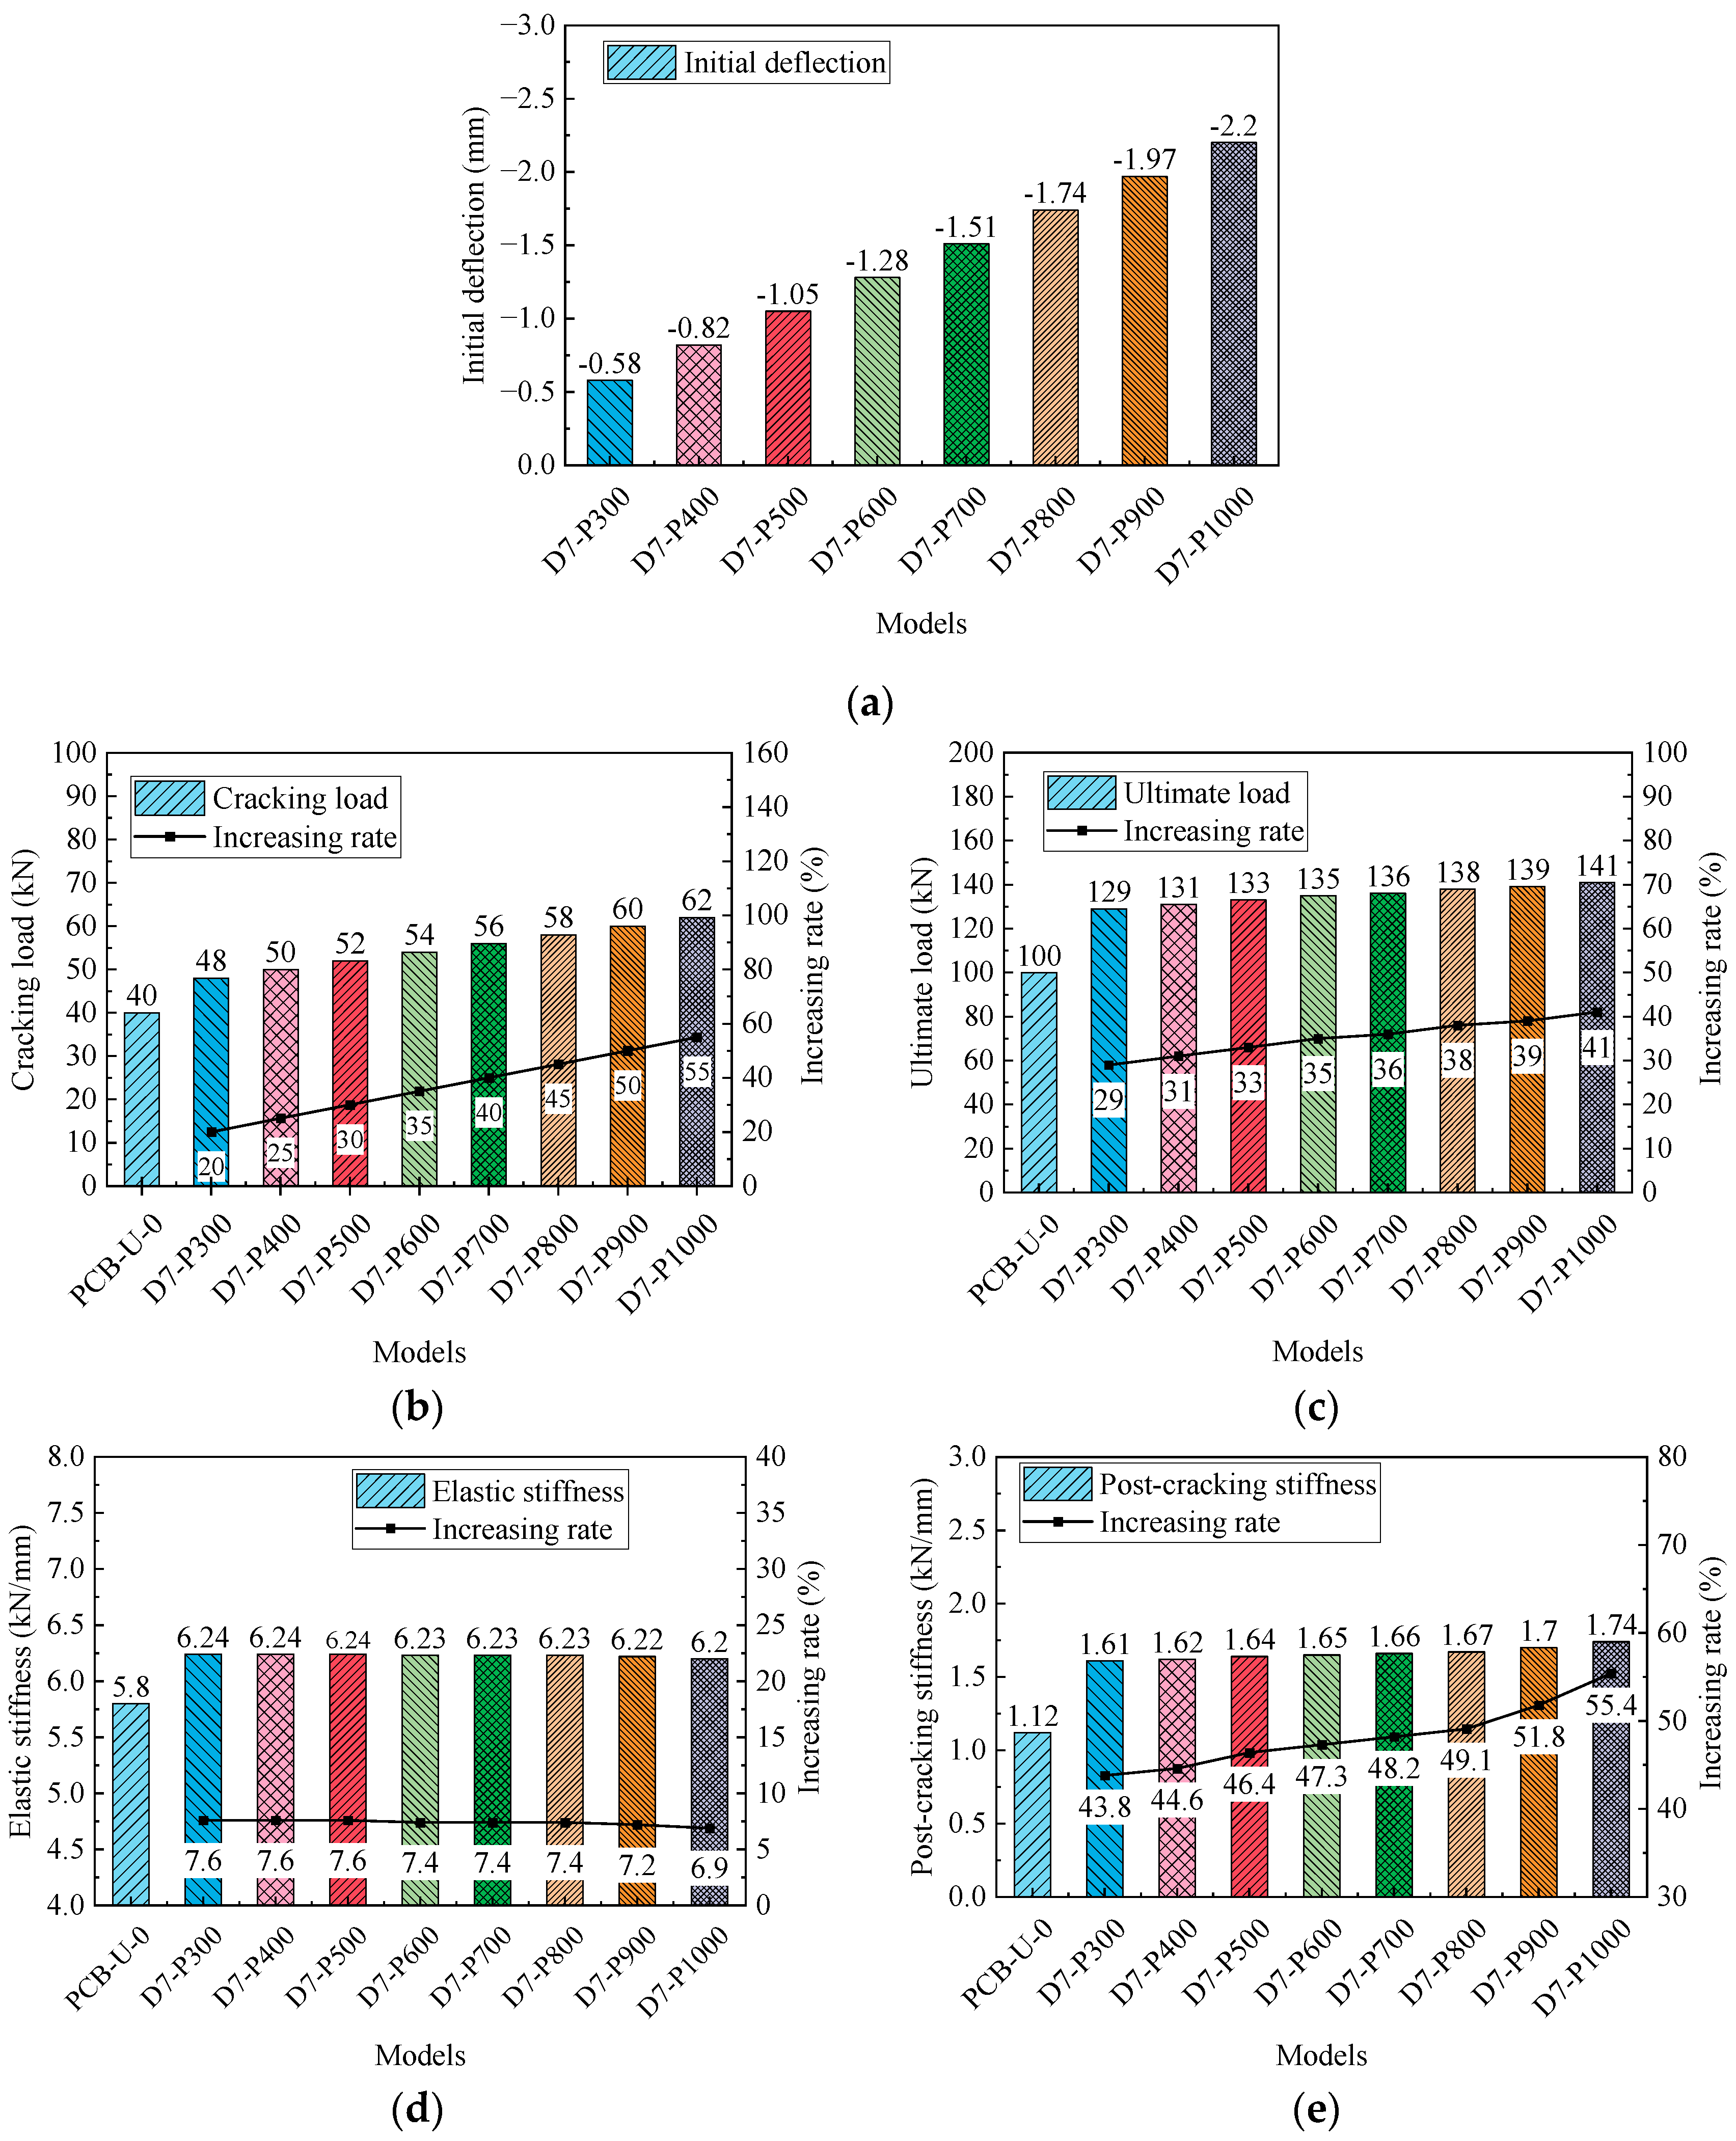
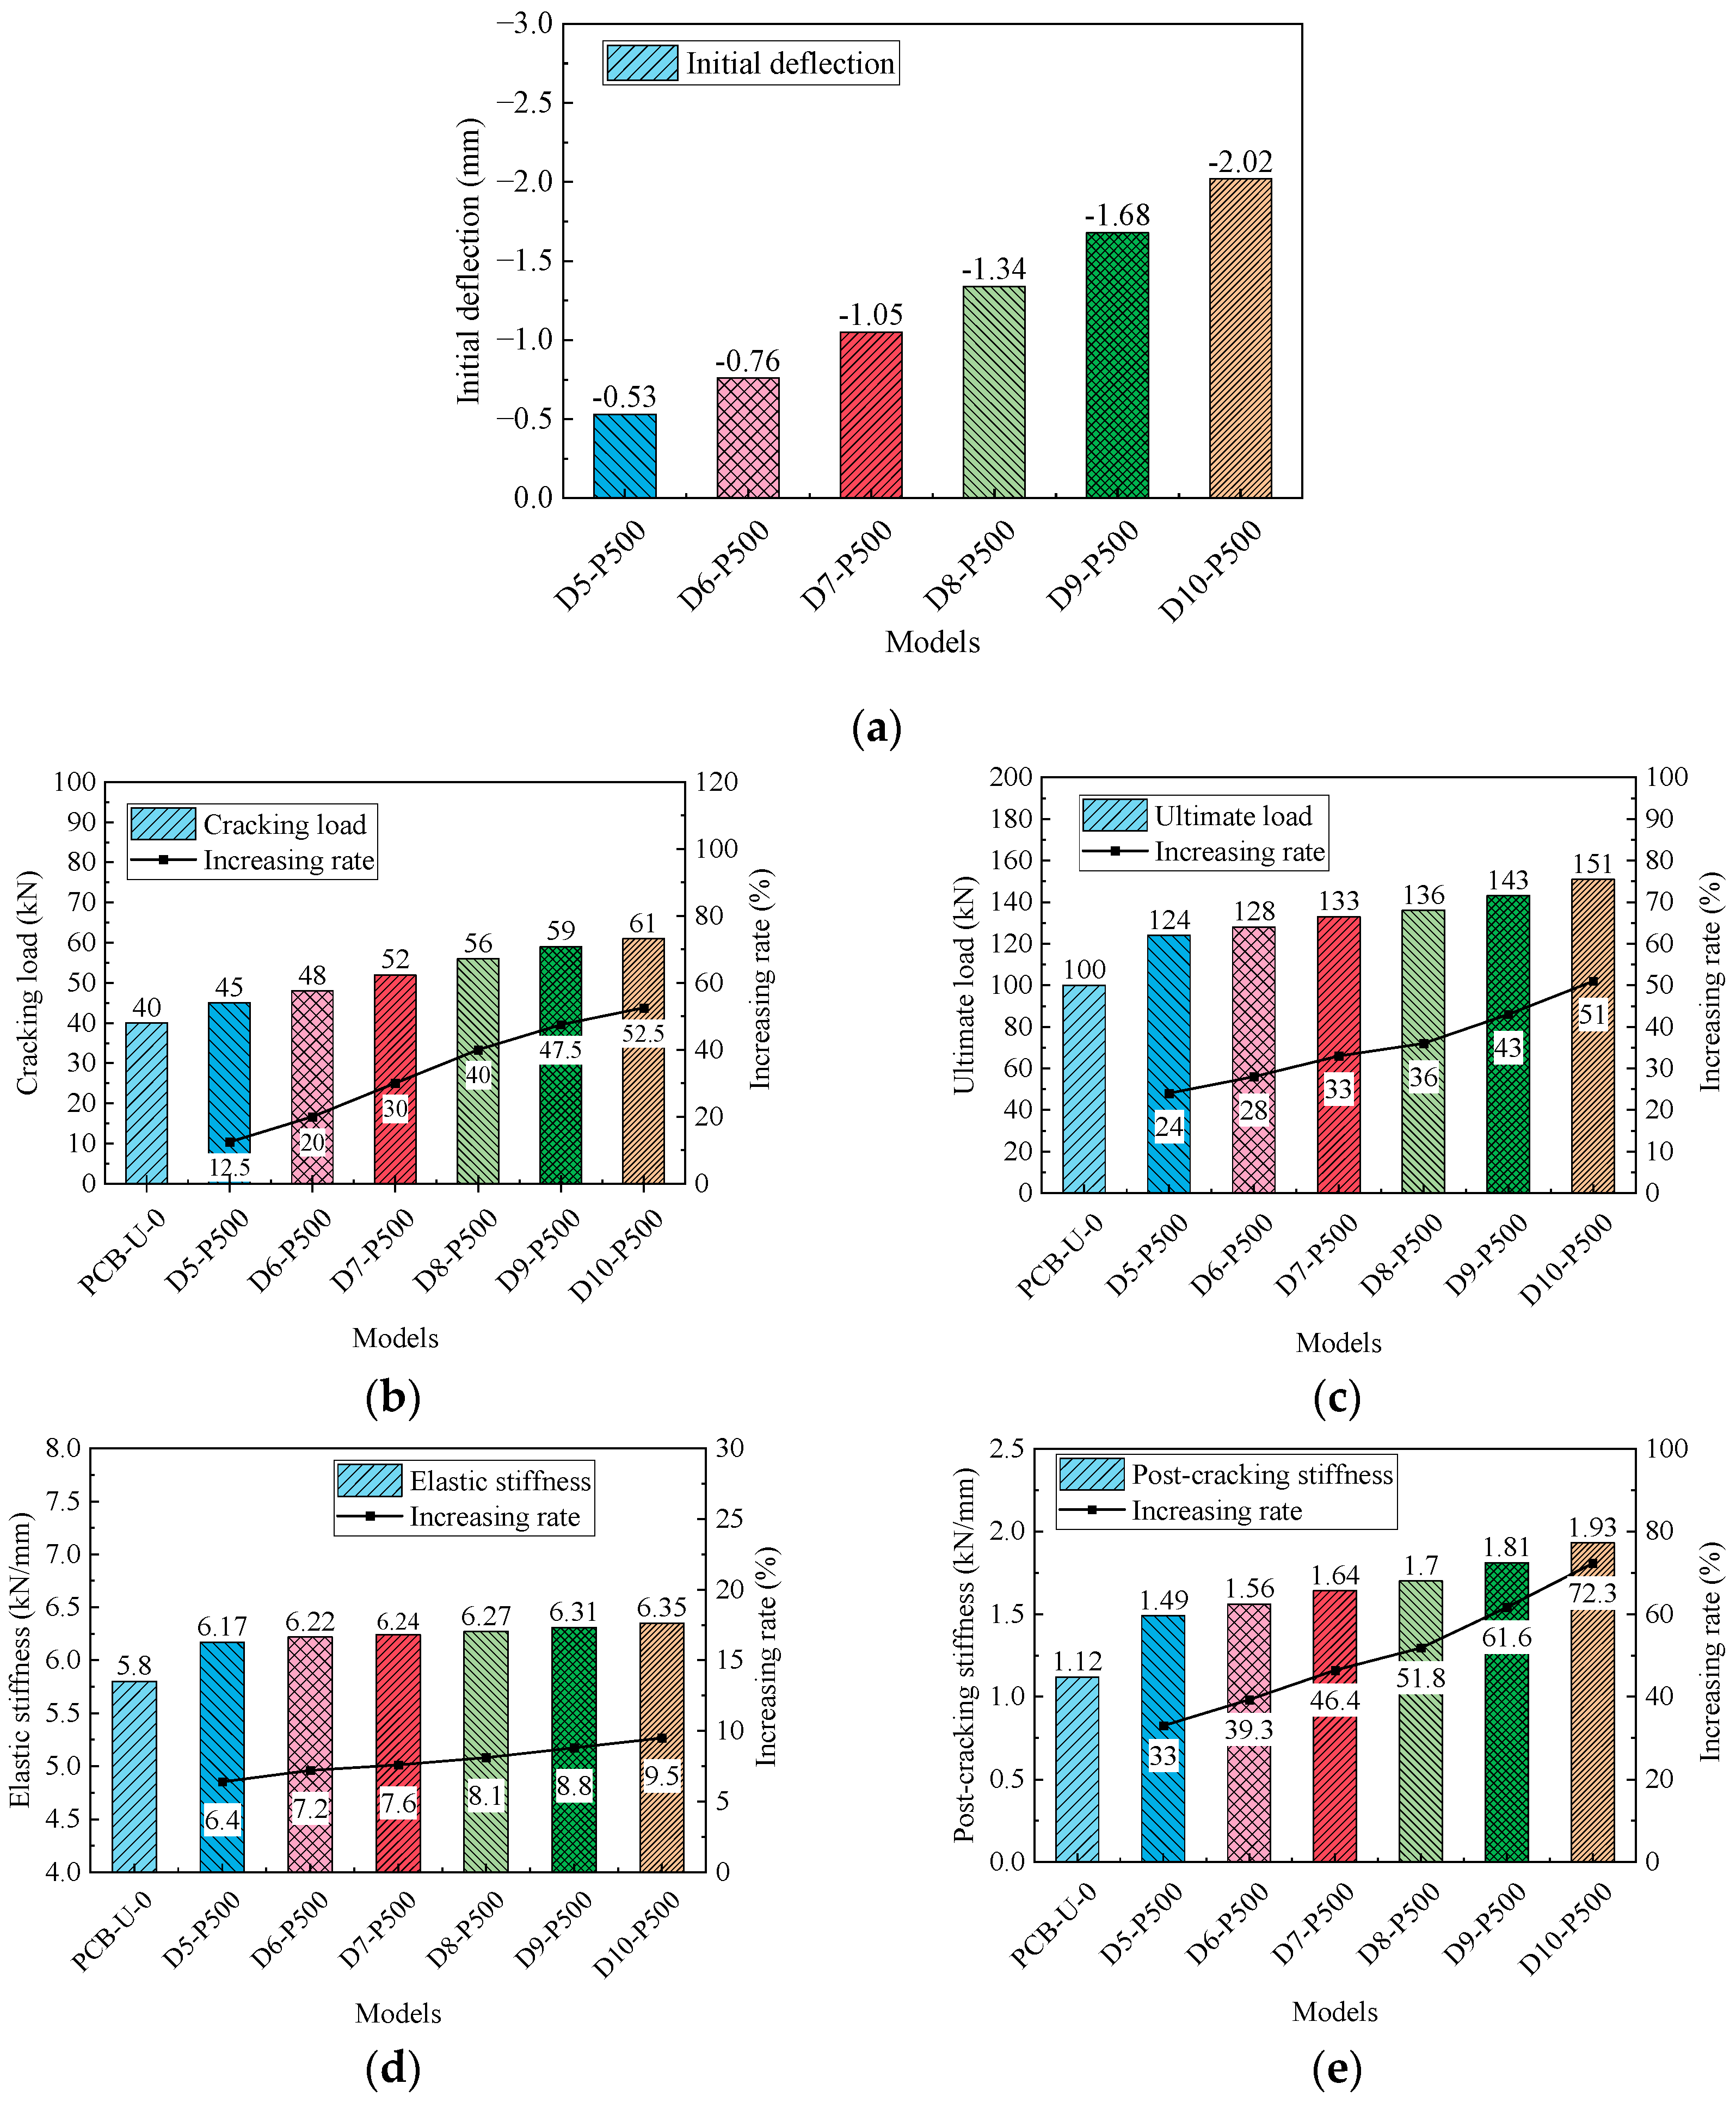
5.1. Effect of CFRP Tendon Prestress
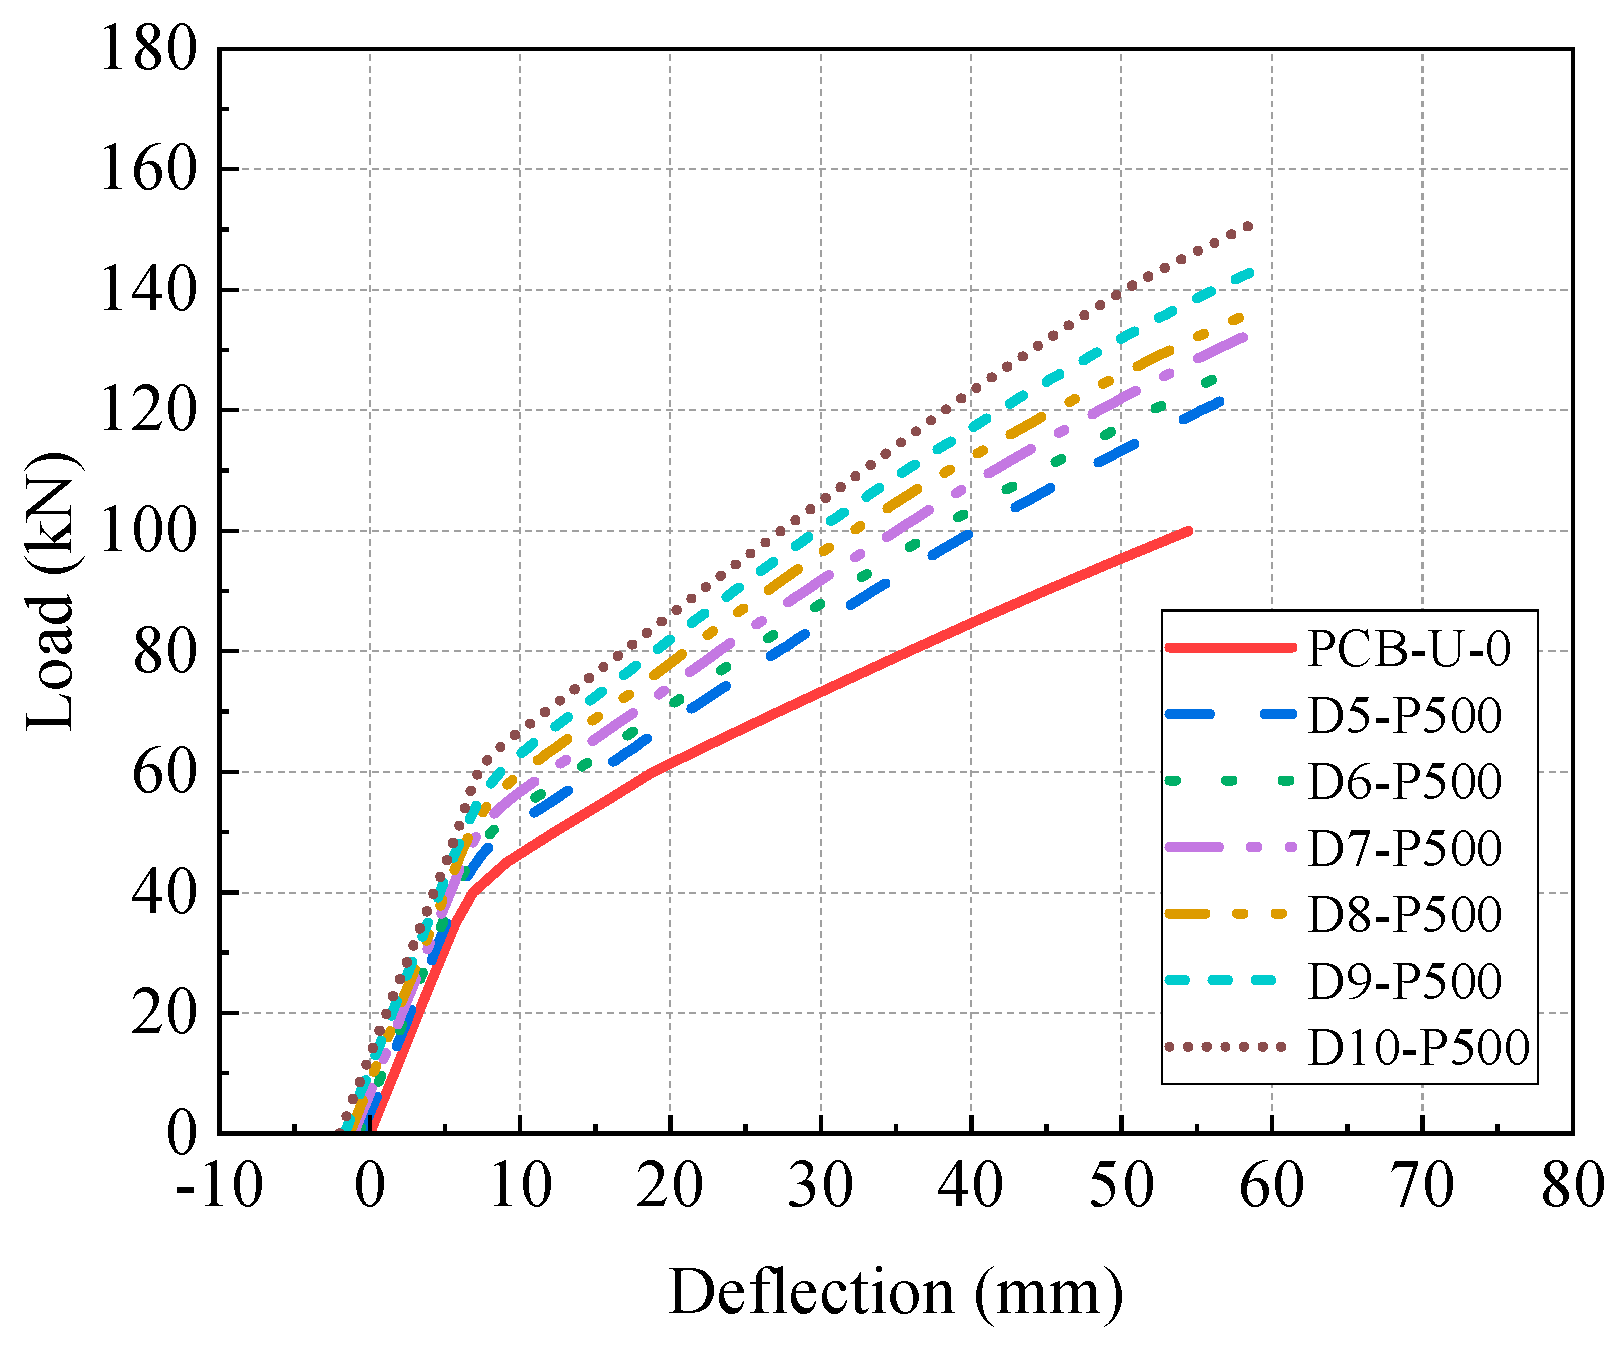
5.2. Effect of CFRP Tendon Diameter
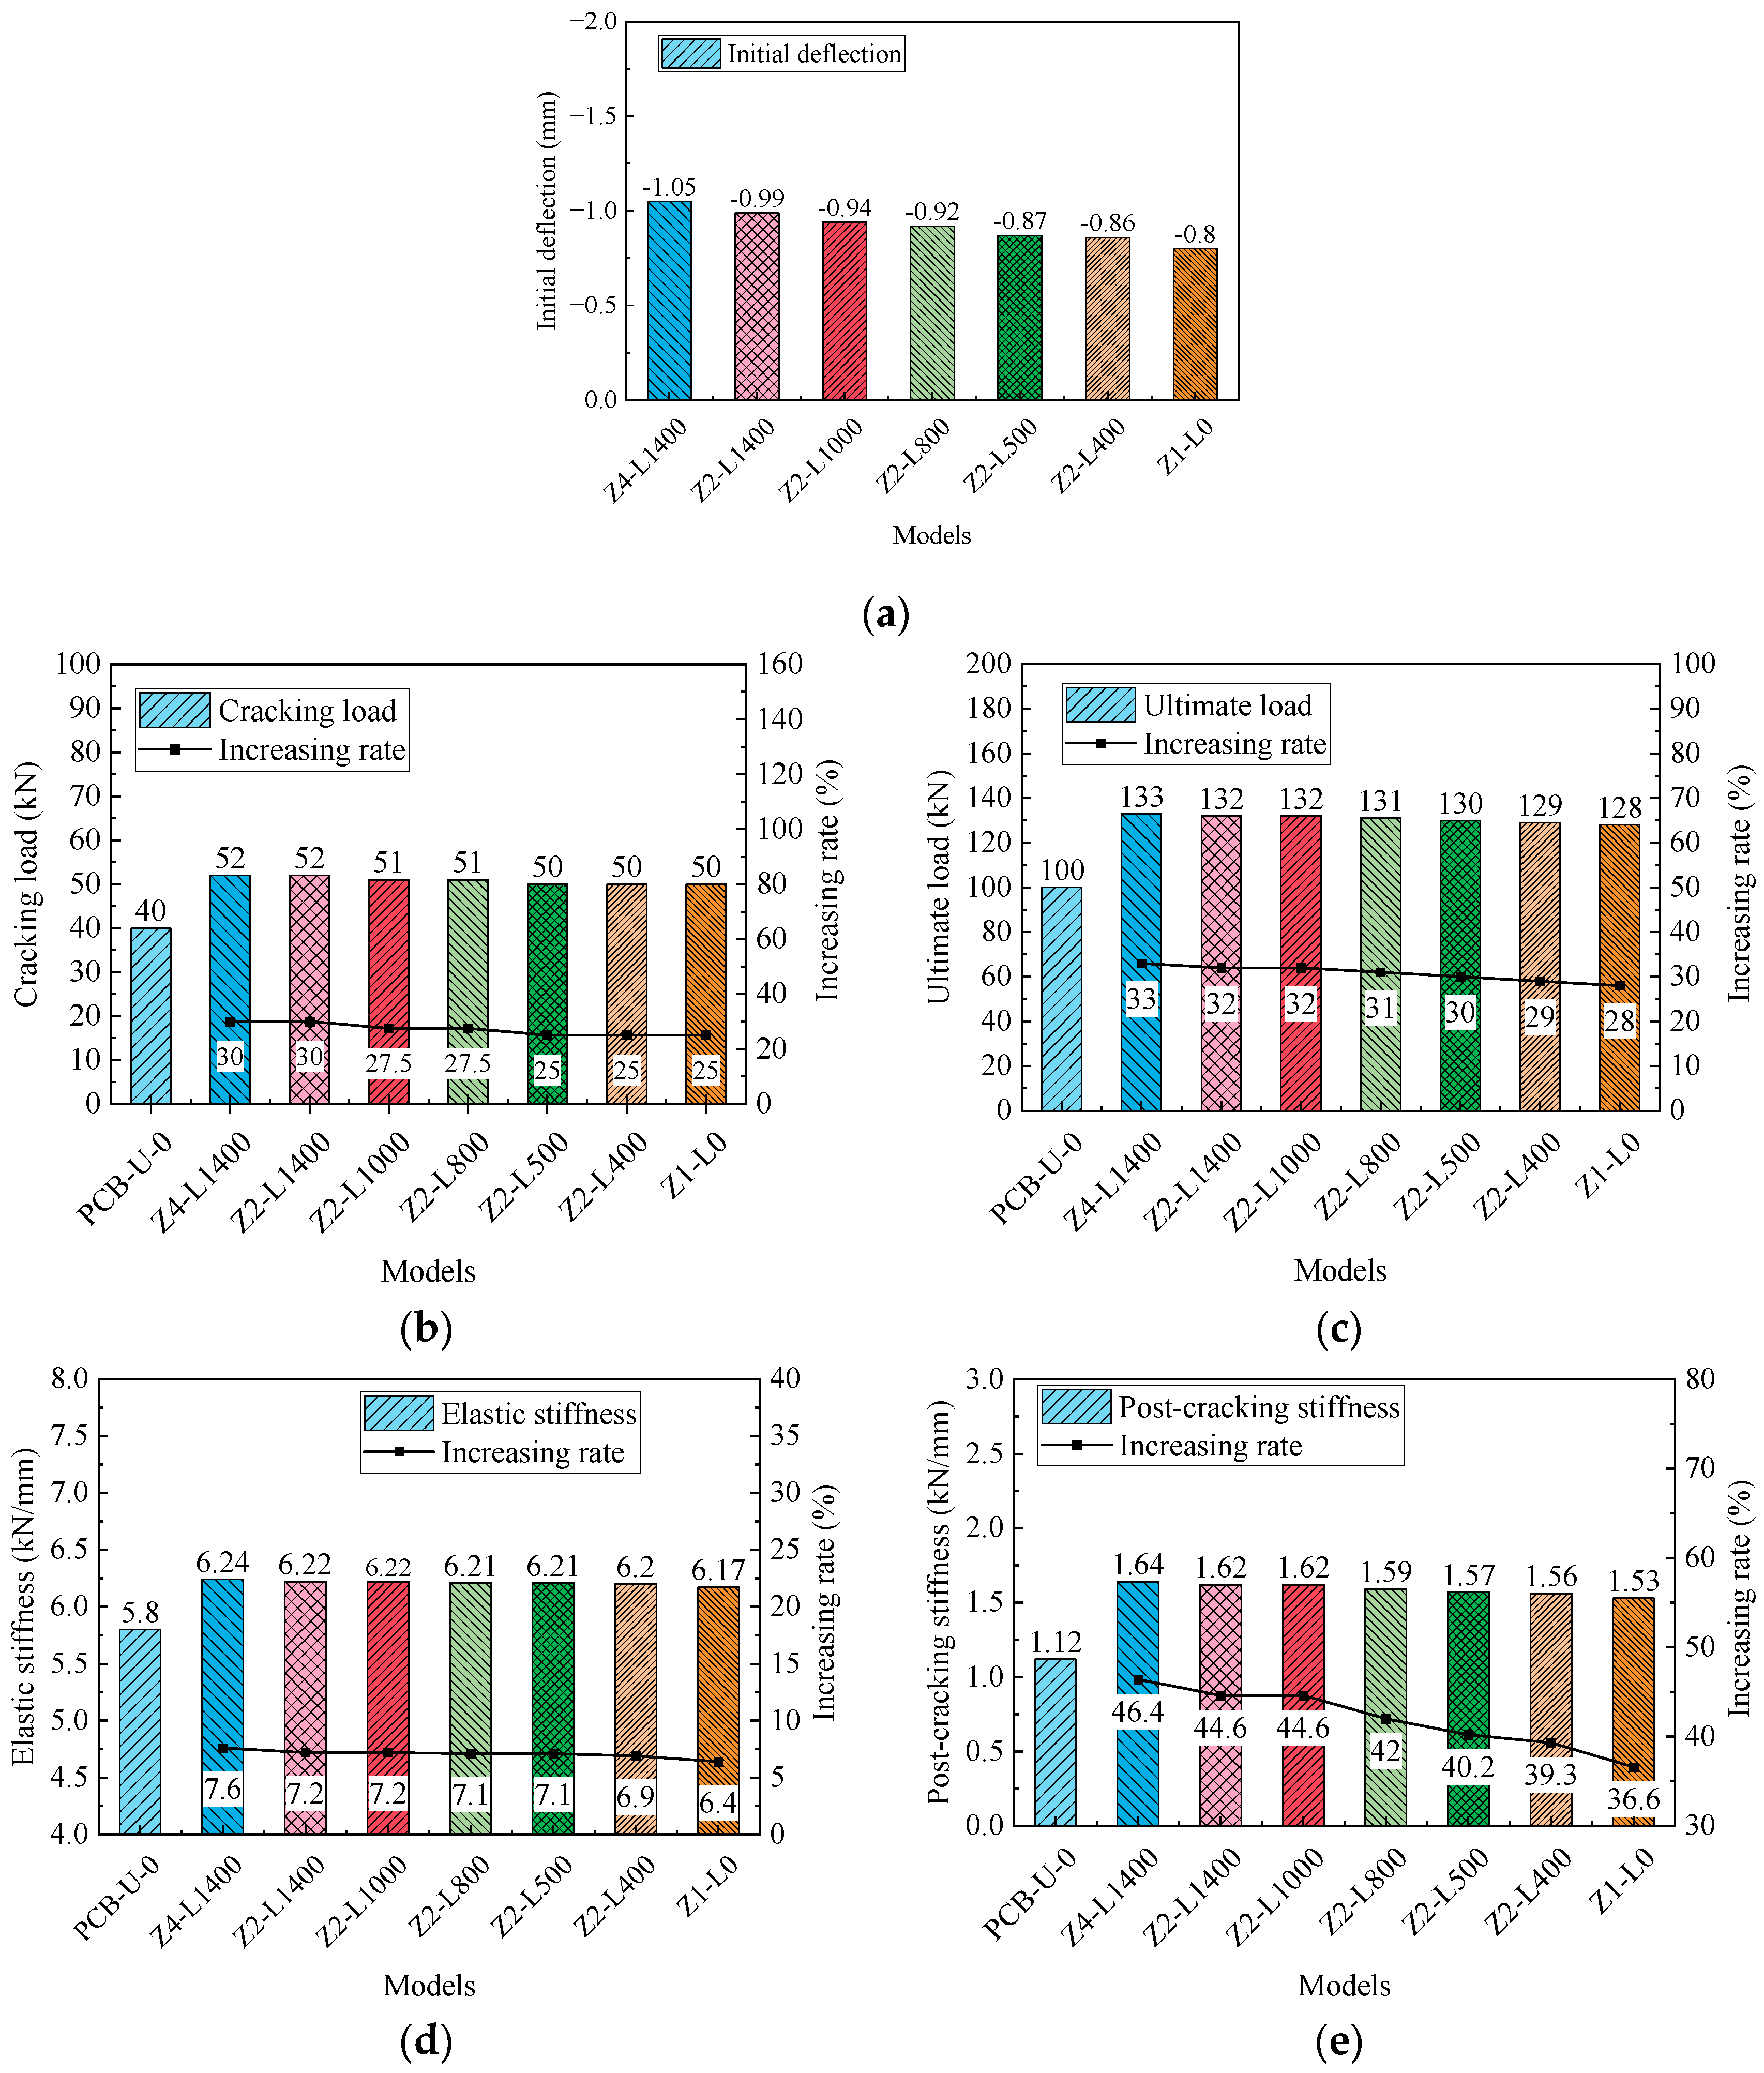
5.3. Effect of Deviator Layout and CFRP Tendon Profile
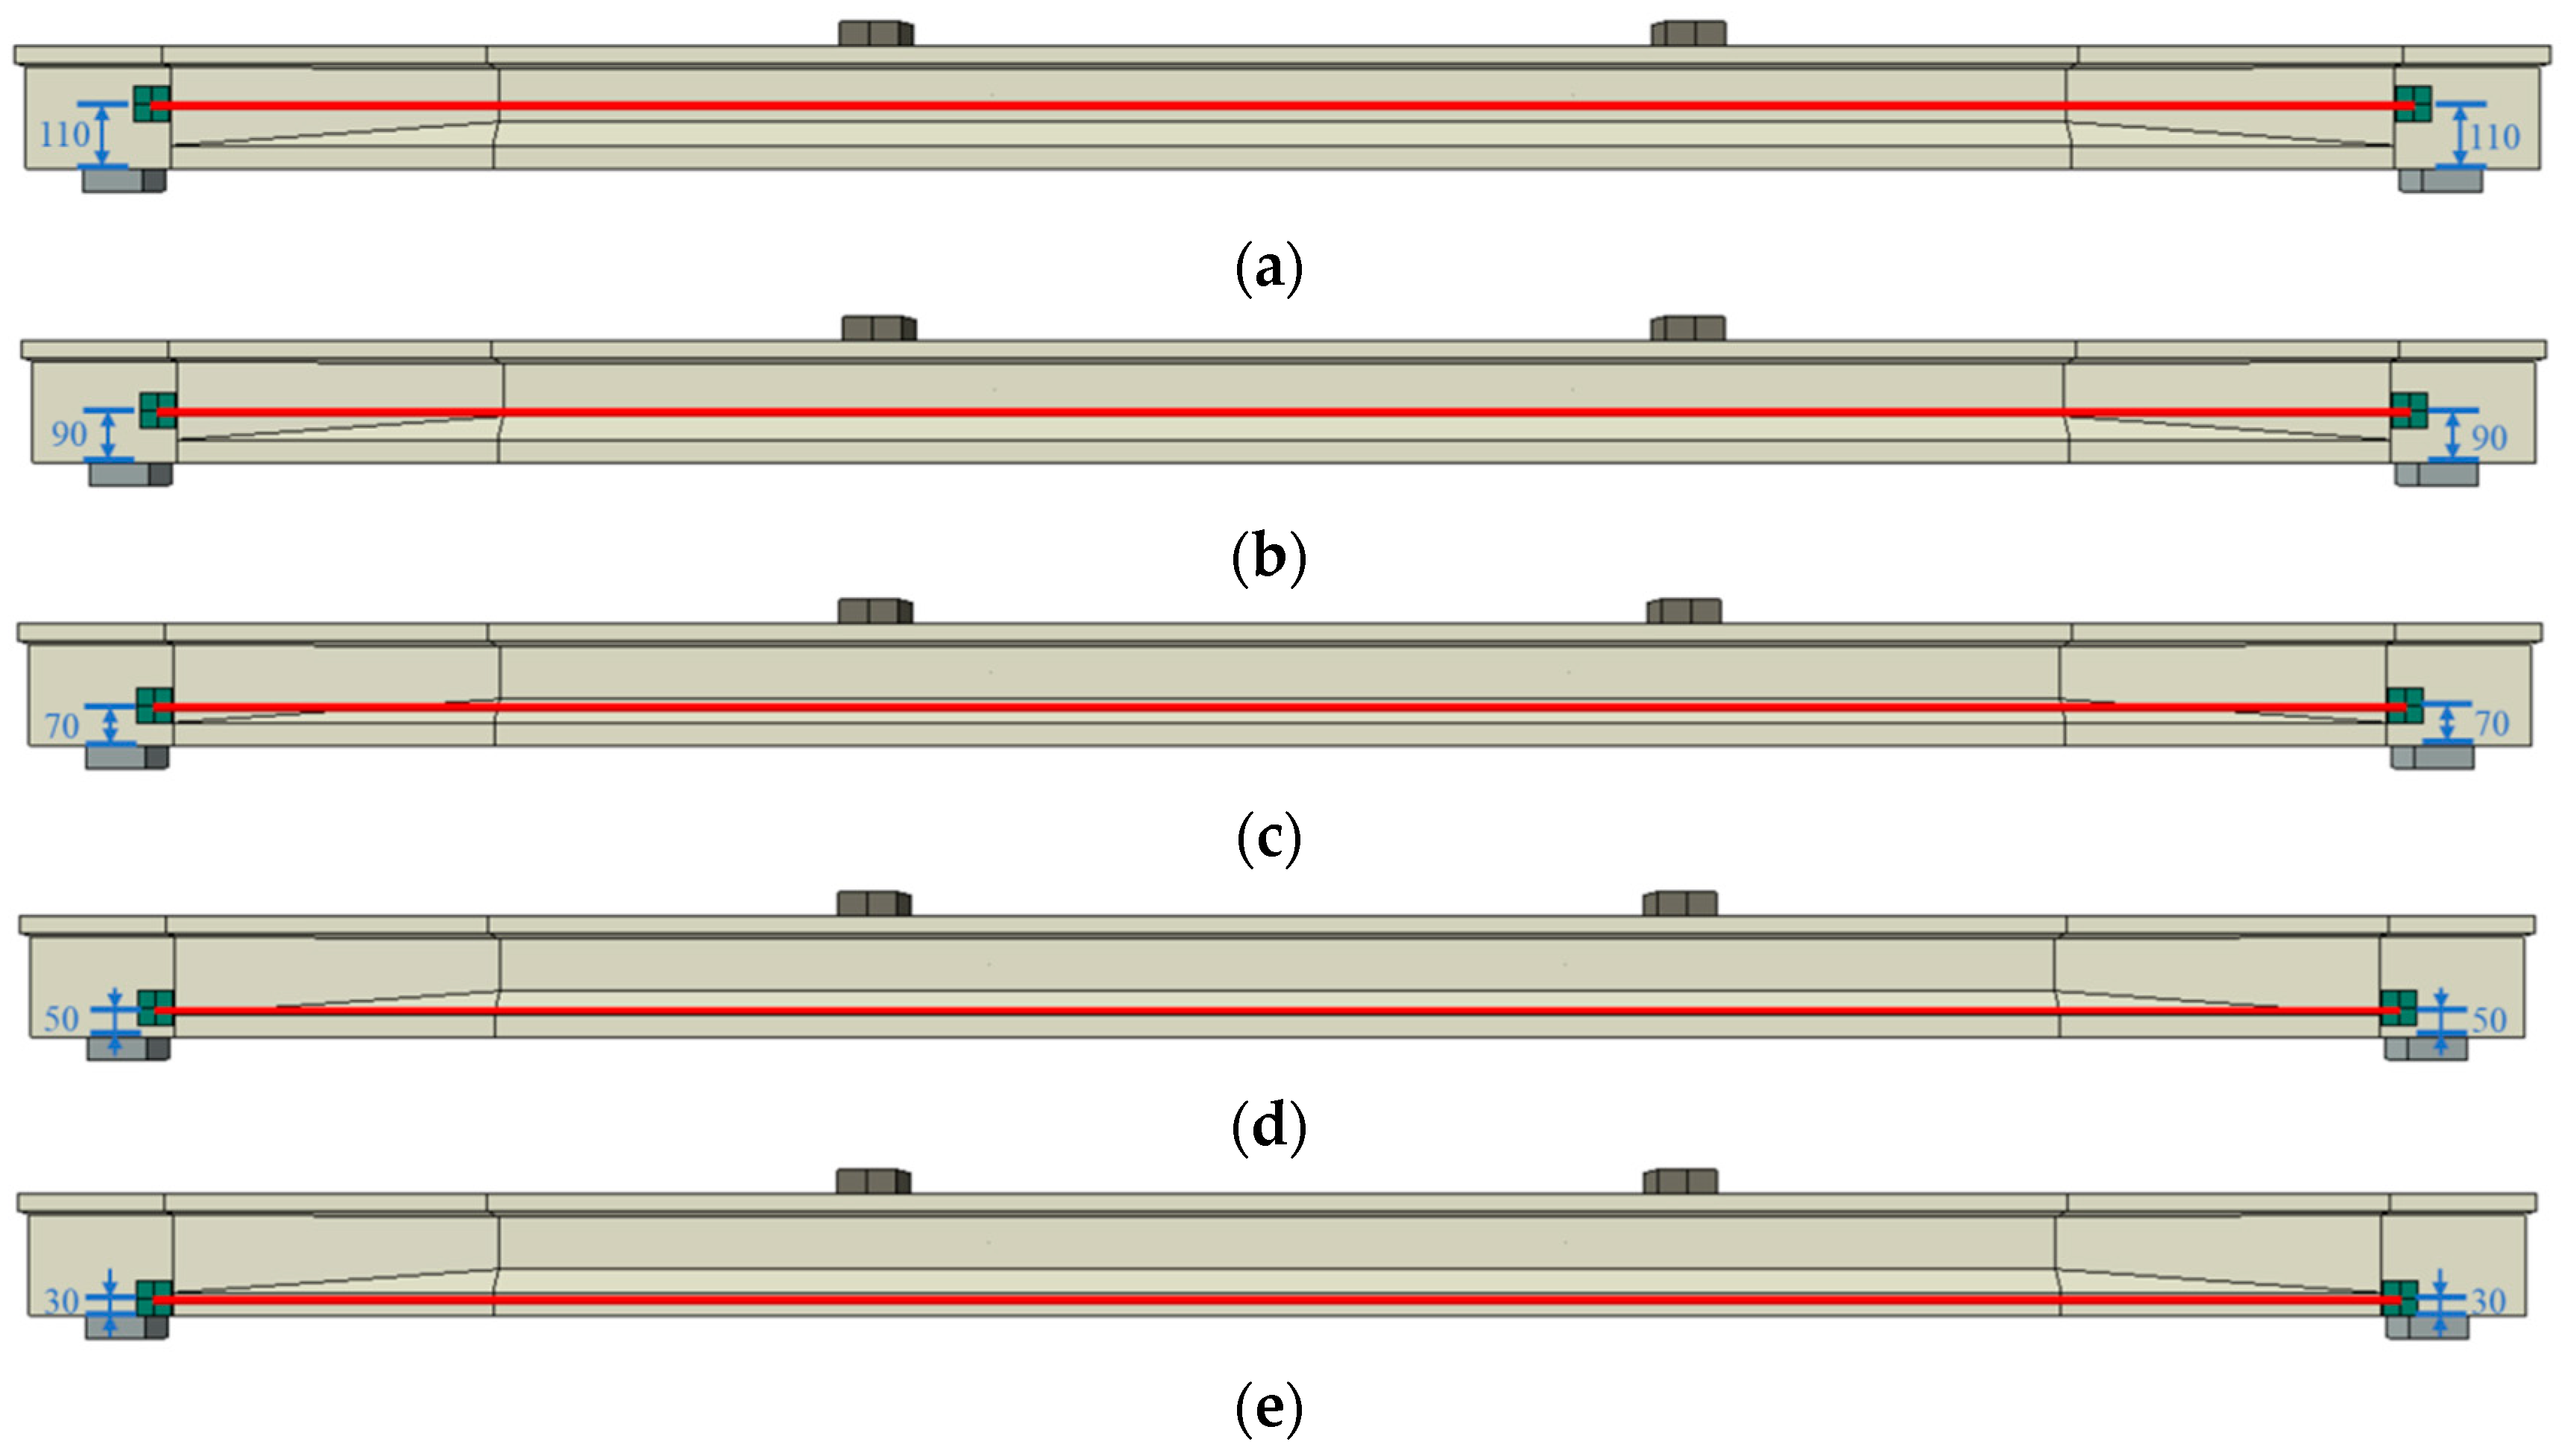
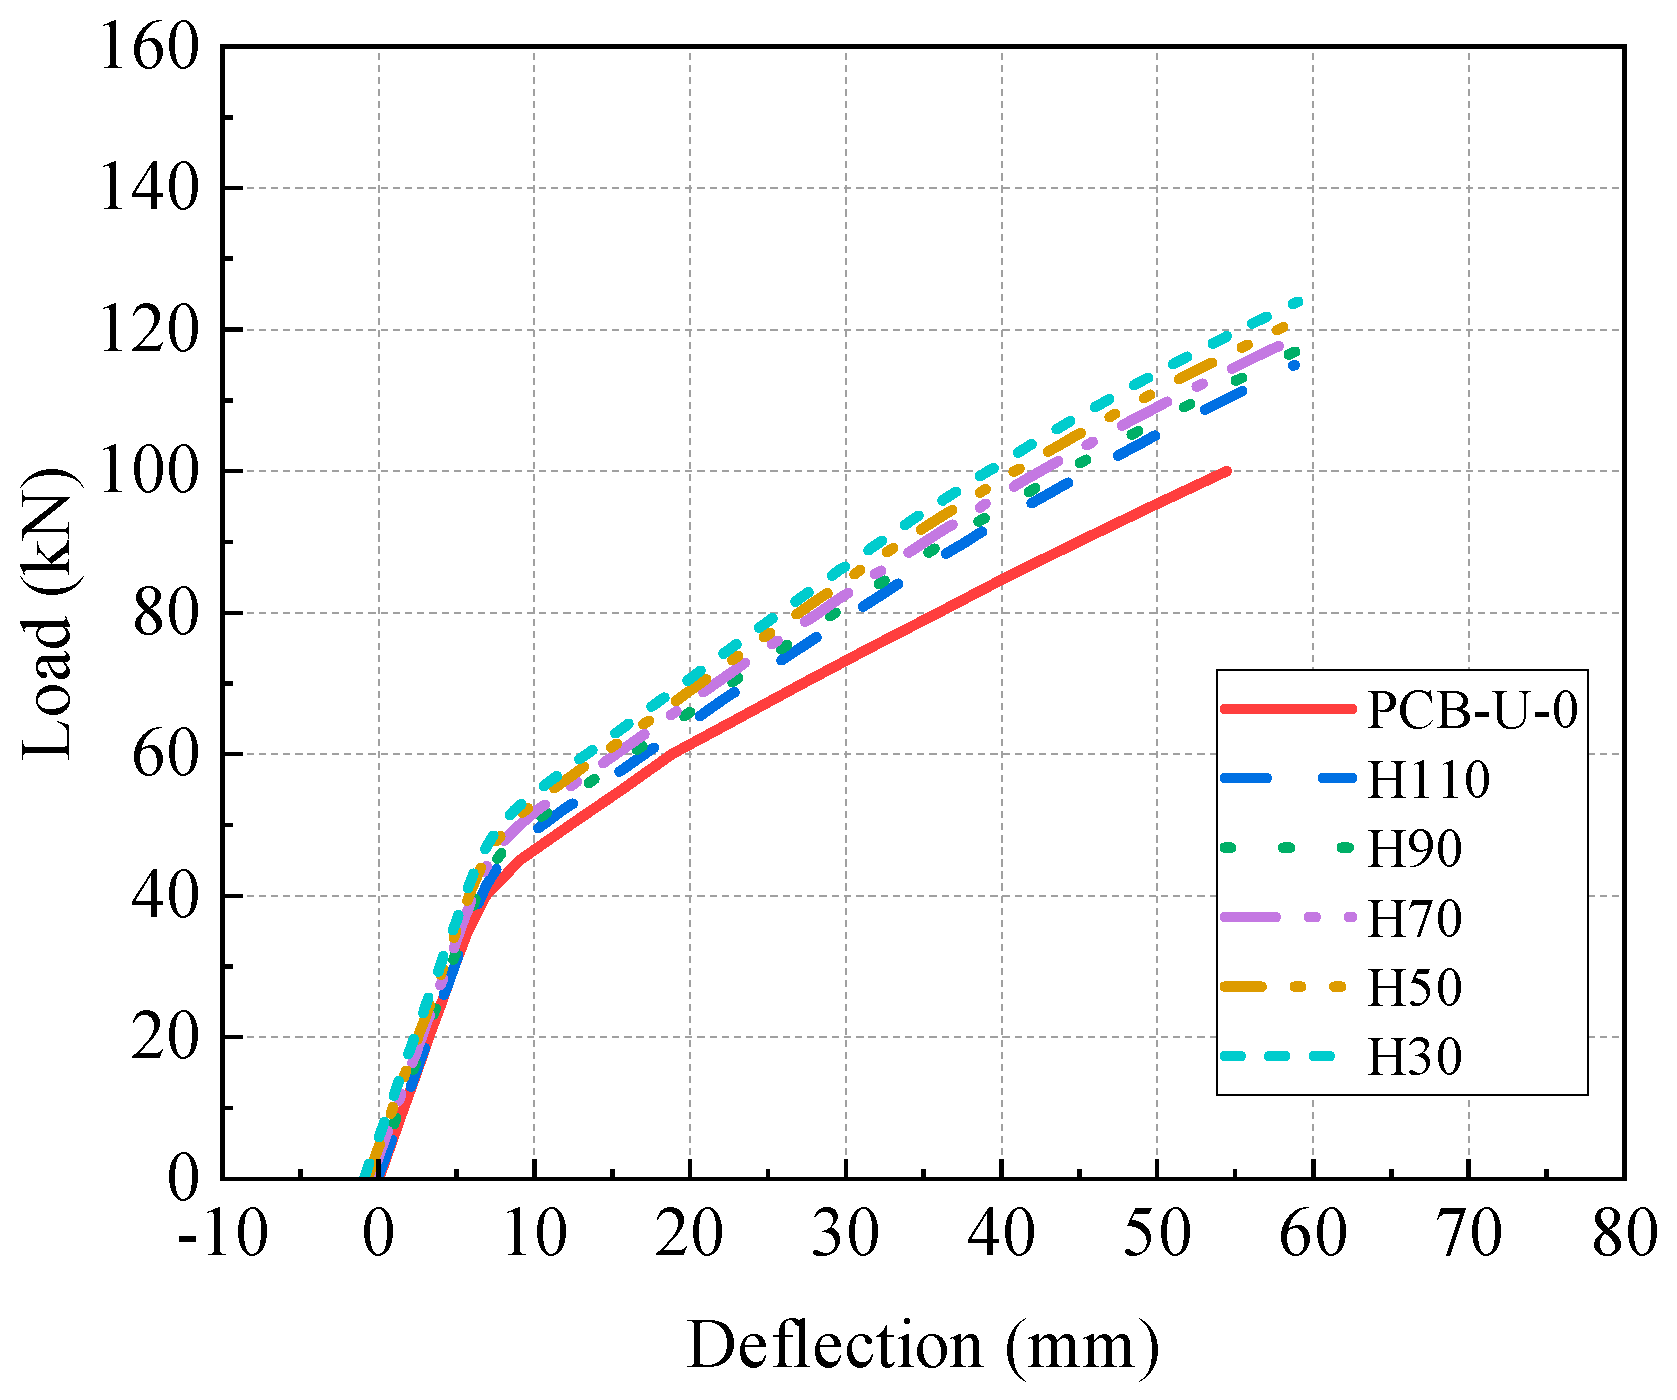
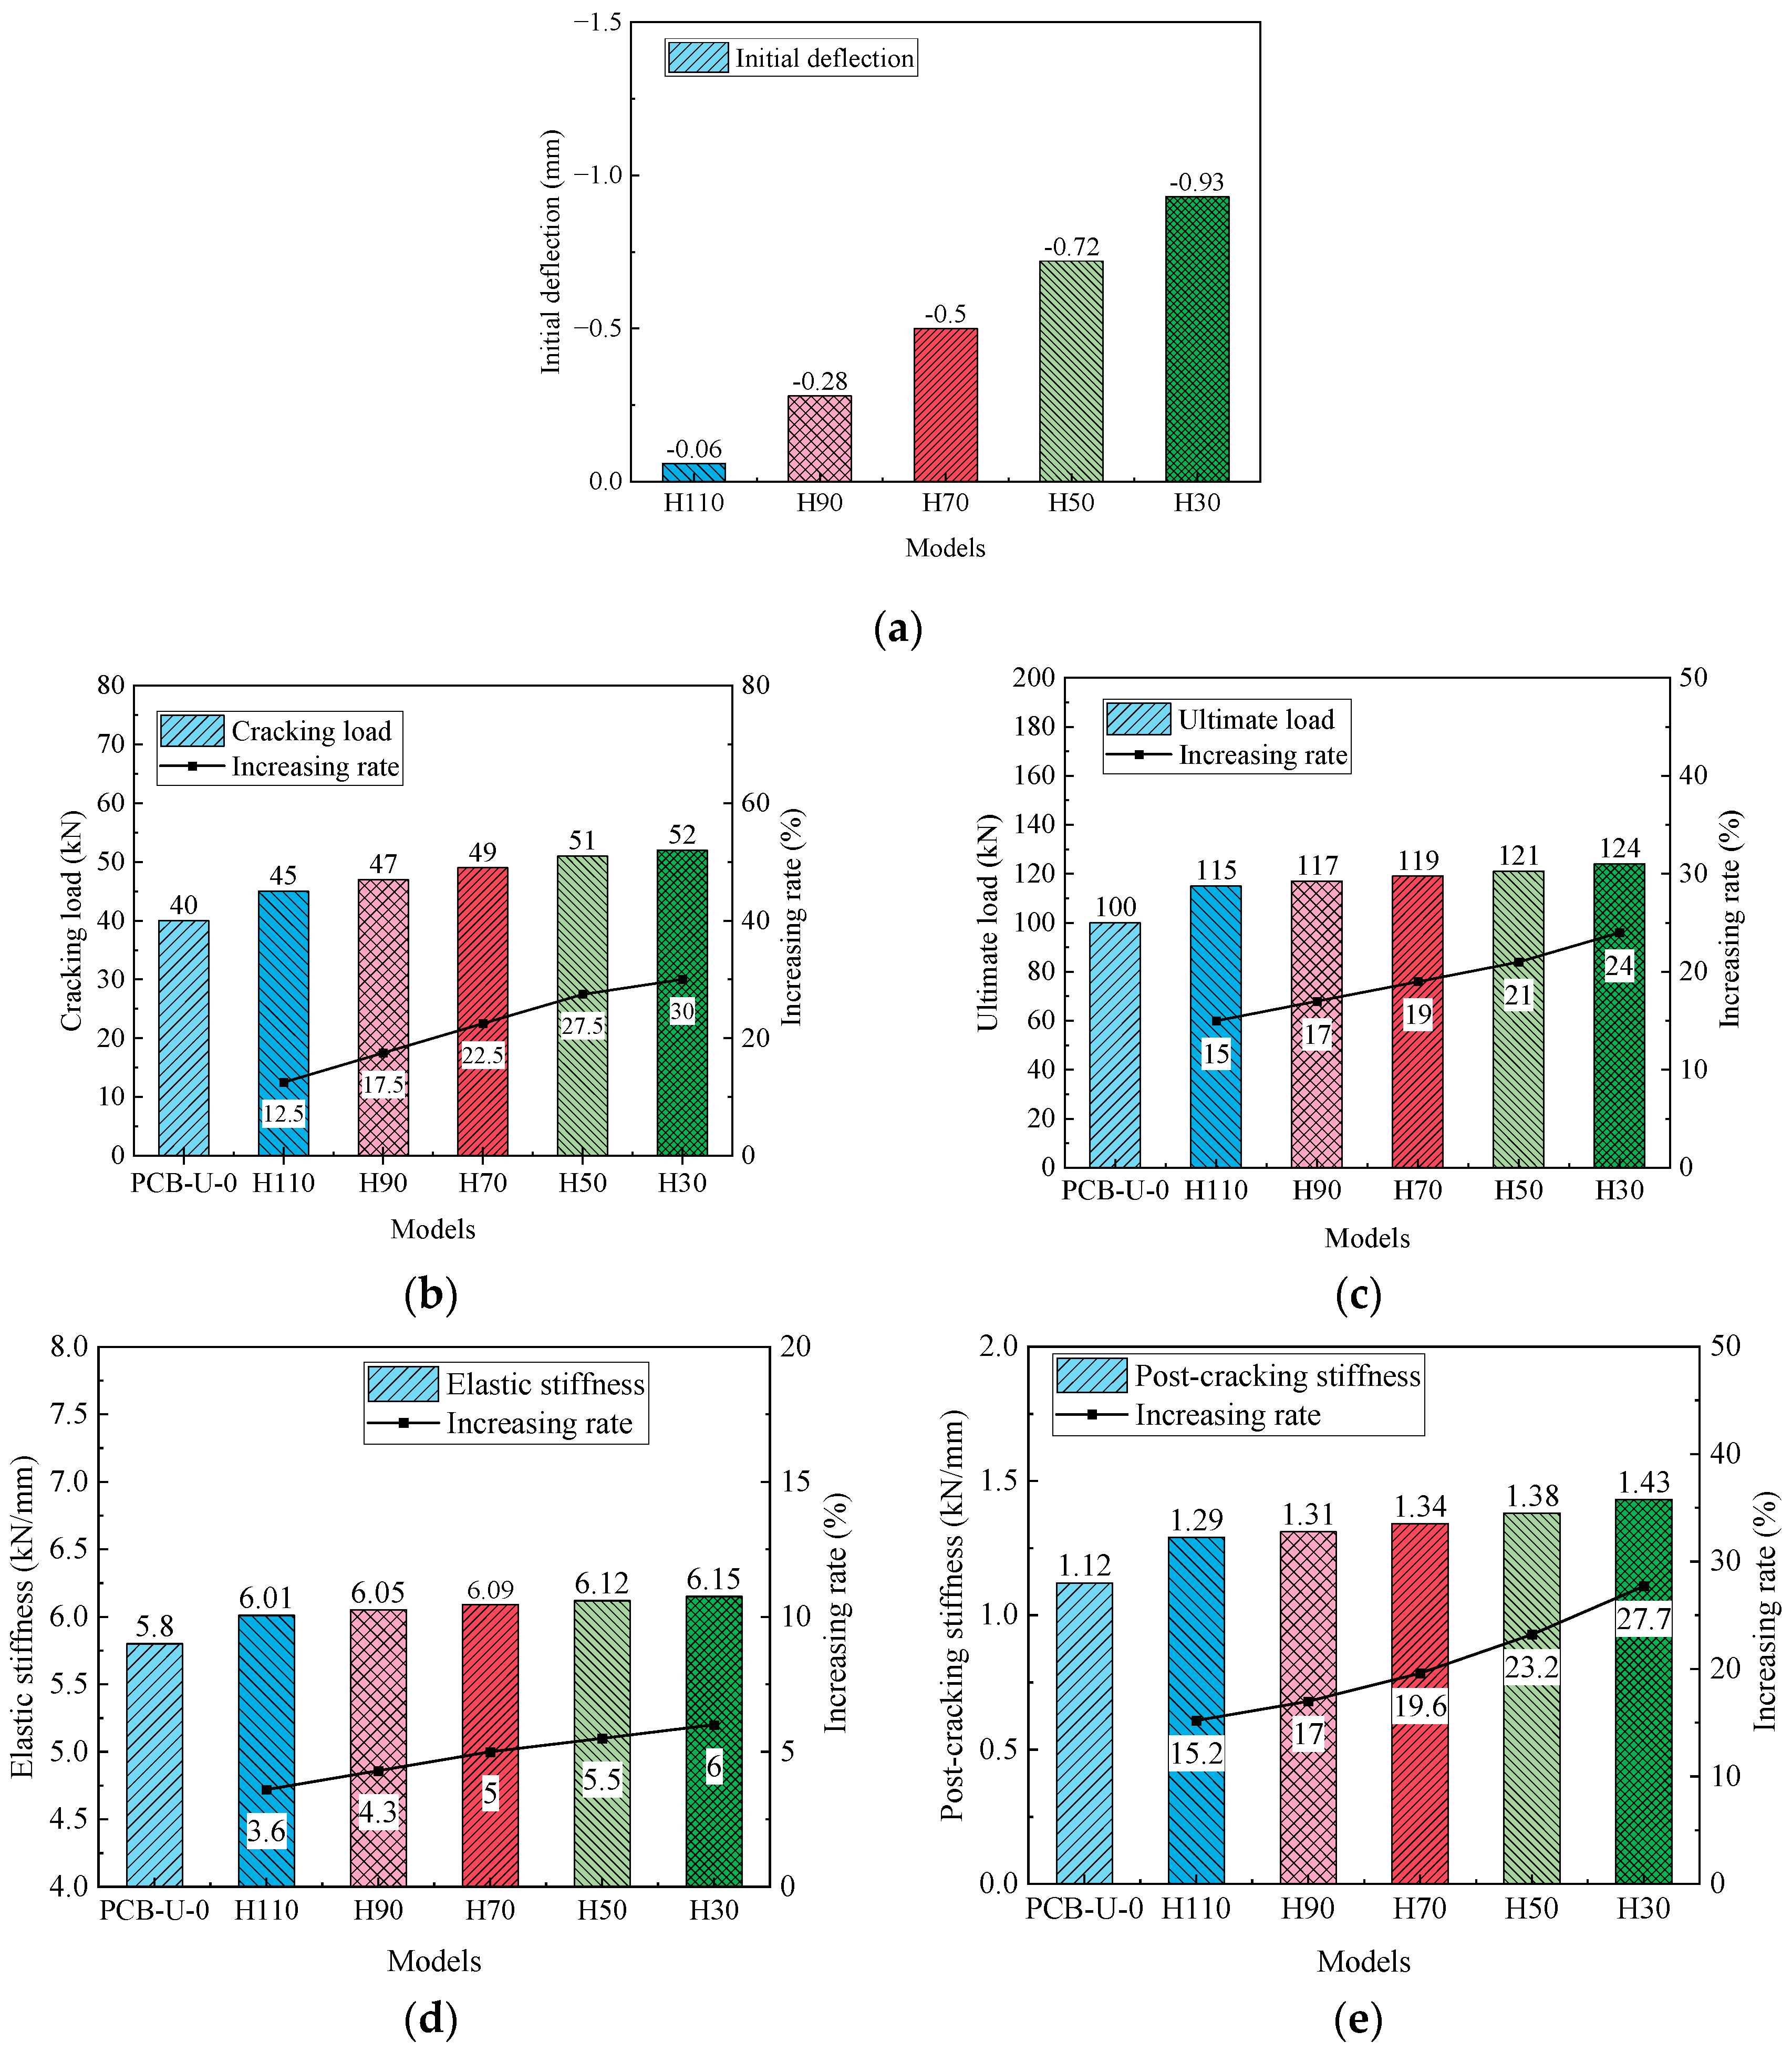
5.4. Effect of End Anchorage Height
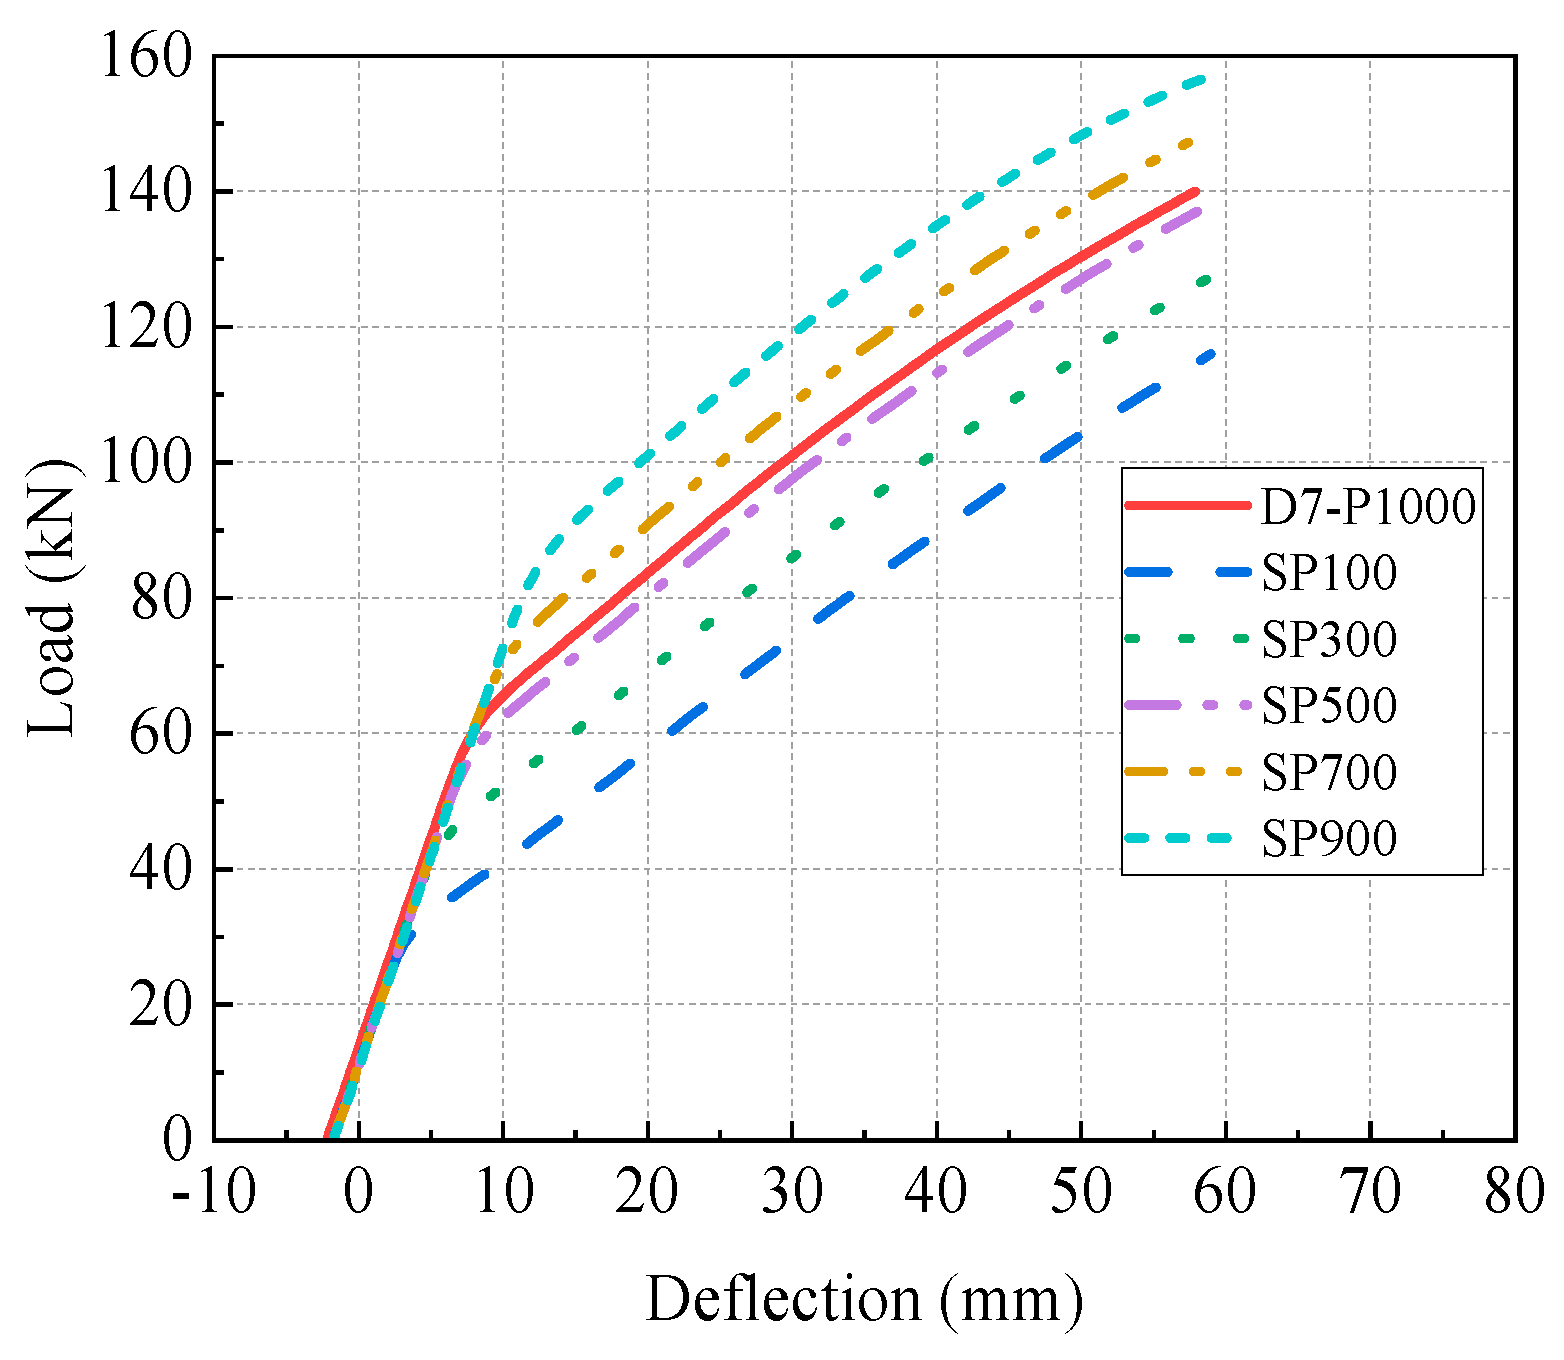
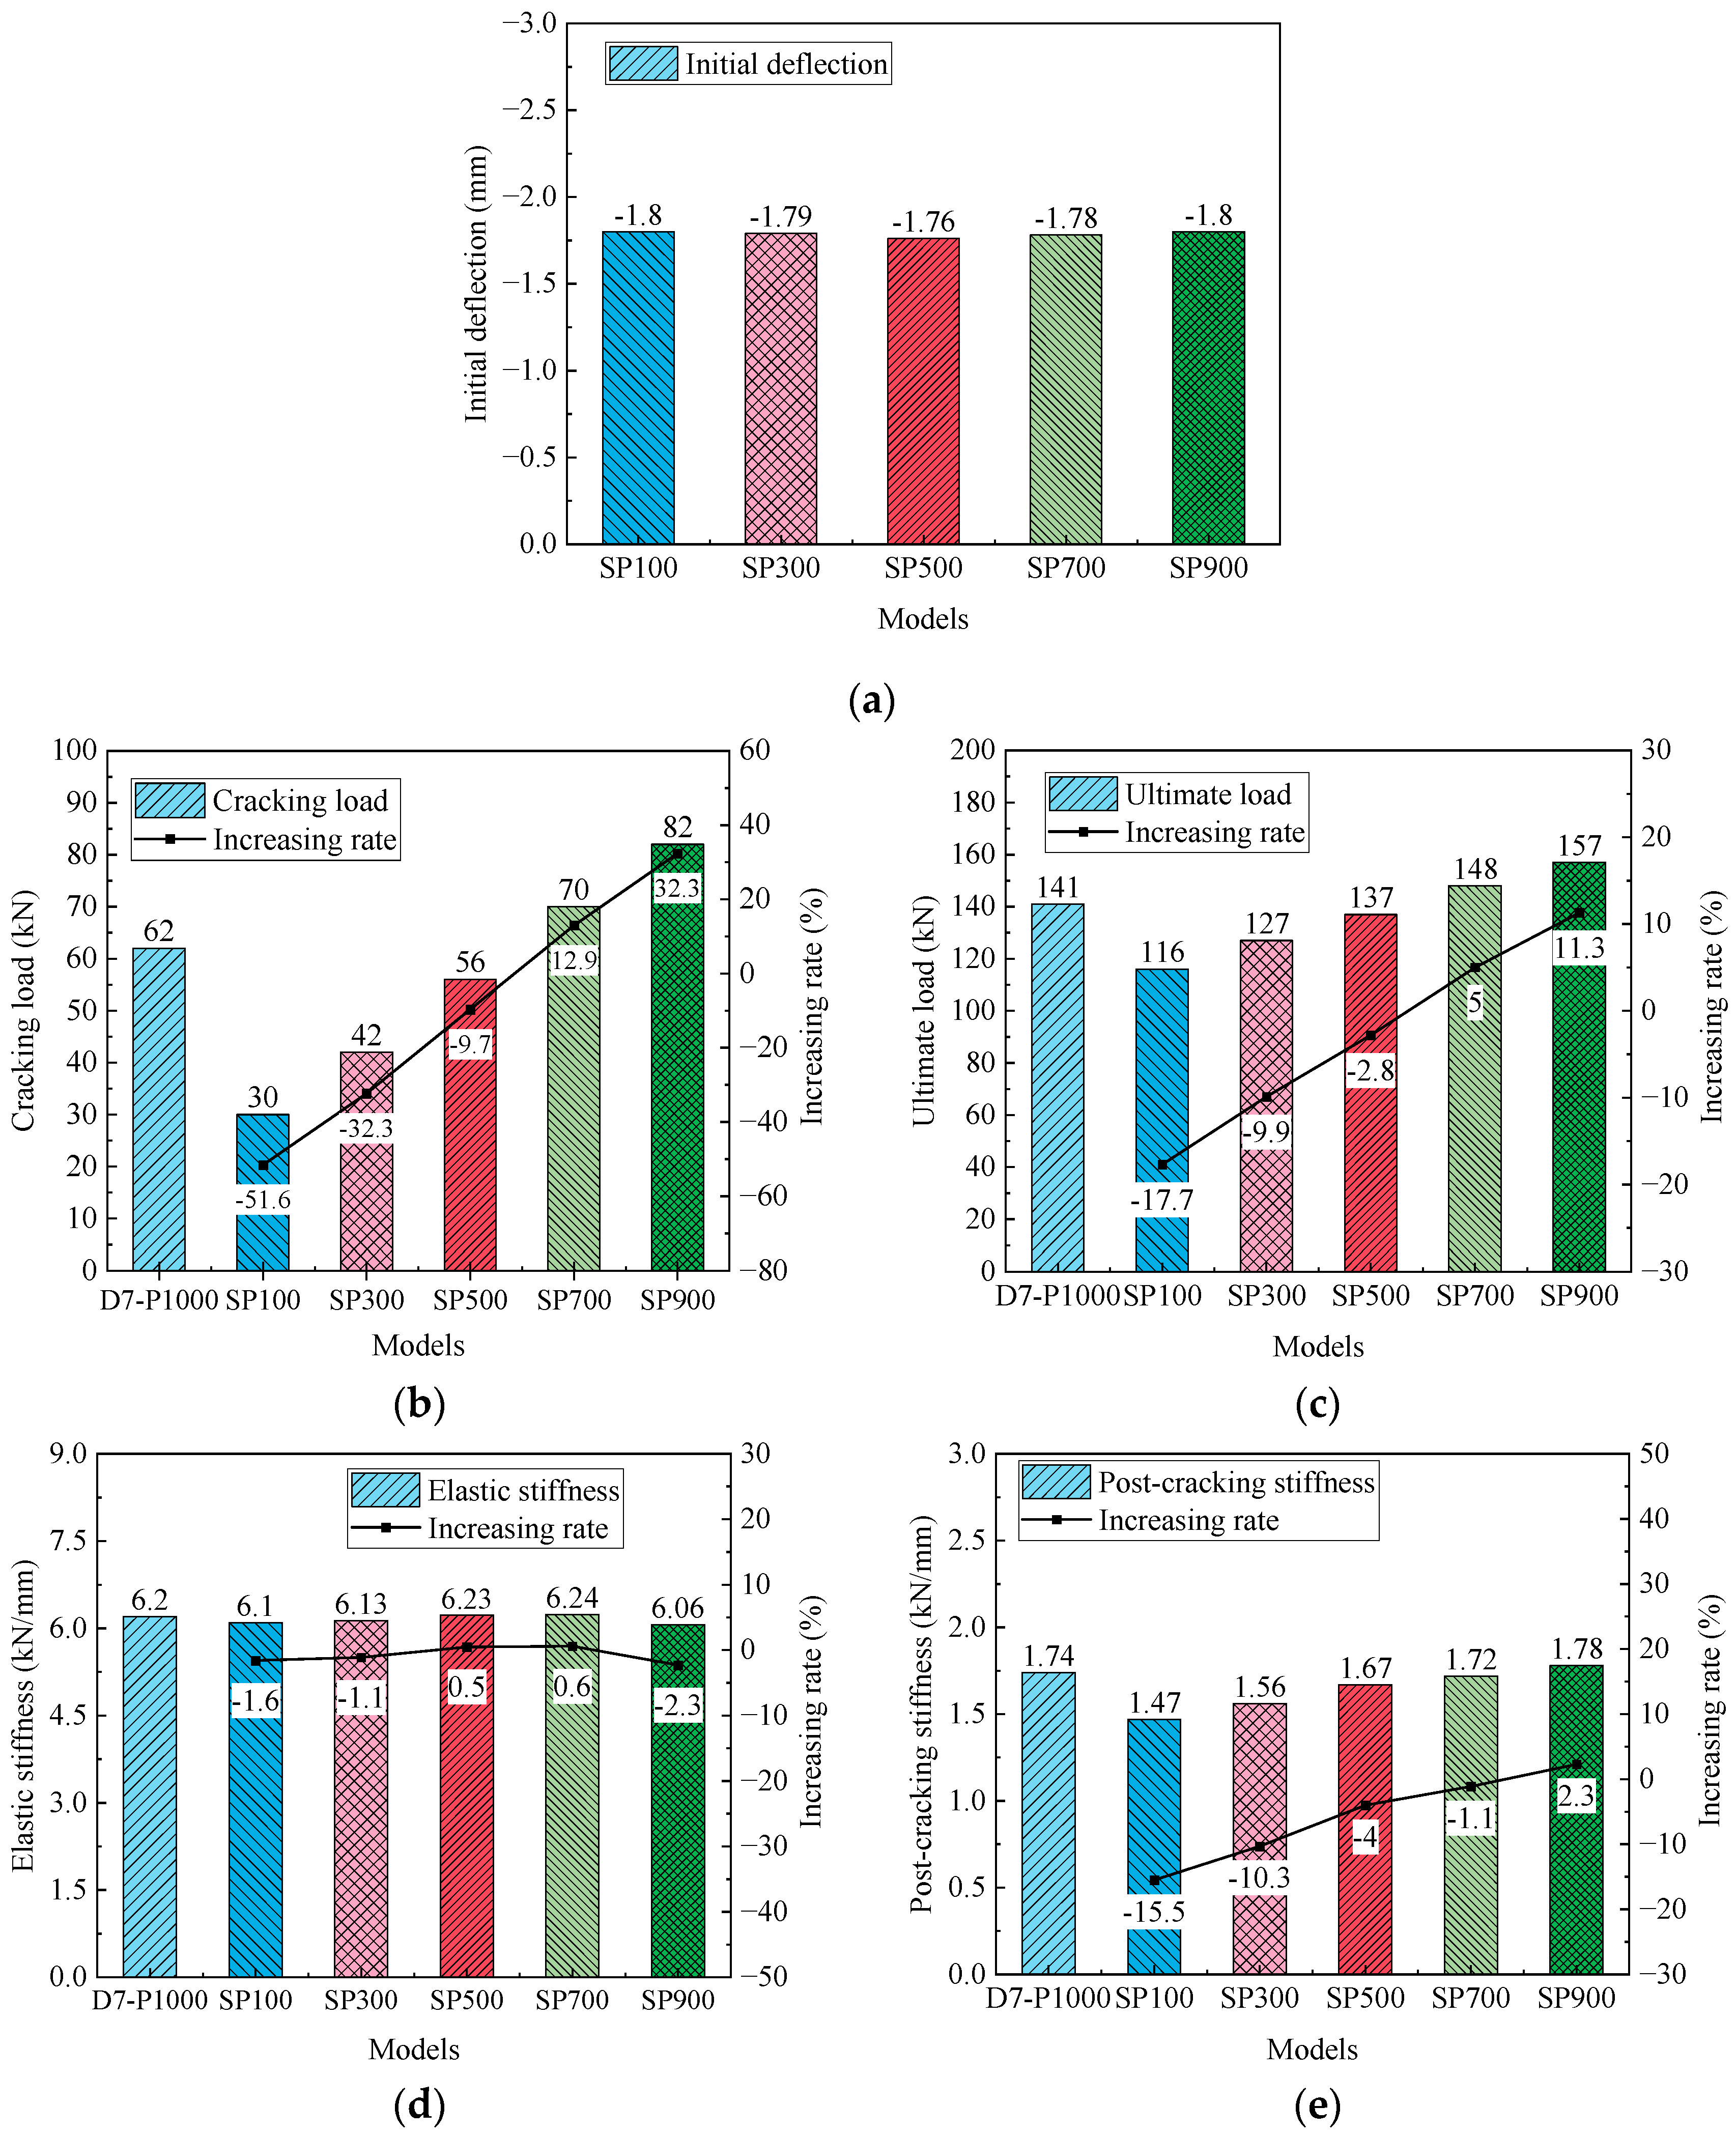
5.5. Effect of the Strand Prestress
6. Conclusions
Author Contributions
Funding
Institutional Review Board Statement
Informed Consent Statement
Data Availability Statement
Conflicts of Interest
References
- Du, Y.; Wei, J.; Yuan, J.; Lai, Y.; Sun, D. Experimental Research on Fatigue Behavior of Prestressed Concrete Beams under Constant-Amplitude and Variable-Amplitude Fatigue Loading. Constr. Build. Mater. 2020, 259, 119852. [Google Scholar] [CrossRef]
- Lakavath, C.; Prakash, S.; Dirar, S. Experimental and Numerical Studies on Shear Behaviour of Macro-Synthetic Fibre Reinforced Prestressed Concrete Beams. Constr. Build. Mater. 2021, 291, 123313. [Google Scholar] [CrossRef]
- Rodrigues, A.; Paulo, J.; Rosa, D. Nonlinear Numerical Analysis of Prestressed Concrete Beams and Slabs. Eng. Struct. 2020, 223, 111187. [Google Scholar] [CrossRef]
- He, J.; Li, X.; Li, C.; Correia, J.; Xin, H.; Zhou, M. A Novel Asynchronous-Pouring-Construction Technology for Prestressed Concrete Box Girder Bridges with Corrugated Steel Webs. Structures 2020, 27, 1940–1950. [Google Scholar] [CrossRef]
- Li, B.; Zeng, L.; Guo, X.; Wang, Y.; Deng, Z. Flexural Behavior of Full-Scale Damaged Hollow RC Beams Strengthened with Prestressed SCFRP Plate under Four-Point Bending. Polymers 2022, 14, 2939. [Google Scholar] [CrossRef]
- Deng, Z.; Huang, S.; Wang, Y.; Xue, H. Experimental Research on Fatigue Behavior of Prestressed Ultra-High Performance Concrete Beams with High-Strength Steel Bars. Structures 2022, 43, 1778–1789. [Google Scholar] [CrossRef]
- Liu, J.B.; Guo, Z.; Chen, L. Research on Precast Roof Truss of Prestressed Concrete Square Pile. Appl. Mech. Mater. 2014, 488–489, 359–364. [Google Scholar] [CrossRef]
- Hu, Y.; Yao, J.; Du, J. Reliability Analysis of Deflection Control of Prestressed Concrete Crane Beam. IOP Conf. Ser. Earth Environ. Sci. 2021, 634, 012118. [Google Scholar] [CrossRef]
- Michel, L.; Ferrier, E. Efficiency of Prestressed Concrete Joist Reinforced by CFRP: Experimentation and Analytical Verification. Struct. Concr. 2021, 23, 895–906. [Google Scholar] [CrossRef]
- Huang, Y.; Tao, Y.; Yi, W.; Zhou, Y.; Deng, L. Numerical Investigation on Compressive Arch Action of Prestressed Concrete Beam-Column Assemblies against Progressive Collapse. J. Build. Eng. 2021, 44, 102991. [Google Scholar] [CrossRef]
- Wang, Y.; Pan, Z.; Zhao, C.; Zeng, B. Long-Term Behavior of Prestressed Concrete Industrial Buildings in Chloride-Based Industrial Environments. J. Build. Eng. 2023, 76, 107344. [Google Scholar] [CrossRef]
- Lu, Z.; Zhou, Q.; Li, H.; Zhao, Y. A New Empirical Model for Residual Flexural Capacity of Corroded Post-Tensioned Prestressed Concrete Beams. Structures 2021, 34, 4308–4321. [Google Scholar] [CrossRef]
- Qiang, X.; Chen, L.; Jiang, X. Achievements and Perspectives on Fe-Based Shape Memory Alloys for Rehabilitation of Reinforced Concrete Bridges: An Overview. Materials 2022, 15, 8089. [Google Scholar] [CrossRef]
- Qiang, X.; Wu, Y.; Wang, Y. Research Progress and Applications of Fe-Mn-Si-Based Shape Memory Alloys on Reinforcing Steel and Concrete Brdiges. Appl. Sci. 2023, 13, 3404. [Google Scholar] [CrossRef]
- Aslam, M.; Shafigh, P.; Jumaat, M.; Shah, S. Strengthening of RC Beams Using Prestressed Fiber Reinforced Polymers—A Review. Constr. Build. Mater. 2015, 82, 235–256. [Google Scholar] [CrossRef]
- Shang, W.; Ning, X.; Liu, J.; Liu, J. Failure Analysis and Evaluation for Cracked Concrete Beam Reinforced with CFRP. Theor. Appl. Fract. Mech. 2024, 129, 104222. [Google Scholar] [CrossRef]
- Qiang, X.; Shu, Y.; Jiang, X.; Xiao, Y.; Jin, P. Mechanical Behavior of Carbon Fiber-Reinforced Polymer / Steel Bonded Joints after Large-Space Fires and Thermal Conductivity of Non-Intumescent Coatings. J. Build. Eng. 2024, 86, 108803. [Google Scholar] [CrossRef]
- Jiang, X.; Tan, C.; Qiang, X.; Han, S.; Shen, A. An Innovative Circular Anchor System for CFRP Plates: Experimental Investigation and Field Application. Case Stud. Constr. Mater. 2023, 19, e02678. [Google Scholar] [CrossRef]
- Qiang, X.; Chen, L.; Jiang, X. Experimental and Theoretical Study on Flexural Behavior of Steel–Concrete Composite Beams Strengthened by CFRP Plates with Unbonded Retrofit Systems. Compos. Struct. 2023, 309, 116763. [Google Scholar] [CrossRef]
- Grace, N.; Abdei-Sayed, G. Behavior of Externally Draped CFRP Tendons in Prestressed Concrete Bridges. PCI J. 1998, 43, 88–101. [Google Scholar] [CrossRef]
- El-Hacha, R.; El-Badry, M. Strengthening Concrete Structures with Externally Prestressed Carbon Fiber Composite Cables: Experimental Investigation. PTI J. 2006, 4, 53–70. [Google Scholar]
- El-Hacha, R.; Elbadry, M. Strengthening Concrete Beams with Externally Prestressed Carbon Fiber Composite Cables. Proc. Fiber-Reinf. Plast. Reinf. Concr. Struct. 2001, 1, 699–708. [Google Scholar]
- Fang, Z.; Li, H.; Peng, B. Mechanical Behaviors of Concrete Beam of External Prestressed CFRP Tendons. Zhongguo Gonglu Xuebao/China J. Highw. Transp. 2008, 21, 40–47. [Google Scholar]
- Cho, S.; Lee, H.; Chung, W. Strengthening Effect of Prestressed Near-Surface Mounted CFRP Bar System According to Material Properties of Aged Reinforced Concrete Beams. Compos. Struct. 2022, 282, 115121. [Google Scholar] [CrossRef]
- Liu, X.; Yu, W.; Huang, Y.; Yang, G.; You, W.; Gao, L. Long-Term Behaviour of Recycled Aggregate Concrete Beams Prestressed with Carbon Fibre-Reinforced Polymer (CFRP) Tendons. Case Stud. Constr. Mater. 2023, 18, e01785. [Google Scholar] [CrossRef]
- Choi, J. Comparative Study of Effective Stresses of Concrete Beams Strengthened Using Carbon-fibre-reinforced Polymer and External Prestressing Tendons. Struct. Infrastruct. Eng. 2014, 10, 753–766. [Google Scholar] [CrossRef]
- Wang, X.; Shi, J.; Wu, G.; Yang, L.; Wu, Z. Effectiveness of Basalt FRP Tendons for Strengthening of RC Beams Through the External Prestressing Technique. Eng. Struct. 2015, 101, 34–44. [Google Scholar] [CrossRef]
- Lee, H.; Jung, W.; Chung, W. Flexural Strengthening of Reinforced Concrete Beams with Pre-Stressed near Surface Mounted Cfrp Systems. Compos. Struct. 2017, 163, 1–12. [Google Scholar] [CrossRef]
- Tran, D.T.; Pham, T.M.; Hao, H.; Chen, W. Numerical Investigation of Flexural Behaviours of Precast Segmental Concrete Beams Internally Post-Tensioned with Unbonded FRP Tendons Under Monotonic Loading. Eng. Struct. 2021, 249, 113341. [Google Scholar] [CrossRef]
- Tran, D.T.; Pham, T.M.; Hao, H.; Chen, W. Numerical Study on Bending Response of Precast Segmental Concrete Beams Externally Prestressed with FRP Tendons. Eng. Struct. 2021, 241, 112423. [Google Scholar] [CrossRef]
- Si-Larbi, A.; Agbossou, A.; Ferrier, E.; Michel, L. Strengthening RC Beams with Composite Fiber Cement Plate Reinforced by Prestressed Frp Rods: Experimental and Numerical Analysis. Compos. Struct. 2012, 94, 830–838. [Google Scholar] [CrossRef]
- Omran, H.; El-Hacha, R. Nonlinear 3D Finite Element Modeling of RC Beams Strengthened with Prestressed NSM-CFRP Strips. Constr. Build. Mater. 2012, 31, 74–85. [Google Scholar] [CrossRef]
- Chen, L.; Qiang, X.; Sun, P.; Zhang, S.; Jiang, X. Experimental and Theoretical Study on Flexural Behavior of Prestressed Concrete Beams Strengthened by CFRP Tendons with External Nnbonded Retrofit System. J. Build. Eng. 2024, 89, 109301. [Google Scholar] [CrossRef]
- ABAQUS Software, Version 2020; Dassault Systemes Simulia Corp: Providence, RI, USA, 2020.
- Silva, R.; Rossi, A.; Sander, A.; De Souza, C.; Humberto, C. Numerical Assessment of Effective Width in Steel-Concrete Composite Box Girder Bridges with Partial Interaction. Eng. Struct. 2021, 239, 112333. [Google Scholar] [CrossRef]
- Moura, V.; Oliveira, D.; Rossi, A.; Piana, F.; Ferreira, V.; Humberto, C. Stability Behavior of Steel—Concrete Composite Cellular Beams Subjected to Hogging Moment. Thin-Walled Struct. 2022, 173, 108987. [Google Scholar] [CrossRef]
- Lima, J.; Bezerra, L.; Bonilla, J.; Barbosa, W. Study of the Behavior and Resistance of Right-Angle Truss Shear Connector for Composite Steel Concrete Beams. Eng. Struct. 2022, 253, 113778. [Google Scholar] [CrossRef]
- Rossi, A.; Silva, R.; Sander, A.; De Souza, C.; Humberto, C. Numerical Assessment of Lateral Distortional Buckling in Steel-Concrete Composite Beams. J. Constr. Steel Res. 2020, 172, 106192. [Google Scholar] [CrossRef]
- Chen, L.; Qiang, X.; Jiang, X.; Bai, J. Numerical Study of Steel—Concrete Composite Beams Strengthened by CFRP Plates with Prestressed Unbonded Reinforcement System. Eng. Fail. Anal. 2024, 157, 107905. [Google Scholar] [CrossRef]
- Earls, C.J. Effects of Material Property Stratification and Residual Stresses on Single Angle Flexural Ductility. J. Constr. Steel Res. 1999, 51, 147–175. [Google Scholar] [CrossRef]
- Hosseinpour, M.; Rossi, A.; Sander, A.; De Souza, C.; Sharifi, Y. New Predictive Equations for LDB Strength Assessment of Steel—Concrete Composite Beams. Eng. Struct. 2022, 258, 114121. [Google Scholar] [CrossRef]
- GB 50010-2010; Code for Design of Concrete Structures. China Architecture & Building Press: Beijing, China, 2015. (In Chinese)


| Components | Elastic Modulus (GPa) | Compressive Strength (MPa) | Tensile Strength (MPa) | Yield Strength (MPa) | Ultimate Strength (MPa) |
|---|---|---|---|---|---|
| Concrete | 36.8 | 72 | 3.7 | - | - |
| Steel rebar | 196 | - | - | 724 | 752 |
| Prestressing strand | 201 | - | - | - | 1860 |
| CFRP tendon | 170 | - | - | - | 2300 |
| Specimens | CFRP Tendons | Note | ||||
|---|---|---|---|---|---|---|
| Number | Df (mm) | Af (mm2) | fci (MPa) | Tf0 (kN) | ||
| PCB-U-0 | - | - | - | - | - | Reference beam |
| PCB-S-1 | 2 | 7 | 77.0 | 345 | 26.6 | Reinforced beams |
| PCB-S-2 | 2 | 7 | 77.0 | 1150 | 88.5 | |
| PCB-S-3 | 2 | 10 | 157.1 | 690 | 108.4 | |
| Models | Element Size (mm) | Element Number | Cracking Load (kN) | Ultimate Load (kN) | Analysis Time (s) | ||||
|---|---|---|---|---|---|---|---|---|---|
| EX | FE | Error (%) | EX | FE | Error (%) | ||||
| PCB-C-1(10) | 10 | 194,992 | 50 | 49 | −2 | 130 | 134 | 3.1 | 258,882 |
| PCB-C-1(15) | 15 | 99,083 | 49 | −2 | 134 | 3.1 | 105,751 | ||
| PCB-C-1(20) | 20 | 70,299 | 50 | 0 | 135 | 3.8 | 34,344 | ||
| PCB-C-1(25) | 25 | 58,870 | 50 | 0 | 135 | 3.8 | 20,276 | ||
| PCB-C-1(30) | 30 | 51,870 | 51 | 2 | 137 | 5.4 | 16,545 | ||
| PCB-C-1(35) | 35 | 47,450 | 52 | 4 | 139 | 6.9 | 13,307 | ||
| PCB-C-1(40) | 40 | 43,910 | 54 | 8 | 140 | 7.7 | 11,903 | ||
| Models | Elastic stiffness (kN/mm) | Cracking load (kN) | Ultimate load (kN) | Ultimate deflection (mm) | ||||||||
|---|---|---|---|---|---|---|---|---|---|---|---|---|
| EX | FE | Error (%) | EX | FE | Error (%) | EX | FE | Error (%) | EX | FE | Error (%) | |
| PCB-U-0 | 5.82 | 5.99 | −2.8 | 40 | 40 | 0 | 100 | 100 | 0 | 54.44 | 60.17 | −9.5 |
| PCB-S-1 | 6.25 | 6.28 | −0.5 | 50 | 50 | 0 | 135 | 130 | 3.8 | 63.34 | 67.17 | −5.7 |
| PCB-S-2 | 6.21 | 6.4 | −3 | 70 | 70 | 0 | 145 | 140 | 3.6 | 63.2 | 68.98 | −8.4 |
| PCB-S-3 | 6.31 | 6.83 | −7.6 | 75 | 80 | −6.3 | 160 | 155 | 3.2 | 66.38 | 68.92 | −3.7 |
| Models | CFRP Tendon | Deviator Layout | Anchorage Position | Prestressing Strand | Numerical Results | |||||||
|---|---|---|---|---|---|---|---|---|---|---|---|---|
| Diameter (mm) | Prestress (mm) | Number | Middle CFRP Length | Height (mm) | Angle of CFRP (°) | Prestress (MPa) | Initial Deflection (mm) | Initial Stiffness (kN/mm) | Post-Cracking Stiffness (kN/mm) | Cracking Load (kN) | Ultimate Load (kN) | |
| PCB-U-0 | - | - | - | - | - | - | - | 0 | 5.8 | 1.12 | 40 | 100 |
| D7-P300 | 7 | 300 | 4 | 1400 | 116 | 5.11 | 580 | −0.58 | 6.24 | 1.61 | 48 | 129 |
| D7-P400 | 400 | −0.82 | 6.24 | 1.62 | 50 | 131 | ||||||
| D7-P500 | 500 | −1.05 | 6.24 | 1.64 | 52 | 133 | ||||||
| D7-P600 | 600 | −1.28 | 6.23 | 1.65 | 54 | 135 | ||||||
| D7-P700 | 700 | −1.51 | 6.23 | 1.66 | 56 | 136 | ||||||
| D7-P800 | 800 | −1.74 | 6.23 | 1.67 | 58 | 138 | ||||||
| D7-P900 | 900 | −1.97 | 6.22 | 1.7 | 60 | 139 | ||||||
| D7-P1000 | 1000 | −2.2 | 6.2 | 1.74 | 62 | 141 | ||||||
| D5-P500 | 5 | 500 | 4 | 1400 | 116 | 5.11 | 580 | −0.53 | 6.17 | 1.49 | 45 | 124 |
| D6-P500 | 6 | −0.76 | 6.22 | 1.56 | 48 | 128 | ||||||
| D7-P500 | 7 | −1.05 | 6.24 | 1.64 | 52 | 133 | ||||||
| D8-P500 | 8 | −1.34 | 6.27 | 1.7 | 56 | 136 | ||||||
| D9-P500 | 9 | −1.68 | 6.31 | 1.81 | 59 | 143 | ||||||
| D10-P500 | 10 | −2.02 | 6.35 | 1.93 | 61 | 151 | ||||||
| Z4-L1400 | 7 | 500 | 4 | 1400 | 116 | 5.11 | 580 | −1.05 | 6.24 | 1.64 | 52 | 133 |
| Z2-L1400 | 2 | 1400 | −0.99 | 6.22 | 1.62 | 52 | 132 | |||||
| Z2-L1000 | 2 | 1000 | −0.94 | 6.22 | 1.62 | 51 | 132 | |||||
| Z2-L800 | 2 | 800 | −0.92 | 6.21 | 1.59 | 51 | 131 | |||||
| Z2-L500 | 2 | 500 | −0.87 | 6.21 | 1.57 | 50 | 130 | |||||
| Z2-L400 | 2 | 400 | −0.86 | 6.2 | 1.56 | 50 | 129 | |||||
| Z1-L0 | 1 | 0 | −0.8 | 6.17 | 1.53 | 50 | 128 | |||||
| H110 | 7 | 500 | 0 | 2800 | 110 | 0 | 580 | −0.06 | 6.01 | 1.29 | 45 | 115 |
| H90 | 90 | −0.28 | 6.05 | 1.31 | 47 | 117 | ||||||
| H70 | 70 | −0.5 | 6.09 | 1.34 | 49 | 119 | ||||||
| H50 | 50 | −0.72 | 6.12 | 1.38 | 51 | 121 | ||||||
| H30 | 30 | −0.93 | 6.15 | 1.43 | 52 | 124 | ||||||
| SP100 | 7 | 1000 | 4 | 1400 | 116 | 5.11 | 100 | −1.8 | 6.10 | 1.47 | 30 | 116 |
| SP300 | 300 | −1.79 | 6.13 | 1.56 | 42 | 127 | ||||||
| SP500 | 500 | −1.76 | 6.23 | 1.67 | 56 | 137 | ||||||
| SP700 | 700 | −1.78 | 6.24 | 1.72 | 70 | 148 | ||||||
| SP900 | 900 | −1.8 | 6.06 | 1.78 | 82 | 157 | ||||||
Disclaimer/Publisher’s Note: The statements, opinions and data contained in all publications are solely those of the individual author(s) and contributor(s) and not of MDPI and/or the editor(s). MDPI and/or the editor(s) disclaim responsibility for any injury to people or property resulting from any ideas, methods, instructions or products referred to in the content. |
© 2024 by the authors. Licensee MDPI, Basel, Switzerland. This article is an open access article distributed under the terms and conditions of the Creative Commons Attribution (CC BY) license (https://creativecommons.org/licenses/by/4.0/).
Share and Cite
Chen, L.; Qiang, X.; Jiang, X.; Dong, H.; Chen, W. Study on Prestressed Concrete Beams Strengthened with External Unbonded CFRP Tendons. Materials 2024, 17, 4622. https://doi.org/10.3390/ma17184622
Chen L, Qiang X, Jiang X, Dong H, Chen W. Study on Prestressed Concrete Beams Strengthened with External Unbonded CFRP Tendons. Materials. 2024; 17(18):4622. https://doi.org/10.3390/ma17184622
Chicago/Turabian StyleChen, Longlong, Xuhong Qiang, Xu Jiang, Hao Dong, and Wulong Chen. 2024. "Study on Prestressed Concrete Beams Strengthened with External Unbonded CFRP Tendons" Materials 17, no. 18: 4622. https://doi.org/10.3390/ma17184622
APA StyleChen, L., Qiang, X., Jiang, X., Dong, H., & Chen, W. (2024). Study on Prestressed Concrete Beams Strengthened with External Unbonded CFRP Tendons. Materials, 17(18), 4622. https://doi.org/10.3390/ma17184622