
Experimental and Numerical Study on Lightweight-Foamed-Concrete-Filled Widened Embankment of High-Speed Railway

Abstract
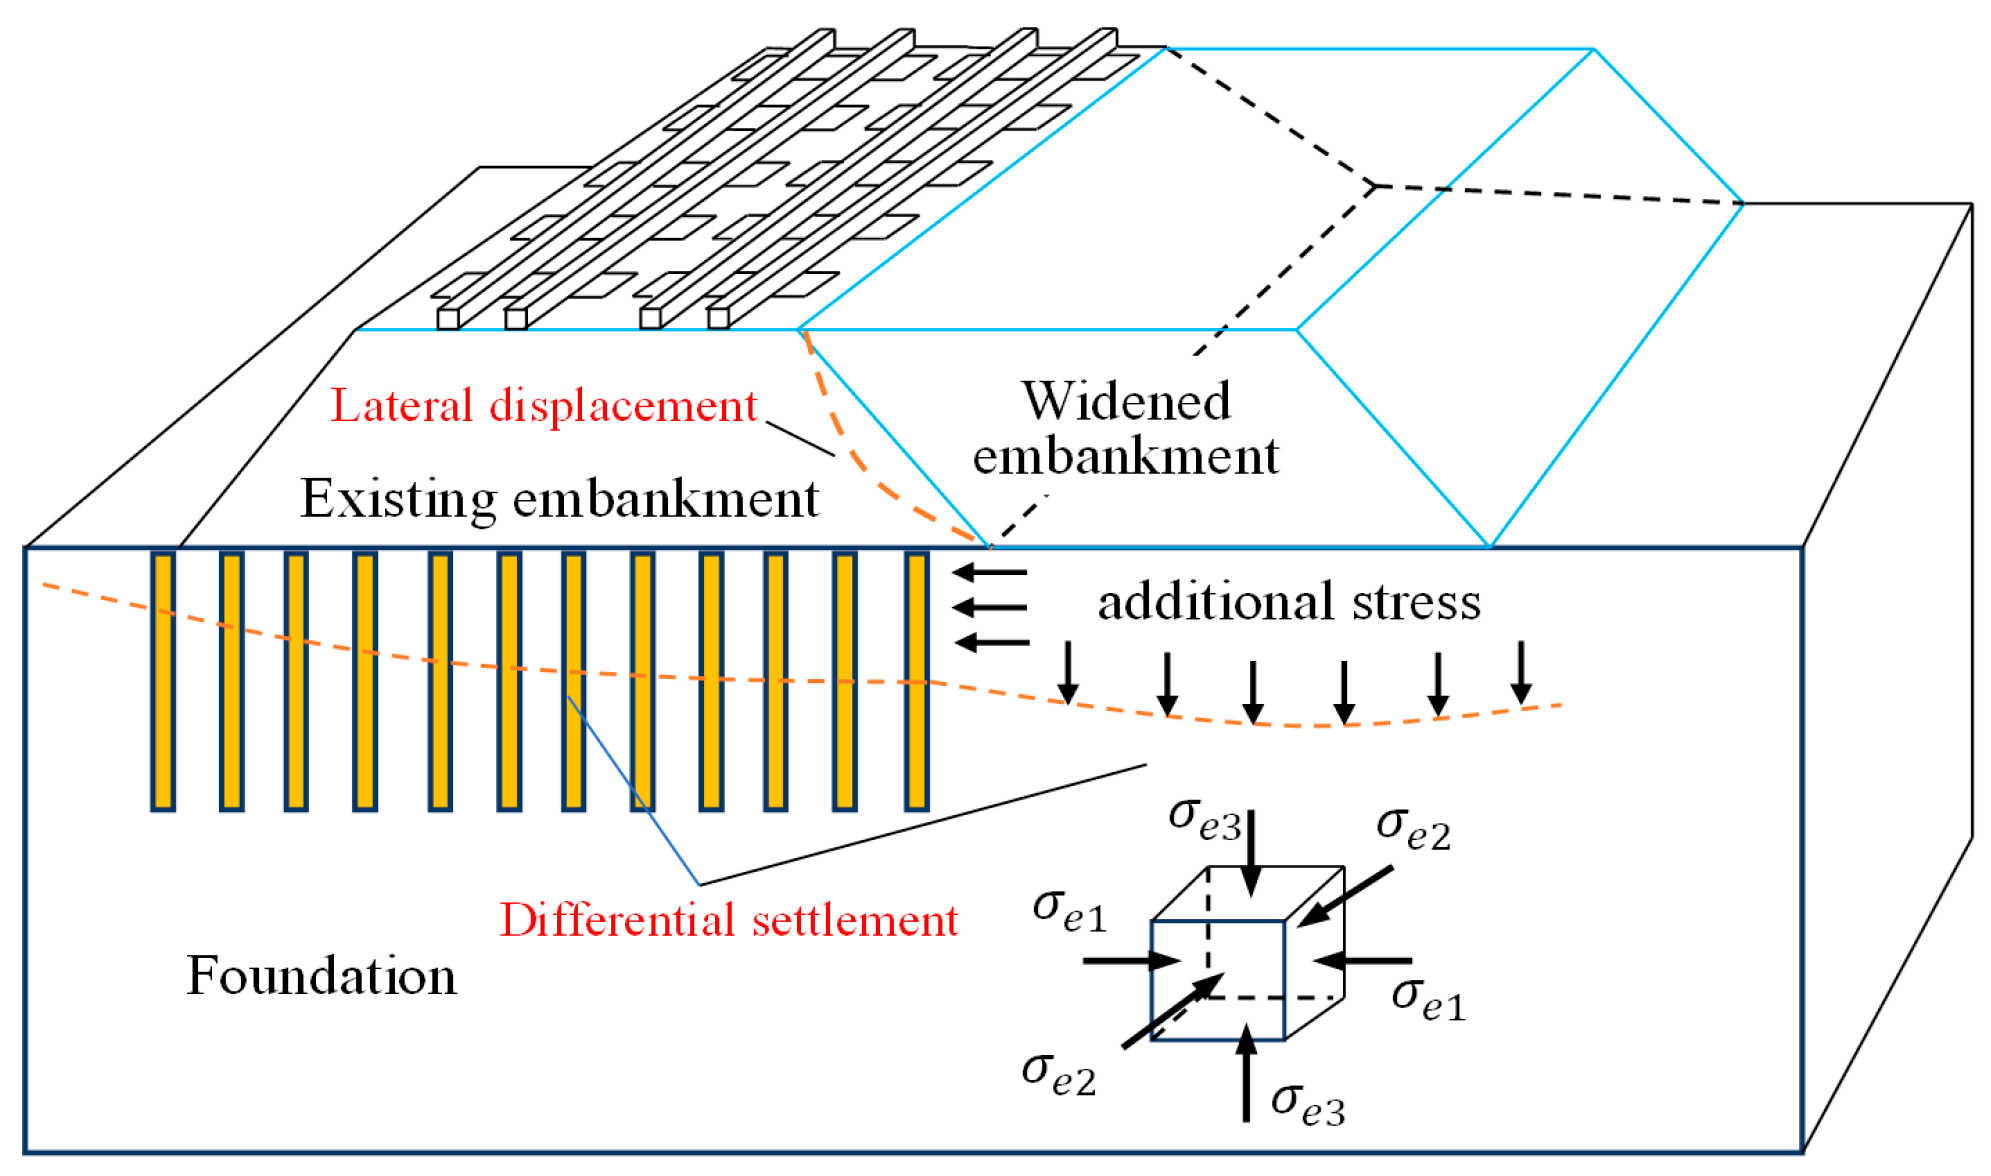
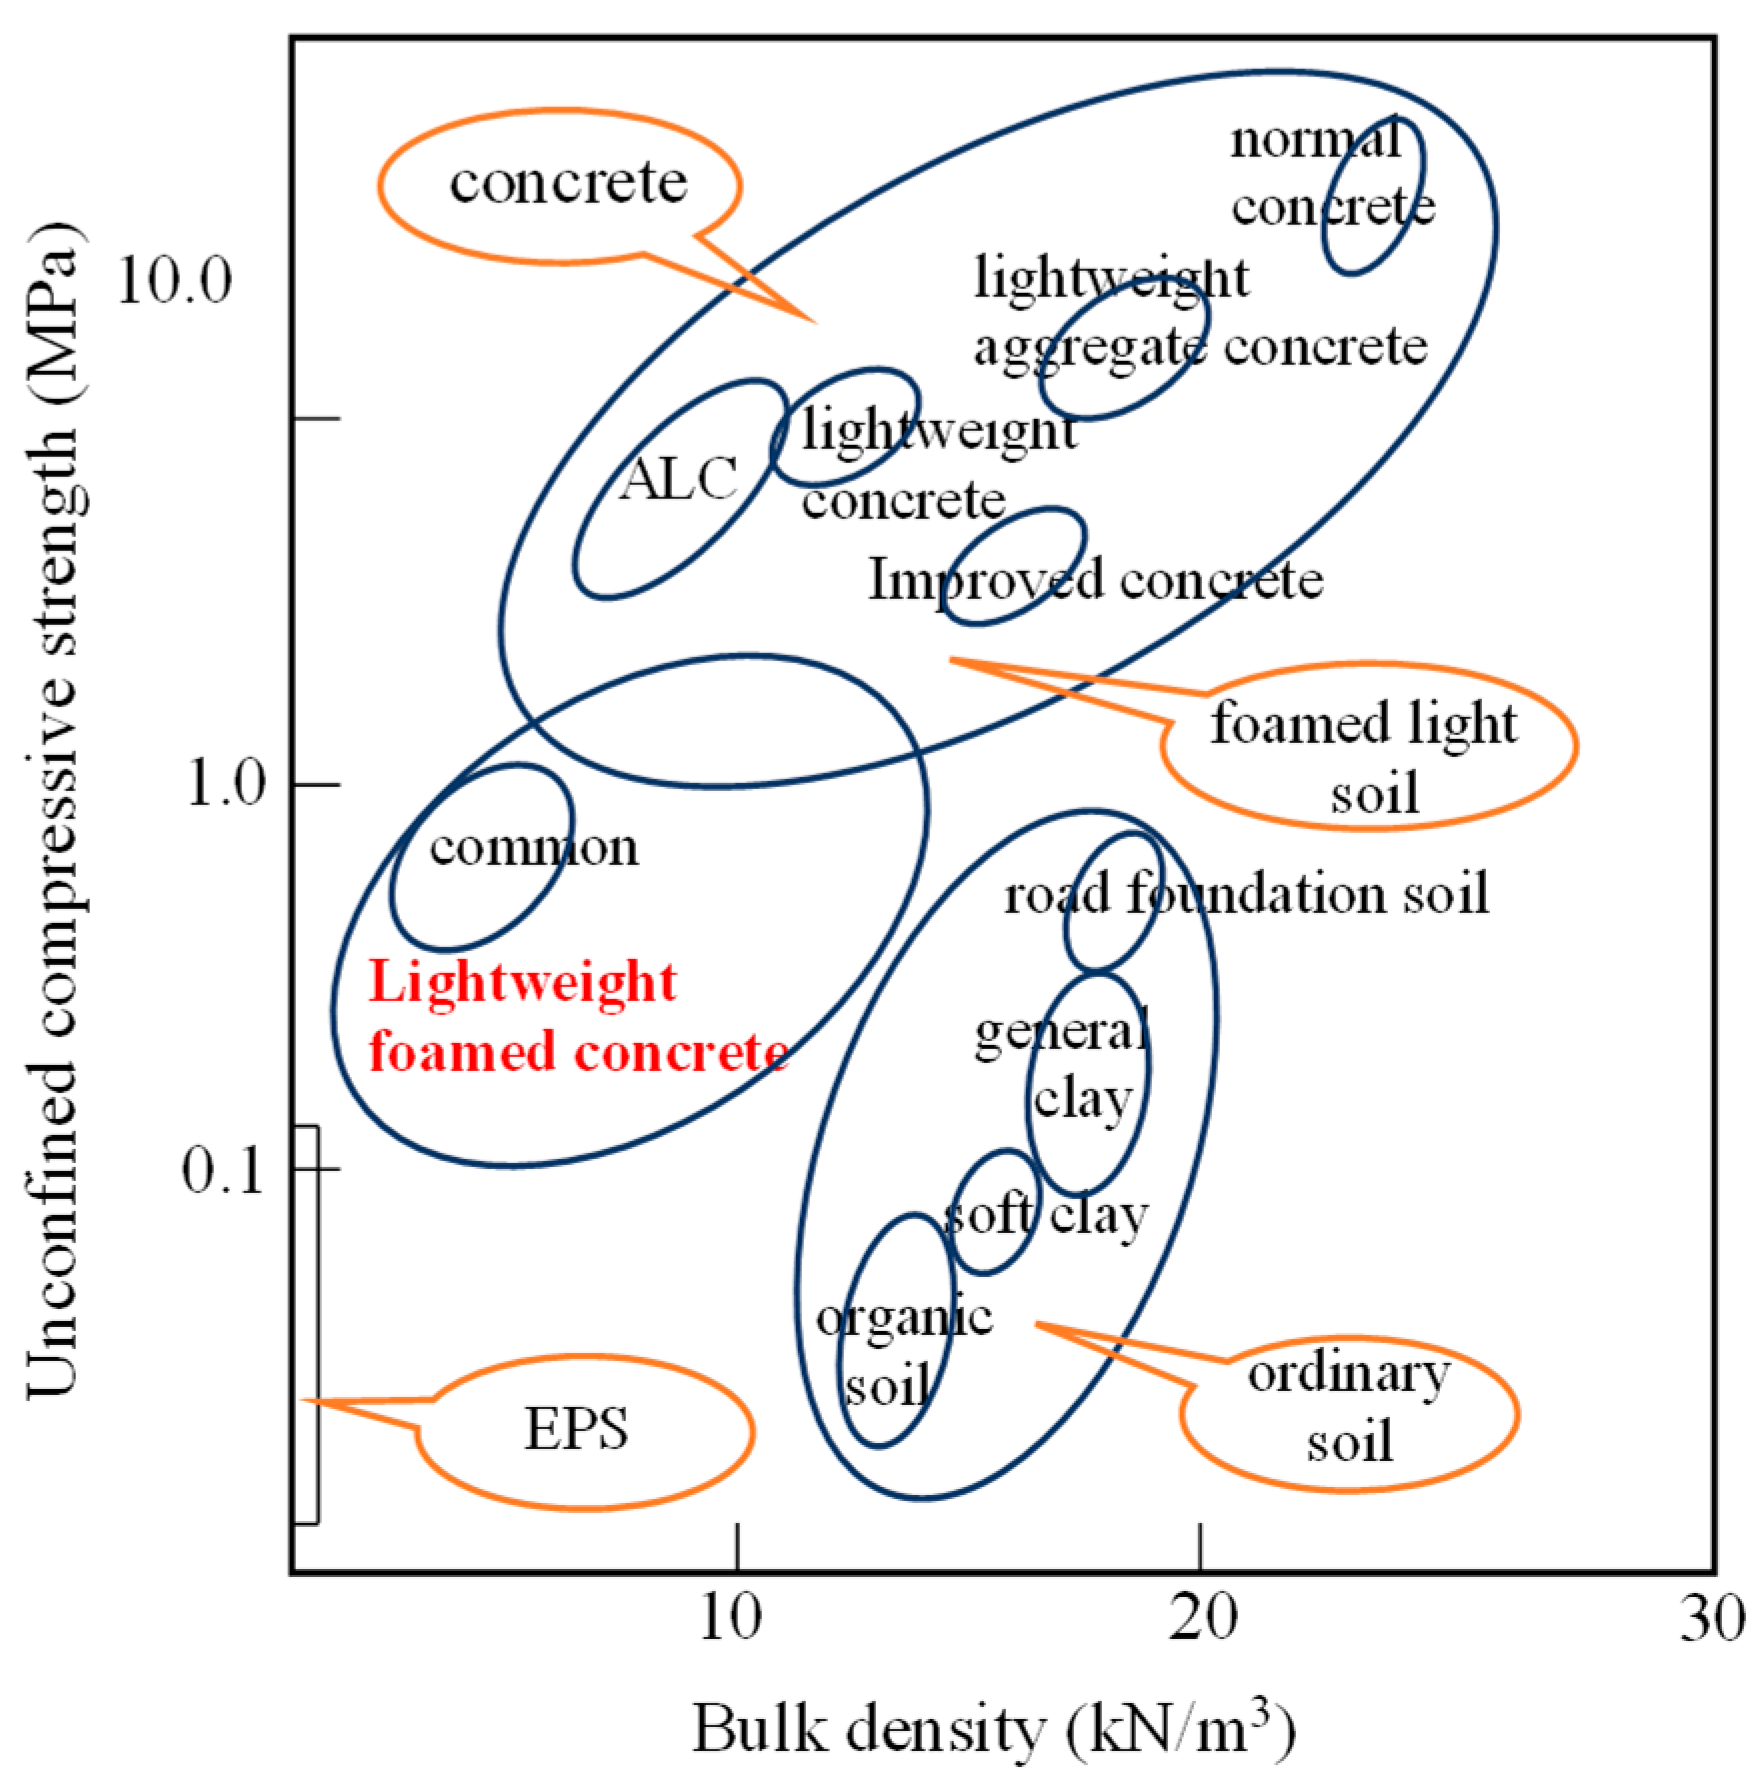
:1. Introduction
2. Performance Test of LWFC
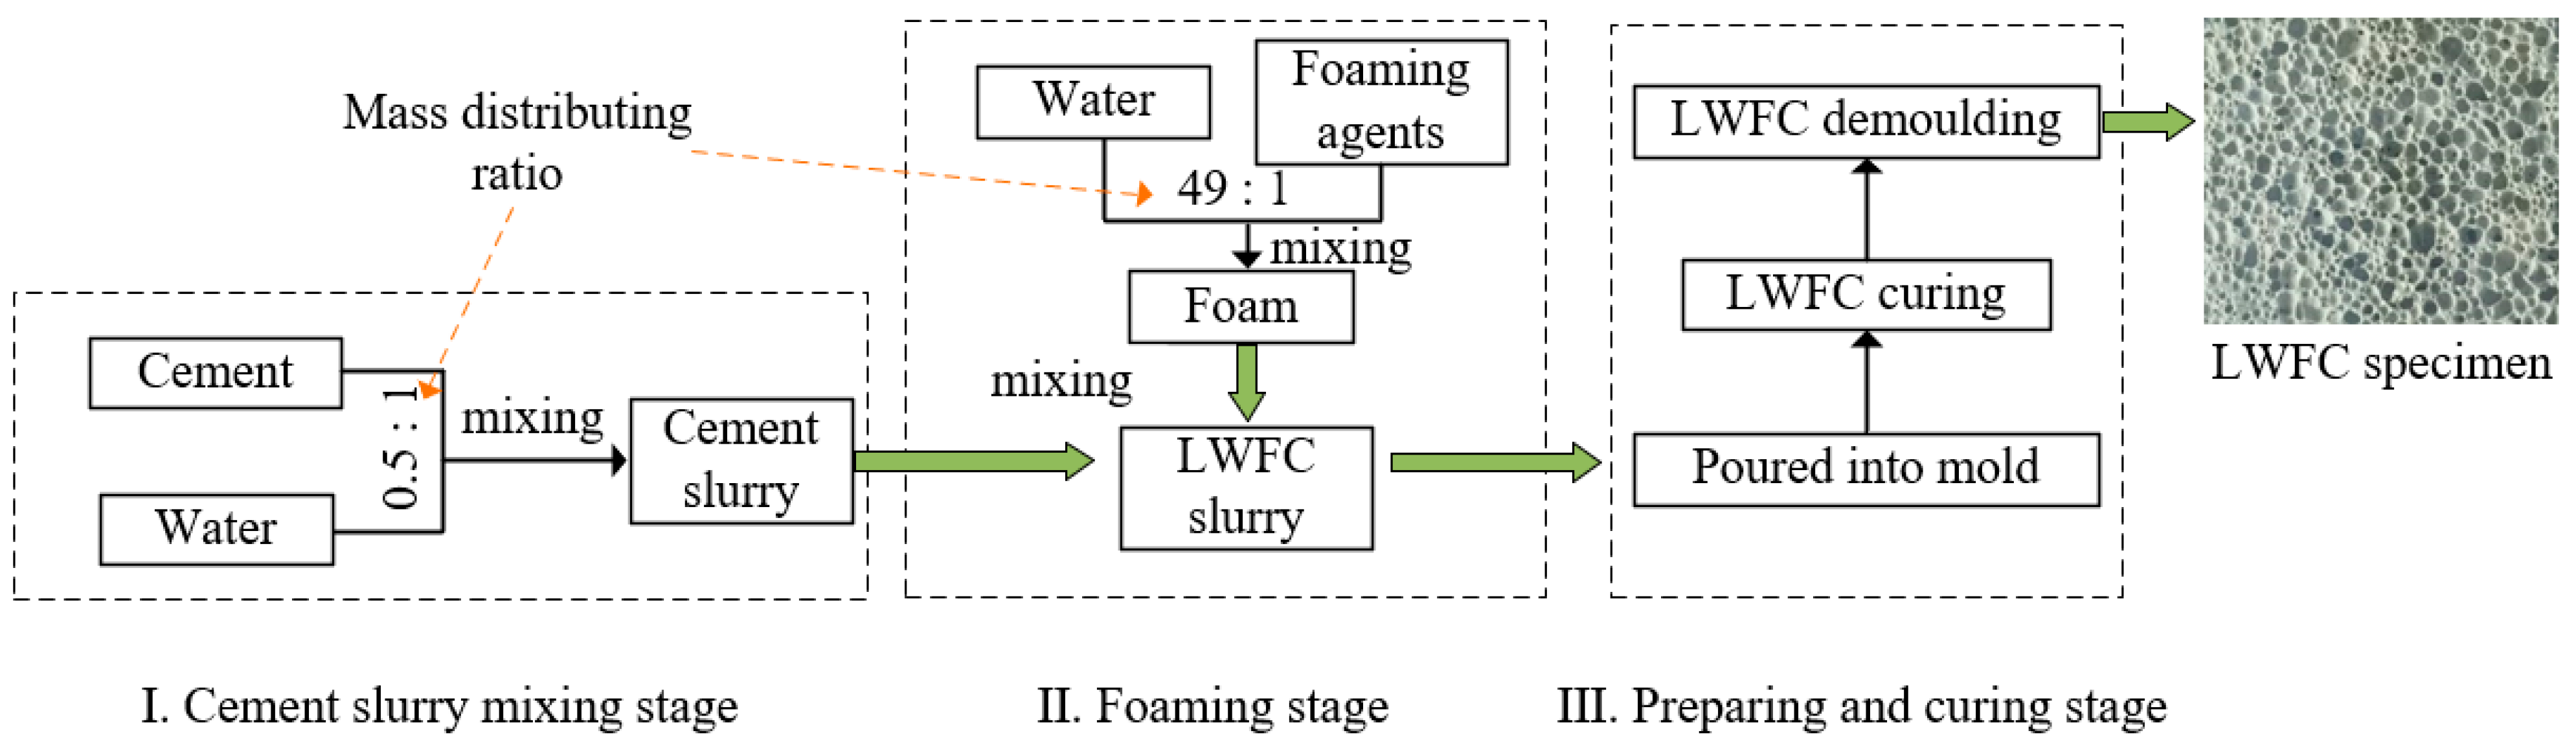
2.1. Preparation of the Specimen
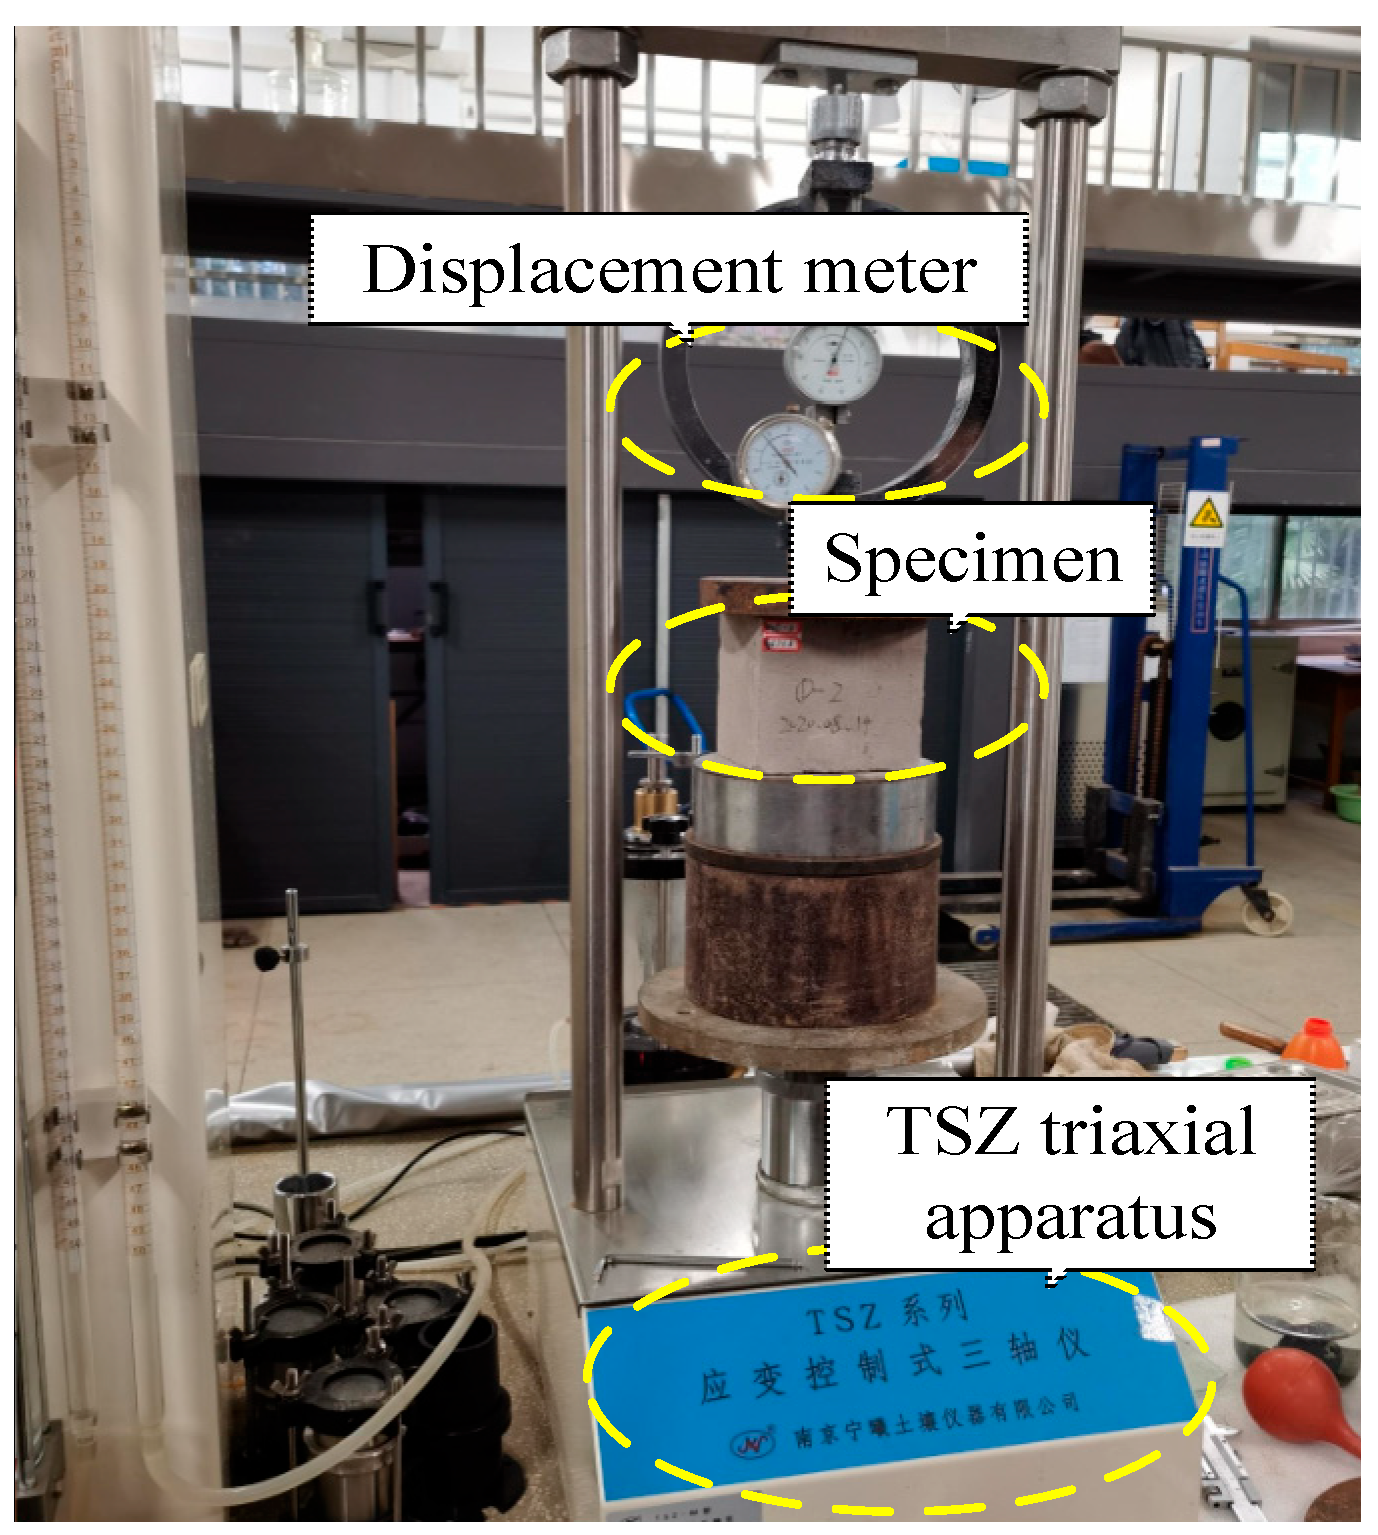
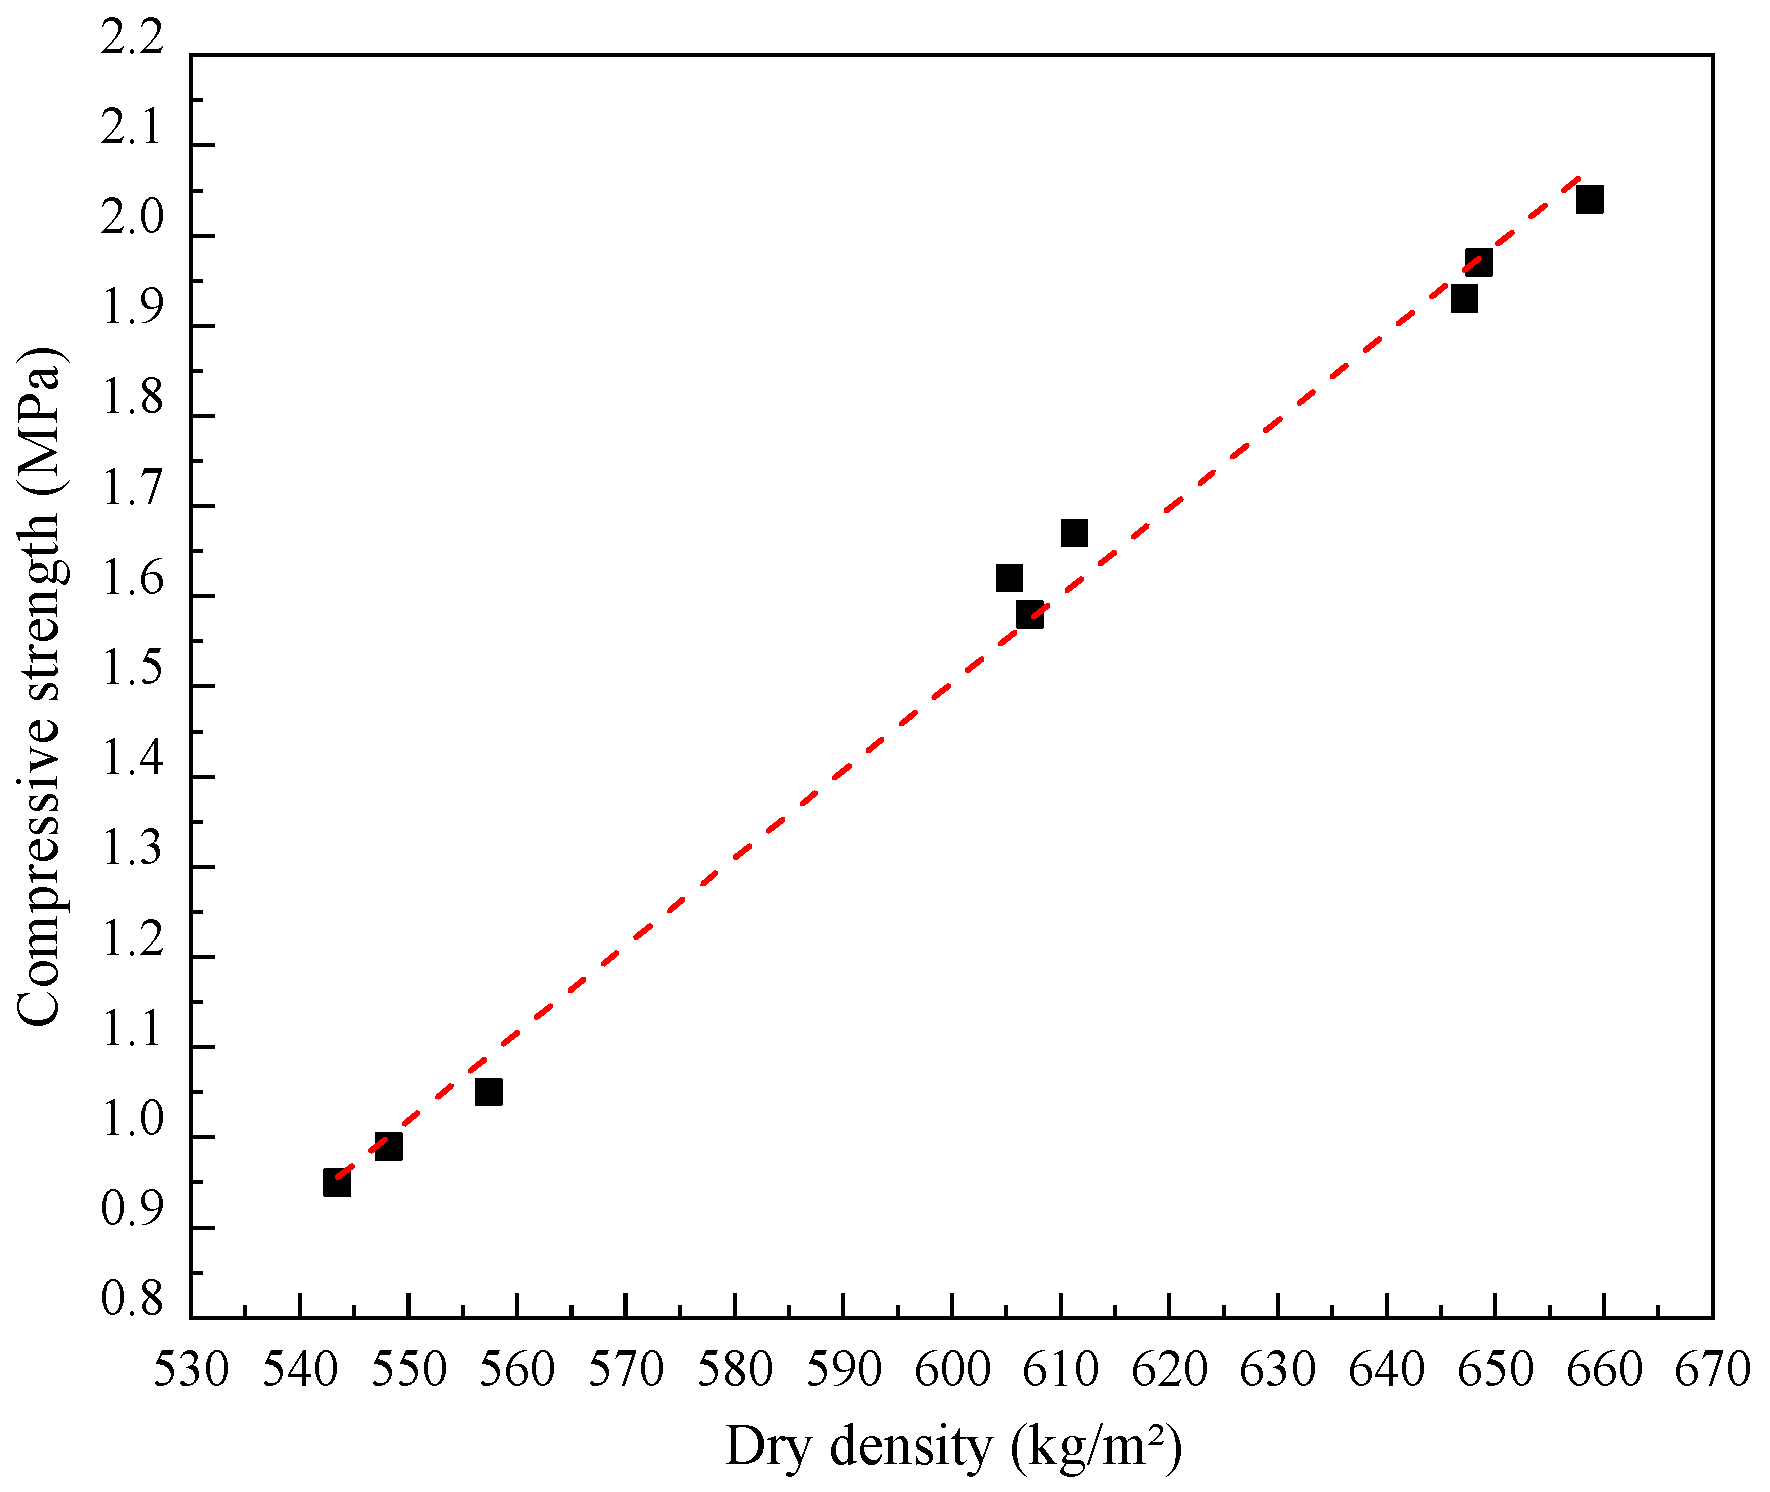
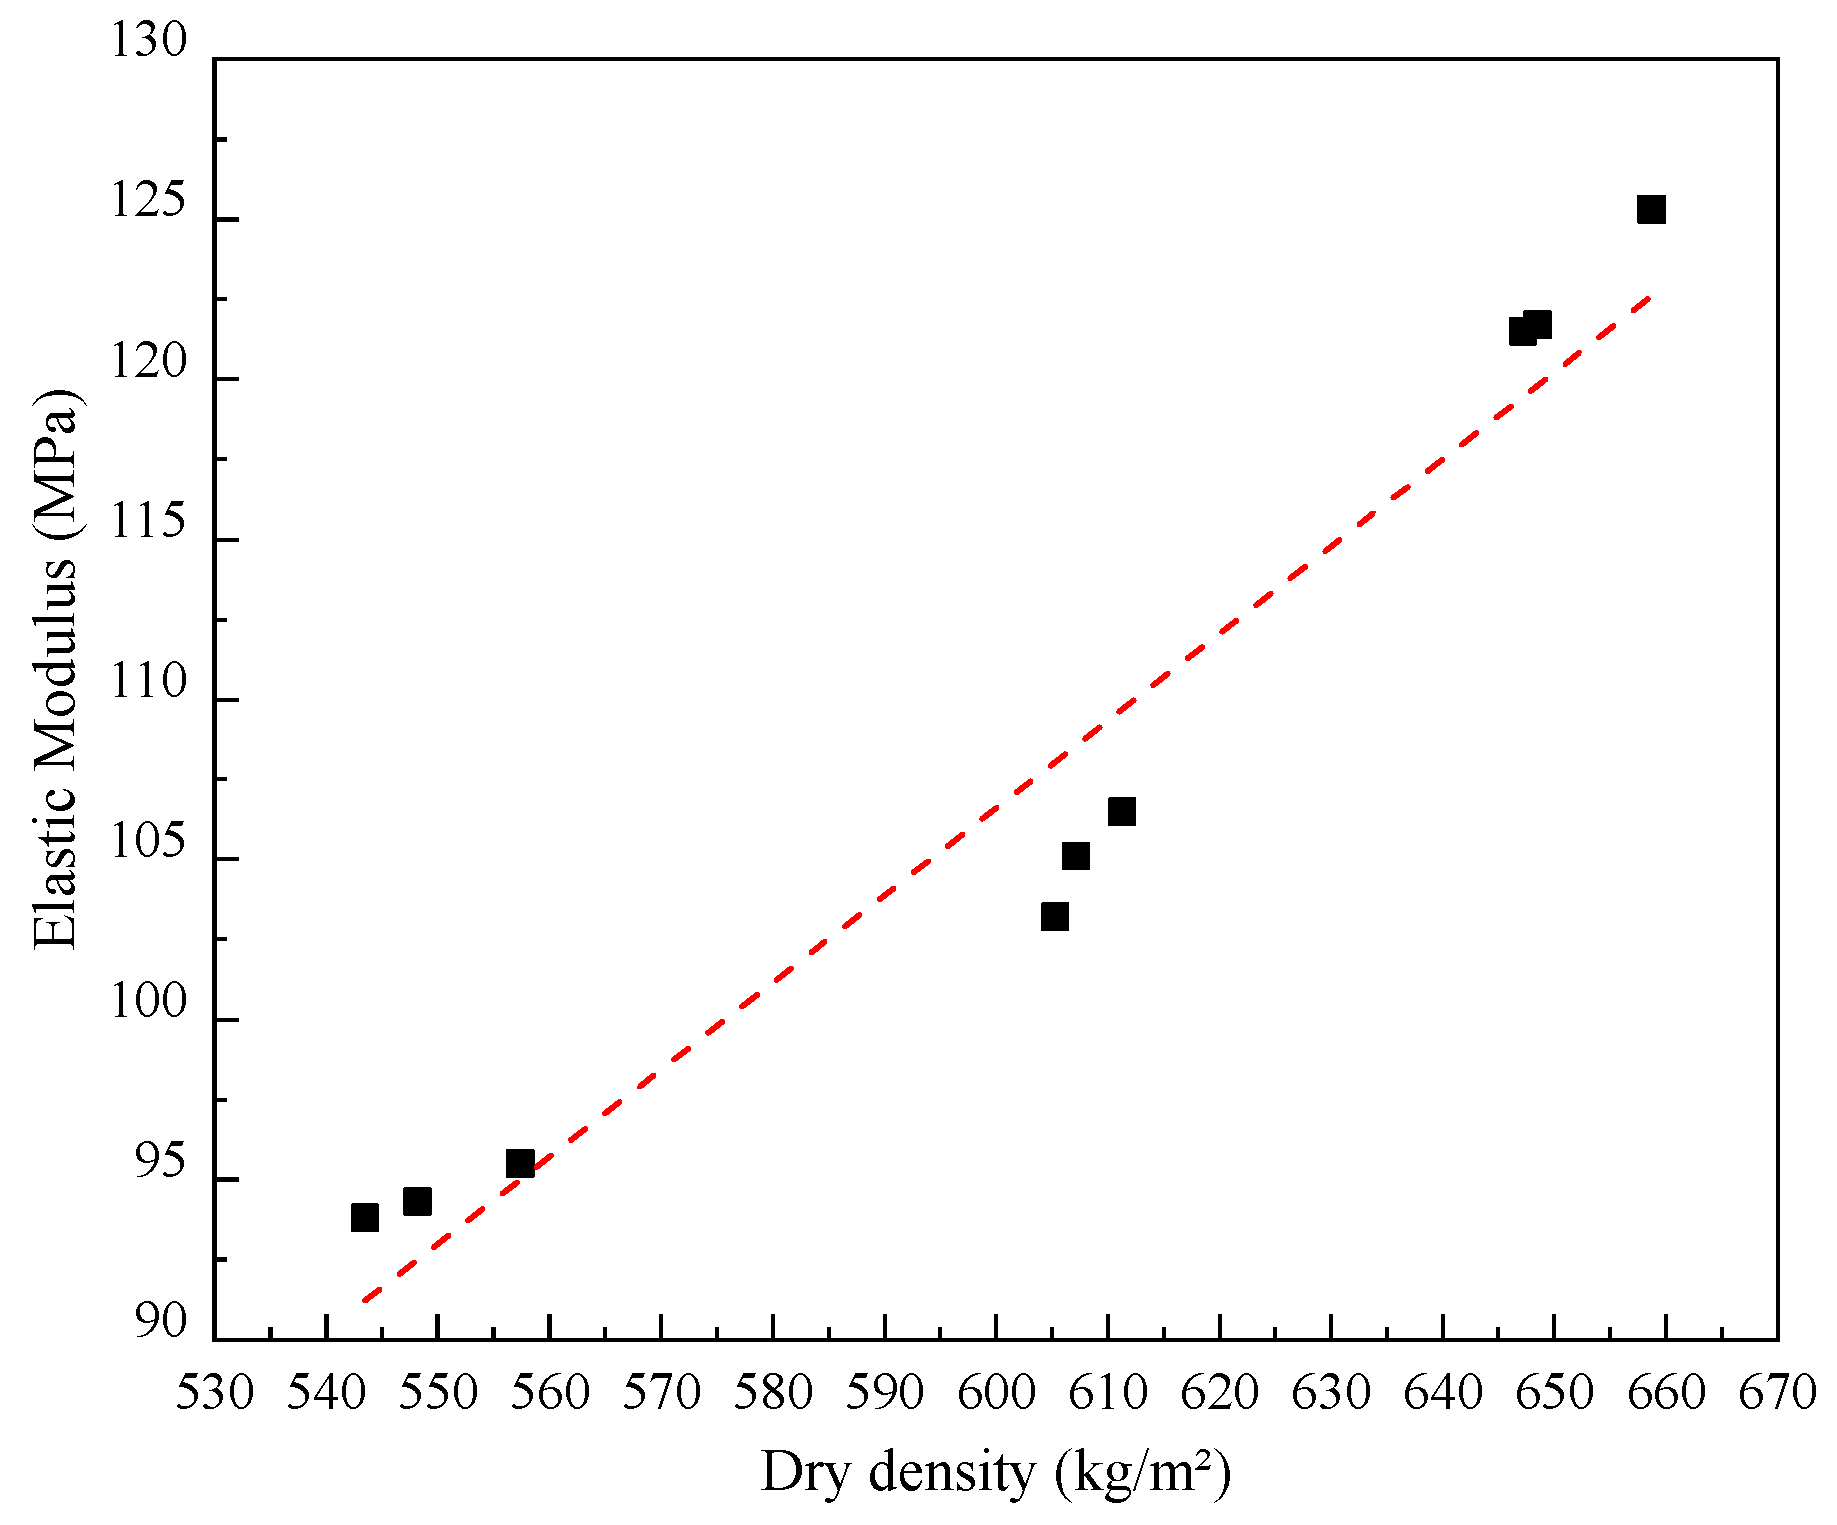
2.2. Compressive Strength Test
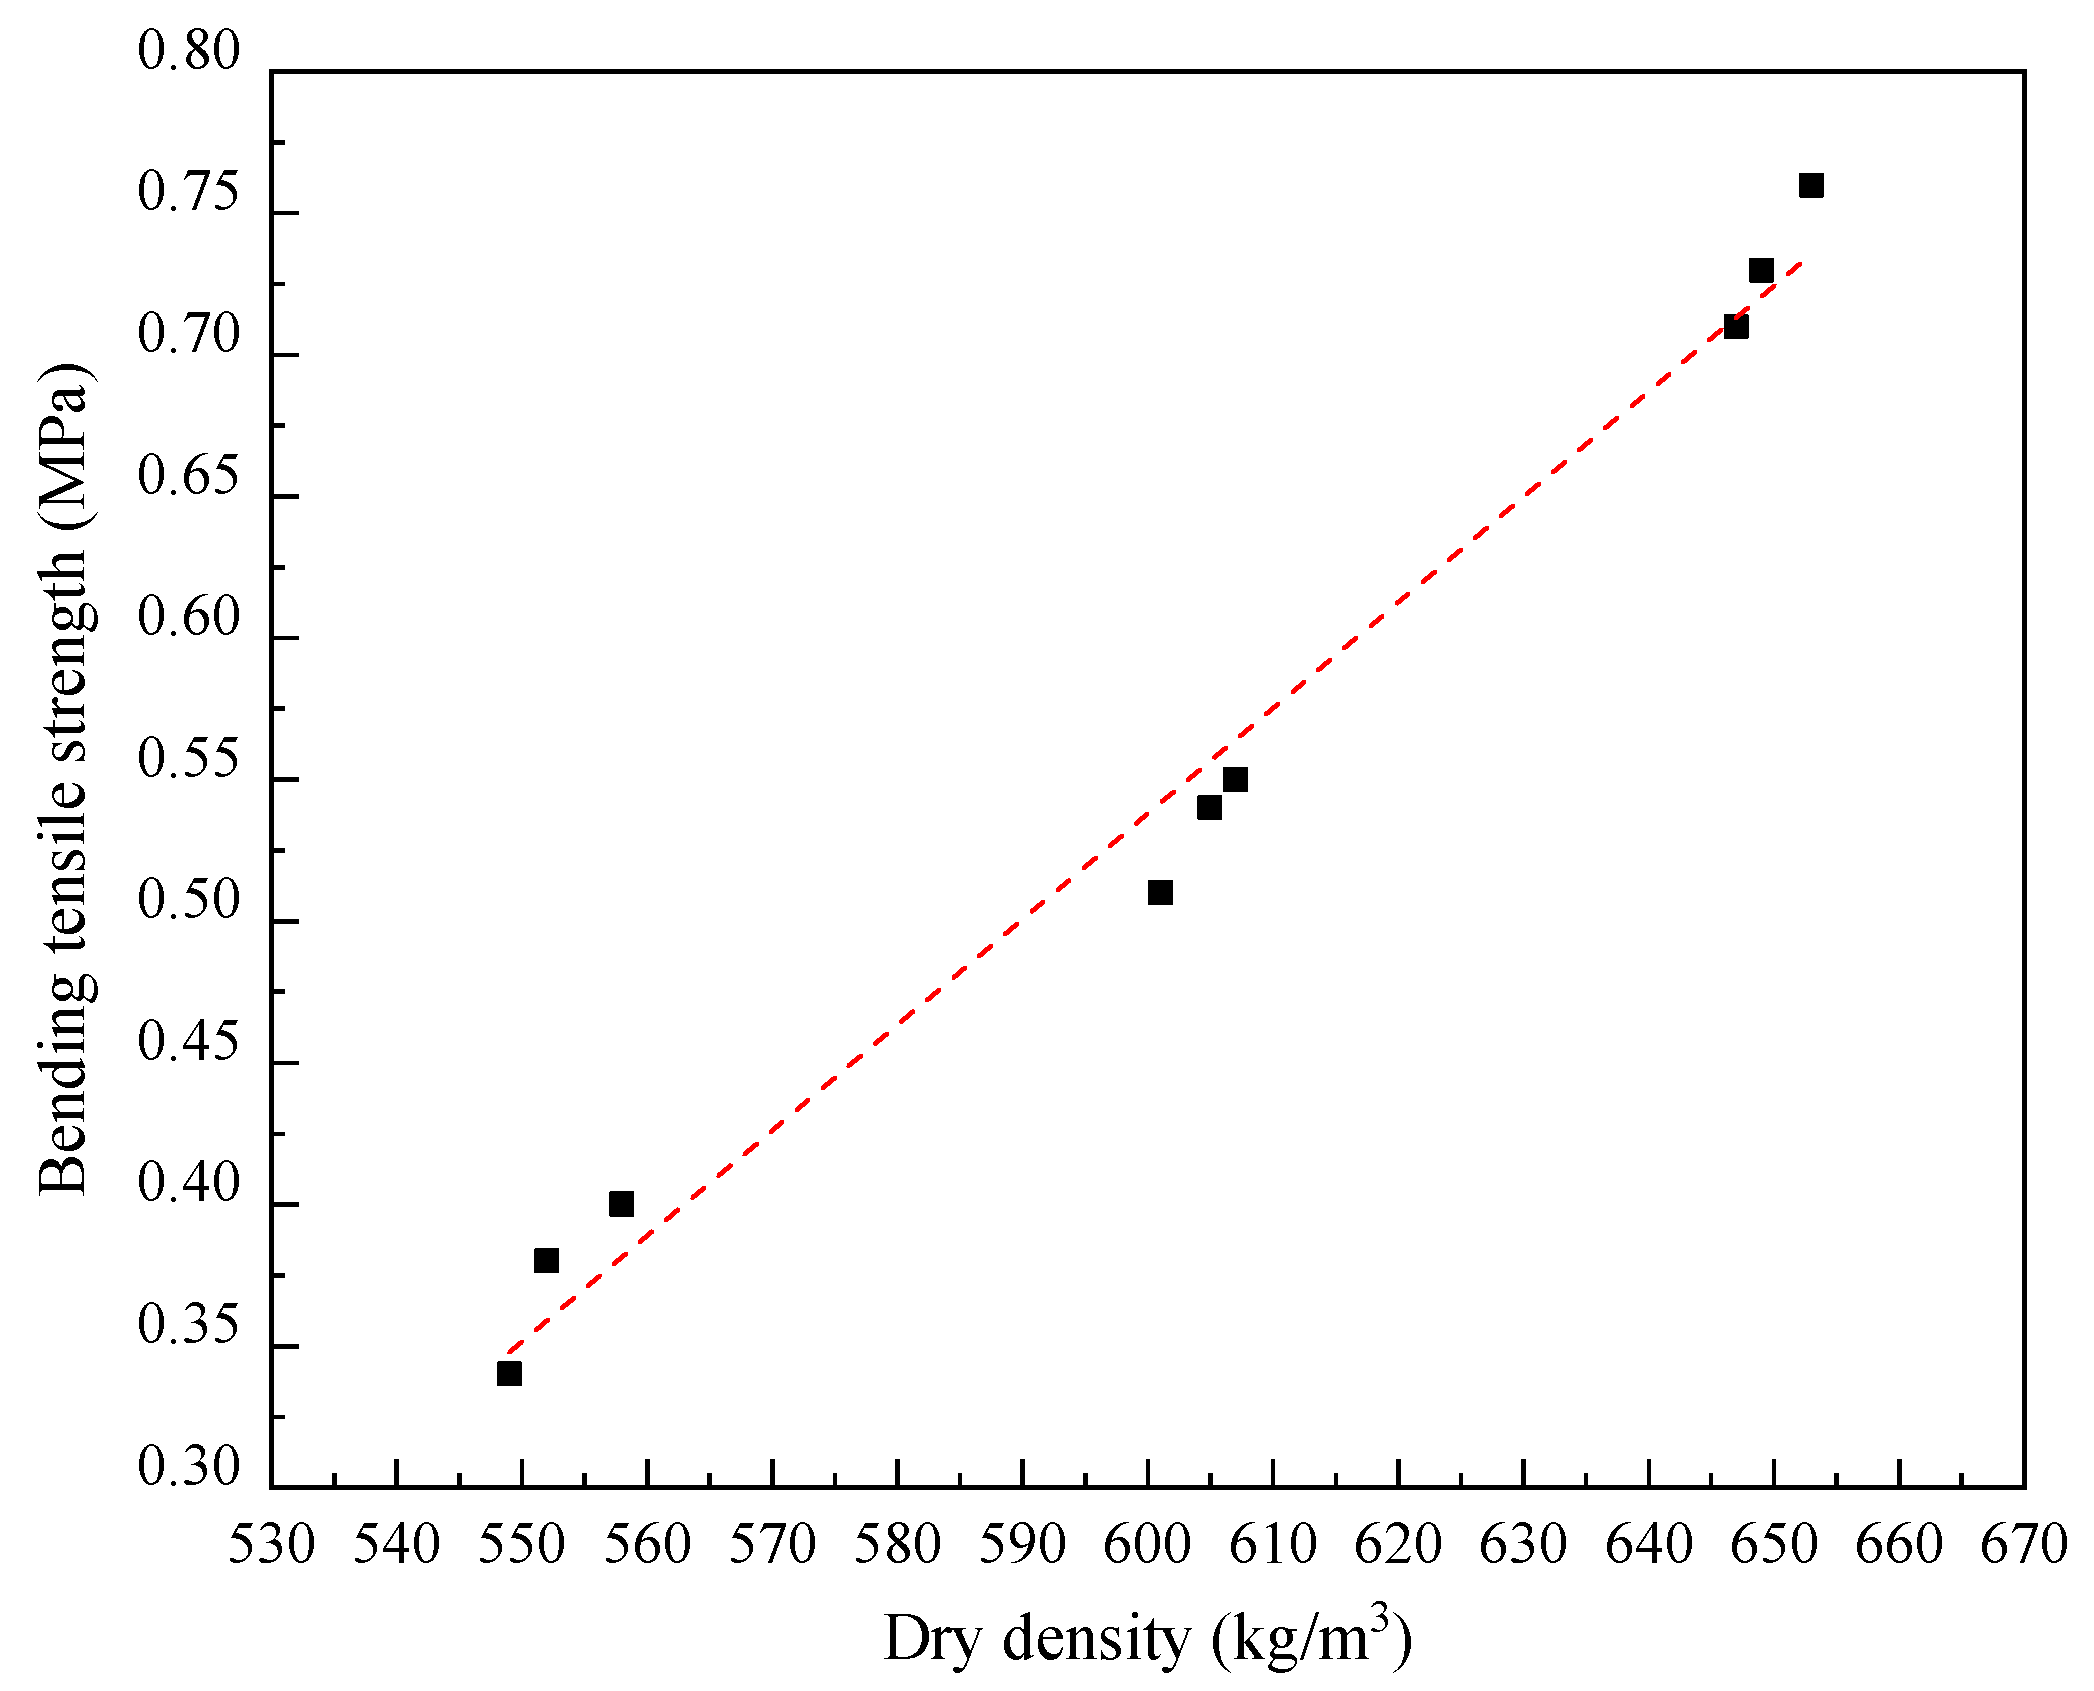
2.3. Tensile Strength Test
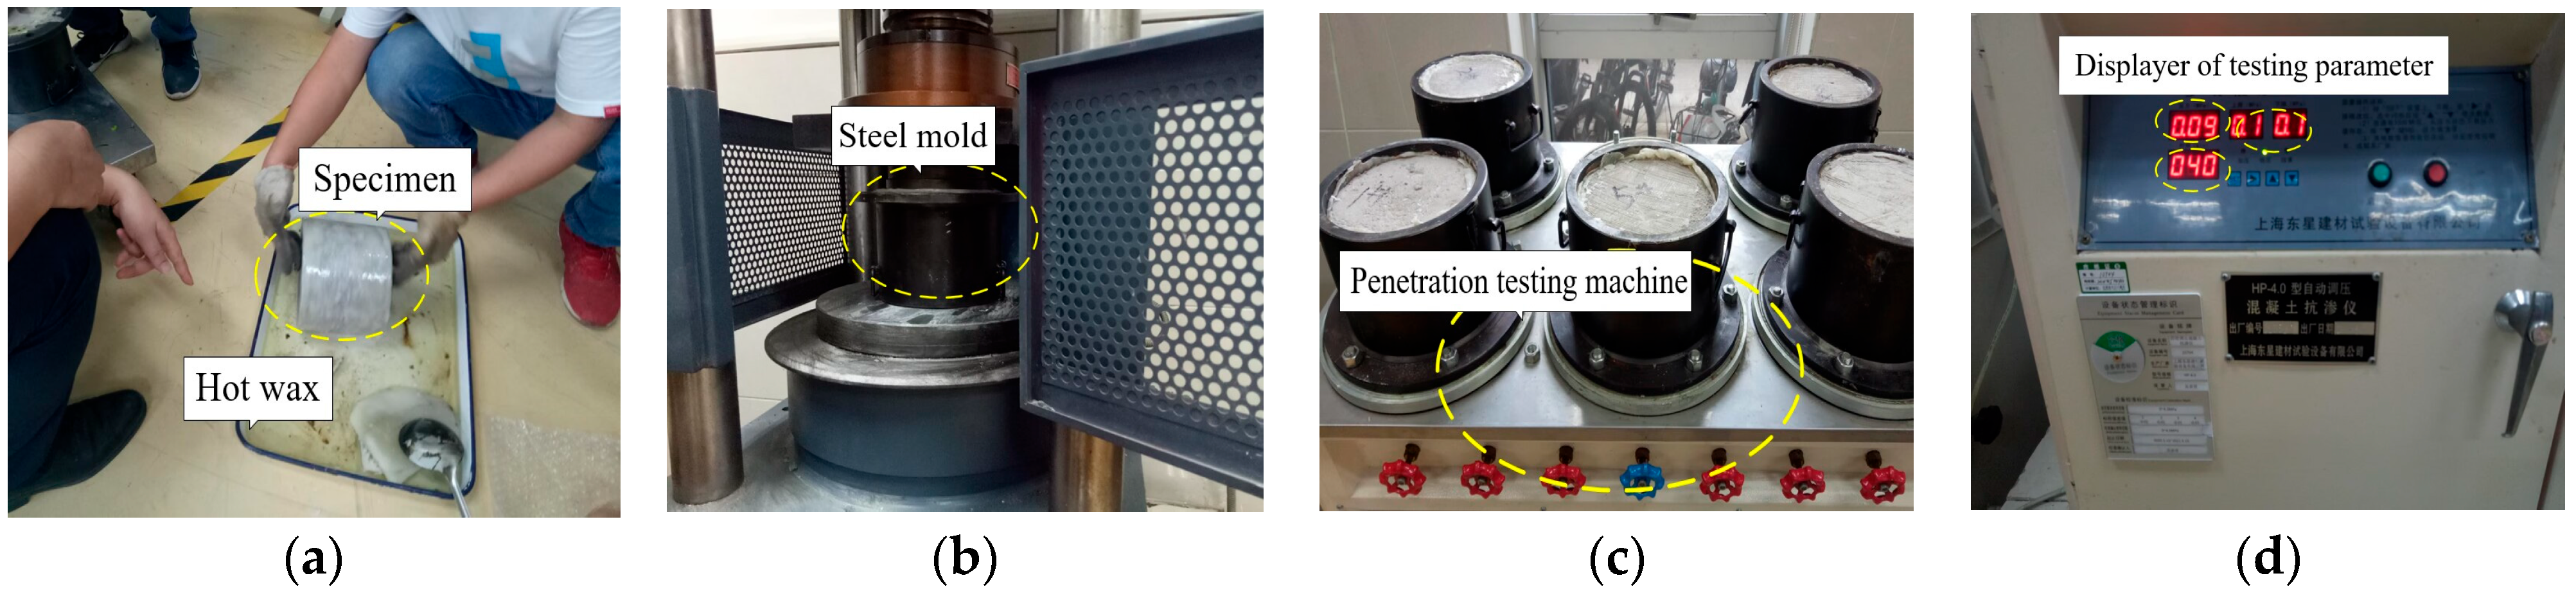
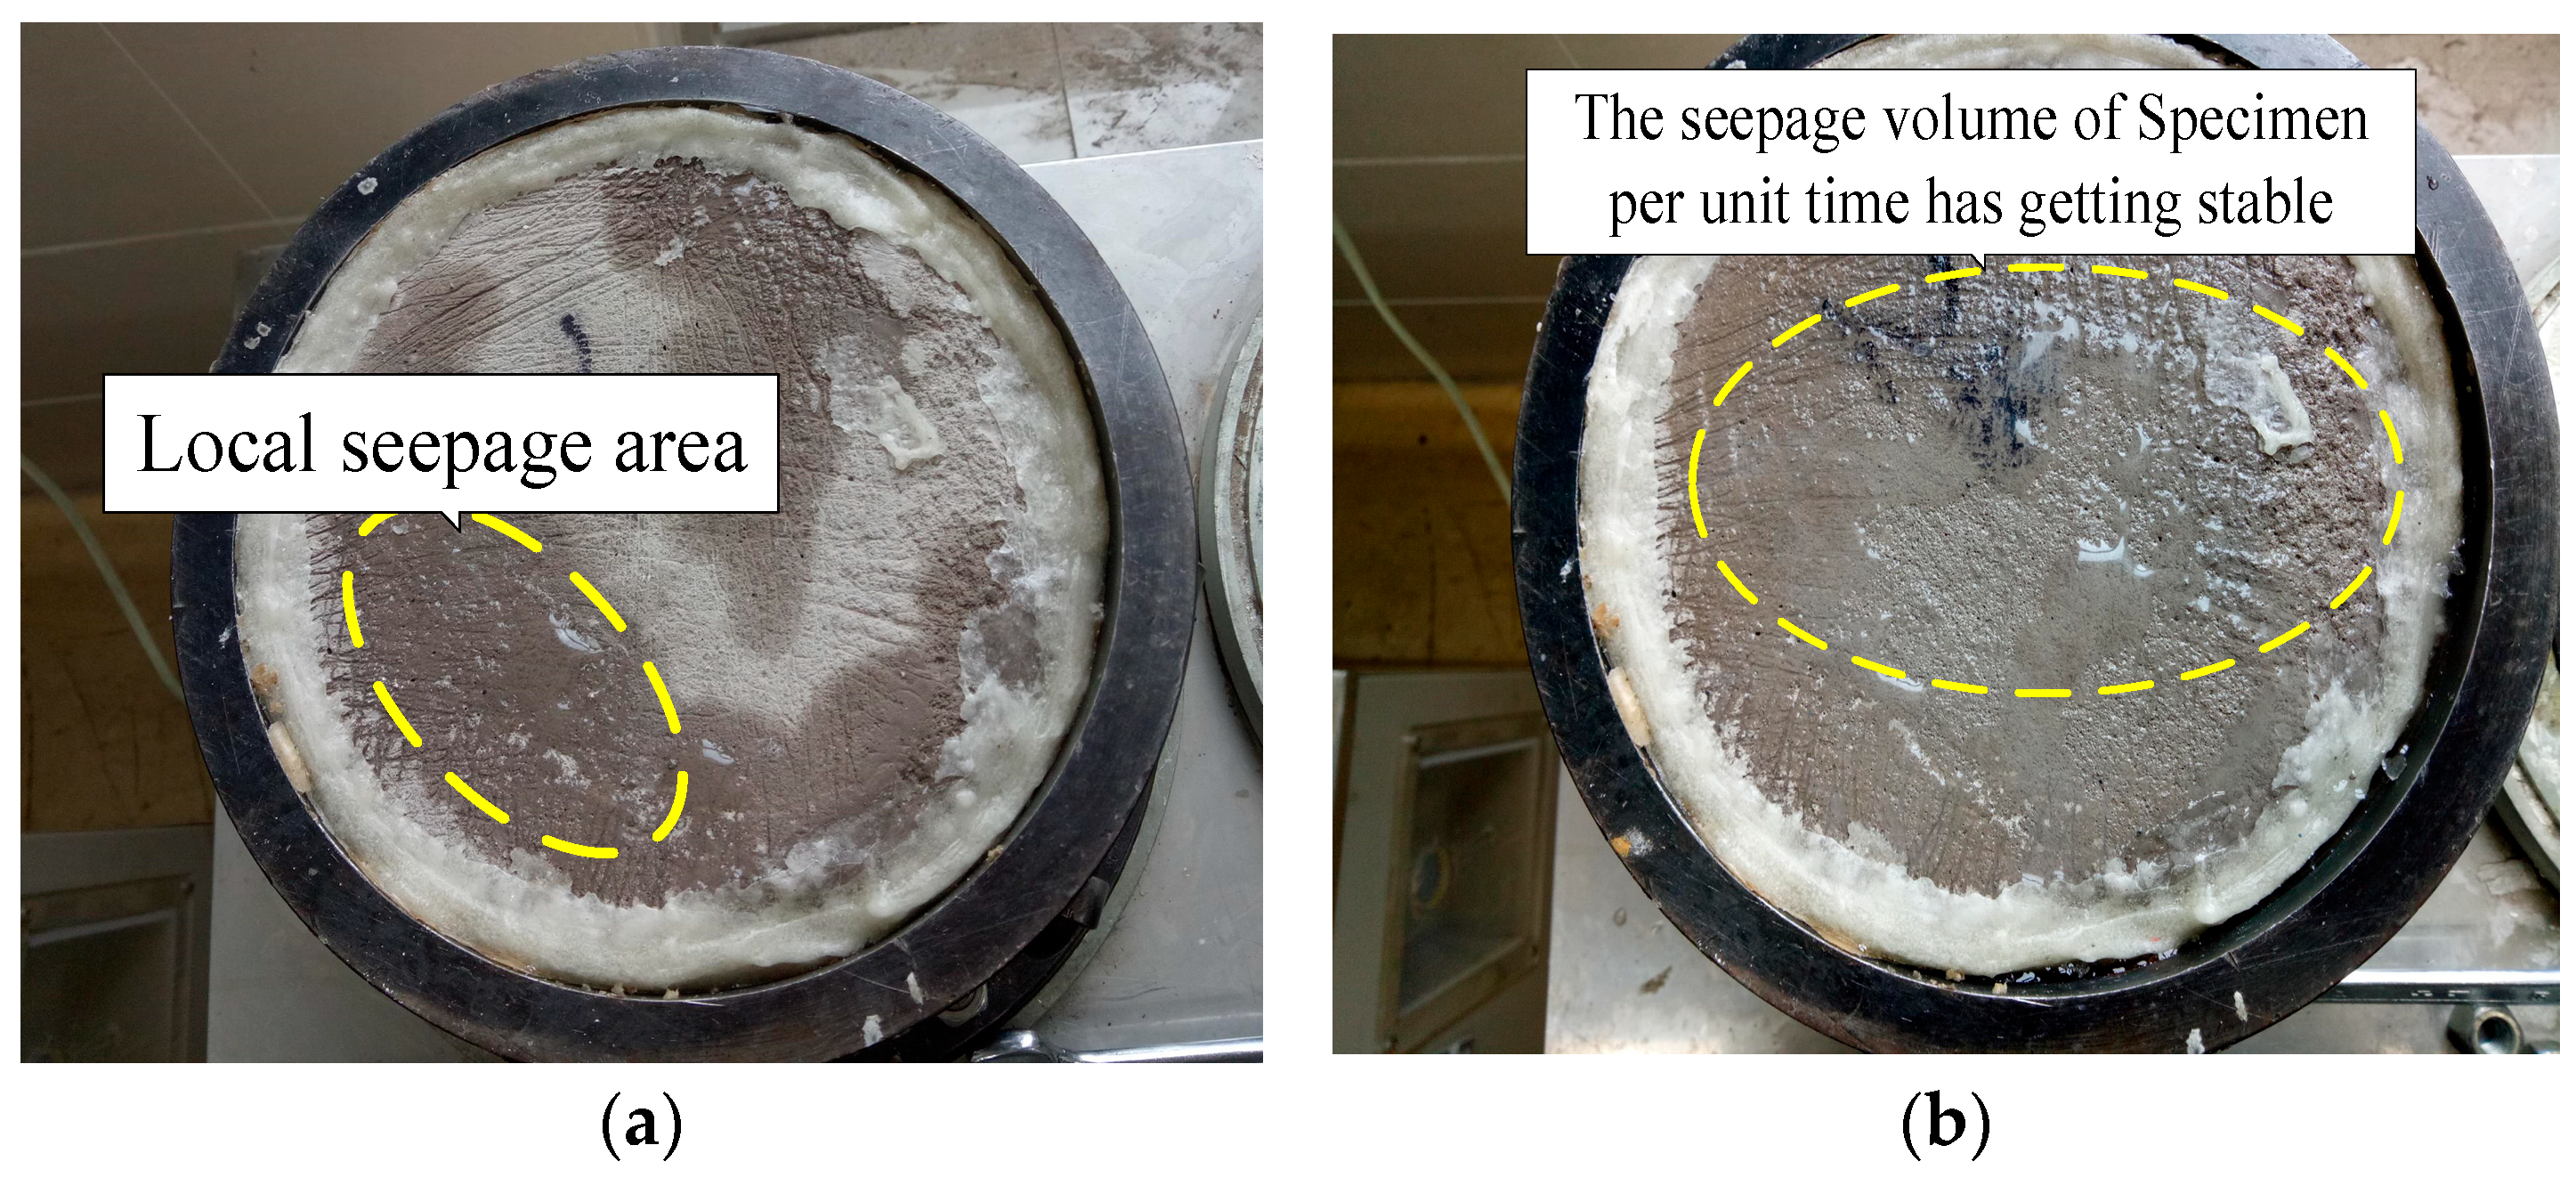
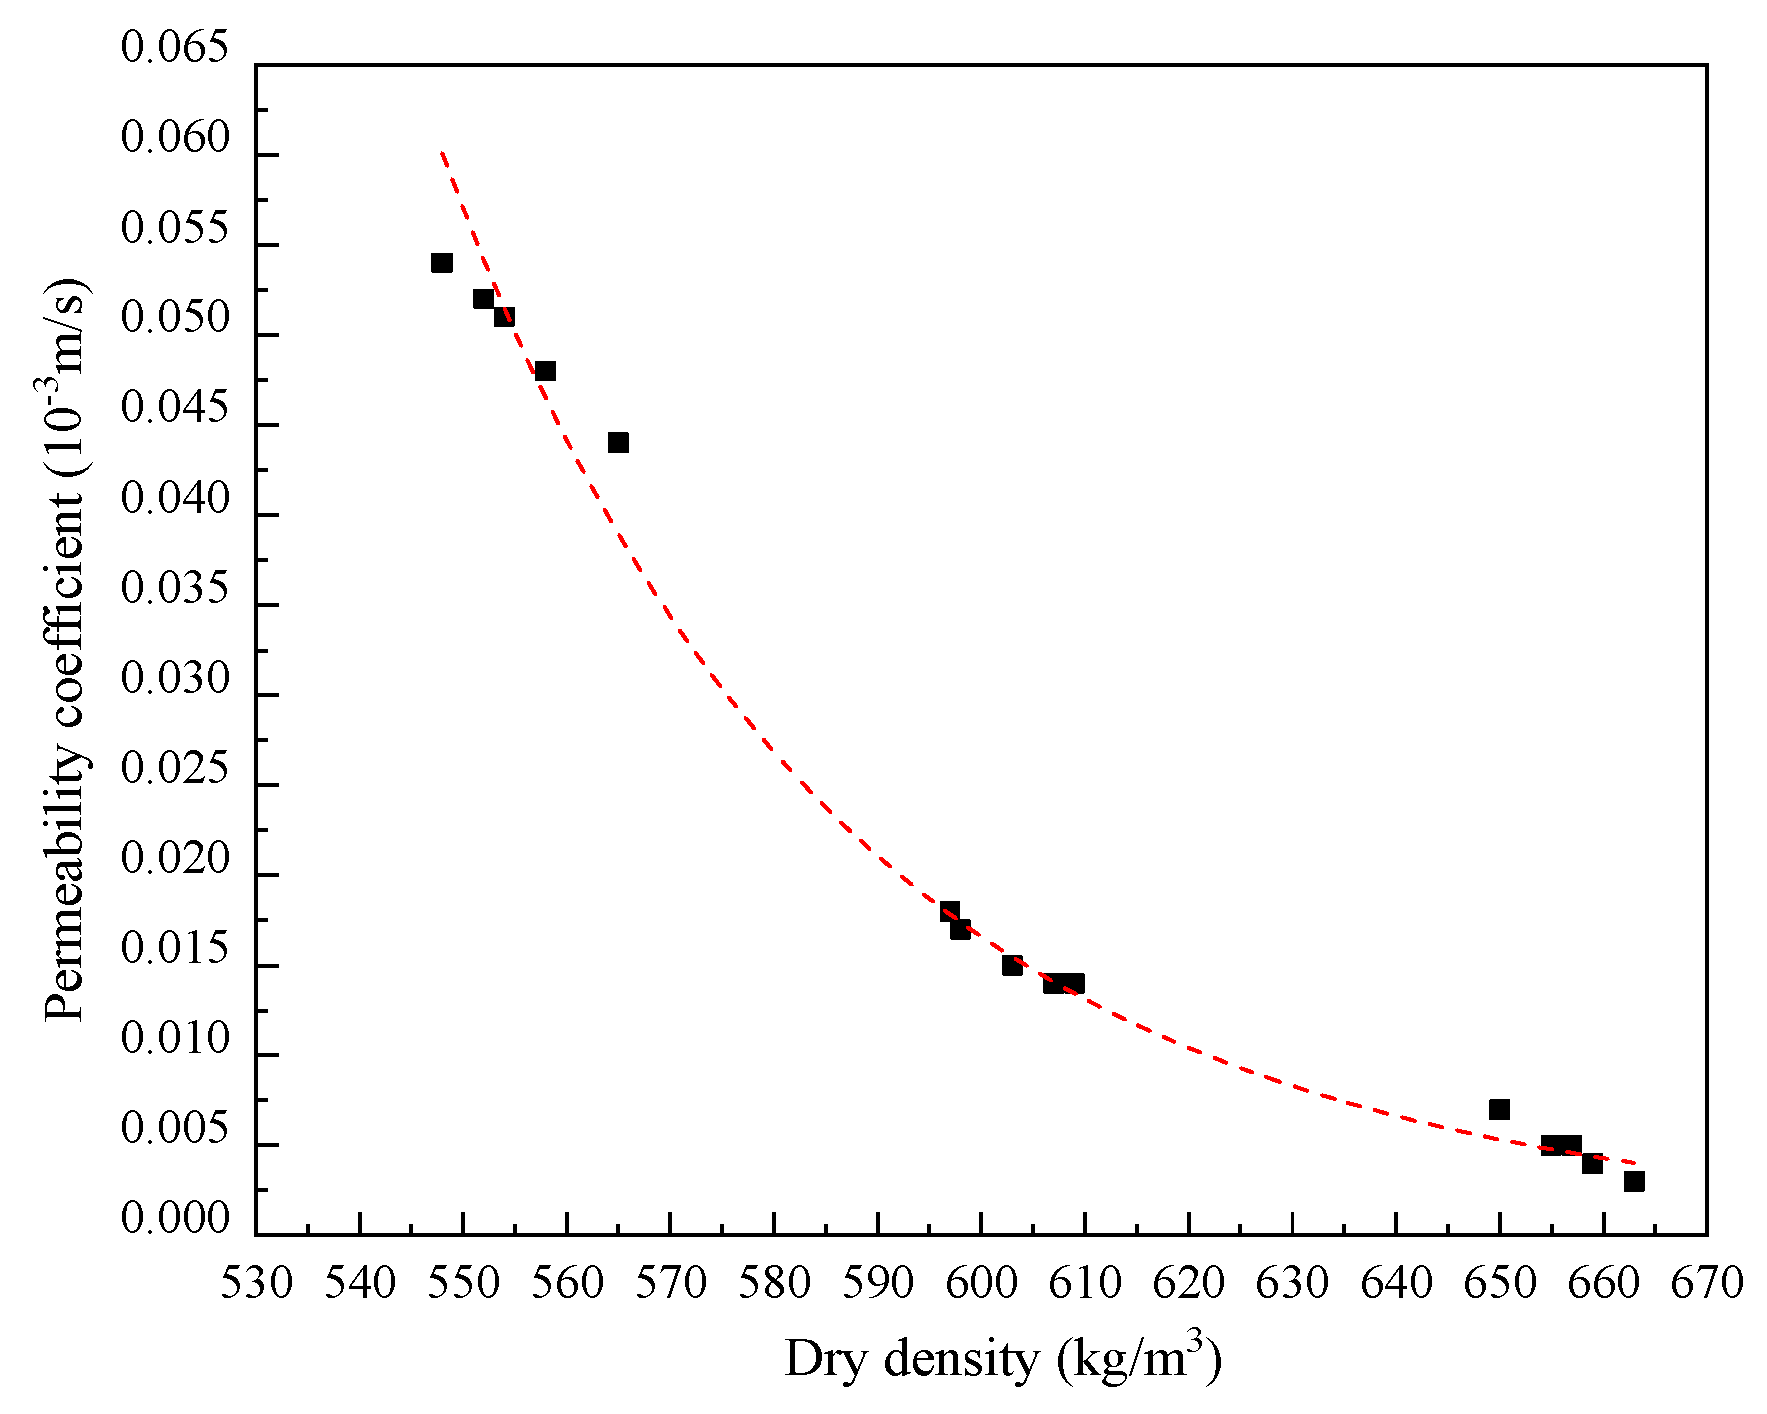
2.4. Permeability Test
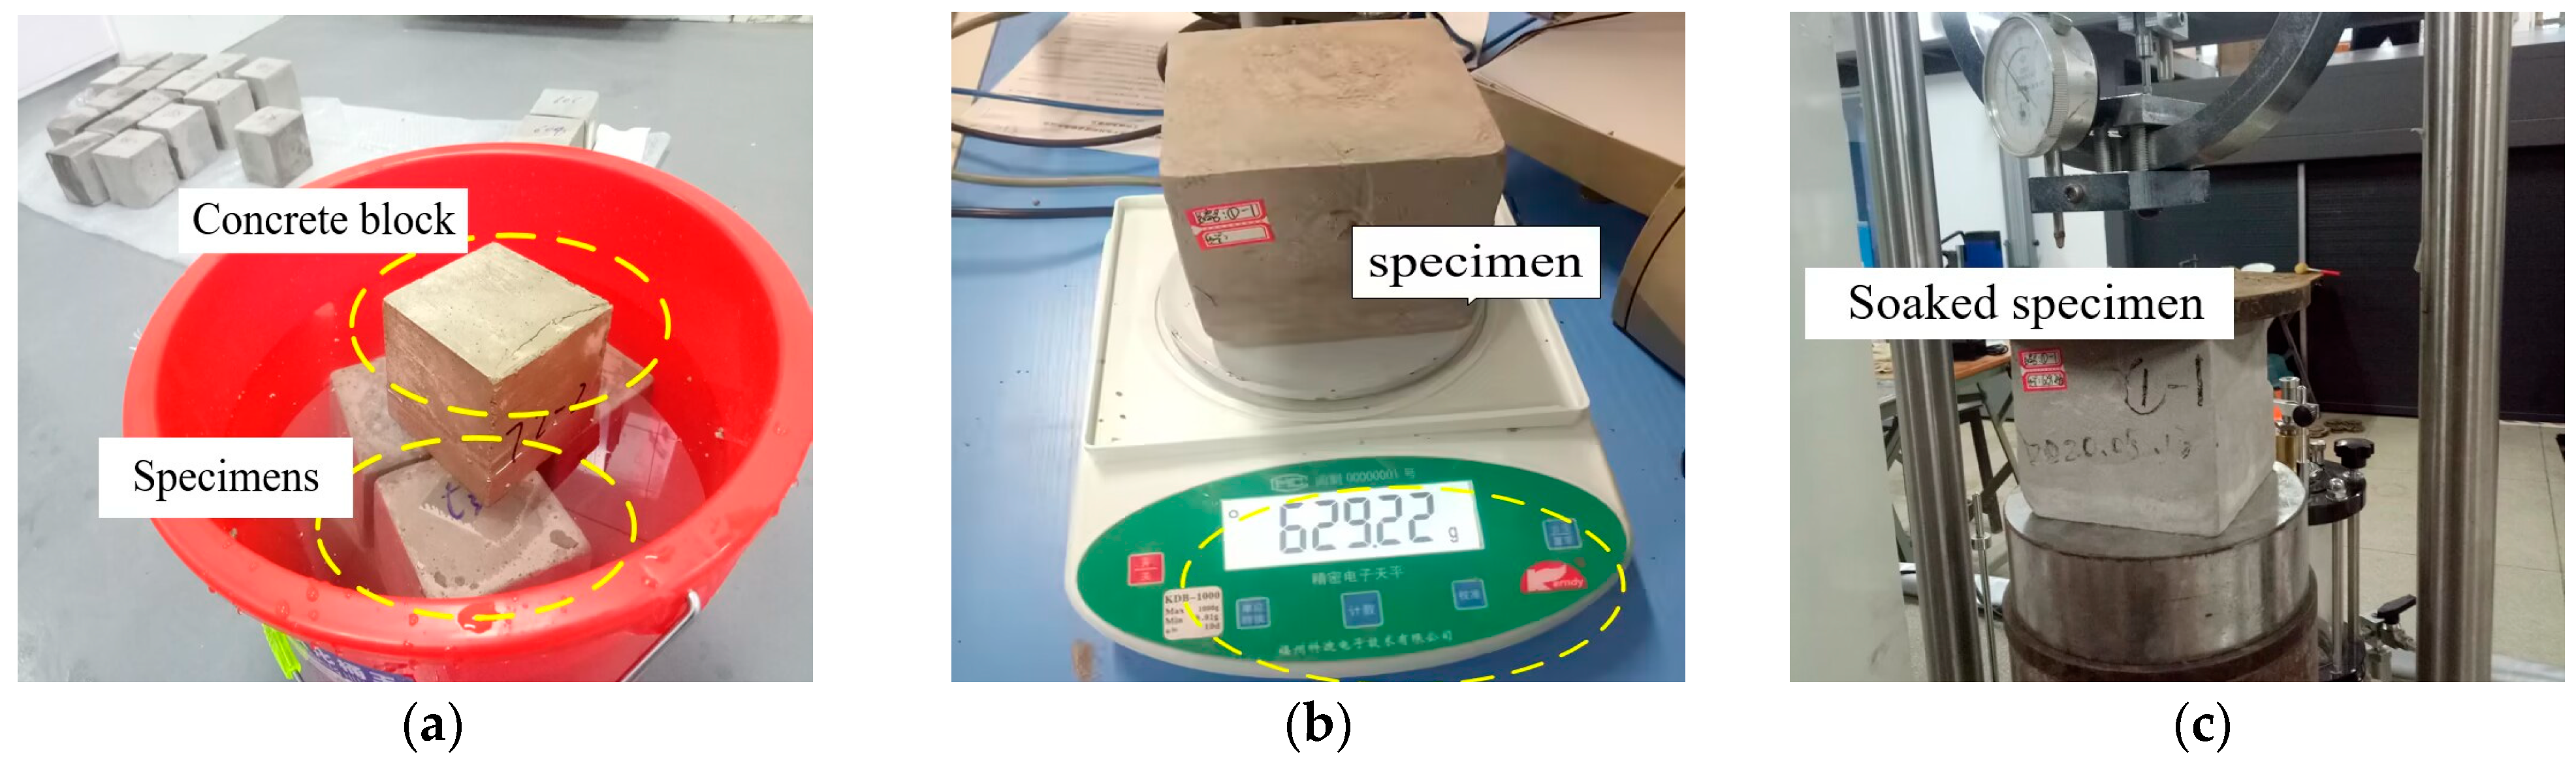
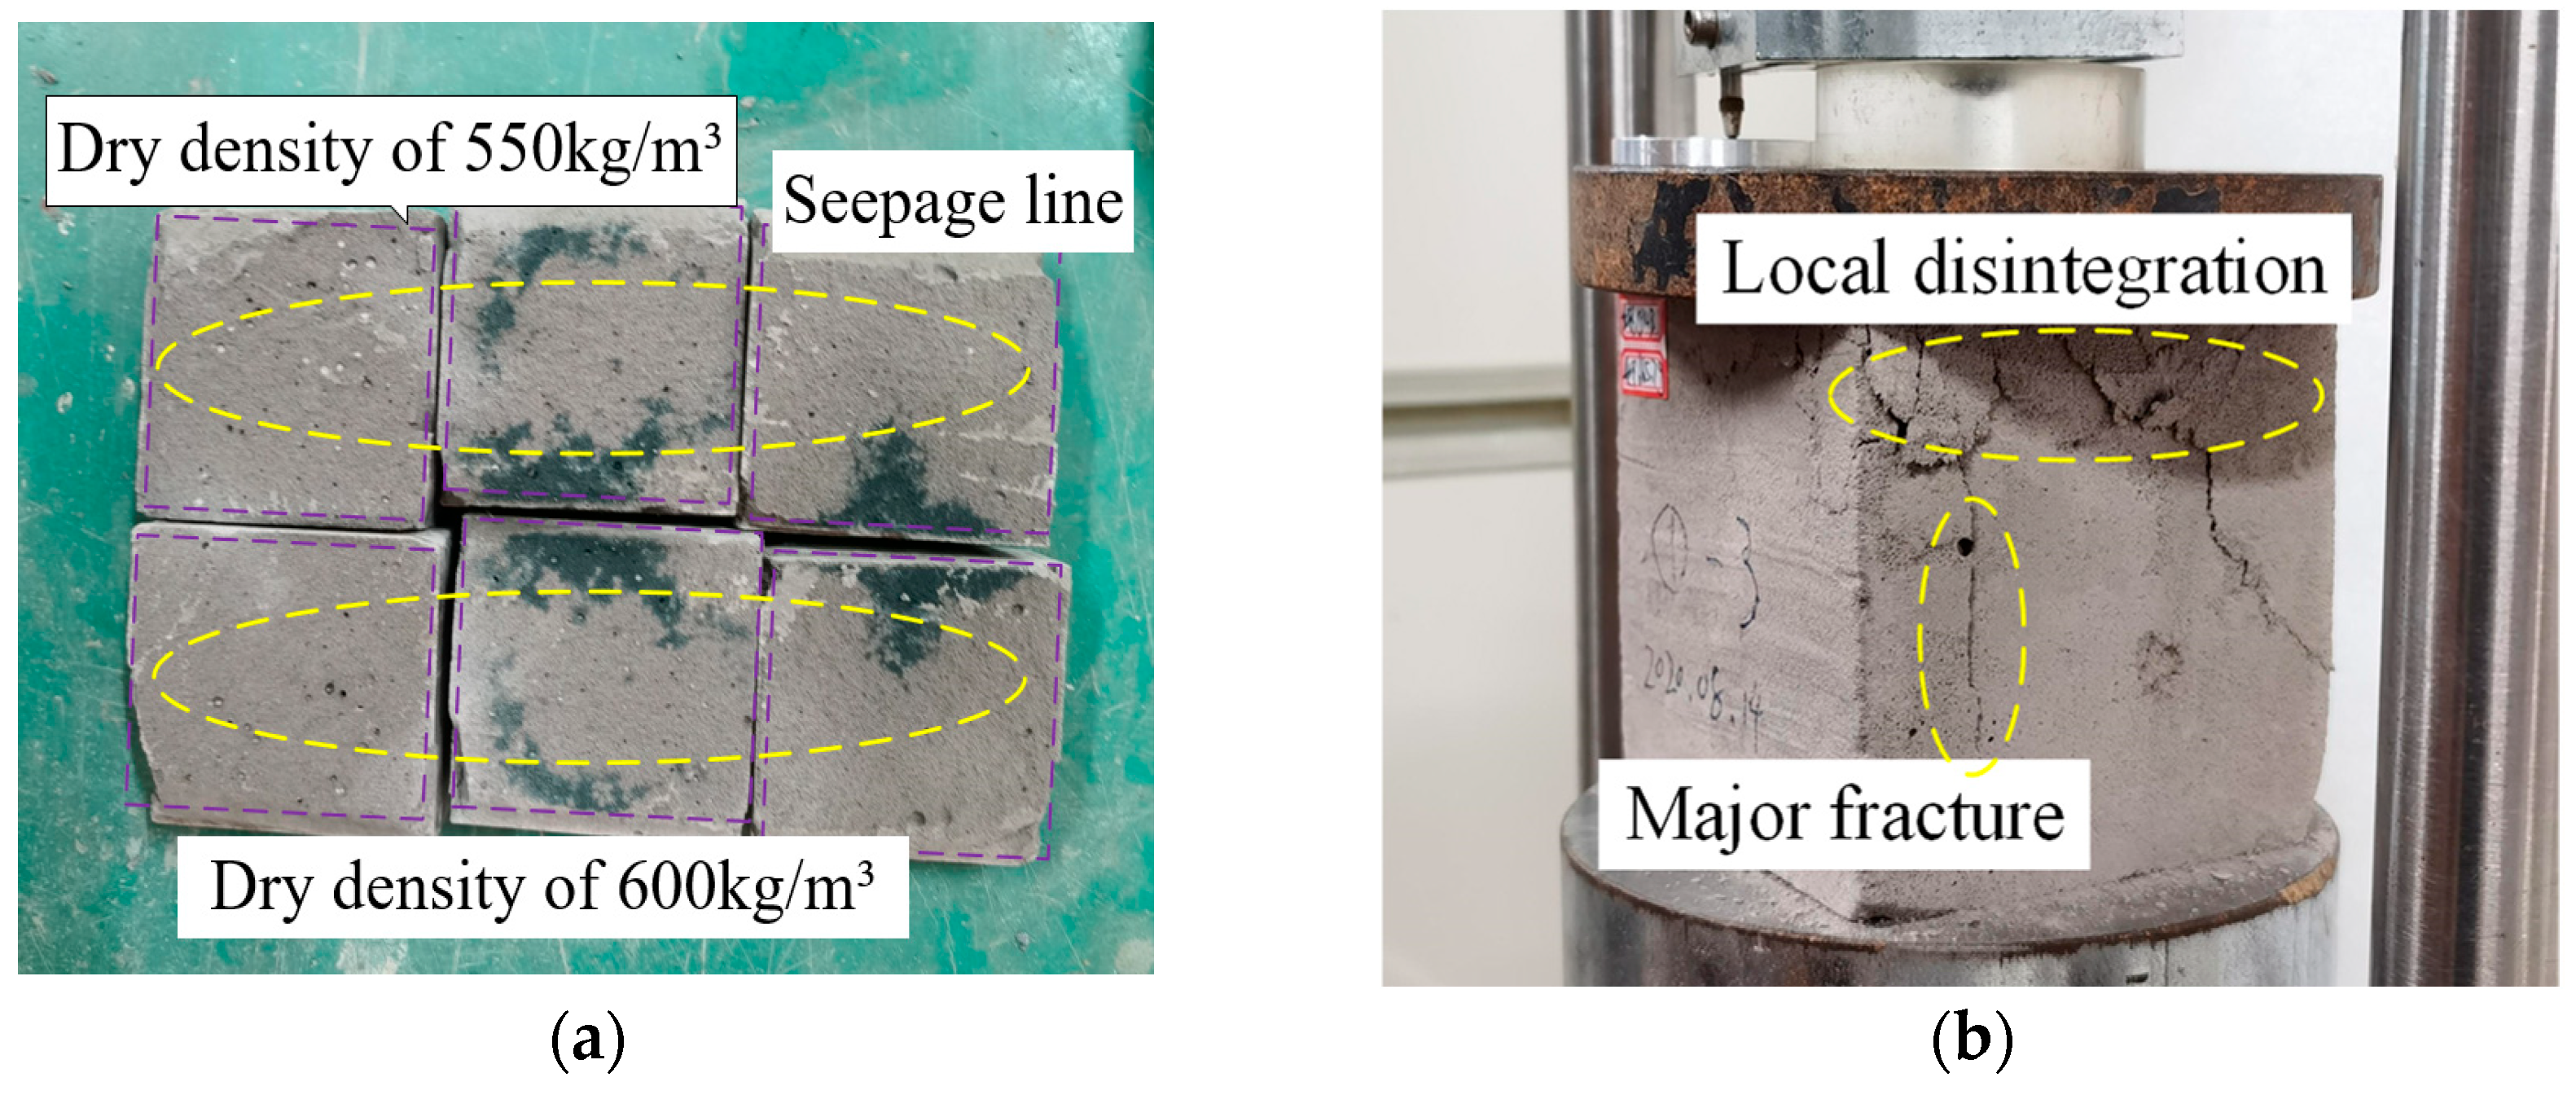
2.5. Water Immersion Test
2.6. Analysis of Testing Results
2.6.1. Compressive Strength and Tensile Strength of LWFC without the Effect of Water
2.6.2. Permeability Coefficient of LWFC
2.6.3. Compressive Strength of LWFC with the Effect of Water
3. Field Test
3.1. Widened Embankments
3.2. Site Conditions
3.3. Monitoring Variables in Field Test
4. Numerical Modeling
4.1. Model Mesh and Boundary Condition
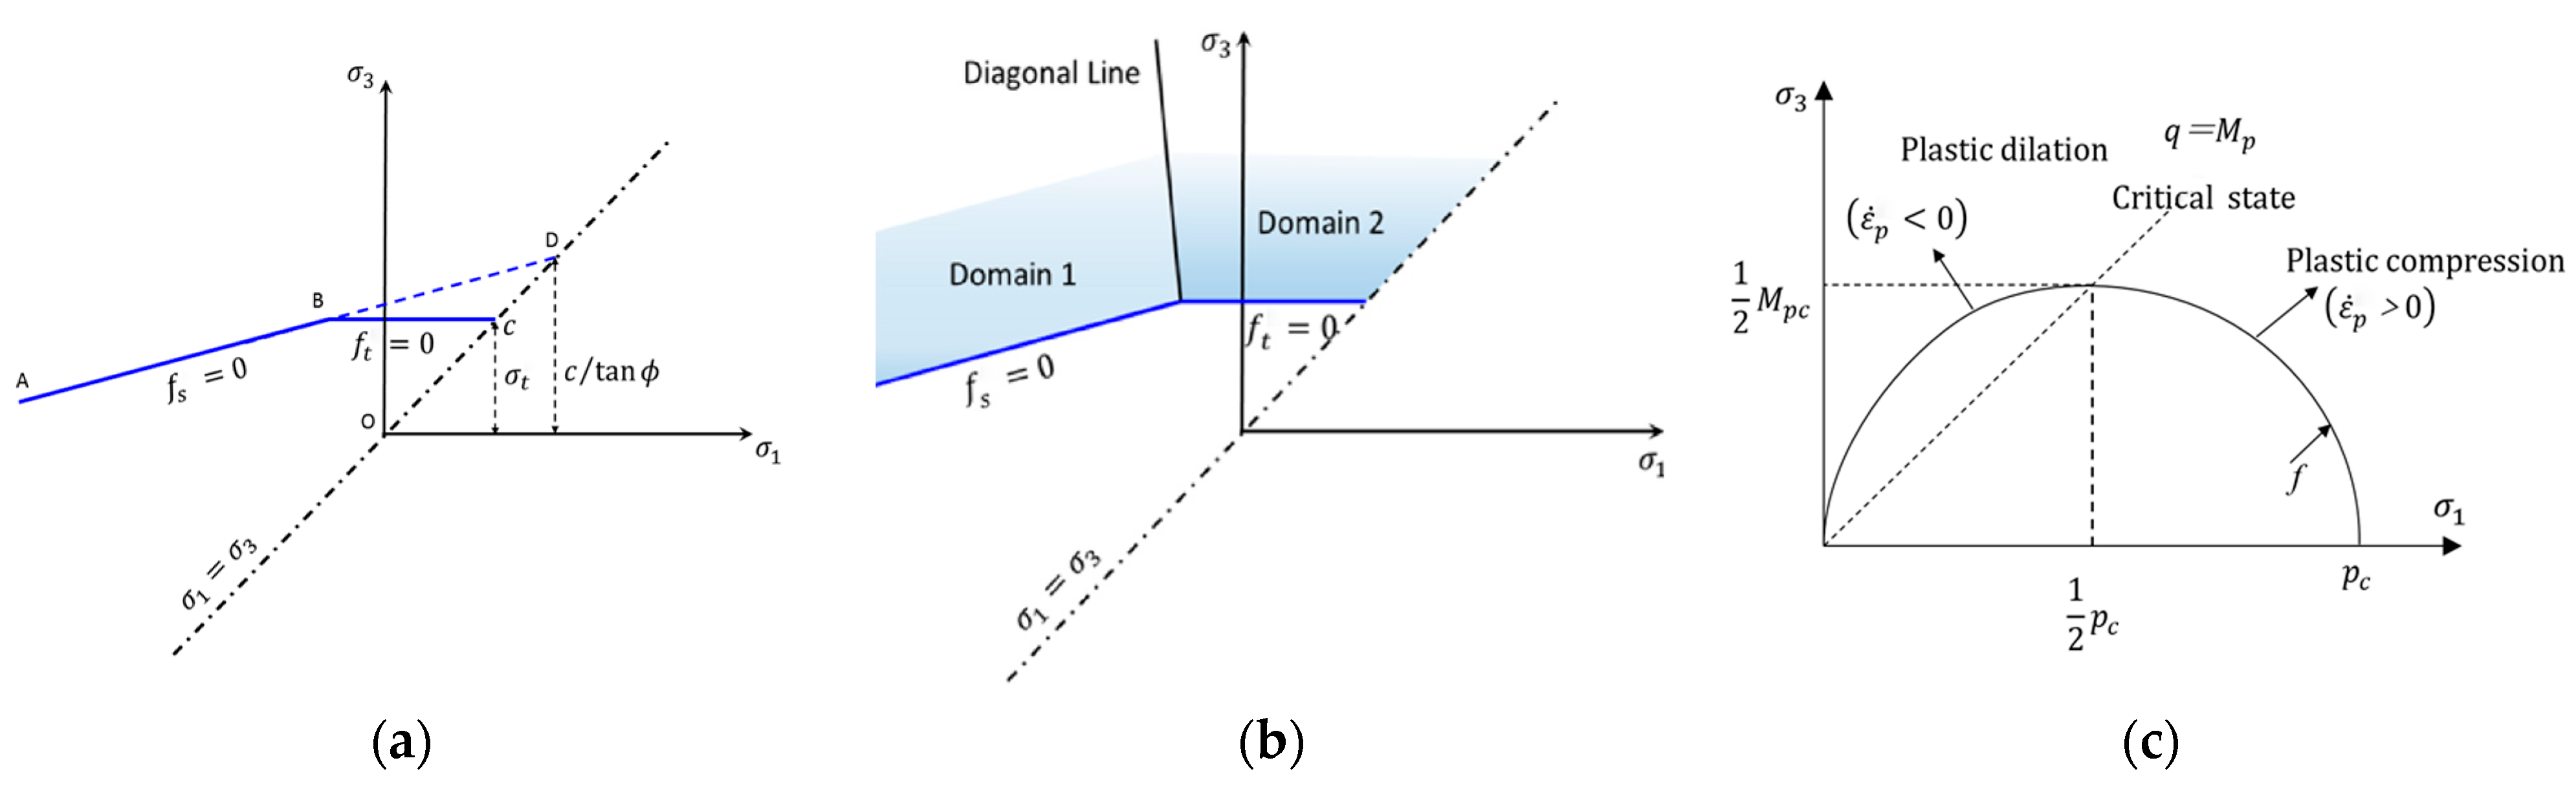
4.2. Constitutive Relationships and Properties of the Material
5. Numerical Results versus Field Measurements
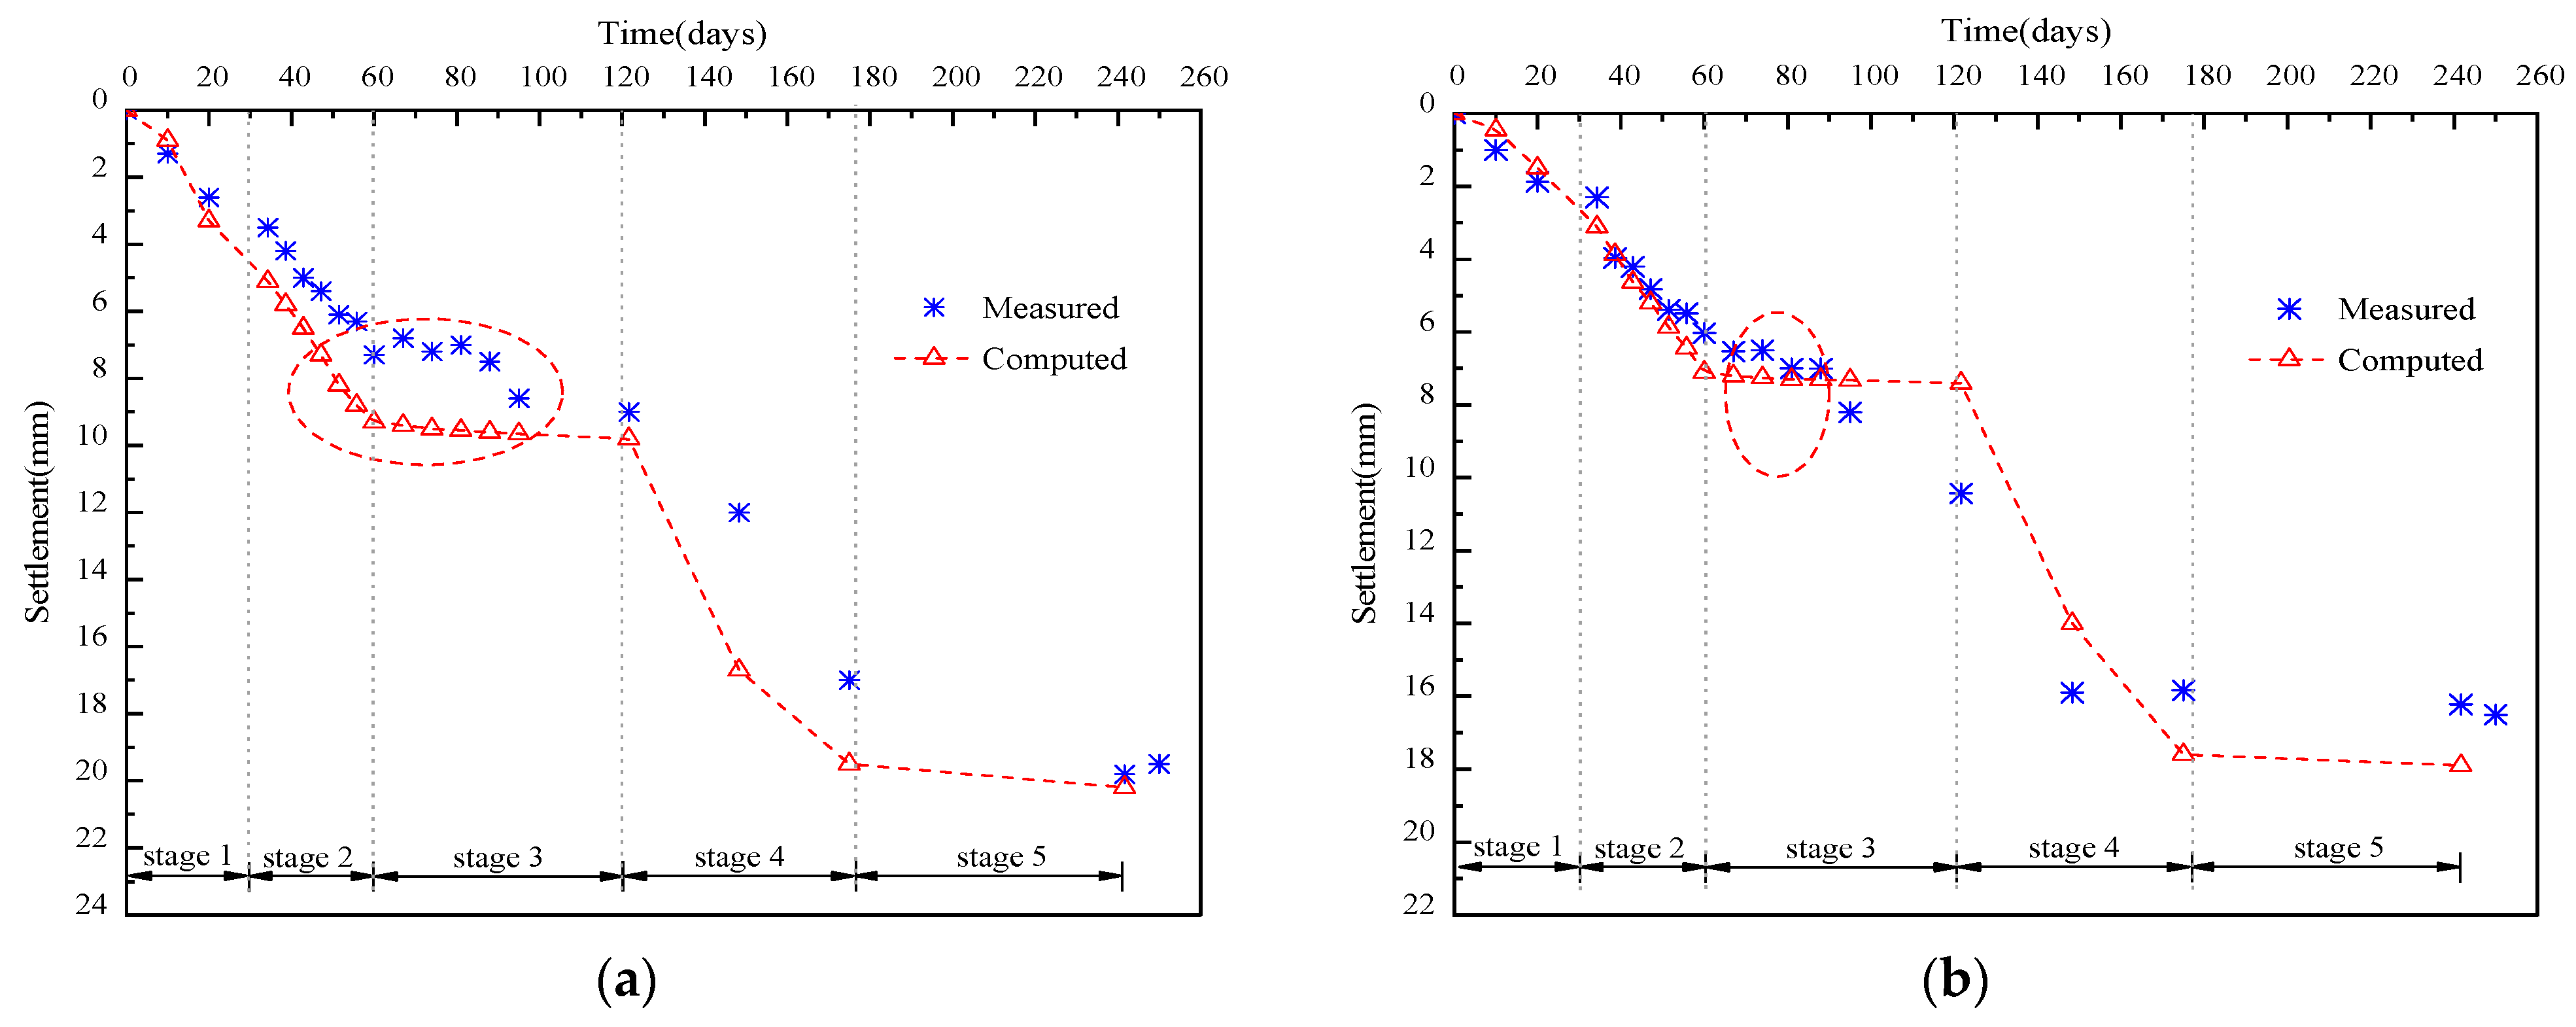
5.1. Settlement
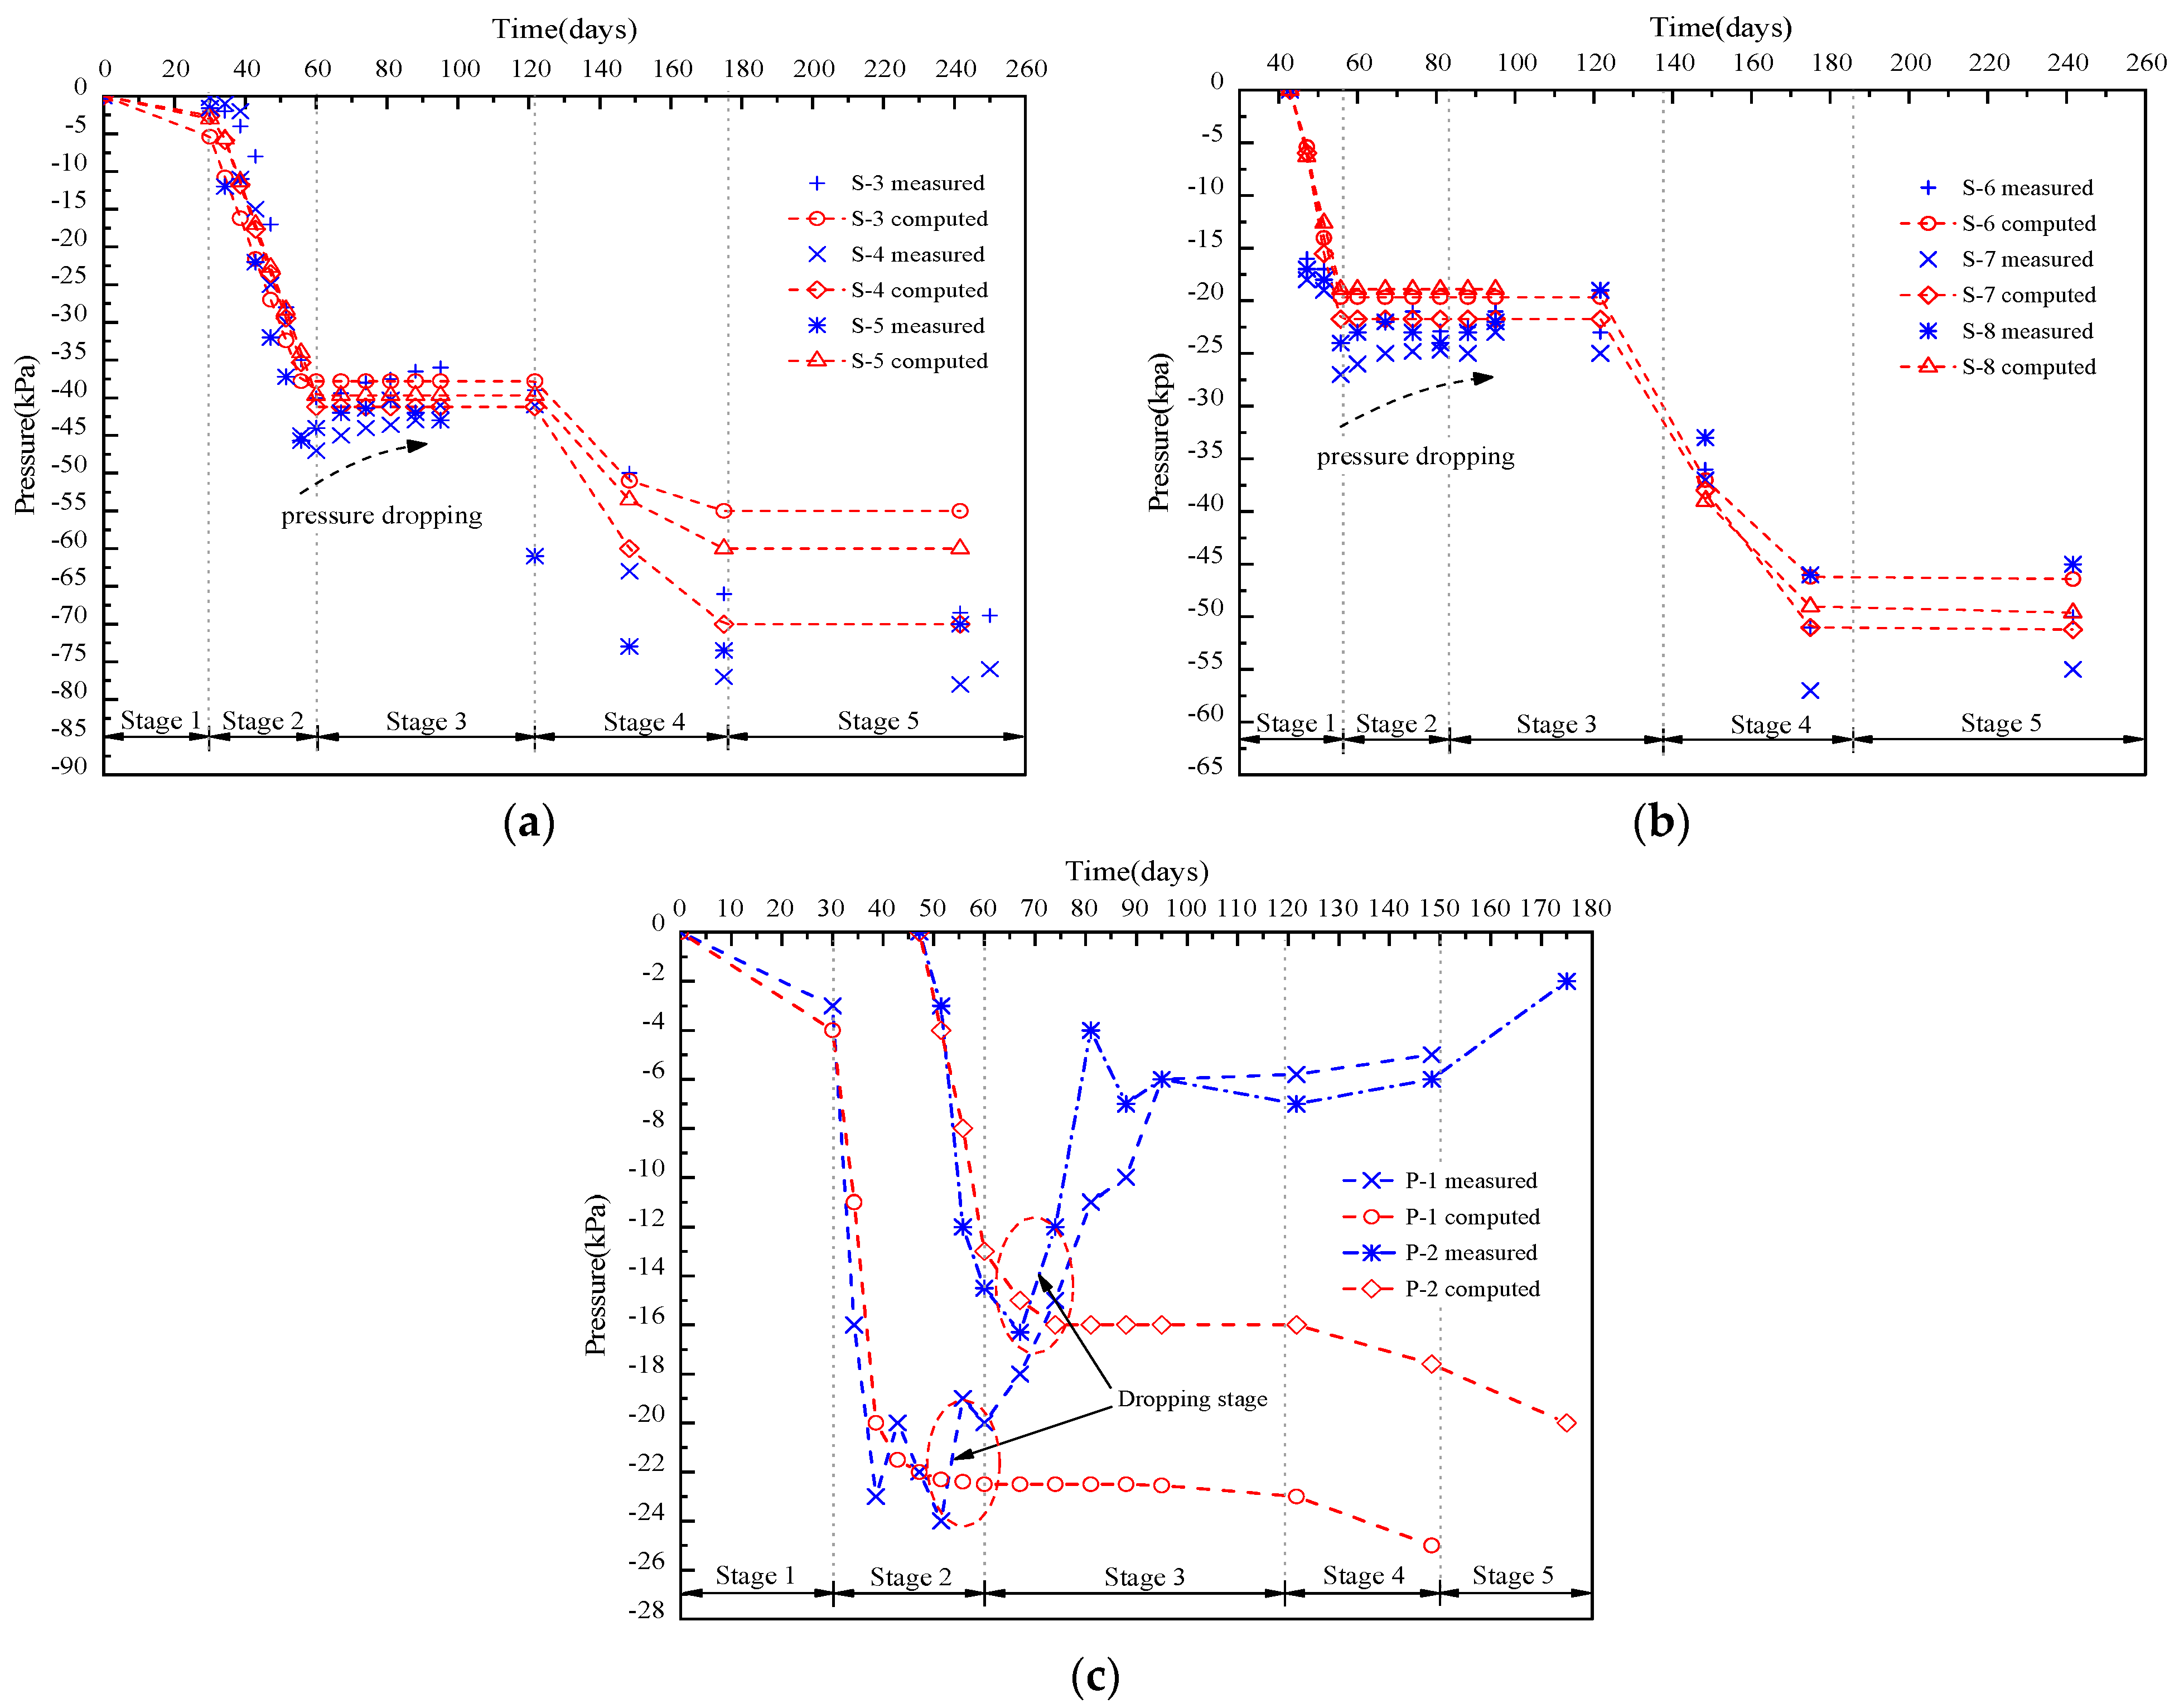
5.2. Pressure
6. Parametric Study
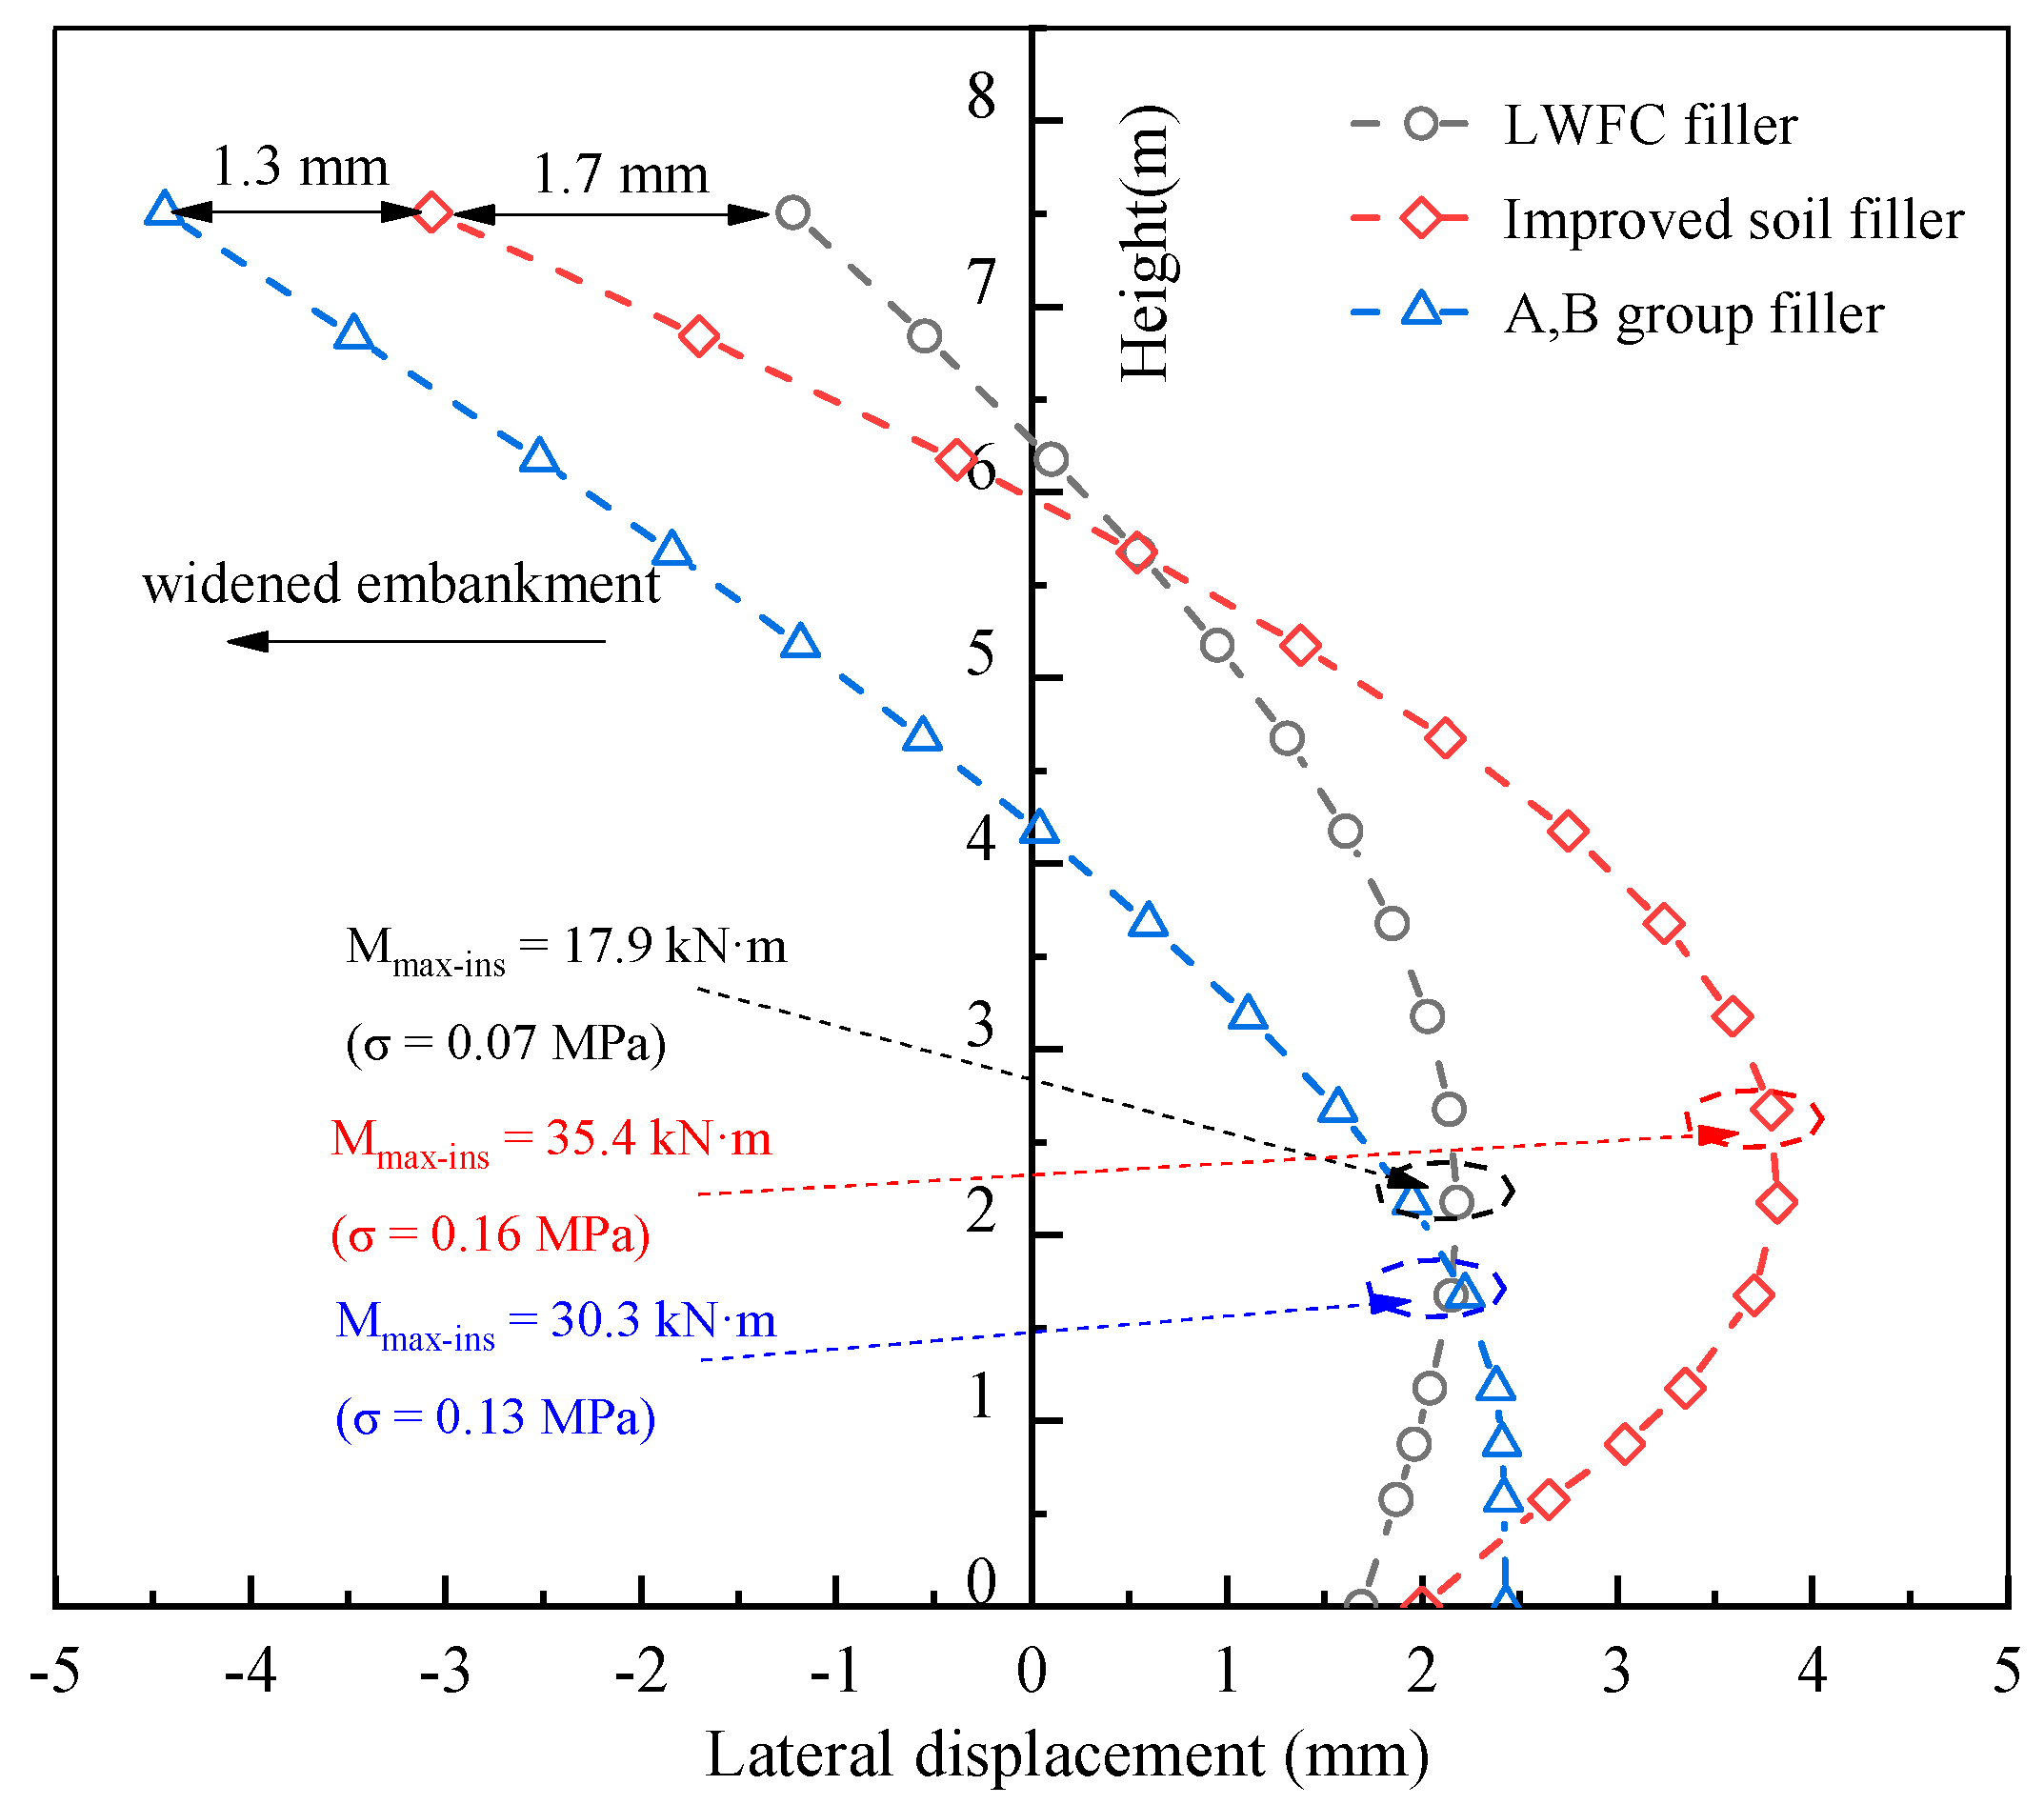
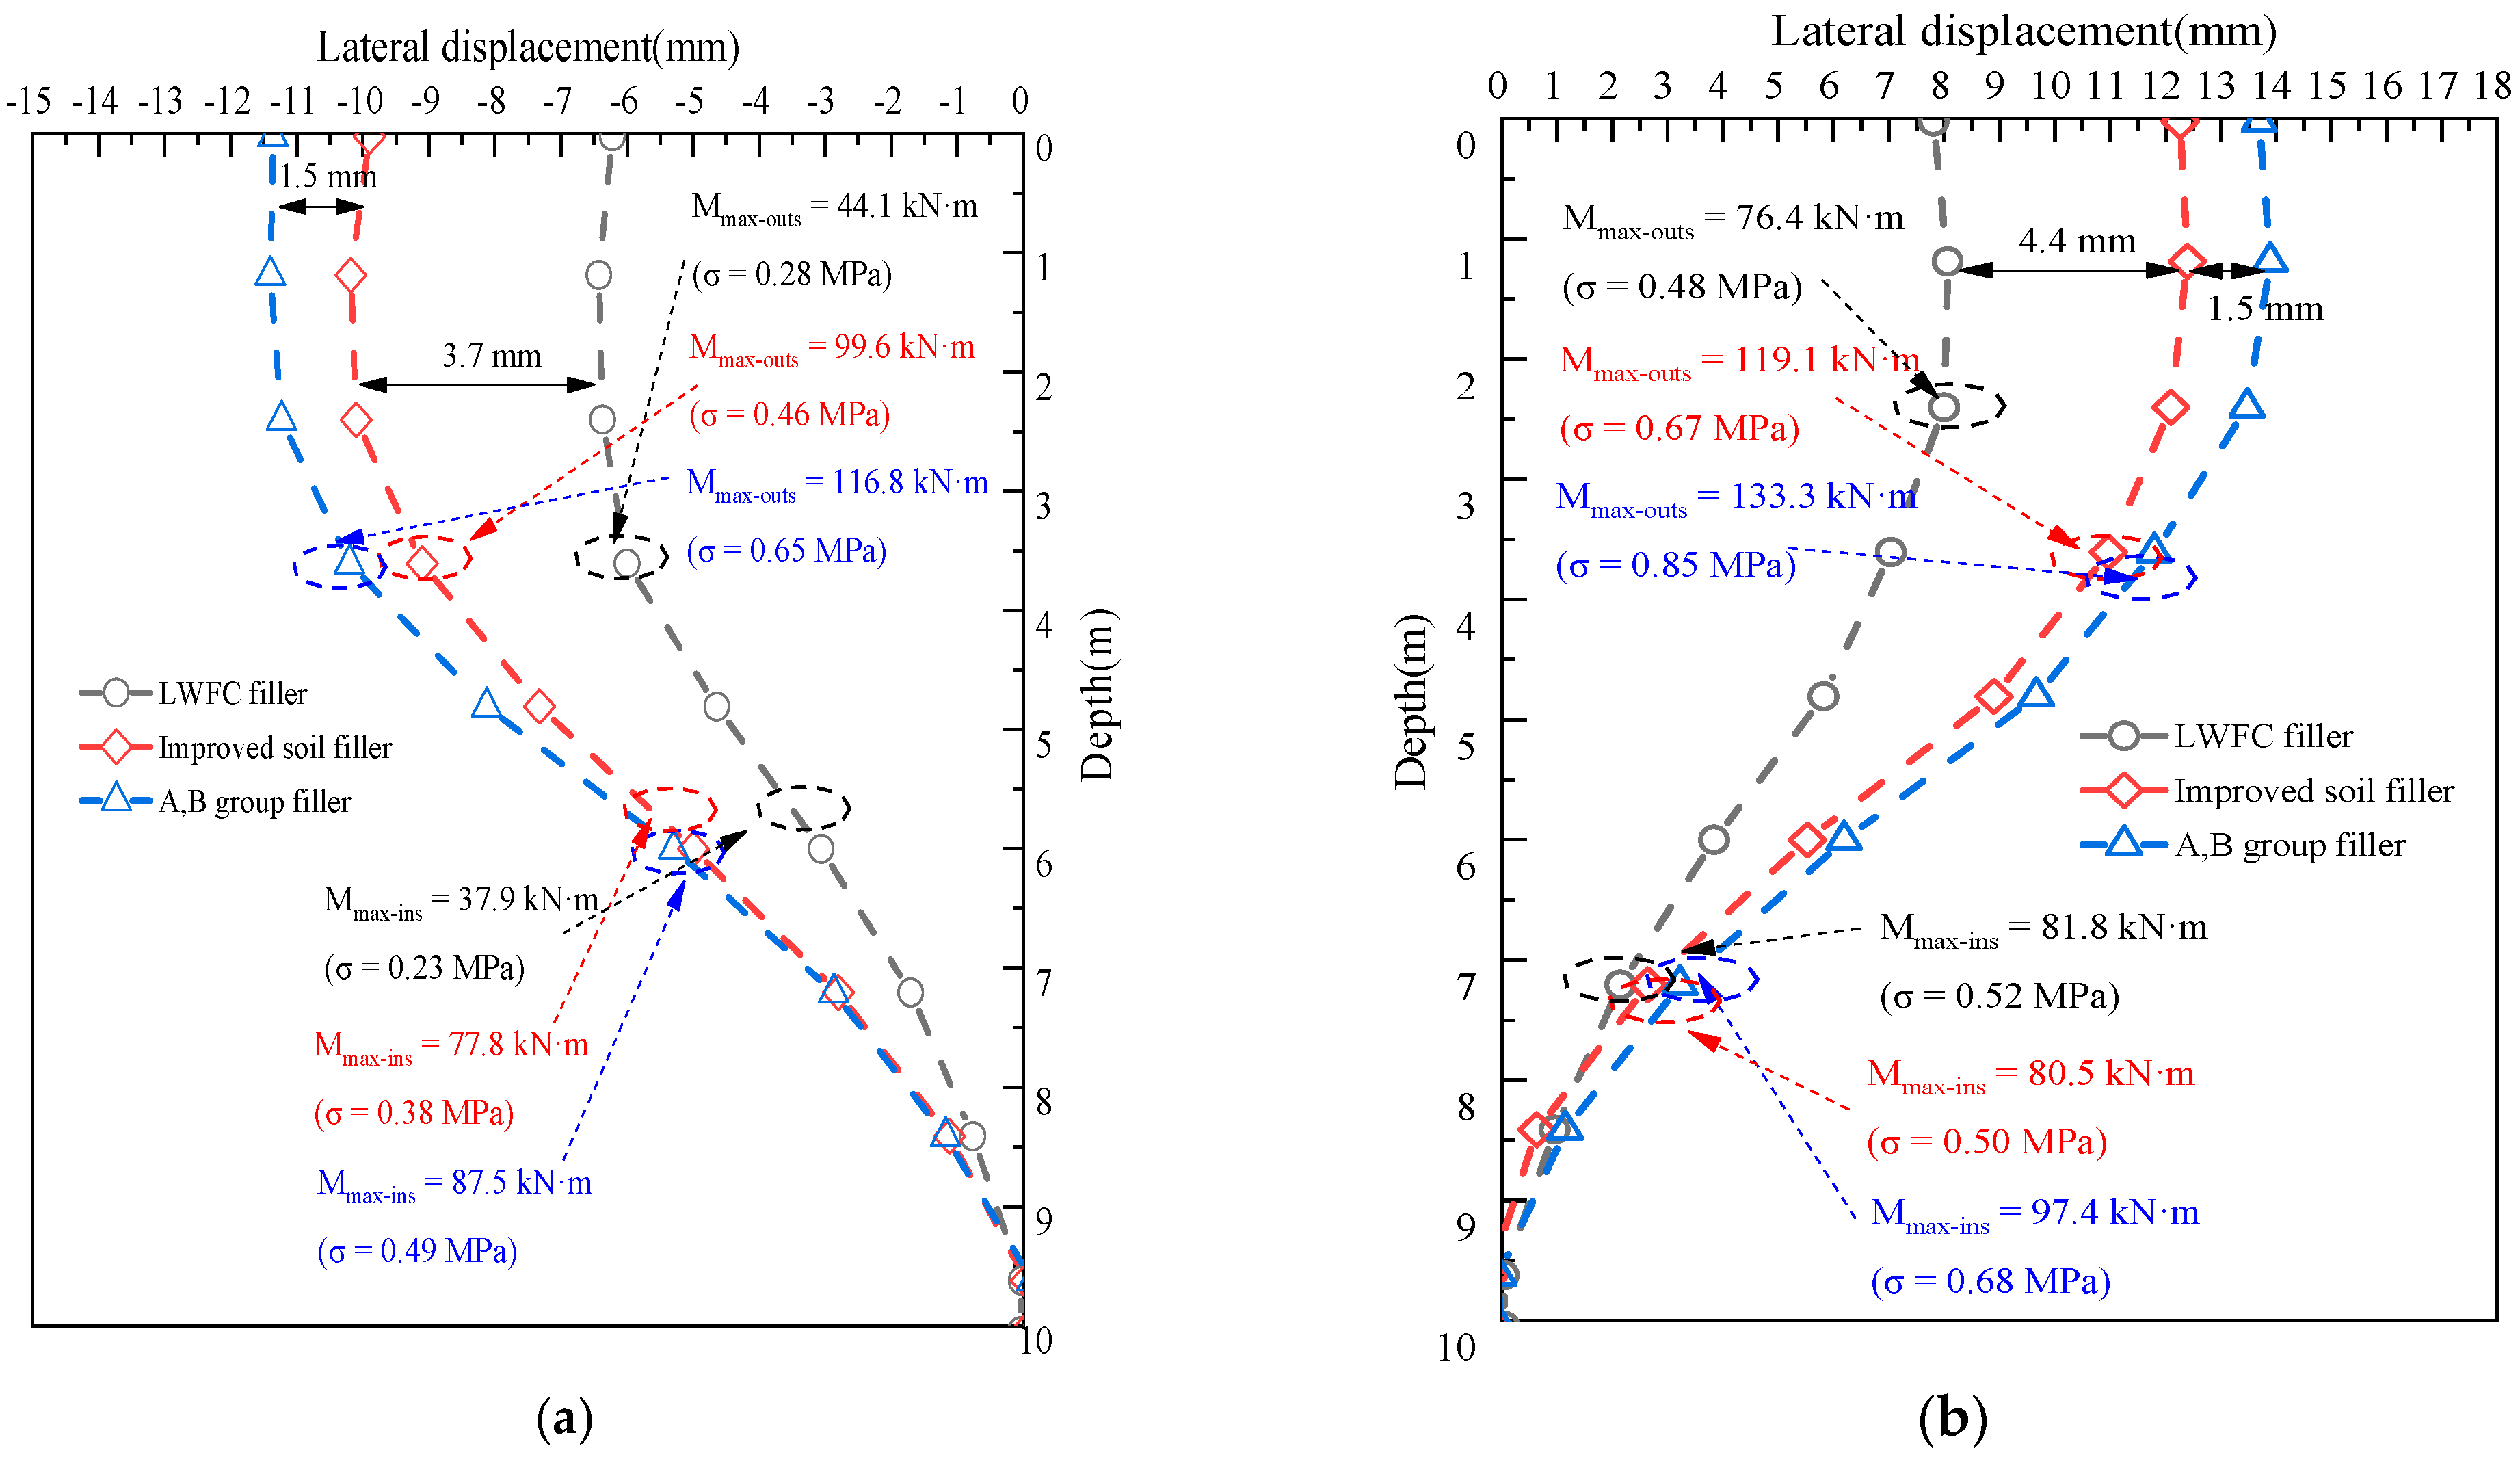
6.1. Influence of Filler Type
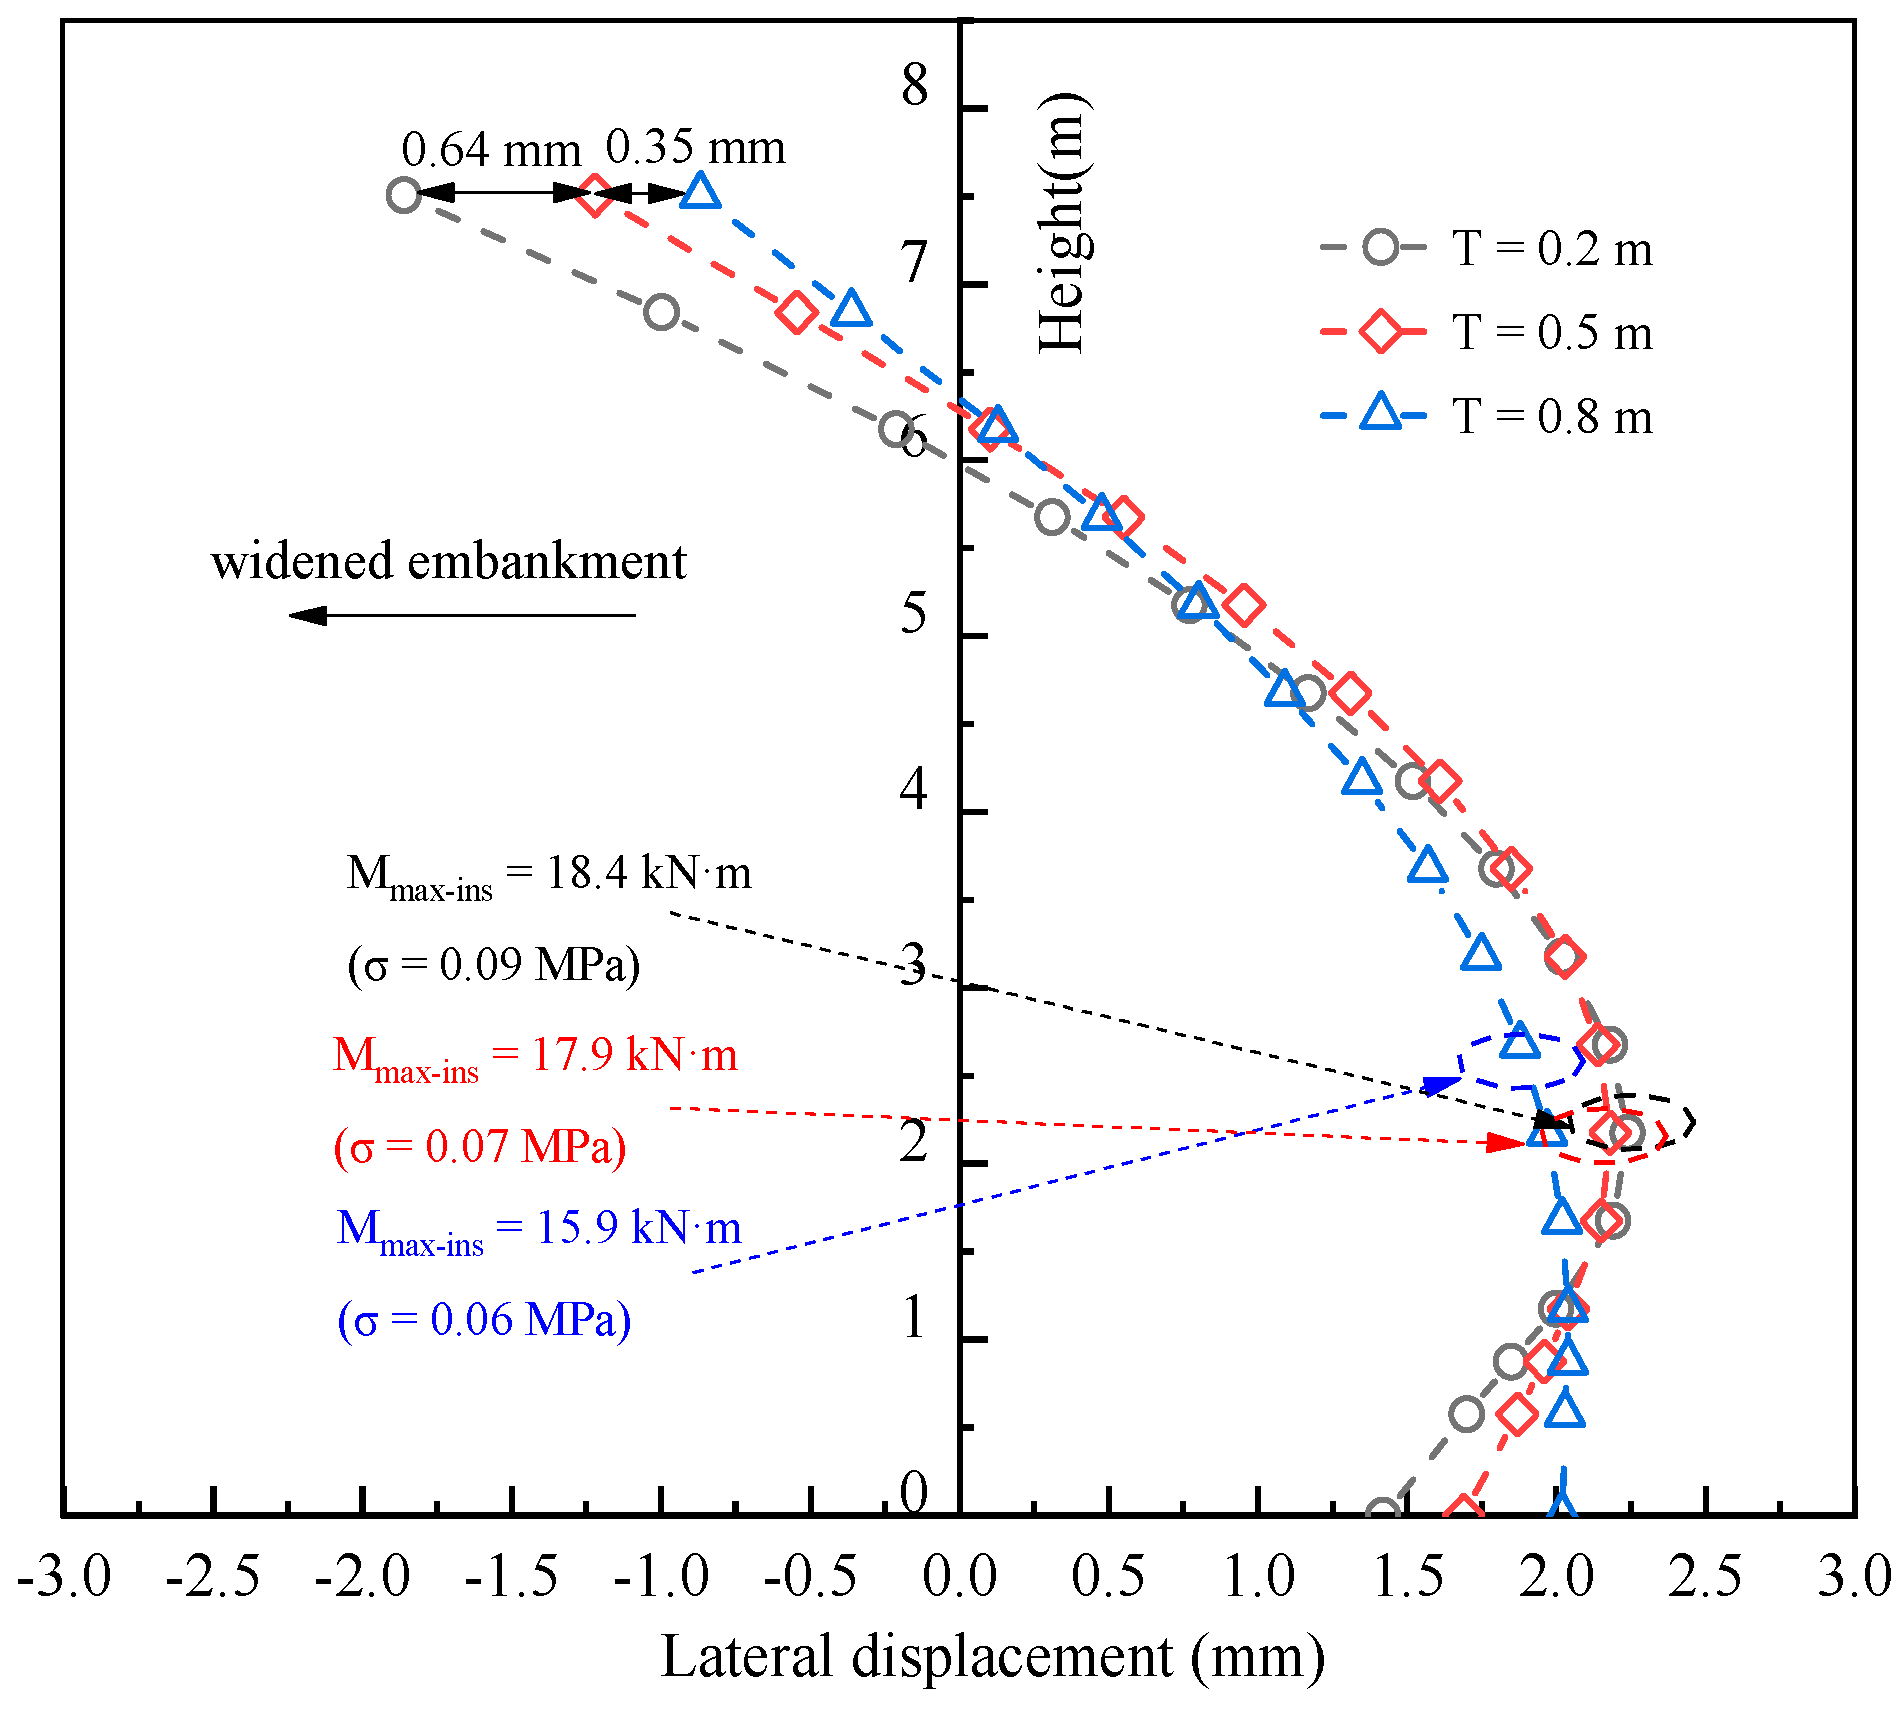
6.2. Influence of Retaining Wall Thickness
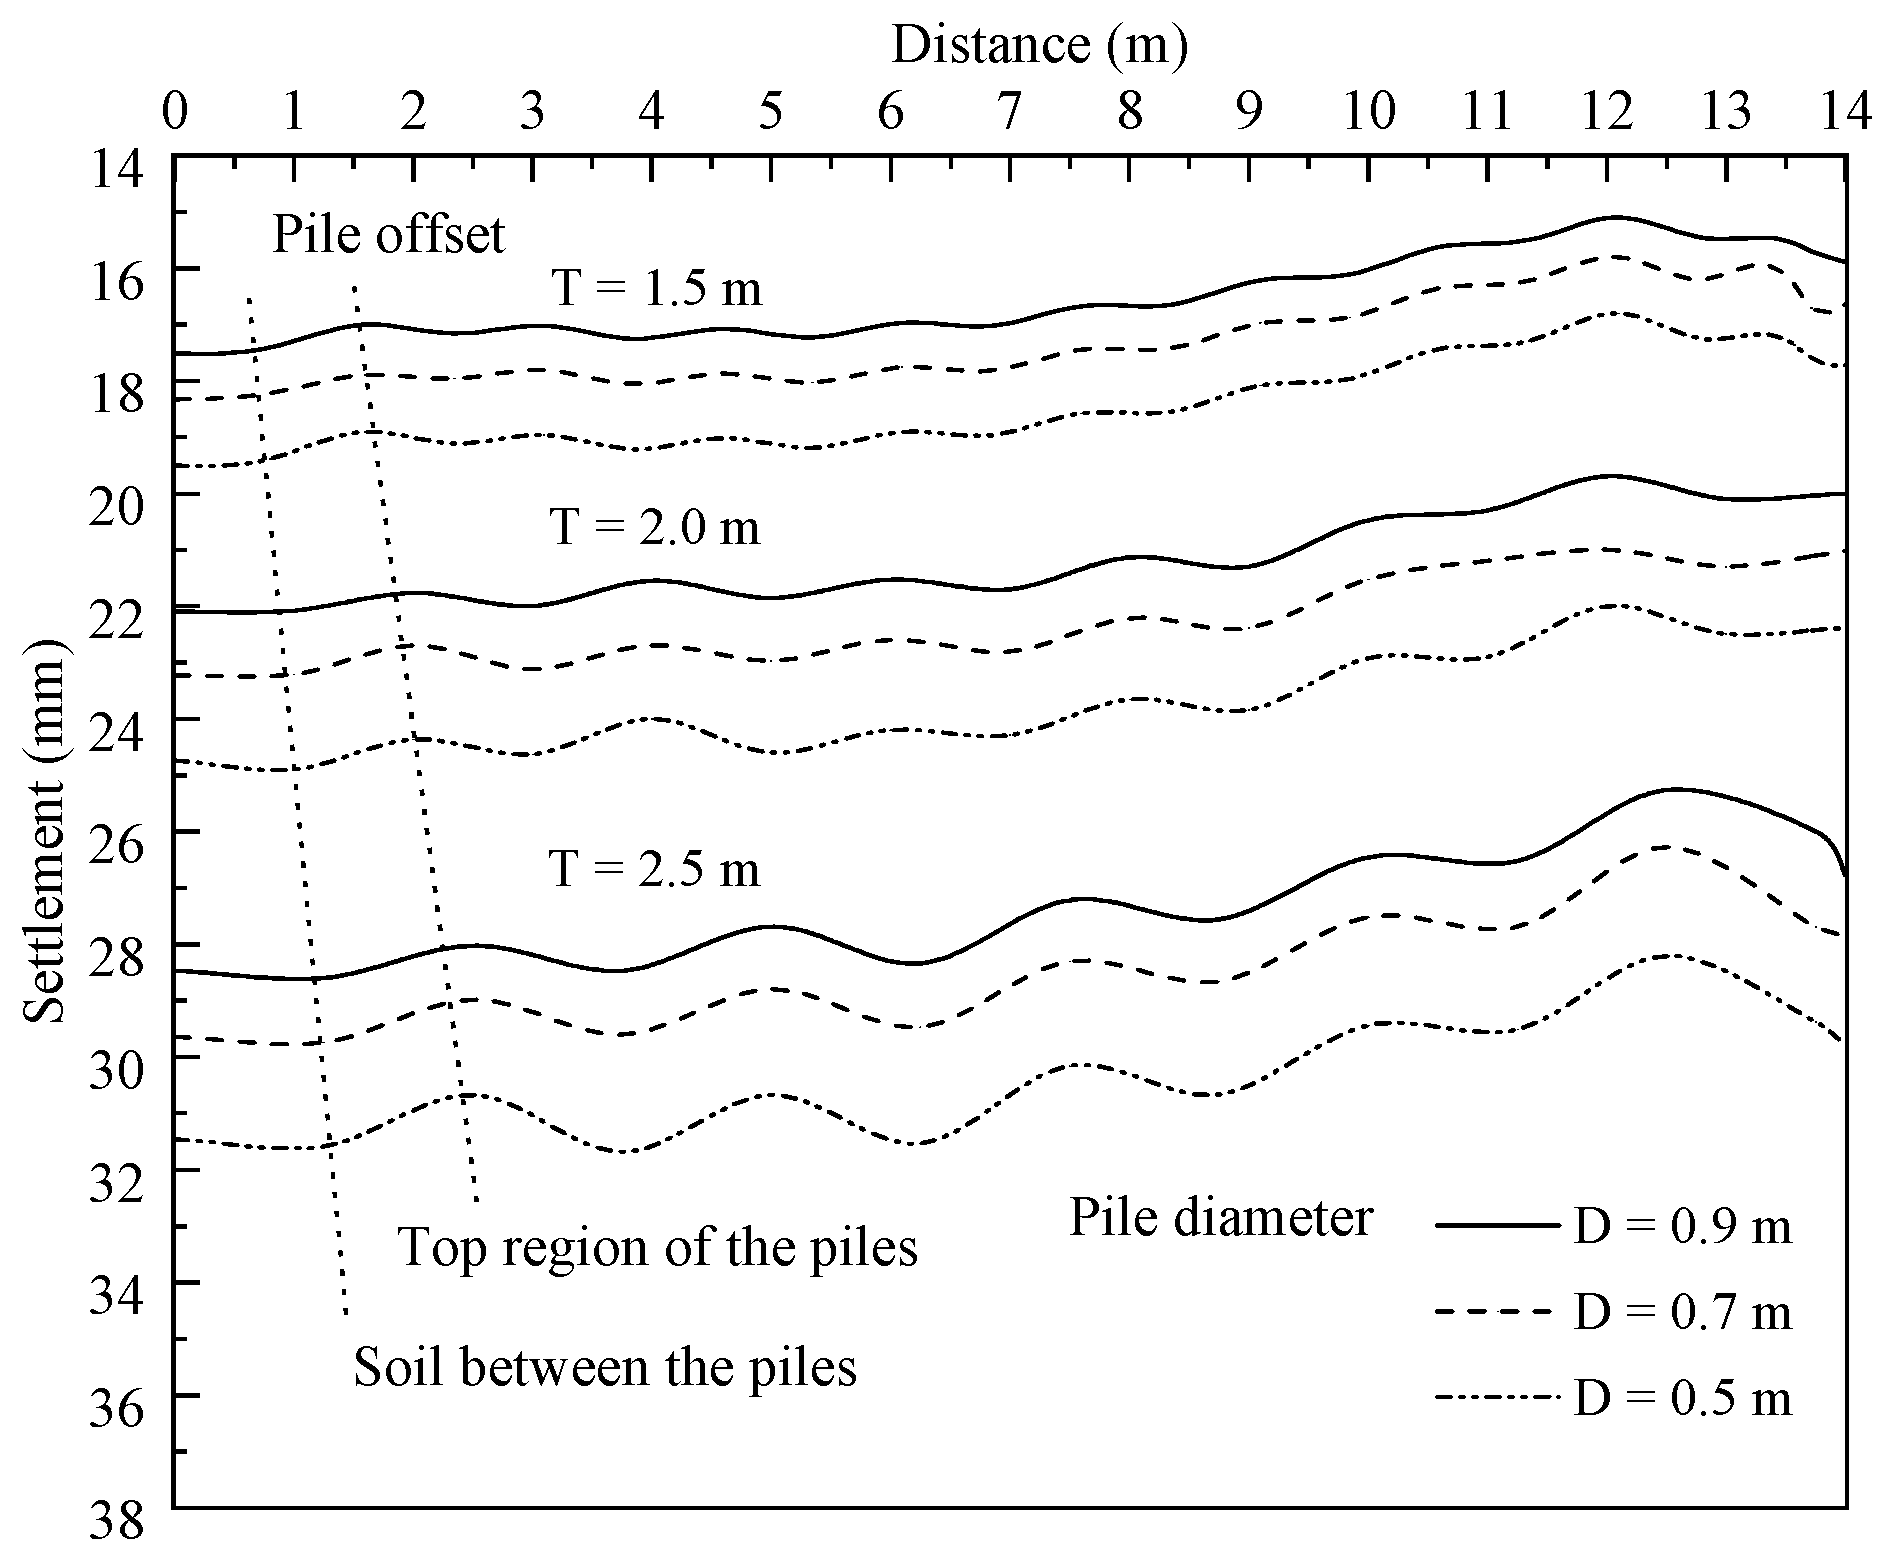
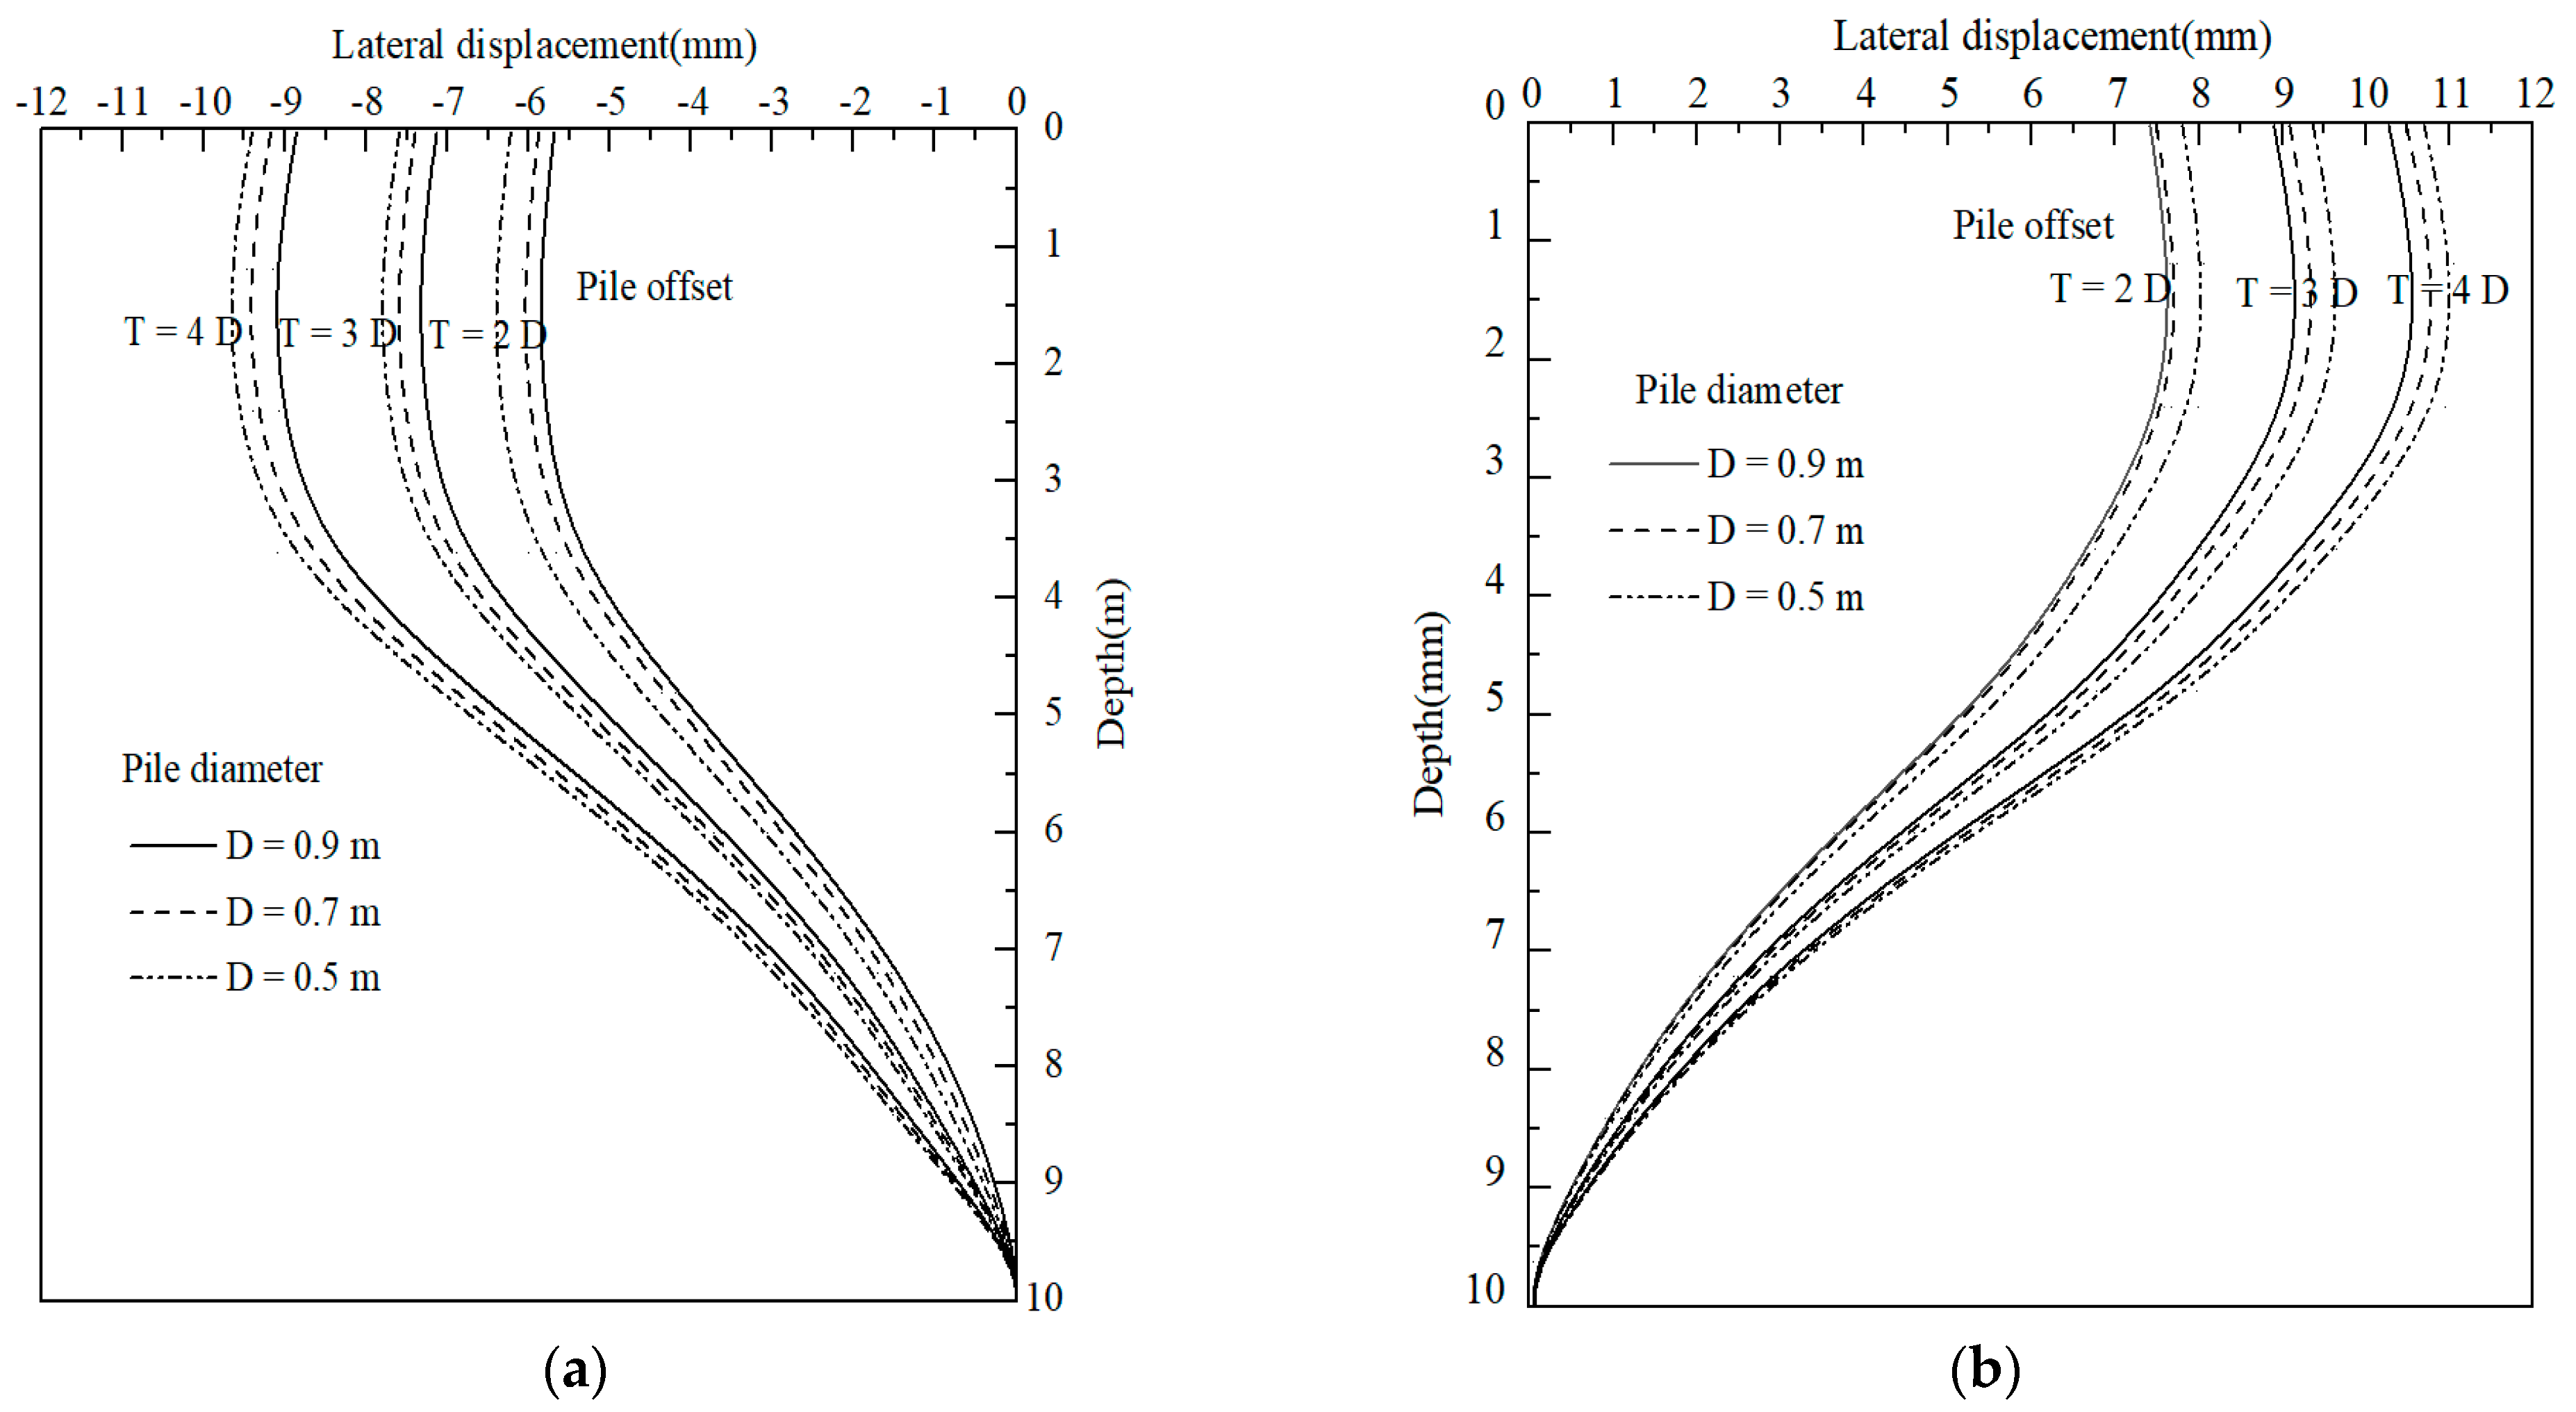
6.3. Influence of Diameter and Offset of Piles
7. Conclusions
8. Recommendations
Author Contributions
Funding
Institutional Review Board Statement
Informed Consent Statement
Data Availability Statement
Conflicts of Interest
References
- Deschamps, R.; Hynes, C. Embankment Widening Design Guidelines and Construction Procedures; Purdue University: West Lafayette, IN, USA, 1999; FHWA/IN/JTRP-99/4. [Google Scholar]
- Ling, J.; Qian, J.; Huang, Q. New Technologies of Subgrade Widening for Highways; Tongji University: Shanghai, China; Changsha Science and Technology University: Changsha, China, 2003. [Google Scholar]
- Lu, W.; Miao, L.; Wang, F.; Zhang, J.; Zhang, Y.; Wang, H. A case study on geogrid-reinforced and pile-supported widened highway embankment. Geosynth. Int. 2020, 27, 261–274. [Google Scholar] [CrossRef]
- Ding, S.; Luo, Z.; Zhang, Y. Method for Realizing Road Construction for Road Widening Building Continuous Traffic Foam Lifting Widening Embankment, Involves Constructing Fixed Cantilever Slab, Constructing Guardrail, and Widening Roadbed on Other Side; Hubei Road & Bridge Group Co Ltd.: Wuhan, China, 2024. [Google Scholar]
- Han, J.; Huang, J.; Porbaha, A. 2D numerical modeling of a constructed geosynthetic-reinforced embankment over deep mixed columns. In Proceedings of the Geo-Frontiers 2005, Austin, TX, USA, 24–26 January 2005; American Society of Civil Engineers: Reston, VG, USA, 2005; pp. 1–11. [Google Scholar]
- Han, J.; Oztoprak, S.; Parsons, R.L.; Huang, J. Numerical analysis of foundation columns to support widening of embankments. Comput. Geotech. 2007, 34, 435–448. [Google Scholar] [CrossRef]
- Tang, C.S.; Liu, Y.H.; Shi, B.; Cai, Y.; Zhu, Y.Q. Numerical simulation on differential settlement of jointing of new and old roadbed. China J. Highw. Transp. 2007, 20, 13–17. [Google Scholar] [CrossRef]
- Allersma, H.G.B.; Ravenswaay, L.; Vos, E. Investigation of road widening on soft soils using a small centrifuge. Transp. Res. Rec. 1994, 1462, 47–53. [Google Scholar]
- Jones, R.; Zheng, L.; Yerramala, A.; Rao, K.S. Use of recycled and secondary aggregates in foamed concretes. Mag. Concr. Res. 2012, 64, 511–525. [Google Scholar] [CrossRef]
- Benato, A.; Gaida, E.; Oggeri, C.; Oreste, P. Analysis of the Importance of the Filling Material Characteristics Injected Around the Precast Concrete Lining in the Microtunnelling Technology. Geotech. Geol. Eng. 2023, 41, 2775–2785. [Google Scholar] [CrossRef]
- Han, J.; Gabr, M.A. Numerical analysis of geosynthetic-reinforced and pile-supported earth platforms over soft soil. J. Geotech. Geoenviron. Eng. 2002, 128, 44–53. [Google Scholar] [CrossRef]
- Miao, L.; Wang, F.; Han, J.; Lv, W. Benefits of geosynthetic reinforcement in widening of embankments subjected to foundation differential settlement. Geosynth. Int. 2014, 21, 321–332. [Google Scholar] [CrossRef]
- Yu, H.; Wang, Y.; Zou, C.; Wang, P.; Yan, C. Study on subgrade settlement characteristics after widening project of highway built on weak foundation. Arab. J. Sci. Eng. 2017, 42, 3723–3732. [Google Scholar] [CrossRef]
- Zhao, M.; Liu, C.; El-Korchi, T.; Song, H.; Tao, M. Performance of geogrid-reinforced and PTC pile-supported embankment in a highway widening project over soft soils. J. Geotech. Geoenviron. Eng. 2019, 145, 06019014. [Google Scholar] [CrossRef]
- Li, G.; Amenuvor, A.C.; Hou, Y.; Lu, X.; Wu, J.; Nguyen, T.N. Effect of open-ended PHC pile installation during embankment widening on the surrounding soil. J. Geotech. Geoenviron. Eng. 2019, 145, 05018006. [Google Scholar] [CrossRef]
- El Kamash, W.; Han, J.; Asce, F. Displacements of column-supported embankments over soft clay after widening considering soil consolidation and column layout: Numerical analysis. Soils Found. 2014, 54, 1054–1069. [Google Scholar] [CrossRef]
- Wu, J.; Xuan, Y.; Deng, Y.; Li, X.; Zha, F.; Zhou, A. Combined vacuum and surcharge preloading method to improve lianyungang soft marine clay for embankment widening project: A case. Geotext. Geomembr. 2021, 49, 452–465. [Google Scholar] [CrossRef]
- Yang, C.Z.; Wan, W.J. Finite Element Analysis on High Embankment of Widened Road. In Proceedings of the MEIME 2011, Beijing, China, 23–24 July 2011; Trans Tech Publ: Beijing, China, 2011; pp. 770–774. [Google Scholar]
- Lü, W.H.; Miao, L.C.; Wang, F.; Cai, H.S.; Zhang, C.X. Experimental study of soil arching of geogrid-reinforced and pile-supported widening embankment. Rock Soil Mech. 2013, 34, 2316–2322. [Google Scholar]
- Zhang, Z.; Tao, F.; Han, J.; Ye, G.; Liu, L. Numerical analysis of geosynthetic-reinforced pile-supported embankments subjected to different surface loads. In Proceedings of the Geo-Congress 2020: Engineering, Monitoring, and Management of Geotechnical Infrastructure, Minneapolis, MN, USA, 25–28 February 2020; American Society of Civil Engineers: Reston, VG, USA, 2020; pp. 70–79. [Google Scholar]
- Jiang, X.; Jiang, Y.; Wu, C.Y.; Wang, W.Q.; Geng, J.Y.; Qiu, Y.J. Numerical analysis for widening embankments over soft soils treated by PVD and DJM columns. Int. J. Pavement Eng. 2020, 21, 267–279. [Google Scholar] [CrossRef]
- Huang, X.; Wang, H. Comparison between responses of reinforced and unreinforced embankments due to road widening. J. Cent. South Univ. Technol. 2009, 16, 857–864. [Google Scholar] [CrossRef]
- Weng, X.L.; Wang, W.; Zhang, L. Deformation characteristics of widen subgrade settlement with pipe pile treatment. J. Chang’an Univ. Nat. Sci. Ed. 2012, 32, 31–35. [Google Scholar]
- Özer, A.T. Laboratory study on the use of EPS-block geofoam for embankment widening. Geosynth. Int. 2016, 23, 71–85. [Google Scholar] [CrossRef]
- Othman, R.; Jaya, R.P.; Muthusamy, K.; Sulaiman, M.; Duraisamy, Y.; Abdullah, M.M.A.B.; Przybyl, A.; Sochacki, W.; Skrzypczak, T.; Vizureanu, P.; et al. Relation between Density and Compressive Strength of Foamed Concrete. Materials 2021, 14, 2967. [Google Scholar] [CrossRef]
- Lee, Y.L.; Oh, C.H.; Lim, M.H.; Lee, F.W. Engineering properties of foamed concrete containing water repellent. In Proceedings of the International Conference on Civil and Environmental Engineering (ICCEE 2018), Kuala Lumpur, Malaysia, 3–5 October 2018; EDP Sciences: Lis, France, 2018; p. 02005. [Google Scholar]
- Amran, M.; Fediuk, R.; Vatin, N.; Huei Lee, Y.; Murali, G.; Ozbakkaloglu, T.; Klyuev, S.; Alabduljabber, H. Fibre-Reinforced Foamed Concretes: A Review. Materials 2020, 13, 4323. [Google Scholar] [CrossRef]
- Bayraktar, O.Y.; Kaplan, G.; Gencel, O.; Benli, A.; Sutcu, M. Physico-mechanical, durability and thermal properties of basalt fiber reinforced foamed concrete containing waste marble powder and slag. Constr. Build. Mater. 2021, 288, 123128. [Google Scholar] [CrossRef]
- JTG D30–2015; Ministry of Transport of the People’s Republic of China (MTPRC). Specification for Design of Highway Subgrades. China Communication Press Co. Ltd.: Beijing, China, 2015.
- Su, Y.; Xu, Z.; Wang, L.; Min, D. Study on deformation characteristics of widened roadbed of Qinghai-tibet railway. J. Eng. Geol. 2003, 11, 288–296. [Google Scholar]
- JG/T266—2011; Ministry of Housing and Urban-Rural Construction of the People’s Republic of China. Foamed Concrete. Standards Press of China: Beijing, China, 2011.
- Shi, X.; Huang, J.; Su, Q. Experimental and numerical analyses of lightweight foamed concrete as filler for widening embankment. Constr. Build. Mater. 2020, 250, 118897. [Google Scholar] [CrossRef]
- CJJ T177-2012; Ministry of Housing and Urban-Rural Development. Technical Specification for Foamed Mixture Lightweight Soil Filling Engineering. China Architecture & Building Press: Beijing, China, 2015.
- Huang, J.; Su, Q.; Zhao, W.; Li, T.; Zhang, X. Experimental study on use of lightweight foam concrete as subgrade bed filler of ballastless track. Constr. Build. Mater. 2017, 149, 911–920. [Google Scholar] [CrossRef]
- Jiang, Y.; Han, J.; Zheng, G. Numerical analysis of a pile-slab-supported railway embankment. Acta Geotech. 2014, 9, 499–511. [Google Scholar] [CrossRef]
- TB 10621—2014; Code for Design of High Speed Railway. China Railway Publishing House: Beijing, China, 2015; 12–16.
- Yang, G.Q.; Gao, M.H.; Chen, J.Z. Anchorage-reinforced technology for subgrade widening project of highways. Chin. J. Geotech. Eng. 2013, 35, 10–15. [Google Scholar]
- Zheng, G.; Jiang, Y.; Han, J.; Liu, Y.F. Performance of cement-fly ash-gravel pile-supported high-speed railway embankments over soft marine clay. Mar. Georesourc. Geotechnol. 2011, 29, 145–161. [Google Scholar] [CrossRef]
- Dong, J.; Yang, Y.; Zhang, X.; Ma, Y. Study on Dynamic Response of Different Improvement Thickness of Subgrade Bed of Heavy Haul Railway. Railw. Stand. Des. 2019, 63, 33–38. [Google Scholar]


| Type of Foam Agent | Compound Foam Agent |
|---|---|
| Foaming ratio Wet densities (kg/m Design dry density grades (kg/m3) | ≥55 |
| Foaming densities (kg/m3) | 40–60 |
| PH value | 7.04 |
| Foaming bleeding rate | ≤20% |
| Increasing rate of wet density determined by defoaming test | ≤10% |
| Design Dry Density Grades (kg/m3) | Cement (kg) | Foam (m3) | Water (kg) |
|---|---|---|---|
| 550 | 405 | 0.71 | 203 |
| 600 | 477 | 0.66 | 238 |
| 650 | 532 | 0.60 | 267 |
| Design Dry Density (kg/m3) | Compressive Strength (MPa) | Elastic Modulus (MPa) | Splitting Strength (MPa) | Bending Strength (MPa) | Permeability Coefficient (10−3 m/s) | Compressive Strength with the Effect of Water (MPa) |
|---|---|---|---|---|---|---|
| 550 | 1.00 | 94.56 | 0.24 | 0.37 | 0.052 | 0.88 |
| 600 | 1.62 | 104.99 | 0.35 | 0.53 | 0.018 | 1.48 |
| 650 | 1.98 | 122.85 | 0.47 | 0.73 | 0.007 | 1.86 |
| Stage of Construction Process | Construction Procedure at the Stage | Height of Filling (m) | Elapsed Time (Day) |
|---|---|---|---|
| 1 | Filling of geotechnical cushion | 0.6 | 30 |
| 2 | Filling of LWFC layer | 6.3 | 60 |
| 3 | Intermittent period | 0.0 | 30 |
| 4 | Filling of A,B group filler | 2.6 | 30 |
| 5 | Intermittent period | - | - |
| Soil Layer | Density (kg/m3) | Permeability Coefficient (×10−4) | Water Content (%) | Shear Strength (Direct Shear Testing) | Characteristic Value of Foundation Bearing Capacity (kPa) | Unconfined Pressive Strength (kPa) | |
|---|---|---|---|---|---|---|---|
| Cohesion (kPa) | Internal Friction Angle (°) | ||||||
| Plain backfill | 1920 | 1.16 | 15.2 | 5 | 7.0 | / | / |
| Upper silty clay | 1837 | 0.09 | 26.4 | 35 | 17.5 | 220 | 113 |
| Lower soft clay | 1949 | 0.41 | 35.8 | 30 | 14.5 | 180 | 110 |
| Weathered rock | 1980 | 0.58 | 19.8 | 300 | 31.0 | 600 | / |
| Material | E (MPa) | v (MPa) | ρ (kg/m3) | c (kPa) | φ (°) | φf (°) | σt (MPa) | |
|---|---|---|---|---|---|---|---|---|
| LWFC | Upper 0.8 m | 117 | 0.23 | 640 | ||||
| Lower 5.5 m | 98 | 0.23 | 580 | |||||
| Piles | 1500 | 0.21 | 2500 | |||||
| Retain wall | 20,000 | 0.21 | 2500 | |||||
| Geotechnical cushion | 45 | 0.3 | 2000 | 22 | 27 | 15 | 0.06 | |
| Existing embankment fill | 290 | 0.23 | 2000 | 24 | 28 | 10 | 0 | |
| A, B group fill | 290 | 0.23 | 2000 | 24 | 28 | 10 | 0 | |
| Weathered rock | 19,000 | 0.22 | 1980 | 300 | 31 | 20 | 0.2 | |
| Material | K (MPa) | pc0 (kPa) | v | Ρ (kg/m3) | κ | M | λ | vλ |
|---|---|---|---|---|---|---|---|---|
| Upper silty clay | 18.3 | 191.6 | 0.3 | 1837 | 0.013 | 0.90 | 0.07 | 0.059 |
| Lower soft clay | 21.7 | 166.5 | 0.3 | 1949 | 0.010 | 0.86 | 0.07 | 0.067 |
| Material | E (MPa) | v | ρ (kg/m3) | c (kPa) | φ (°) | φf (°) |
|---|---|---|---|---|---|---|
| Improved soil filler | 70 | 0.25 | 1750 | 3.9 | 23 | 10 |
| A, B group filler | 290 | 0.23 | 2000 | 24 | 28 | 10 |
Disclaimer/Publisher’s Note: The statements, opinions and data contained in all publications are solely those of the individual author(s) and contributor(s) and not of MDPI and/or the editor(s). MDPI and/or the editor(s) disclaim responsibility for any injury to people or property resulting from any ideas, methods, instructions or products referred to in the content. |
© 2024 by the authors. Licensee MDPI, Basel, Switzerland. This article is an open access article distributed under the terms and conditions of the Creative Commons Attribution (CC BY) license (https://creativecommons.org/licenses/by/4.0/).
Share and Cite
Hao, D.; Miao, C.; Fang, S.; Wang, X.; Shu, Q. Experimental and Numerical Study on Lightweight-Foamed-Concrete-Filled Widened Embankment of High-Speed Railway. Materials 2024, 17, 4642. https://doi.org/10.3390/ma17184642
Hao D, Miao C, Fang S, Wang X, Shu Q. Experimental and Numerical Study on Lightweight-Foamed-Concrete-Filled Widened Embankment of High-Speed Railway. Materials. 2024; 17(18):4642. https://doi.org/10.3390/ma17184642
Chicago/Turabian StyleHao, Didi, Changqing Miao, Shisheng Fang, Xudong Wang, and Qiaoqiao Shu. 2024. "Experimental and Numerical Study on Lightweight-Foamed-Concrete-Filled Widened Embankment of High-Speed Railway" Materials 17, no. 18: 4642. https://doi.org/10.3390/ma17184642
APA StyleHao, D., Miao, C., Fang, S., Wang, X., & Shu, Q. (2024). Experimental and Numerical Study on Lightweight-Foamed-Concrete-Filled Widened Embankment of High-Speed Railway. Materials, 17(18), 4642. https://doi.org/10.3390/ma17184642