

Study on the Flexural Performance of Ultrahigh-Performance Concrete–Normal Concrete Composite Slabs


Abstract
:1. Introduction
2. Experimental Investigation
2.1. Material Properties
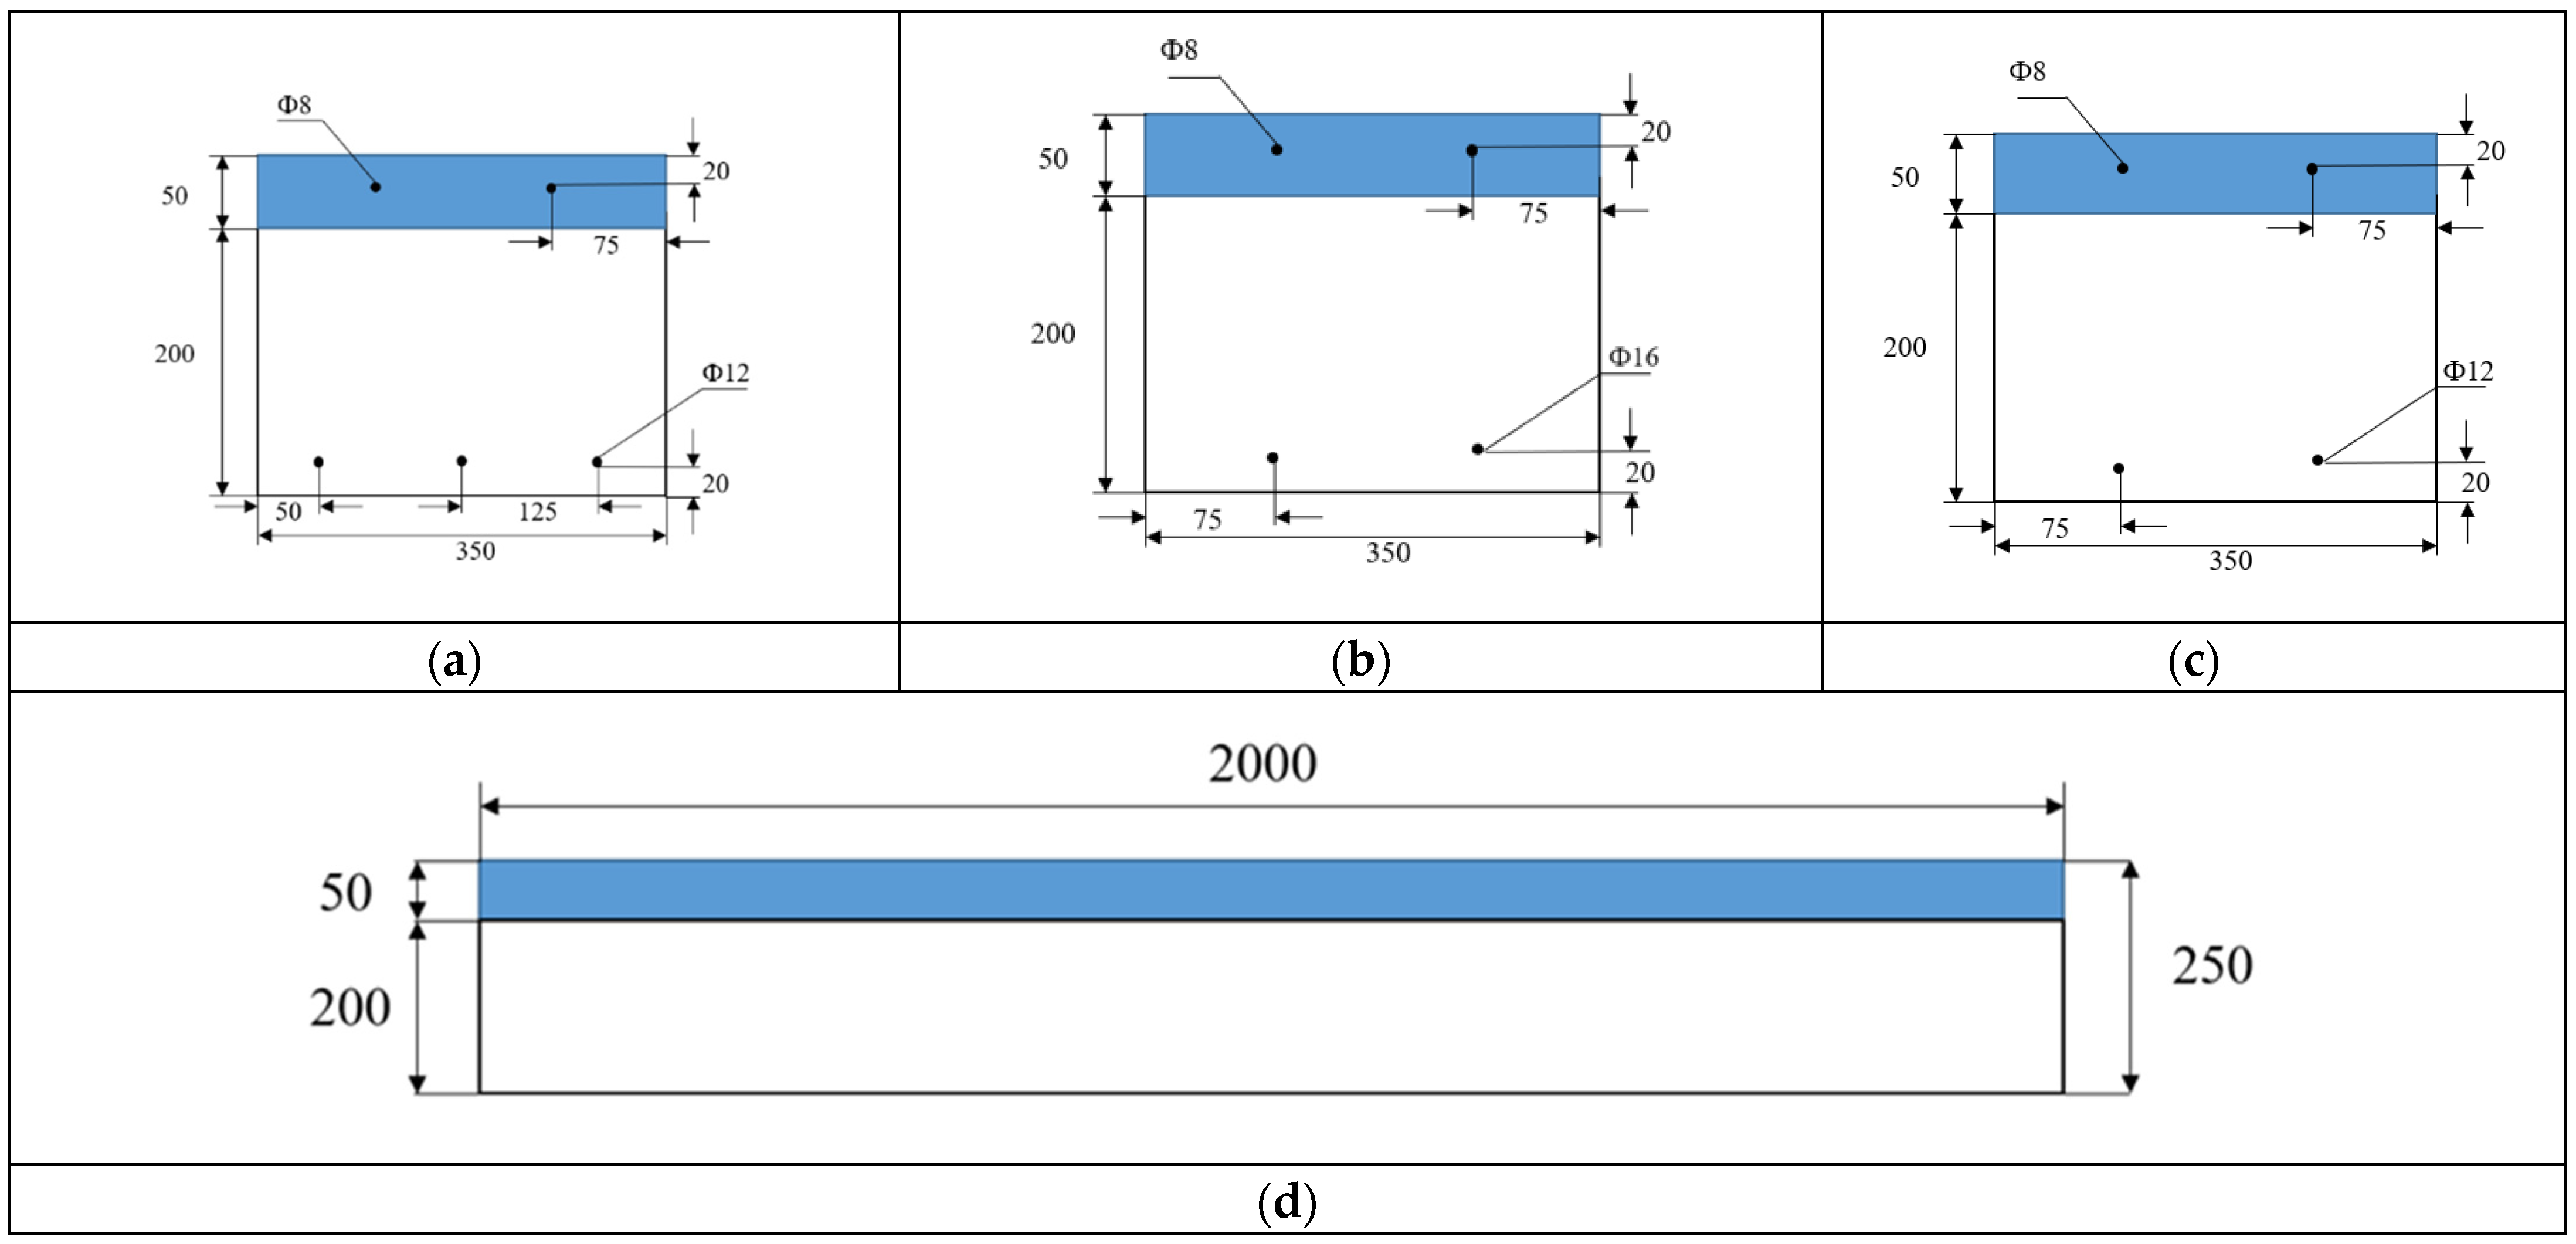
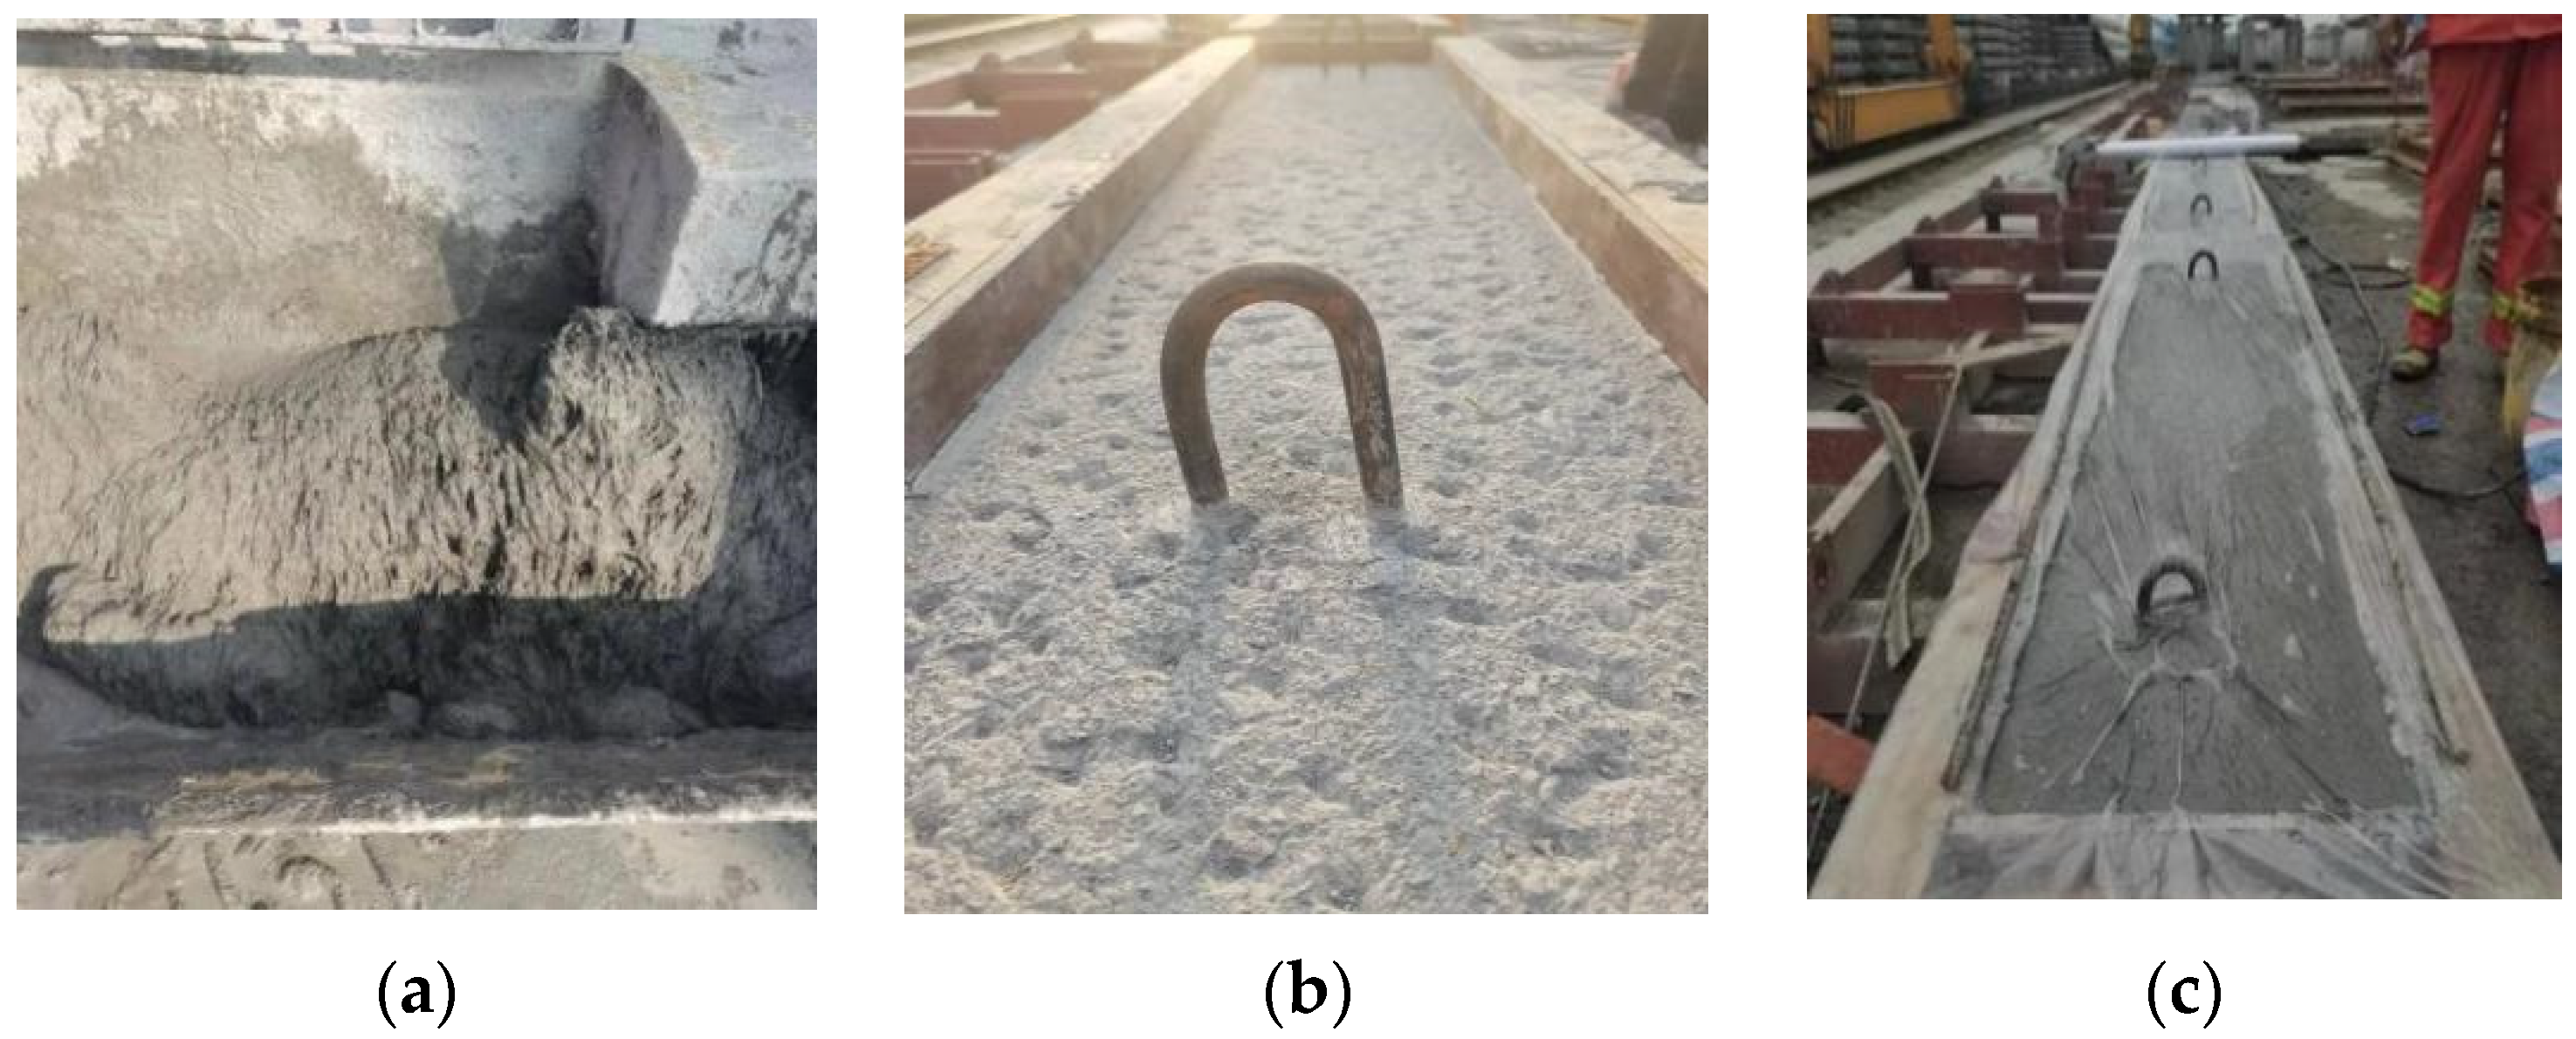
2.2. Design and Preparation of Specimens
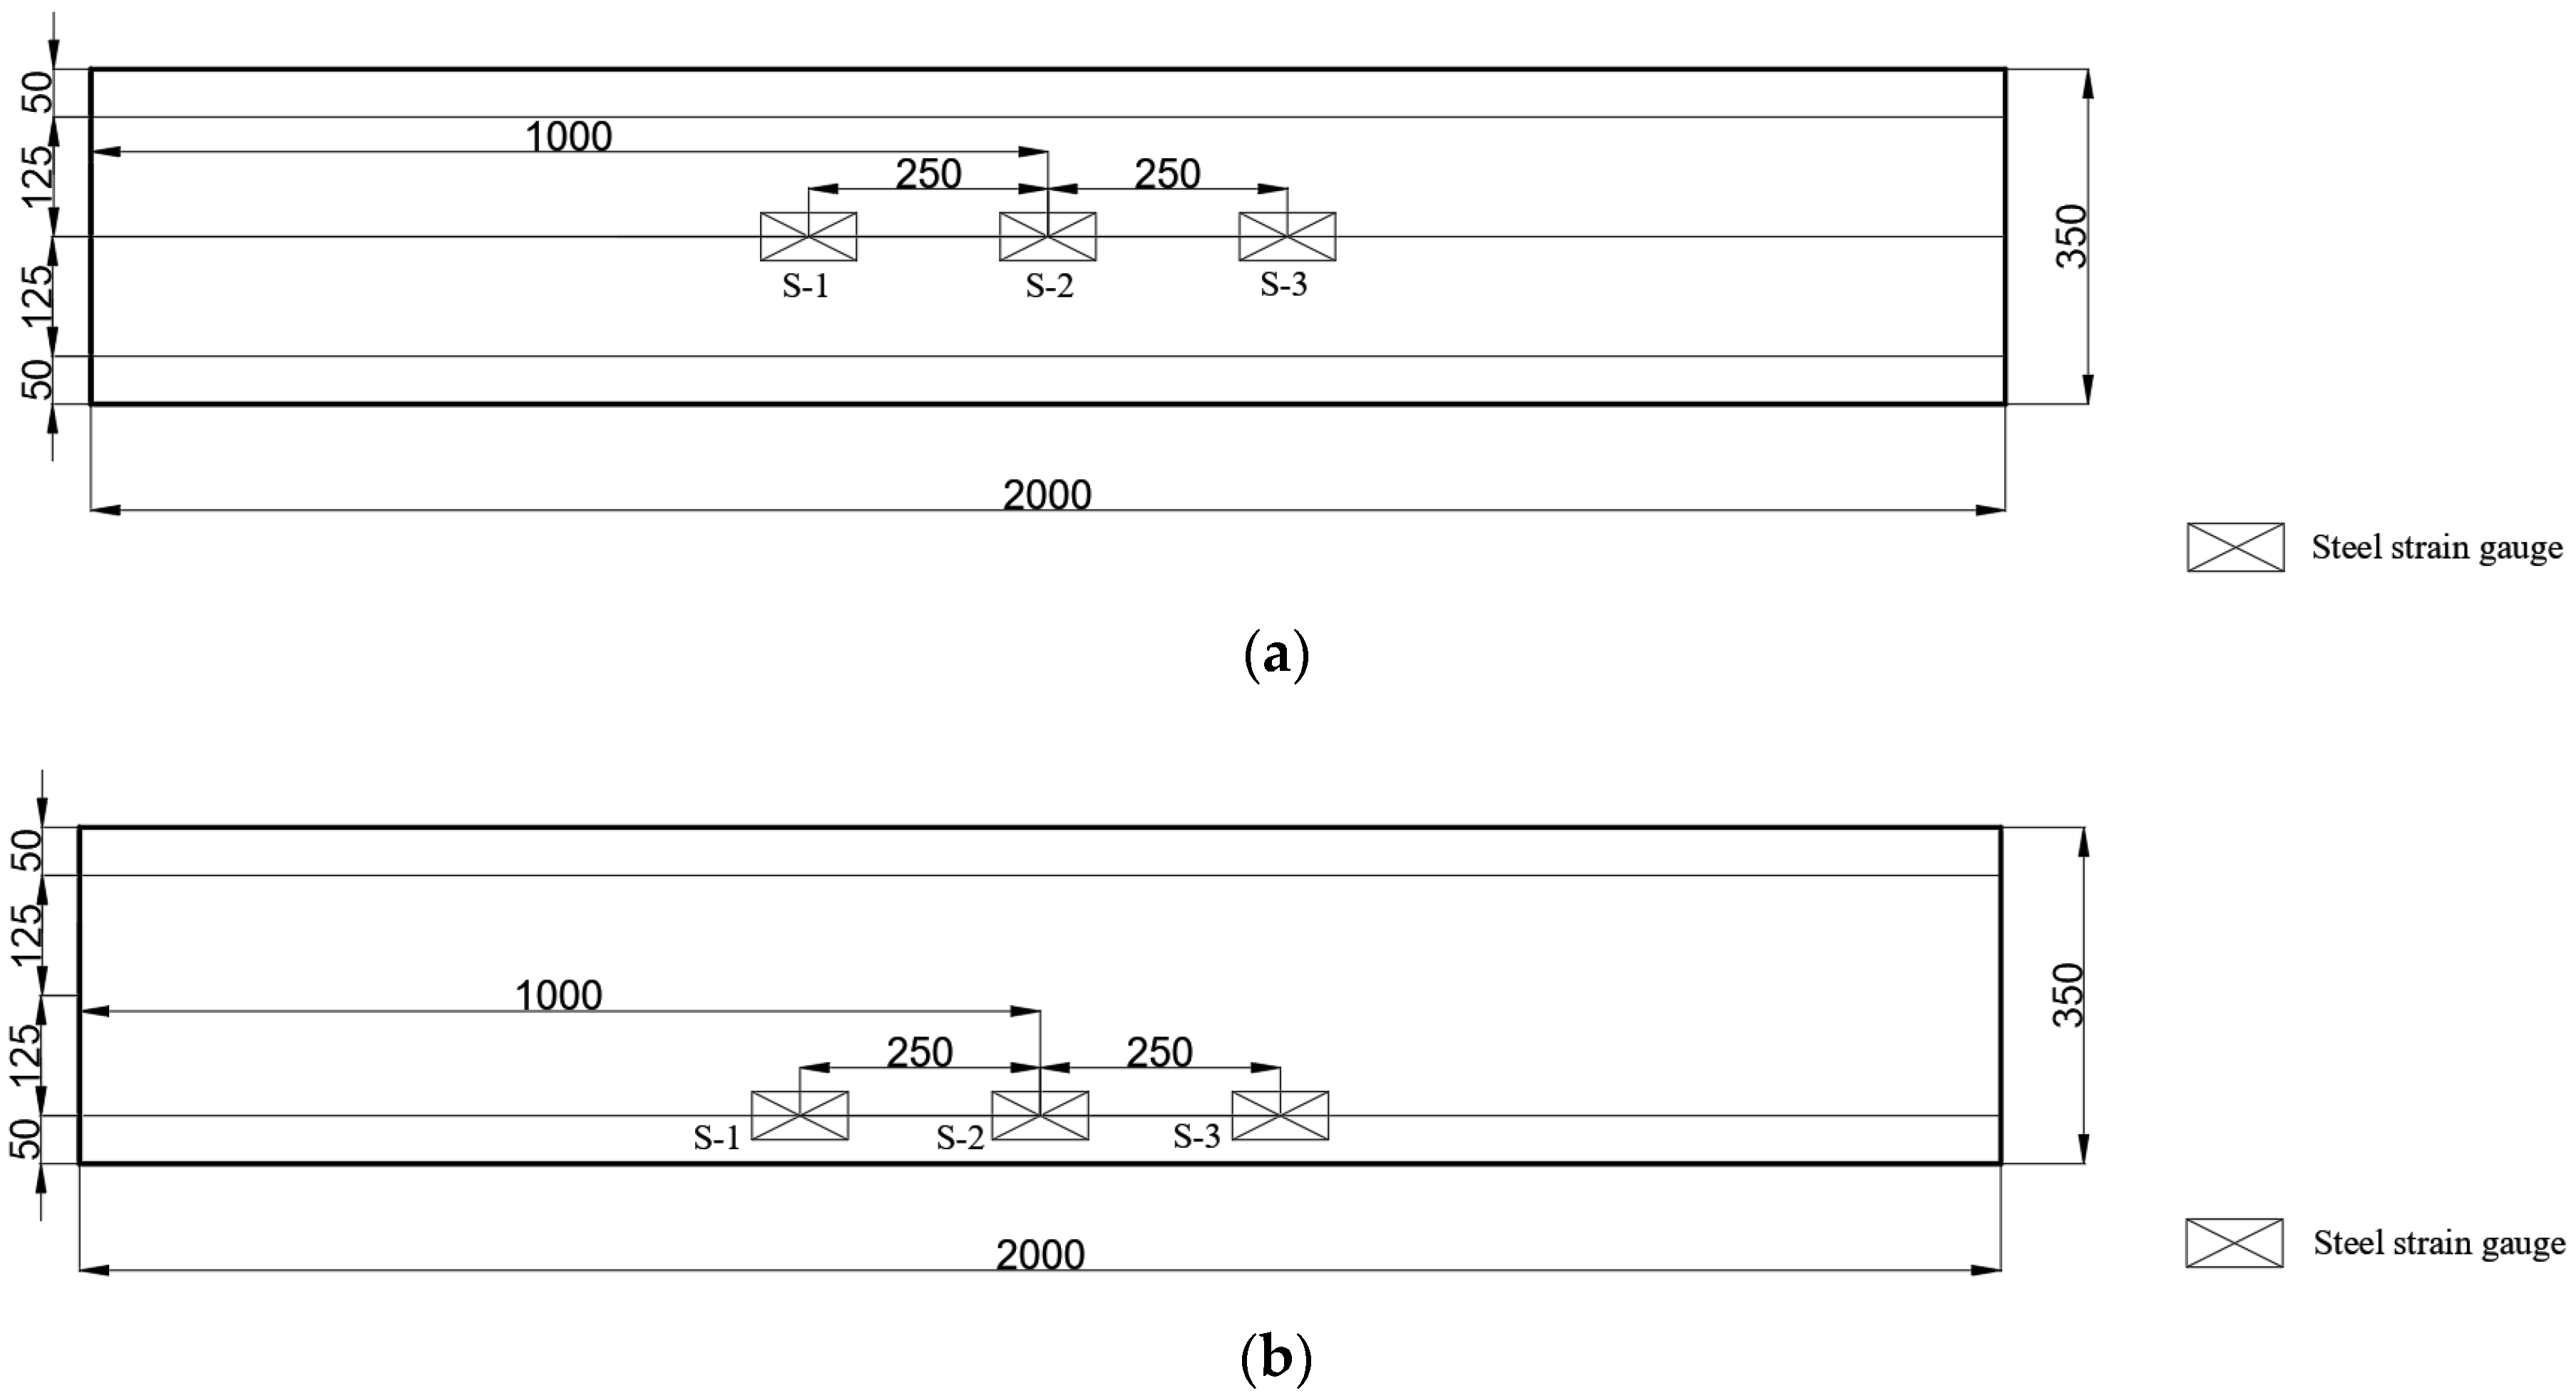
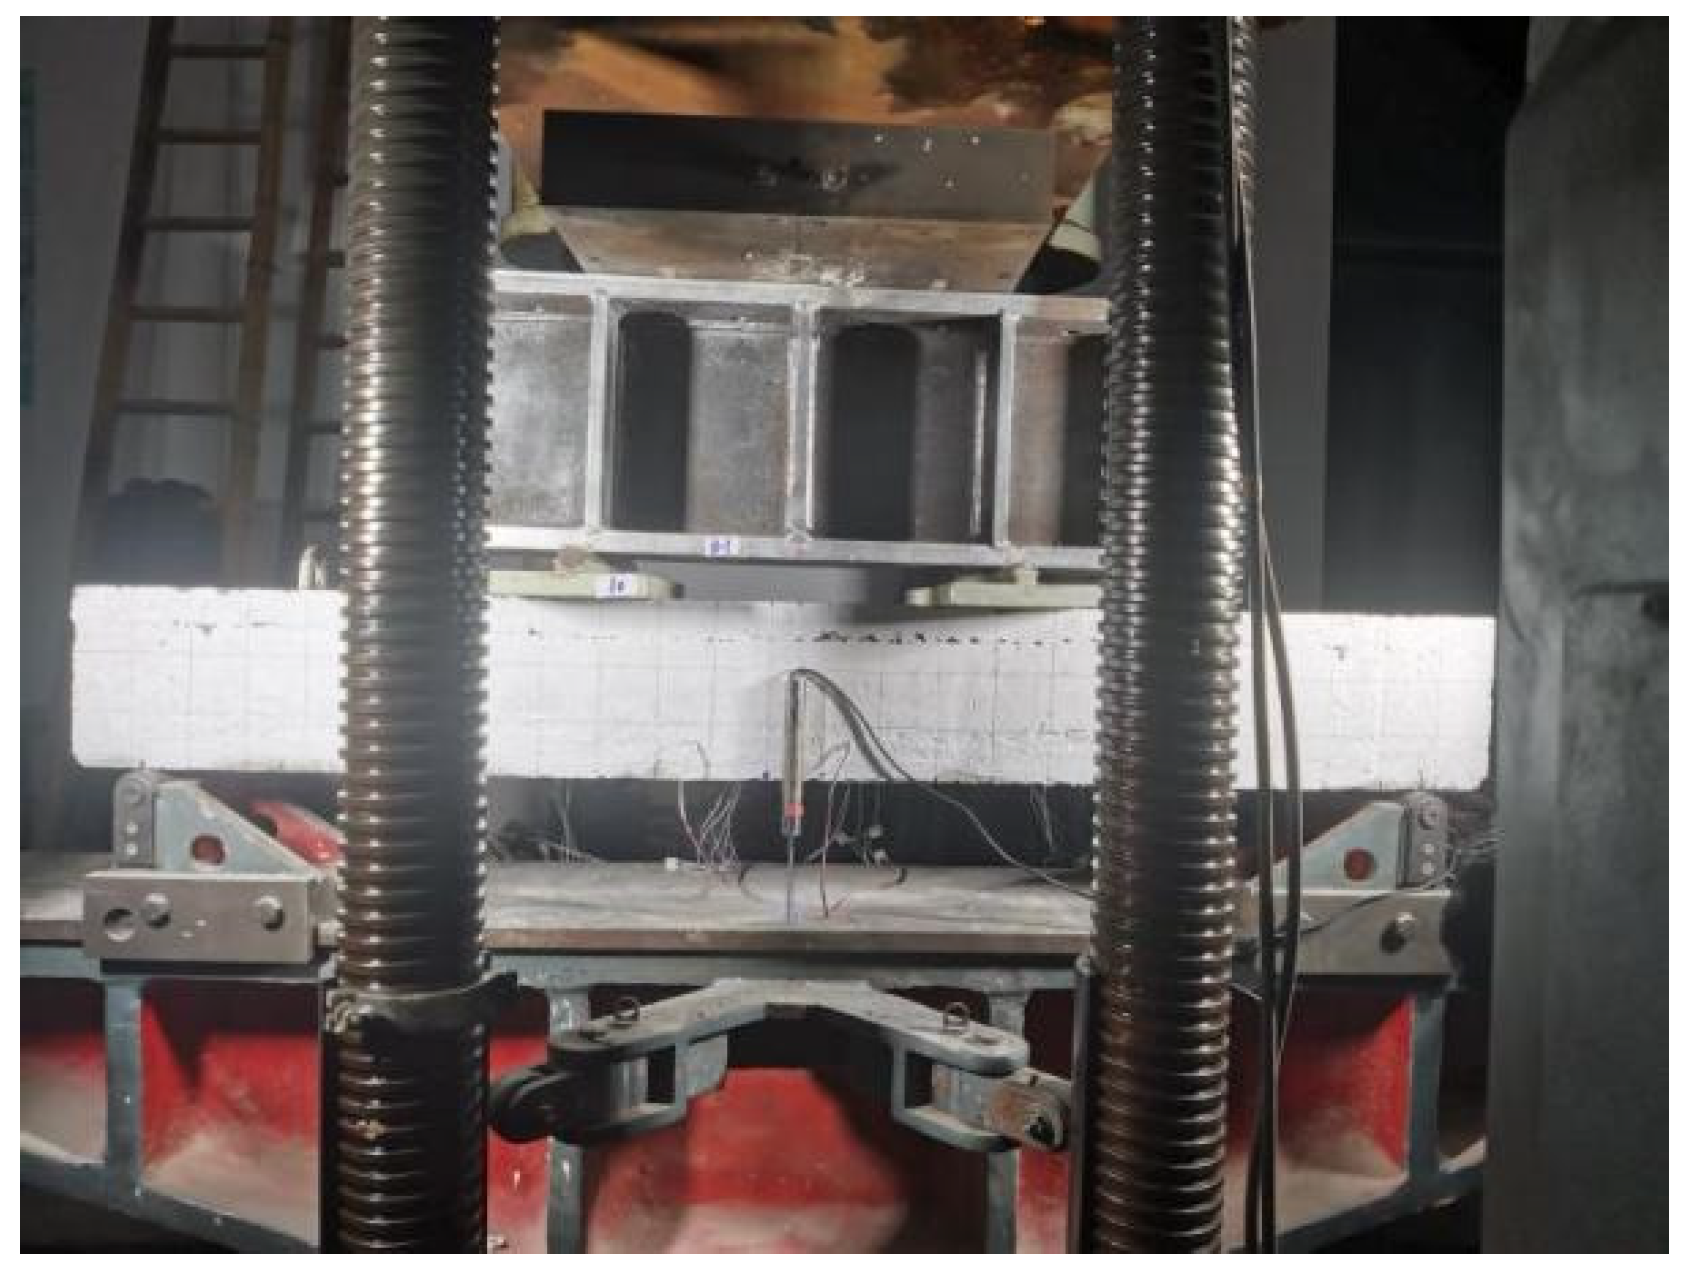
2.3. Test Loading and Measurement Scheme
3. Experimental Results
3.1. Experimental Phenomena
- (1)
- B-1: Under loading to 60 kN, the first crack appeared in the middle of the span. As the test continued, the load gradually increased, the number of cracks increased, and the cracks extended upward and gradually widened. When the specimen reached ultimate failure, the deformation of the specimen was obvious, and there were approximately eight cracks in the component. The cracks extended to the UHPC area, and the tensile steel rebars yielded. The specimen can be considered to have suitable reinforcement failure.
- (2)
- B-2: When the specimen was loaded to 70 kN, the first crack appeared in the mid-span. As the test continued, the load gradually increased, the number of cracks increased, and the cracks extended upward and gradually widened. When the specimen reached ultimate failure, there were approximately eight cracks in the component. The cracks extended to the UHPC area, the tensile steel rebars yielded, and the deformation of the specimen was obvious. The specimen can be considered to have been damaged by reinforcement.
- (3)
- B-3: Under loading to 70 kN, the first crack first appeared in the middle of the span. As the test continued, the load gradually increased, the number of cracks increased, and the cracks extended upward and gradually widened. When the specimen reached ultimate failure, there were approximately eight cracks in the component. The cracks extended to the UHPC area, the tensile steel rebars yielded, and the deformation of the specimen was obvious. The specimen can be considered to have been damaged by reinforcement.
3.2. Load–Displacement Curve
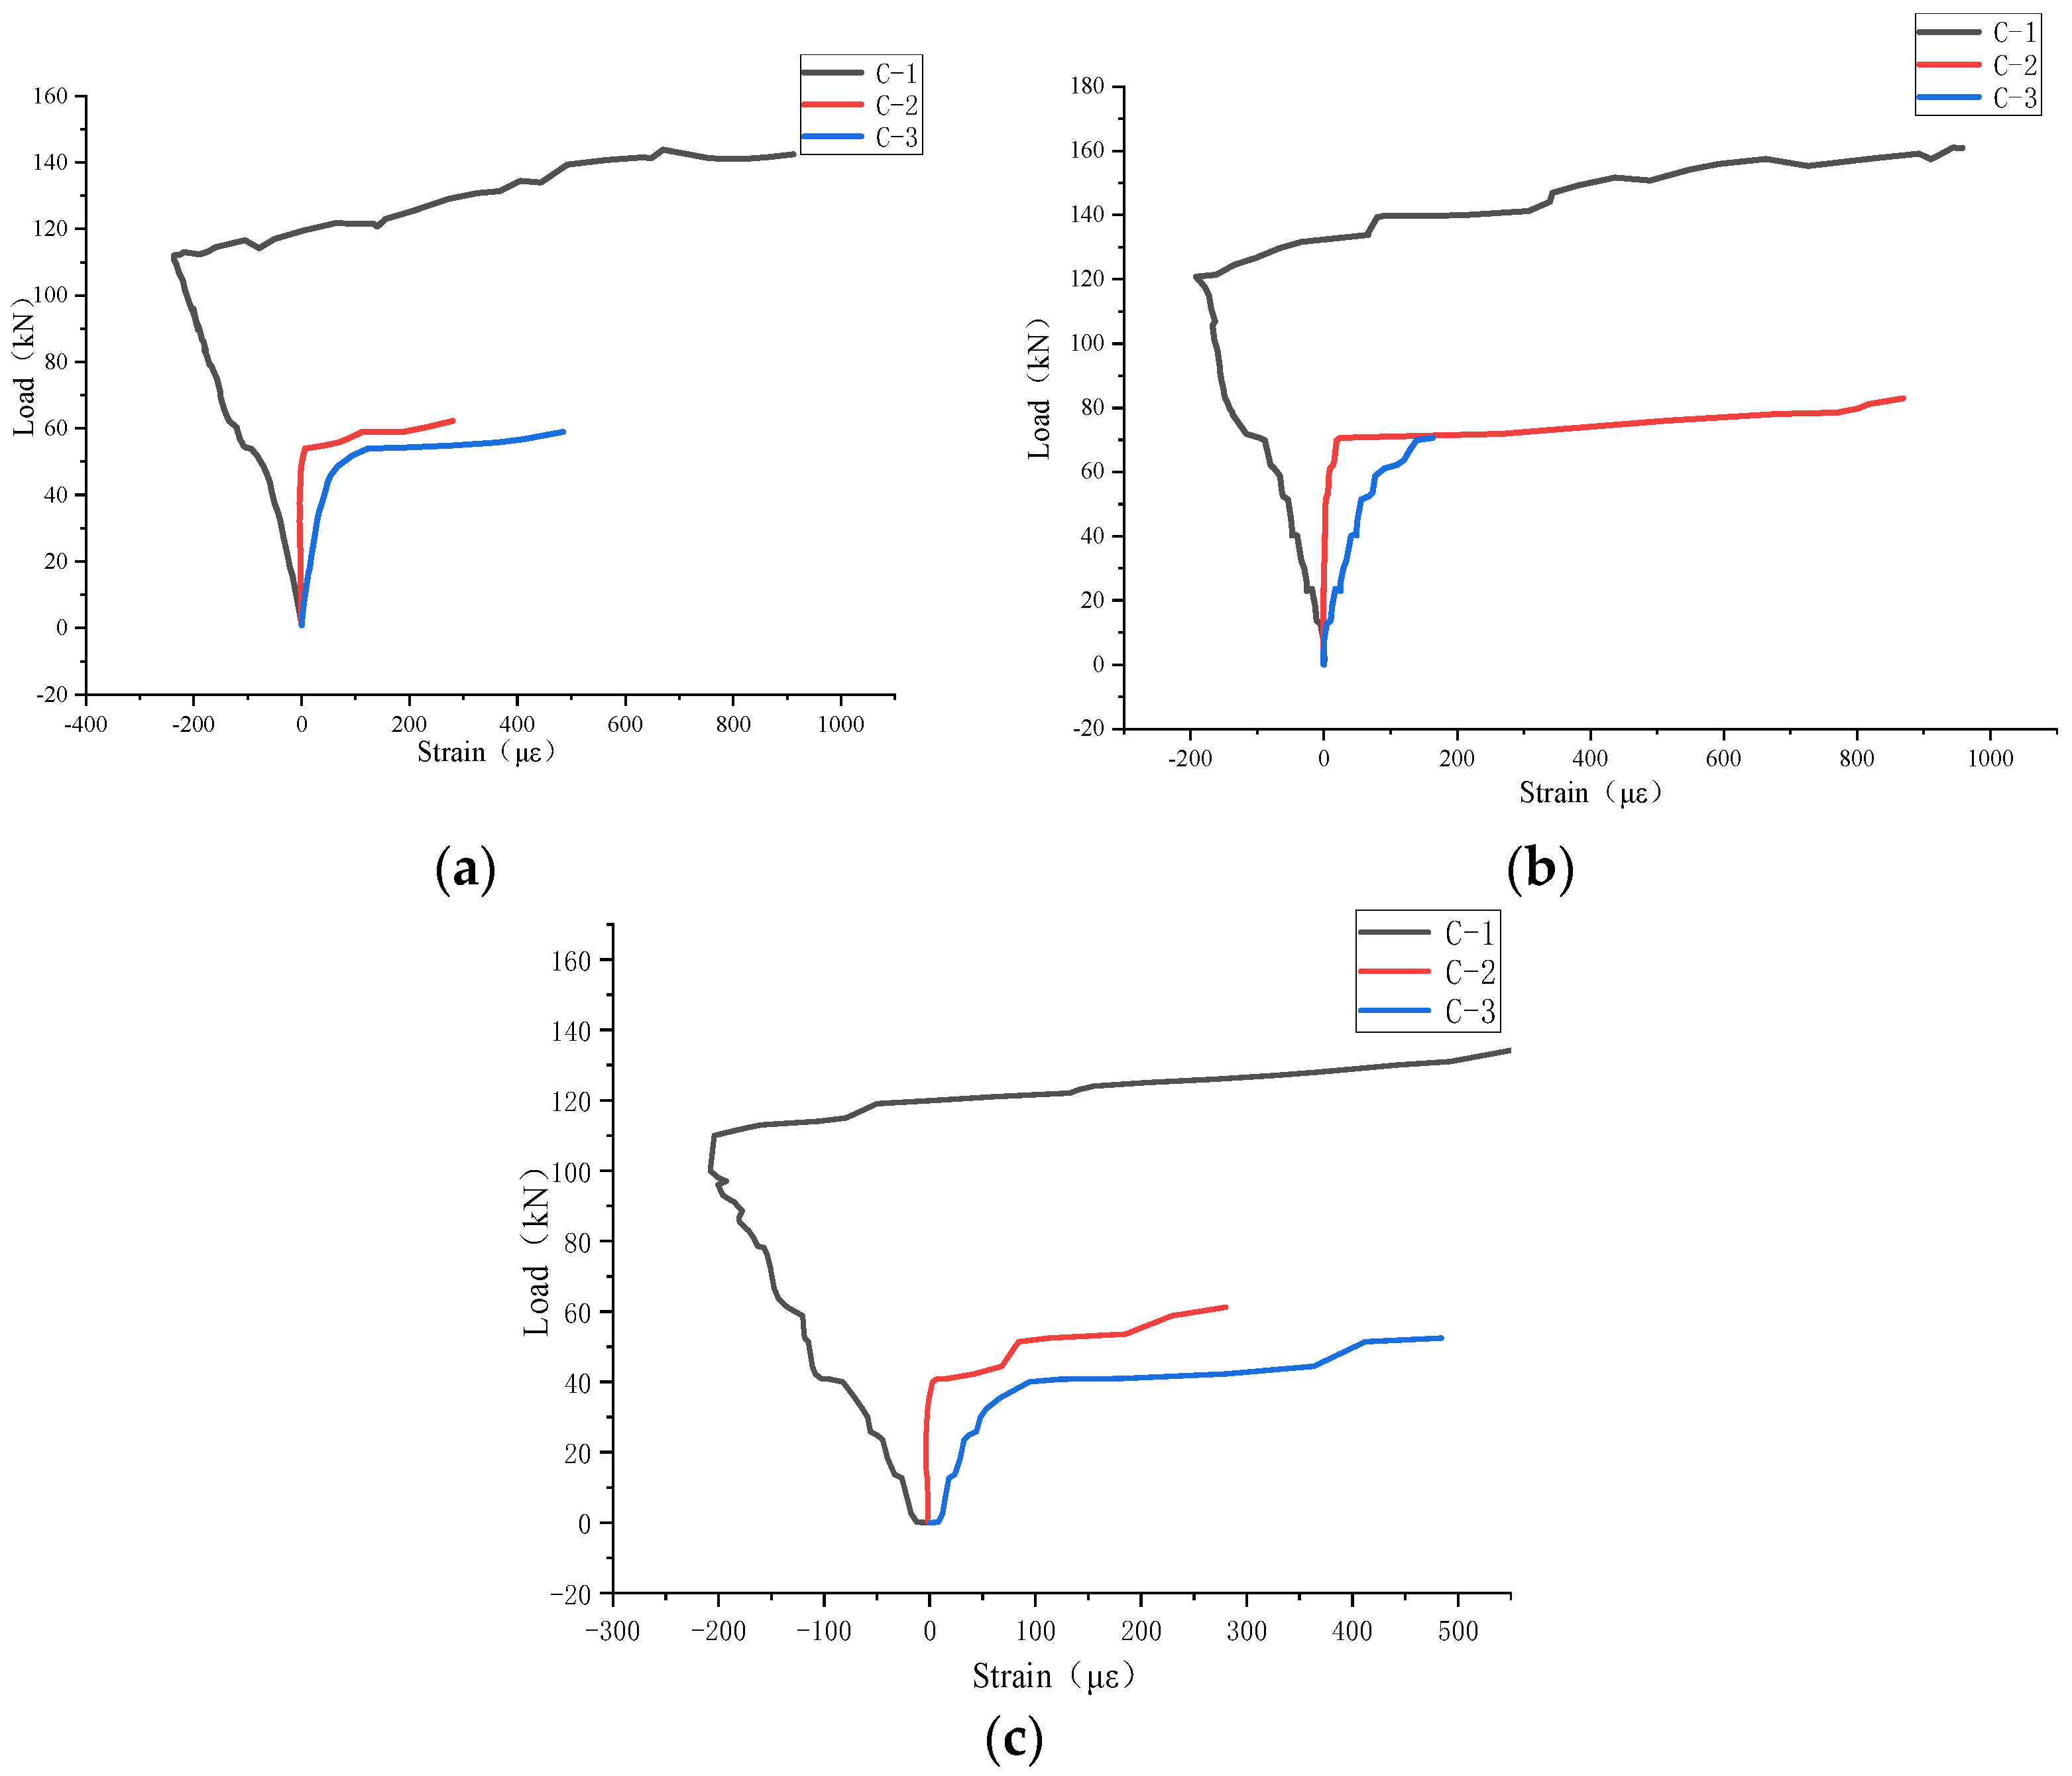
3.3. Load–Strain Curve of Concrete
3.4. Load–Strain Curve of Tensile Steel Rebars
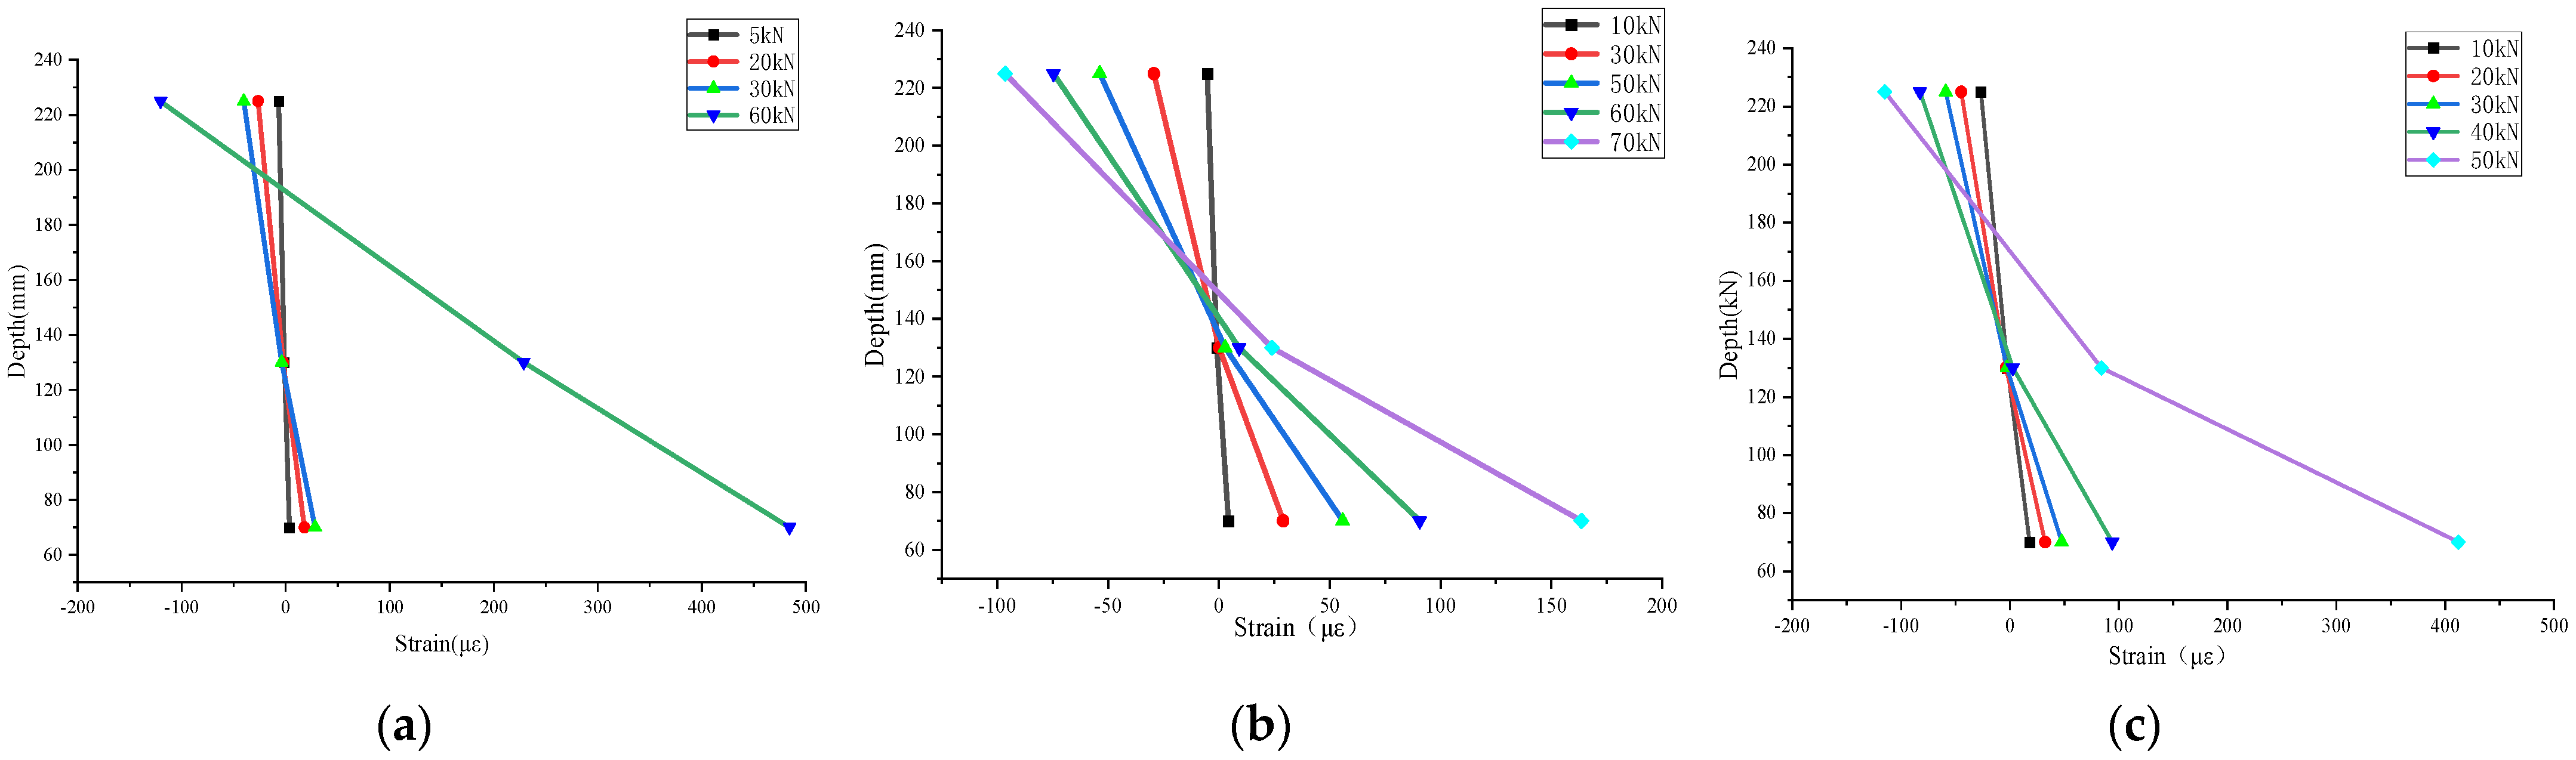
3.5. Distribution of Concrete Strain the in Mid-Span Section
4. Finite Element Model
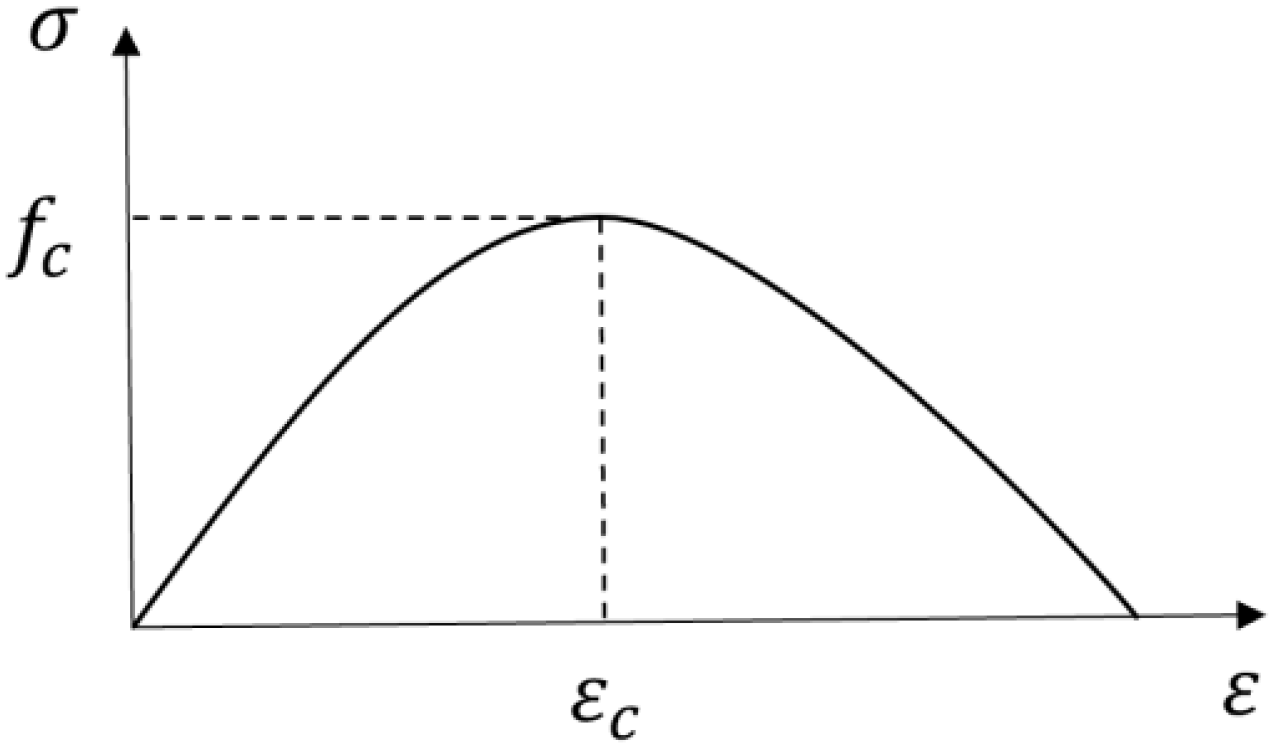
4.1. Basic Assumptions of the Materials’ Parameters
- (1)
- Ordinary concrete
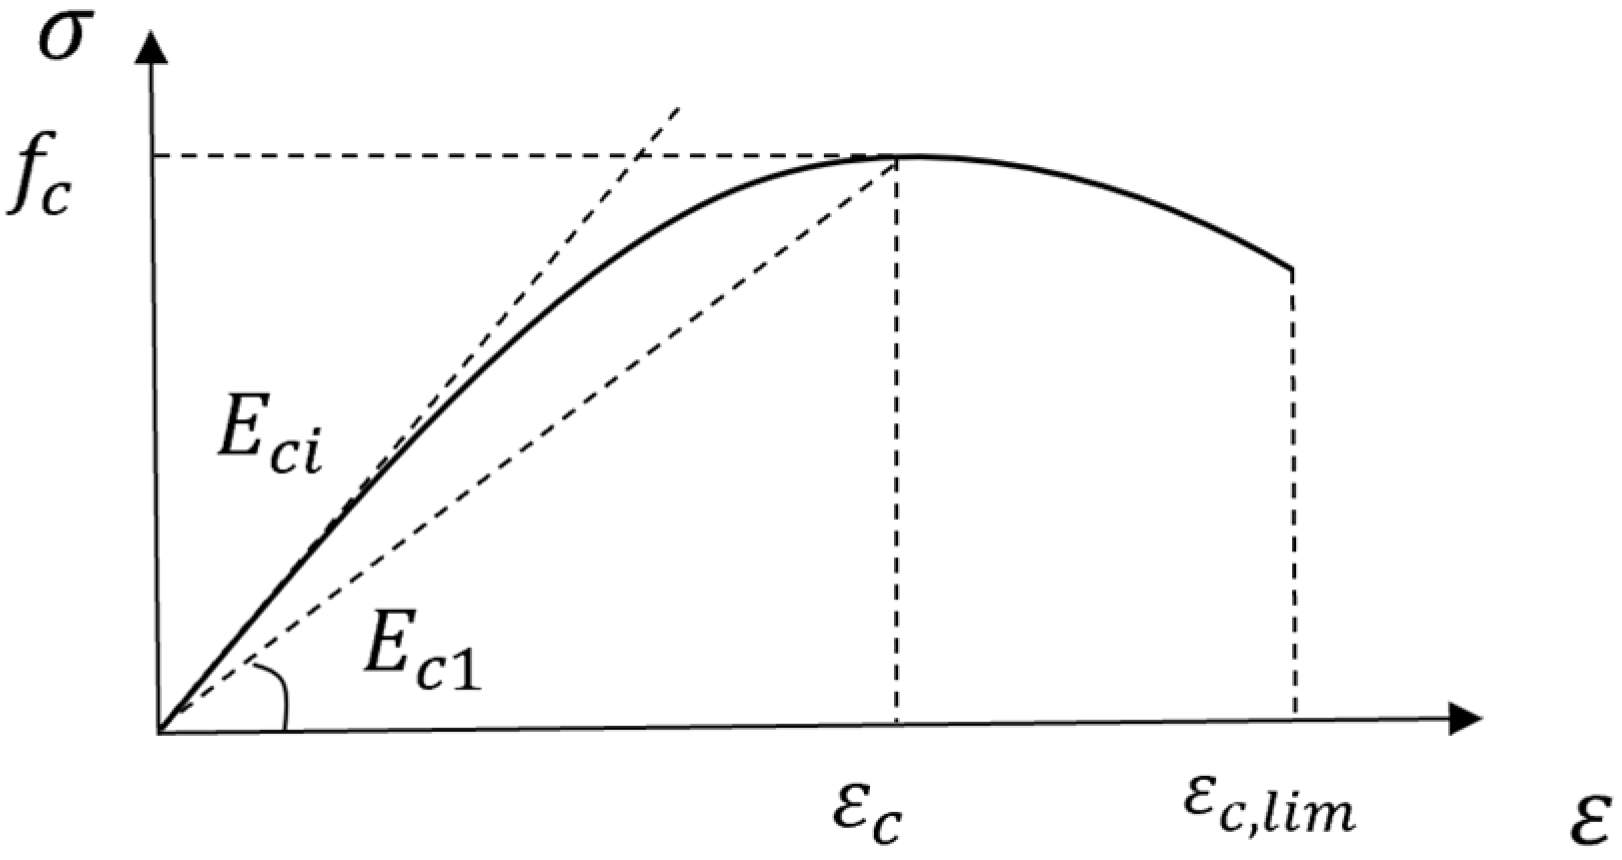
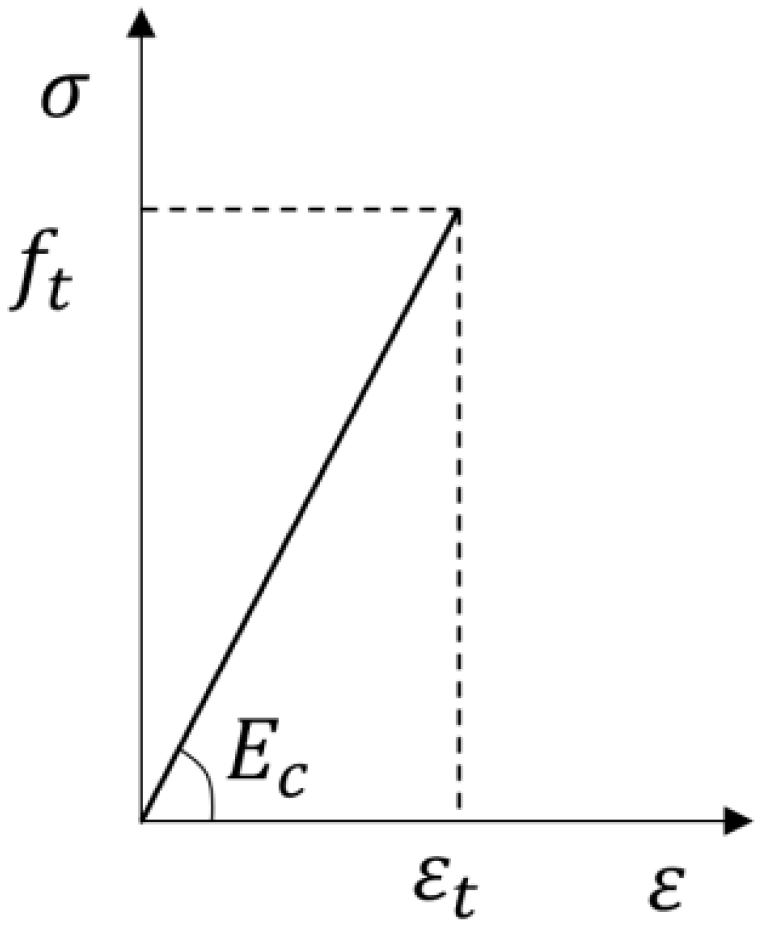
- (2)
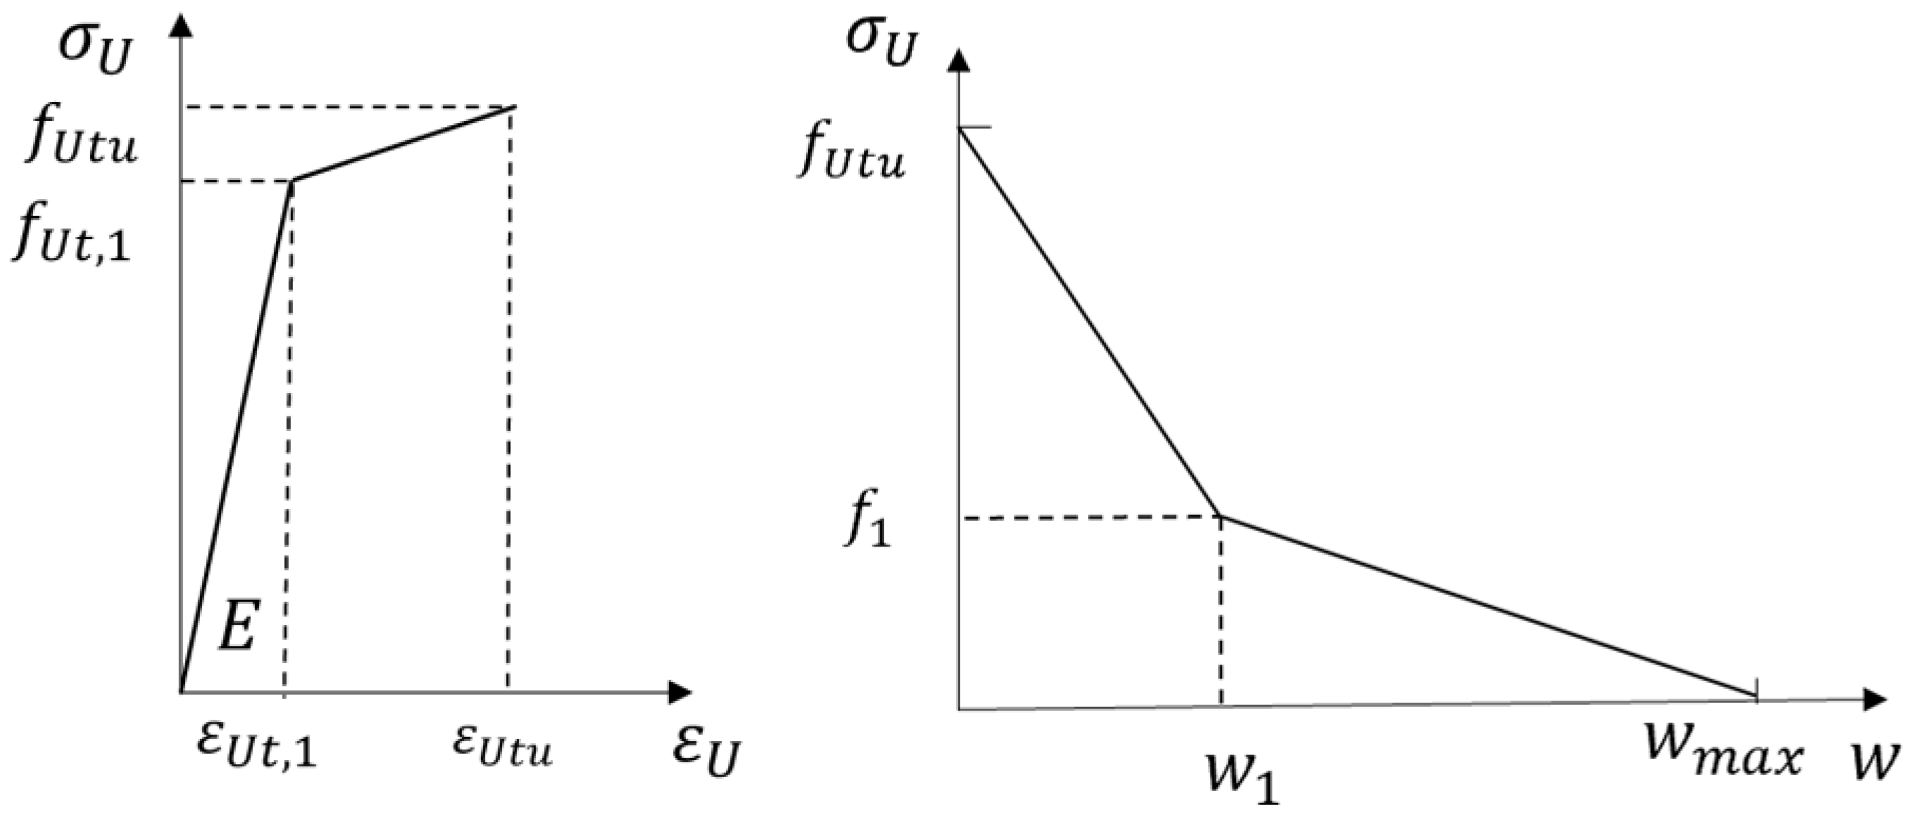
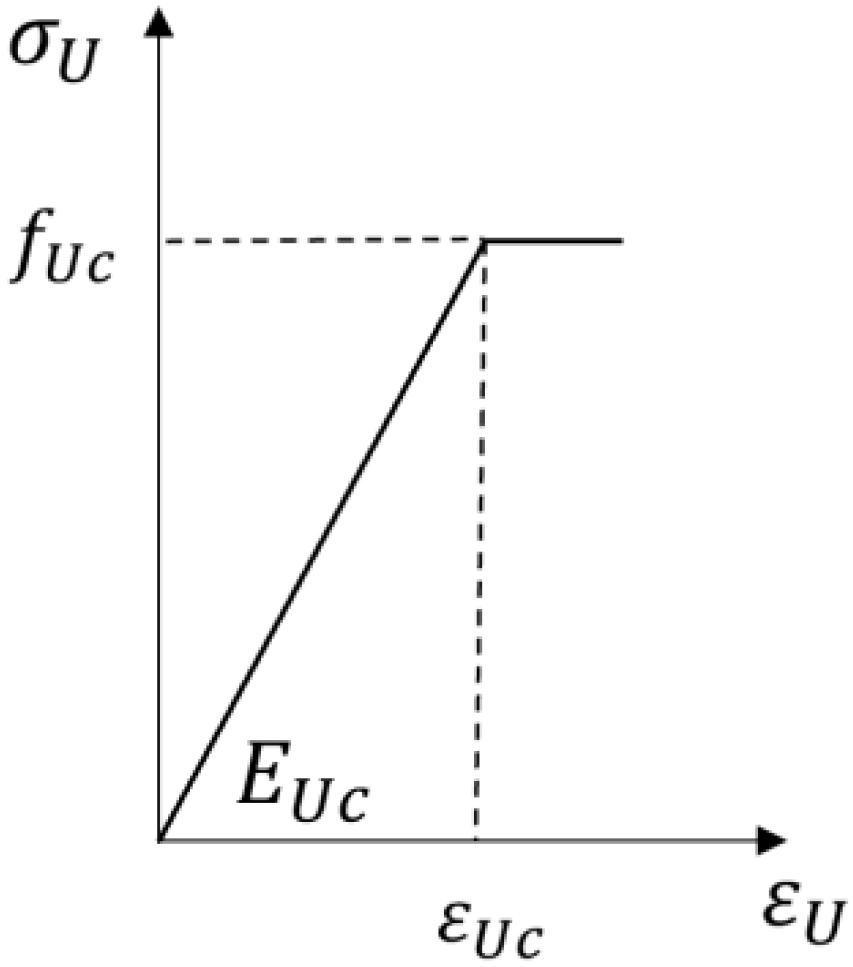
- UHPC
- (3)
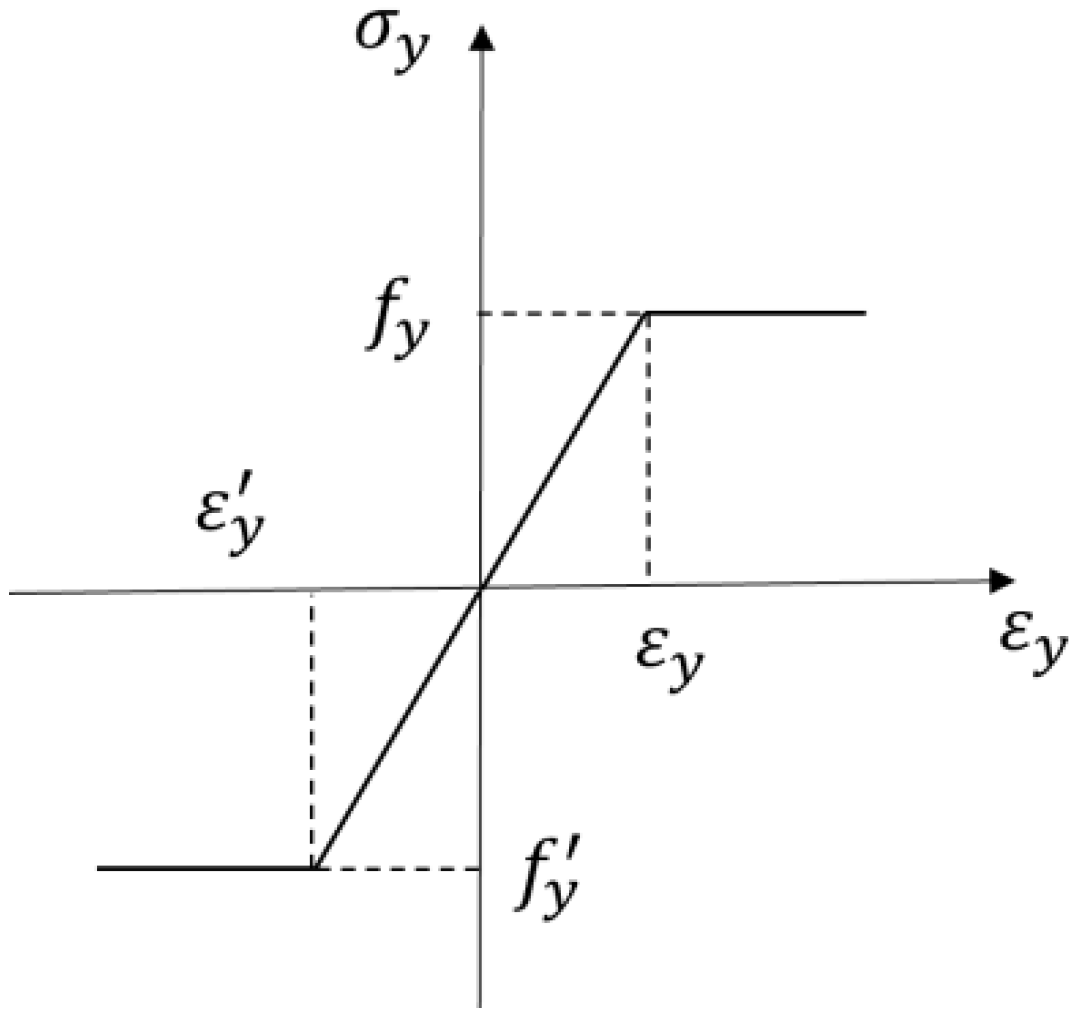
- Steel rebars
4.2. Establishment of the Model
- (1)
- The side with the larger material stiffness and structural stiffness was the main surface, and the side with the smaller material stiffness and structural stiffness was the secondary surface.
- (2)
- The larger side was used as the main side, and the smaller side was used as the secondary side.
- (3)
- The side with high roughness was the main surface, and the side with low roughness was the secondary surface. Since the NC side was greater than the UHPC part, the NC side of the contact surface was defined as the main surface, and the UHPC side was defined as the secondary surface. The steel rebars were embedded in the UHPC and ordinary concrete.
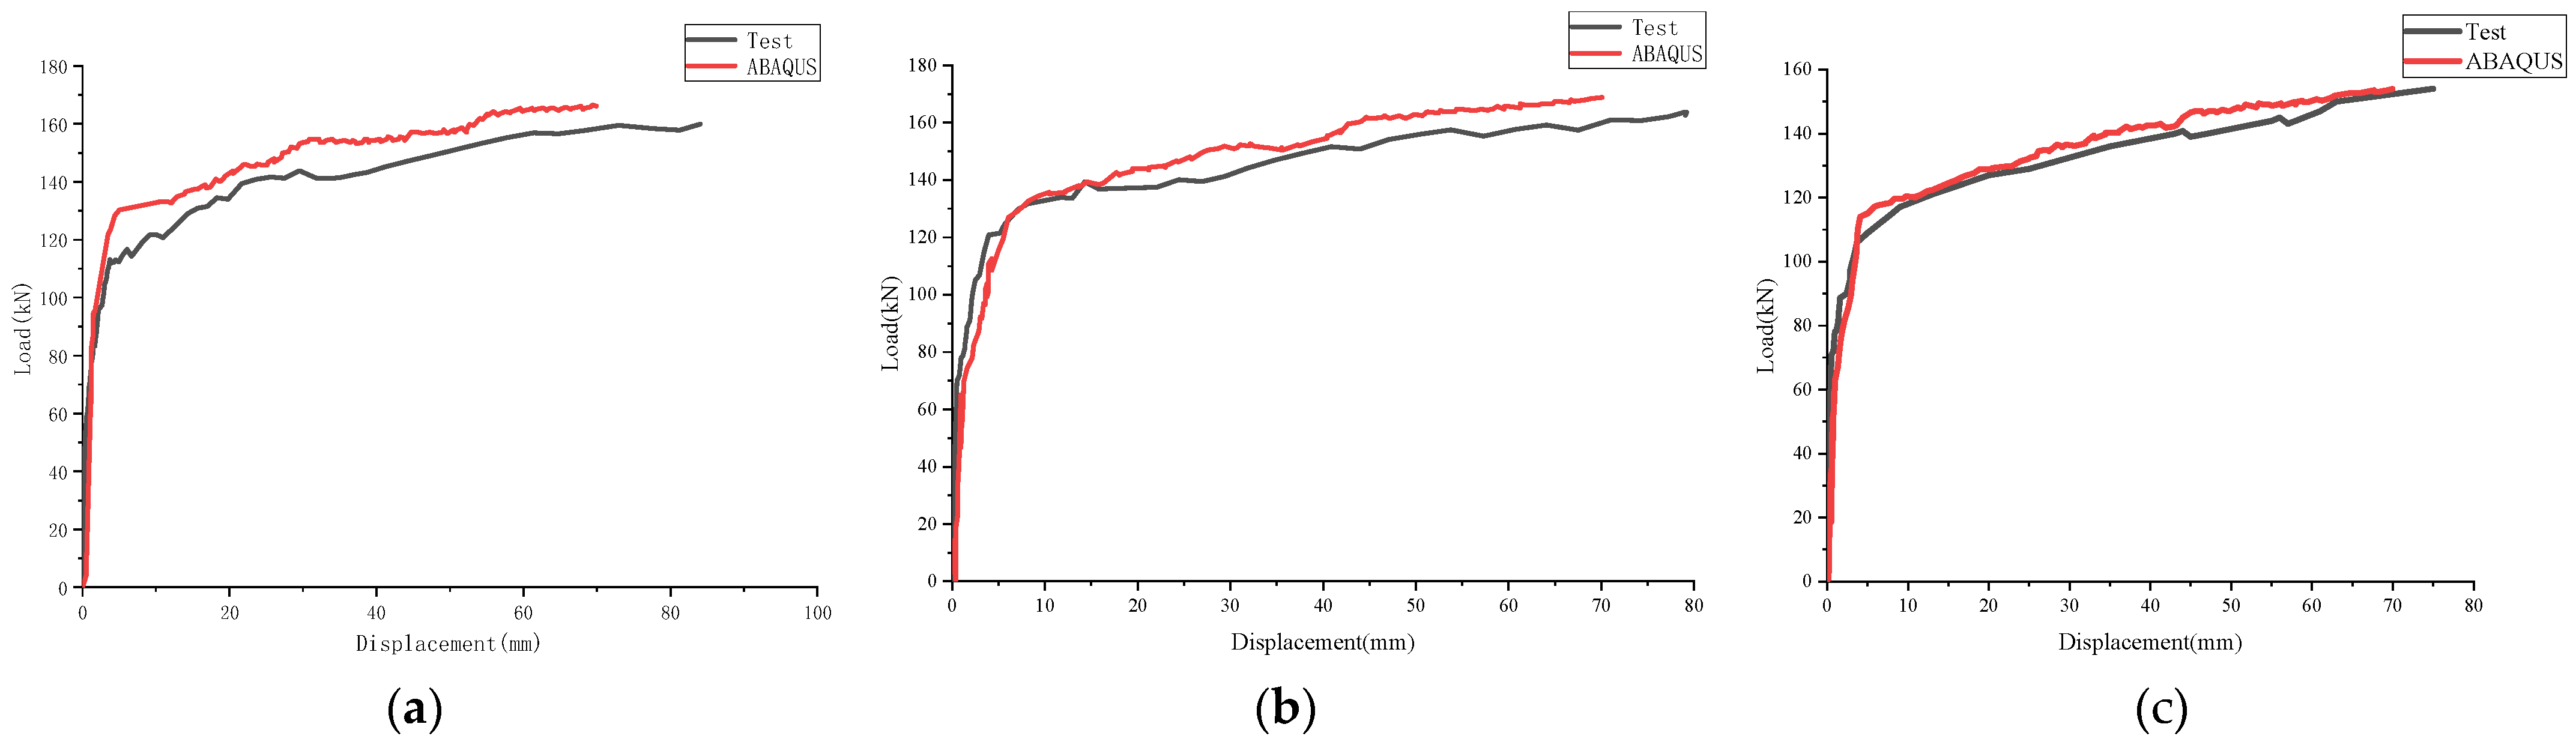
4.3. Results of Numerical Simulation
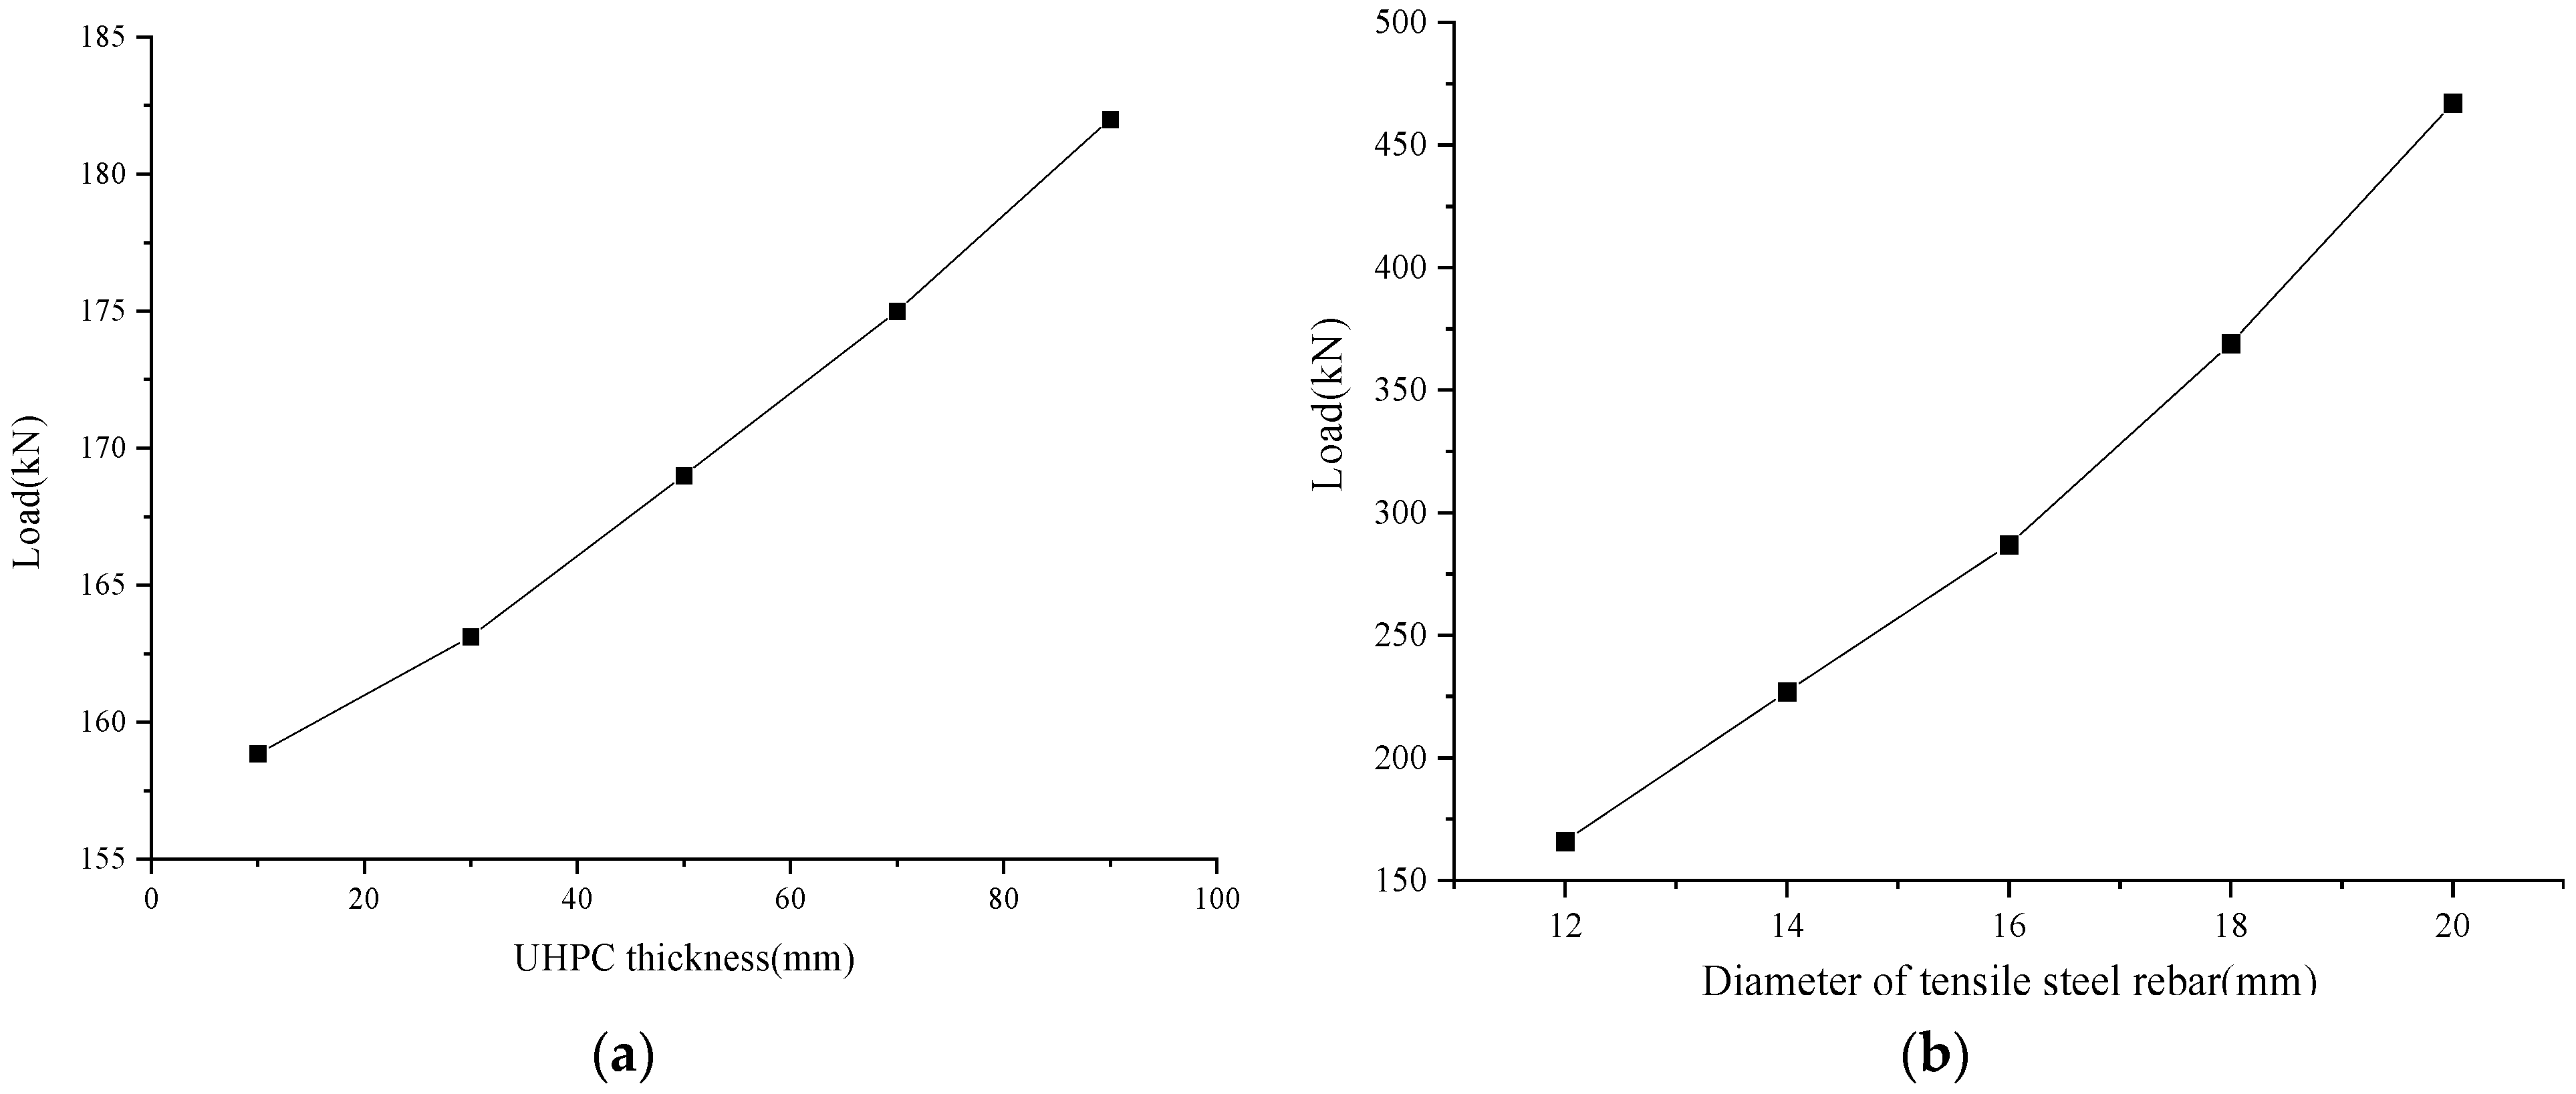
4.4. Parametric Analysis
- (1)
- UHPC thickness
- (2)
- Tensile reinforcement ratio
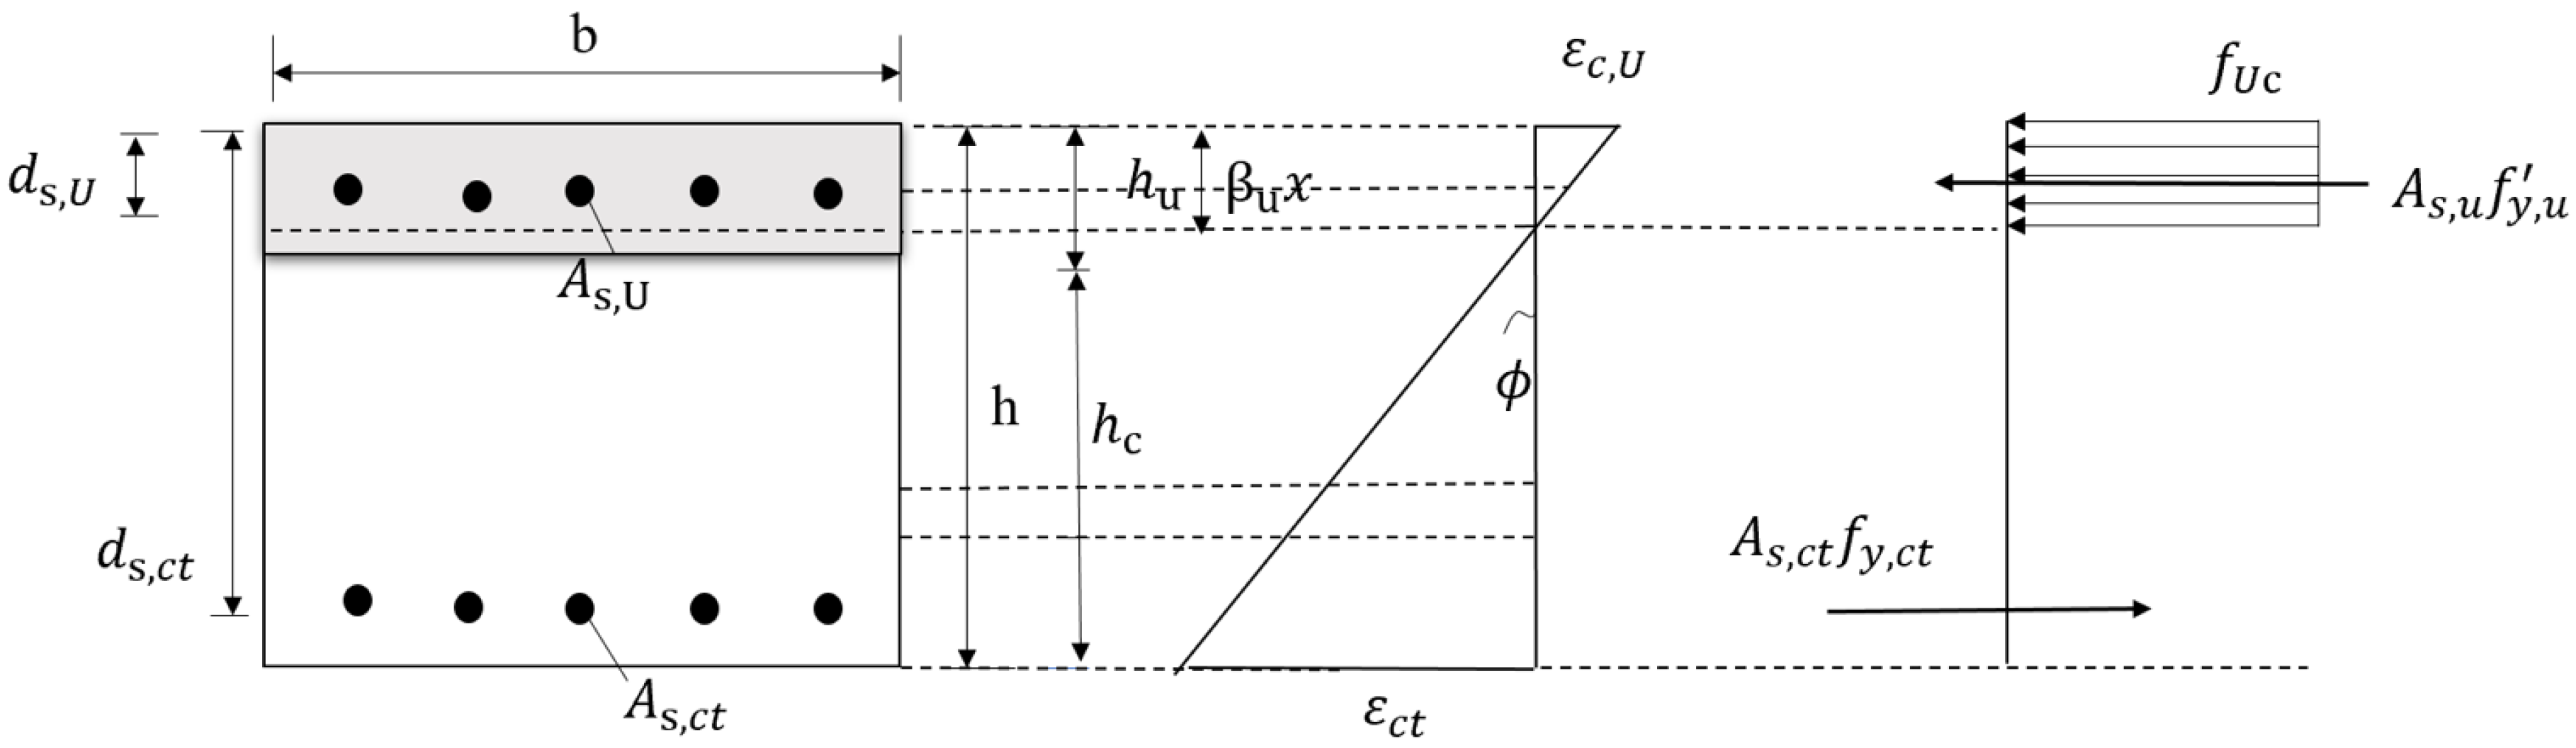
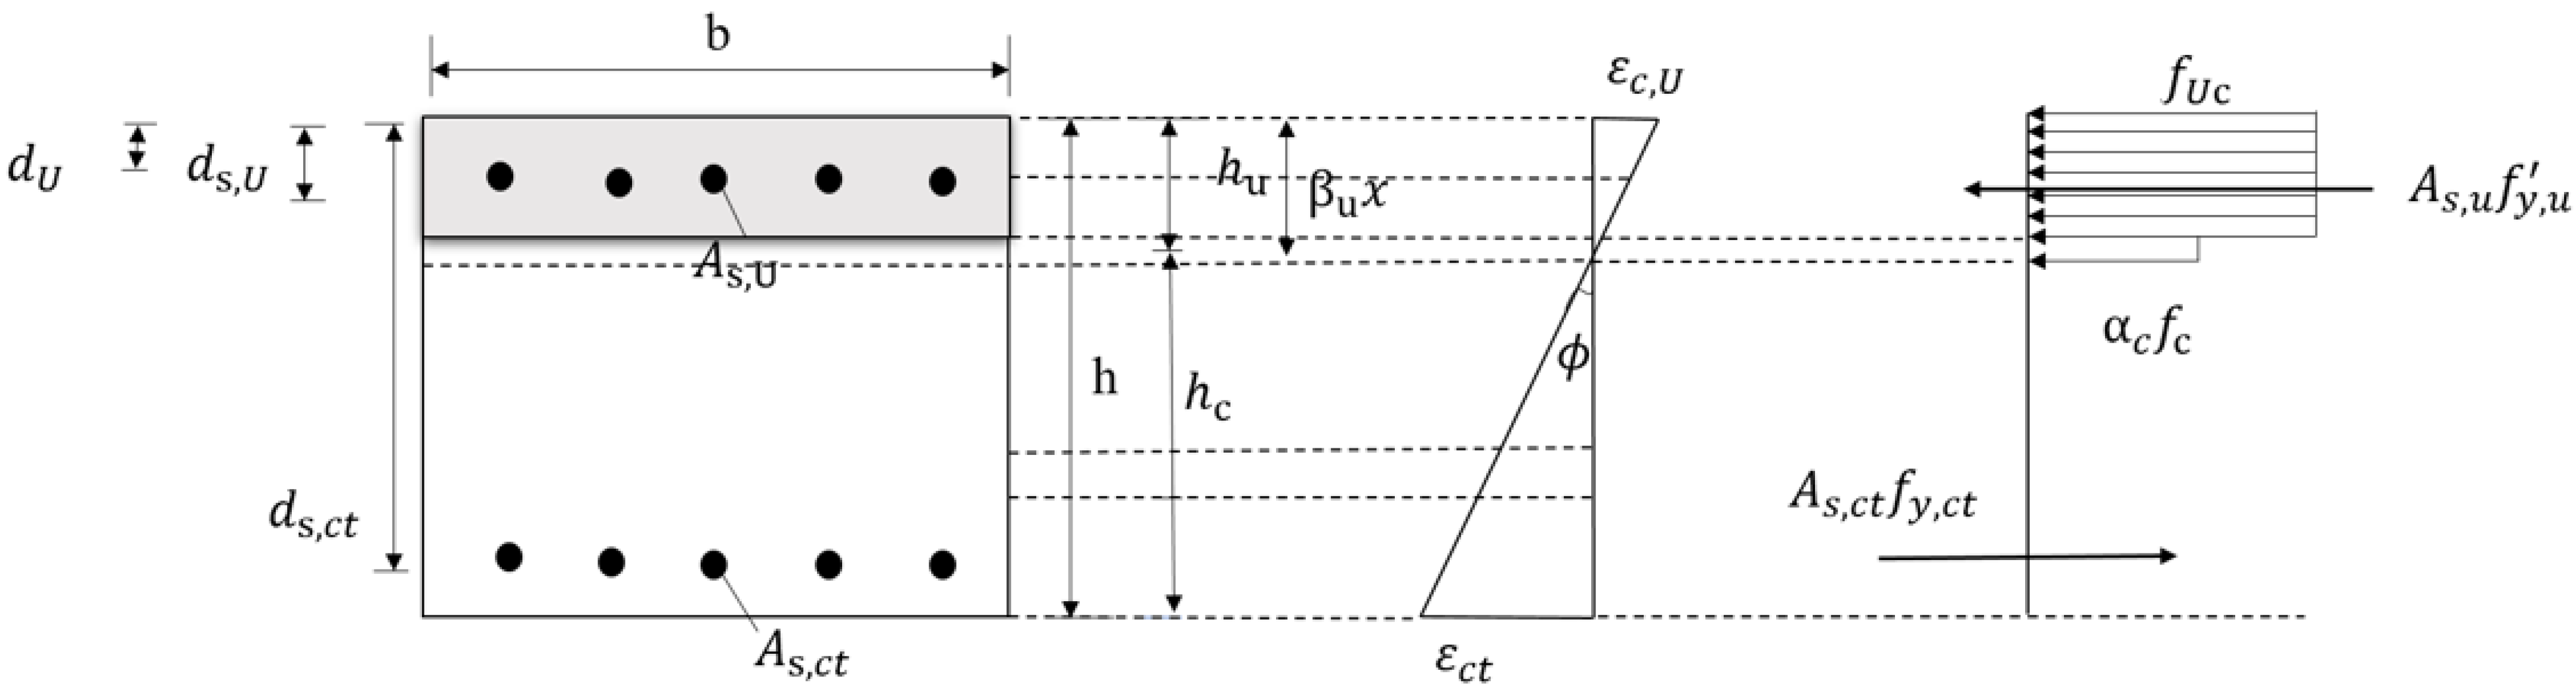
5. Theoretical Study on the Bending Failure of UHPC–NC Composite Slabs
- (1)
- (2)
6. Conclusions
- (1)
- During the loading process, the bonding between UHPC and ordinary concrete was good, and there was no relative displacement at both ends. The two materials bore the load together as a whole. Therefore, the joint surface of the two met the requirements of interface bonding by chiseling.
- (2)
- Bending failure of the composite slabs occurred, and all of the slabs involved the failure of the reinforced beam; that is, after the tensile longitudinal reinforcement had yielded first, some of the UHPC in the compression zone was crushed and destroyed. After the tensile steel rebars yielded, the width of the main crack continued to grow, and the displacement of the beam’s body continued to increase, resisting the external load. Finally, the UHPC in the compression zone was crushed and destroyed. Due to the high strength of the UHPC, only the local area of concrete was crushed when it was destroyed.
- (3)
- The factors affecting the flexural capacity of composite slabs included the UHPC’s thickness and tensile reinforcement ratio. According to the results of this study, increasing the thickness of the UHPC significantly improved the flexural capacity of the composite slab, and the maximum increase was about 15%. Increasing the reinforcement ratio of tensile steel rebars also had an increasing effect, with a maximum increase of about 181%.
- (4)
- A formula for calculating the flexural load capacity of the combined slabs where UHPC was in the compression zone was proposed, and the results of the calculation were in good agreement with the test values, with relatively small errors. Moreover, the formula could effectively calculate the flexural load capacity of the UHPC–NC combined slab.
- (5)
- The size of the components in this test was limited by the test environment. In subsequent research, experiments could be conducted on on-site components in actual engineering to avoid the influence of size effects.
- (6)
- The calculation formula proposed in this article was in good agreement with the experimental results. However, due to the limited sample size, these formulas are primarily intended as a reference in bridge design. Further experimental data are required for validation and refinement before they can be applied in the design of actual bridges.
Author Contributions
Funding
Institutional Review Board Statement
Informed Consent Statement
Data Availability Statement
Conflicts of Interest
References
- Habel, K.; Denarié, E.; Brühwiler, E. Time Dependent Behavior of Elements Combining Ultra-High Performance Fiber Reinforced Concretes (UHPFRC) and Reinforced Concrete. Mater. Struct. 2006, 39, 557–569. [Google Scholar] [CrossRef]
- Denarie, E.; Bruhwiler, E. Structural Rehabilitations with Ultra-High Performance Fibre Reinforced Concretes (UHPFRC). Restor. Build. Monum. 2006, 12, 453–468. [Google Scholar]
- Voo, Y.L.; Foster, S.; Pek, L.G. Ultra-High Performance Concrete—Technology for Present and Future. In Proceedings of the High Tech Concrete: Where Technology and Engineering Meet, Maastricht, The Netherlands, 12–14 June 2017; pp. 12–14. [Google Scholar]
- Liu, C.; Chen, Y.; Yang, S.; Gao, M.; Wang, F. Design and Research of 56m UHPC Composite Simple Supported Beam of ShibaliBao Super Large Bridge of Lanzhou-Zhangye High Speed Railway. Chin. Civ. Eng. J. 2020, 64, 57–61. [Google Scholar]
- Habel, K. Structural Behaviour of Elements Combining Ultra-High Performance Fibre Reinforced Concretes (UHPFRC) and Reinforced Concrete; EPFL: Lausanne, Switzerland, 2004. [Google Scholar]
- Zanuy, C.; Ulzurrun, G.S. Bending Model for Composite UHPFRC-RC Elements Including Tension Stiffening and Crack Width. Eng. Struct. 2020, 209, 109958. [Google Scholar] [CrossRef]
- Yin, H.; Teo, W.; Shirai, K. Experimental Investigation on the Behaviour of Reinforced Concrete Slabs Strengthened with Ultra-High Performance Concrete. Constr. Build. Mater. 2017, 155, 463–474. [Google Scholar] [CrossRef]
- Hou, L.; Wang, J.; Huang, T.; Shen, C.; Aslani, F.; Chen, D. Flexural Behaviour of Corroded Reinforced Concrete Beams Repaired with Ultra-High Toughness Cementitious Composite. Constr. Build. Mater. 2019, 211, 1127–1137. [Google Scholar] [CrossRef]
- Liao, Z. Experimental Research on Bond Strength of UHPC-NC Interface. Master’s Thesis, Hunan University, Changsha, China, 2019. [Google Scholar]
- Prem, P.R.; Murthy, A.R. Acoustic Emission and Flexural Behaviour of RC Beams Strengthened with UHPC Overlay. Constr. Build. Mater. 2016, 123, 481–492. [Google Scholar] [CrossRef]
- Liu, C.; Sun, Q.; Zhou, Y. Experimental Study on Bending Performance of Ultra-high Performance Concrete-Normal Concrete Composite Simply Supported Beam. J. Tongji Univ. (Nat. Sci.) 2020, 48, 664–672+701. [Google Scholar]
- Zingaila, T.; Augonis, M.; Arruda, M.R.T.; Šerelis, E.; Kelpša, Š. Experimental and Numerical Analysis of Flexural Concrete-UHPFRC/RC Composite Members. Mechanika 2017, 23, 182–189. [Google Scholar] [CrossRef]
- Li, Z.; Zhao, H.; Zhu, P.; Ma, P.; Zhuo, Y. Test and Finite Element Analysis on Bending Performance of UHPC-NC Composite Structure. Highw. Eng. 2019, 44, 194–200. [Google Scholar]
- Yan, B.; Qiu, M.; Zeng, T.; Shao, X.; Zhu, Y.; Li, M. Full-Scale Experimental Verification of UHPC-RC Composite Slab Culvert with a Clear Span of 8 m. J. Bridge Eng. 2020, 25, 05020010. [Google Scholar] [CrossRef]
- Deng, Z.; Zhang, W. Flexural performance of reinforced concrete beams reinforced with hybrid fiber reactive powder concrete. J. Harbin Eng. Univ. 2015, 36, 1199–1205. [Google Scholar]
- Zhang, Y.; Huang, S.; Liu, Y.; Shao, X. Experimental Study on Flexural Behavior of RC Beams Strengthened with Prestressed Ultra-high Performance Concrete. J. Hunan Univ. (Nat. Sci.) 2022, 49, 23–31. [Google Scholar]
- Paschalis, S.A.; Lampropoulos, A.P.; Tsioulou, O. Experimental and Numerical Study of the Performance of Ultra High Performance Fiber Reinforced Concrete for the Flexural Strengthening of Full Scale Reinforced Concrete Members. Constr. Build. Mater. 2018, 186, 351–366. [Google Scholar] [CrossRef]
- Ganesh, P.; Ramachandra Murthy, A. Analytical Model to Predict the Fatigue Life of Damaged RC Beam Strengthened with GGBS Based UHPC. Structures 2021, 33, 2559–2569. [Google Scholar] [CrossRef]
- Tanarslan, H.M.; Alver, N.; Jahangiri, R.; Yalçınkaya, Ç.; Yazıcı, H. Flexural Strengthening of RC Beams Using UHPFRC Laminates: Bonding Techniques and Rebar Addition. Constr. Build. Mater. 2017, 155, 45–55. [Google Scholar] [CrossRef]
- Safdar, M.; Matsumoto, T.; Kakuma, K. Flexural Behavior of Reinforced Concrete Beams Repaired with Ultra-High Performance Fiber Reinforced Concrete (UHPFRC). Compos. Struct. 2016, 157, 448–460. [Google Scholar] [CrossRef]
- Bruehwiler, E.; Bastien-Masse, M. Strengthening of the Chillon Highway Viaduct Deck Slab with Reinforced UHPFRC. In Maintenance, Monitoring, Safety, Risk and Resilience of Bridges and Bridge Networks; Bittencourt, T.N., Frangopol, D.M., Beck, A.T., Eds.; CRC Press: Foz do Iguacu, Brazil, 2016; pp. 212–213. [Google Scholar]
- Tayeh, B.A.; Abu Bakar, B.H.; Megat Johari, M.A.; Zeyad, A.M. Microstructural Analysis of the Adhesion Mechanism between Old Concrete Substrate and UHPFC. J. Adhes. Sci. Technol. 2014, 28, 1846–1864. [Google Scholar] [CrossRef]
- Hussein, L.; Amleh, L. Structural Behavior of Ultra-High Performance Fiber Reinforced Concrete-Normal Strength Concrete or High Strength Concrete Composite Members. Constr. Build. Mater. 2015, 93, 1105–1116. [Google Scholar] [CrossRef]
- Han, J. Research on Flexural Mechanism of RUHPC-RC Composite Beam. Master’s Thesis, Harbin Institute of Technology, Harbin, China, 2019. [Google Scholar]


| Cement | Silica Fume | Fine Filler | Fine Aggregate | Water | Superplasticizer |
|---|---|---|---|---|---|
| 1 | 0.176 | 0.311 | 1.400 | 0.222 | 0.027 |
| Fiber Shape | Tensile Strength (MPa) | Elastic Modulus (GPa) | Length (mm) | Diameter (μm) | Density (kg/m3) |
|---|---|---|---|---|---|
| Straight smooth | 2875 | 201 | 14 | 200 | 7850 |
| Material | Elastic Modulus Ec (GPa) | Compressive Strength fc (MPa) | Tensile Strength ft (MPa) |
|---|---|---|---|
| Concrete | 34,500 | 43.6 | 2.8 |
| UHPC | 47,600 | 122.83 | 11.3 |
| Steel Grade | Elastic Modulus Es (GPa) | Yield Strength fy (MPa) | Ultimate Strength fu (MPa) |
|---|---|---|---|
| HRB400 | 206,000 | 507.5 | 702.5 |
| Specimen | Material | Length (mm) | Width (mm) | Depth (mm) | UHPC Dimensions (mm) | NC Dimensions (mm) | ||
|---|---|---|---|---|---|---|---|---|
| Depth hu | Rebars | Depth hc | Rebars | |||||
| B-1 | UHPC and NC | 2000 | 350 | 250 | 50 | 2Φ8 | 200 | 3Φ12 |
| B-2 | UHPC and NC | 2000 | 350 | 250 | 50 | 2Φ8 | 200 | 2Φ16 |
| B-3 | UHPC and NC | 2000 | 350 | 250 | 50 | 2Φ8 | 200 | 2Φ12 |
| Specimen | Peak Load PT (kN) | Central Displacement at PT (mm) |
|---|---|---|
| B-1 | 161 | 85 |
| B-2 | 165 | 78 |
| B-3 | 150 | 72 |
| Specimen | Test PT (kN) | ABAQUS Pa (kN) | PT/Pa |
|---|---|---|---|
| B-1 | 161 | 166 | 0.95 |
| B-2 | 165 | 169 | 0.98 |
| B-3 | 150 | 154 | 0.97 |
| average | 0.97 | ||
| S.D. | 0.01 |
| Specimen | Length (mm) | Width (mm) | Depth (mm) | UHPC Depth hu (mm) | NC Depth hc (mm) | UHPC Rebars | NC Rebars | Tensile Reinforcement Ratio | Peak Load PT (kN) |
|---|---|---|---|---|---|---|---|---|---|
| B-U10 | 2000 | 350 | 250 | 10 | 240 | 2Φ8 | 3Φ12 | 0.39% | 159 |
| B-U30 | 2000 | 350 | 250 | 30 | 220 | 2Φ8 | 3Φ12 | 0.39% | 163 |
| B-U50 | 2000 | 350 | 250 | 50 | 200 | 2Φ8 | 3Φ12 | 0.39% | 169 |
| B-U70 | 2000 | 350 | 250 | 70 | 180 | 2Φ8 | 3Φ12 | 0.39% | 175 |
| B-U90 | 2000 | 350 | 250 | 90 | 160 | 2Φ8 | 3Φ12 | 0.39% | 182 |
| B-S12 | 2000 | 350 | 250 | 10 | 240 | 2Φ8 | 3Φ12 | 0.39% | 166 |
| B-S14 | 2000 | 350 | 250 | 30 | 220 | 2Φ8 | 3Φ14 | 0.53% | 227 |
| B-S16 | 2000 | 350 | 250 | 50 | 200 | 2Φ8 | 3Φ16 | 0.69% | 287 |
| B-S18 | 2000 | 350 | 250 | 70 | 180 | 2Φ8 | 3Φ18 | 0.87% | 369 |
| B-S20 | 2000 | 350 | 250 | 90 | 160 | 2Φ8 | 3Φ20 | 1.08% | 467 |
| Specimen | Test MT | Formula Mu | MT/Mu |
|---|---|---|---|
| B-1 | 48.3 | 47.1 | 1.03 |
| B-2 | 49.5 | 46.3 | 1.07 |
| B-3 | 45 | 42.5 | 1.06 |
| B-U10 | 47.7 | 47.1 | 1.01 |
| B-U30 | 48.9 | 47.1 | 1.04 |
| B-U50 | 50.7 | 47.1 | 1.08 |
| B-U70 | 52.5 | 47.1 | 1.11 |
| B-U90 | 54.6 | 47.1 | 1.16 |
| B-S12 | 49.8 | 47.1 | 1.06 |
| B-S14 | 68.1 | 65.9 | 1.03 |
| B-S16 | 86.1 | 87.4 | 0.99 |
| B-S18 | 110.7 | 111.6 | 0.99 |
| B-S20 | 140.1 | 138.4 | 1.01 |
| Average | 1.04 | ||
| S.D. | 0.05 |
Disclaimer/Publisher’s Note: The statements, opinions and data contained in all publications are solely those of the individual author(s) and contributor(s) and not of MDPI and/or the editor(s). MDPI and/or the editor(s) disclaim responsibility for any injury to people or property resulting from any ideas, methods, instructions or products referred to in the content. |
© 2024 by the authors. Licensee MDPI, Basel, Switzerland. This article is an open access article distributed under the terms and conditions of the Creative Commons Attribution (CC BY) license (https://creativecommons.org/licenses/by/4.0/).
Share and Cite
Sun, Z.; Li, X.; Liu, C. Study on the Flexural Performance of Ultrahigh-Performance Concrete–Normal Concrete Composite Slabs. Materials 2024, 17, 4675. https://doi.org/10.3390/ma17184675
Sun Z, Li X, Liu C. Study on the Flexural Performance of Ultrahigh-Performance Concrete–Normal Concrete Composite Slabs. Materials. 2024; 17(18):4675. https://doi.org/10.3390/ma17184675
Chicago/Turabian StyleSun, Zizhou, Xianjing Li, and Chao Liu. 2024. "Study on the Flexural Performance of Ultrahigh-Performance Concrete–Normal Concrete Composite Slabs" Materials 17, no. 18: 4675. https://doi.org/10.3390/ma17184675