

Ammonia-Cyanuric Acid Co-Production in Boiler Denitrification System


Abstract
1. Introduction
2. Materials and Methods
2.1. Research Method
2.2. Experimental Instruments and Raw Materials
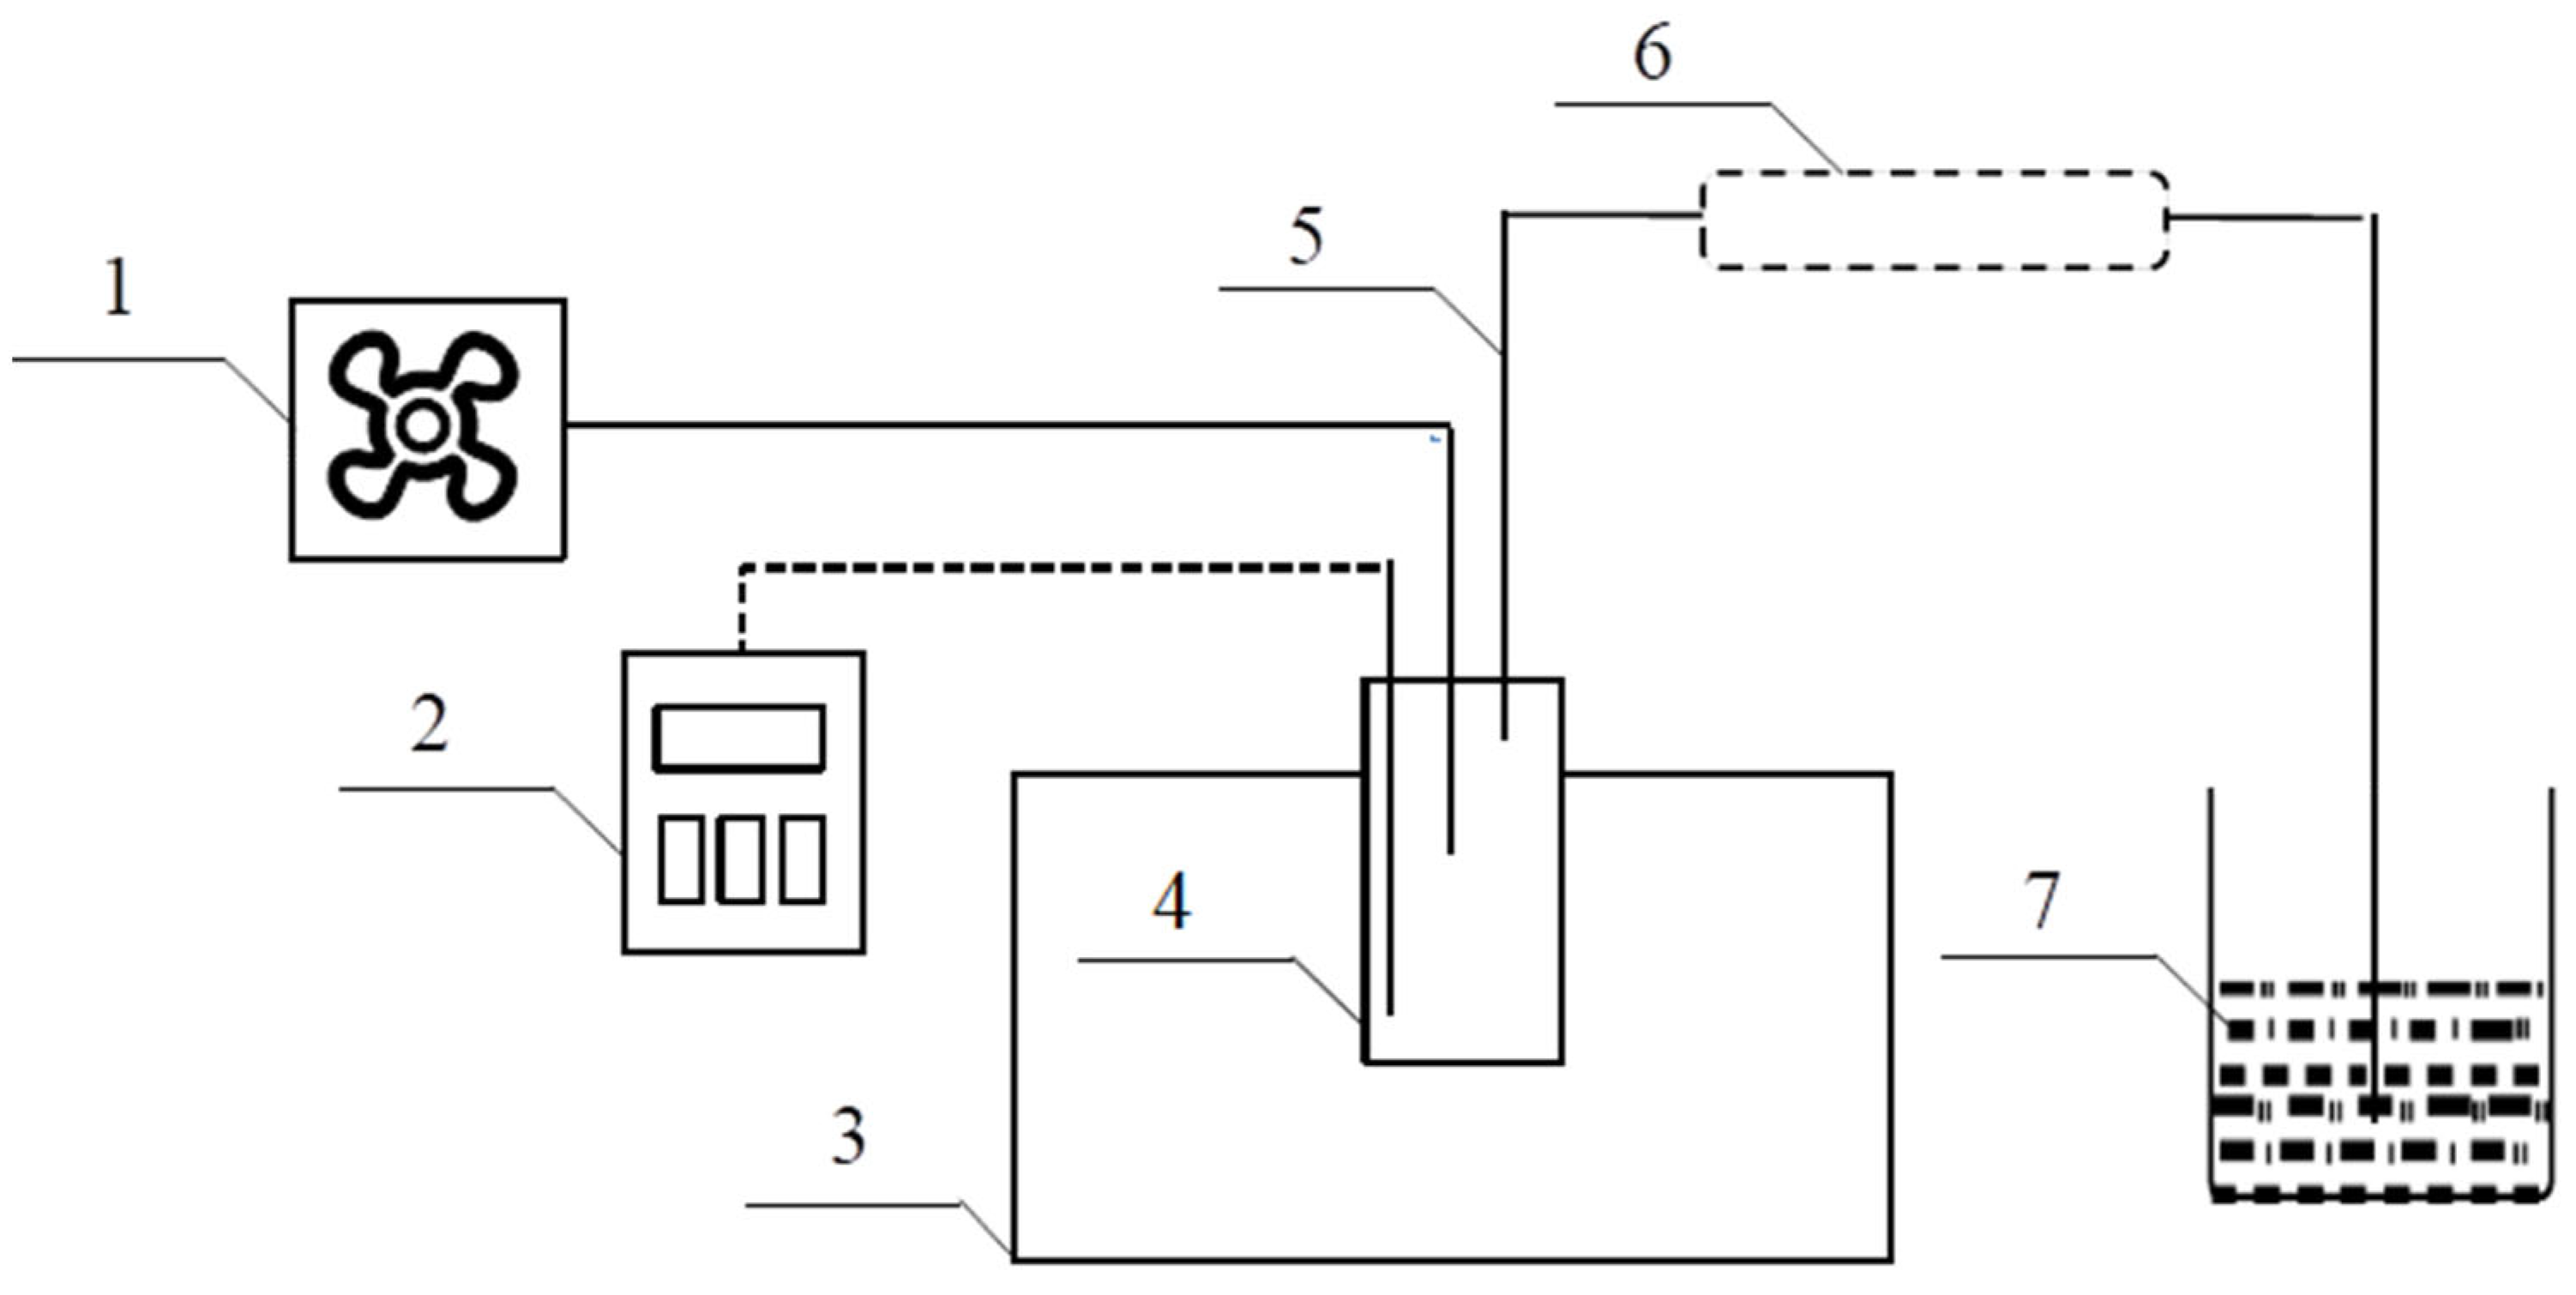
2.3. Experimental Process
2.4. Analytical Determination Method
- M: ammonia production, g;
- V: total volume of absorbed boric acid, mL;
- V0: volume of consumed hydrochloric acid, mL.
3. Results
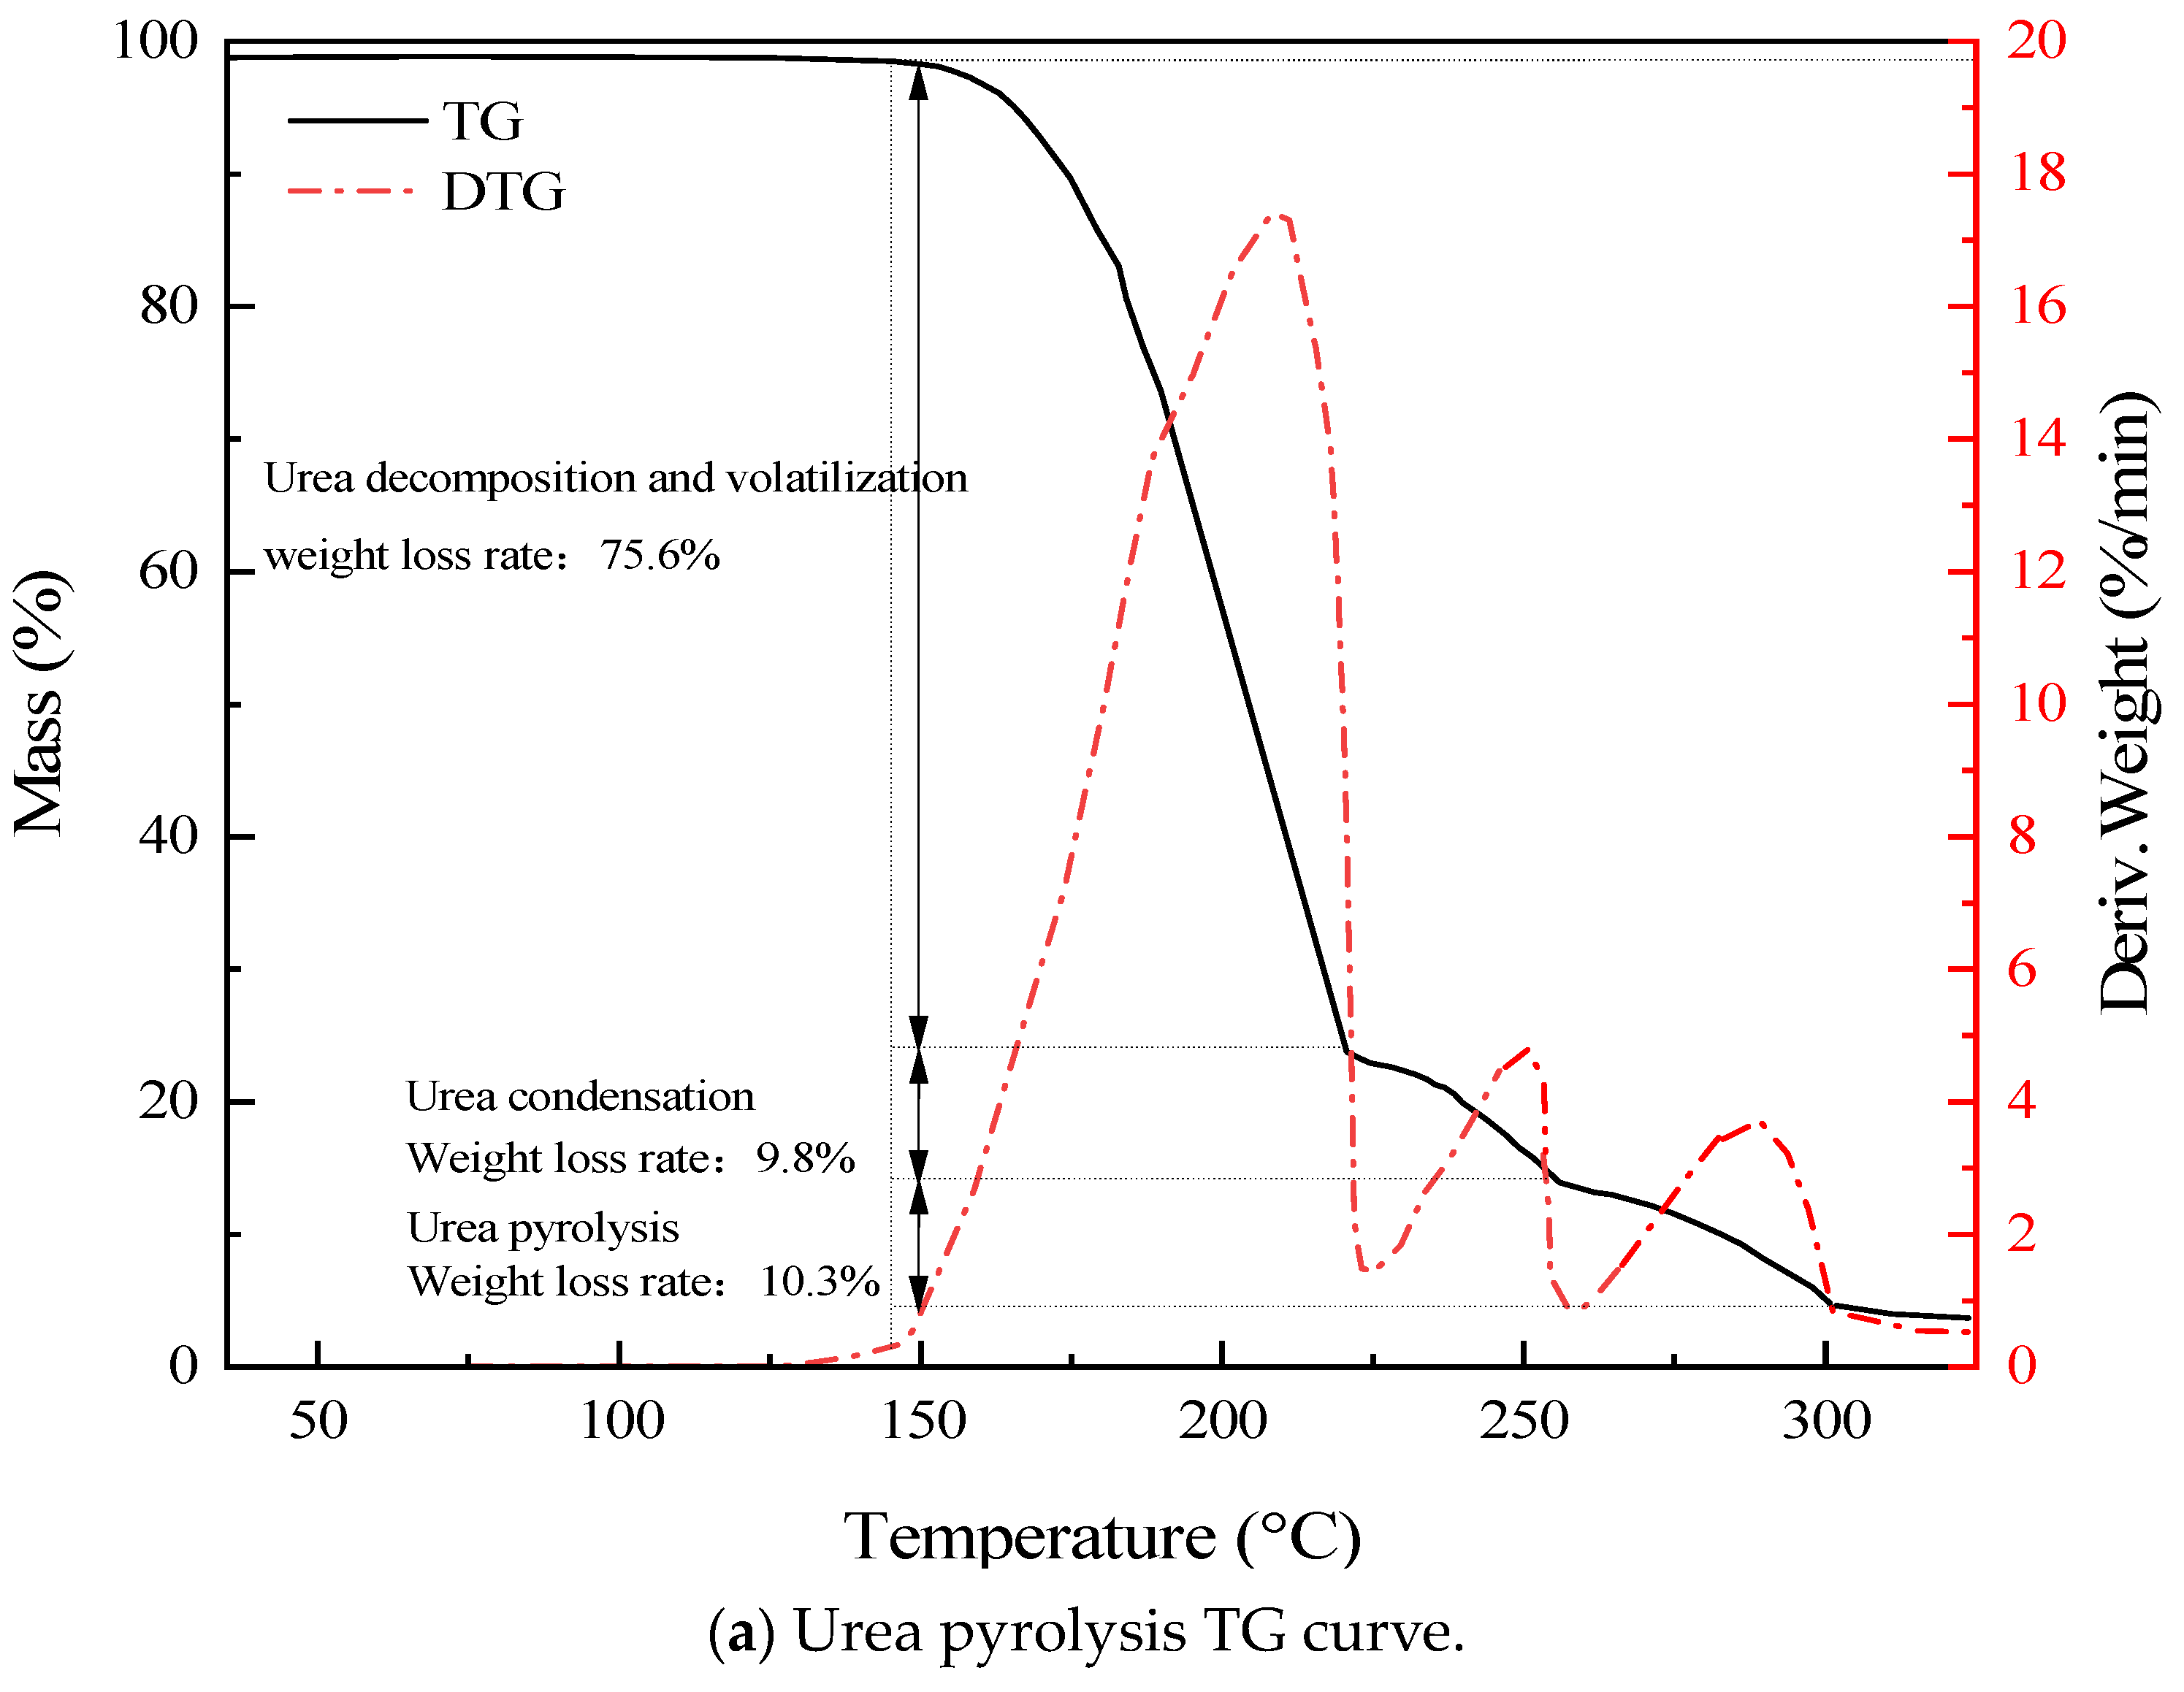
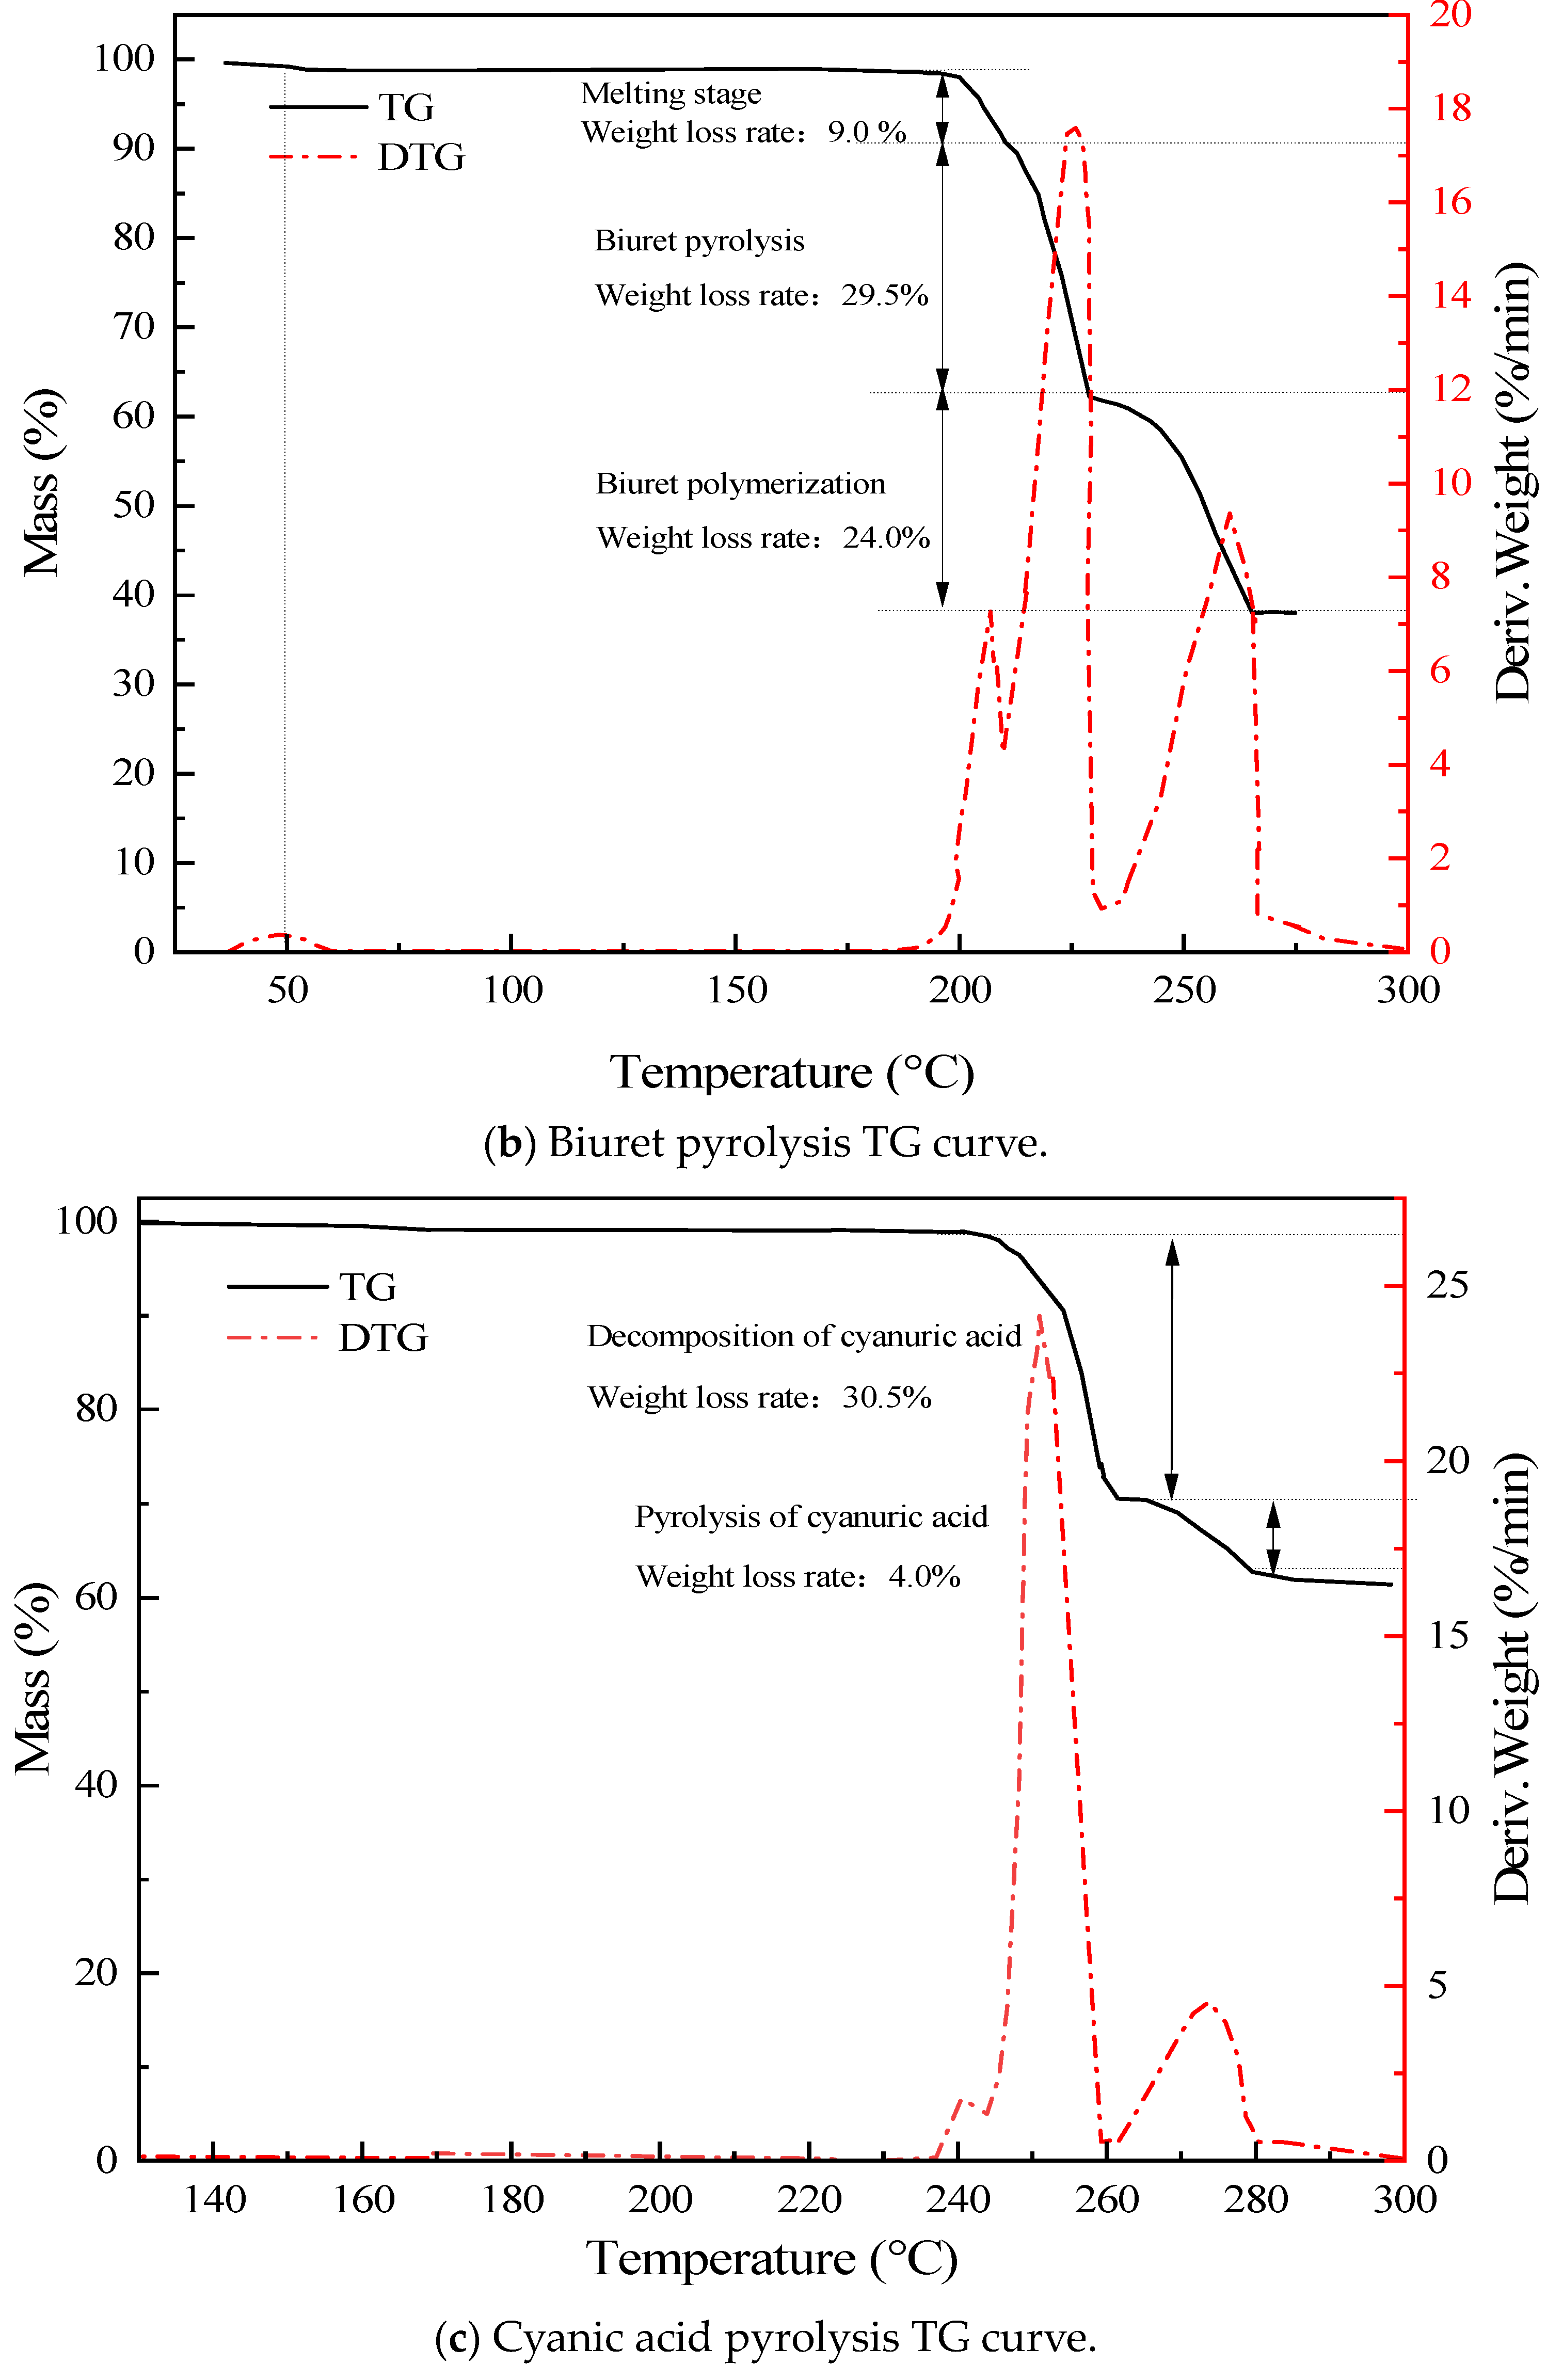
3.1. Thermal Stability Analysis
3.2. Urea Pyrolysis Experimental Analysis
3.3. Ammonia Release Characteristics Analysis
3.4. Aspen Plus Process Analysis
3.4.1. Aspen Plus Modeling
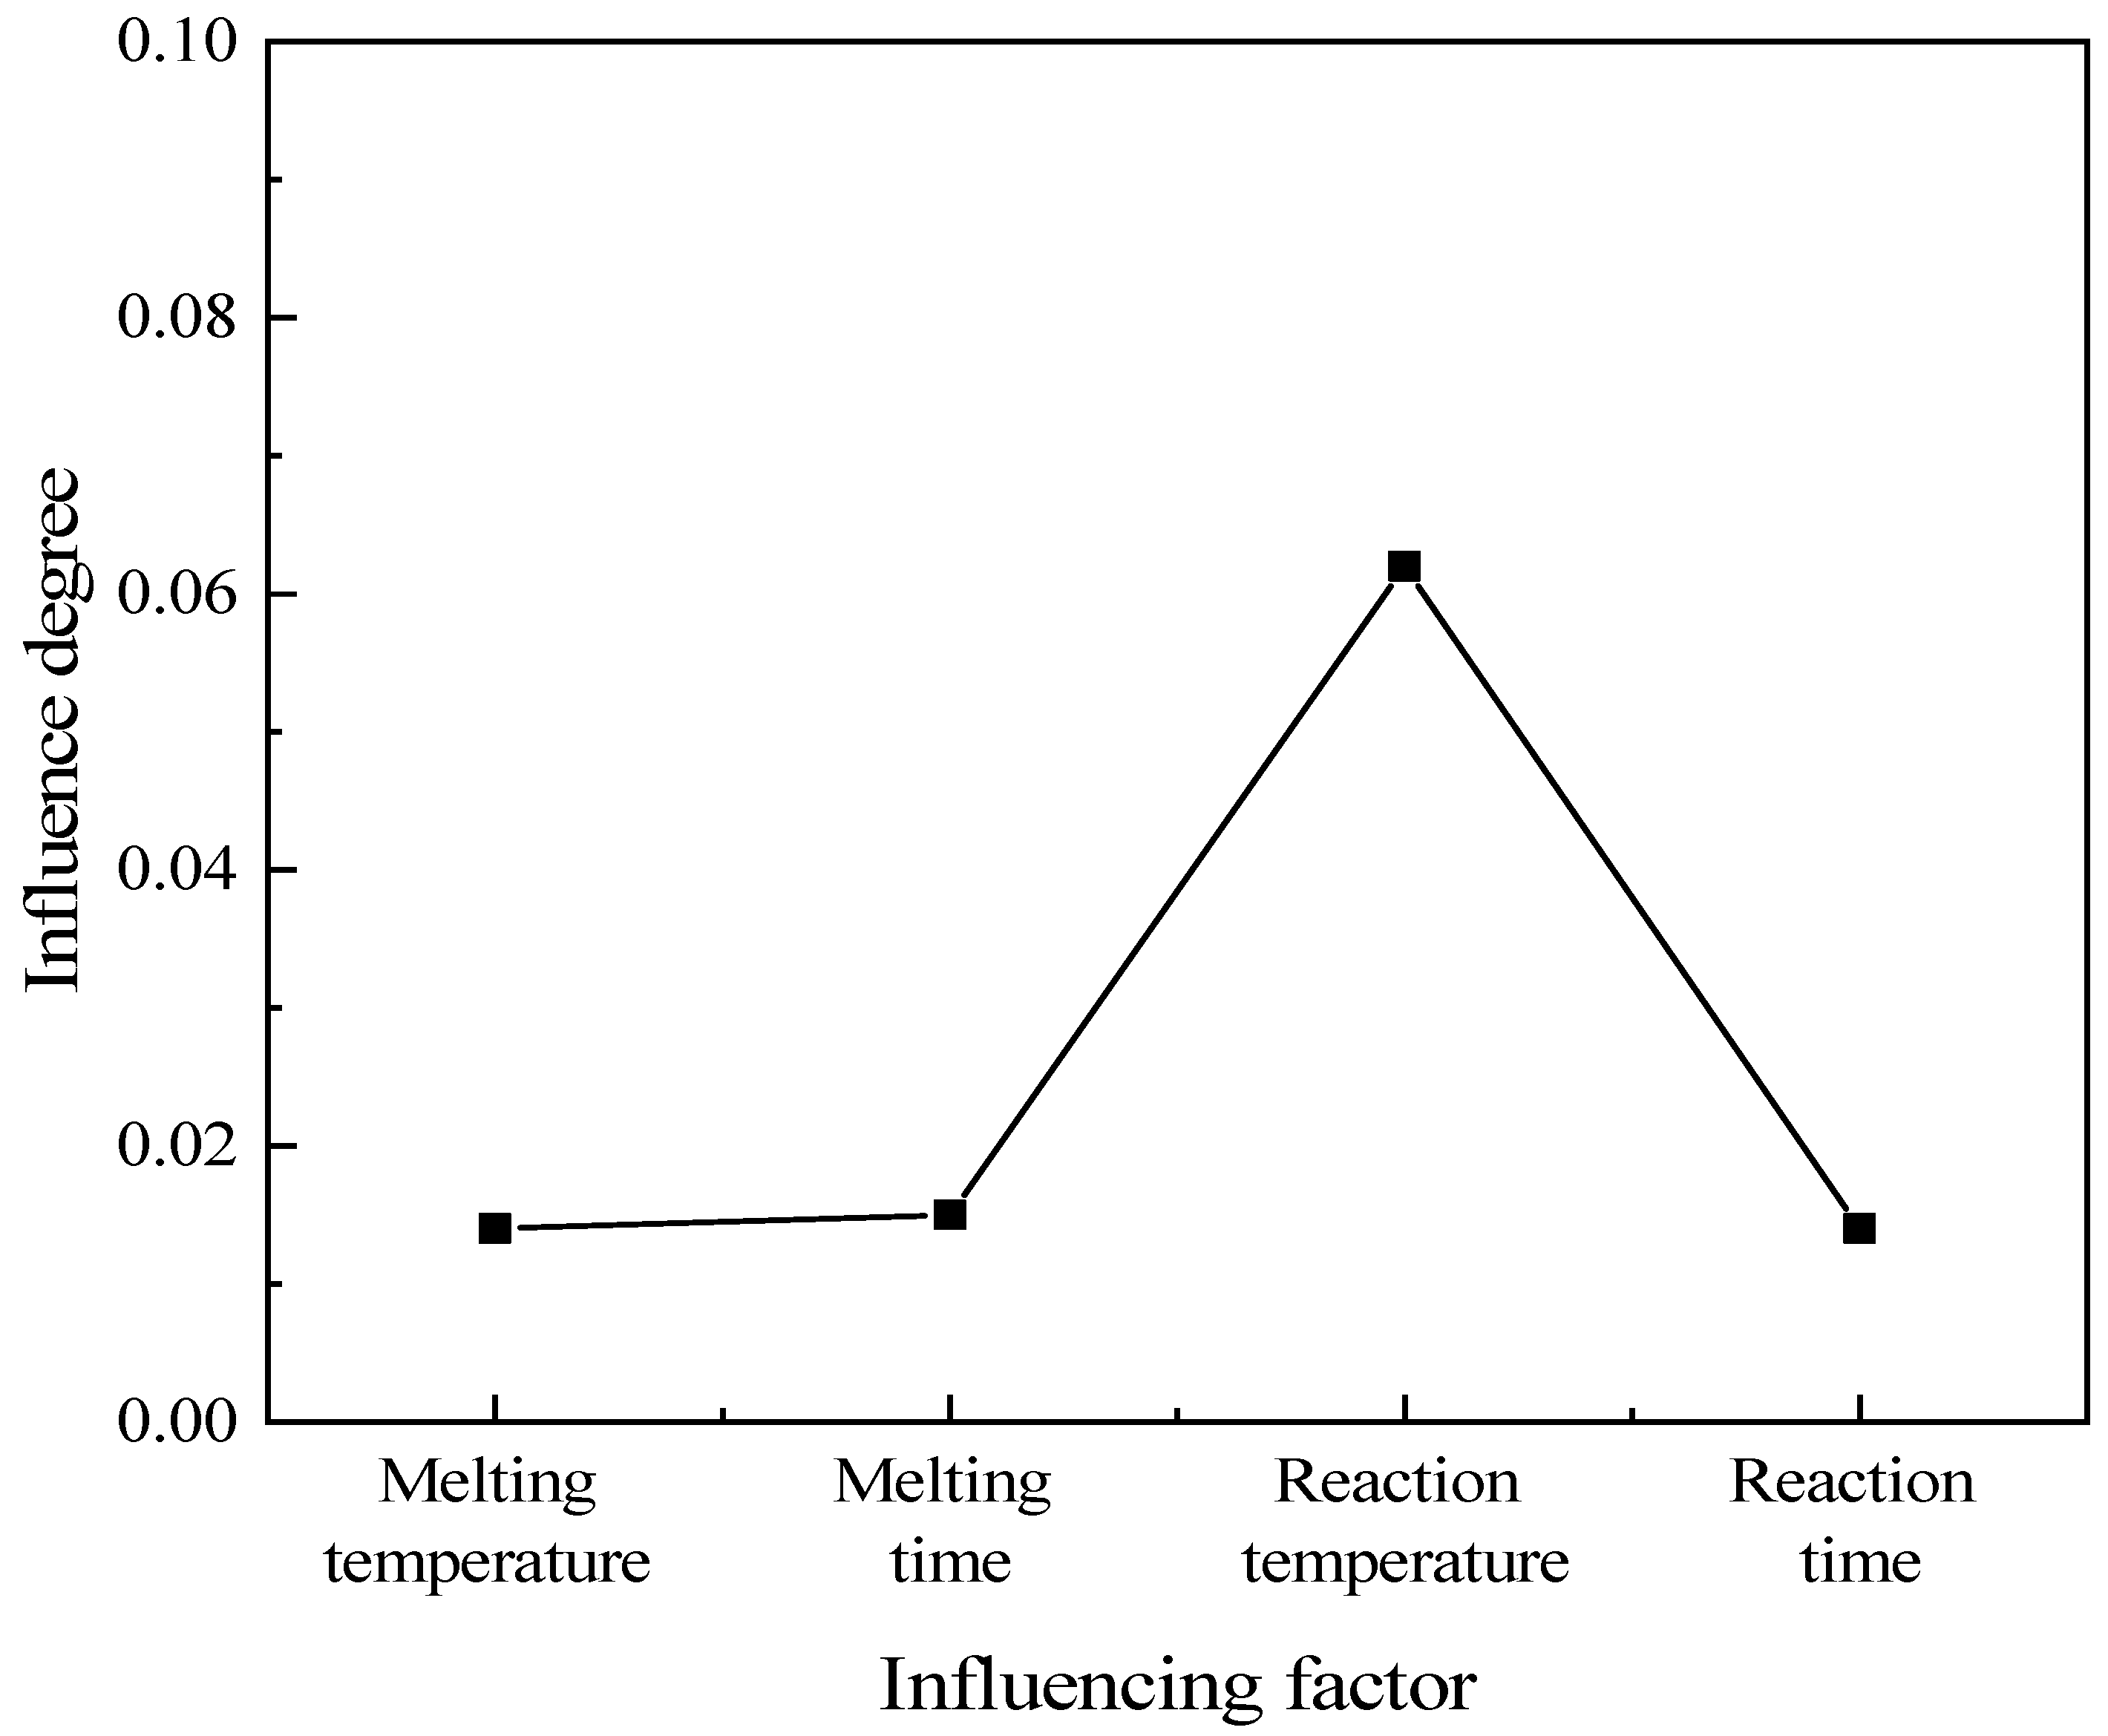
3.4.2. Analysis of Simulation Experiment Results
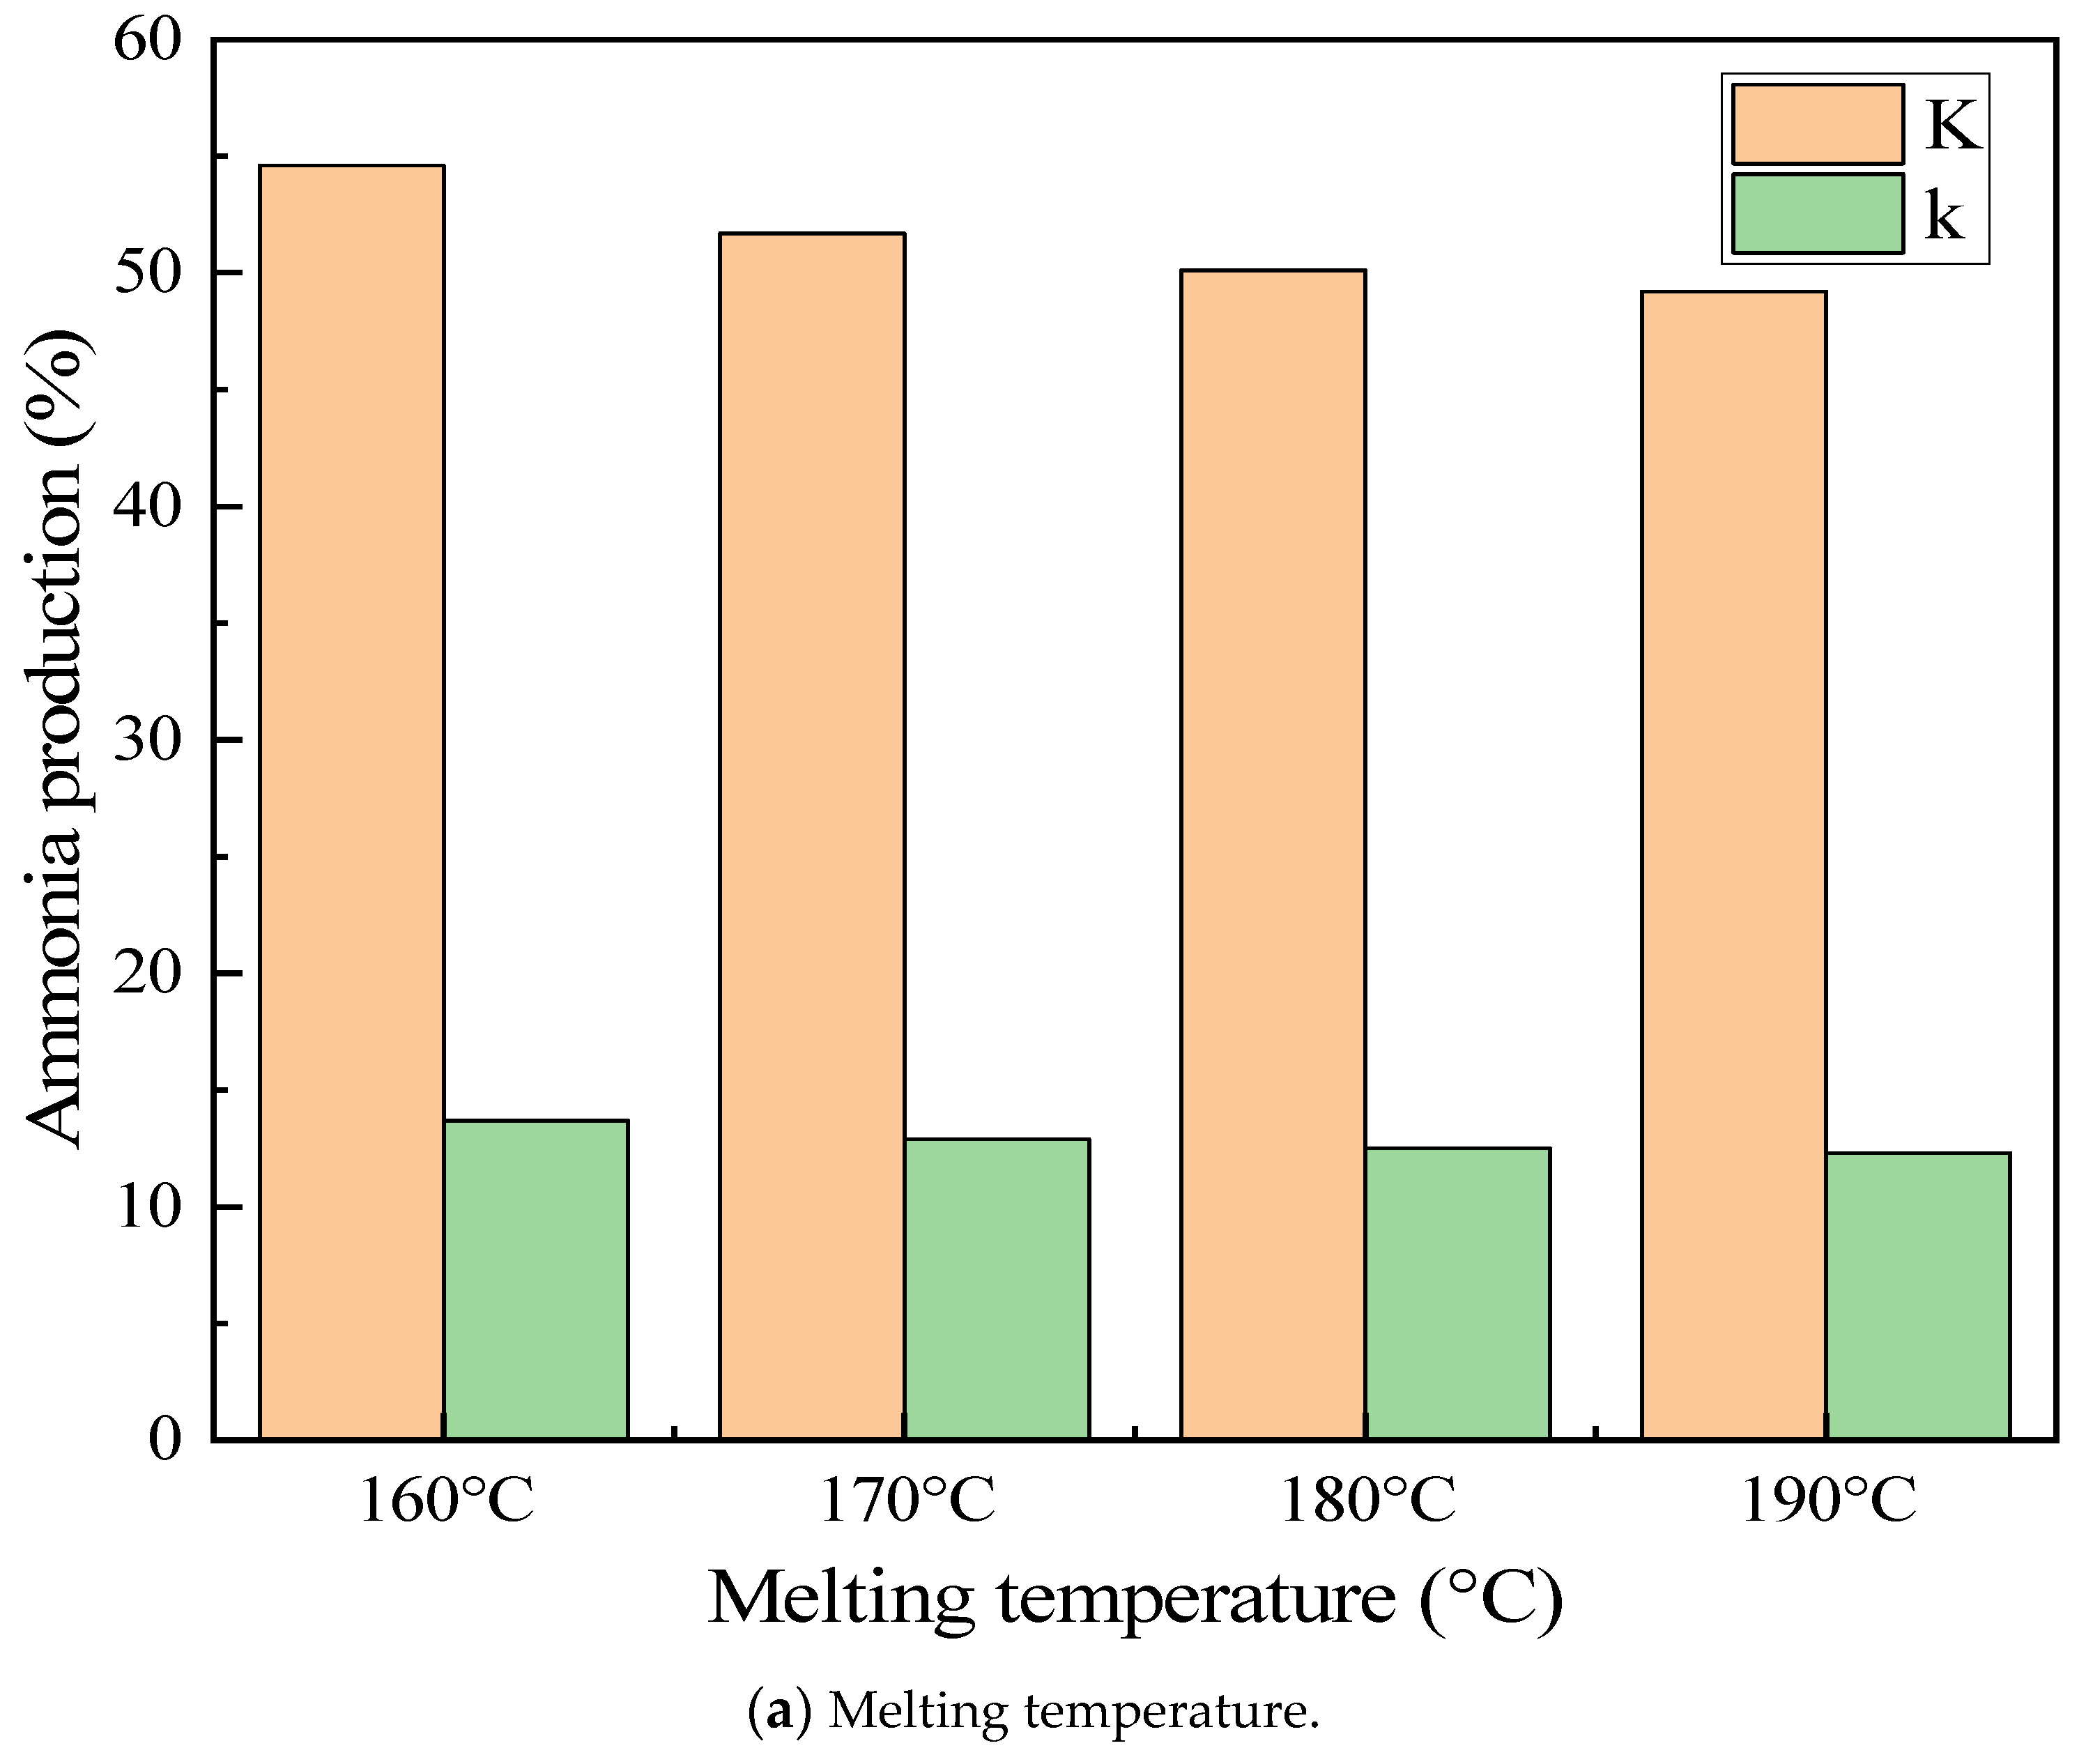
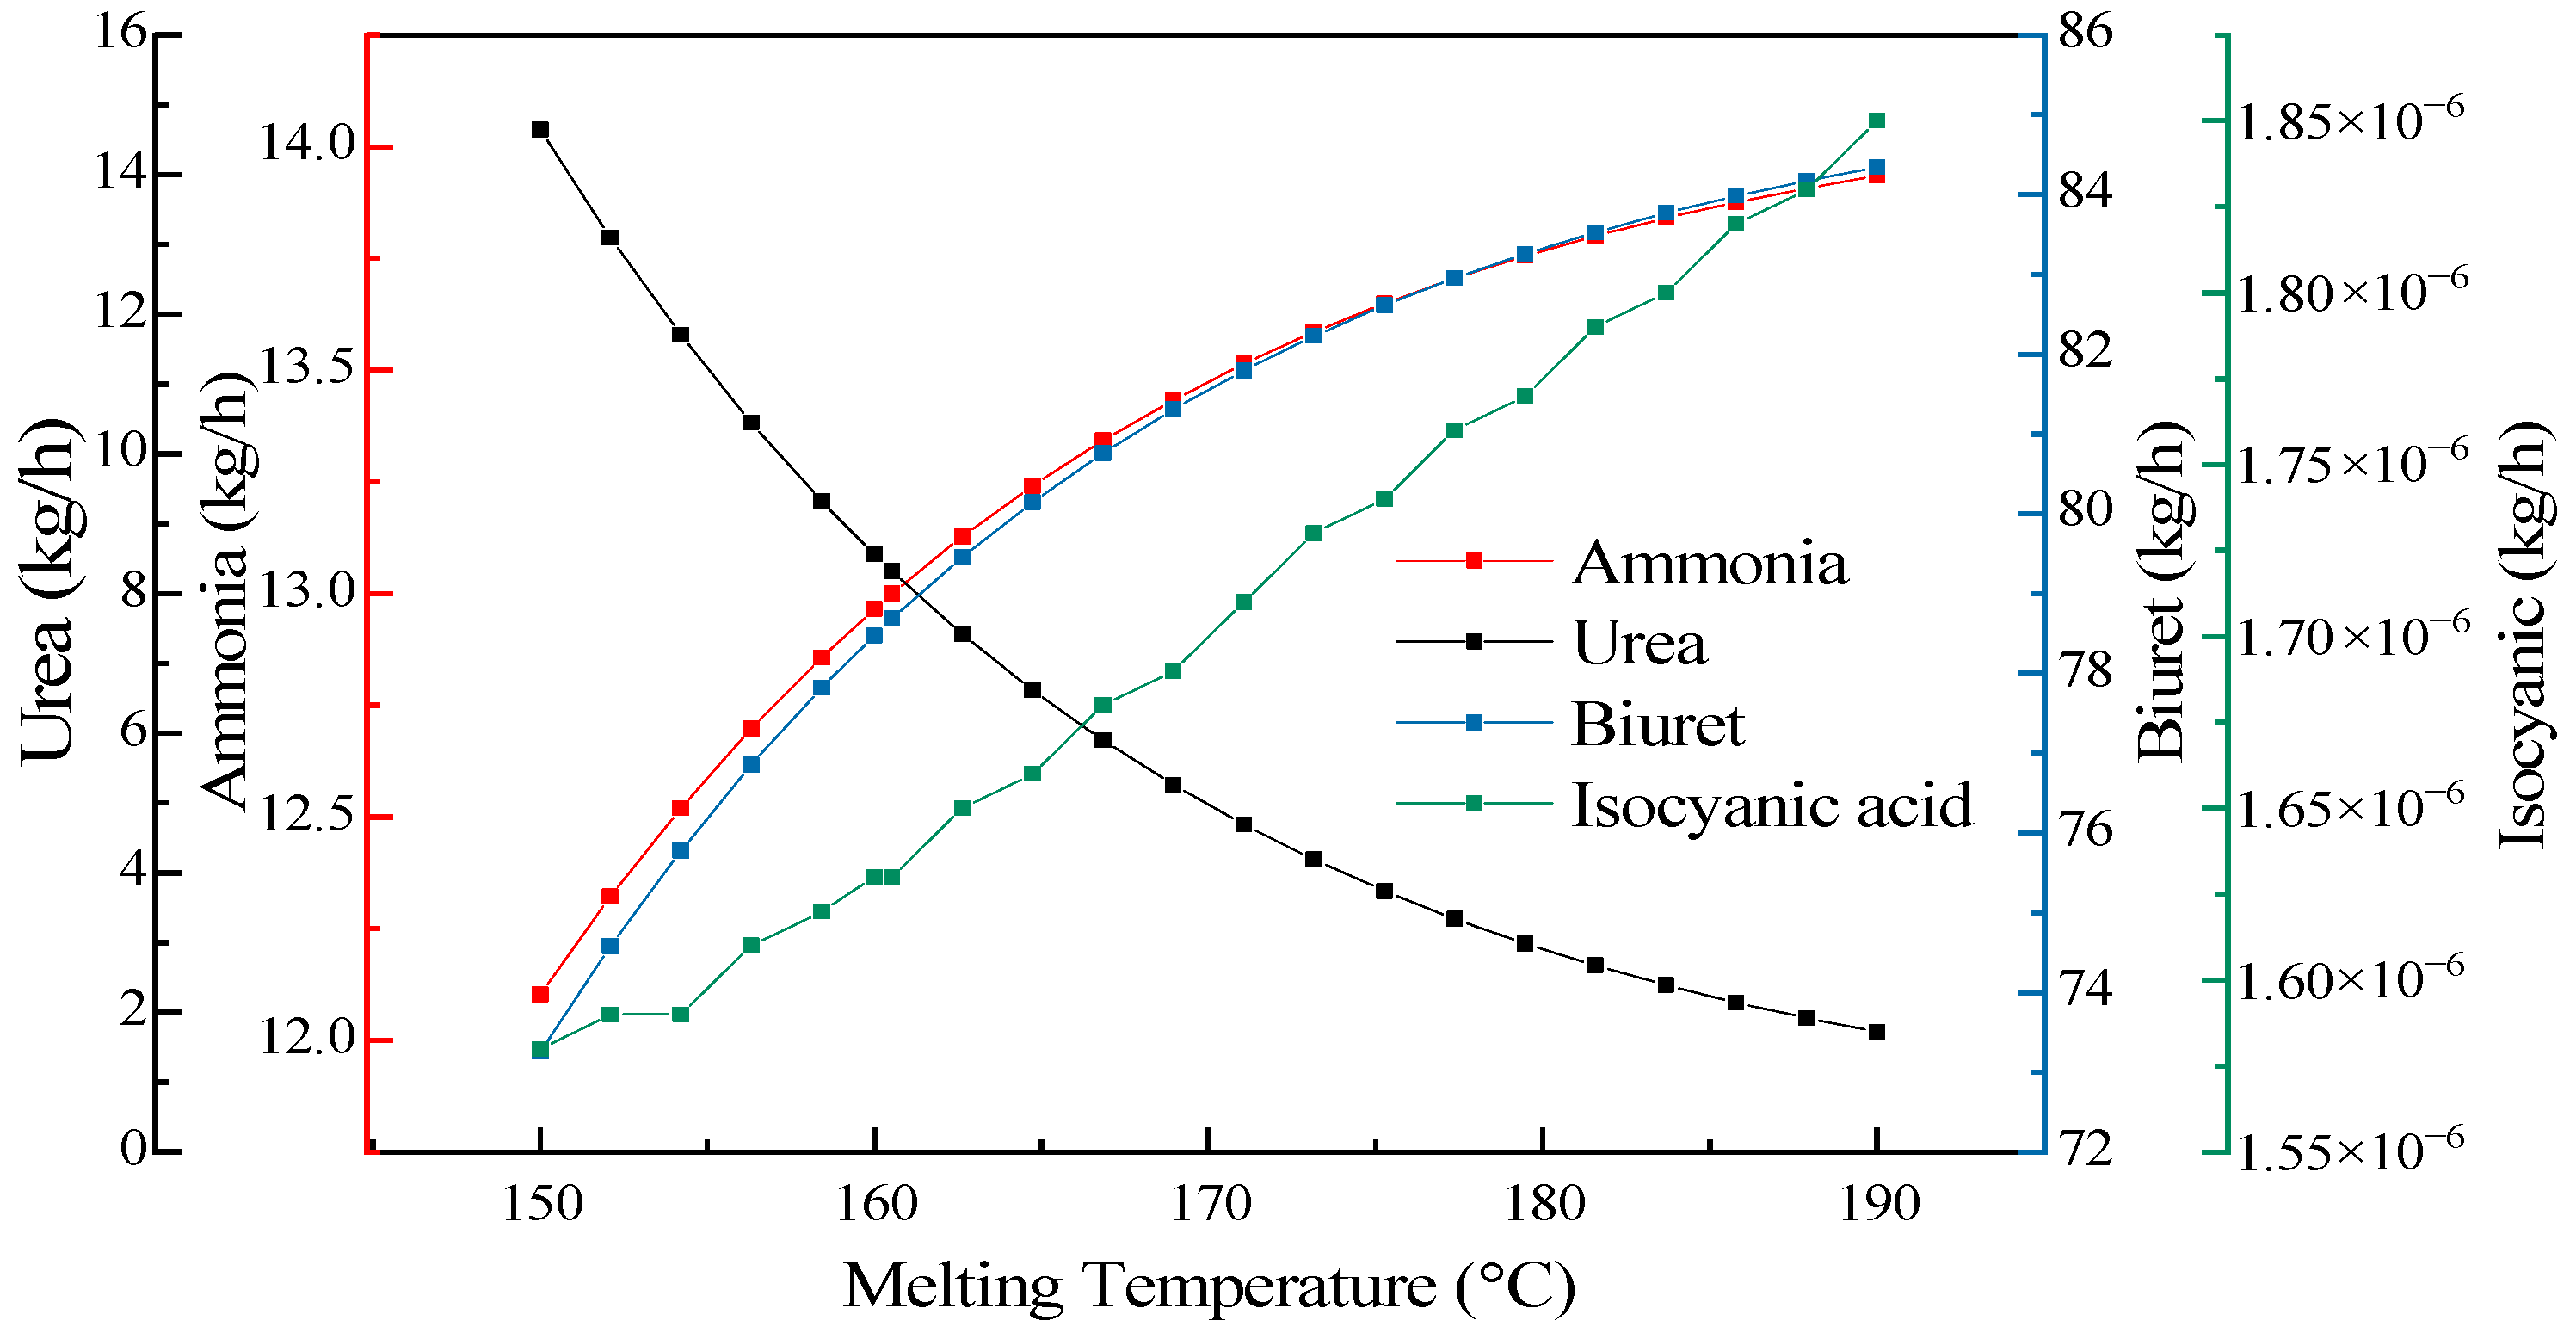
3.4.3. Melting Temperature Effect
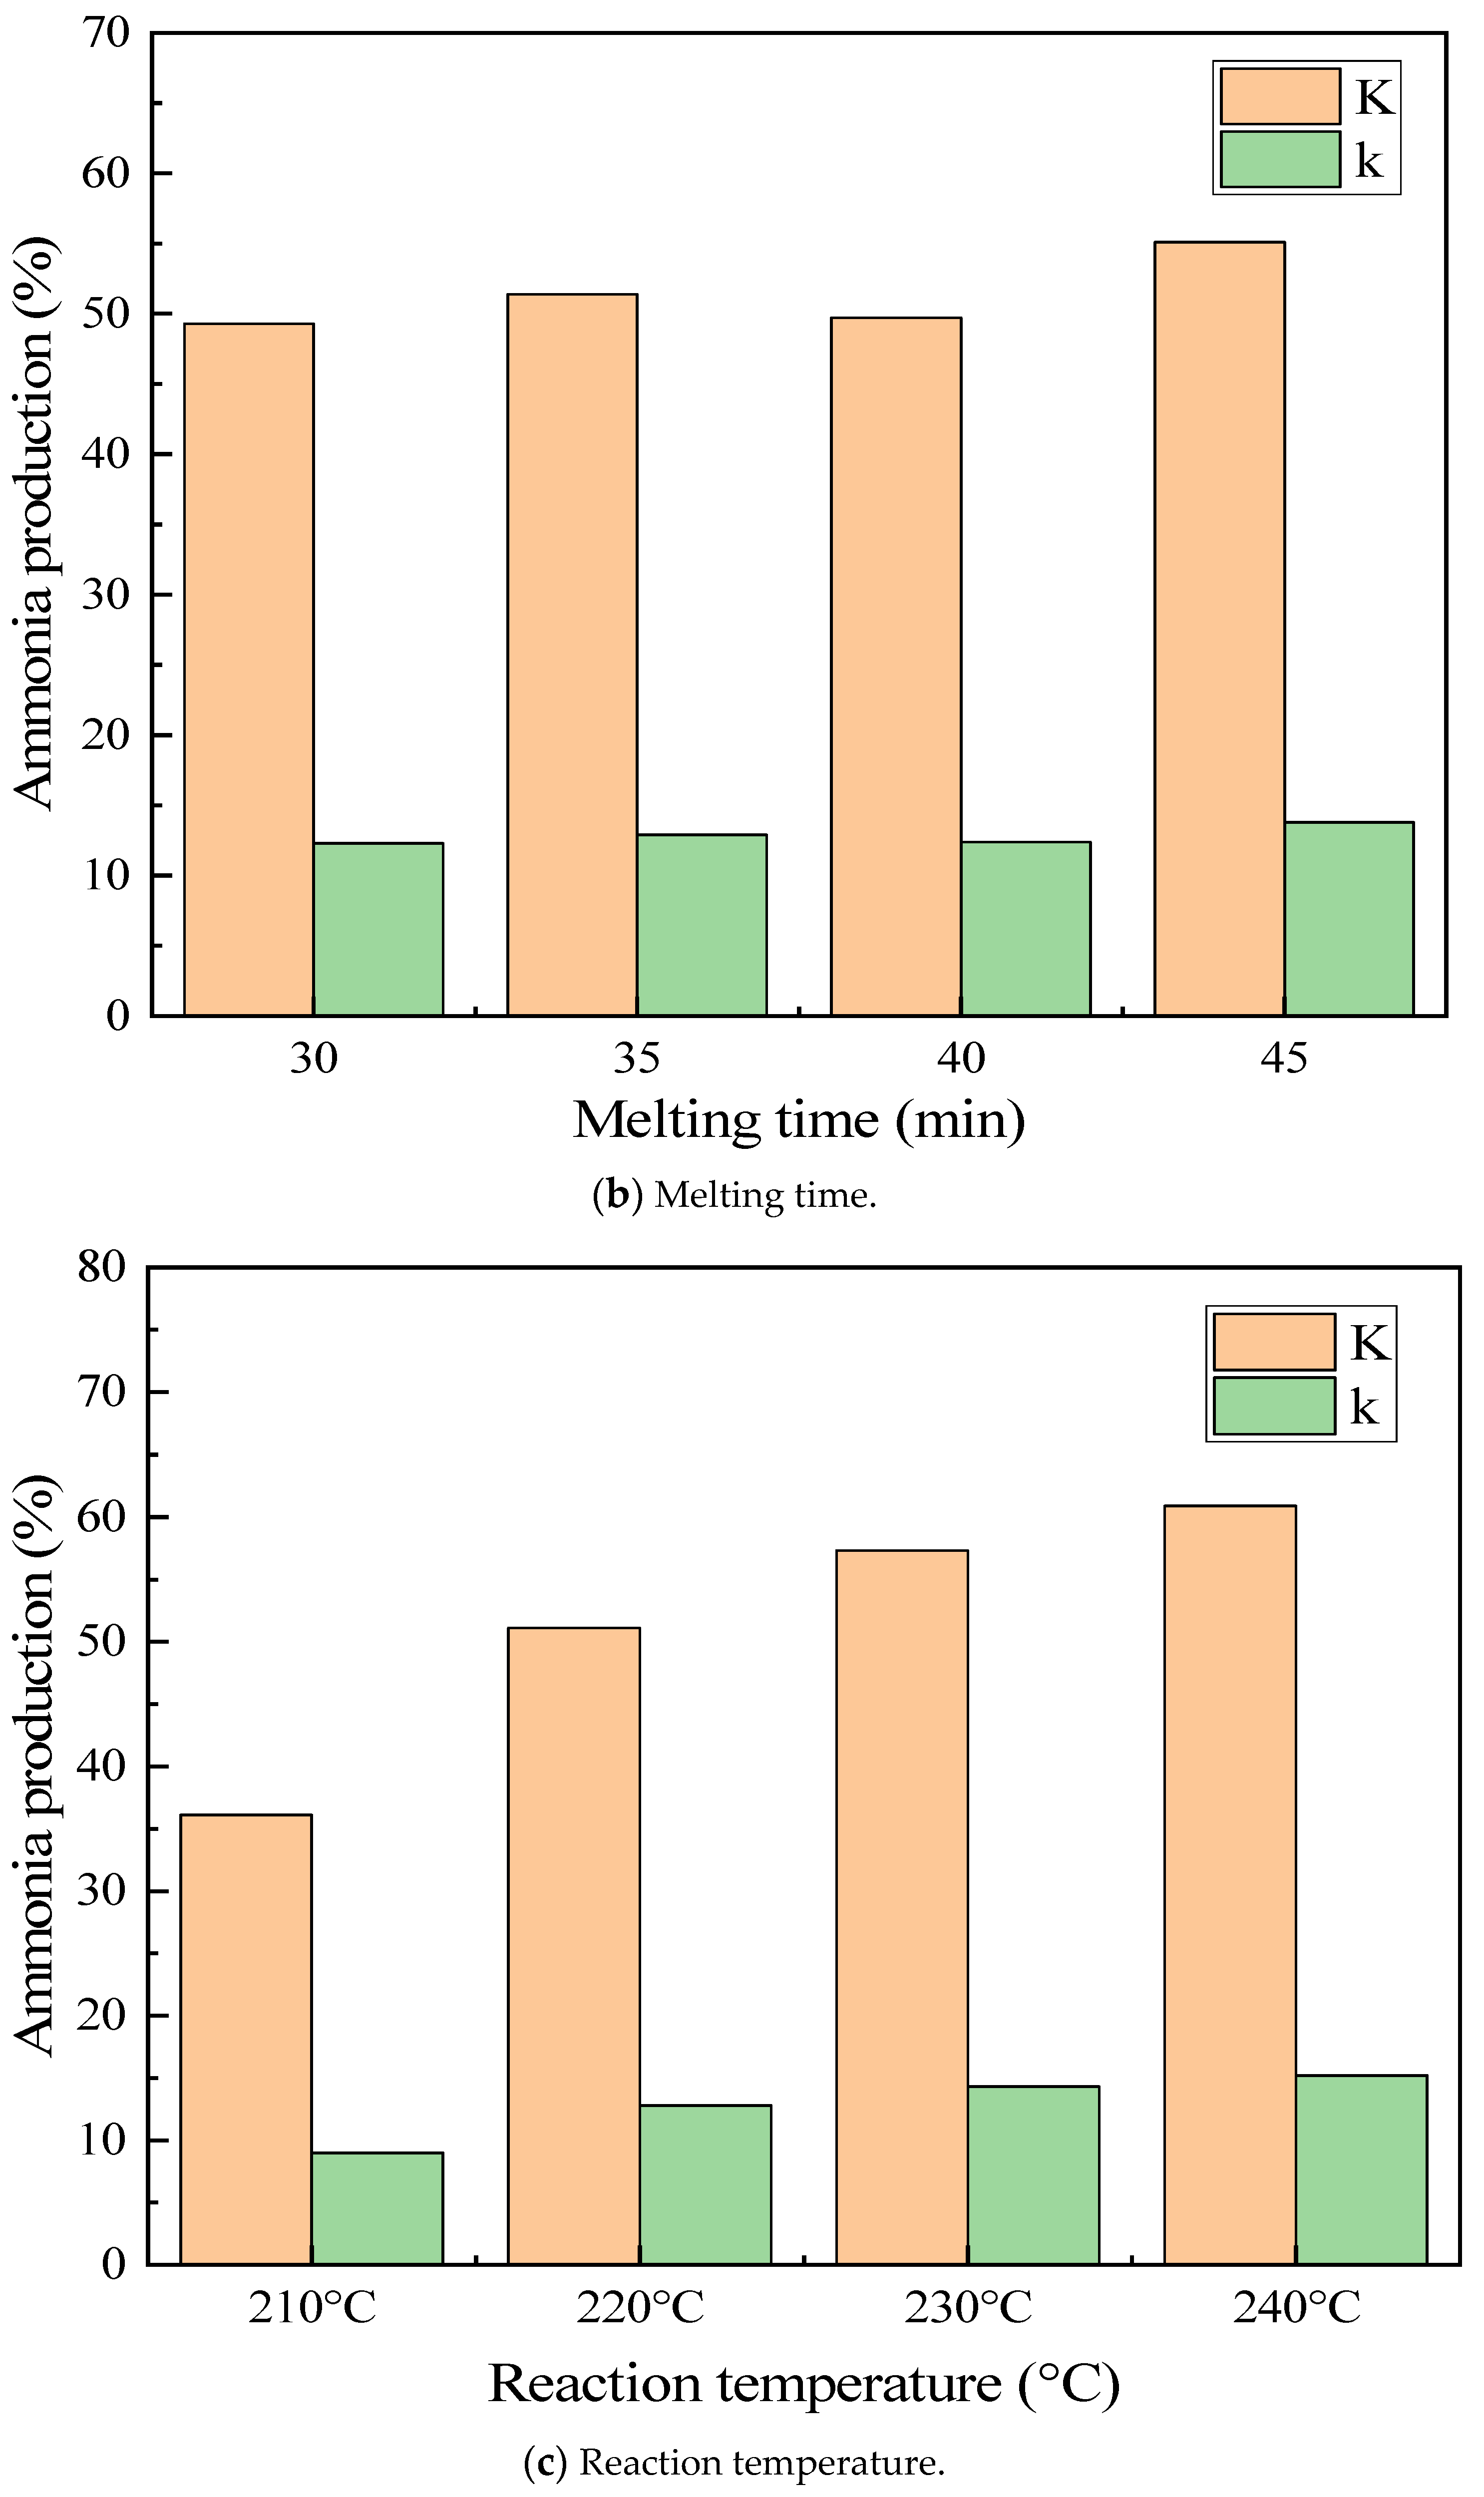
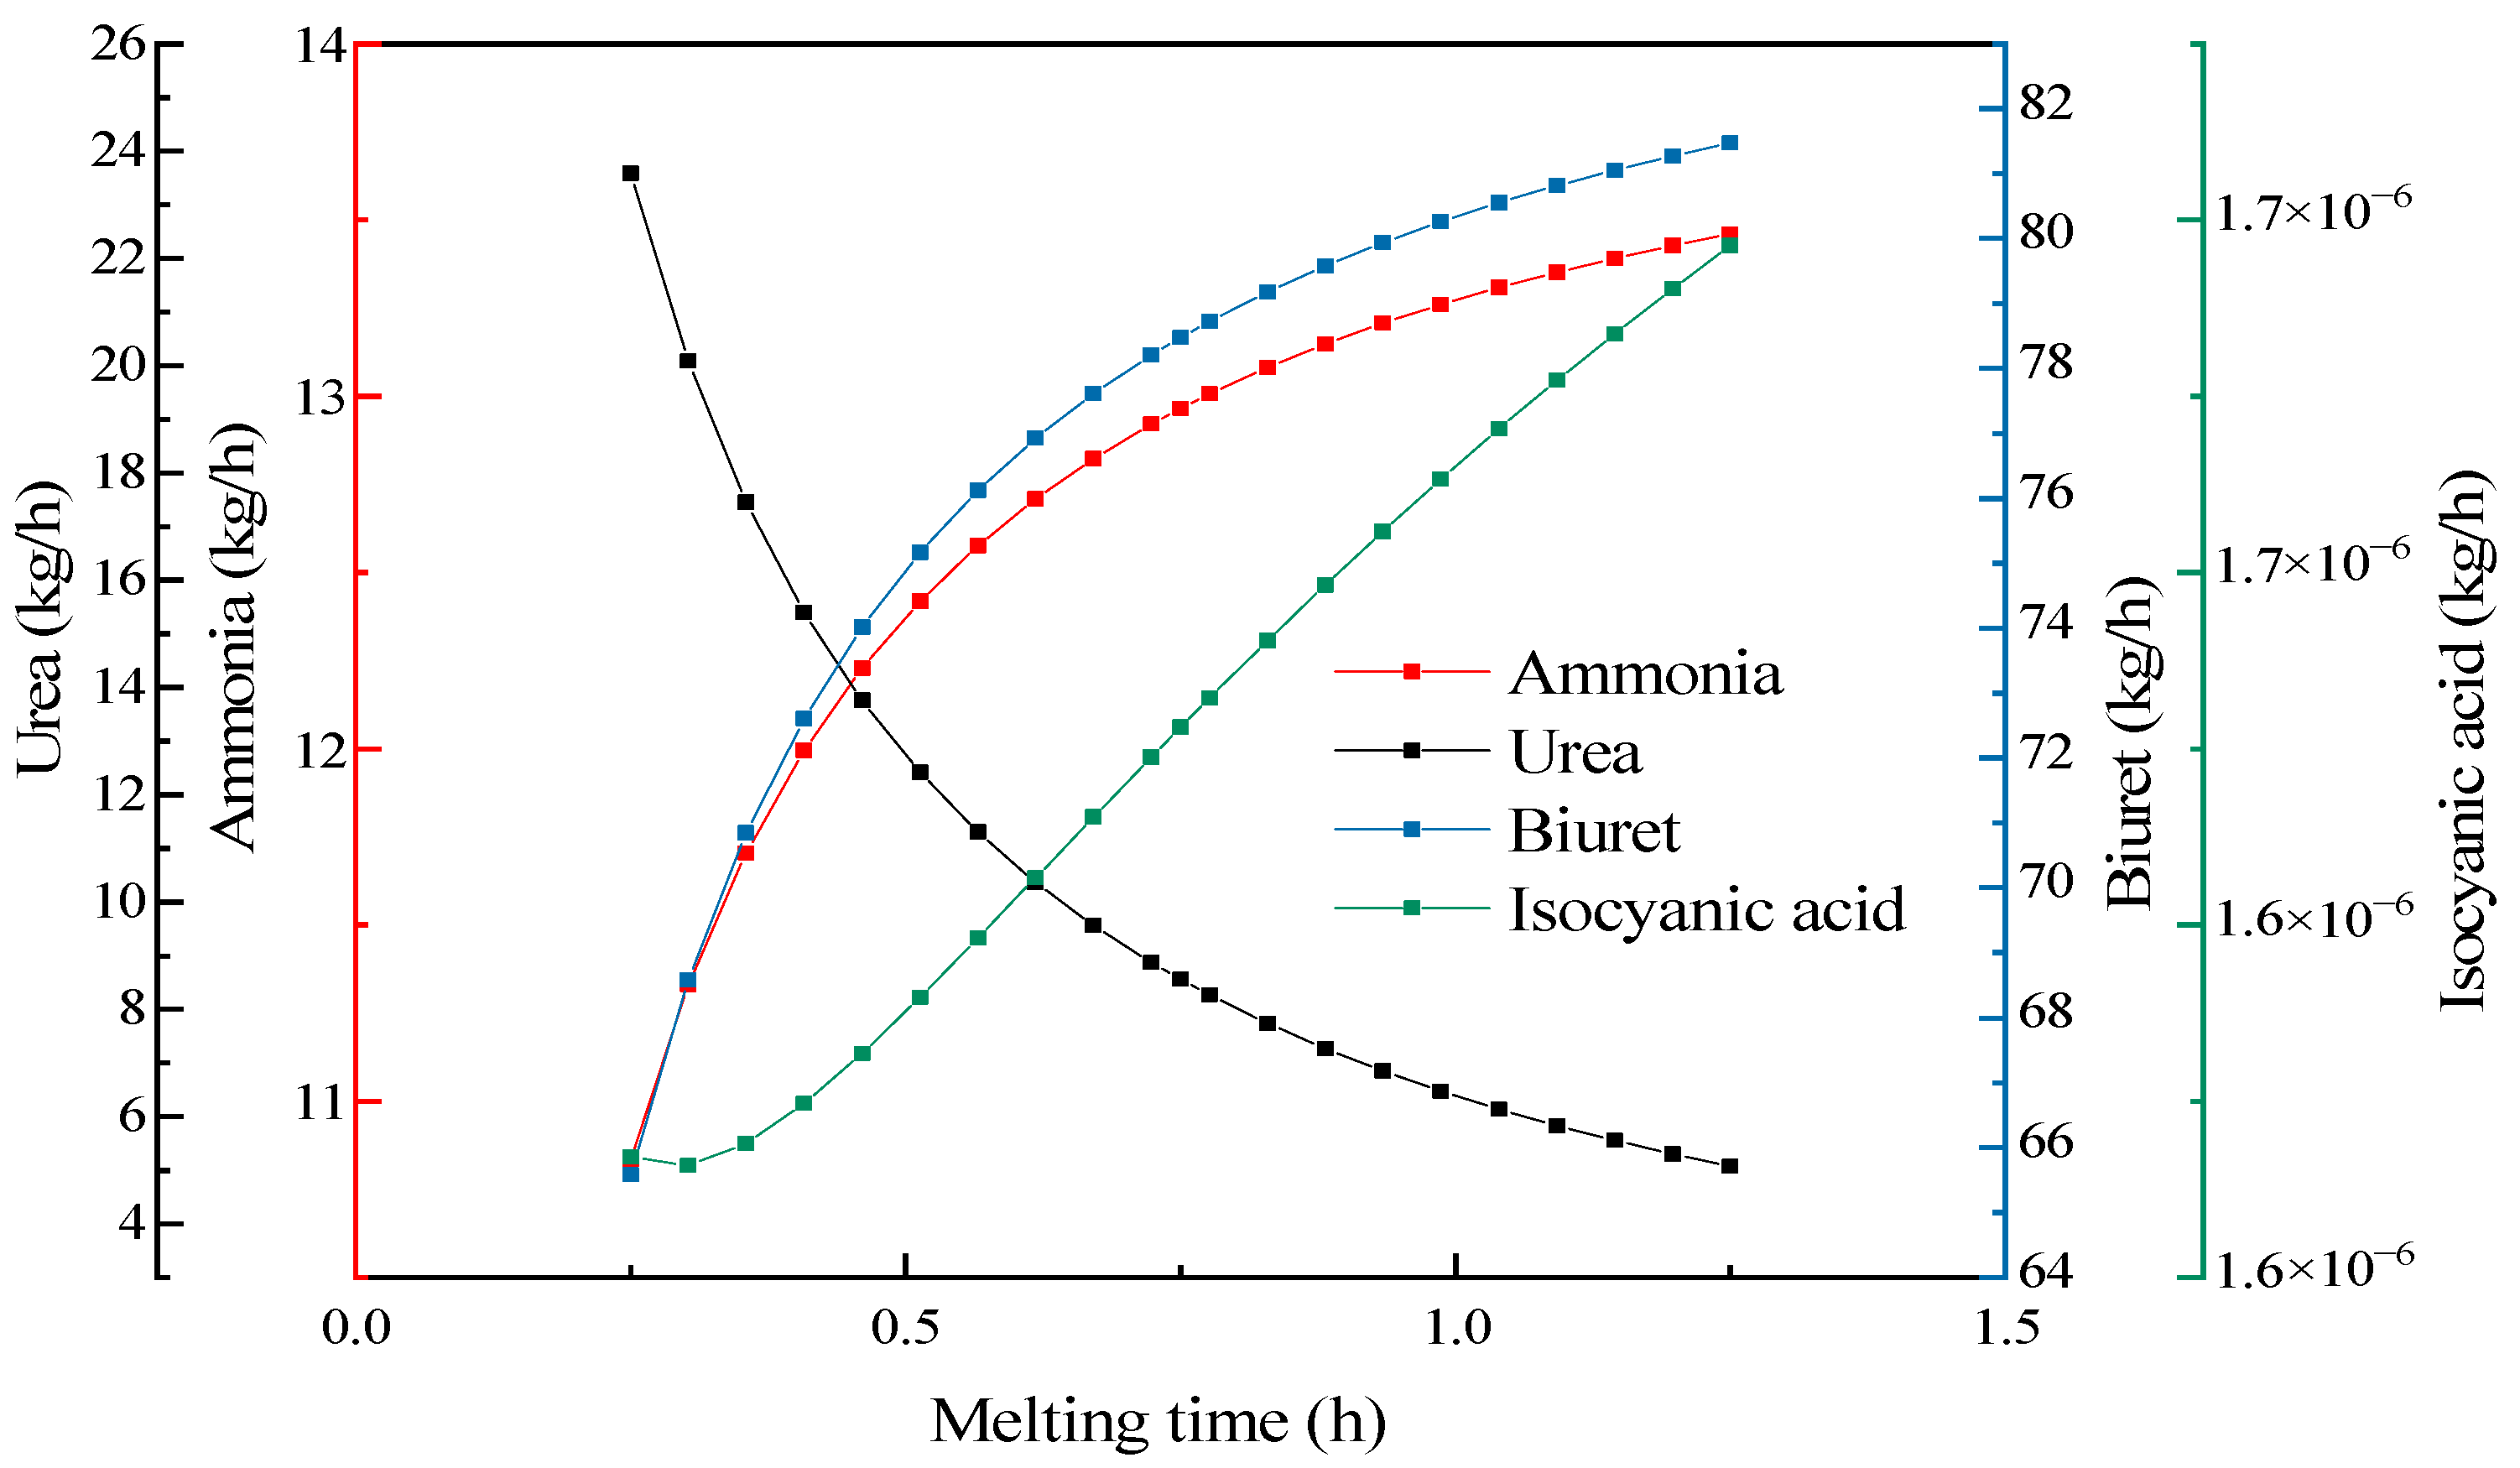
3.4.4. Melting Time Effect
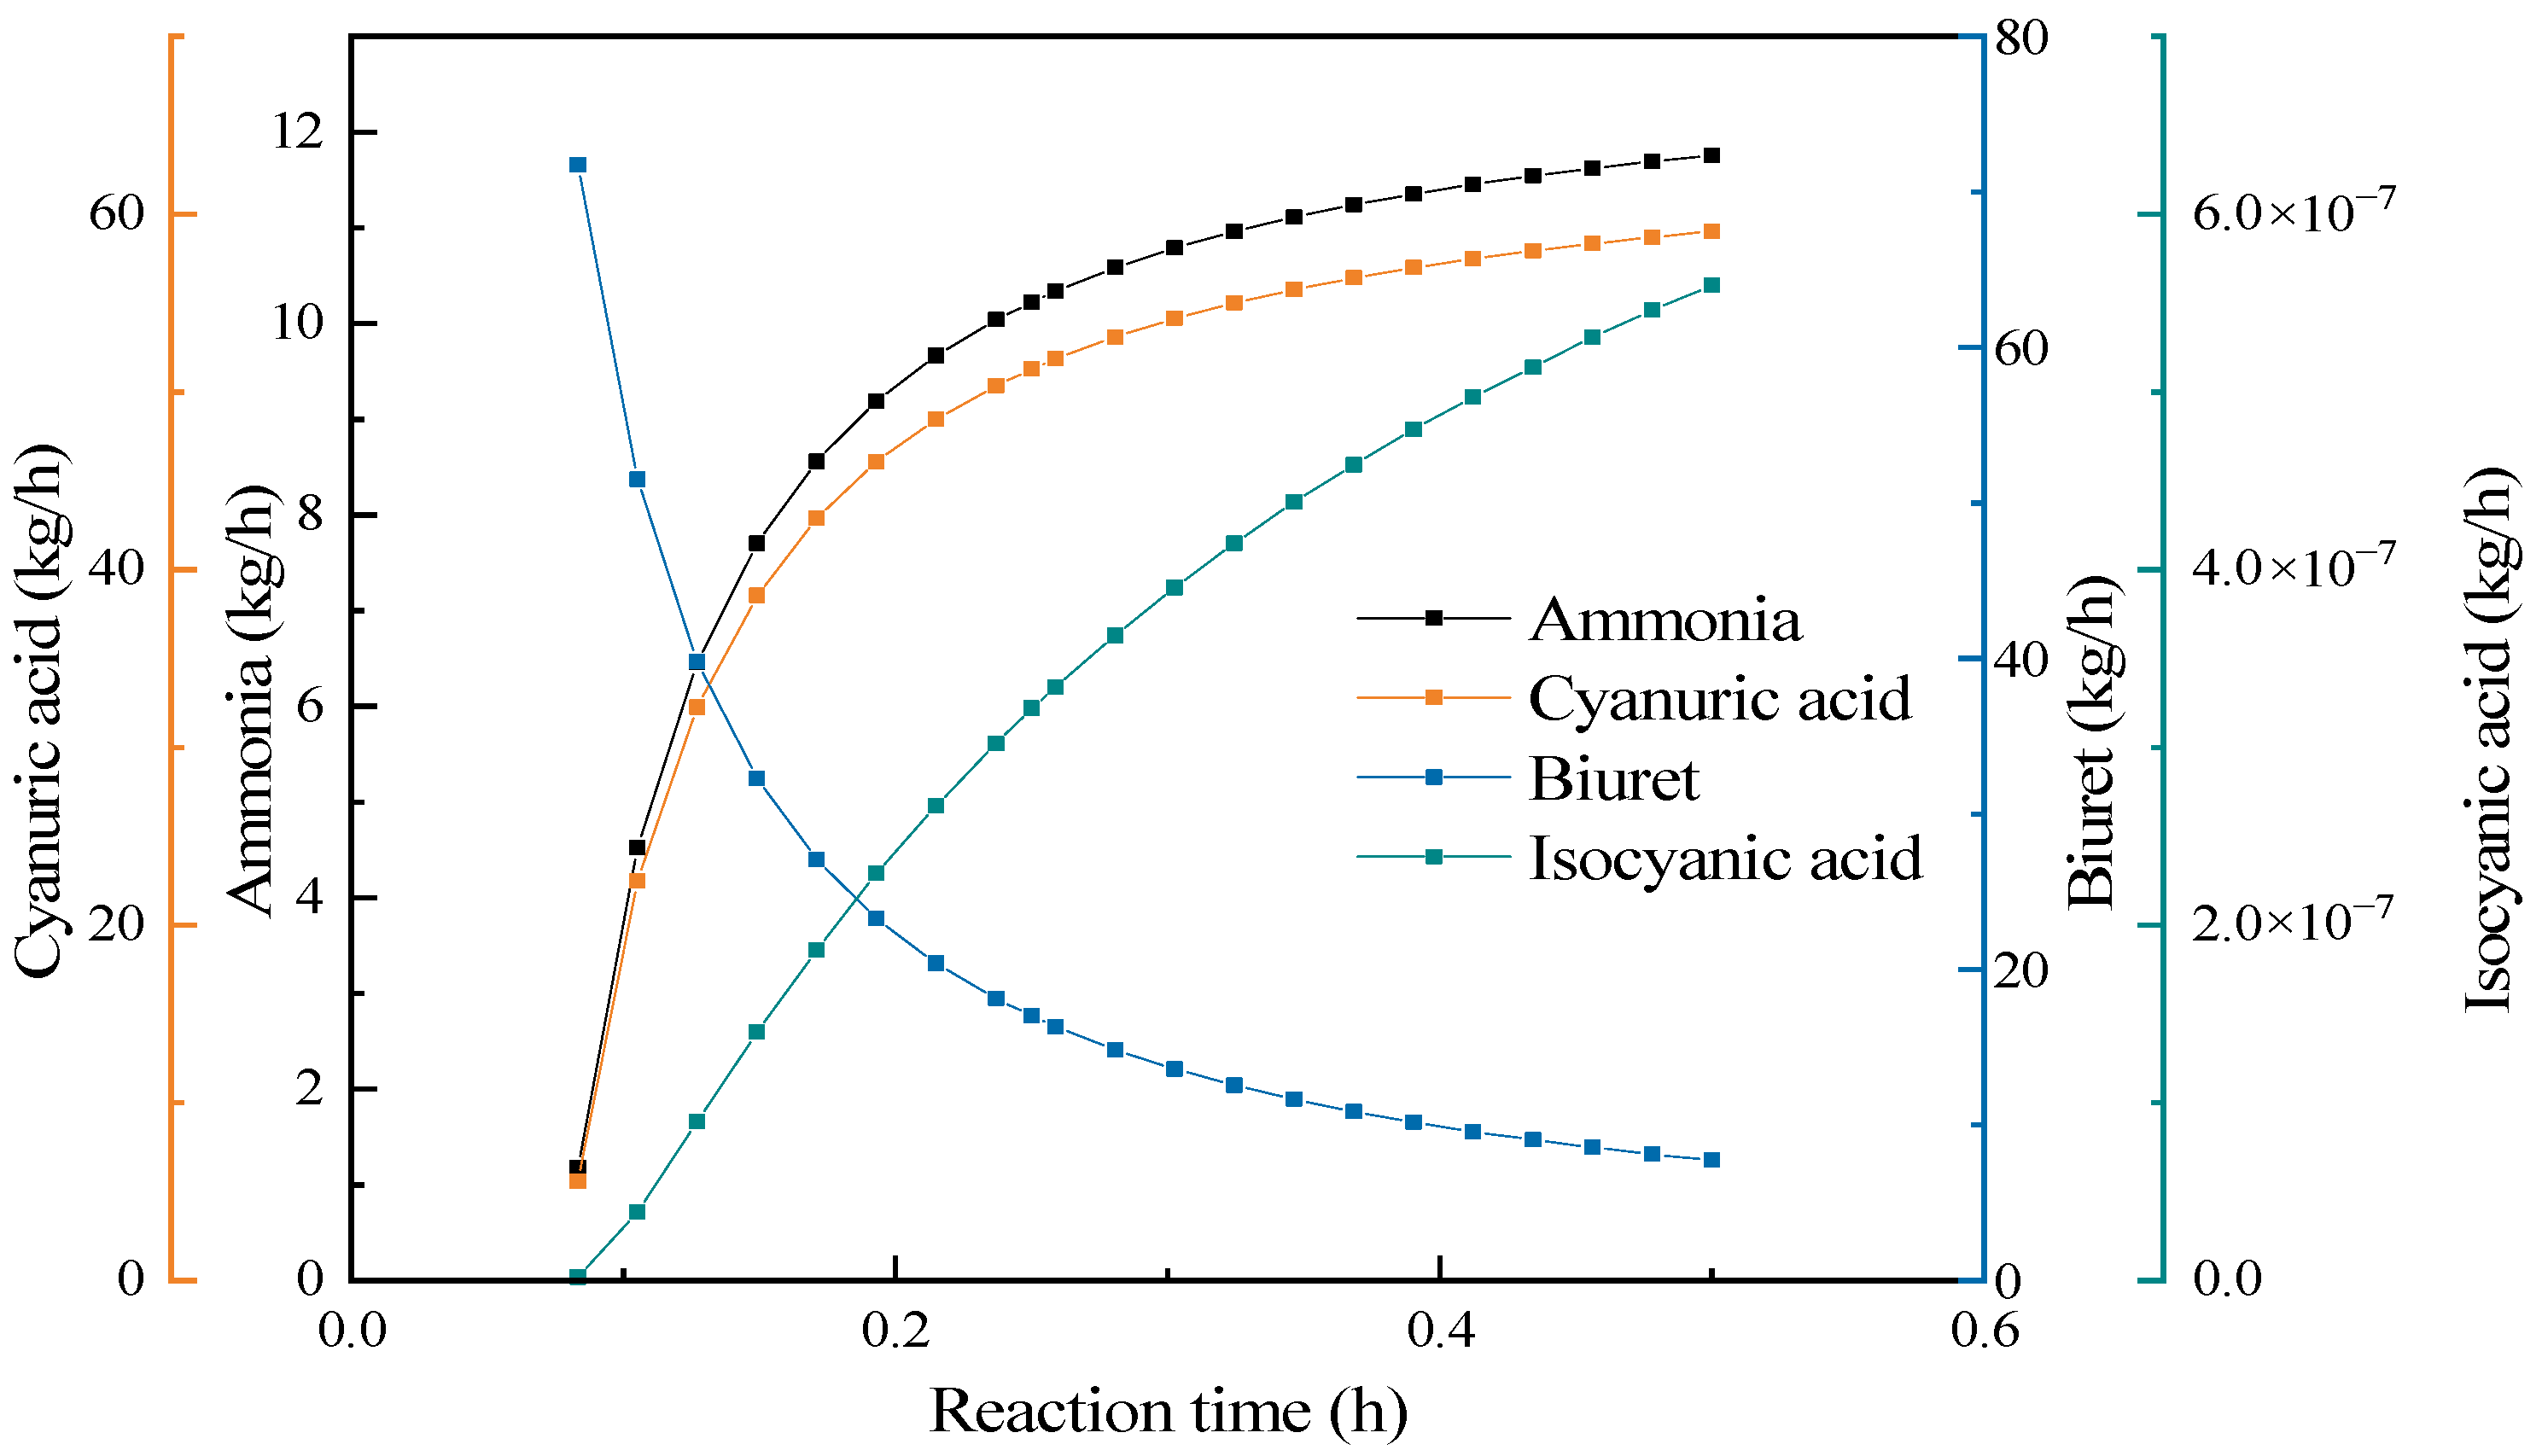
3.4.5. Reaction Time Effect
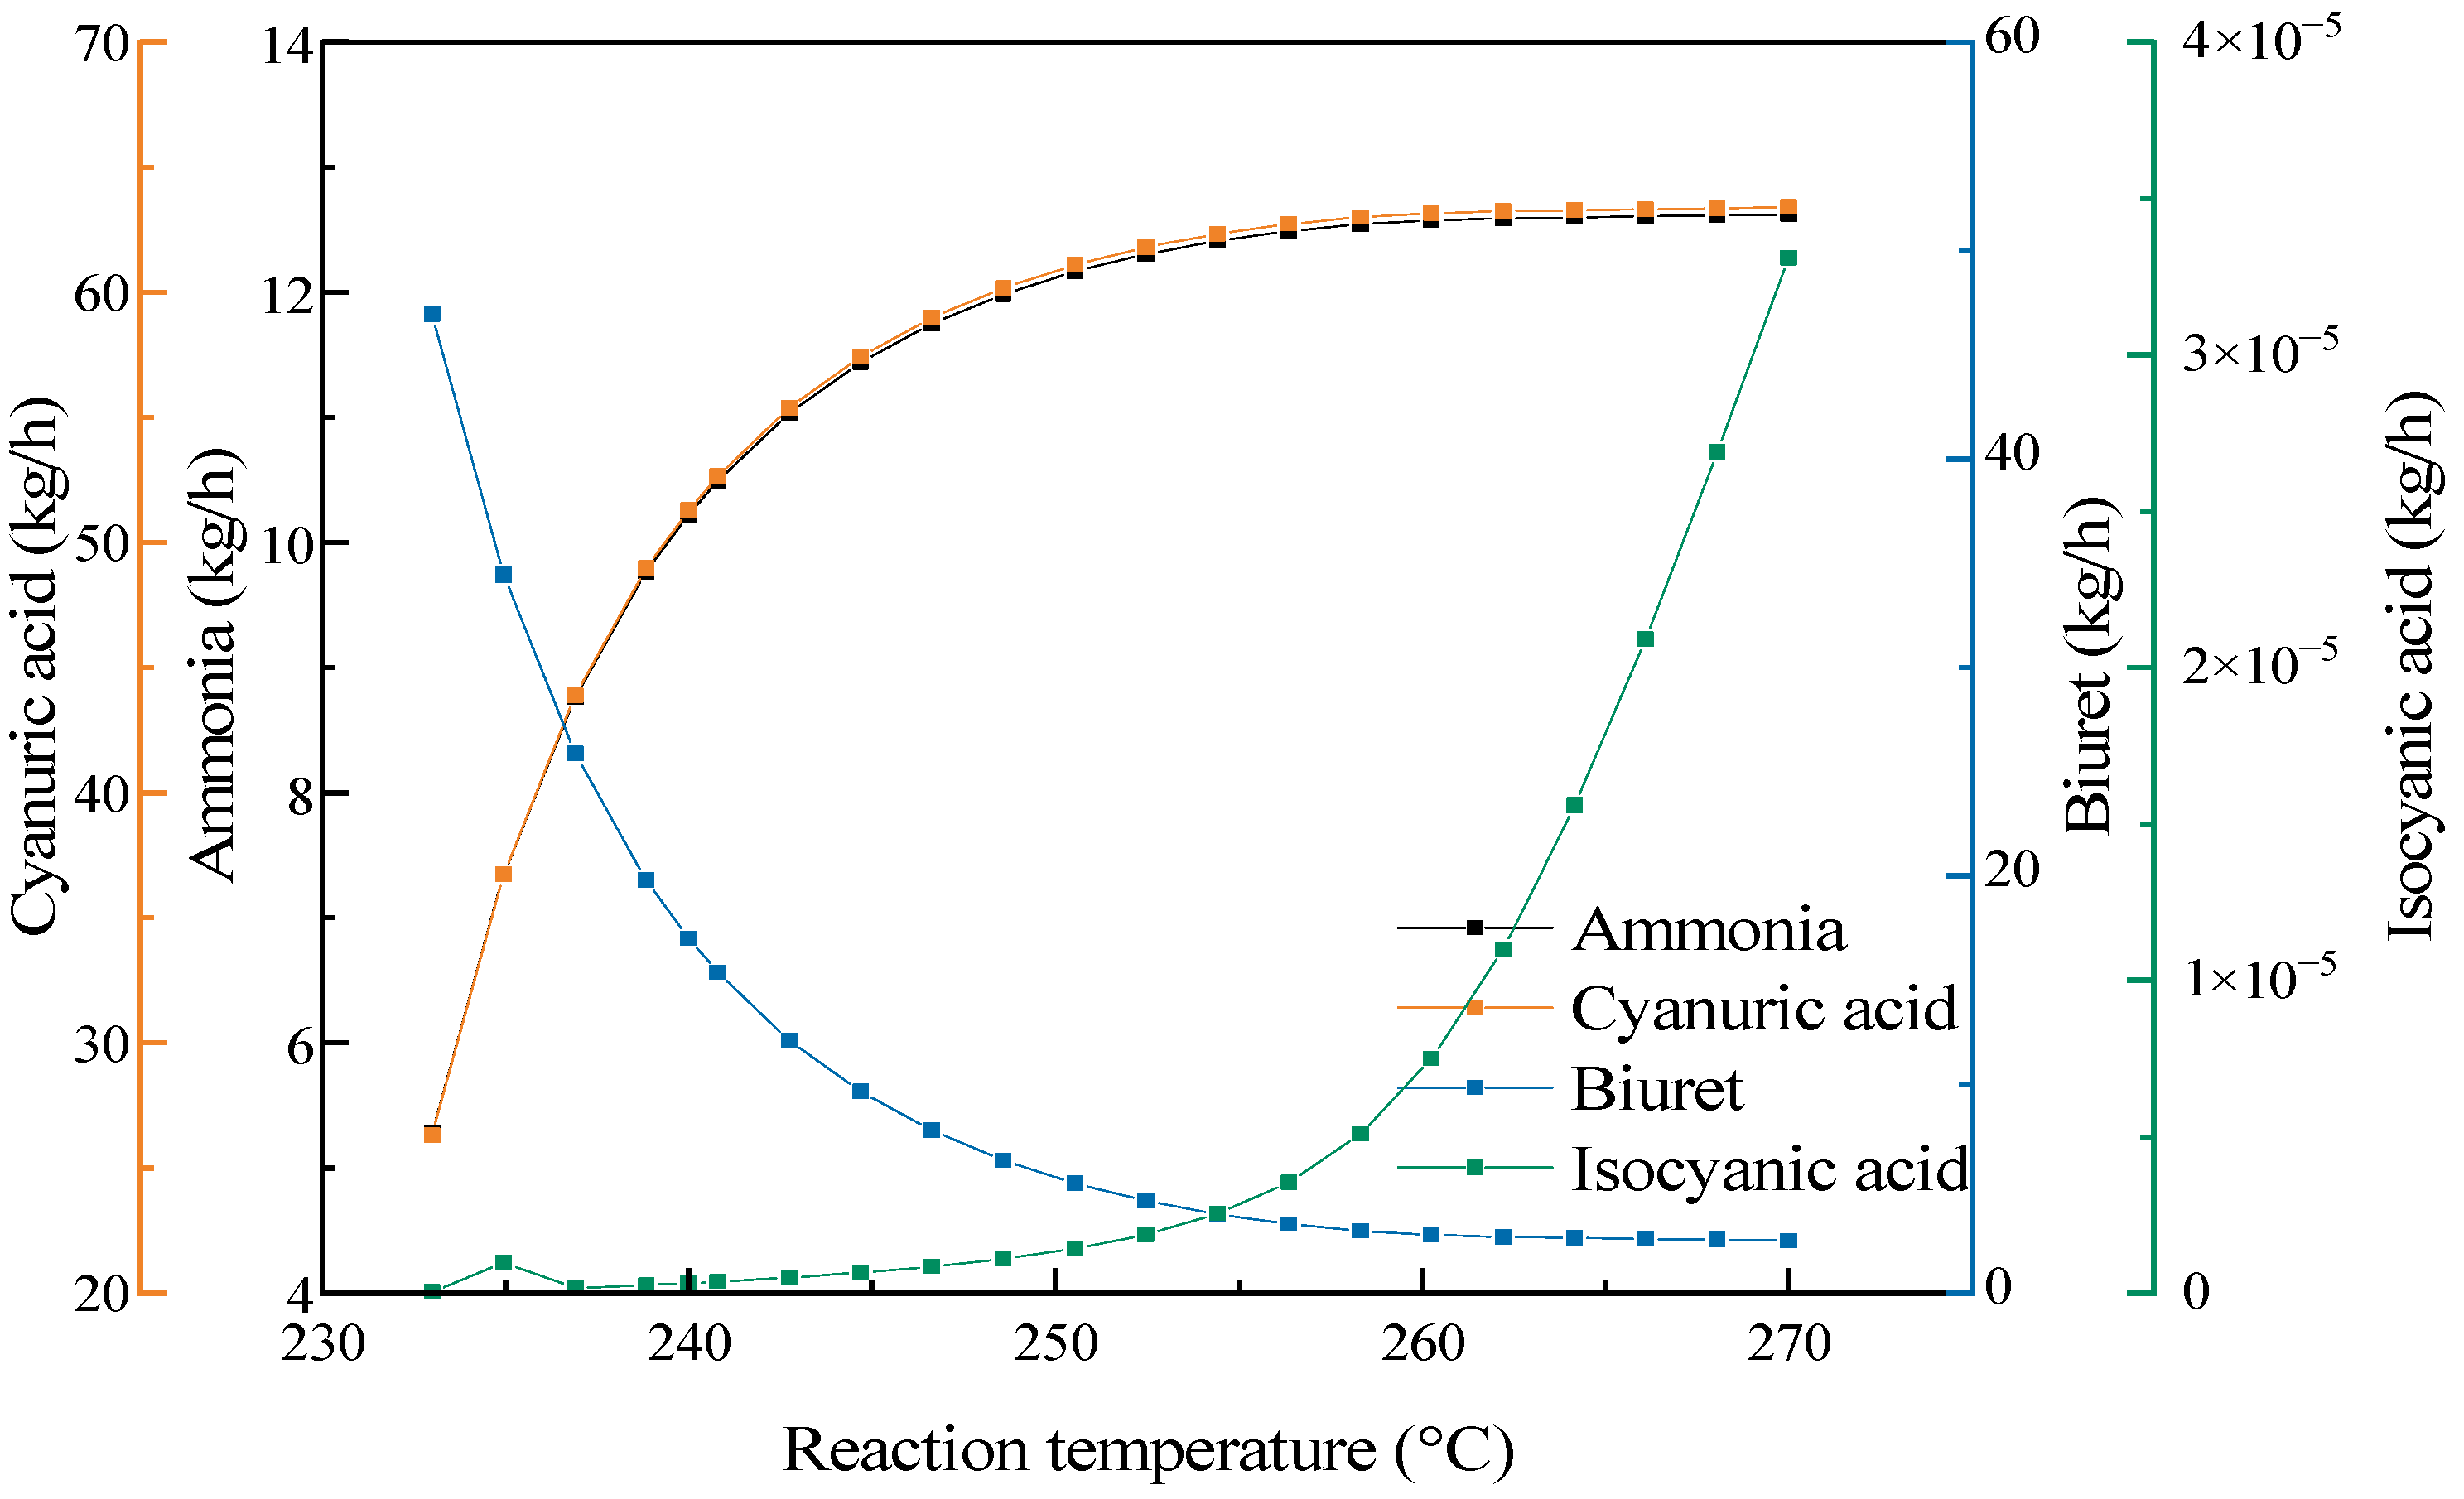
3.4.6. Reaction Temperature Effect
4. Discussion
5. Conclusions
Author Contributions
Funding
Institutional Review Board Statement
Informed Consent Statement
Data Availability Statement
Conflicts of Interest
References
- Chen, H.; Zhao, H.; Ding, J. Introduction to denitration technology of flue gas in thermal power plant. Therm. Power Gener. 2005, 2, 15–18. [Google Scholar] [CrossRef]
- Peng, D. Contrast of Urea Pyrolysis and Hydrolysis Ammonia Production Technologies in Boiler Flue Gas Denitration. Energy Energy Conserv. 2014, 18, 188–189. [Google Scholar] [CrossRef]
- Ji, J.; Chen, X.; Han, X. Rapid Simulation and Visualization Analysis of Liquid Ammonia Tank Leakage Risk. Procedia Eng. 2014, 84, 682–688. [Google Scholar] [CrossRef]
- Liu, J.; Hou, F.; Duan, C.; Liu, H.; Zhang, X.; Liu, K.; Zhang, L.; Zhou, X.; Hu, Z.; Yang, X. Study on Optimization Test Method of Ammonia Injection in SCR Denitrification Unit in Thermal Power Plant. IOP Conf. Ser. Mater. Sci. Eng. 2018, 452, 2. [Google Scholar] [CrossRef]
- Su, J.; Xue, F.; Chen, F.; Sun, Y.; Liu, X. Discussion on the Scheme of Preparing Ammonia Gas by Hydrolysis of Urea. IOP Conf. Ser. Mater. Sci. Eng. 2019, 612, 4. [Google Scholar] [CrossRef]
- Sahu, J.; Hussain, S.; Meikap, B. Studies on the hydrolysis of urea for production of ammonia and modeling for flow characterization in presence of stirring in a batch reactor using computational fluid dynamics. Korean J. Chem. Eng. 2011, 28, 1380–1384. [Google Scholar] [CrossRef]
- Aditya, K.; Kwangchul, O.; Ocktaeck, L. Investigation of Urea Uniformity with Different Types of Urea Injectors in an SCR System. Catalysts 2020, 10, 1269. [Google Scholar] [CrossRef]
- Ma, Q. Comparison of ammonia preparation schemes in Denitration system of Thermal power plant. Integr. Intell. Energy 2011, 33, 58–59. [Google Scholar] [CrossRef]
- Yao, Y.; Gui, S.; Yang, J.; Wei, J.; Zhang, W.; Li, P.; Xue, F.; Su, J.; Liu, X. Analysis of clogging causes and countermeasures of Urea pyrolysis system for flue gas Denitrification in coal-fired Power Plant. Boil. Technol. 2021, 52, 72–78. [Google Scholar] [CrossRef]
- Peter, M.; James, C.; Steven, H.; Daniel, T.; Bill, A.; Jonathan, B. Thermal decomposition (pyrolysis) of urea in an open reaction vessel. Thermochim. Acta 2004, 424, 131–142. [Google Scholar] [CrossRef]
- Zhu, Z.; Zhang, S.; Zhang, M.; Zhang, Y.; Yu, F. Urea downstream product technology development. Henan Chem. Ind. 2020, 37, 3–5. [Google Scholar] [CrossRef]
- Zhang, N.; Dong, Z.; Zhang, J.; Chen, H. Synthesis of cyanic acid. J. Hebei Univ. Sci. Technol. 2021, 42, 271–279. [Google Scholar] [CrossRef]
- Ren, Q.; Qian, L.; Yao, Y.; Wen, Y.; Shi, X. A Safe and Effective Strategy for the Synthesis of Cyanuric Acid Using the Solvent Method. Russ. J. Appl. Chem. 2023, 95, 1618–1626. [Google Scholar] [CrossRef]
- She, D.; Yu, H.; Huang, Q.; Li, F.; Li, C. Liquid-Phase Synthesis of Cyanuric Acid from Urea. Molecules 2010, 15, 1898. [Google Scholar] [CrossRef] [PubMed]
- Fu, C. Cyanic acid was produced by urea solid phase method. M-Sized Nitrogenous Fertil. Prog. 2003, 3, 39–40. [Google Scholar]
- Lebedev, V.; Sheludyakov, D.; Lebedeva, B. A new three-step procedure for the synthesis of cyanuric acid from urea. Russ. J. Appl. Chem. 2014, 87, 793–795. [Google Scholar] [CrossRef]
- Zhang, W.; Yan, Y.; Cai, K. Cyanuric acid was synthesized with o-nitrotoluene as solvent. Guangzhou Chem. Ind. 2012, 40, 75–76. [Google Scholar] [CrossRef]
- Yan, Y.; Zhang, W.; Cai, K. Synthesis of cyanuric acid by mixed solvent method. Guangzhou Chem. Ind. 2012, 40, 57–58. [Google Scholar]
- Liu, H.; Zhang, C. Cyanuric acid was synthesized by mixed solvent method. Chem. World 1997, 3, 139–141. [Google Scholar] [CrossRef]
- Zhang, D.; Zhou, X. Synthesis of cyanuric acid. J. Southeast Univ. 1996, 3, 47–52. [Google Scholar]
- Liu, X.; Wang, F.; Zhang, P.; Liu, X.; Wang, Q.; Zhu, W. The co-production of cyanuric acid and the ammonia used in coal-fired flue gas desulphurization and denitrification. J. Shandong Univ. 2010, 40, 120–123. [Google Scholar] [CrossRef]
- Wang, F. Microwave Solid Phase Synthesis of Three Reaction Products and Their Properties. Master’s Thesis, Shandong University, Jinan, China, 2011. [Google Scholar]
- Chemat, F.; Poux, M. Microwave assisted pyrolysis of urea supported on graphite under solvent-free conditions. Tetrahedron Lett. 2001, 42, 3693–3695. [Google Scholar] [CrossRef]
- Zhao, X.; Song, Z.; Wang, T.; Li, L.; Ma, Y. Research progress of microwave technology for pyrolysis. Prog. Chem. Ind. 2008, 12, 1873–1877. [Google Scholar] [CrossRef]
- Ebrahimian, V.; Nicolle, A.; Habchi, C. Detailed modeling of the evaporation and thermal decomposition of urea-water solution in SCR systems. AIChE J. 2012, 58, 1998–2009. [Google Scholar] [CrossRef]
- Brack, W.; Heine, B.; Birkhold, F.; Kruse, M.; Deutschmann, O. Formation of Urea-Based Deposits in an Exhaust System: Numerical Predictions and Experimental Observations on a Hot Gas Test Bench. Emiss. Control. Sci. Technol. 2016, 2, 115–123. [Google Scholar] [CrossRef]
- Brack, W.; Heine, B.; Birkhold, F.; Kruse, M.; Schoch, G.; Tischer, S.; Deutschmann, O. Kinetic modeling of urea decomposition based on systematic thermogravimetric analyses of urea and its most important by-products. Chem. Eng. Sci. 2014, 106, 1–8. [Google Scholar] [CrossRef]
- Kim, J.; Ryu, Y.; Ha, J. Numerical prediction on the characteristics ofspray-induced mixing and thermal decomposition of urea solution in SCR system. In Proceedings of the ASME Internal Combustion Engine Division (ASME 2004), Long Beach, CA, USA, 24 October 2004; pp. 165–170. [Google Scholar]
- Birkhold, F.; Meingast, U.; Waaaermann, P.; Deutschmann, O. Model and simulation of the injection of urea-water-solution for automotive SCR DeNOx-systems. Appl. Catal. B Environ. 2007, 70, 119–127. [Google Scholar] [CrossRef]
- Zhao, D.; Liu, S.; Wu, X.; Meng, D. Application of urea pyrolysis technology to ammonia production in SCR denitration. Therm. Power Gener. 2009, 38, 65–67. [Google Scholar]
- Su, J.; Xue, F.; Li, P.; Zhang, Y. Prevention and Countermeasures of Urea Crystallization in SCR Urea Pyrolysis System. IOP Conf. Ser. Earth Environ. Sci. 2021, 631, 12. [Google Scholar] [CrossRef]
- Kong, X.; Lv, J.; Li, Y.; Song, F. SCR denitration pyrolysis furnace has the feasibility study of pyrolysis of urea solution and ammonia water. Therm. Power Gener. 2023, 39, 81–82. [Google Scholar]
- Kou, Y.; Xue, Q.; Qi, W.; Nie, Y.; Zhang, S. Cyanuric acid was prepared by condensation of urea. Guangdong Chem. Ind. 2019, 46, 89–90. [Google Scholar]
- Ma, L. Study on Synthesis and Application of Cyanuric Acid. Master’s Thesis, Shandong University, Jinan, China, 2017. [Google Scholar]
- Kou, H.; Bai, Z.; Hou, H.; Tian, L.; Li, H. Thermodynamic analysis of cyanuric acid synthesis by liquid phase method. CIESC J. 2024, 75, 2157–2165. [Google Scholar] [CrossRef]
- Yao, Y.; Wen, Y.; Yang, C.; Zhang, J.; Ren, Q. Determination and correlation for solubilities of urea and cyanuric acid in organic solvents from 300.75 K to 369.45 K. Thermochim. Acta 2020, 689, 178613. [Google Scholar] [CrossRef]
- Liu, X. Study on Synthesis Technology of Three Urea Derivatives. Master’s Thesis, Shandong University, Jinan, China, 2010. [Google Scholar]
- Zhu, W.; Liu, X.; Wang, F.; Zhang, P. Co-Production Method of Ammonia Gas for Desulfurization and Denitrification of Coal Flue Gas. CN Patents CN200910014992.2, 8 December 2010. [Google Scholar]
- Zhu, W.; Wang, F.; Wang, Q.; Sun, H.; Yuan, A. A Method for Desulfurization and Denitrification of Flue Gas Using Urea Co-Production Technology. CN Patents CN201410290112.5, 3 September 2014. [Google Scholar]


| Factor | Melting Temperature (°C) | Melting Time (Minutes) | Reaction Temperature (°C) | Reaction Time (Minutes) | |
|---|---|---|---|---|---|
| Level | |||||
| 1 | 45.6 | 1.63 × 10⁻⁹ | 533 | 59.4 | |
| 2 | 62.4 | 3.06 × 10⁻⁹ | 663 | 66.3 | |
| 3 | 58.5 | 2.69 × 10⁻⁹ | 386 | 55.2 | |
| 4 | 53.6 | 2.26 × 10⁻⁹ | 686 | 62.4 | |
| 5 | 64.5 | 3.27 × 10⁻⁹ | 494 | 61.8 | |
| 6 | 84.2 | 5.56 × 10⁻⁹ | 469 | 74.0 | |
| ID | Melting Temperature (°C) | Melting Time (Minutes) | Reaction Temperature (°C) | Reaction Time (Minutes) | Ammonia Yield (%) |
|---|---|---|---|---|---|
| 1 | 160 | 30 | 210 | 15 | 10.0 |
| 2 | 160 | 35 | 220 | 20 | 13.9 |
| 3 | 160 | 40 | 230 | 25 | 14.1 |
| 4 | 160 | 45 | 240 | 30 | 16.6 |
| 5 | 170 | 30 | 220 | 25 | 11.8 |
| 6 | 170 | 35 | 210 | 30 | 8.7 |
| 7 | 170 | 40 | 240 | 15 | 13.8 |
| 8 | 170 | 45 | 230 | 20 | 17.4 |
| 9 | 180 | 30 | 230 | 30 | 12.7 |
| 10 | 180 | 35 | 240 | 25 | 15.8 |
| 11 | 180 | 40 | 210 | 20 | 9.0 |
| 12 | 180 | 45 | 220 | 15 | 12.6 |
| 13 | 190 | 30 | 240 | 20 | 14.8 |
| 14 | 190 | 35 | 230 | 15 | 13.1 |
| 15 | 190 | 40 | 220 | 30 | 12.8 |
| 16 | 190 | 45 | 210 | 25 | 8.5 |
| Melting Temperature (°C) | Melting Time (Minutes) | Reaction Temperature (°C) | Reaction Time (Minutes) | Ammonia Production (%) | Cyanic Acid Production (%) | |
|---|---|---|---|---|---|---|
| Optimal scheme | 160 | 45 | 240 | 20 | 18.45 | 52.53 |
| Name | Melting Temperature (°C) | Melting Time (Minutes) | Reaction Temperature (°C) | Reaction Time (Minutes) | Ammonia Production (%) |
|---|---|---|---|---|---|
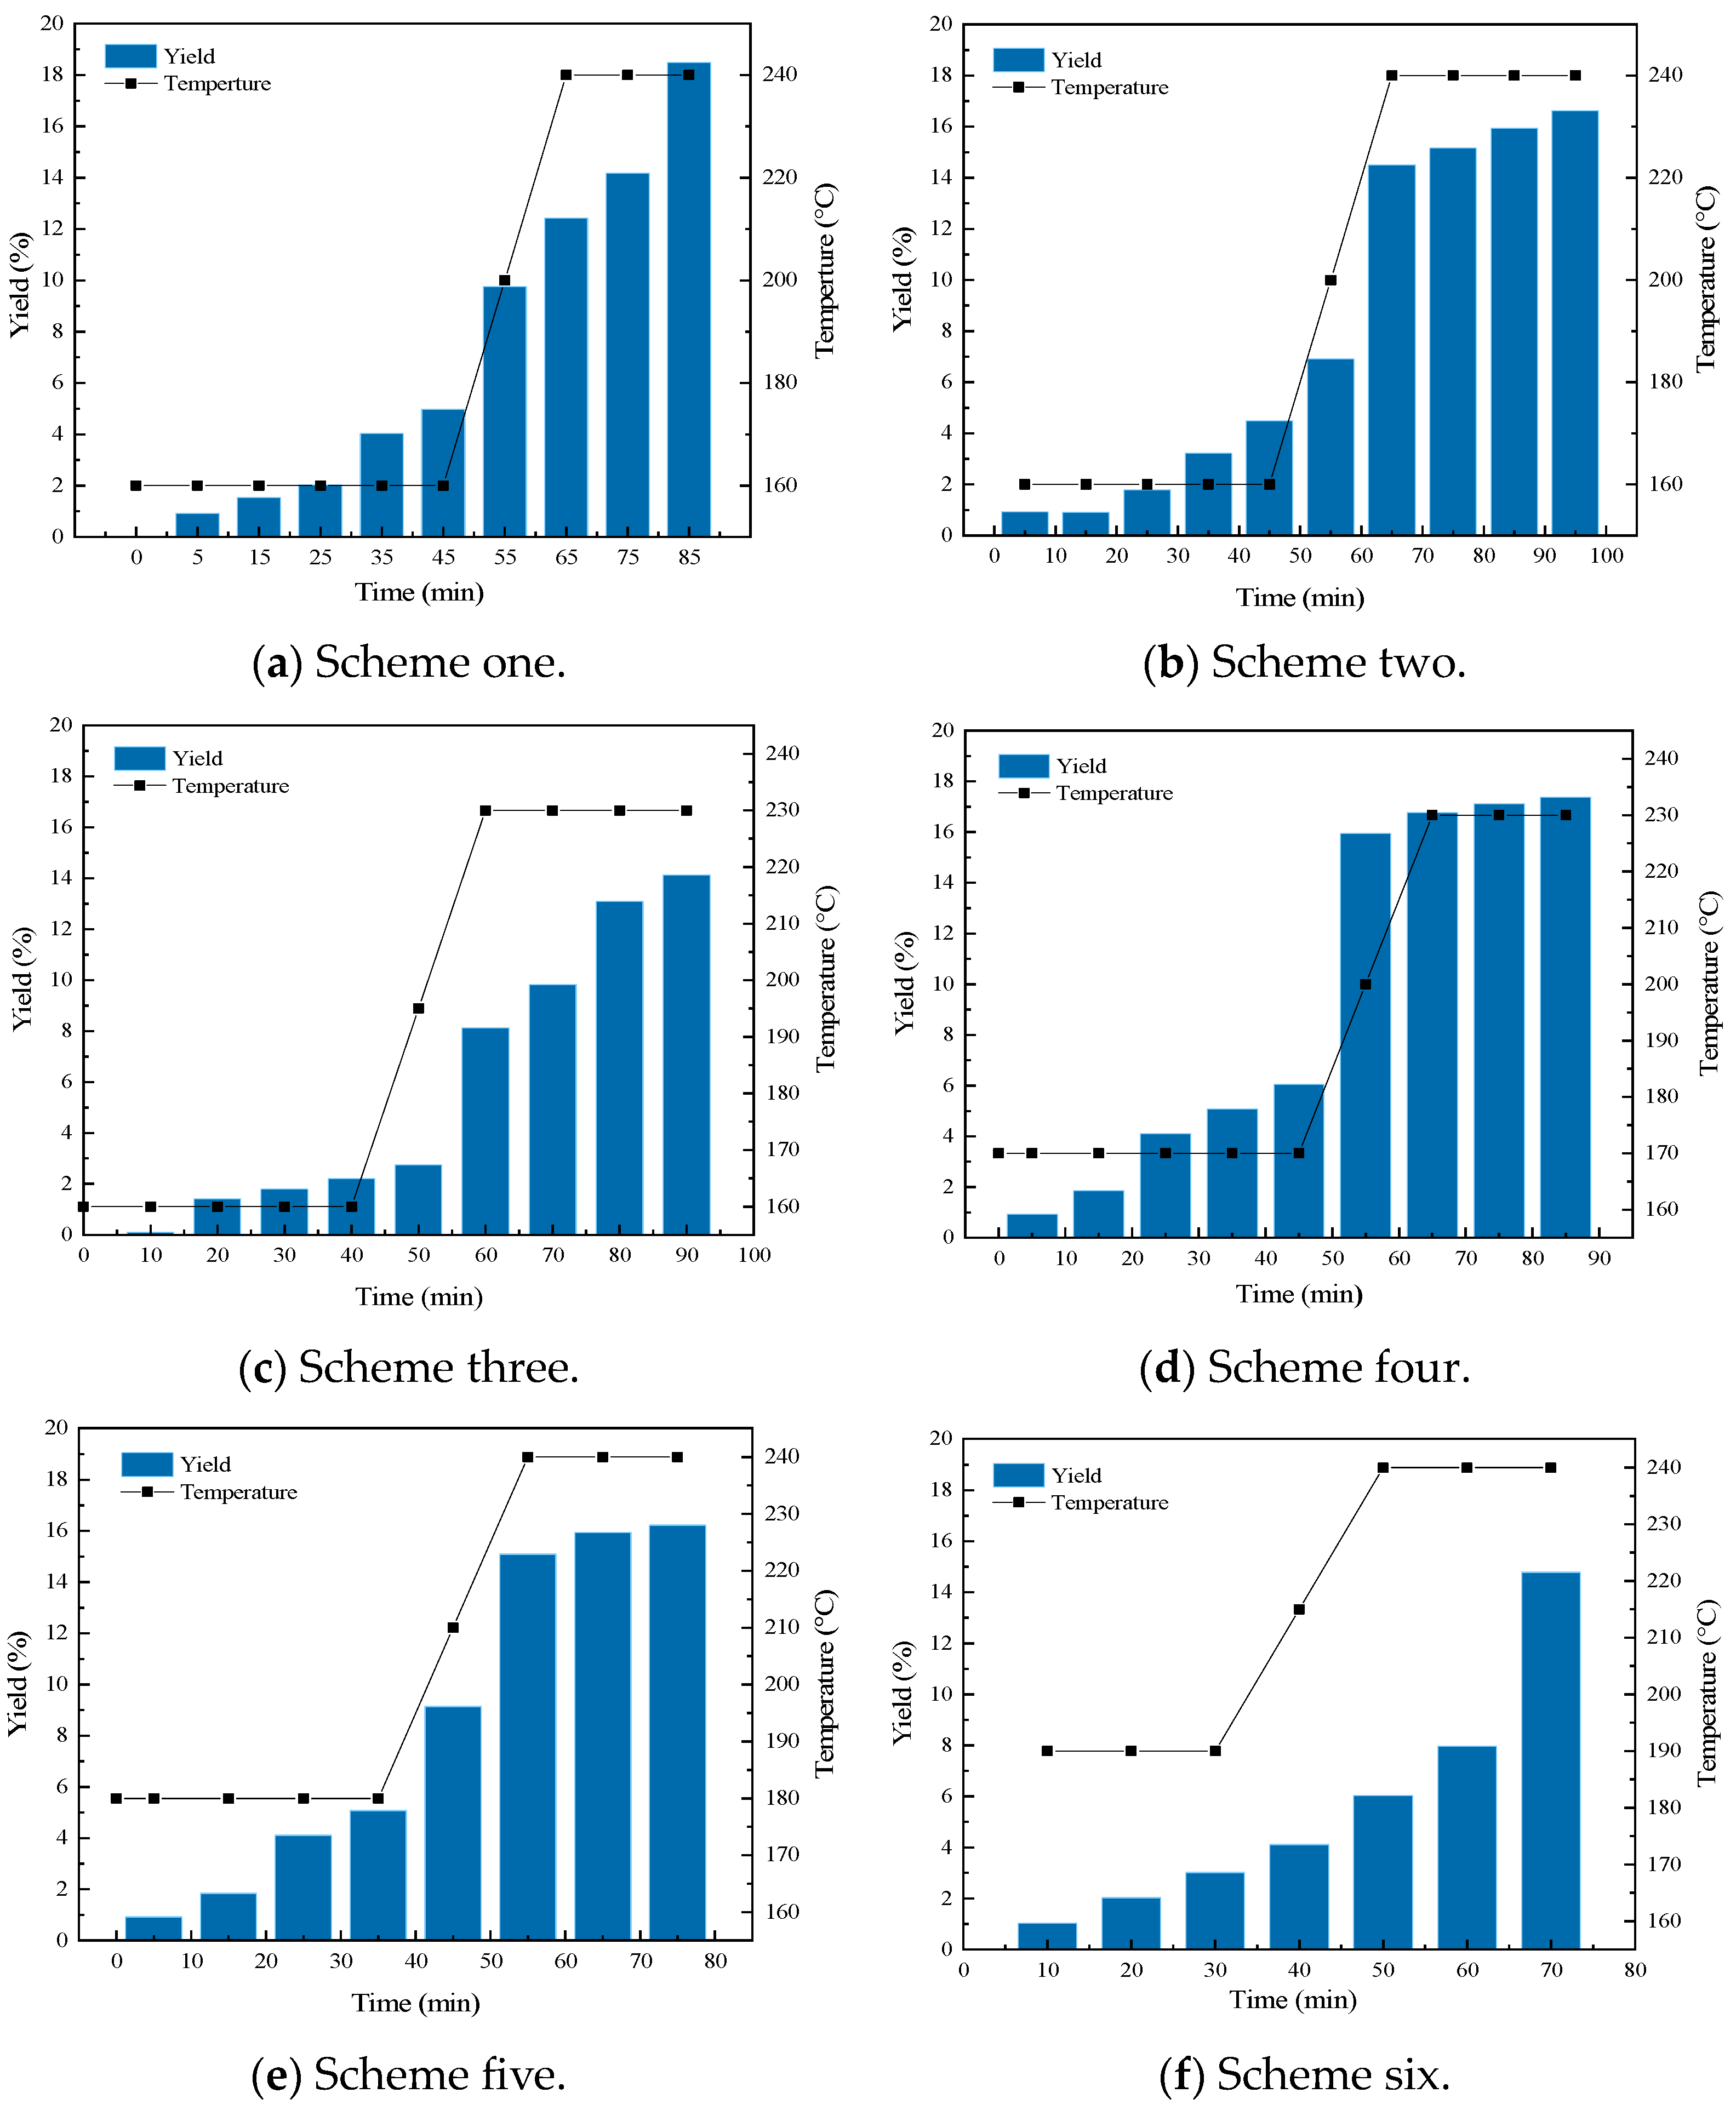
| Scheme one | 160 | 45 | 240 | 20 | 18.5 |
| Scheme two | 160 | 45 | 240 | 30 | 16.6 |
| Scheme three | 160 | 45 | 230 | 25 | 14.1 |
| Scheme four | 170 | 45 | 230 | 20 | 17.4 |
| Scheme five | 180 | 35 | 240 | 20 | 16.8 |
| Scheme six | 190 | 30 | 240 | 20 | 14.8 |
| Name | Heating Module | Reaction Module | Separation Module | Heating Module | Reaction Module | Separation Module | Mixing Module |
|---|---|---|---|---|---|---|---|
| ID | H-1 | PREHEAT | FLASH1 | H-2 | HEAT | FLASH | MIX |
| Number | Chemical Reaction Equation | Pre-Exponential Factor | Activation Energy (kJ/mol) |
|---|---|---|---|
| R1 | CO(NH2)2 → NH3 + HNCO | 3 × 10⁴ | 84.42 |
| R2 | CO(NH2)2 + HNCO → C2H5N3O2 | 3.3 × 10¹⁰ | 85.54 |
| R3 | C2H5N3O2 → CO(NH2)2 + HNCO | 5.626 × 1024 | 266.38 |
| R4 | CO(NH2)2 → NH3 + HNCO | 3 × 10⁴ | 84.42 |
| R5 | C2H5N3O2 + HNCO → C3H3N3O3 + NH3 | 2.5031 × 10¹⁹ | 153.12 |
| R6 | 2C2H5N3O2 → C3H3N3O3 + HNCO + 2NH3 | 2.5031 × 10¹⁹ | 254.12 |
| Module | Name | Parameter | Unit | Value |
|---|---|---|---|---|
| Urea | FEED | Flow rate | kg/h | 100 |
| Urea | FEED | Temperature | °C | 25 |
| Heating module | H-1 | Temperature | °C | 160 |
| Reaction module | PREHEAT | Temperature | °C | 160 |
| Reaction module | PREHEAT | Residence time | min | 45 |
| Separation module | FLASH1 | Temperature | °C | 160 |
| Heating module | H-2 | Temperature | °C | 240 |
| Reaction module | HEAT | Temperature | °C | 240 |
| Reaction module | HEAT | Residence time | min | 20 |
| Separation module | FLASH | Temperature | °C | 240 |
| Mixing module | MIX | Pressure | kPa | 101.325 |
Disclaimer/Publisher’s Note: The statements, opinions and data contained in all publications are solely those of the individual author(s) and contributor(s) and not of MDPI and/or the editor(s). MDPI and/or the editor(s) disclaim responsibility for any injury to people or property resulting from any ideas, methods, instructions or products referred to in the content. |
© 2024 by the authors. Licensee MDPI, Basel, Switzerland. This article is an open access article distributed under the terms and conditions of the Creative Commons Attribution (CC BY) license (https://creativecommons.org/licenses/by/4.0/).
Share and Cite
Wang, Q.; Wu, H.; Zhang, M.; Song, Q.; Hu, N.; Yang, H. Ammonia-Cyanuric Acid Co-Production in Boiler Denitrification System. Materials 2024, 17, 4692. https://doi.org/10.3390/ma17194692
Wang Q, Wu H, Zhang M, Song Q, Hu N, Yang H. Ammonia-Cyanuric Acid Co-Production in Boiler Denitrification System. Materials. 2024; 17(19):4692. https://doi.org/10.3390/ma17194692
Chicago/Turabian StyleWang, Qingjia, Haowen Wu, Man Zhang, Qiang Song, Nan Hu, and Hairui Yang. 2024. "Ammonia-Cyanuric Acid Co-Production in Boiler Denitrification System" Materials 17, no. 19: 4692. https://doi.org/10.3390/ma17194692
APA StyleWang, Q., Wu, H., Zhang, M., Song, Q., Hu, N., & Yang, H. (2024). Ammonia-Cyanuric Acid Co-Production in Boiler Denitrification System. Materials, 17(19), 4692. https://doi.org/10.3390/ma17194692