Mechanical Properties, Durability Performance, and Microstructure of CaO-Fly Ash Solidified Sludge from Northeast, China

 ,
,
Abstract
:1. Introduction
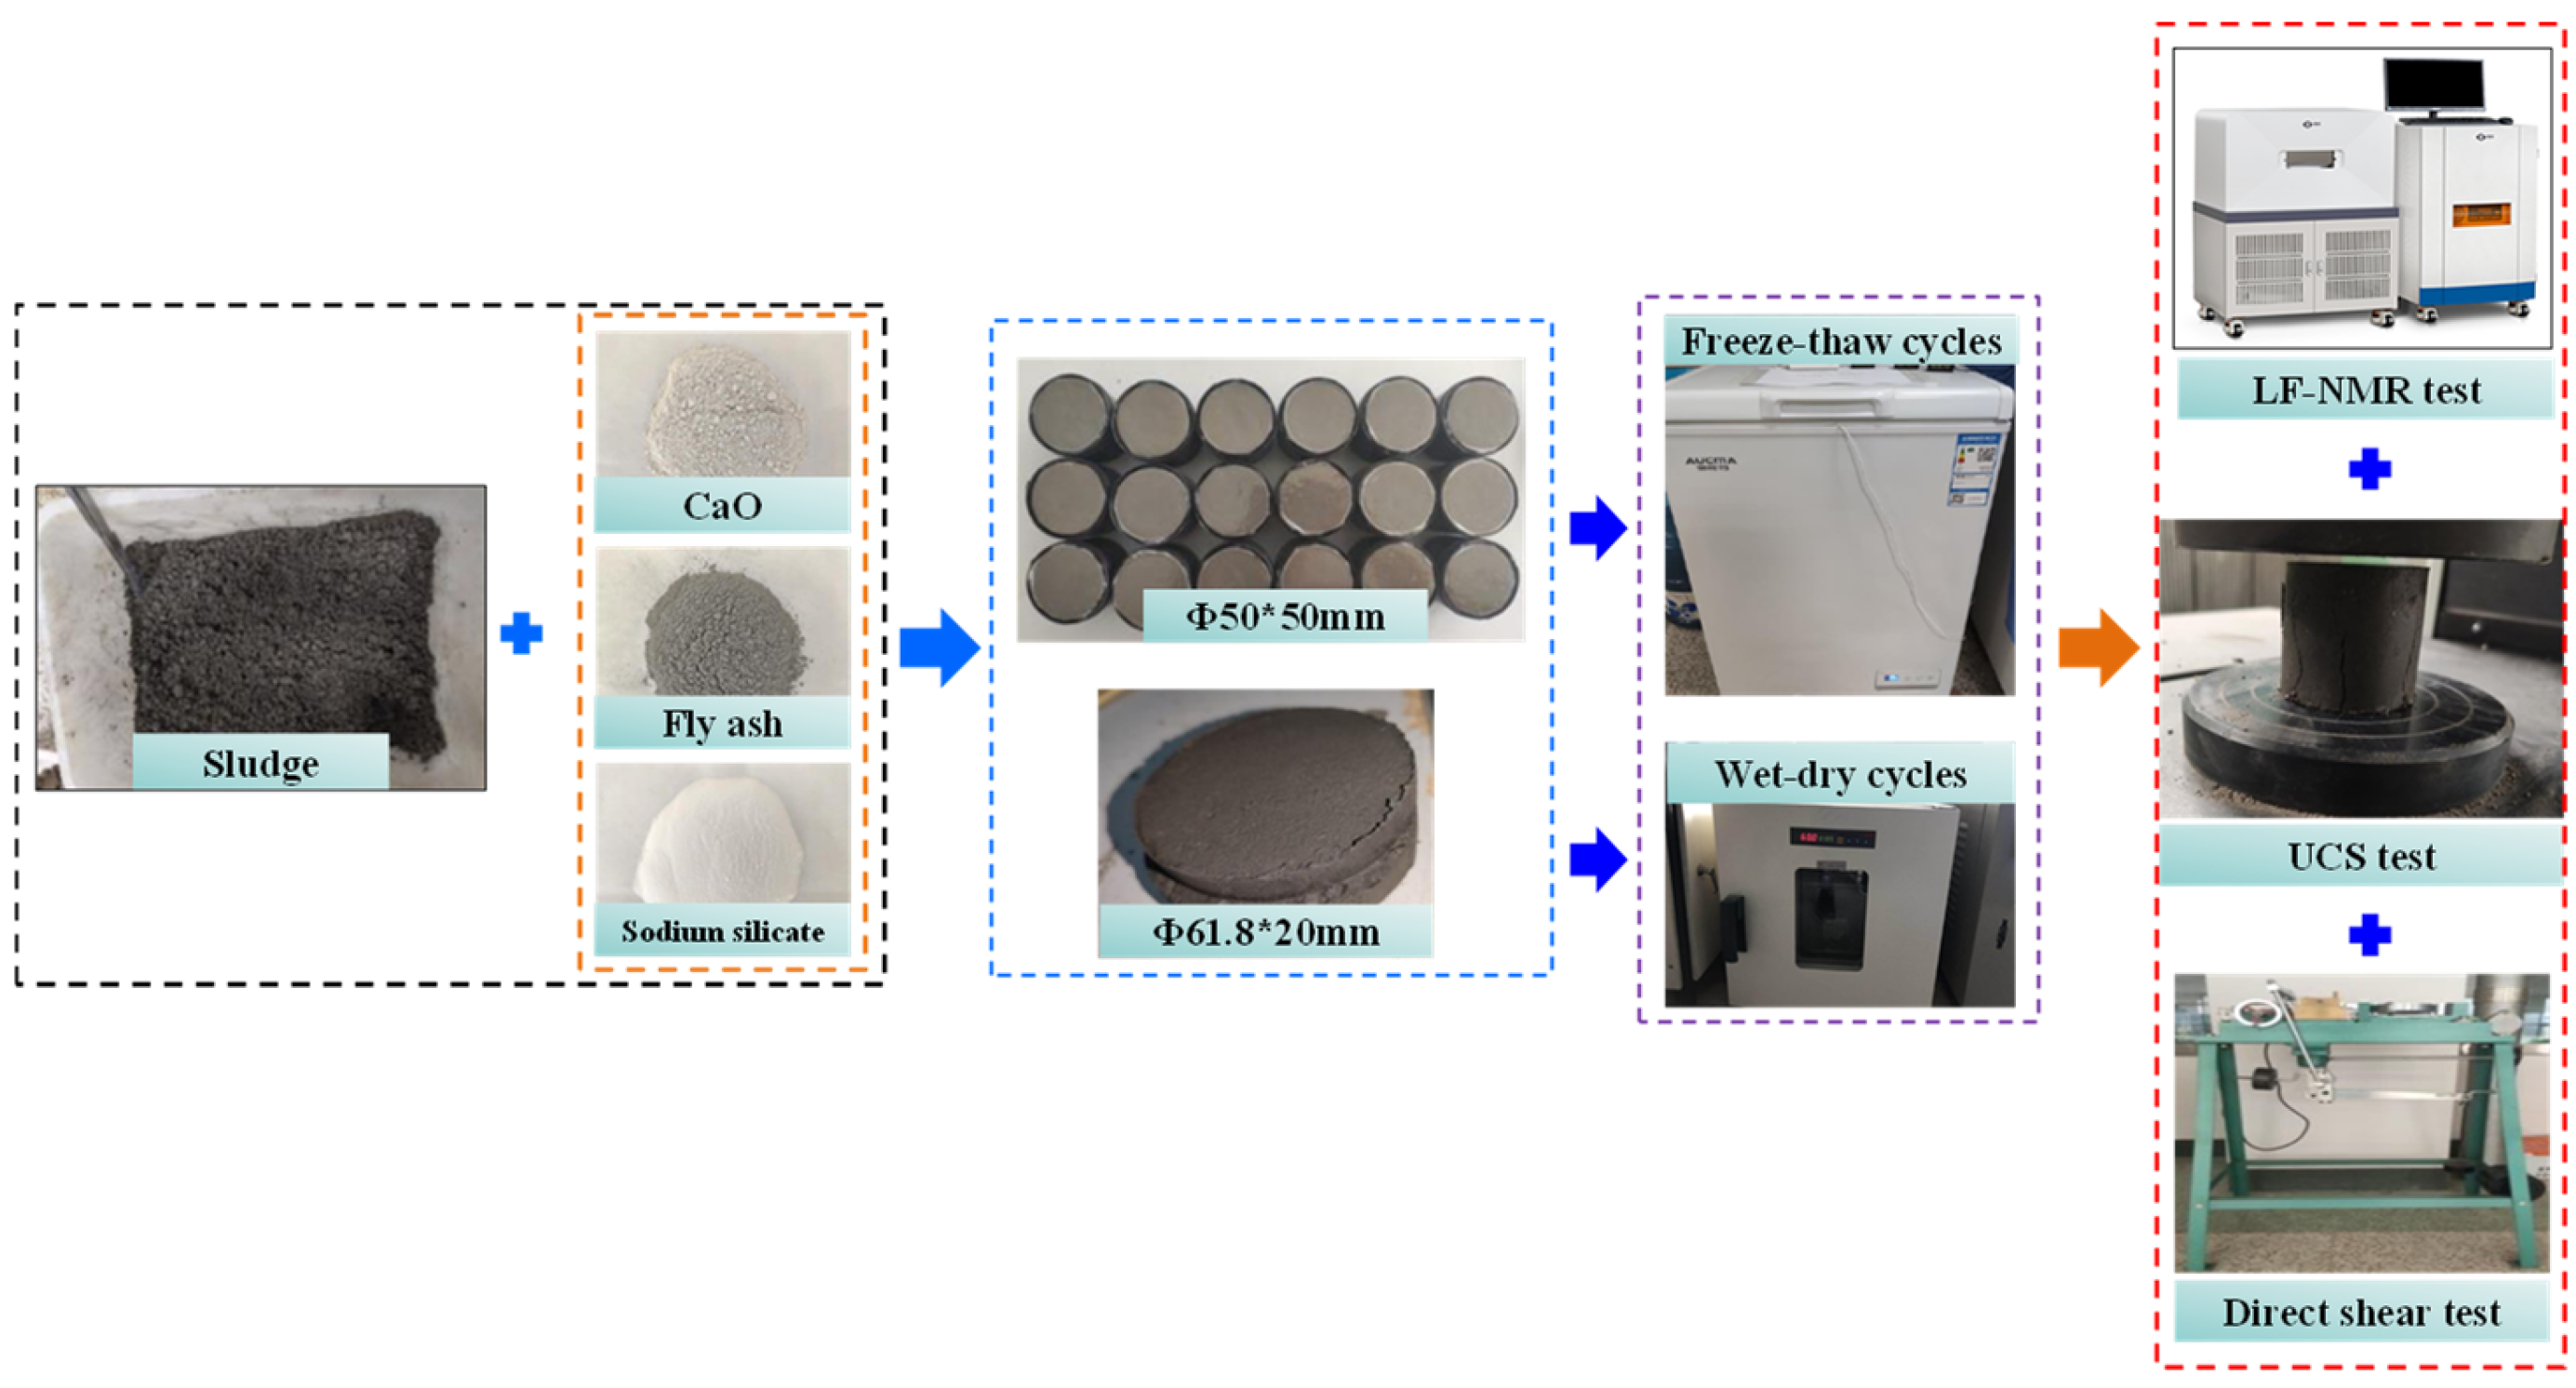
2. Materials and Experiment Design
2.1. Materials
2.2. Preparation of Specimens
2.3. Testing Methods
2.3.1. UCS Test
2.3.2. Direct Shear Test
2.3.3. F-T Cycle
2.3.4. W-D Cycle
2.3.5. LF-NMR Test
3. Results and Discussion
3.1. Strength Characteristics
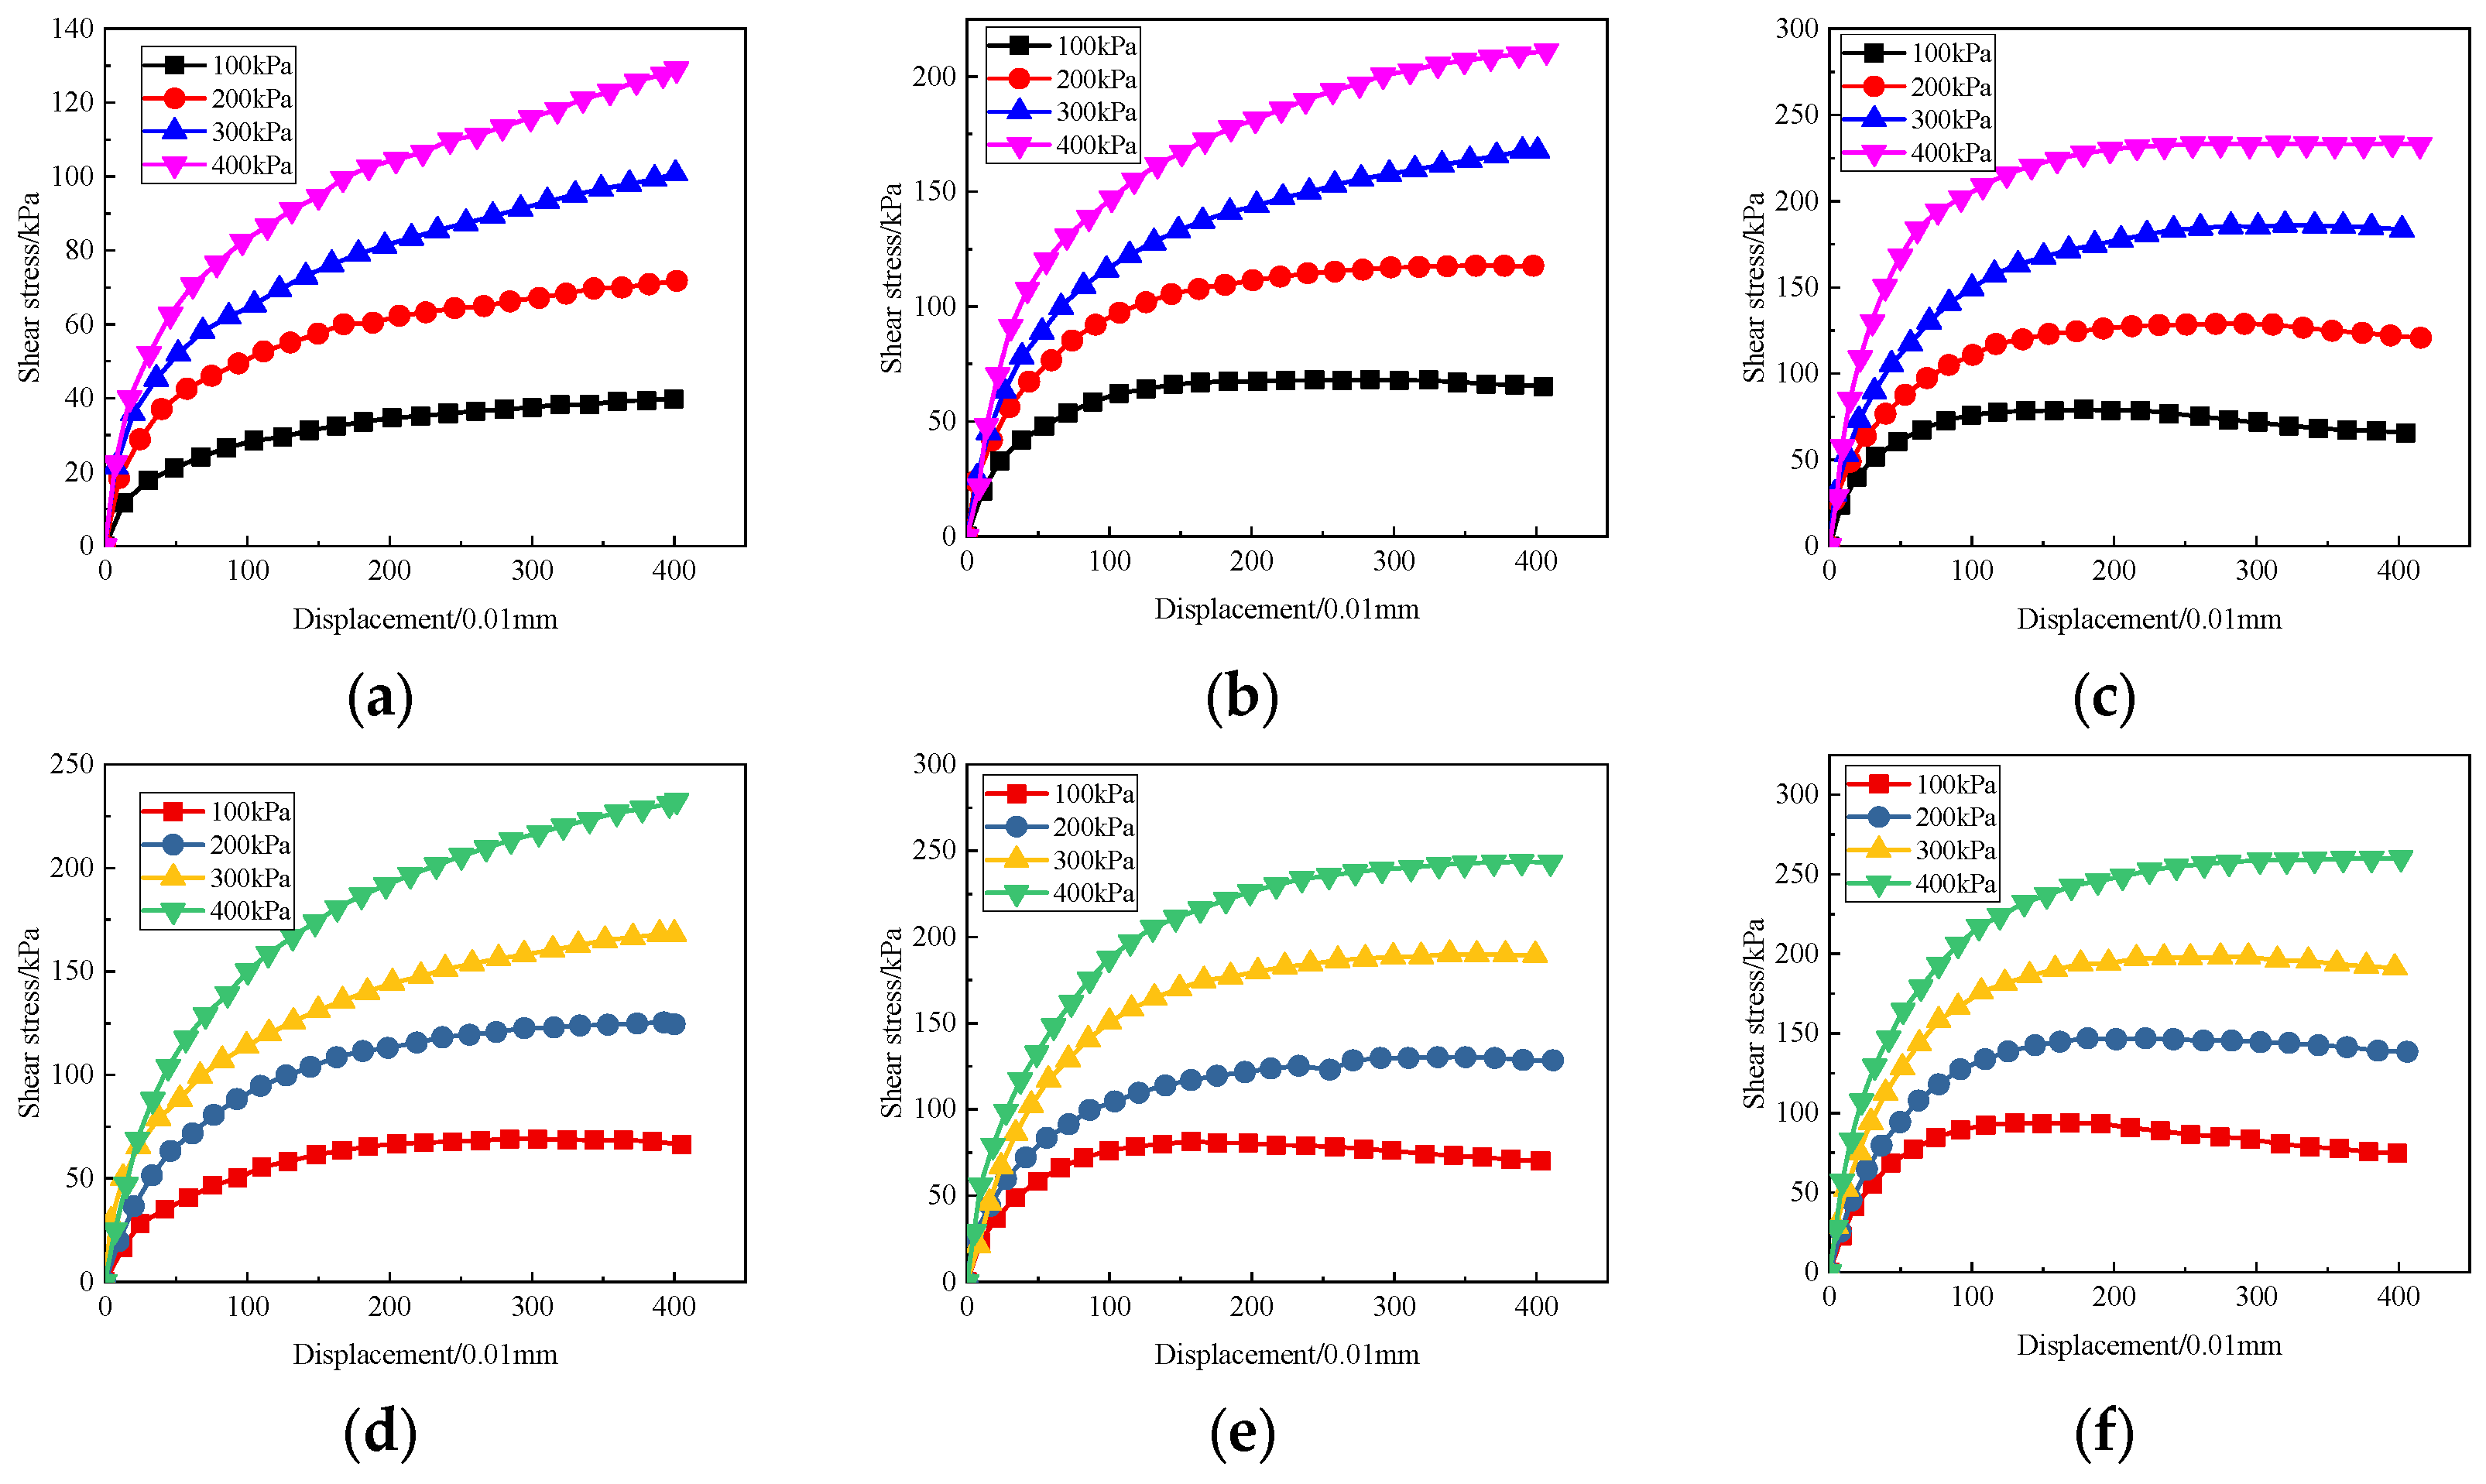
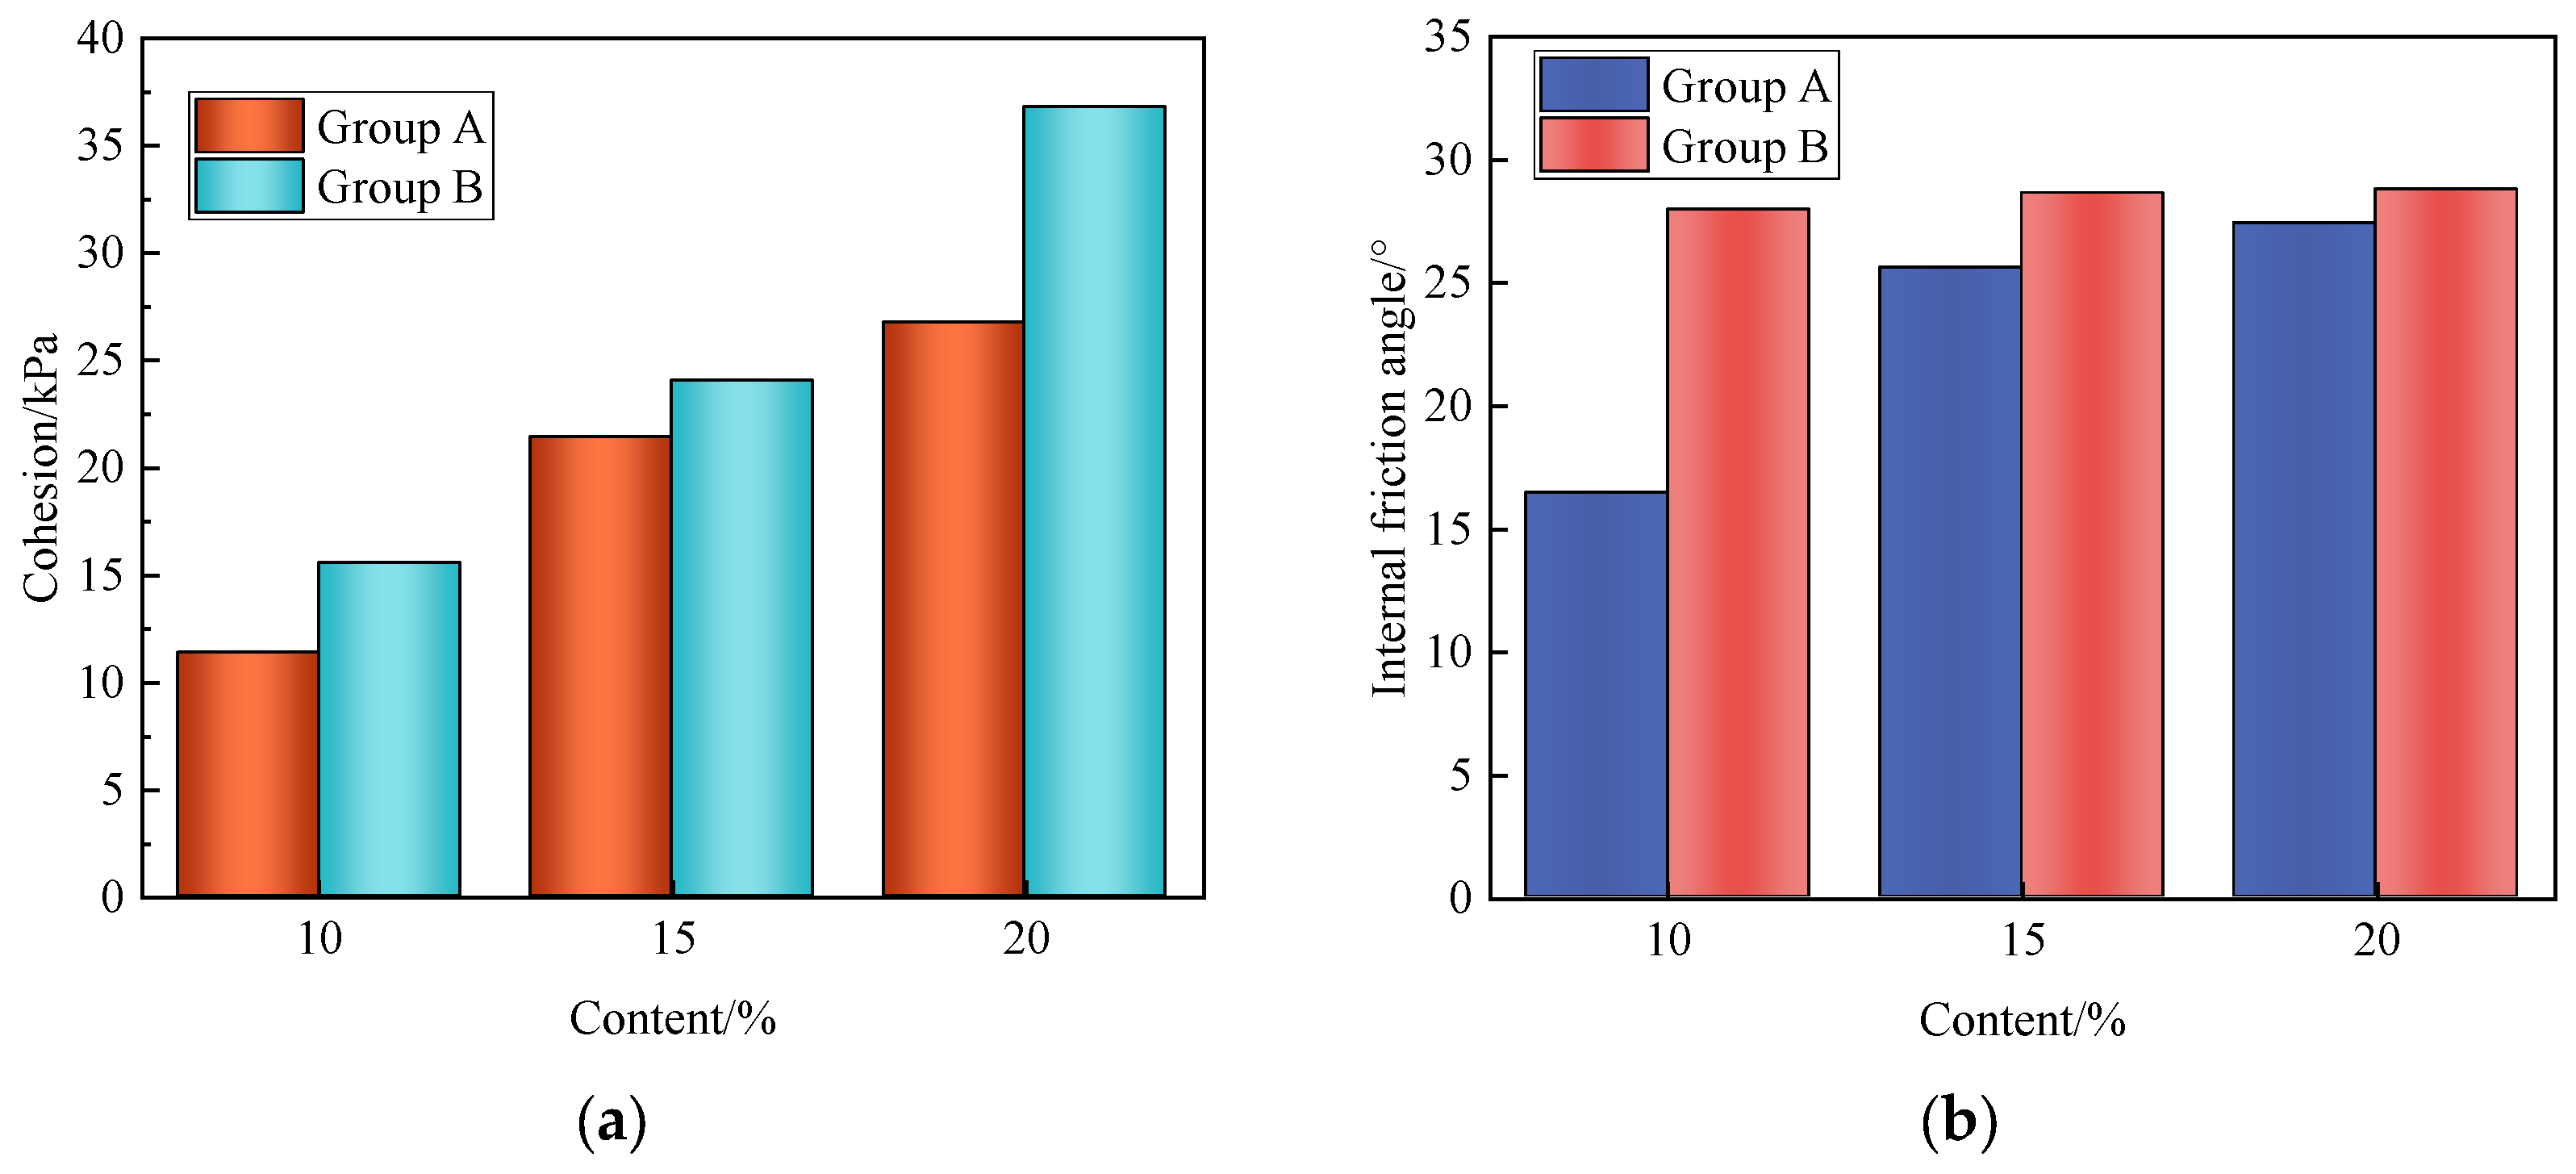
3.2. Direct Shear Test
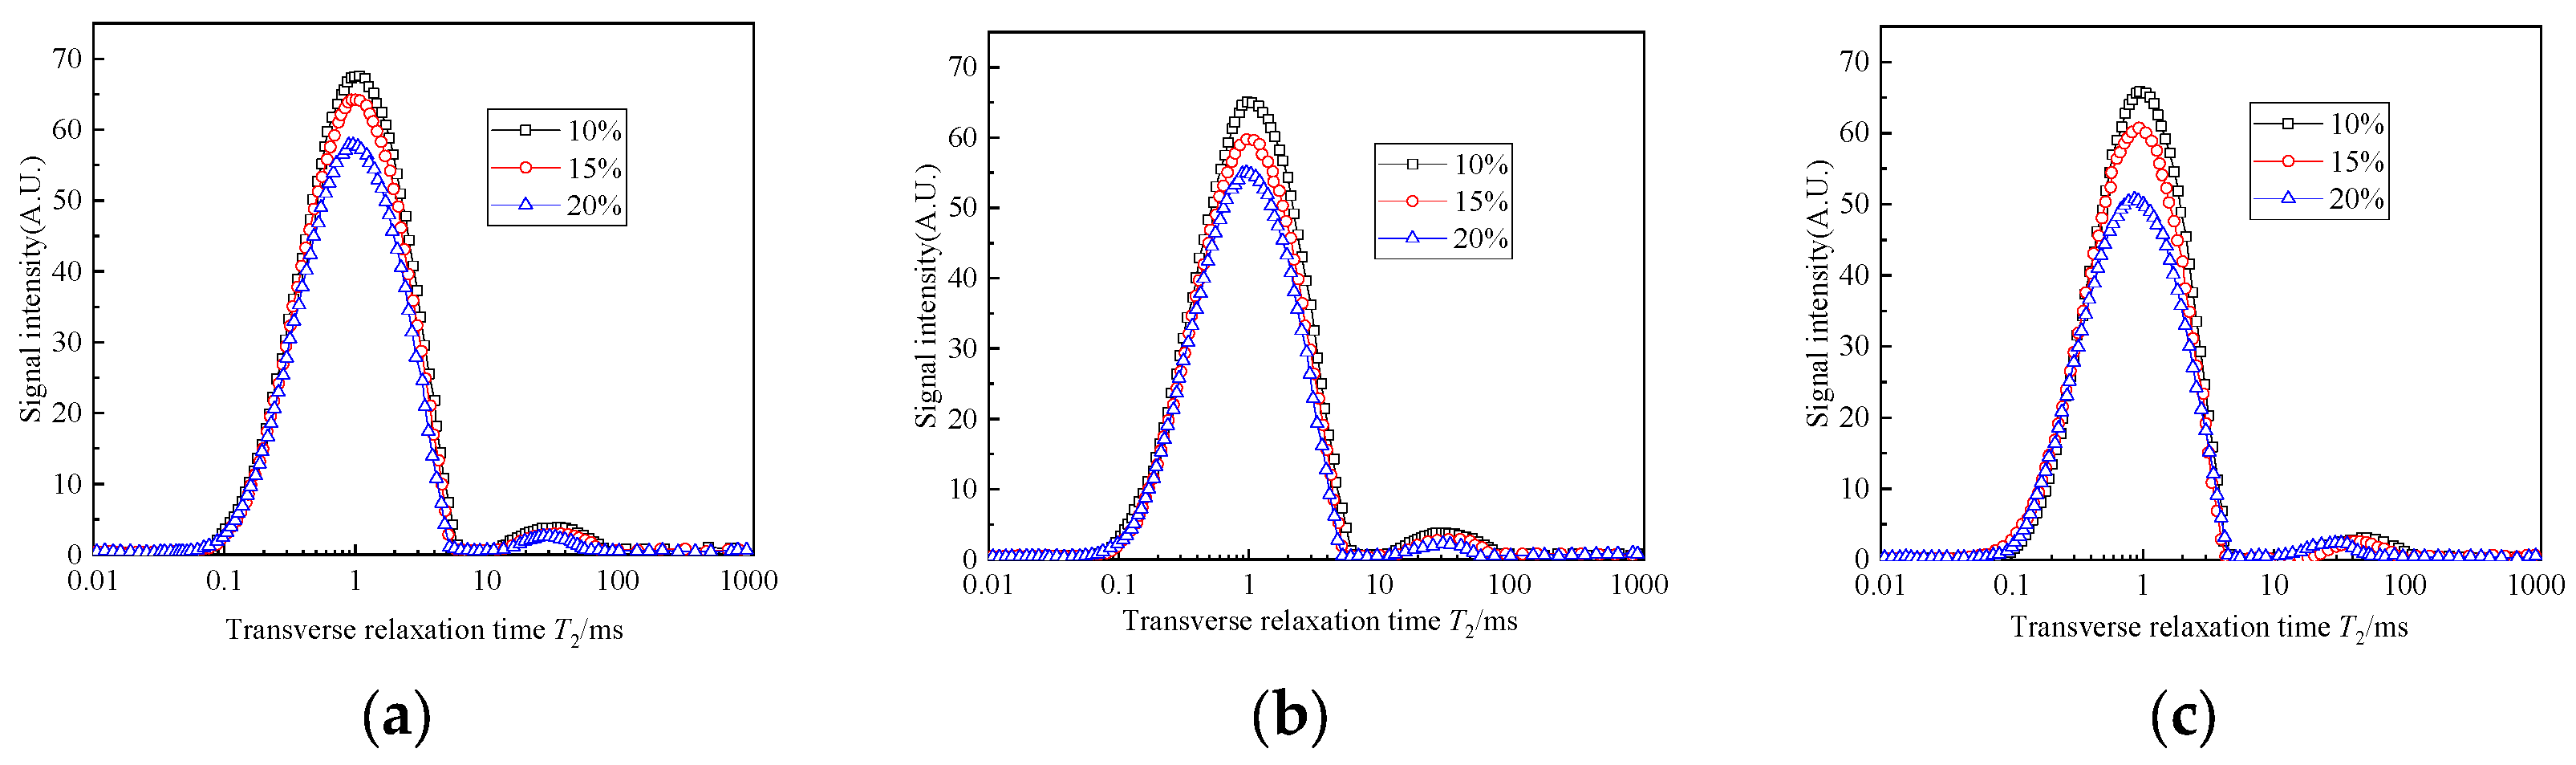
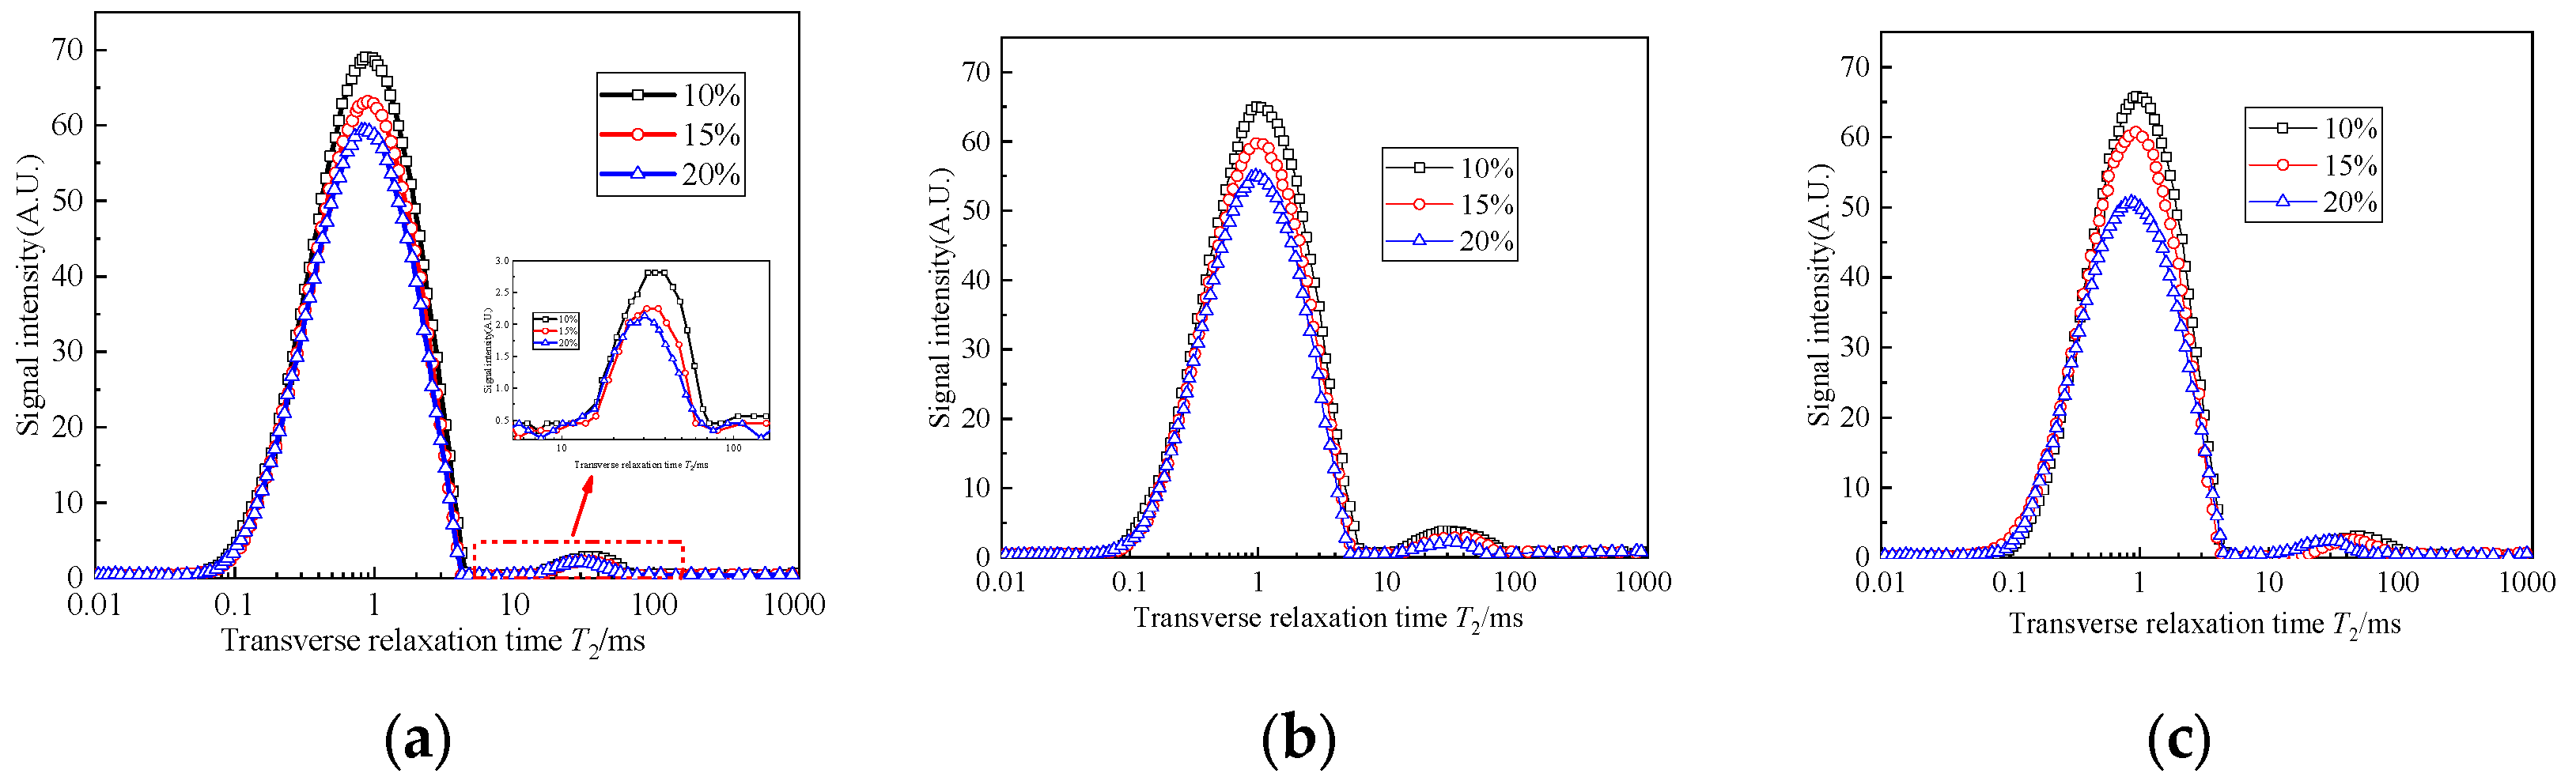
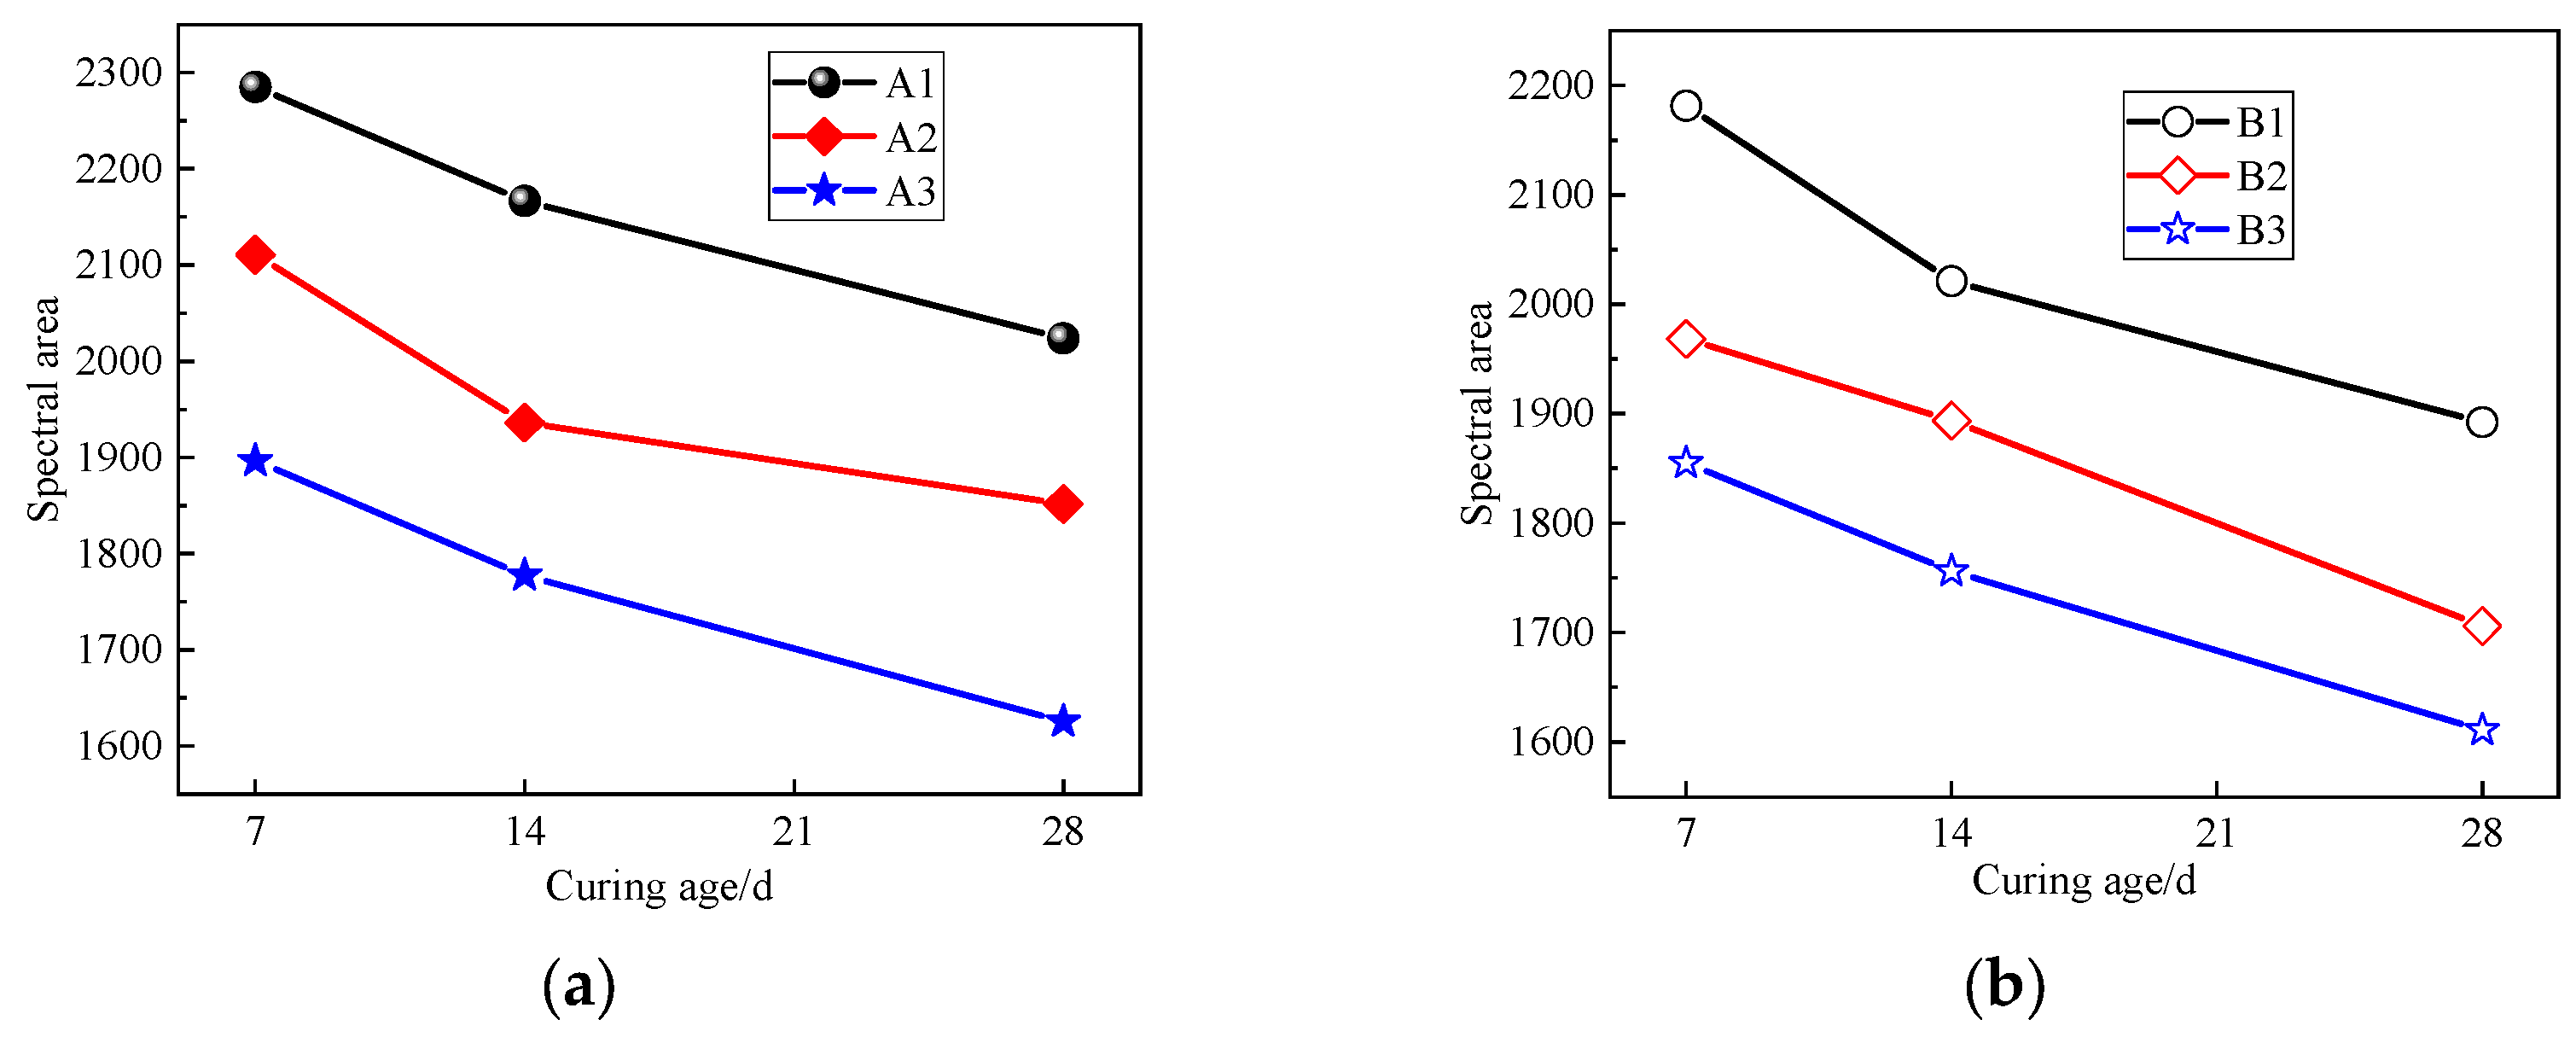
3.3. Effect of the Curing Age and Curing Agent Content on the Transverse Relaxation Time T2
4. Durability of Solidified Sludge
4.1. F-T Cycles
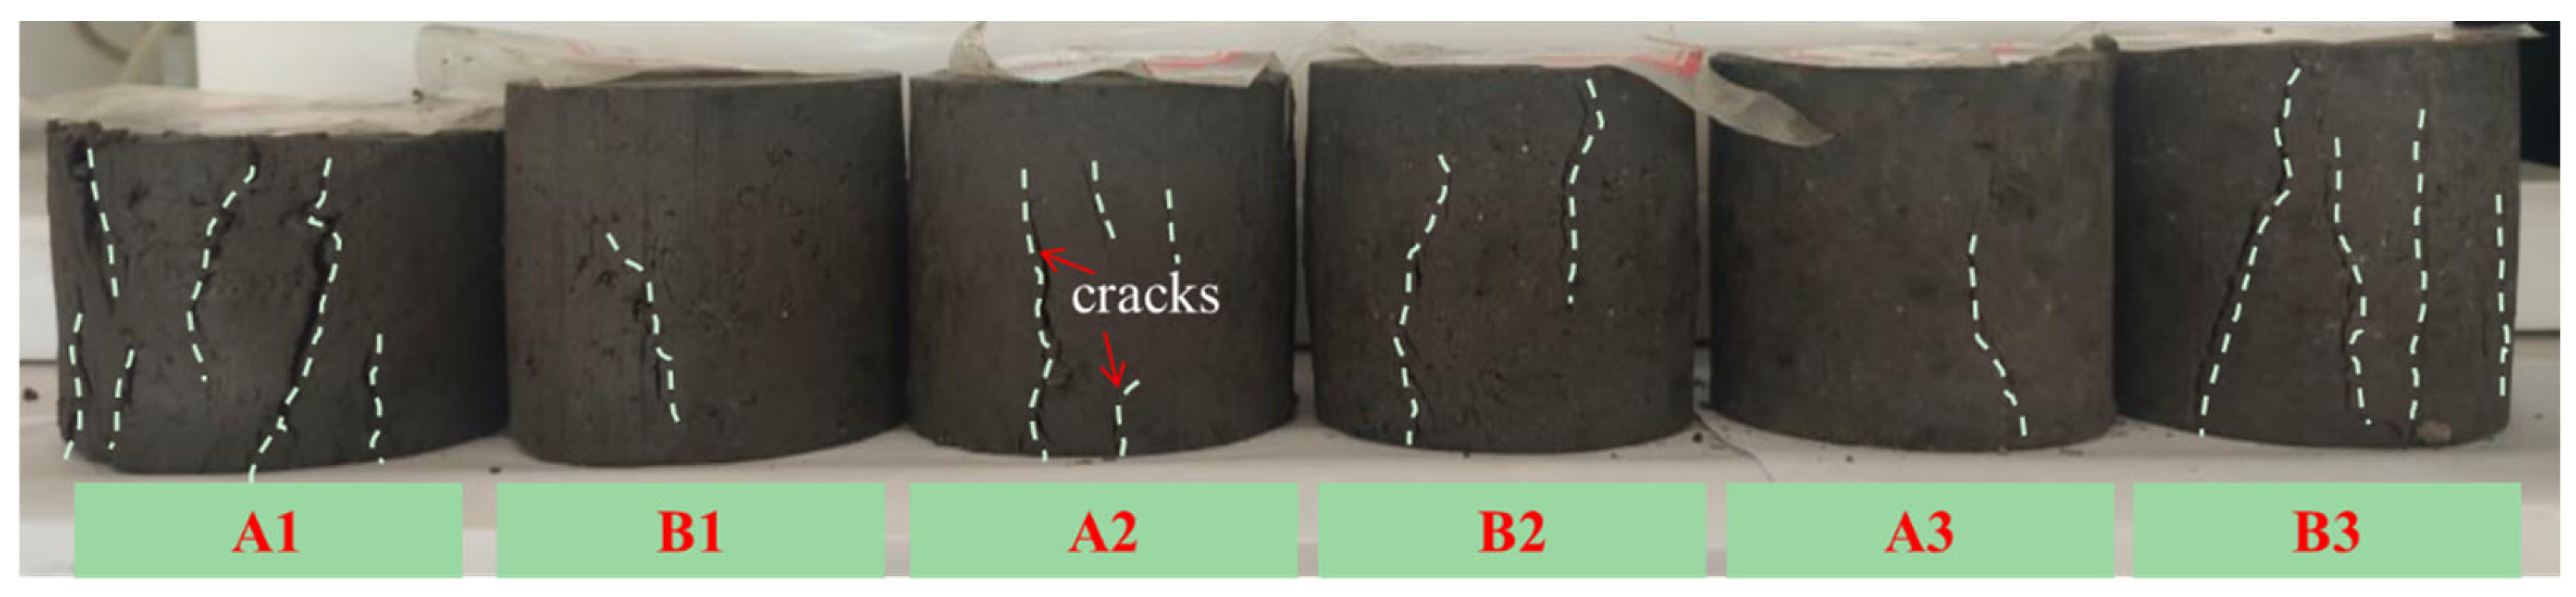
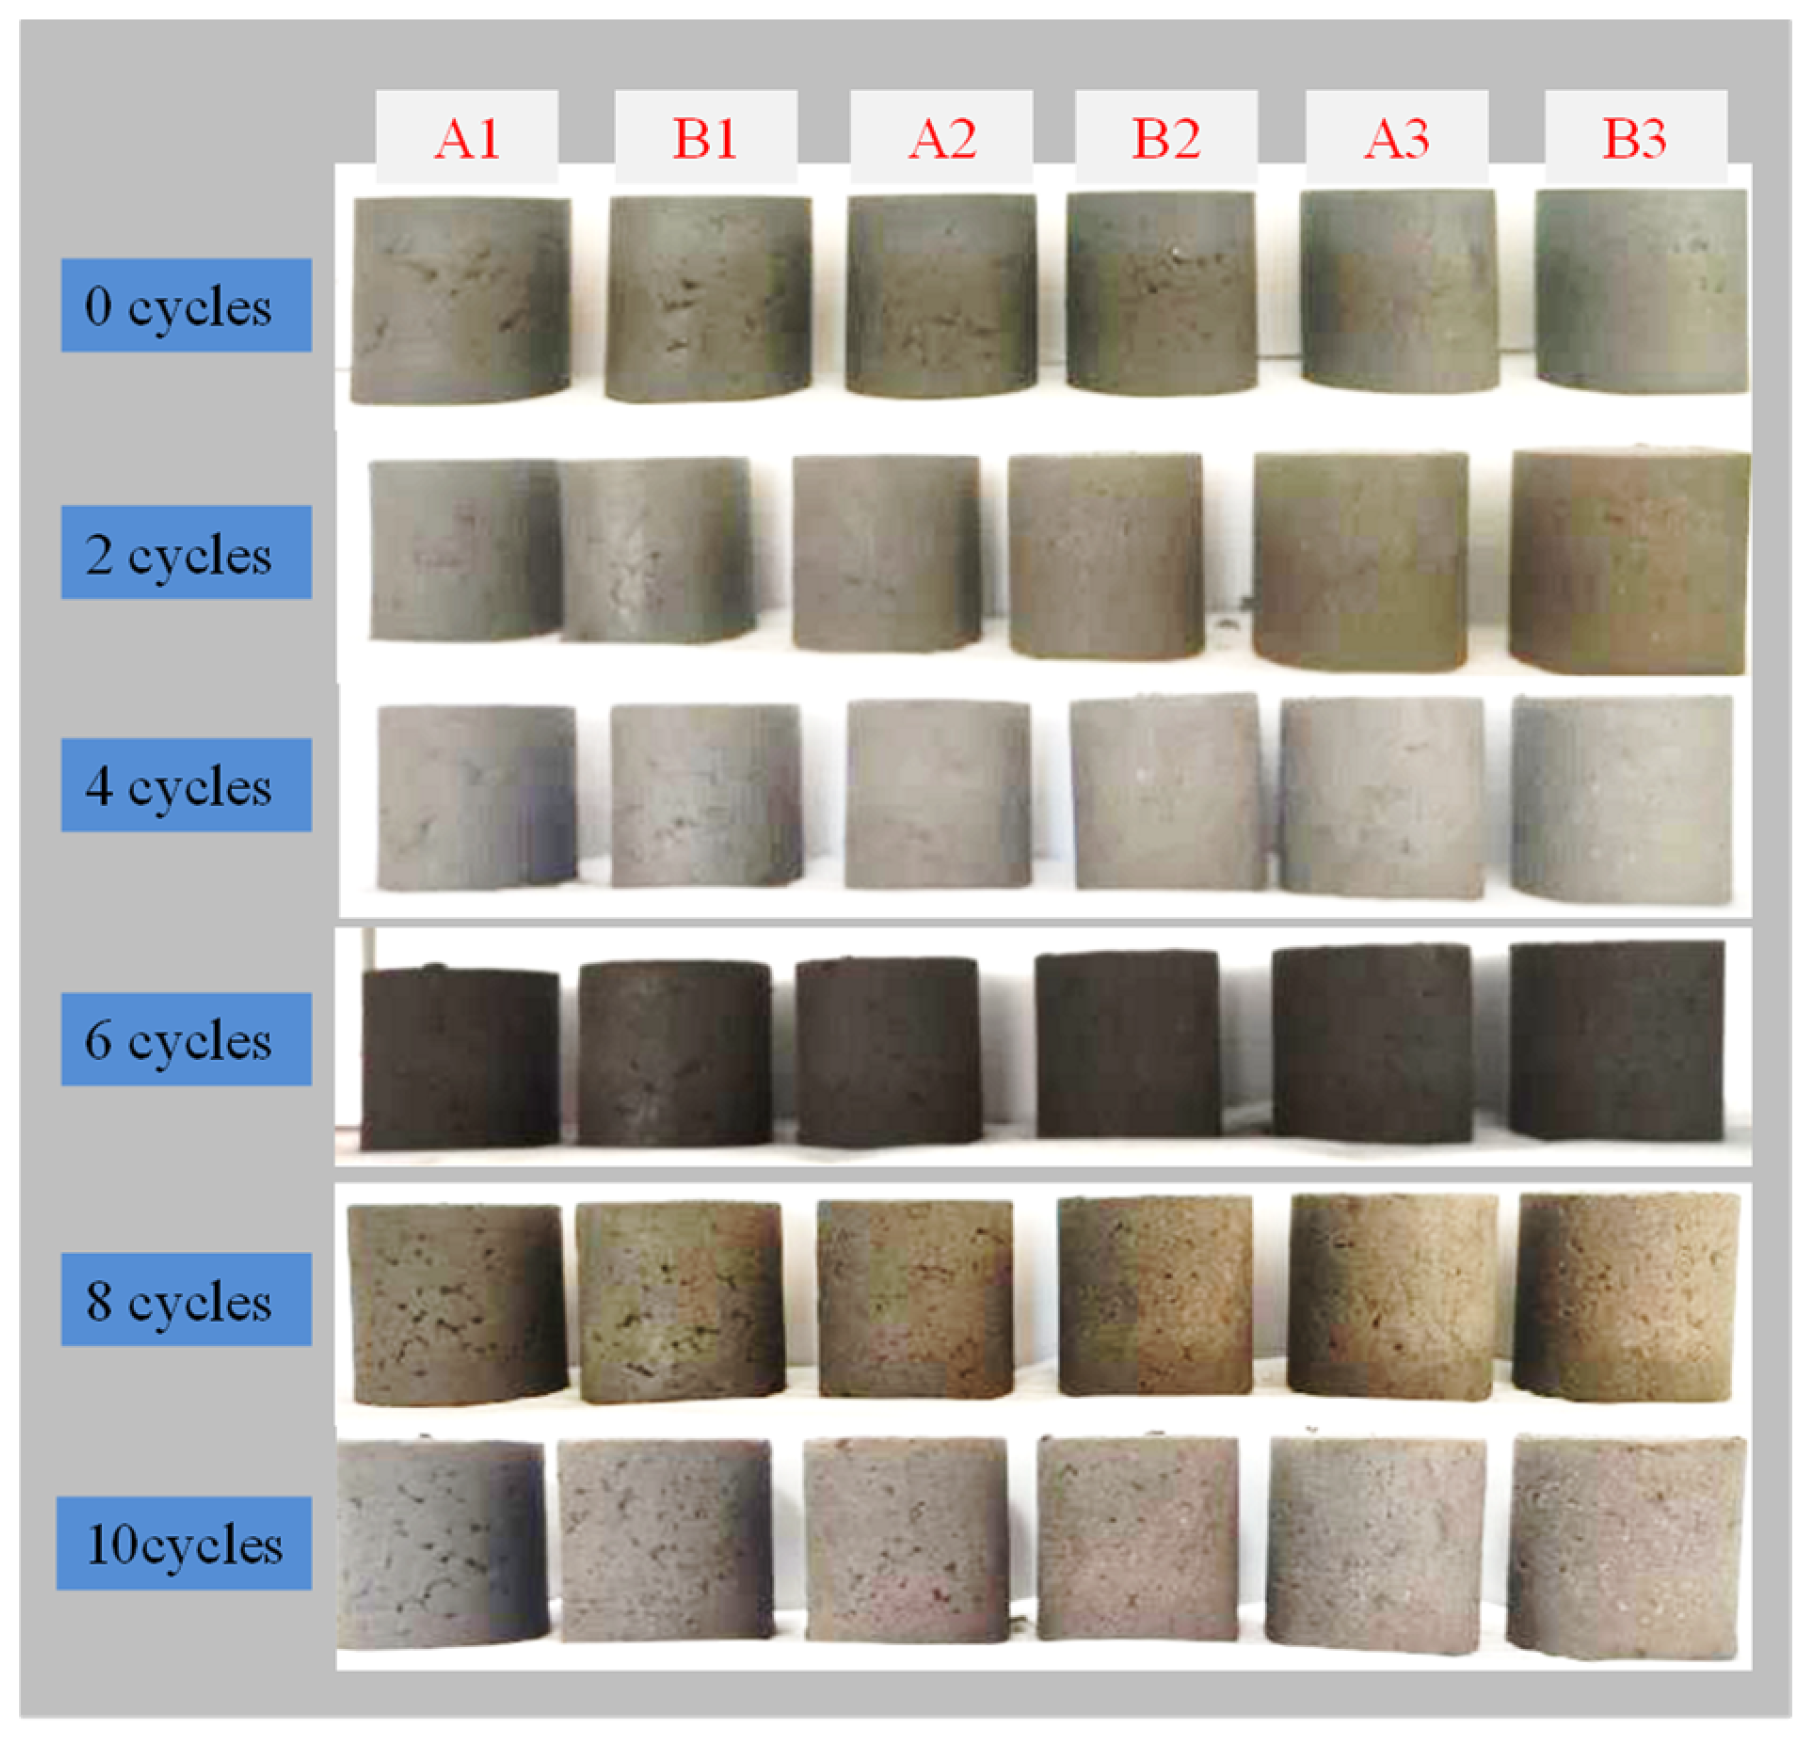
4.1.1. Failure Characteristics after F-T Cycles
4.1.2. UCS after F-T Cycles
4.1.3. Evolution of Microscopic Pore Structures after F-T Cycles
4.2. D-W Cycles
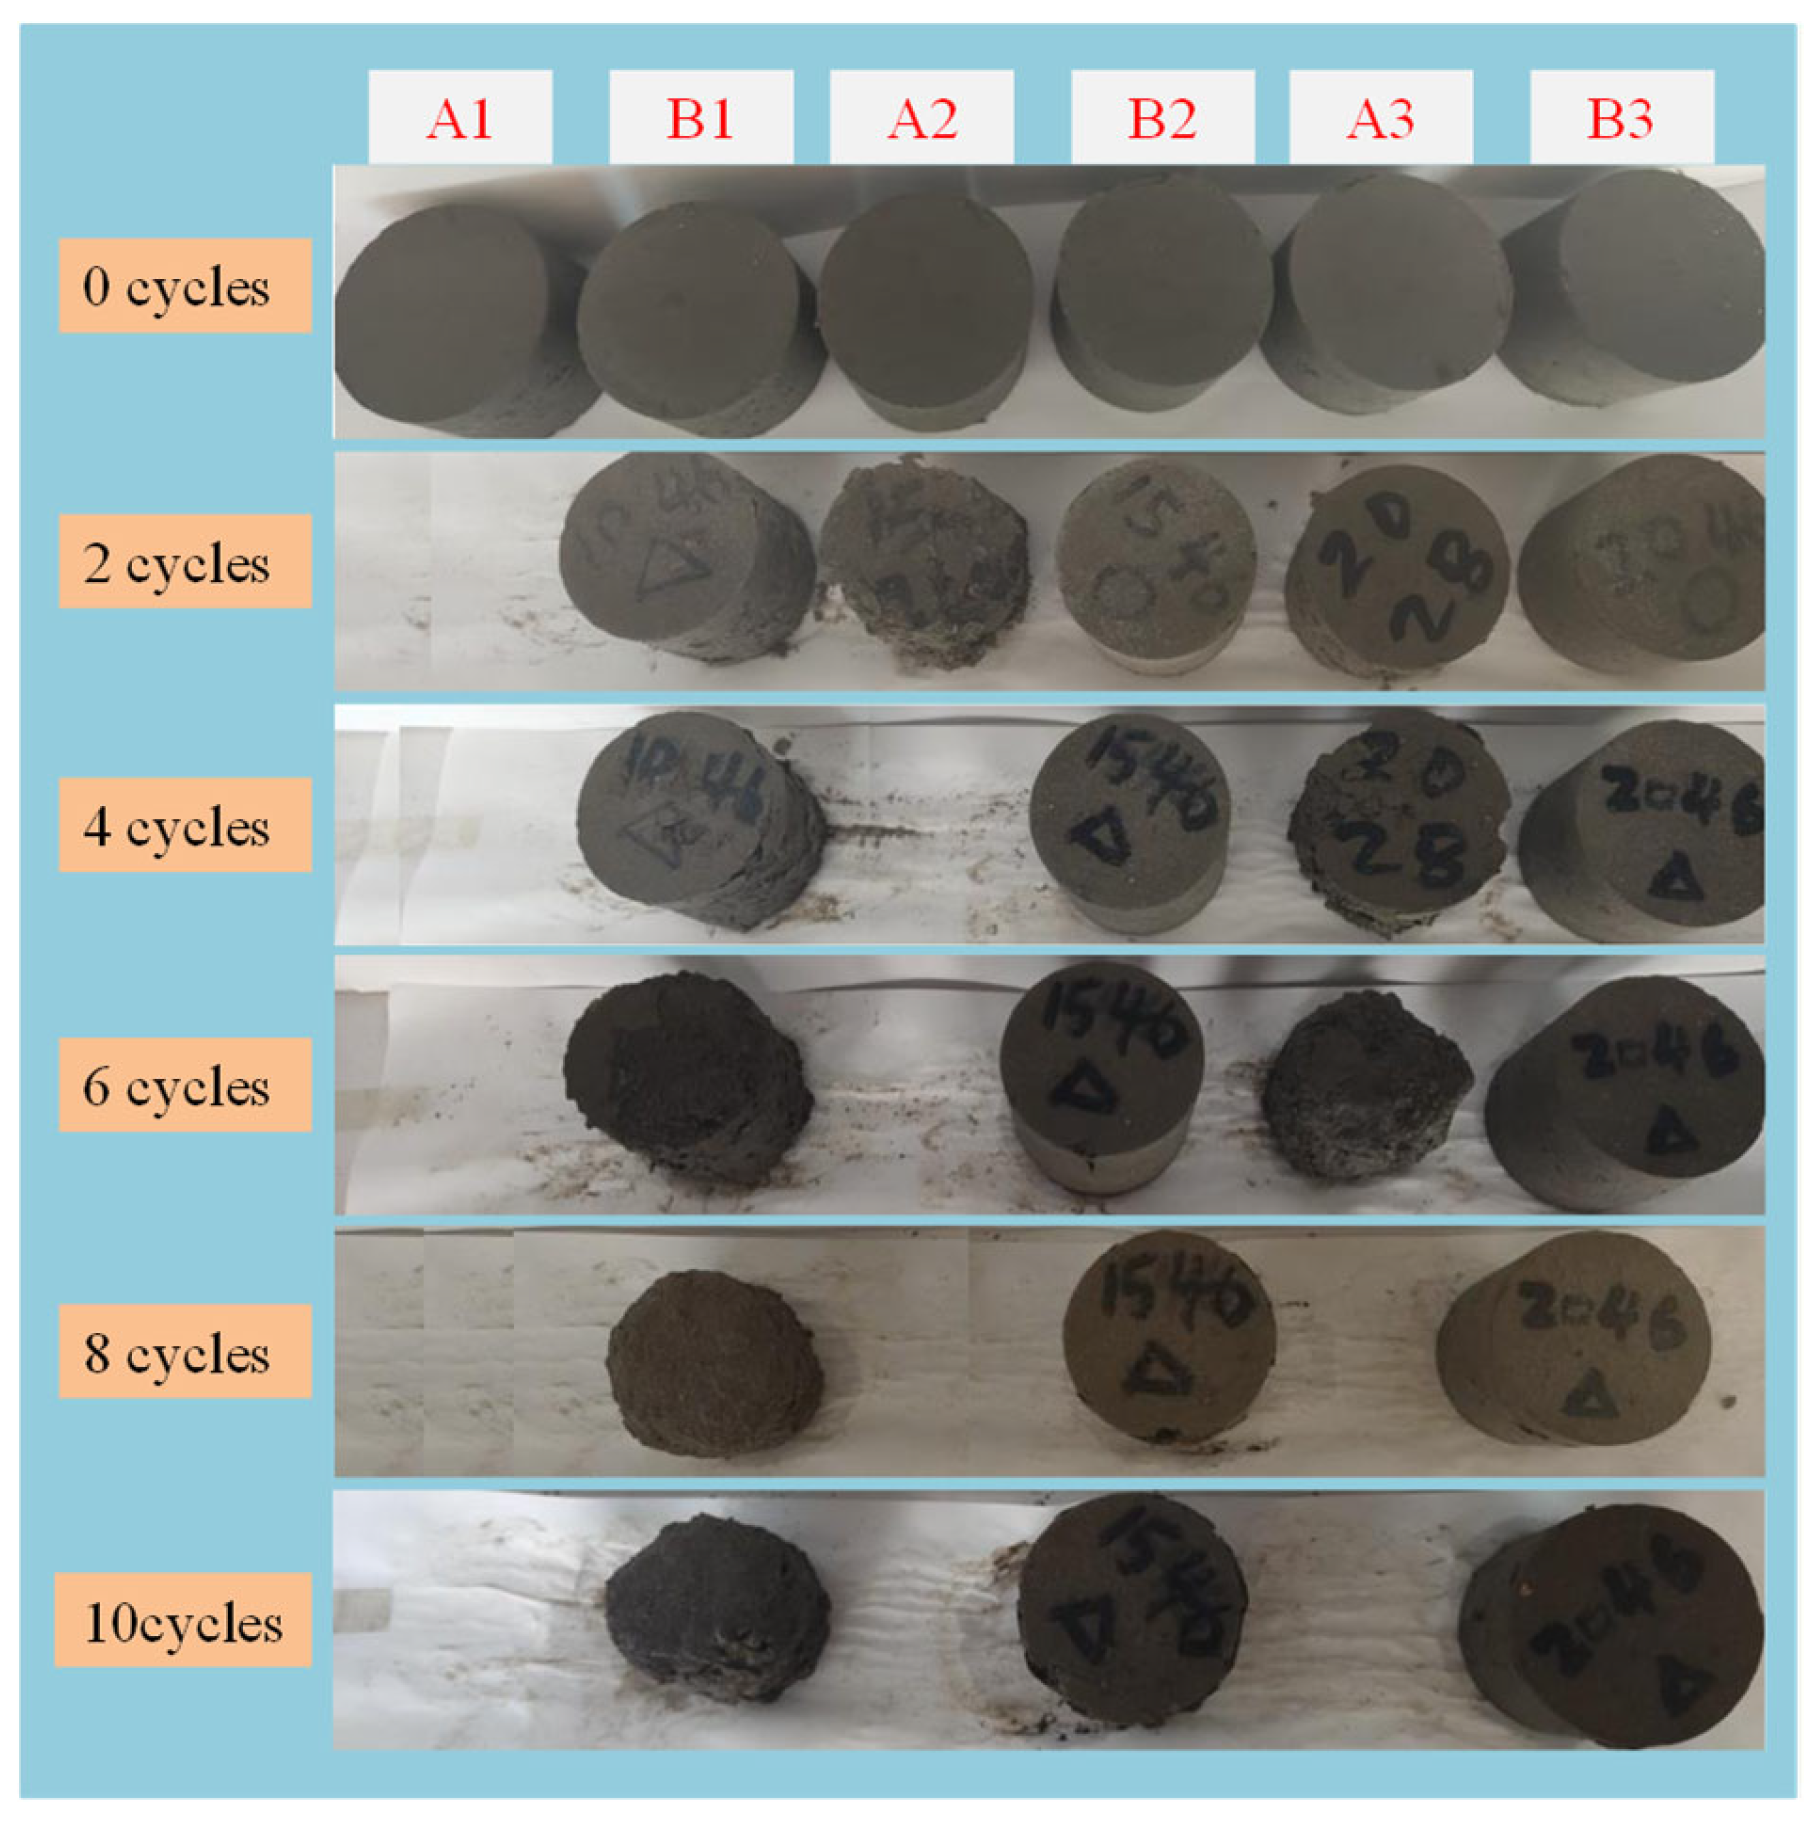
4.2.1. Failure Characteristics after D-W Cycles
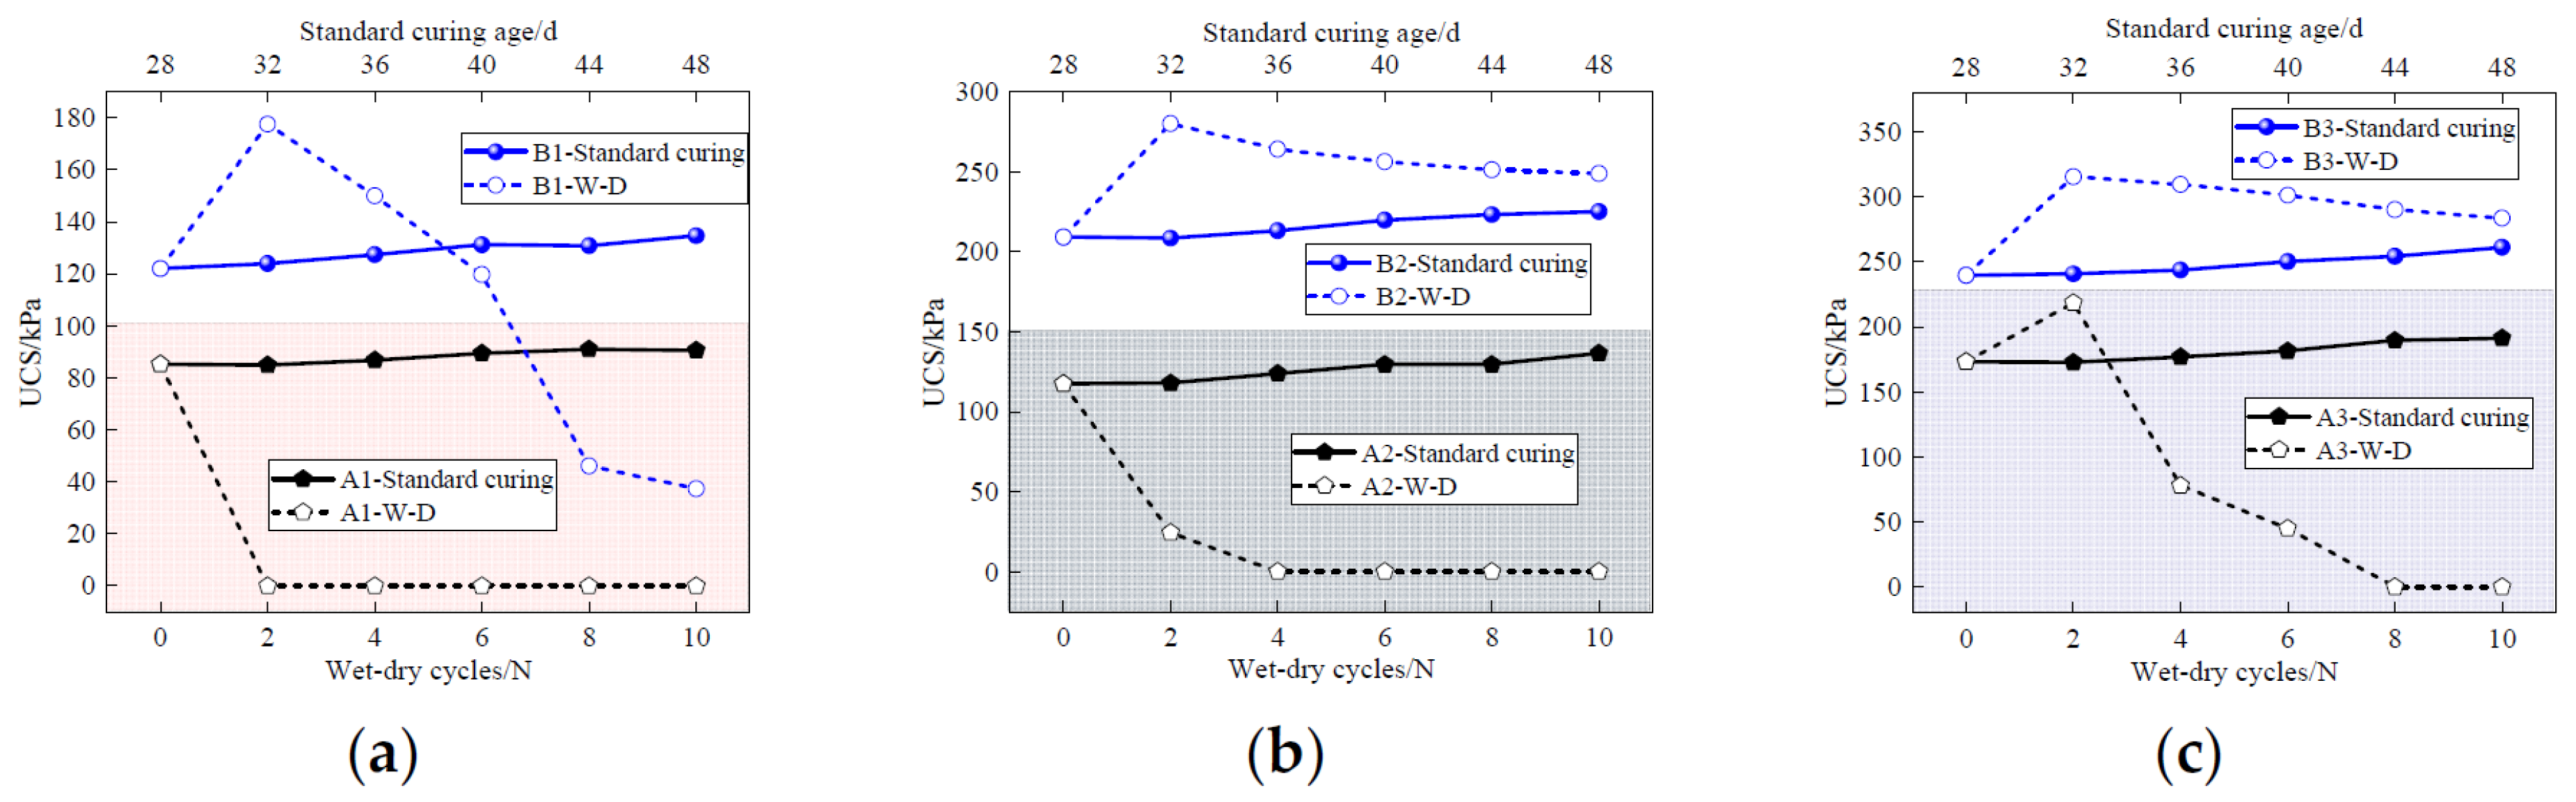
4.2.2. UCS after D-W Cycles
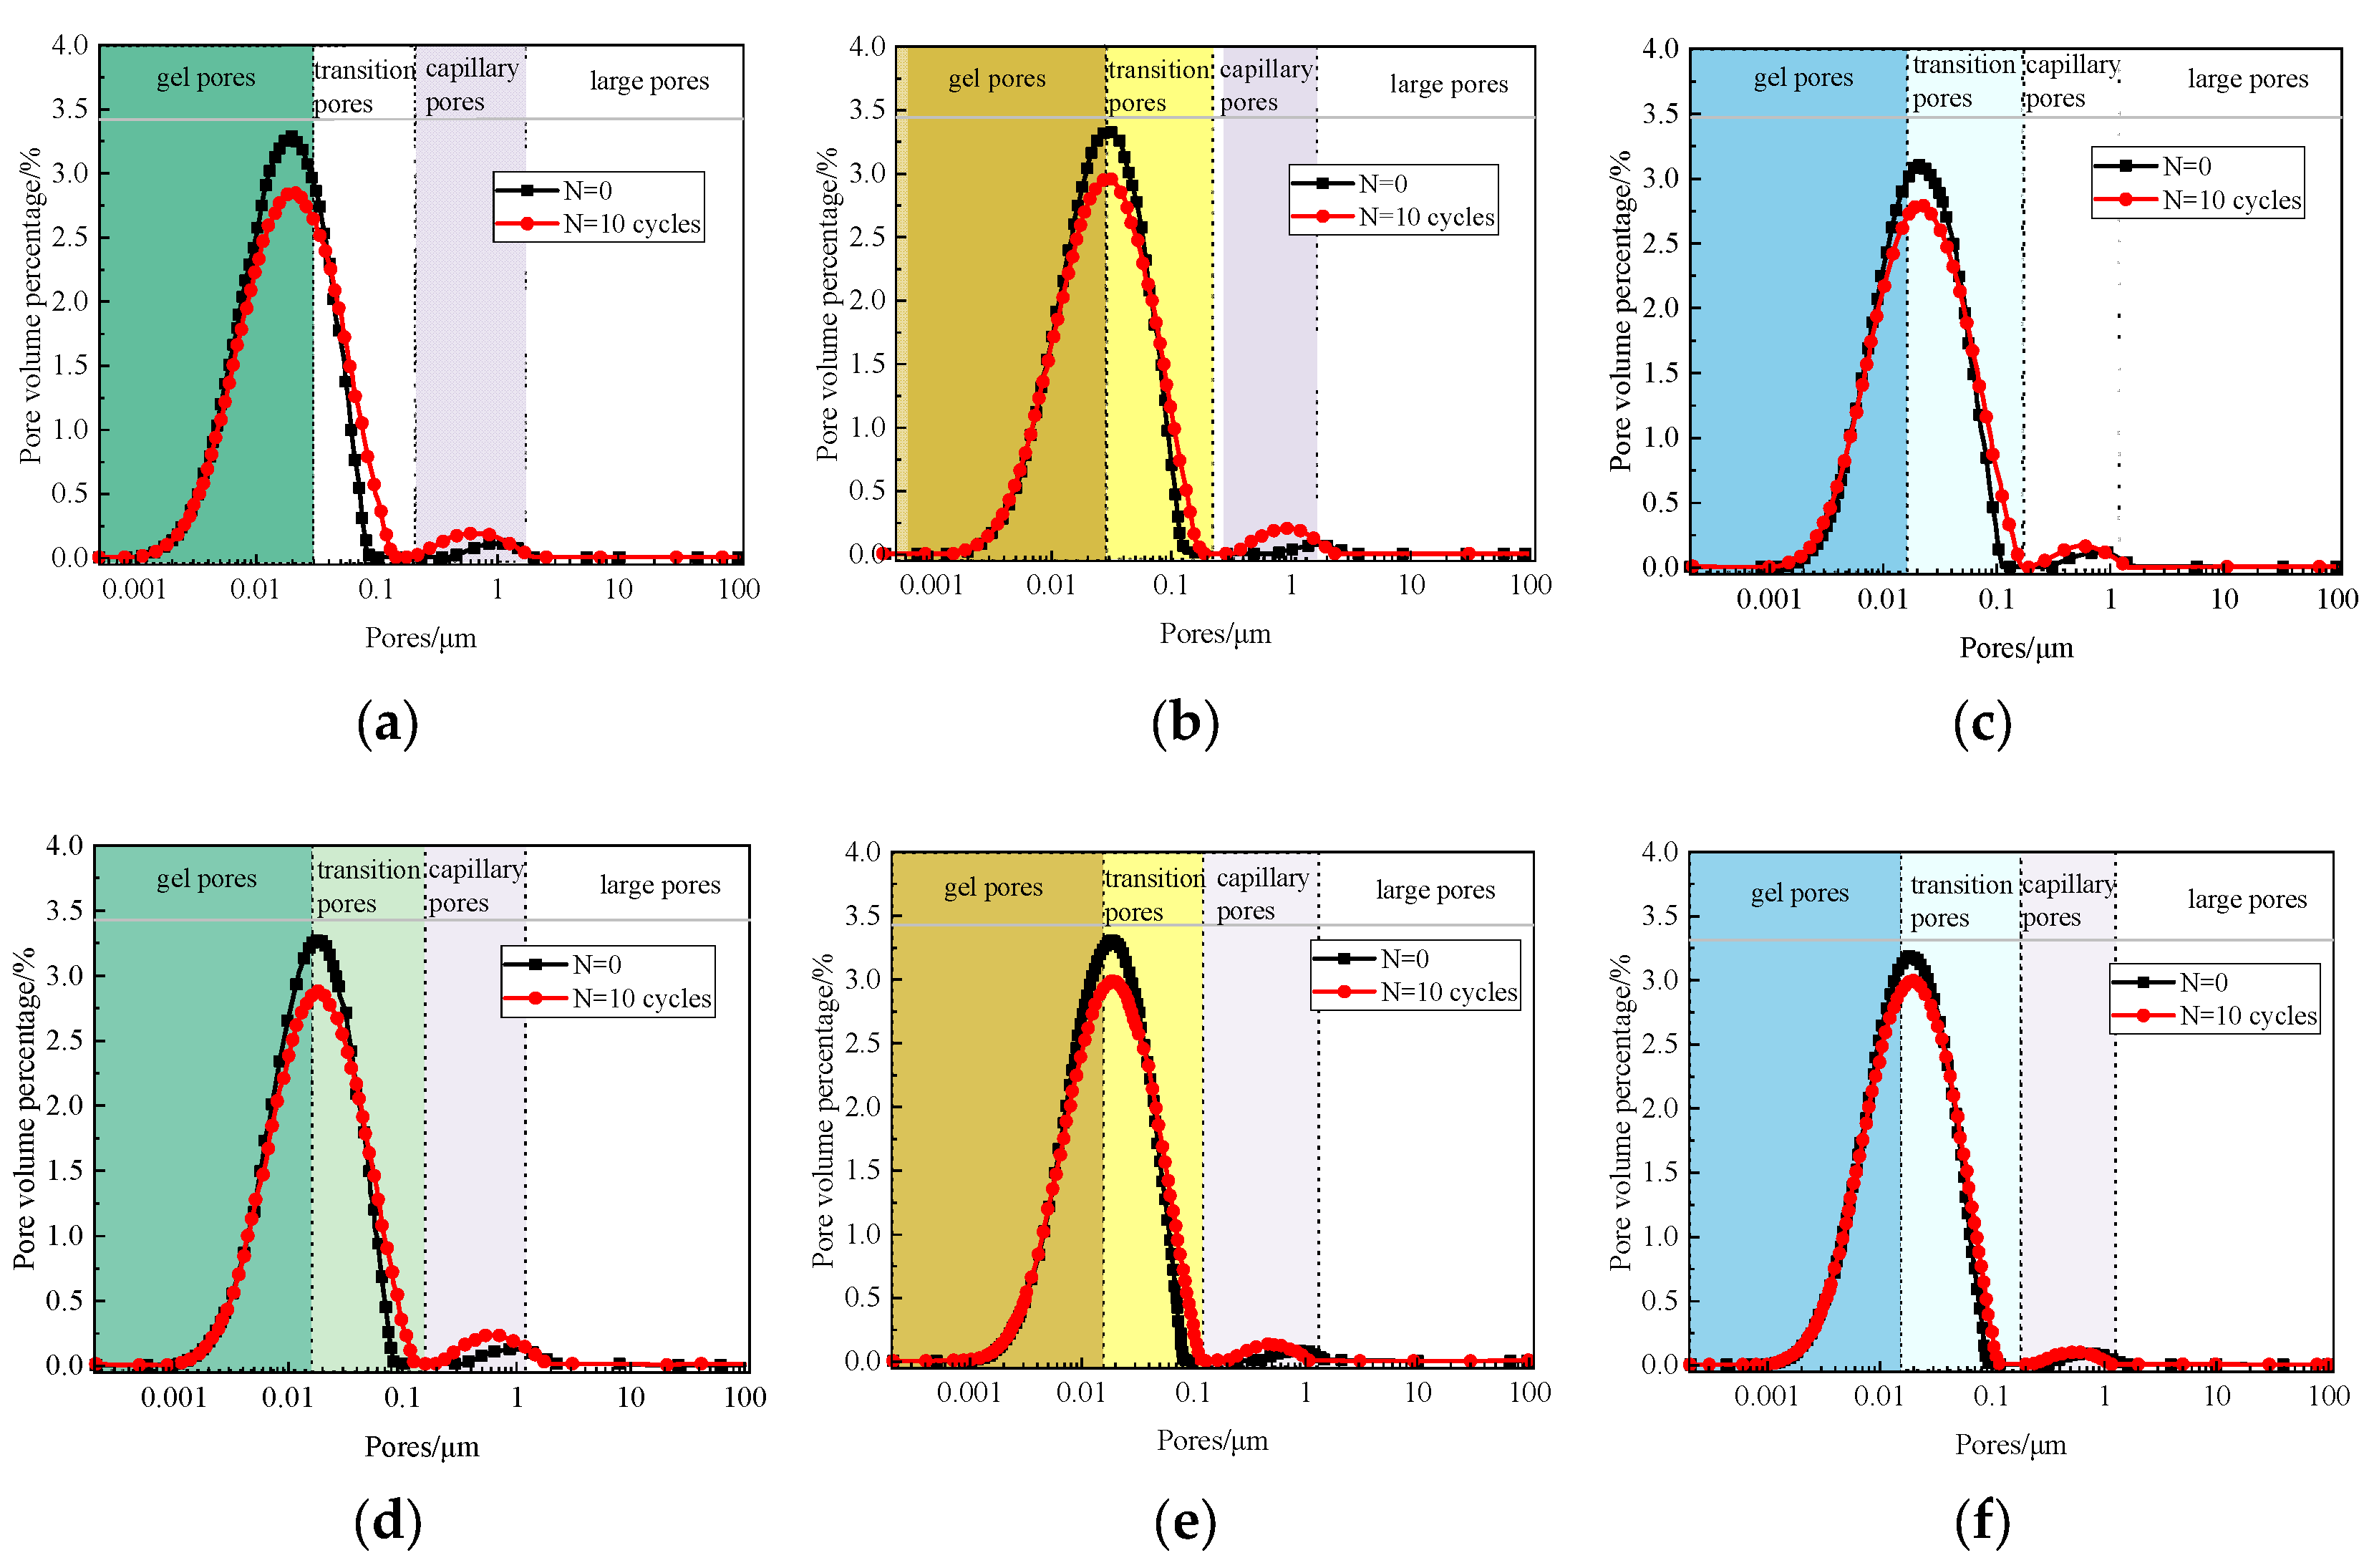
4.2.3. Microscope Pore Structure Distribution after D-W Cycles
5. Conclusions
- (1)
- Increasing the CaO/FA ratio can significantly improve the UCS and shear strength of solidified sludge.
- (2)
- With a higher curing agent content, the UCS and shear strength of the solidified sludge increase. Compared with a 10% curing agent content, the UCS and shear strength of specimen with a 30% curing agent content increase by 105.20% and 199%, respectively.
- (3)
- LF-NMR can quantitatively characterize the change in micropores in the solidified sludge during curing. The transverse relaxation time T2 spectra become narrow and the spectra area reduces obviously with the increase in curing age. The trend of the T2 spectra is “downward” and “leftward”. The hydration reaction slows down and the pore skeleton space structure tends to be stable. With a higher curing agent content, the T2 curves at 14 d and 28 d become closer.
- (4)
- The UCS of the solidified sludge reduces after F-T cycles or D-W cycles. Increasing the CaO/FA ratio can significantly improve the resistance of the solidified sludge to both F-T cycles and D-W cycles. Compared with the F-T cycles, the appearance damage caused by D-W cycles is worse.
- (5)
- Periodic frozen pressure, shrinkage and wet expansion, and bulking will destroy the original pore structure of solidified sludge. The deterioration rate of large pores in the sample will be intensified, and finally the mechanical properties of the solidified sludge will continue to decline. The destruction process of solidified sludge under the action of D-W cycles can be described as follows: pore deterioration → microcracks’ initiation → surface becomes rough, and macrocracks begin to appear → surface peels off and flakes → disintegration.
Author Contributions
Funding
Institutional Review Board Statement
Informed Consent Statement
Data Availability Statement
Conflicts of Interest
References
- Lang, L.; Song, C.; Xue, L.; Chen, B. Effectiveness of waste steel slag powder on the strength development and associated micro-mechanisms of cement-stabilized dredged sludge. Constr. Build. Mater. 2020, 240, 117975. [Google Scholar] [CrossRef]
- Wang, D.; Korkiala-Tanttu, L. 1-D compressibility behaviour of cement-lime stabilized soft clays. Eur. J. Environ. Civ. Eng. 2020, 24, 1013–1031. [Google Scholar] [CrossRef]
- Zhu, W.; Zhang, C.; Liu, H. The status quo of dredged spoils utilization. Environ. Sci. Technol. 2002, 25, 39–41. [Google Scholar] [CrossRef]
- Li, X.; Liu, R.; Ao, D.; Sun, F.; Gao, H. Comprehensive treatment for black and odorous water body: A case study of Meishe River in Haikou City. J. Environ. Eng. Technol. 2020, 10, 733–739. [Google Scholar] [CrossRef]
- Ao, D.; Sun, F.; Feng, Q.; Li, X.; Li, B.; Yang, F. Case analysis on the treatment of black and odorous water body in Shuanggangchong River, Guangzhou City. J. Environ. Eng. Technol. 2020, 10, 719–725. [Google Scholar] [CrossRef]
- Lu, J.; Peng, S.; Sun, T.; Liu, Z.; Song, N.; Liu, X. Typical case analysis of the black and odorous water body treatment of Mantang River in Shenyang City. J. Environ. Eng. Technol. 2020, 10, 711–718. [Google Scholar] [CrossRef]
- Yadav, P.; Petrella, A.; Todaro, F.; De Gisi, S.; Vitone, C.; Petti, R.; Notarnicola, M. Ex Situ Stabilization/Solidification Approaches of Marine Sediments Using Green Cement Admixtures. Materials 2024, 17, 3597. [Google Scholar] [CrossRef]
- De Gisi, S.; Todaro, F.; Mesto, E.; Schingaro, E.; Notarnicola, M. Recycling contaminated marine sediments as filling materials by pilot scale stabilization/solidification with lime, organoclay and activated carbon. J. Clean. Prod. 2020, 269, 122416. [Google Scholar] [CrossRef]
- Wang, L.; Chen, L.; Tsang, D.C.W.; Li, J.-S.; Baek, K.; Hou, D.; Ding, S.; Poon, C.-S. Recycling dredged sediment into fill materials, partition blocks, and paving blocks: Technical and economic assessment. J. Clean. Prod. 2018, 199, 69–76. [Google Scholar] [CrossRef]
- Andrew, R.M. Global CO2 emissions from cement production, 1928–2018. Earth Syst. Sci. Data 2019, 11, 1675–1710. [Google Scholar] [CrossRef]
- Unluer, C.; Al-Tabbaa, A. Impact of hydrated magnesium carbonate additives on the carbonation of reactive MgO cements. Cem. Concr. Res. 2013, 54, 87–97. [Google Scholar] [CrossRef]
- Nalbantoğlu, Z. Effectiveness of Class C fly ash as an expansive soil stabilizer. Constr. Build. Mater. 2004, 18, 377–381. [Google Scholar] [CrossRef]
- Horpibulsuk, S.; Miura, N.; Nagaraj, T.S. Assessment of strength development in cement-admixed high water content clays with Abrams’ law as a basis. Géotechnique 2003, 53, 439–444. [Google Scholar] [CrossRef]
- Yin, C.-Y.; Mahmud, H.B.; Shaaban, M.G. Stabilization/solidification of lead-contaminated soil using cement and rice husk ash. J. Hazard. Mater. 2006, 137, 1758–1764. [Google Scholar] [CrossRef] [PubMed]
- Zentar, R.; Wang, D.; Abriak, N.E.; Benzerzour, M.; Chen, W. Utilization of siliceous–aluminous fly ash and cement for solidification of marine sediments. Constr. Build. Mater. 2012, 35, 856–863. [Google Scholar] [CrossRef]
- Kamei, T.; Ahmed, A.; Shibi, T. The use of recycled bassanite and coal ash to enhance the strength of very soft clay in dry and wet environmental conditions. Constr. Build. Mater. 2013, 38, 224–235. [Google Scholar] [CrossRef]
- Wang, D.; Xiao, J.; Gao, X. Strength gain and microstructure of carbonated reactive MgO-fly ash solidified sludge from East Lake, China. Eng. Geol. 2019, 251, 37–47. [Google Scholar] [CrossRef]
- Wang, D.; Xiao, J.; He, F.; Zhou, Y. Durability evolution and associated micro-mechanisms of carbonated reactive MgO-fly ash solidified sludge from East Lake, China. Constr. Build. Mater. 2019, 208, 1–12. [Google Scholar] [CrossRef]
- Wang, D.; Gao, X.; Wang, R.; Larsson, S.; Benzerzour, M. Elevated curing temperature-associated strength and mechanisms of reactive MgO-activated industrial by-products solidified soils. Mar. Georesources Geotechnol. 2020, 38, 659–671. [Google Scholar] [CrossRef]
- Zhu, X.; Niu, F.; Ren, L.; Jiao, C.; Jiang, H.; Yao, X. Effect of Calcium Carbide Residue on Strength Development along with Mechanisms of Cement-Stabilized Dredged Sludge. Materials 2022, 15, 4453. [Google Scholar] [CrossRef]
- Rios, S.; Cristelo, N.; Fonseca, A.V.d.; Ferreira, C. Structural Performance of Alkali-Activated Soil Ash versus Soil Cement. J. Mater. Civ. Eng. 2016, 28, 04015125. [Google Scholar] [CrossRef]
- Firdous, R.; Stephan, D. Effect of silica modulus on the geopolymerization activity of natural pozzolans. Constr. Build. Mater. 2019, 219, 31–43. [Google Scholar] [CrossRef]
- Wong, B.Y.F.; Wong, K.S.; Phang, I.R.K. A review on geopolymerisation in soil stabilization. IOP Conf. Ser. Mater. Sci. Eng. 2019, 495, 012070. [Google Scholar] [CrossRef]
- Mustafa Al Bakri, A.M.; Muhammad Faheem, M.T.; Sandhu, A.V.; Alida, A.; Mohd Salleh, M.A.A.; Ruzaidi, C.M. Microstructure Studies on Different Types of Geopolymer Materials. Appl. Mech. Mater. 2013, 421, 384–389. [Google Scholar] [CrossRef]
- Ra, J.; Shin, S.; Kim, J. Experimental Study on the Properties of Autoclave Curing High-Strength Concrete According to CaO/SiO2 Ratio. Appl. Sci. 2023, 13, 6190. [Google Scholar] [CrossRef]
- Wang, Z.; Chen, Y.; Xu, L.; Zhu, Z.; Zhou, Y.; Pan, F.; Wu, K. Insight into the local C-S-H structure and its evolution mechanism controlled by curing regime and Ca/Si ratio. Constr. Build. Mater. 2022, 333, 127388. [Google Scholar] [CrossRef]
- Zhang, K.; Zhou, J.; Yin, Z. Experimental Study on Mechanical Properties and Pore Structure Deterioration of Concrete under Freeze–Thaw Cycles. Materials 2021, 14, 6568. [Google Scholar] [CrossRef]
- Dong, C.-Q.; Zhang, R.-J.; Zheng, J.-J.; Jiang, W.-H. Strength behavior of dredged mud slurry treated jointly by cement, metakaolin and flocculant. Appl. Clay Sci. 2020, 193, 105676. [Google Scholar] [CrossRef]
- Shibi, T.; Kamei, T. Effect of freeze–thaw cycles on the strength and physical properties of cement-stabilised soil containing recycled bassanite and coal ash. Cold Reg. Sci. Technol. 2014, 106, 36–45. [Google Scholar] [CrossRef]
- Wang, D.; Di, S.; Gao, X.; Wang, R.; Chen, Z. Strength properties and associated mechanisms of magnesium oxychloride cement-solidified urban river sludge. Constr. Build. Mater. 2020, 250, 118933. [Google Scholar] [CrossRef]
- Chen, C.; Zhang, K.; Yin, Z.; Zhou, J. Deterioration Performance of Recycled Aggregate Pervious Concrete under Freezing–Thawing Cycle and Chloride Environment. Buildings 2023, 13, 645. [Google Scholar] [CrossRef]


| pH | Density (g/cm3) | Initial Water Content (%) | Liquid Limit (%) | Plastic Limit (%) | Plasticity Index (%) |
|---|---|---|---|---|---|
| 7.26 | 1.98 | 29.58 | 32.4 | 21.6 | 10.8 |
| Components | SiO2 | Al2O3 | Fe2O3 | CaO | MgO | K2O | Na2O | Others |
|---|---|---|---|---|---|---|---|---|
| Value in % | 54.94 | 34.86 | 2.52 | 2.63 | 0.779 | 1.76 | 0.475 | ≤2 |
| Group | Specimen | Curing Agent/Sludge | CaO/FA | Water Content/% | Curing Age/d | |
|---|---|---|---|---|---|---|
| A | A1 | 10% | 2:8 | 40 | 7, 14, 28 | |
| A2 | 15% | 7, 14, 28 | ||||
| A3 | 20% | 7, 14, 28 | ||||
| B | B1 | 10% | 4:6 | 7, 14, 28 | ||
| B2 | 15% | 7, 14, 28 | ||||
| B3 | 20% | 7, 14, 28 | ||||
Disclaimer/Publisher’s Note: The statements, opinions and data contained in all publications are solely those of the individual author(s) and contributor(s) and not of MDPI and/or the editor(s). MDPI and/or the editor(s) disclaim responsibility for any injury to people or property resulting from any ideas, methods, instructions or products referred to in the content. |
© 2024 by the authors. Licensee MDPI, Basel, Switzerland. This article is an open access article distributed under the terms and conditions of the Creative Commons Attribution (CC BY) license (https://creativecommons.org/licenses/by/4.0/).
Share and Cite
Chen, C.; Zhang, K.; Ma, C.; Yin, Z.; Wang, L.; Chen, Y.; Lin, Z.; Liu, Y. Mechanical Properties, Durability Performance, and Microstructure of CaO-Fly Ash Solidified Sludge from Northeast, China. Materials 2024, 17, 4757. https://doi.org/10.3390/ma17194757
Chen C, Zhang K, Ma C, Yin Z, Wang L, Chen Y, Lin Z, Liu Y. Mechanical Properties, Durability Performance, and Microstructure of CaO-Fly Ash Solidified Sludge from Northeast, China. Materials. 2024; 17(19):4757. https://doi.org/10.3390/ma17194757
Chicago/Turabian StyleChen, Chen, Kai Zhang, Chunyu Ma, Zhigang Yin, Liang Wang, Yao Chen, Ziqi Lin, and Yi Liu. 2024. "Mechanical Properties, Durability Performance, and Microstructure of CaO-Fly Ash Solidified Sludge from Northeast, China" Materials 17, no. 19: 4757. https://doi.org/10.3390/ma17194757