
Effect of Deposit Scale on Mechanical Properties of In-Situ Alloyed CrCoNi Medium Entropy Alloys Formed by Directed Energy Deposition

Abstract
1. Introduction
2. Materials and Experimental Procedure
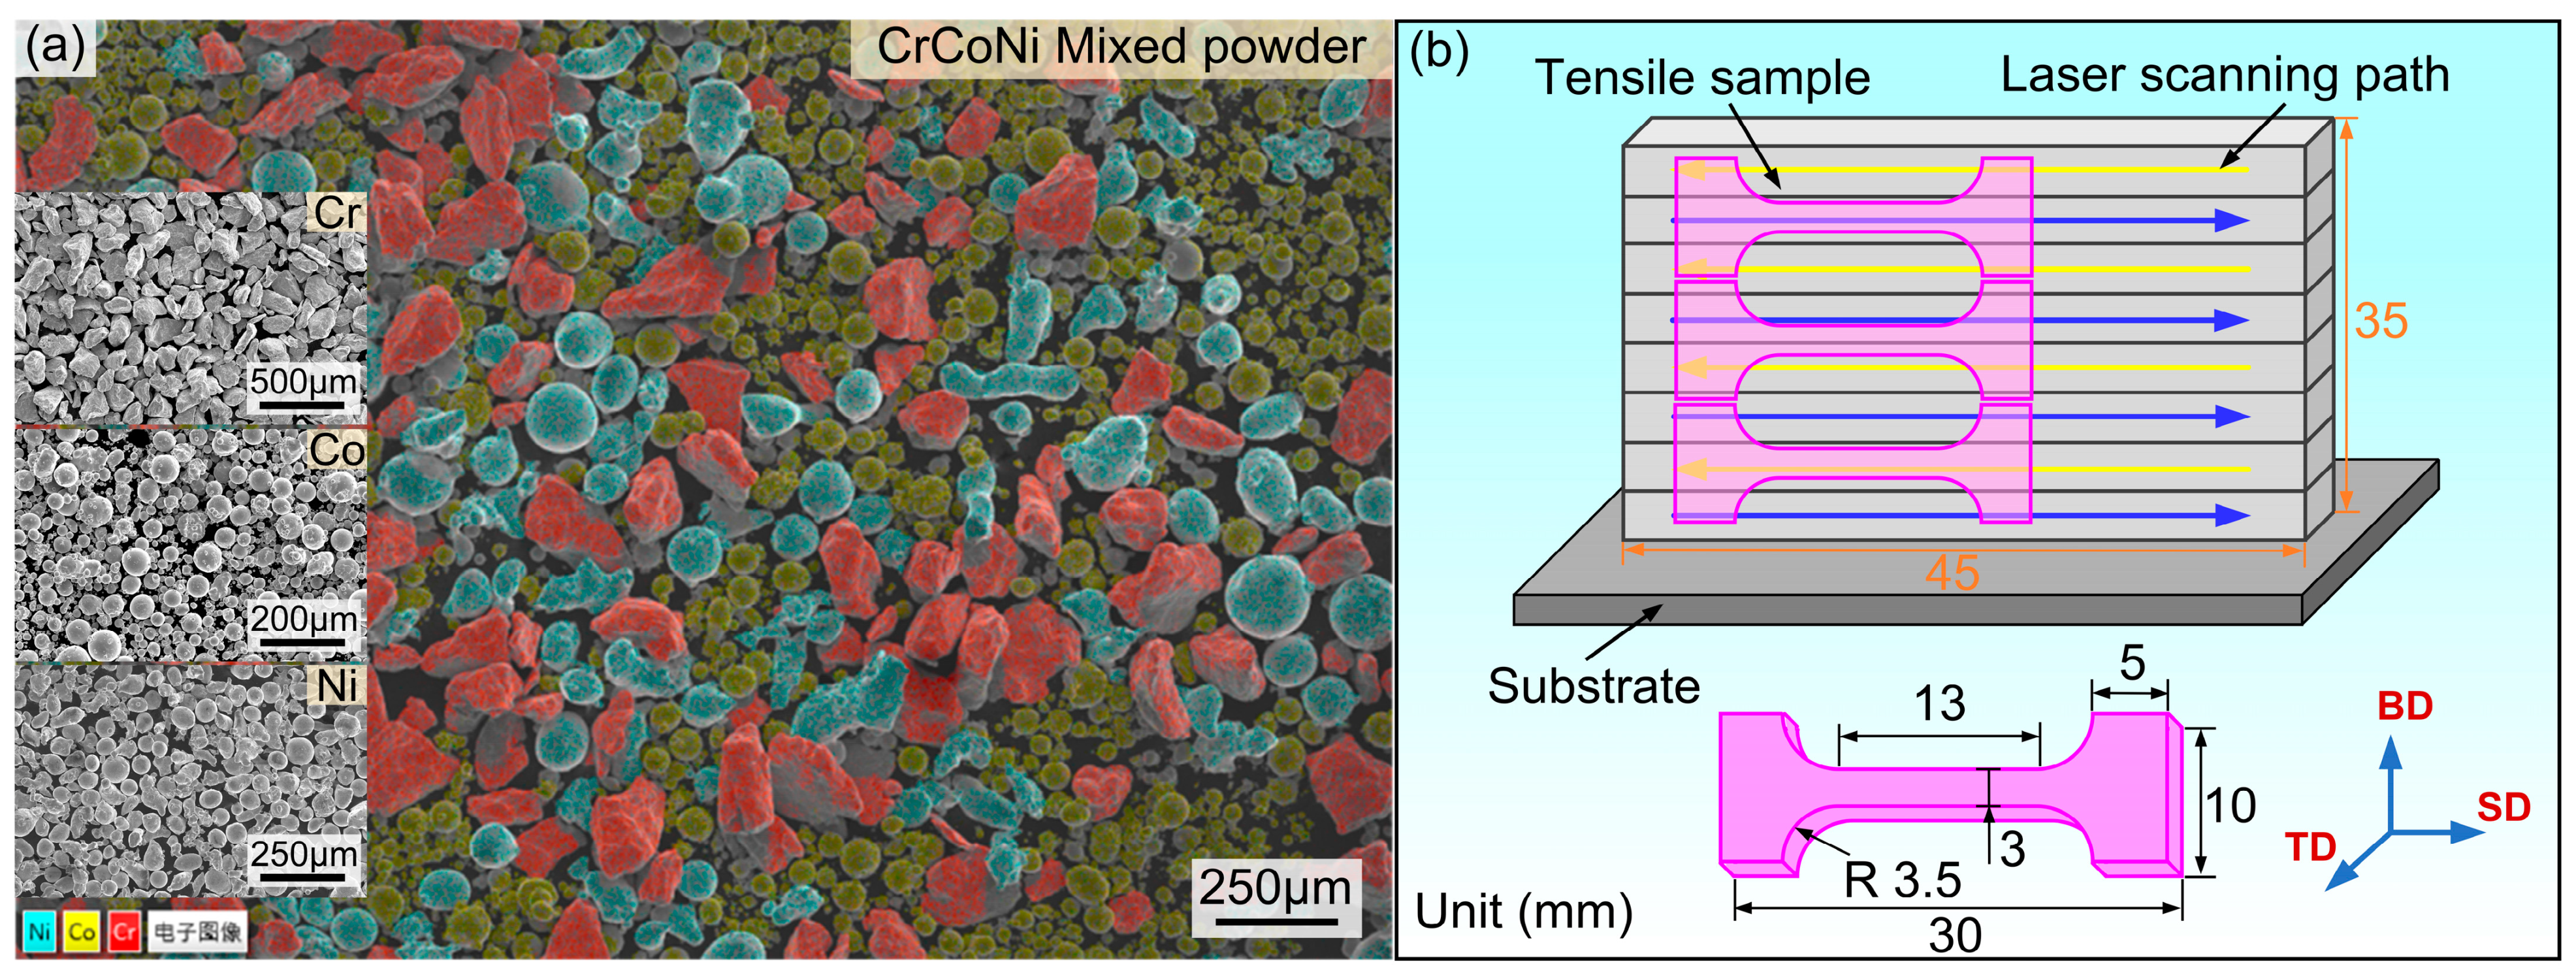
2.1. Materials and Experimental Details
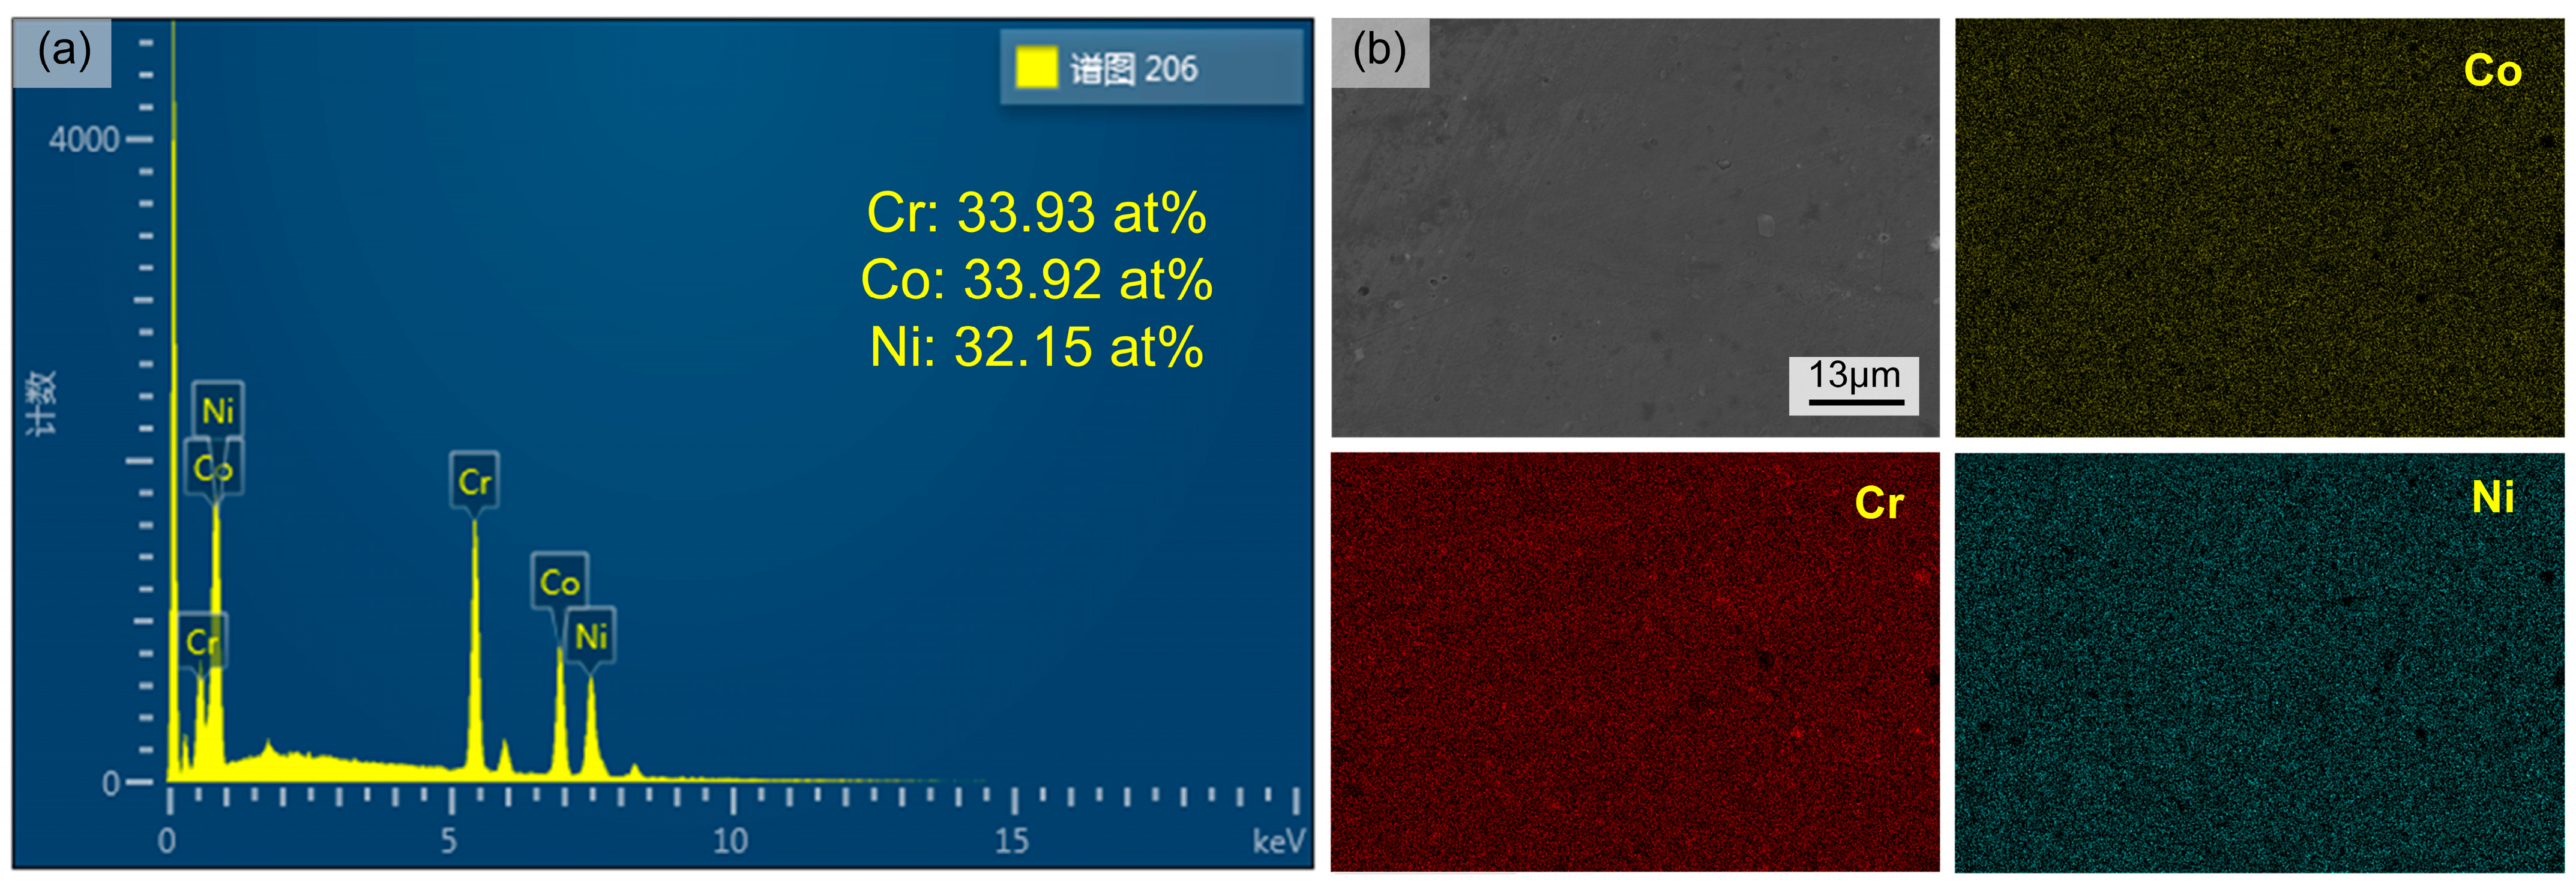
2.2. Microstructural Characterization
2.3. Analysis of Mechanical Properties
3. Results and Discussions
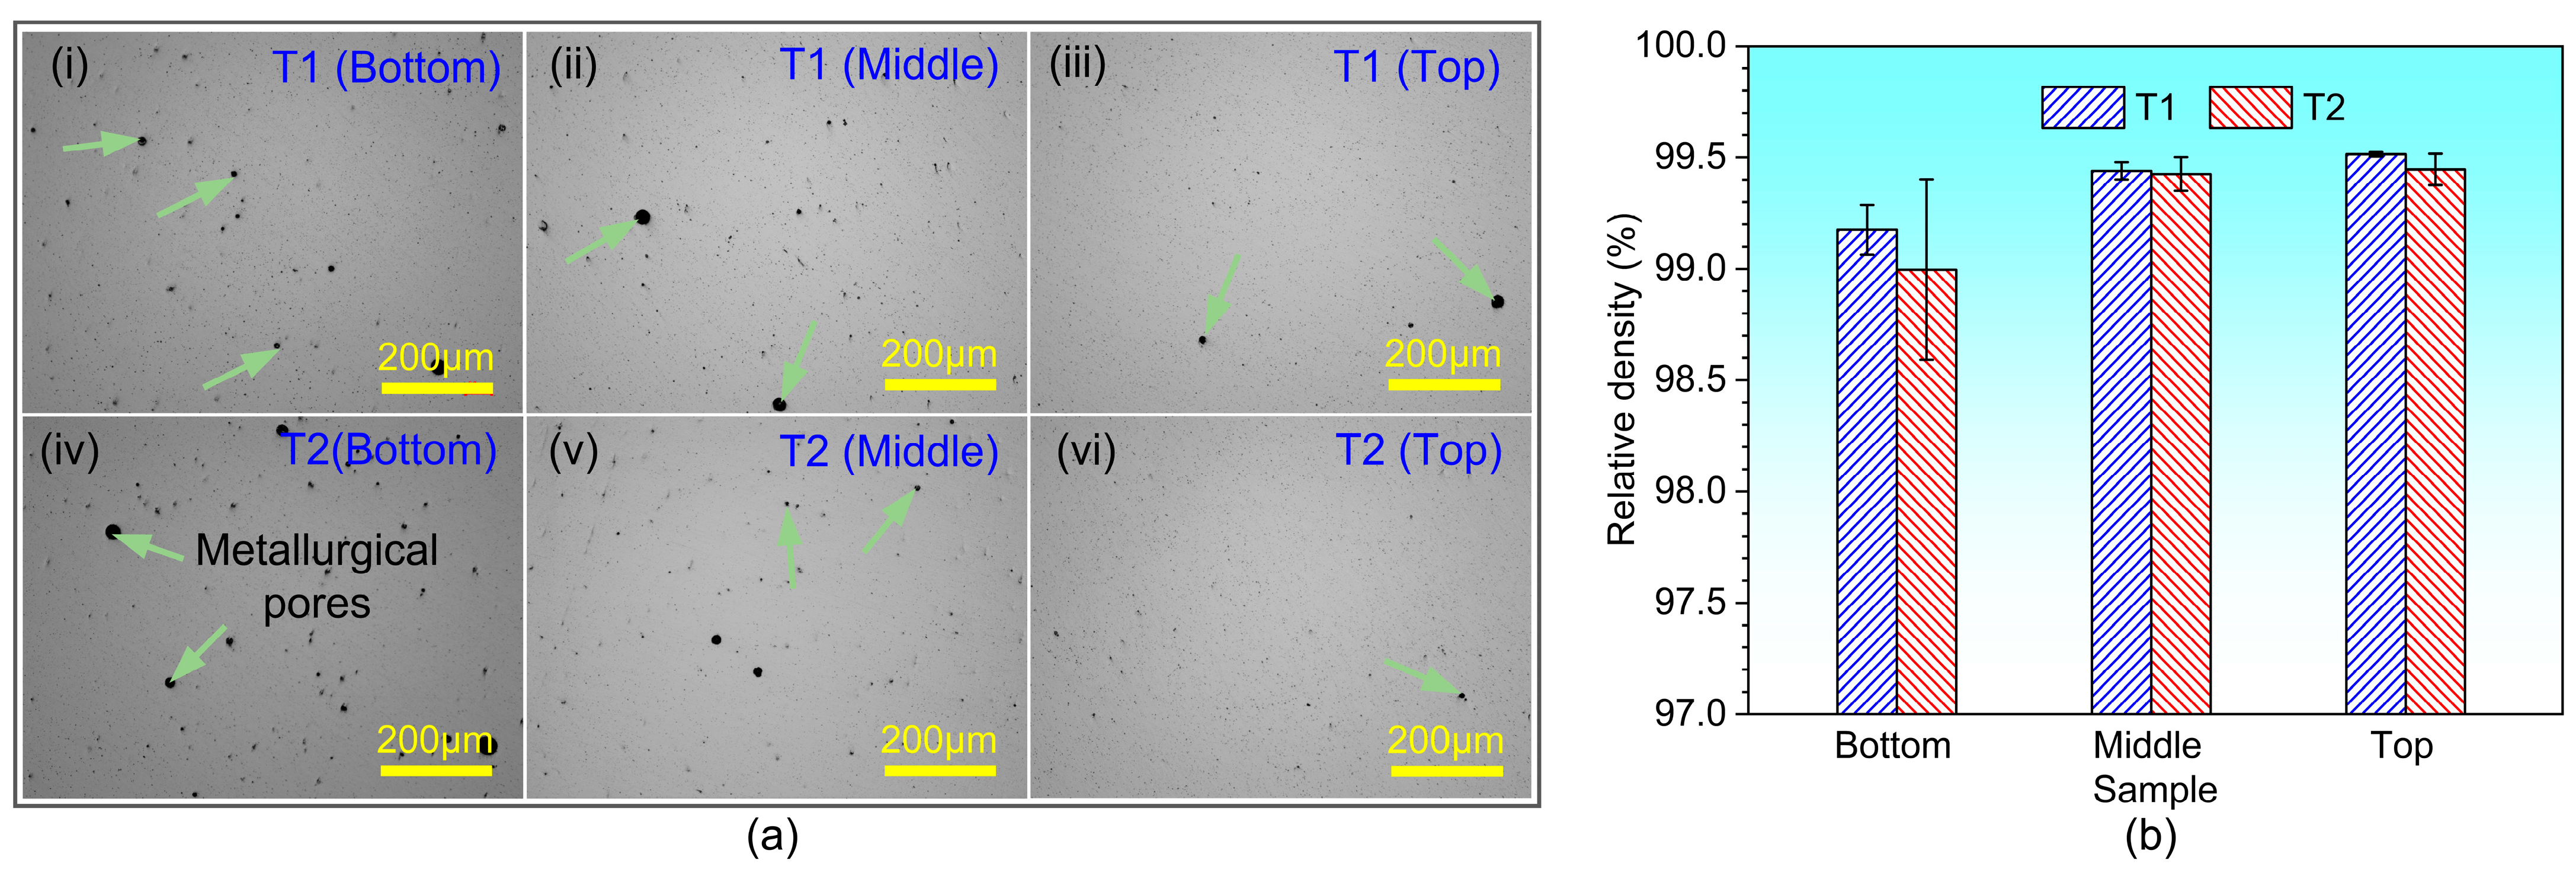
3.1. Porosity
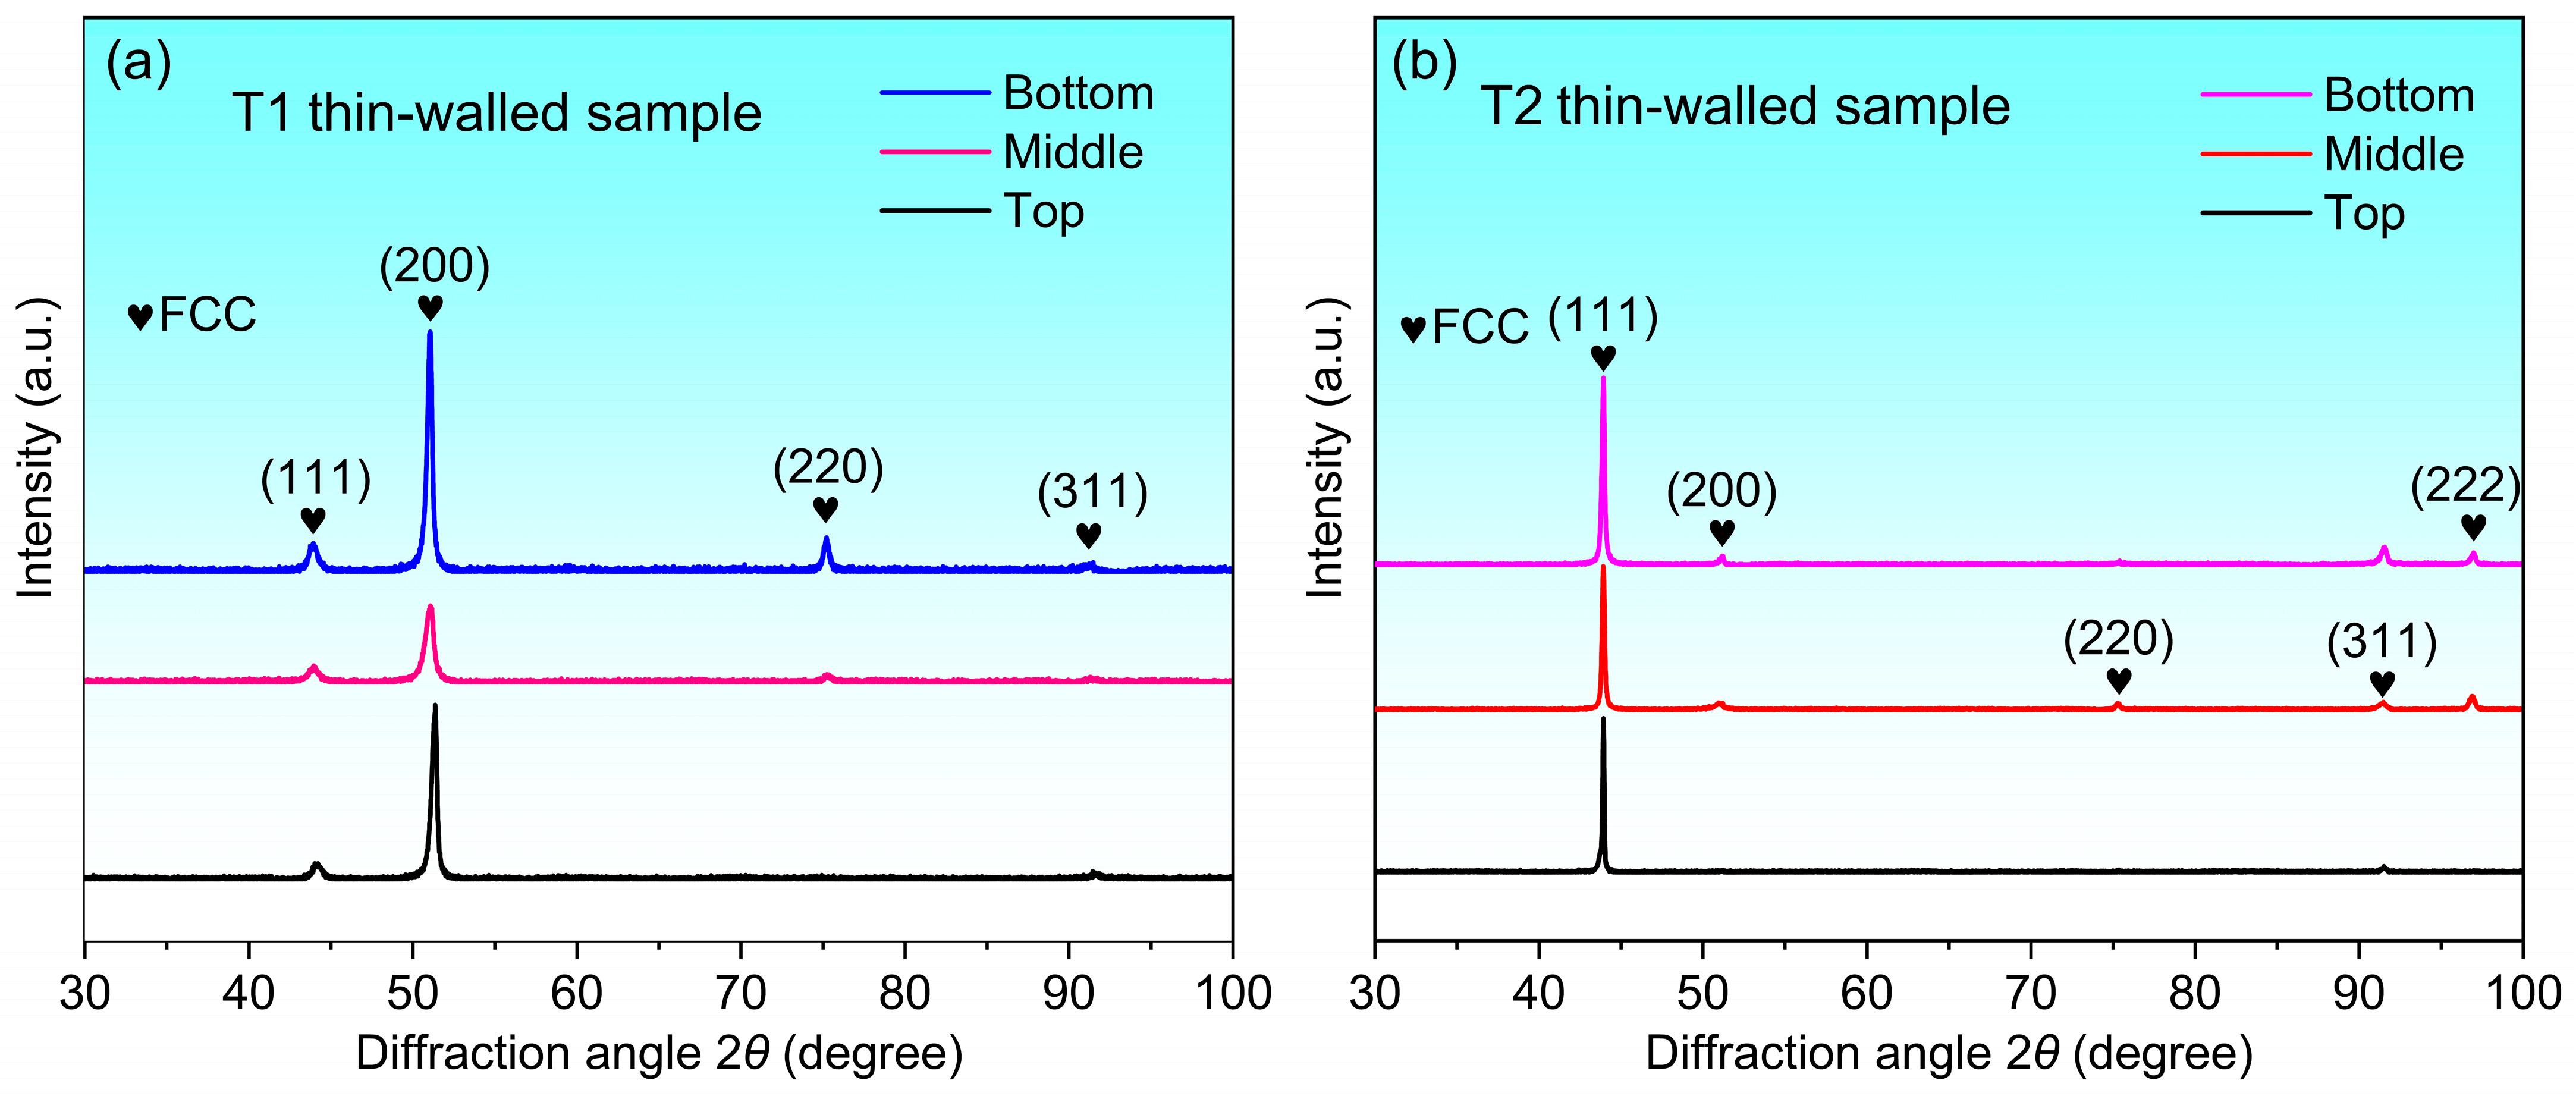
3.2. XRD Analysis
3.3. Microstructures
3.4. Mechanical Properties
3.4.1. Tensile Properties
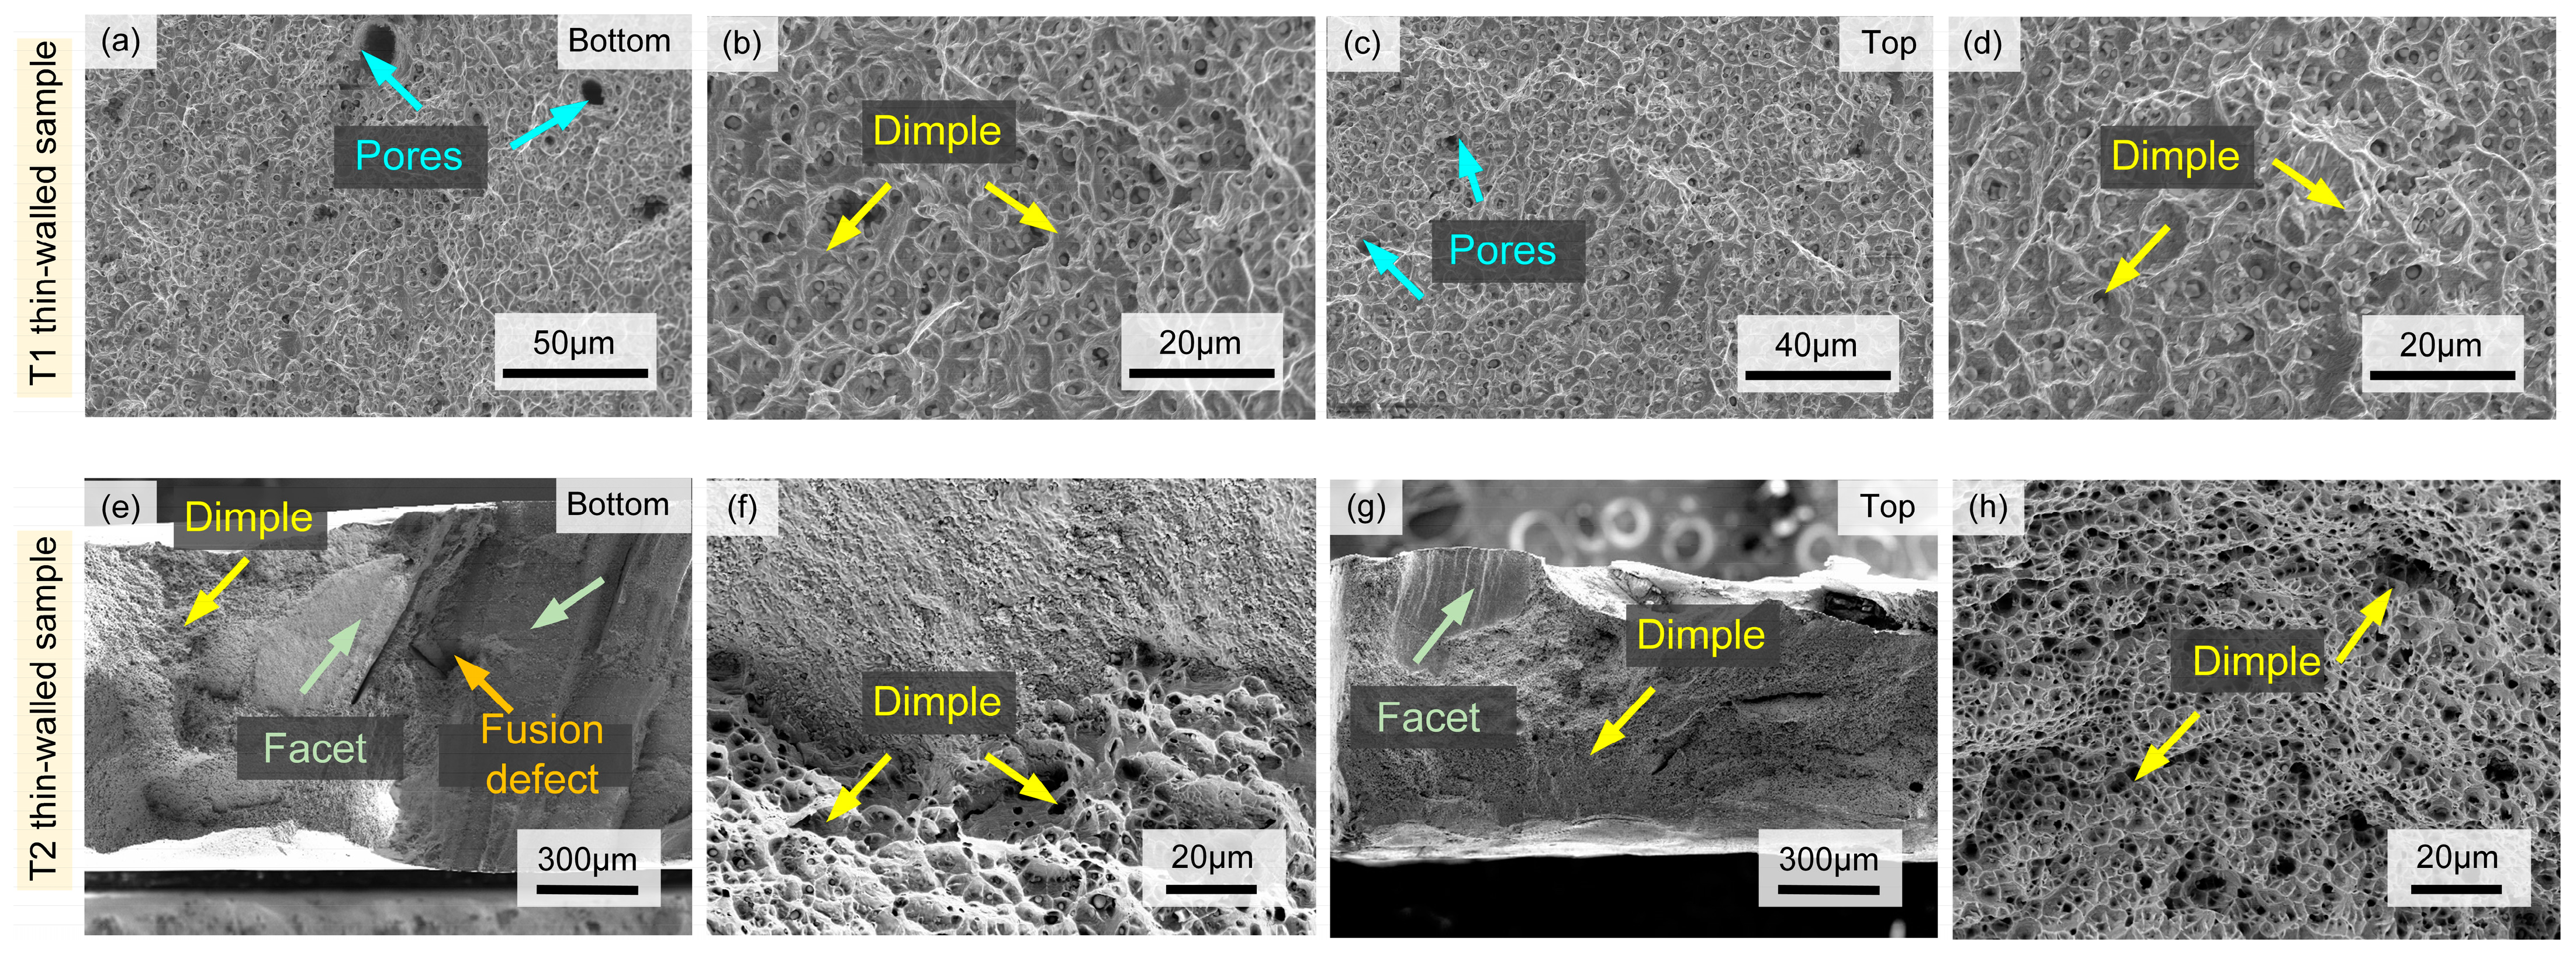
3.4.2. Fracture Analysis
4. Conclusions
Author Contributions
Funding
Institutional Review Board Statement
Informed Consent Statement
Data Availability Statement
Conflicts of Interest
References
- Kessler, H.D.; Sherman, R.J. Tension and Charpy V-notch impact properties of wire arc additively manufactured ER80S-Ni1. Structures 2024, 61, 106134. [Google Scholar] [CrossRef]
- Feenstra, D.R.; Banerjee, R.; Fraser, H.L.; Huang, A.; Molotnikov, A.; Birbilis, N. Critical review of the state of the art in multi-material fabrication via directed energy deposition. Curr. Opin. Solid State Mater. Sci. 2021, 25, 100924. [Google Scholar] [CrossRef]
- Kang, L.; Chen, F.; Bradford, M.A.; Liu, X. Experimental study of mechanical properties of laser additively manufactured 316L stainless steels. Structures 2023, 54, 221–235. [Google Scholar] [CrossRef]
- Gao, Z.; Zhang, S.; Ren, C.; Yu, Y.; Gao, Z.; Zhang, C. Effect of Rare-Earth La2O3 on Tribological Properties of Laser Cladding Nickel-Based Coatings on 35CrMoV Alloy Steel. J. Mater. Eng. Perform. 2024, 33, 651–659. [Google Scholar] [CrossRef]
- Meng, G.; Gong, Y.; Zhang, J.; Zhao, J. The microstructural evolution and mechanical response of laser direct energy deposition Inconel 718 alloy based on simulation and experimental methods. Eng. Fail. Anal. 2024, 161, 108334. [Google Scholar] [CrossRef]
- Shen, S.; He, B.; Wang, H. Cyclic softening behavior of TC17 titanium alloy fabricated by laser directly energy deposition. Mater. Sci. Eng. A 2024, 890, 145883. [Google Scholar] [CrossRef]
- Xue, P.; Zhu, L.; Ning, J.; Xu, P.; Wang, S.; Yang, Z.; Ren, Y.; Meng, G. The crystallographic texture and dependent mechanical properties of the CrCoNi medium-entropy alloy by laser remelting strategy. J. Mater. Sci. Technol. 2022, 111, 245–255. [Google Scholar] [CrossRef]
- Park, H.; Kwon, H.; Kim, K.T.; Yu, J.-H.; Choe, J.; Sung, H.; Kim, H.S.; Kim, J.G.; Park, J.M. Cryogenic tensile behavior of carbon-doped CoCrFeMnNi high-entropy alloys additively manufactured by laser powder bed fusion. Addit. Manuf. 2024, 86, 104223. [Google Scholar] [CrossRef]
- Bi, X.; Li, R.; Yuan, Z.; Cheng, J.; Guan, D.; Zhang, P. Laser-directed energy deposition of a high performance additively manufactured (CoCrNi)94(TiAl)6 medium-entropy alloy with a novel core-shell structured strengthening phase. Addit. Manuf. 2024, 80, 103971. [Google Scholar] [CrossRef]
- Li, C.; Jain, M.; Liu, Q.; Cao, Z.; Ferry, M.; Kruzic, J.J.; Gludovatz, B.; Li, X. Multi-scale microstructure manipulation of an additively manufactured CoCrNi medium entropy alloy for superior mechanical properties and tunable mechanical anisotropy. Addit. Manuf. 2024, 84, 104104. [Google Scholar] [CrossRef]
- Ge, J.; Chen, C.; Zhao, R.; Liu, Q.; Long, Y.; Wang, J.; Ren, Z.; Yin, S. Strength-ductility synergy of CoCrNi medium-entropy alloy processed with laser powder bed fusion. Mater. Des. 2022, 219, 110774. [Google Scholar] [CrossRef]
- Yi, M.; Tu, J.; Yang, L.; Zhou, Z.; Chen, S.; Ding, L.; Du, Y.; Qiu, Y.; Liang, Y. Microstructural mechanisms endowing high strength-ductility synergy in CoCrNi medium entropy alloy prepared by laser powder bed fusion. Addit. Manuf. 2024, 87, 104229. [Google Scholar] [CrossRef]
- Pan, C.; Zhu, D.; Luo, H.; Kosiba, K.; Qu, S.; Yang, C.; Li, X. Fabrication of high-performance CoCrNi medium entropy alloy by laser powder bed fusion: The effect of grain boundary segregation. Compos. Part B Eng. 2023, 253, 110540. [Google Scholar] [CrossRef]
- Bi, X.; Li, R.; Li, T.; Liu, B.; Yuan, Y.; Zhang, P.; Feng, K. Anisotropic microstructure, properties and molecular dynamics simulation of CoCrNi medium entropy alloy fabricated by laser directed energy deposition. Mater. Sci. Eng. A 2023, 871, 144834. [Google Scholar] [CrossRef]
- Jiang, H.; Jiang, F.; Xie, B.; Wang, B.; Xu, B.; Hu, X.; Xu, L.; He, Z.; Zhang, H.; Wu, Y.; et al. Effects of the cooling rate on mechanical properties and microstructure of near-α Ti-6Al-3Zr-2Nb-Mo alloy. Mater. Charact. 2023, 195, 112529. [Google Scholar] [CrossRef]
- Andani, M.T.; Zhang, Z.; Sundararaghavan, V.; Misra, A. Mapping the roles of scan strategy and build orientation in predicting the crystallographic texture and yield strength of 316L stainless steel produced by laser powder bed fusion. J. Mater. Res. Technol. 2024, 30, 7375–7383. [Google Scholar] [CrossRef]
- Zagade, P.R.; Gautham, B.P.; De, A.; DebRoy, T. Analytical modelling of scanning strategy effect on temperature field and melt track dimensions in laser powder bed fusion. Addit. Manuf. 2024, 82, 104046. [Google Scholar] [CrossRef]
- Sun, S.-H.; Hagihara, K.; Nakano, T. Effect of scanning strategy on texture formation in Ni-25 at.%Mo alloys fabricated by selective laser melting. Mater. Des. 2018, 140, 307–316. [Google Scholar] [CrossRef]
- Xue, P.; Lu, H.; Wen, G.; Ren, Y.; Gao, W.; Cao, X. Comprehensive study on scale-induced heterogeneity of (Ni2CrCo)94Nb3V3 high-entropy alloy variable-width thin-walled structure fabricated by additive manufacturing. Opt. Laser Technol. 2024, 179, 111347. [Google Scholar] [CrossRef]
- Li, Y.; Dlouhý, J.; Koukolíková, M.; Kirana, A.; Vavřík, J.; Džugan, J. Effect of deposit thickness on microstructure and mechanical properties at ambient and elevated temperatures for Inconel 718 superalloy fabricated by directed energy deposition. J. Alloys Compd. 2022, 908, 164723. [Google Scholar] [CrossRef]
- Ishimoto, T.; Hagihara, K.; Hisamoto, K.; Sun, S.-H.; Nakano, T. Crystallographic texture control of beta-type Ti-15Mo-5Zr-3Al alloy by selective laser melting for the development of novel implants with a biocompatible low Young’s modulus. Scr. Mater. 2017, 132, 34–38. [Google Scholar] [CrossRef]
- Ren, Y.; Liang, L.; Shan, Q.; Cai, A.; Du, J.; Huang, Q.; Liu, S.; Yang, X.; Tian, Y.; Wu, H. Effect of volumetric energy density on microstructure and tribological properties of FeCoNiCuAl high-entropy alloy produced by laser powder bed fusion. Virtual Phys. Prototyp. 2020, 15, 543–554. [Google Scholar] [CrossRef]
- Kumar, P.; Michalek, M.; Cook, D.H.; Sheng, H.; Lau, K.B.; Wang, P.; Zhang, M.; Minor, A.M.; Ramamurty, U.; Ritchie, R.O. On the strength and fracture toughness of an additive manufactured CrCoNi medium-entropy alloy. Acta Mater. 2023, 258, 119249. [Google Scholar] [CrossRef]
- Yao, N.; Lu, T.; Feng, K.; Sun, B.; Wang, R.-Z.; Wang, J.; Xie, Y.; Zhao, P.; Han, B.; Zhang, X.-C.; et al. Ultrastrong and ductile additively manufactured precipitation-hardening medium-entropy alloy at ambient and cryogenic temperatures. Acta Mater. 2022, 236, 118142. [Google Scholar] [CrossRef]
- Amar, A.; Wang, M.; Zhang, L.; Li, J.; Huang, L.; Yan, H.; Zhang, Y.; Lu, Y. Additive manufacturing of VCoNi medium-entropy alloy: Microstructure evolution and mechanical properties. Addit. Manuf. 2023, 68, 103522. [Google Scholar] [CrossRef]
- Chen, X.; Lu, T.; Yao, N.; Chen, H.; Sun, B.; Xie, Y.; Chen, Y.; Wan, B.; Zhang, X.-C.; Tu, S.-T. Enhanced fatigue resistance and fatigue-induced substructures in an additively manufactured CoCrNi medium-entropy alloy treated by ultrasonic surface rolling process. Int. J. Plast. 2023, 169, 103721. [Google Scholar] [CrossRef]
- Chung, S.; Lee, T.; Jeong, W.; Kong, B.S.; Ryu, H.J. Additive manufacturing of oxide dispersion-strengthened CoCrNi medium-entropy alloy by in situ oxide synthesis. J. Alloys Compd. 2023, 965, 171340. [Google Scholar] [CrossRef]
- Weng, F.; Chew, Y.; Zhu, Z.; Yao, X.; Wang, L.; Ng, F.L.; Liu, S.; Bi, G. Excellent combination of strength and ductility of CoCrNi medium entropy alloy fabricated by laser aided additive manufacturing. Addit. Manuf. 2020, 34, 101202. [Google Scholar] [CrossRef]
- Woo, W.; Kim, Y.S.; Chae, H.B.; Lee, S.Y.; Jeong, J.S.; Lee, C.M.; Won, J.W.; Na, Y.S.; Kawasaki, T.; Harjo, S.; et al. Competitive strengthening between dislocation slip and twinning in cast-wrought and additively manufactured CrCoNi medium entropy alloys. Acta Mater. 2023, 246, 118699. [Google Scholar] [CrossRef]
- Guan, S.; Wan, D.; Solberg, K.; Berto, F.; Welo, T.; Yue, T.M.; Chan, K.C. Additive manufacturing of fine-grained and dislocation-populated CrMnFeCoNi high entropy alloy by laser engineered net shaping. Mater. Sci. Eng. A 2019, 761, 138056. [Google Scholar] [CrossRef]
- Weng, F.; Chew, Y.; Zhu, Z.; Sui, S.; Tan, C.; Yao, X.; Ng, F.L.; Ong, W.K.; Bi, G. Influence of oxides on the cryogenic tensile properties of the laser aided additive manufactured CoCrNi medium entropy alloy. Compos. Part B Eng. 2021, 216, 108837. [Google Scholar] [CrossRef]
- Wang, F.; Guo, Y.; Liu, Q.; Shang, X. Nanoparticle-strengthened Ni2CoCrNb0.2 medium-entropy alloy with an ultrastrong cryogenic yield strength fabricated by additive manufacturing. J. Mater. Sci. Technol. 2023, 163, 17–31. [Google Scholar] [CrossRef]
- HajyAkbary, F.; Sietsma, J.; Böttger, A.J.; Santofimia, M.J. An improved X-ray diffraction analysis method to characterize dislocation density in lath martensitic structures. Mater. Sci. Eng. A 2015, 639, 208–218. [Google Scholar] [CrossRef]
- Meng, G.; Gong, Y.; Zhang, J.; Zhao, J. Effect of heat treatment on microstructure, precipitation behavior and mechanical properties of Inconel 718 fabricated by laser direct energy deposition. Mater. Sci. Eng. A 2024, 898, 146396. [Google Scholar] [CrossRef]
- Kong, D.; Dong, C.; Wei, S.; Ni, X.; Zhang, L.; Li, R.; Wang, L.; Man, C.; Li, X. About metastable cellular structure in additively manufactured austenitic stainless steels. Addit. Manuf. 2021, 38, 101804. [Google Scholar] [CrossRef]
- Wang, F.; Stinville, J.-C.; Charpagne, M.; Echlin, M.P.; Agnew, S.R.; Pollock, T.M.; Graef, M.D.; Gianola, D.S. Dislocation cells in additively manufactured metallic alloys characterized by electron backscatter diffraction pattern sharpness. Mater. Charact. 2023, 197, 112673. [Google Scholar] [CrossRef]
- Lin, D.; Xu, L.; Jing, H.; Han, Y.; Zhao, L.; Minami, F. Effects of annealing on the structure and mechanical properties of FeCoCrNi high-entropy alloy fabricated via selective laser melting. Addit. Manuf. 2020, 32, 101058. [Google Scholar] [CrossRef]


| Materials | Technology | Feature | References |
|---|---|---|---|
| CoCrNi | SLM | Differences in mechanical properties under different volumetric energy densities. | [10] |
| CoCrNi | SLM | Elucidated the interaction mechanisms of dislocations, twinning induced plasticity, and phase transition induced plasticity. | [12] |
| CoCrNi | SLM | Analyzed the effects of TiC addition on hot cracking, grain size, and mechanical properties. | [13] |
| CoCrNi | DED | The mechanical anisotropy of the sample was studied through experiments and molecular dynamics simulations. | [14] |
| Samples | YS (MPa) | UTS (MPa) | εf (%) |
|---|---|---|---|
| T1 Top | 335.93 | 594.68 | 32.63 |
| T1 Middle | 347.63 | 597.93 | 35.21 |
| T1 Bottom | 375.58 | 580.55 | 24.13 |
| T2 Top | 433.27 | 608.75 | 22.46 |
| T2 Middle | 443.29 | 599.55 | 21.35 |
| T2 Bottom | 470.42 | 629.83 | 17.12 |
| Samples | Relative Density | Grain Size | Dislocation Density | Schmid Factor | Preferred Orientation |
|---|---|---|---|---|---|
| T1 Top | 99.175% | 92.3 μm | 0.456 | <001> | |
| T1 Bottom | 98.997% | 68.8 μm | 0.468 | <001> | |
| T2 Top | 99.514% | 181.3 μm | 0.381 | <101> | |
| T2 Bottom | 99.446% | 143.6 μm | 0.380 | <101> |
Disclaimer/Publisher’s Note: The statements, opinions and data contained in all publications are solely those of the individual author(s) and contributor(s) and not of MDPI and/or the editor(s). MDPI and/or the editor(s) disclaim responsibility for any injury to people or property resulting from any ideas, methods, instructions or products referred to in the content. |
© 2024 by the authors. Licensee MDPI, Basel, Switzerland. This article is an open access article distributed under the terms and conditions of the Creative Commons Attribution (CC BY) license (https://creativecommons.org/licenses/by/4.0/).
Share and Cite
Xue, P.; Liu, D.; Gao, Z.; Wen, G.; Ren, Y.; Cao, X. Effect of Deposit Scale on Mechanical Properties of In-Situ Alloyed CrCoNi Medium Entropy Alloys Formed by Directed Energy Deposition. Materials 2024, 17, 4795. https://doi.org/10.3390/ma17194795
Xue P, Liu D, Gao Z, Wen G, Ren Y, Cao X. Effect of Deposit Scale on Mechanical Properties of In-Situ Alloyed CrCoNi Medium Entropy Alloys Formed by Directed Energy Deposition. Materials. 2024; 17(19):4795. https://doi.org/10.3390/ma17194795
Chicago/Turabian StyleXue, Pengsheng, Dengke Liu, Zhongtang Gao, Guodong Wen, Yuan Ren, and Xiangang Cao. 2024. "Effect of Deposit Scale on Mechanical Properties of In-Situ Alloyed CrCoNi Medium Entropy Alloys Formed by Directed Energy Deposition" Materials 17, no. 19: 4795. https://doi.org/10.3390/ma17194795
APA StyleXue, P., Liu, D., Gao, Z., Wen, G., Ren, Y., & Cao, X. (2024). Effect of Deposit Scale on Mechanical Properties of In-Situ Alloyed CrCoNi Medium Entropy Alloys Formed by Directed Energy Deposition. Materials, 17(19), 4795. https://doi.org/10.3390/ma17194795