Article

Study on Pore Water Pressure Model of EICP-Solidified Sand under Cyclic Loading

1
Shaanxi Key Laboratory of Safety and Durability of Concrete Structures, Xijing University, Xi’an 710123, China
2
Guangyuan Natural Gas Co., Ltd., Guangyuan 628000, China
3
School of Petroleum Engineering and Environmental Engineering, Yan’an University, Yan’an 716000, China
*
Author to whom correspondence should be addressed.
Materials 2024, 17(19), 4800; https://doi.org/10.3390/ma17194800 (registering DOI)
Submission received: 2 September 2024 / Revised: 27 September 2024 / Accepted: 27 September 2024 / Published: 29 September 2024

Abstract

:
Under traffic load, earthquake load, and wave load, saturated sand foundation is prone to liquefaction, and foundation reinforcement is the key measure to improve its stability and liquefaction resistance. Traditional foundation treatment methods have many problems, such as high cost, long construction period, and environmental pollution. As a new solidification method, enzyme-induced calcium carbonate precipitation (EICP) technology has the advantages of economy, environmental protection, and durability. Through a triaxial consolidated undrained shear test under cyclic loading, the impacts of confining pressure (σ3), cementation number (Pc), cyclic stress ratio (CSR), initial dry density (ρd), and vibration frequency (f) on the development law of pore water pressure of EICP-solidified sand are analyzed and then a pore water pressure model suitable for EICP-solidified sand is established. The result shows that as σ3 and CSR increase, the rise rate of pore water pressure of solidified sand gradually accelerates, and with a lower vibration number required for liquefaction, the anti-liquefaction ability of solidified sand gradually weakens. However, as Pc, ρd, and f rise, the increase rate of pore water pressure of solidified sand gradually lowers, the vibration number required for liquefaction increases correspondingly, and its liquefaction resistance gradually increases. The test results are highly consistent with the predictive results, which show that the three-parameter unified pore water pressure model is suitable for describing the development law of A-type and B-type pore water pressure of EICP-solidified sand at the same time. The study results provide essential reference value and scientific significance in guidance for preventing sand foundations from liquefying.

1. Introduction

Affected by traffic loads, earthquake loads, and wave loads, the pore water pressure in saturated sand rises sharply, while the effective stress decreases rapidly to zero, causing the shear strength of the sand to lower [1], resulting in liquefaction phenomena such as water spraying [2], sand emitting [3], and subsidence [4], which lead to serious engineering accidents. Foundation treatment is the key measure to improve the stability and anti-liquefaction ability of foundation. At present, the commonly used liquefaction treatment methods include the soil replacement cushion method [5], reinforcement method [6], and chemical reinforcement method [7], etc., which usually have problems such as high cost, long construction period, and environment pollution. Thus, the most important thing is to find an efficient [8], environmentally friendly [9], cost-effective [10], and durable [11] solidification method. Microbially induced carbonate precipitation (MICP) and enzyme-induced carbonate precipitation (EICP) are new curing methods developed in recent years that have the characteristics of being highly efficient, environmentally friendly, and durable when compared with traditional methods of solidified sandy soil [12,13,14]. It mainly catalyzes urea hydrolysis via enzymes to generate ammonium ions and carbonate ions. Ammonium ions can provide an alkaline environment for the solution, while carbonate ions combine with calcium ions to generate calcium carbonate, which can improve strength and reduce permeability by rapidly cementing soil particles [15,16,17,18,19,20]. Compared with MICP technology, EICP technology does not require a lengthy bacterial culture process and has no biosafety issues [21]. Moreover, enzymes are much smaller in size than bacteria [22].
Sun et al. [21] discovered that the optimal urease (1.0 mol/L) and complex strength (4.9 MPa) of specimens in the EICP study were 1.56 times that of constant humidity specimens. Thomas et al. [23] discovered that the soft oil was treated with nano silica, bioenzyme, and cement under dynamic load, and through a cyclic triaxial test, the nano dioxide effect was very high for improving the stability of sandy oil under the conditions of biologic enzyme and cement. Saif et al. [24] discovered that the urease activity and calculation carbonate formation rate were increased with increasing temperature when urease and curing time were fixed. When the concentration of the reactant contacts a certain concentration, the reaction rate and prevention amount will be reduced. If the curing time is prolonged, the precession ratio of calcium carbonate can reach 100%. Shen et al. [25] discovered that EICP, EICP-BF (Basalt fiber), and EICP-PVAC (Polyvinyl acetate emulsion) can promote the surface strength (SS) and capacity of sandy soil. The sand treated with EICP-0.5% BF, EICP-30 g/L PVAC, and EICP-50 g/L PVAC has higher erosion resistance. Zhu et al. [26] discovered that the liquefaction persistence of sand is directly proportional to the content of slag power. Under the cyclic triaxial test, with a cyclic stress ratio of 0.2, the number of liquefaction cycles of the solidified soil has risen by 30 instead of the unsolidified soil, which greatly increments the stability of sand. Li et al. [27] discovered that after 30 days of seawater erosion, the strength of the specimens retained 35.19% of the starting strength. The weight was reduced by 6.69%. The test results show that the specimen retains its integrity despite being eroded by sea water. Wang et al. [28] discovered that combining polyacrylic acid (PAA) and EICP can promote sandy soil strength. When the slope of the surface strength lines of EICP-PAA-treated specimens is k = 13.434, 14.002 and 14.186, the surface strength of EICP-PAA-treated specimens is higher than that of EICP (k = 14.271) solidified specimens. Wu et al. [29] discovered that the urease activity incremented from 2.95 U/mL to 5.39 U/mL and the cementing solution incremented from 0.25 M to 0.75 M, which could improve the unconfined comprehensive strength of the specimen sand. Cui et al. [30] investigated the curing action of EICP combined with xanthan gum on sand. It was found that the permeability coefficient of 2% xanthan gum was only 65.4% of that of the pure EICP treatment, and the addition of xanthan gum would accelerate the formation of CaCO3 and increase the vision between sand parties. Alotaibi et al. [31] conclude that, in terms of soil stabilization, the EICP soil treatment has nearly a 90% lower abiotic depletion potential and a 3% reduction in global warming potential compared to Portland cement.
EICP technology can greatly enhance the strength of the soil and decrease its permeability, but its effectiveness in improving the soil’s liquefaction resistance still needs to be validated. So, it is particularly important to clarify the development law of the pore water pressure of solidified soil under cyclic loading. Based on the triaxial consolidated undrained shear test of EICP-solidified sand under cyclic loading, the effects of confining pressure, cementation number, cyclic stress ratio, dry density, and vibration frequency on the development of pore water pressure of EICP-solidified sand were analyzed, and the pore water pressure model suitable for EICP-solidified sand was established and verified. The study findings hold significant theoretical value and scientific importance for promoting EICP technology in the prevention and control of sand liquefaction.

2. Materials and Methods
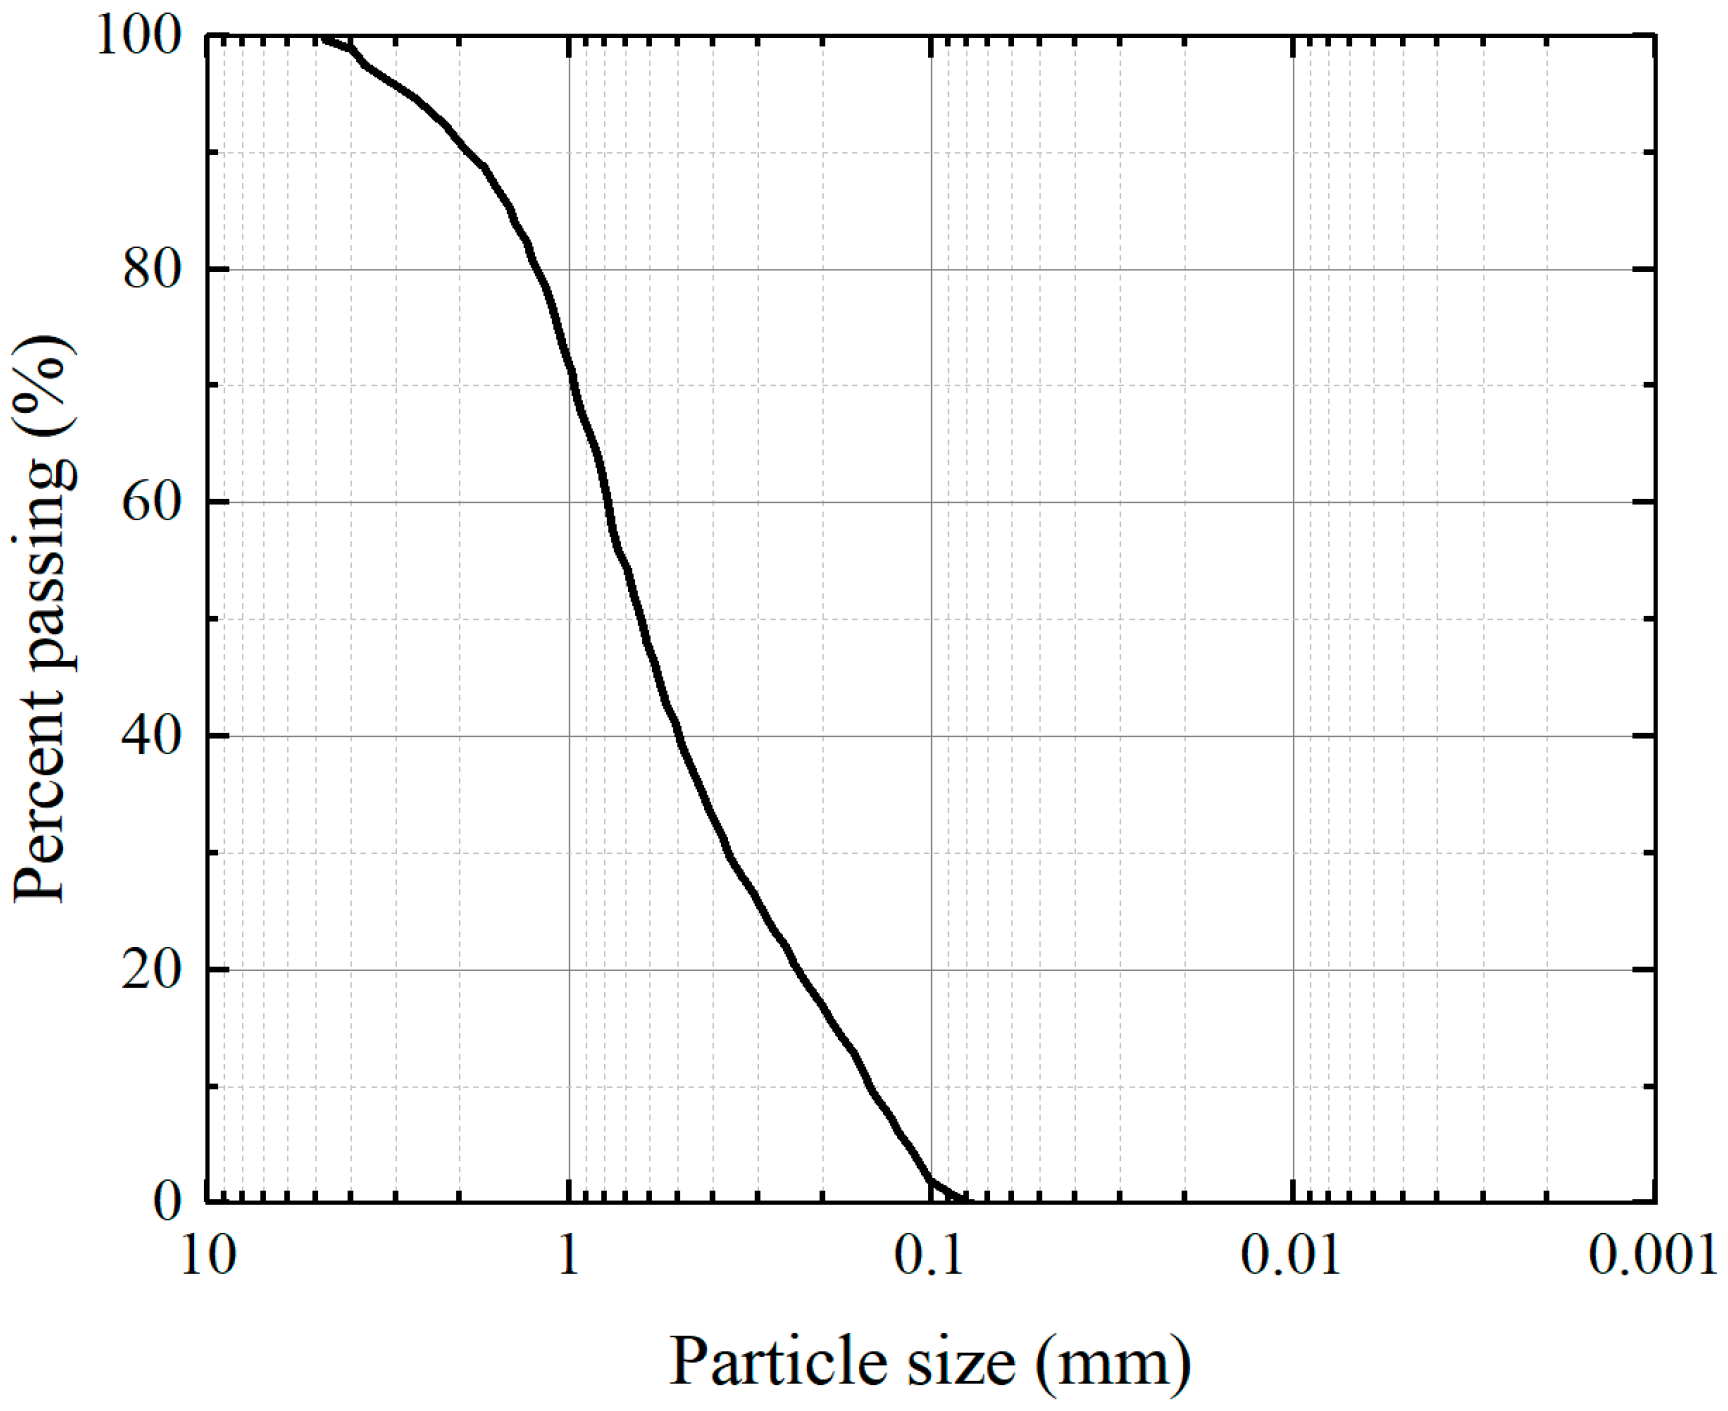
2.1. Test Materials

The test enzyme is soybean enzyme extract, and the soybean is produced in Yilan County Sanxing Ecological Agriculture Co., Harbin, China, which is a non-transgenic product with round and full particles. During the experiment, the soybean was dried and ground into powder, mixed with deionized water after passing through a 0.150 mm sieve, stirred in a magnetic stirrer for 30 min, centrifuged in a centrifuge at a speed of 3000 r/min for 30 min, and then the supernatant was extracted, which was enzyme solution. The enzyme solution prepared by mixing 100 g soybean powder with 1000 mL water was used for the follow-up test. The urea and anhydrous calcium chloride are purchased from China National Pharmaceutical Group Chemical Reagent Company, Shanghai, China. The cementing solution is the mixture of urea and anhydrous calcium chloride, which is prepared 1:1 (equal concentration and equal volume). The standard sand used in the test is China ISO standard sand (GB/T 50123-2019) [32], which is purchased from Xiamen Aisiou Standard Sand Co., Ltd., Xiamen, China. The standard sand grading curve is displayed in Figure 1. The physical property index of standard sand is shown in Table 1.

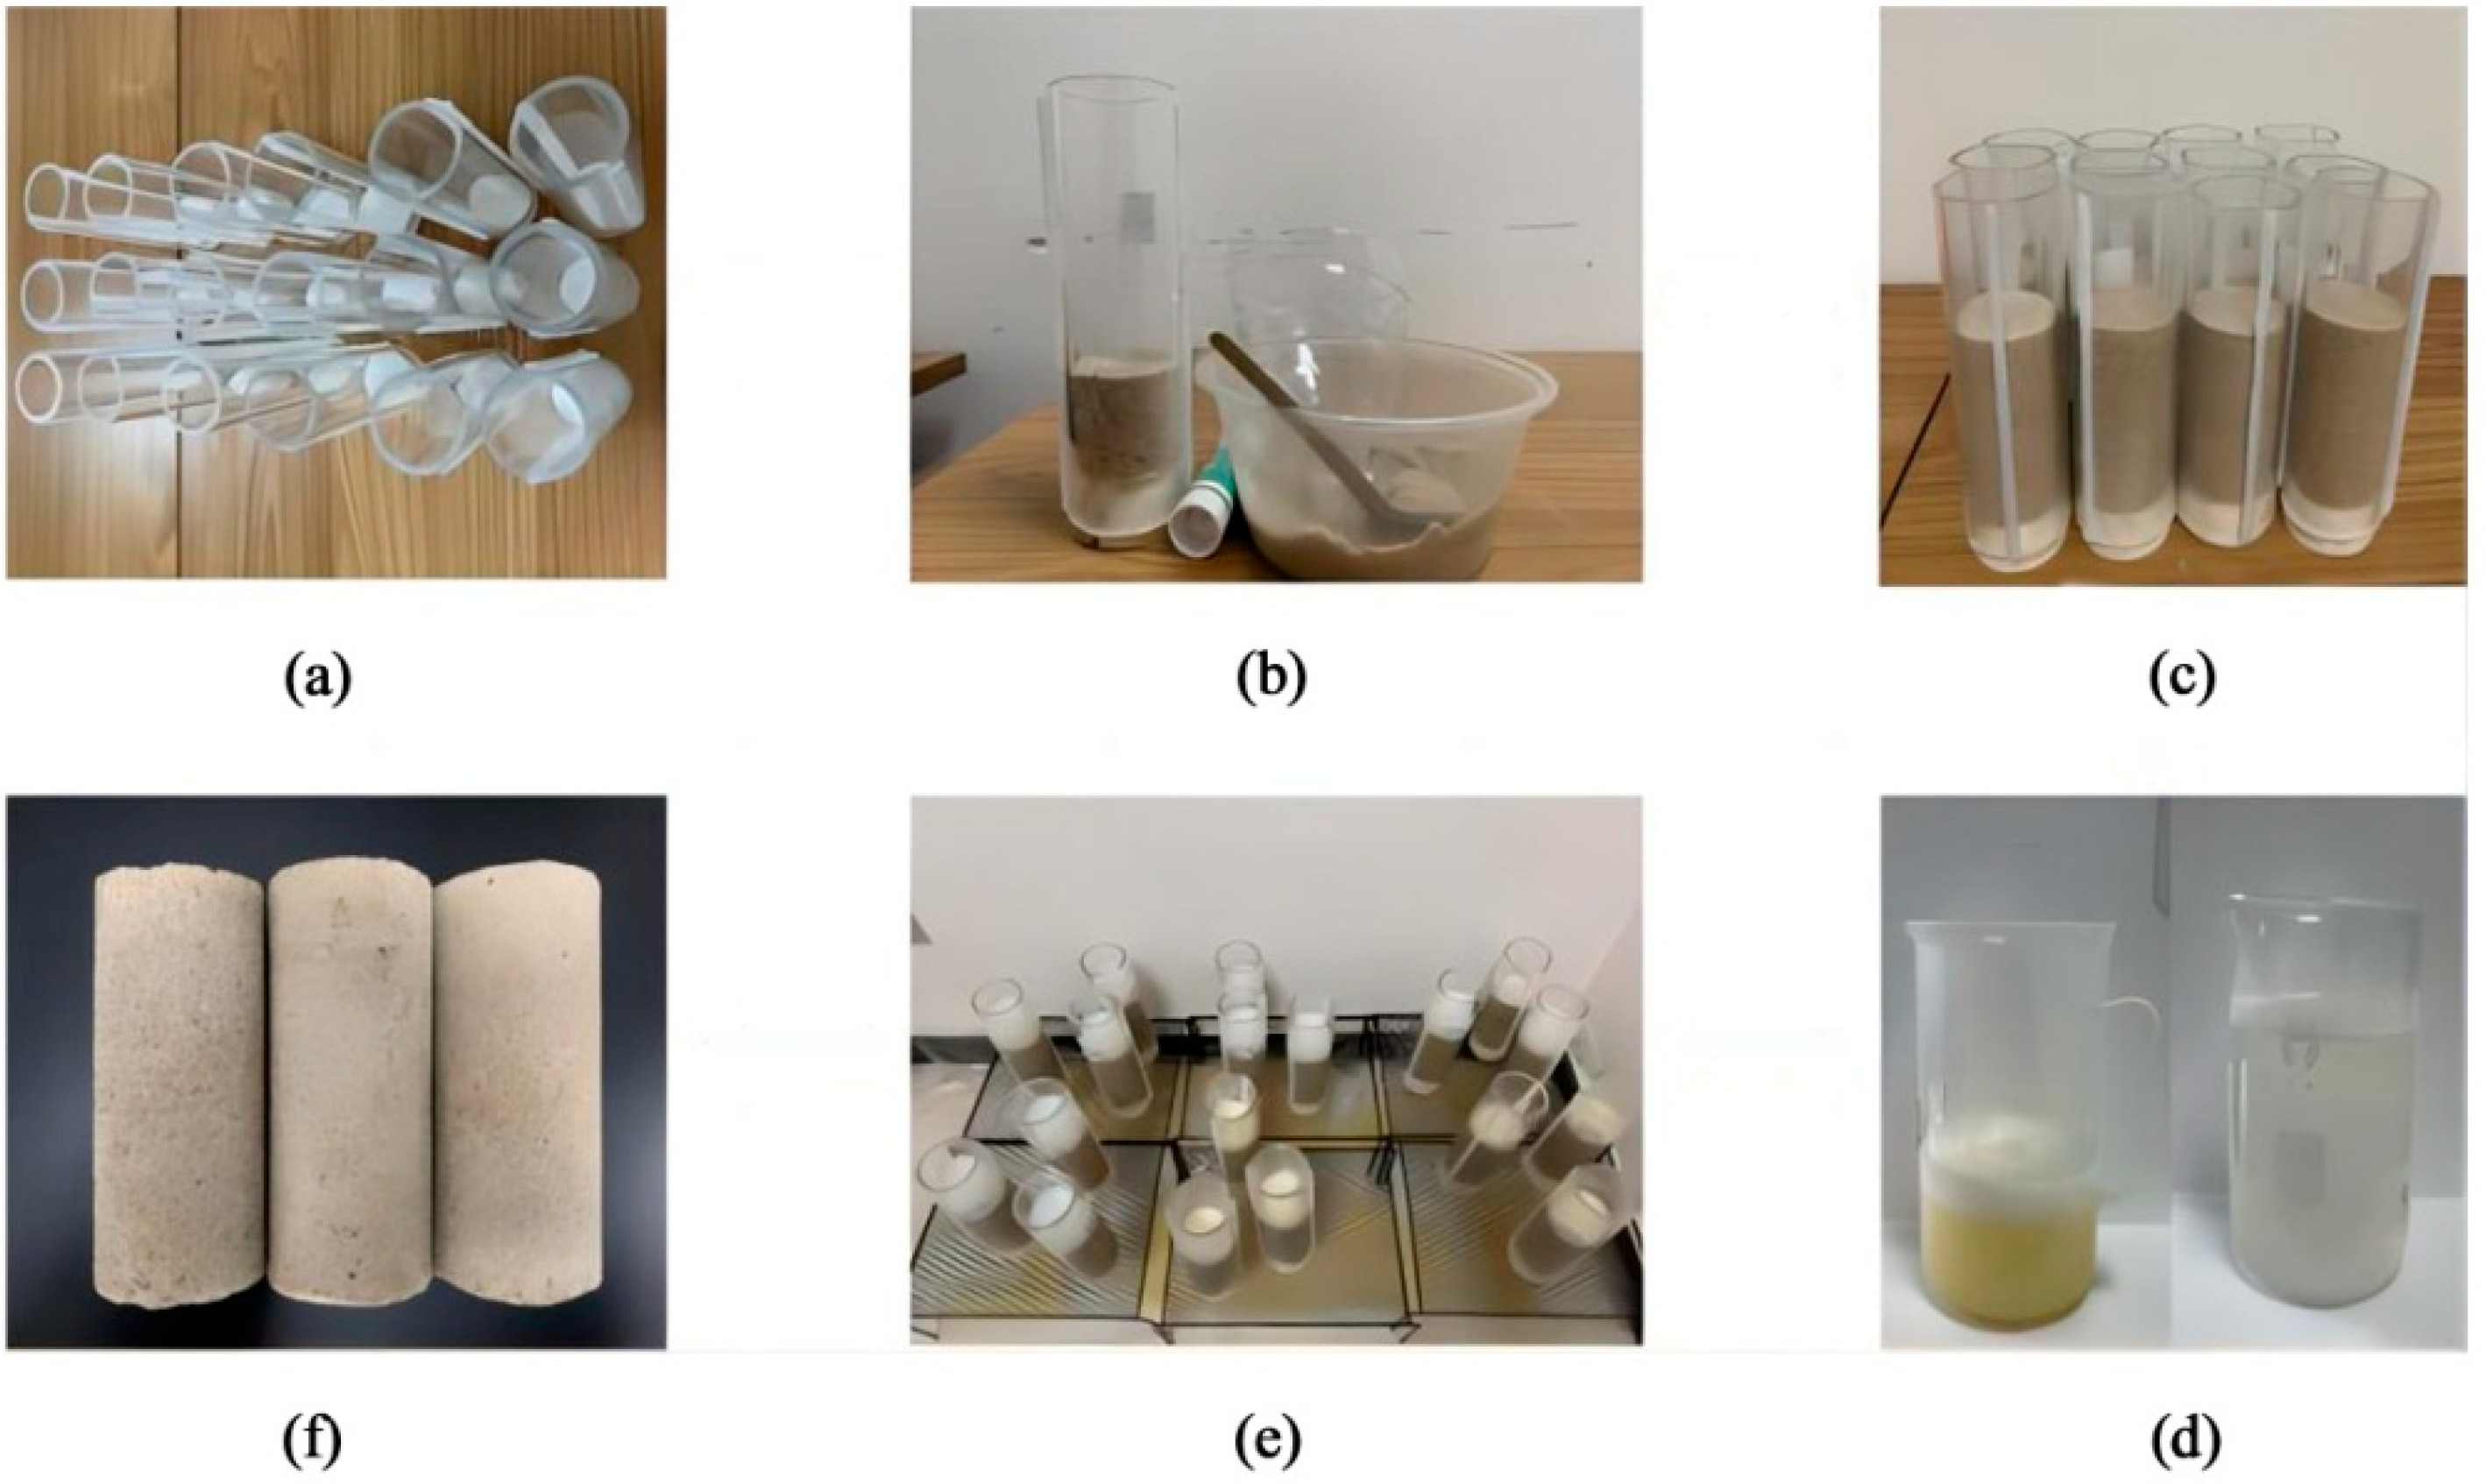
2.2. Sample Preparation

The Plexiglas tube with an internal diameter of 50 mm and a height of 200 mm is chosen for the sample mold. The mold is half-open for taking out the solidified specimen and is fixed by hot melt adhesive when used. The triaxial specimen is 50 mm in diameter and 100 mm in height. To avoid leakage during pouring, the bottom of the mold is sealed with a rubber plug. Based on the set dry density, the specimen is loaded in 4 layers. The standard sand is evenly and slowly sent into the mold by funnel and drug spoon, and the sand column is compacted by compaction hammer. After the specimen is placed, a layer of filter paper is laid on top to reduce the impact disturbance of the pouring liquid. In the process of pouring, 40 of mL enzyme was first poured into the mold, and then stood for 30 min after enzyme grouting until enzyme fully penetrated into the pores of sand. Then, 40 mL of cementing solution was poured. After pouring, the specimen was left for 24 h and air-dried at normal temperature. The specimen preparation process is shown in Figure 2.

2.3. Test Methods

To analyze the cumulative characteristics of pore water pressure of EICP-solidified sand under cyclic loading, a triaxial consolidated undrained shear test was carried out by using DYNTTS dynamic triaxial soil testing machine (manufactured by Earth Products China Limited, Hong Kong, China). The influence of confining pressure (σ3), cementation number (Pc), cyclic stress ratio (CSR), initial dry density (ρd), and vibration frequency (f) on the pore water pressure ratio (ru) was considered in the test process. Pc represents the number of injected cycles with enzyme solution and cementing solution. CSR [33,34] is defined as the ratio of the amplitude of the applied cyclic stress to two of the effective confining pressures after consolidation. The ru [35] is the ratio between the accumulated excess pore water pressure and the confining pressure. The test scheme is displayed in Table 2. Based on the geotechnical test method standard (GB/T 50123-2019) [32], the specimen is first put into a vacuum saturation cylinder for saturation for more than 10 h and then taken out and loaded into a pressure chamber for step-by-step back pressure saturation. Once the pore water pressure coefficient B is greater than 0.99, the specimen is saturated. After the specimen is saturated, the effective confining pressure is applied to consolidate for more than 60 min, and the consolidation is completed after the drainage volume has no change. Stress control is adopted in the test, sinusoidal wave load is applied axially, and the number of cycles (N) is 10,000. When the pore pressure reaches the effective confining pressure, the test is stopped. The 108-group tests were carried out, and repeated tests were set for each group of specimens.
Based on relevant research [36,37,38,39,40,41], the existing pore water pressure prediction model was fitted and analyzed with test data, and a new pore water pressure model for EICP-solidified sand was established to verify its feasibility. Table 3 summarizes the existing prediction models of the pore water pressure of sand.

3. Results and Discussion

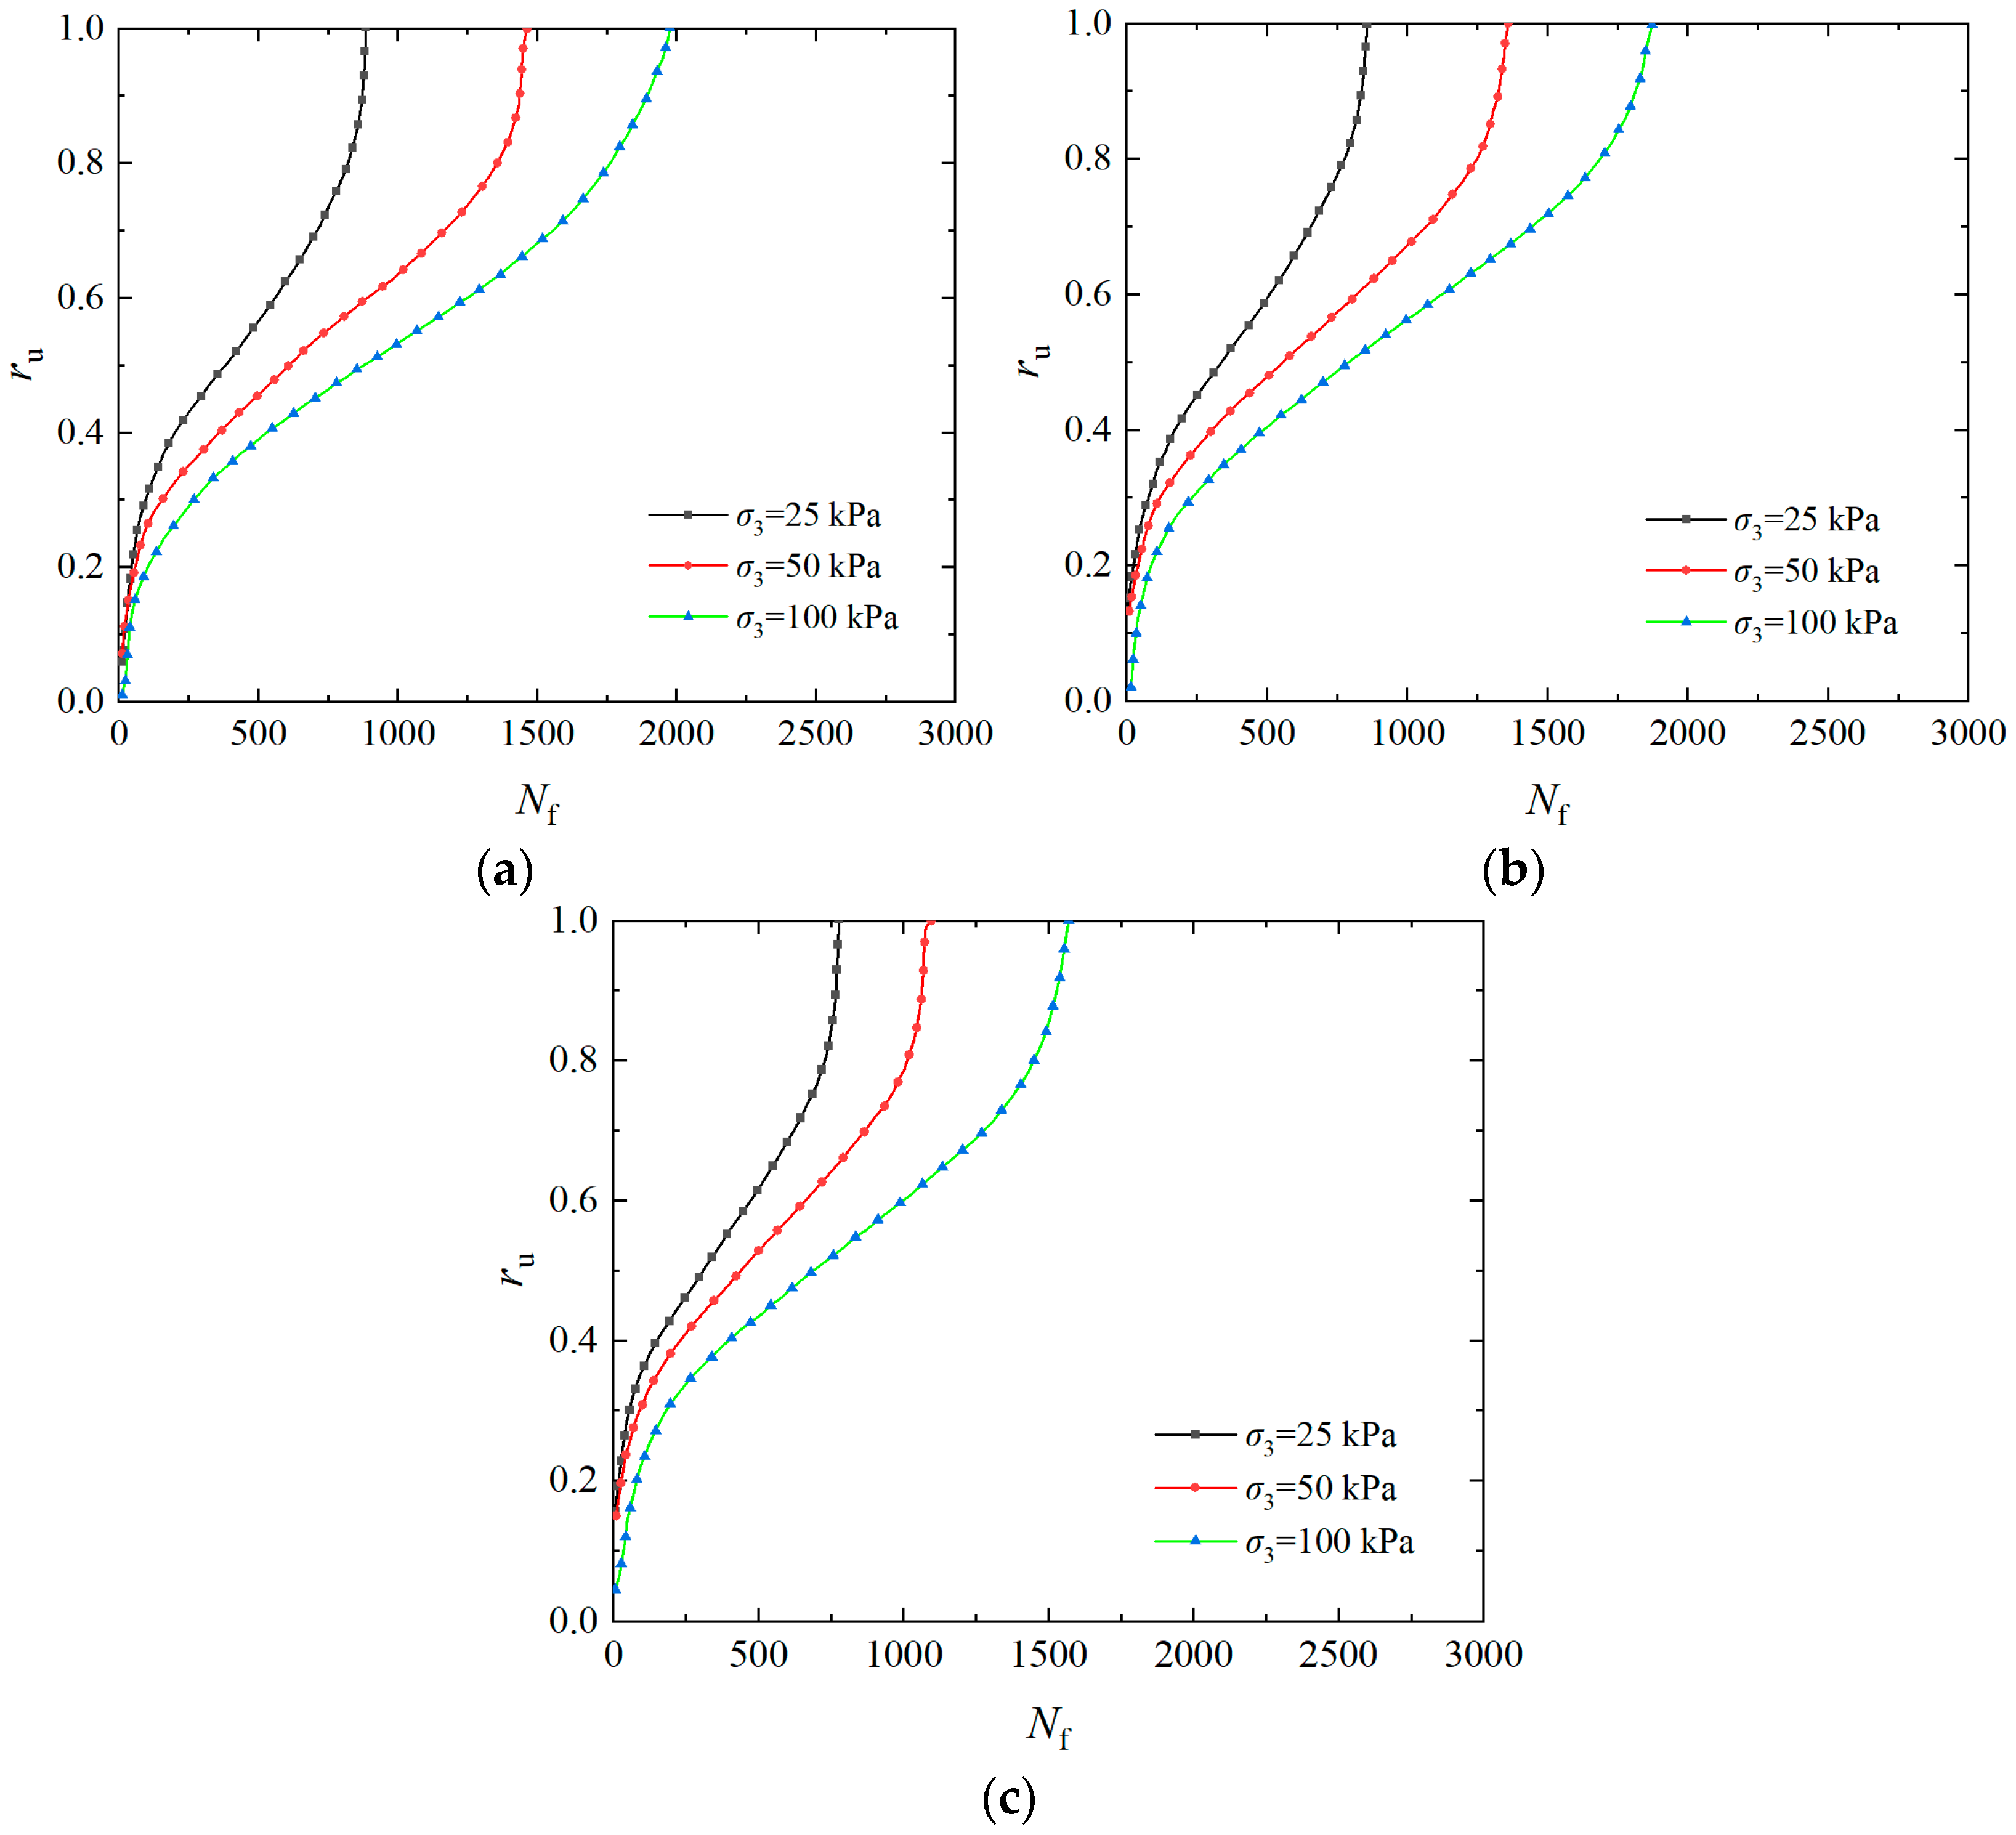
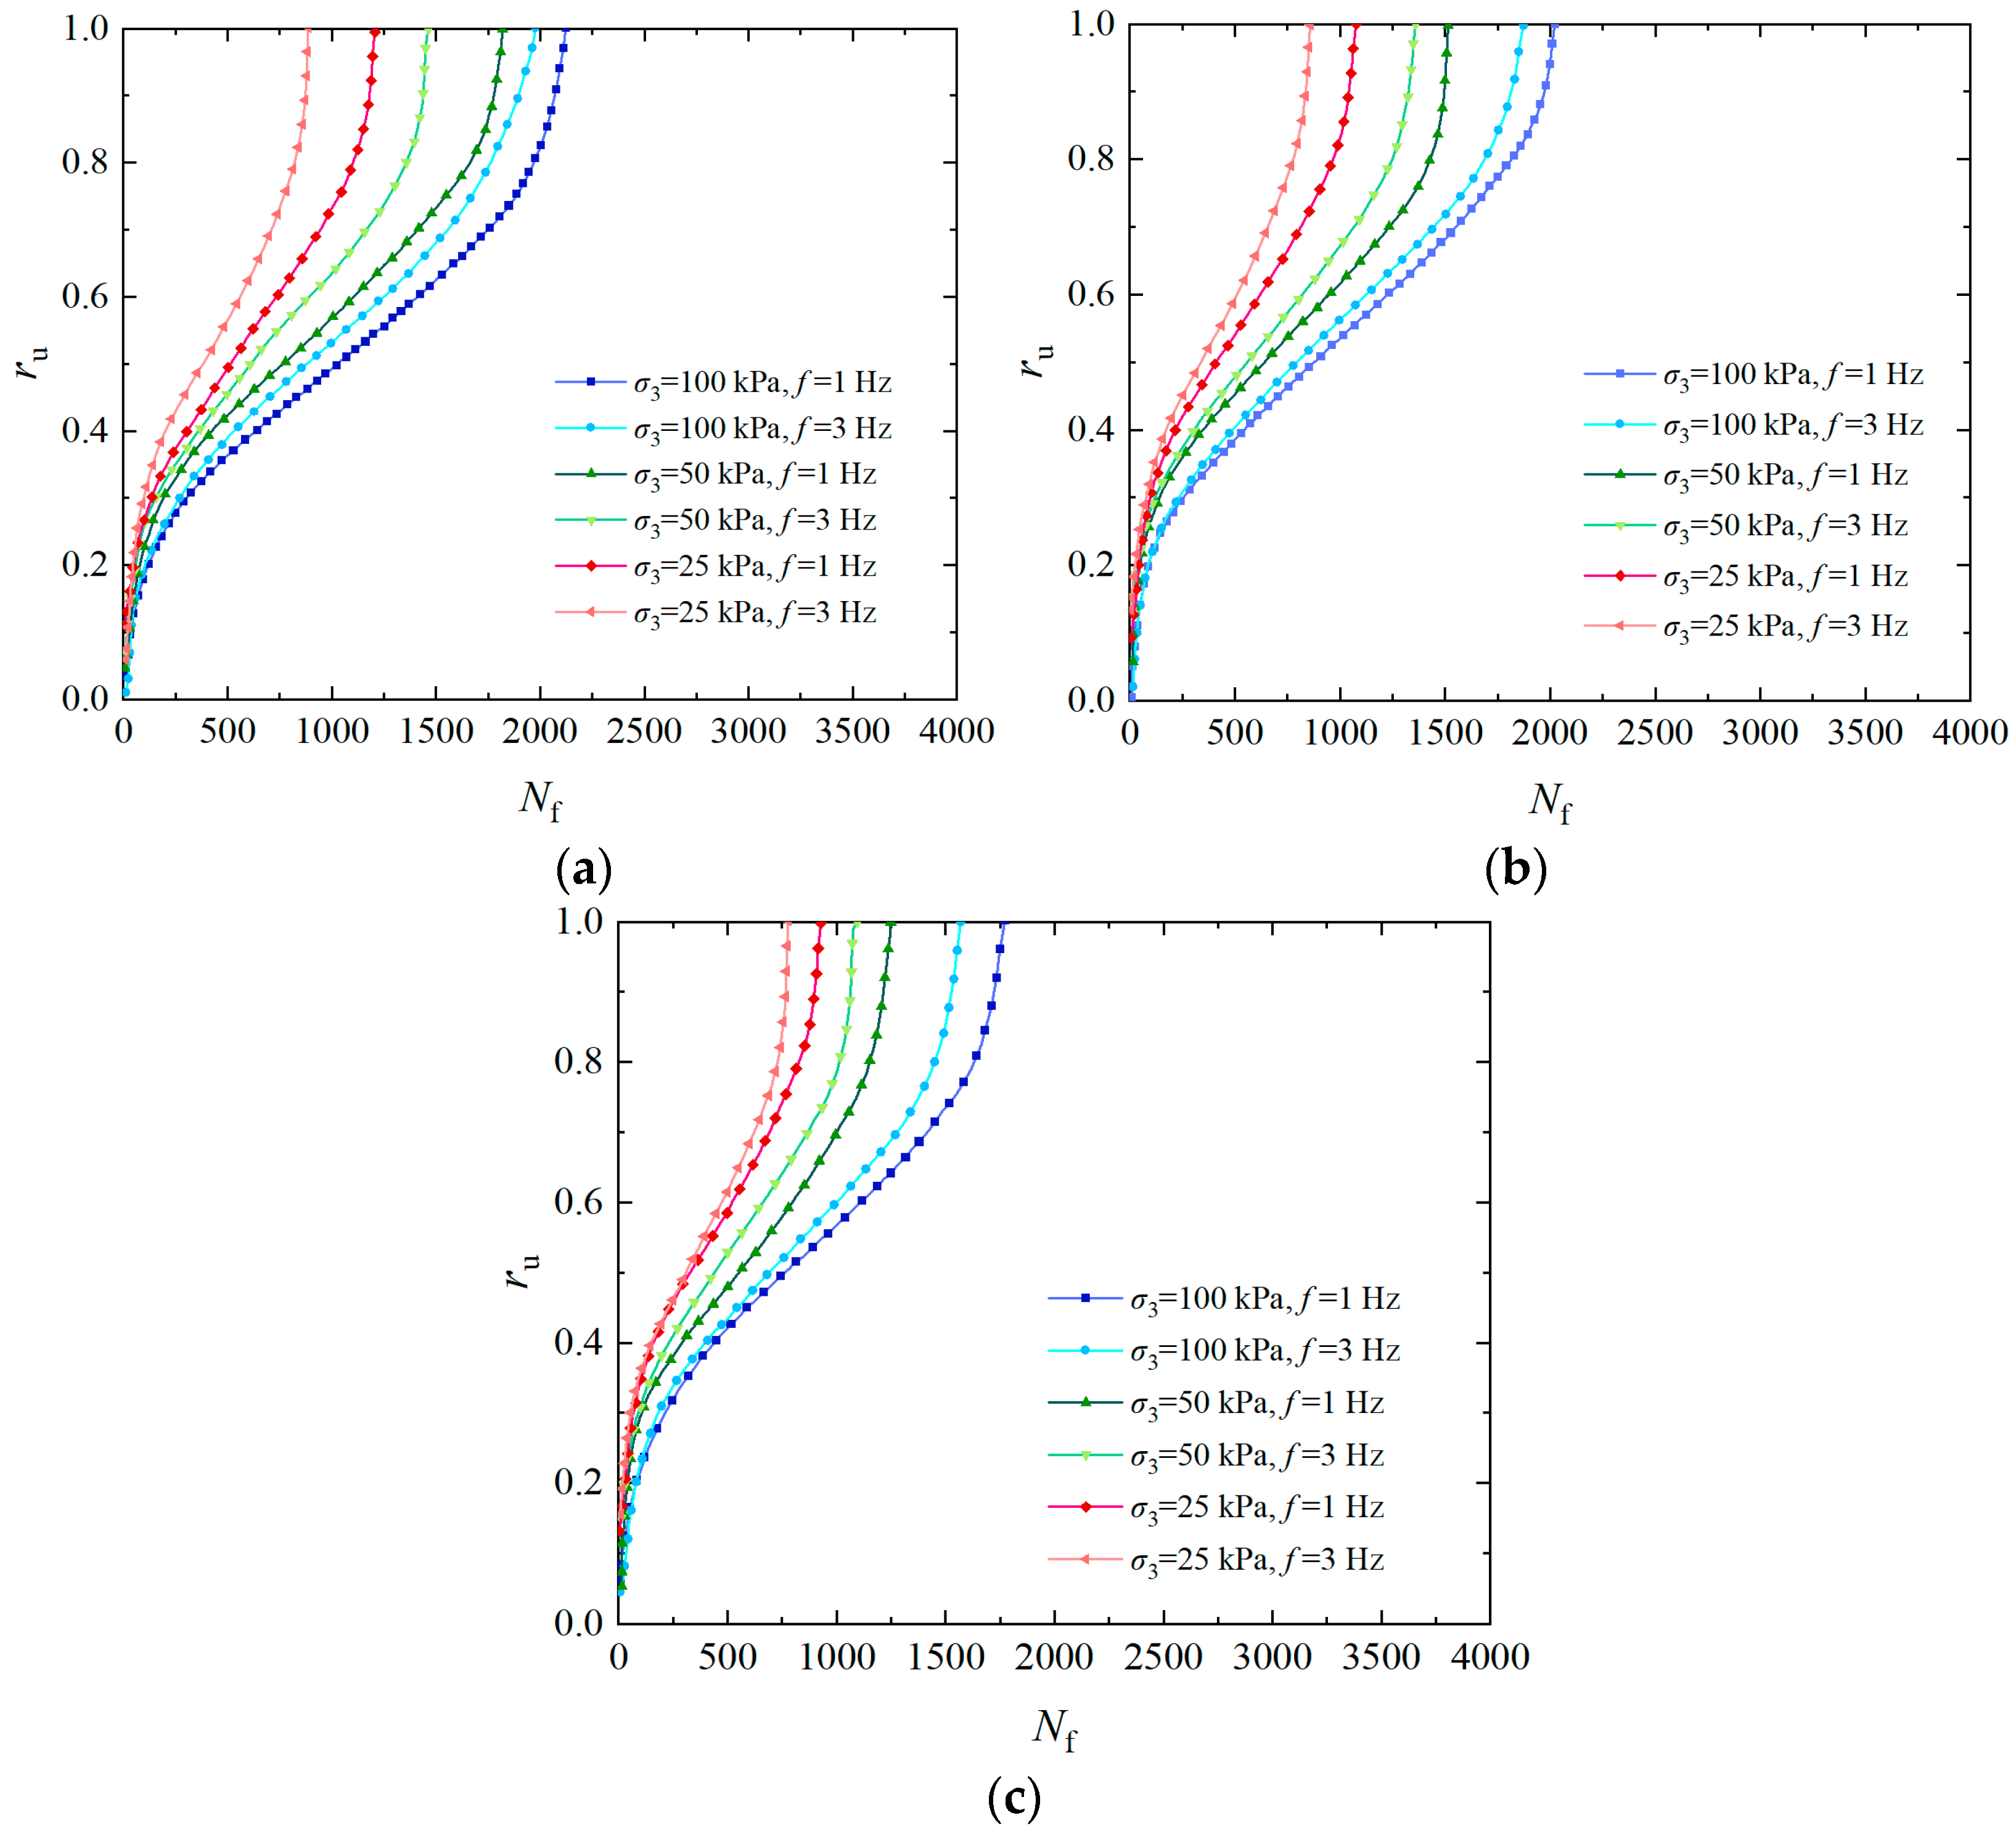
3.1. Analysis of the Influence of Confining Pressure on Pore Water Pressure

The σ3 generally rises with increasing soil depth, so it has an important influence on the pore water pressure accumulation. Figure 3 shows the curves of the over pore pressure ratio of the solidified specimen with a vibration number under ρd of 1.6 g/cm3, Pc of 2, f of 1 Hz, and CSR of 0.25, 0.30, and 0.35, respectively. The pore water pressure varies in three stages as the vibration number rises, as seen in Figure 3: in the instantaneous increase section, the curve is convex (pore pressure increases rapidly); in the middle gentle section, the curve is nearly linear (pore water pressure rises slowly); and in the instantaneous liquefaction section, the curve is concave (pore water pressure increases rapidly). When the CSR is 0.25, the ru is 0.6 under σ3 of 100 kPa, the cumulative curve of pore water pressure is steep, and the vibration number is less when liquefaction is reached. However, the ru of the specimen under σ3 of 25 kPa is 0.4, the pore pressure curve is slow, and the vibration number is the highest when liquefaction is reached. It can be seen that as the σ3 increases, the failure vibration number of the specimen decreases, while the growth rate of pore water pressure accelerates, and the pore water pressure curve shows an increasing trend from slow to steep, indicating that the liquefaction resistance of the solidified specimen gradually decreases [42]. The primary reason for this phenomenon is that the σ3 has a significant effect on dynamic stress. Under significant dynamic loading, the soil structure is largely destroyed. The soil stress is entirely born by the pore water pressure, and effective stress gradually decreases to zero, which makes liquefaction more likely to occur.

3.2. Analysis of the Influence of Cementation Number on Pore Water Pressure

To study the effect of the Pc on the accumulation law of pore water pressure of EICP-solidified sand, Figure 4 summarizes the curves of the over pore water pressure ratio with the vibration number at ρd of 1.6 g/cm3, σ3 of 25 kPa, and f of 1 Hz, and CSR of 0.25, 0.30, and 0.35, respectively. Seeing Figure 4, the pore water pressure curve of solidified specimens changes from steep to slow as the Pc rises. The velocity of the increase in pore water pressure decreases gradually, and the vibration number required for failure increases gradually. This indicates that the rise in Pc contributes to enhancing the liquefaction resistance of EICP-solidified sand. The primary factor contributing to this phenomenon is that, as the Pc rises, CaCO3 crystals produced by EICP mineralization gradually increase. The CaCO3 crystals can efficiently occupy the pores between sand particles, cementing sand particles together, thus improving the overall mechanical properties of the treatment sands. Under vibration loading, the solidified soil skeleton and pore water pressure bear the dynamic stress together, which leads to the liquefaction of the specimen.

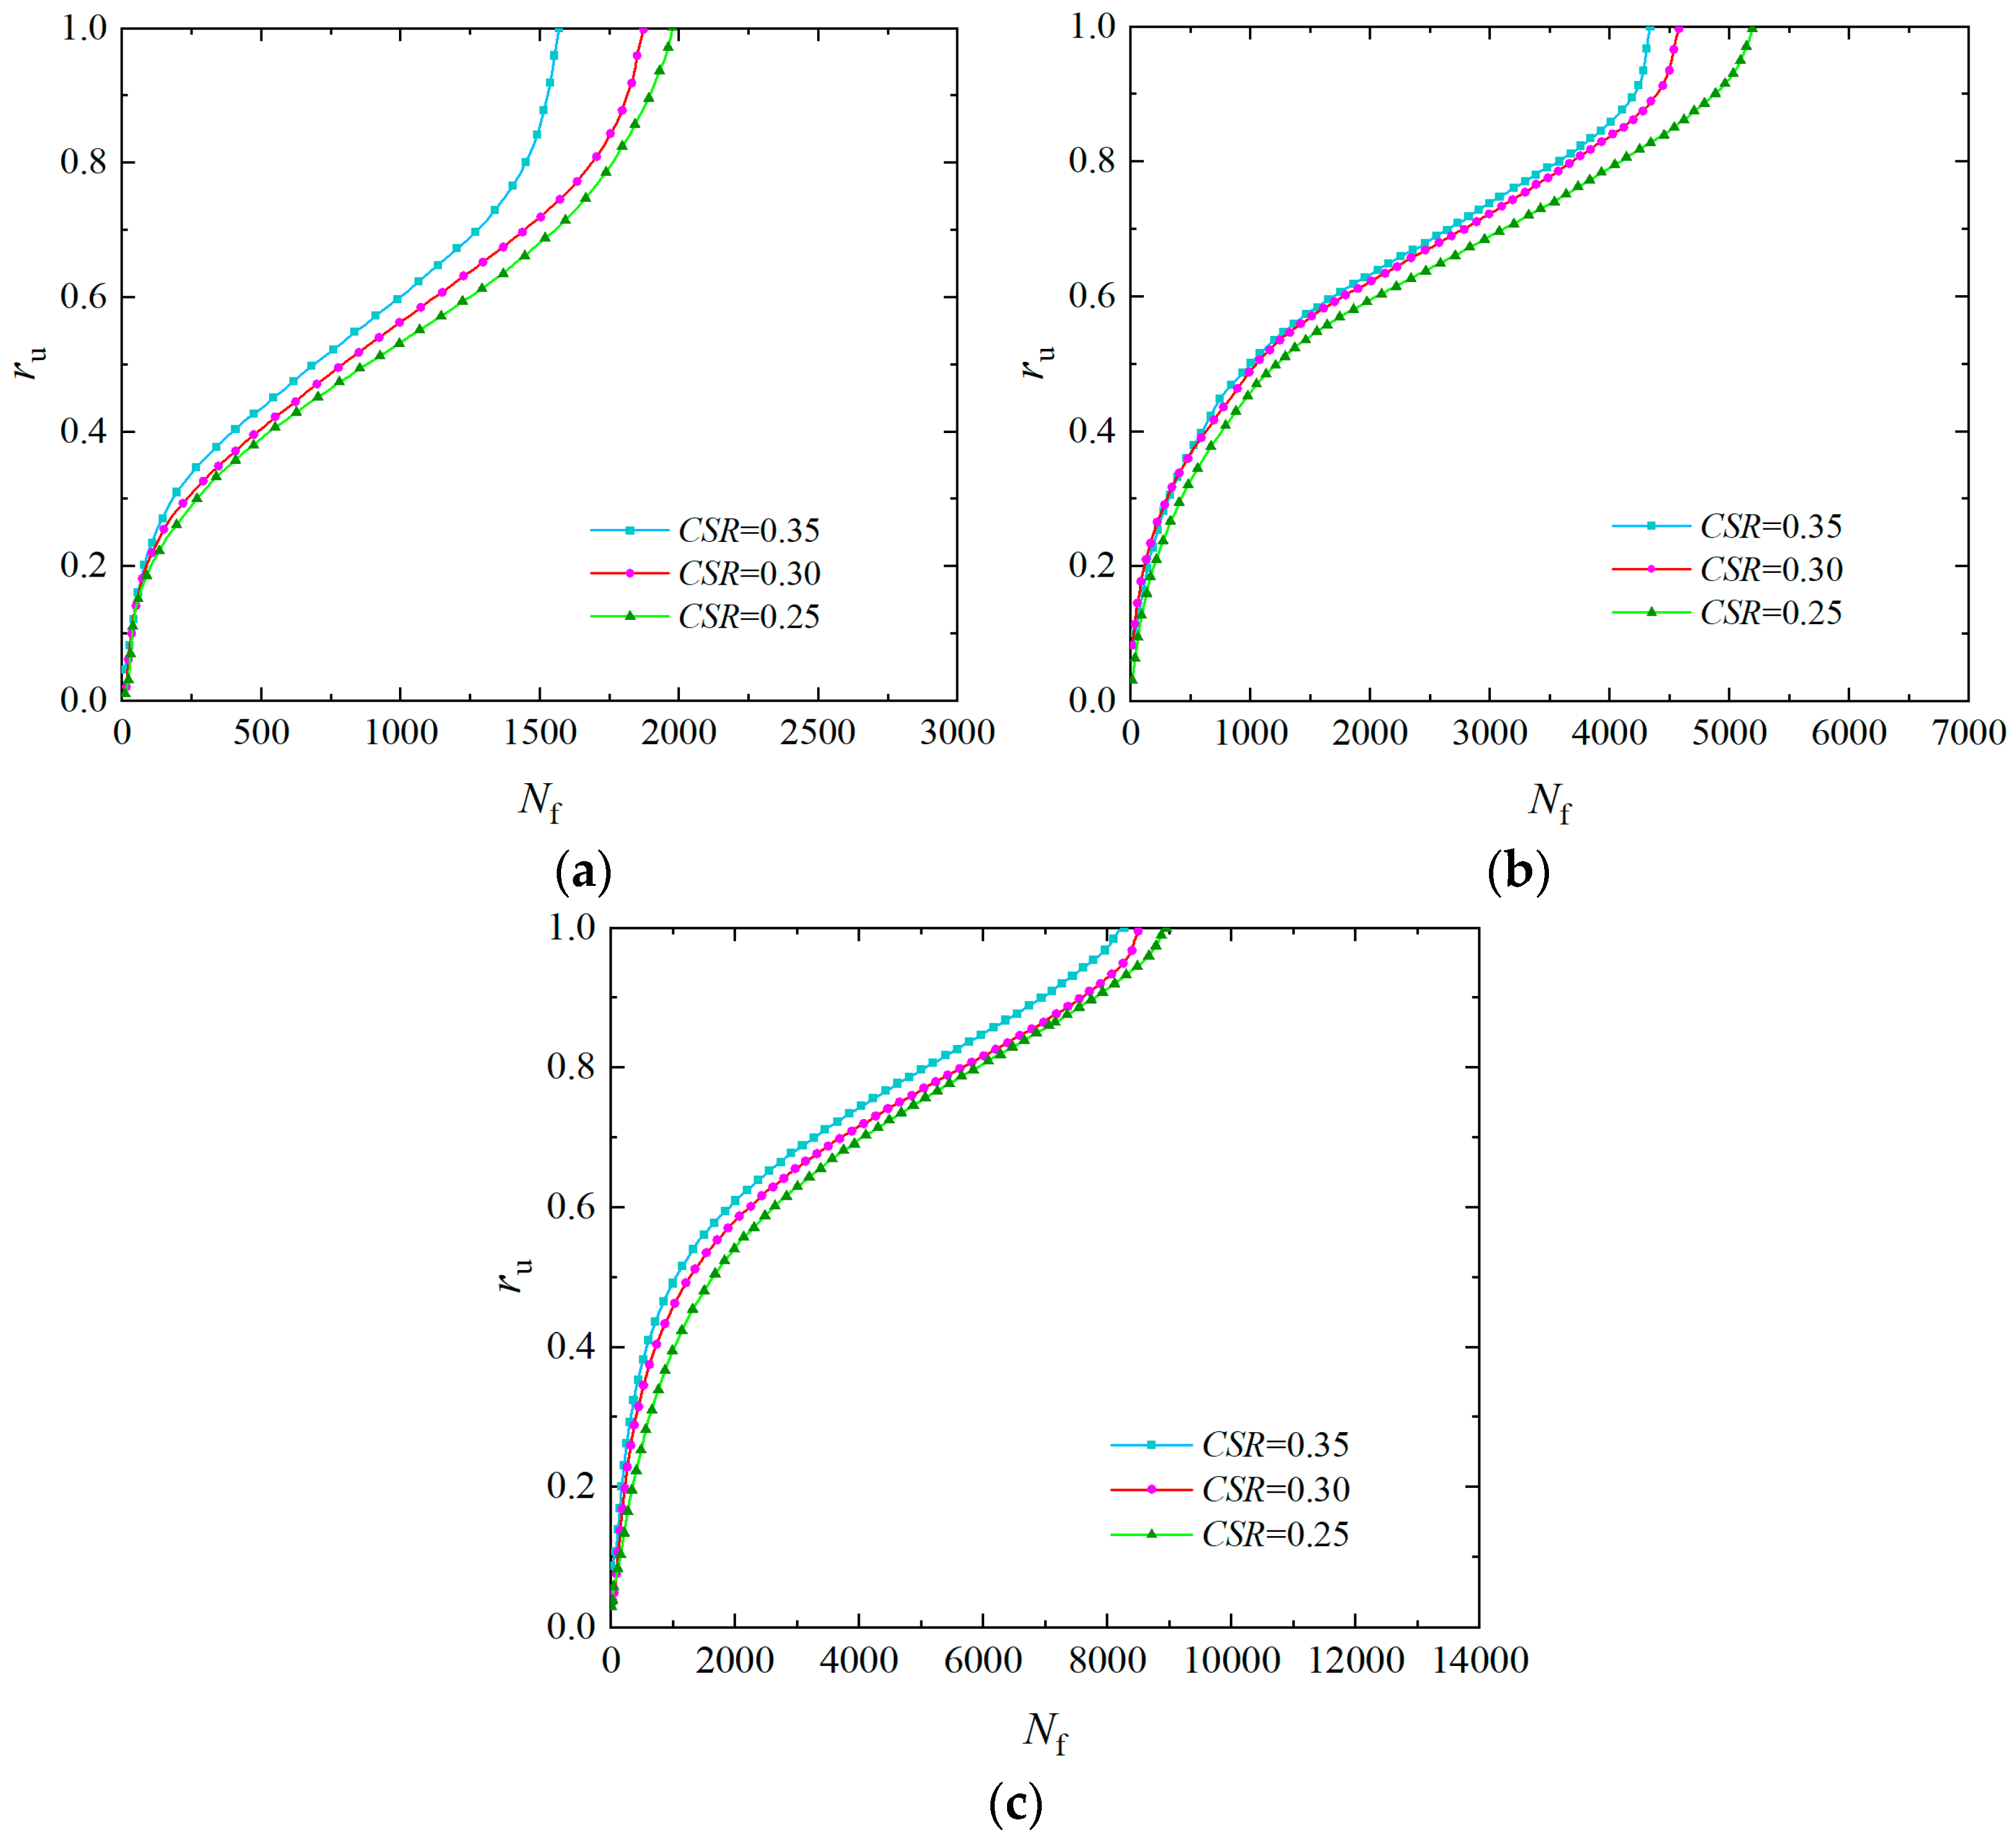
3.3. Analysis of the Influence of Cyclic Stress Ratio on Pore Water Pressure

To study the effect of the CSR on pore water pressure accumulation characteristics, Figure 5 shows the curve between the excess pore water pressure ratio and vibration number when the ρd is 1.6 g/cm3, the σ3 is 25 kPa, the f is 1 Hz, and the Pc are 2, 4, and 6. For the number of the same vibrations, the higher the CSR, the higher the corresponding the ru. The greater the CSR, the fewer vibrations number are required for the liquefaction of the specimen, which indicates that the rise in the CSR accelerates the liquefaction trend in the specimen. The reason is that the rise in the CSR will exert stronger shear stress in a short time, which will lead to sand particles being rearranged, enhance the connectivity of pores in the sand, cause the rapid rise in the pore water pressure, and make the liquefaction trend in specimens more obvious [43]. When Pc is 6, the vibration number required for specimen liquefaction does not change significantly with the increase in the CSR. The main reason is that when Pc is 6, the EICP mineralization reaction generates a large amount of CaCO3 to fill the pores, cementing sand particles, increasing the cohesion and the shear strength of sand, and improving the liquefaction resistance of the specimen [44].

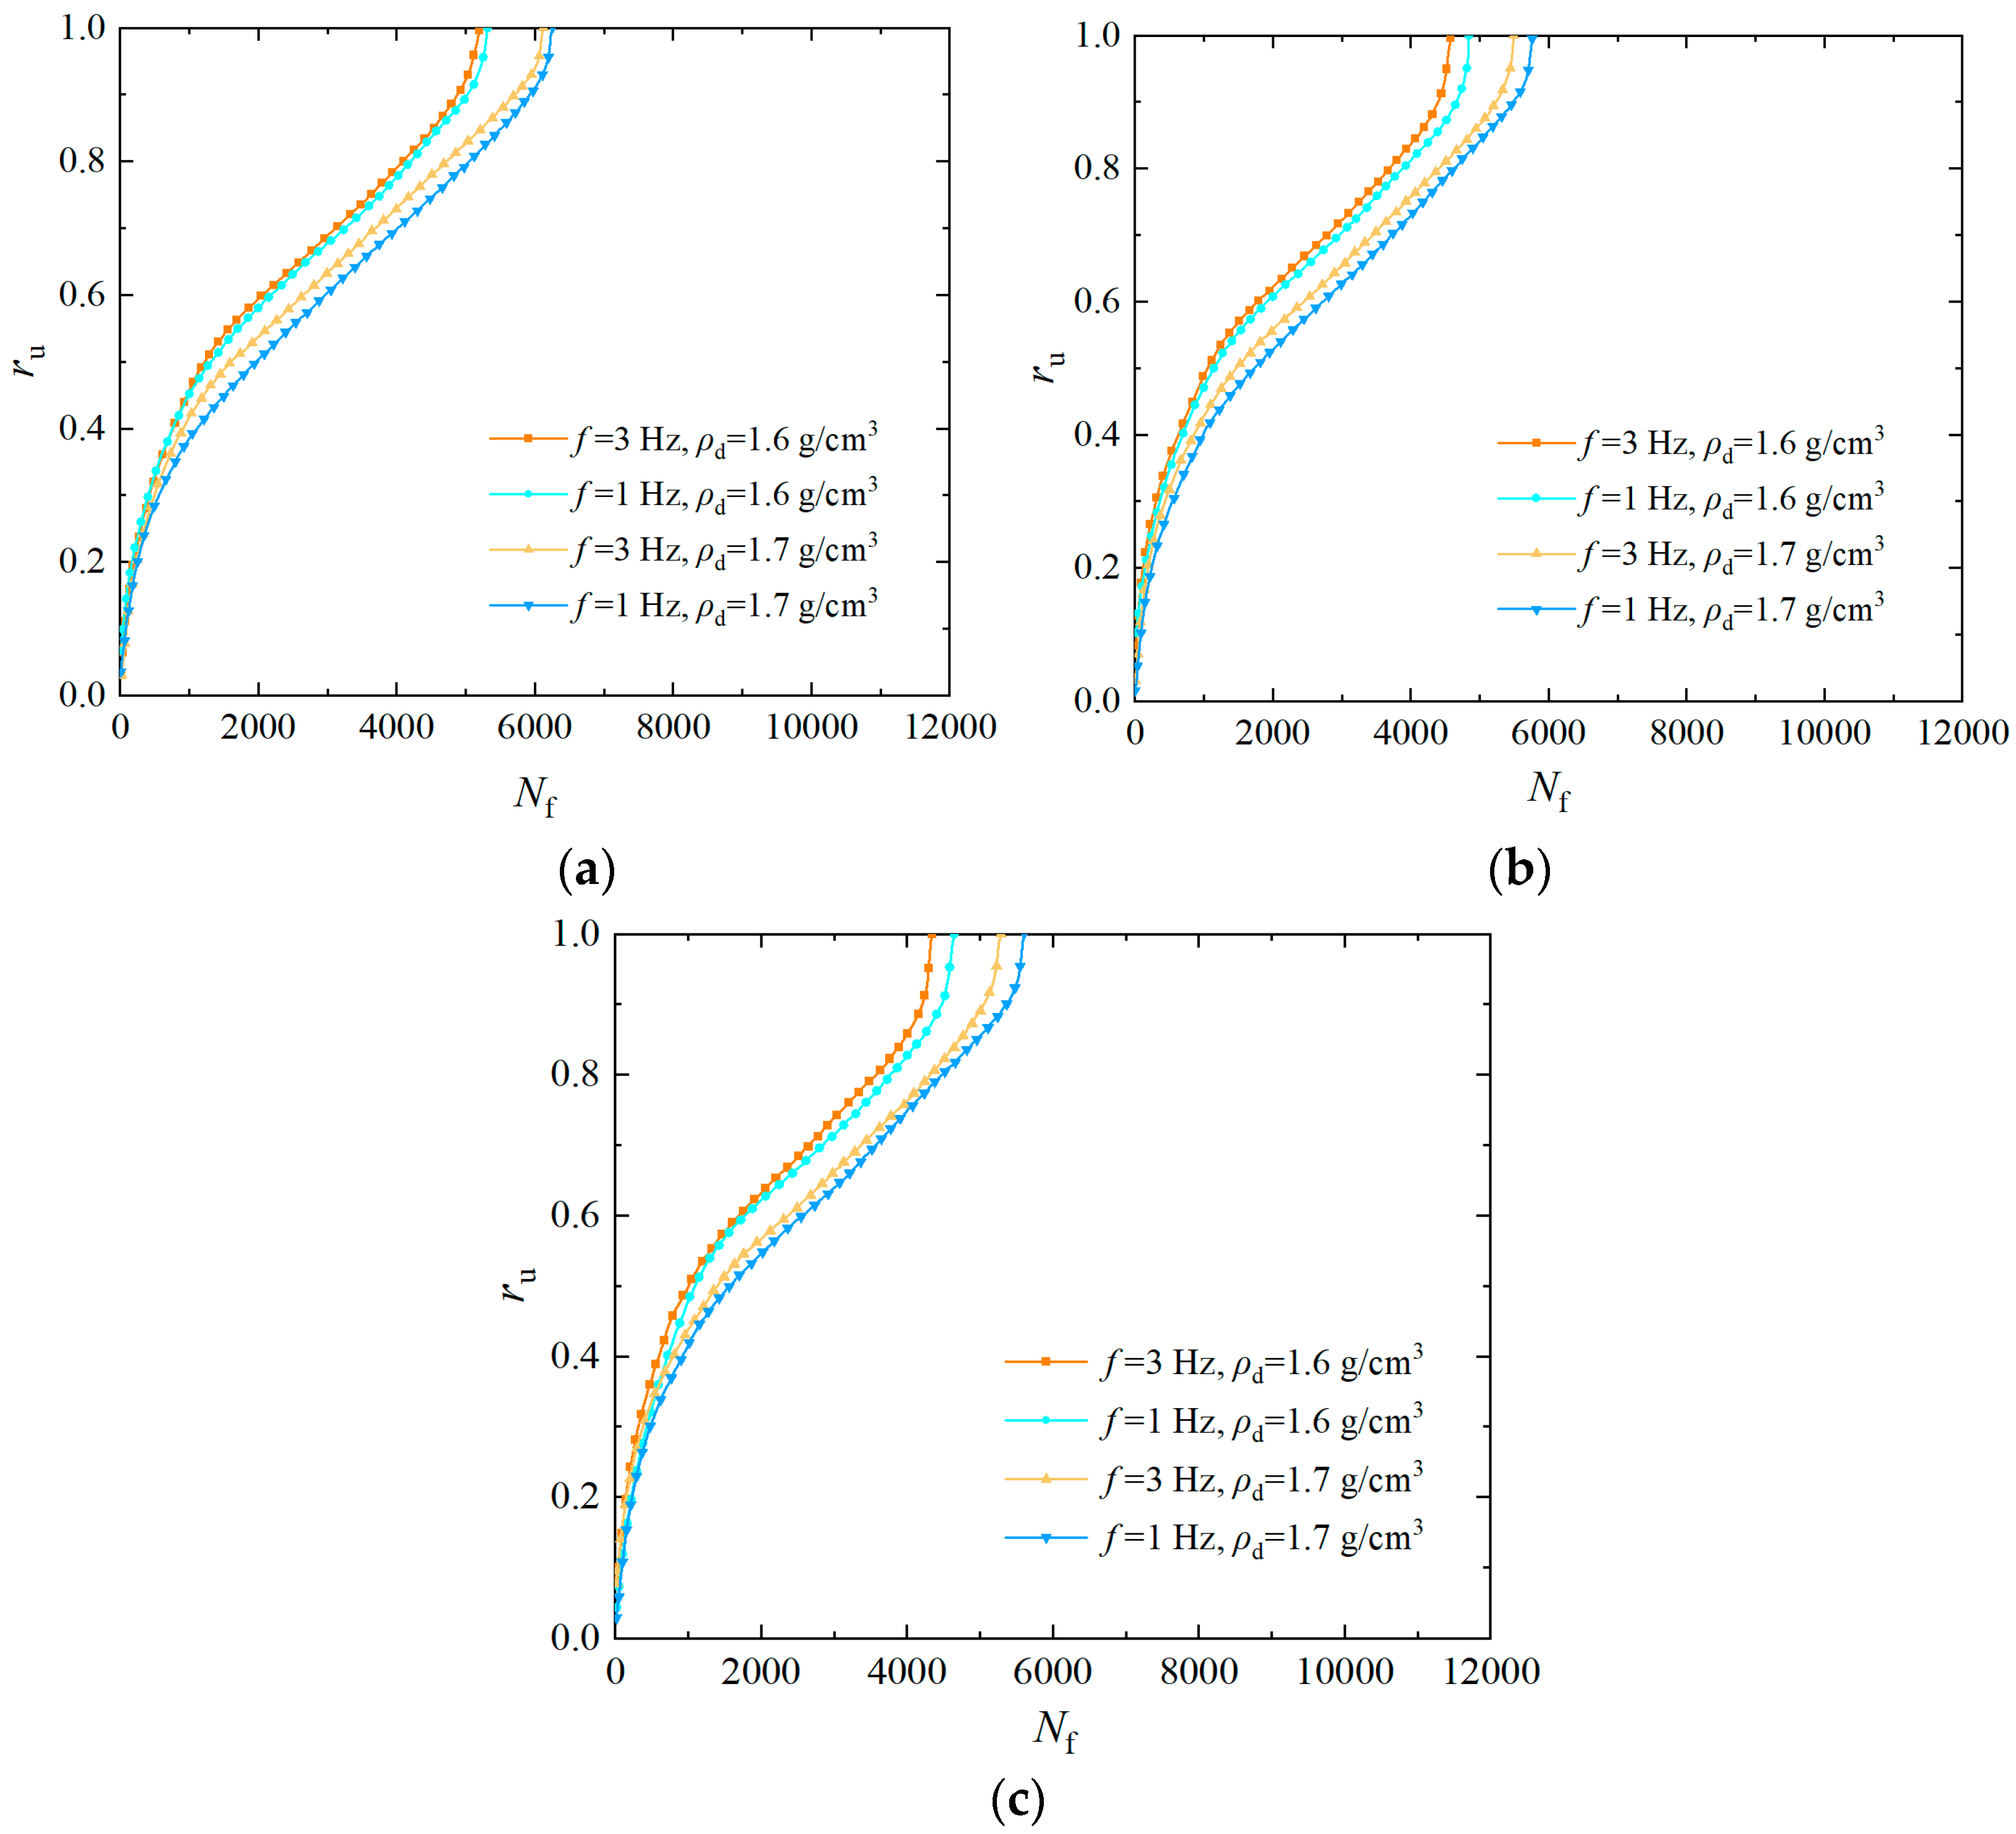
3.4. Analysis of the Influence of Dry Density on Pore Water Pressure

The ρd affects the liquefaction resistance of EICP-solidified sand. Figure 6 summarizes the curves of the over pore pressure ratio versus the vibration number at σ3 of 25 kPa, Pc of 4, and CSR of 0.25, 0.30, and 0.35, respectively. In seeing Figure 6, the cumulative curve of the pore water pressure of the specimen is steep at ρd of 1.6 g/cm3, and the vibration number required for liquefaction is less. However, the cumulative curve of the pore water pressure of the specimen is smooth, and the vibration number required for liquefaction rises when the ρd is 1.7 g/cm3. This indicates that as the ρd of the specimen increases, the rate of the growth of the pore water pressure decreases and the vibration number required for failure increases correspondingly [45]. This phenomenon occurs because the contact points between sand particles increase, and the pores between particles decrease as the ρd of the specimen rises. CaCO3 crystals produced by EICP mineralization can better cement sand particles, which leads to the decrease in pore volume and the deterioration of the permeability of the specimen. Under cyclic loading, the pore water pressure rises slowly, which delays the liquefaction process of specimens.

3.5. Analysis of the Influence of Frequency on Pore Water Pressure

The f directly reflects the moving speed of the dynamic load and vibration number, affecting the liquefaction resistance of EICP-solidified sand. Figure 7 summarizes the curves of the over pore pressure ratio versus the vibration number at the ρd is 1.6 g/cm3, the Pc is 2, and the CSR are 0.25, 0.30, and 0.35, respectively. Seeing Figure 7, the ru of the specimen reduces gradually as the rise in f at the vibration number is constant. The vibration number required for liquefaction of specimen gradually rises with the improvement in f when the ru is constant. That is, as f increases, the rise speed of pore water pressure of the specimen gradually reduces and the vibration number required for liquefaction gradually improves. The reason is that the pore pressure transfer is affected by the drainage channel formed by the pore penetration of the soil skeleton. Under high-frequency cyclic loading, the dislocation between sand particles will lead to the reconstruction of the drainage channel, and the reconstructed channel will have a blocking effect due to the action of small particles, thus reducing the rate of pore water pressure transmission and improving the liquefaction resistance of solidified specimen.

4. Pore Pressure Model of EICP-Solidified Standard Sand

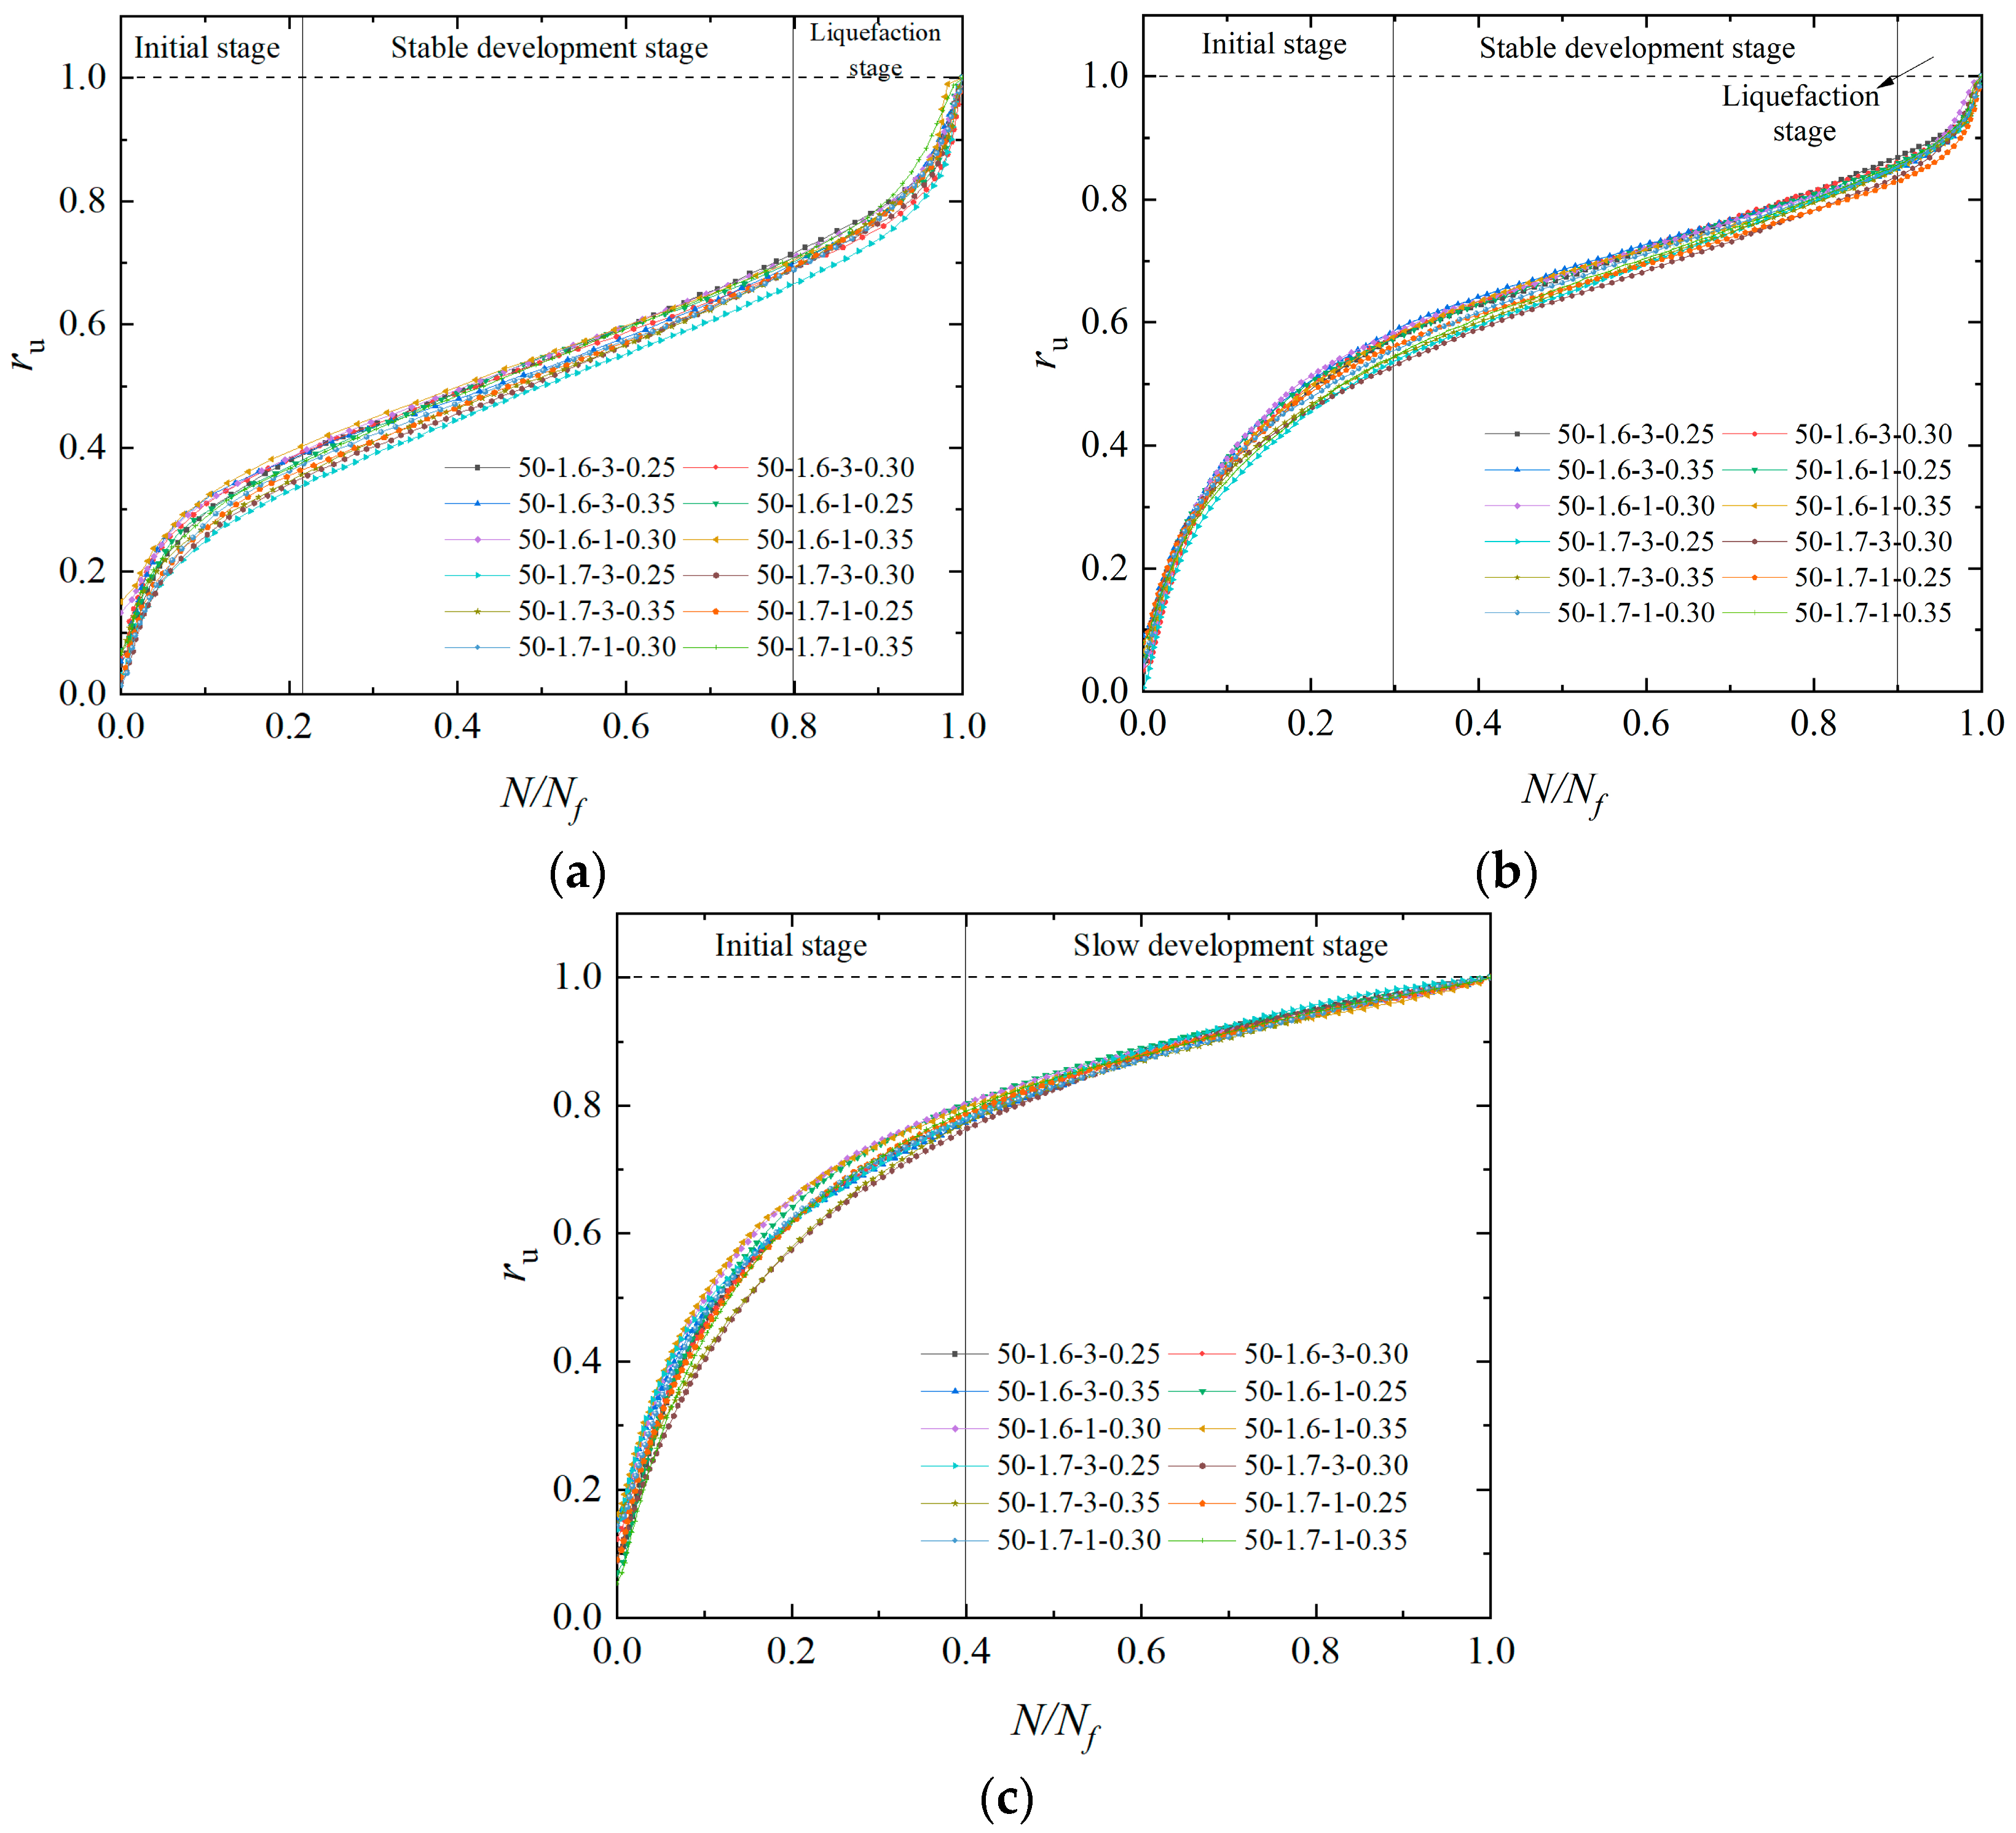
4.1. Analysis of Pore Pressure Development Model

Figure 8 summarizes the evolution pattern of the pore water pressure of the EICP-solidified sand at a Pc of 2, 4, and 6. Based on the development pattern of the pore water pressure in EICP-solidified standard sand, the Pc has a significant impact on the pore water pressure, while ρd has a lesser effect. Generally, the modes of developing pore water pressure can be classified into two types: Type A and Type B. The A-type pore water pressure development model can be divided into three stages: in the instantaneous rise stage, the curve is convex (pore water pressure increases rapidly); in the middle gentle section, the curve is nearly linear (pore water pressure increases slowly); and in instantaneous liquefaction section, the curve is concave (pore water pressure increases rapidly). The B-type pore water pressure development model can be divided into two stages: the instantaneous increasing stage and the intermediate gentle stage. When the Pc are 2 and 4, the development pattern of pore water pressure of EICP-solidified sand is mainly type A, while, when the Pc is 6, the development pattern is mainly type B. The reason is that fewer CaCO3 crystals are generated by EICP mineralization when the Pc is lower (2 and 4), which mainly act to cover and fill pores, but do not play an effective role in cementing sand particles. When the vibration number reaches a certain value, the skeleton between sand particles is destroyed, and the dynamic stress is transferred to pore water pressure, leading to the sudden rise in the pore water pressure and liquefaction. When the PC is greater, CaCO3 crystals can cement sand particles together and enhance the skeleton action of sand particles. With the increase in the vibration number, the connection between sand particles has not been broken, but some sand particles exhibit dislocation displacement, which leads to pore communication, and pore water pressure reaches the liquefaction state in the steady growth stage [46].

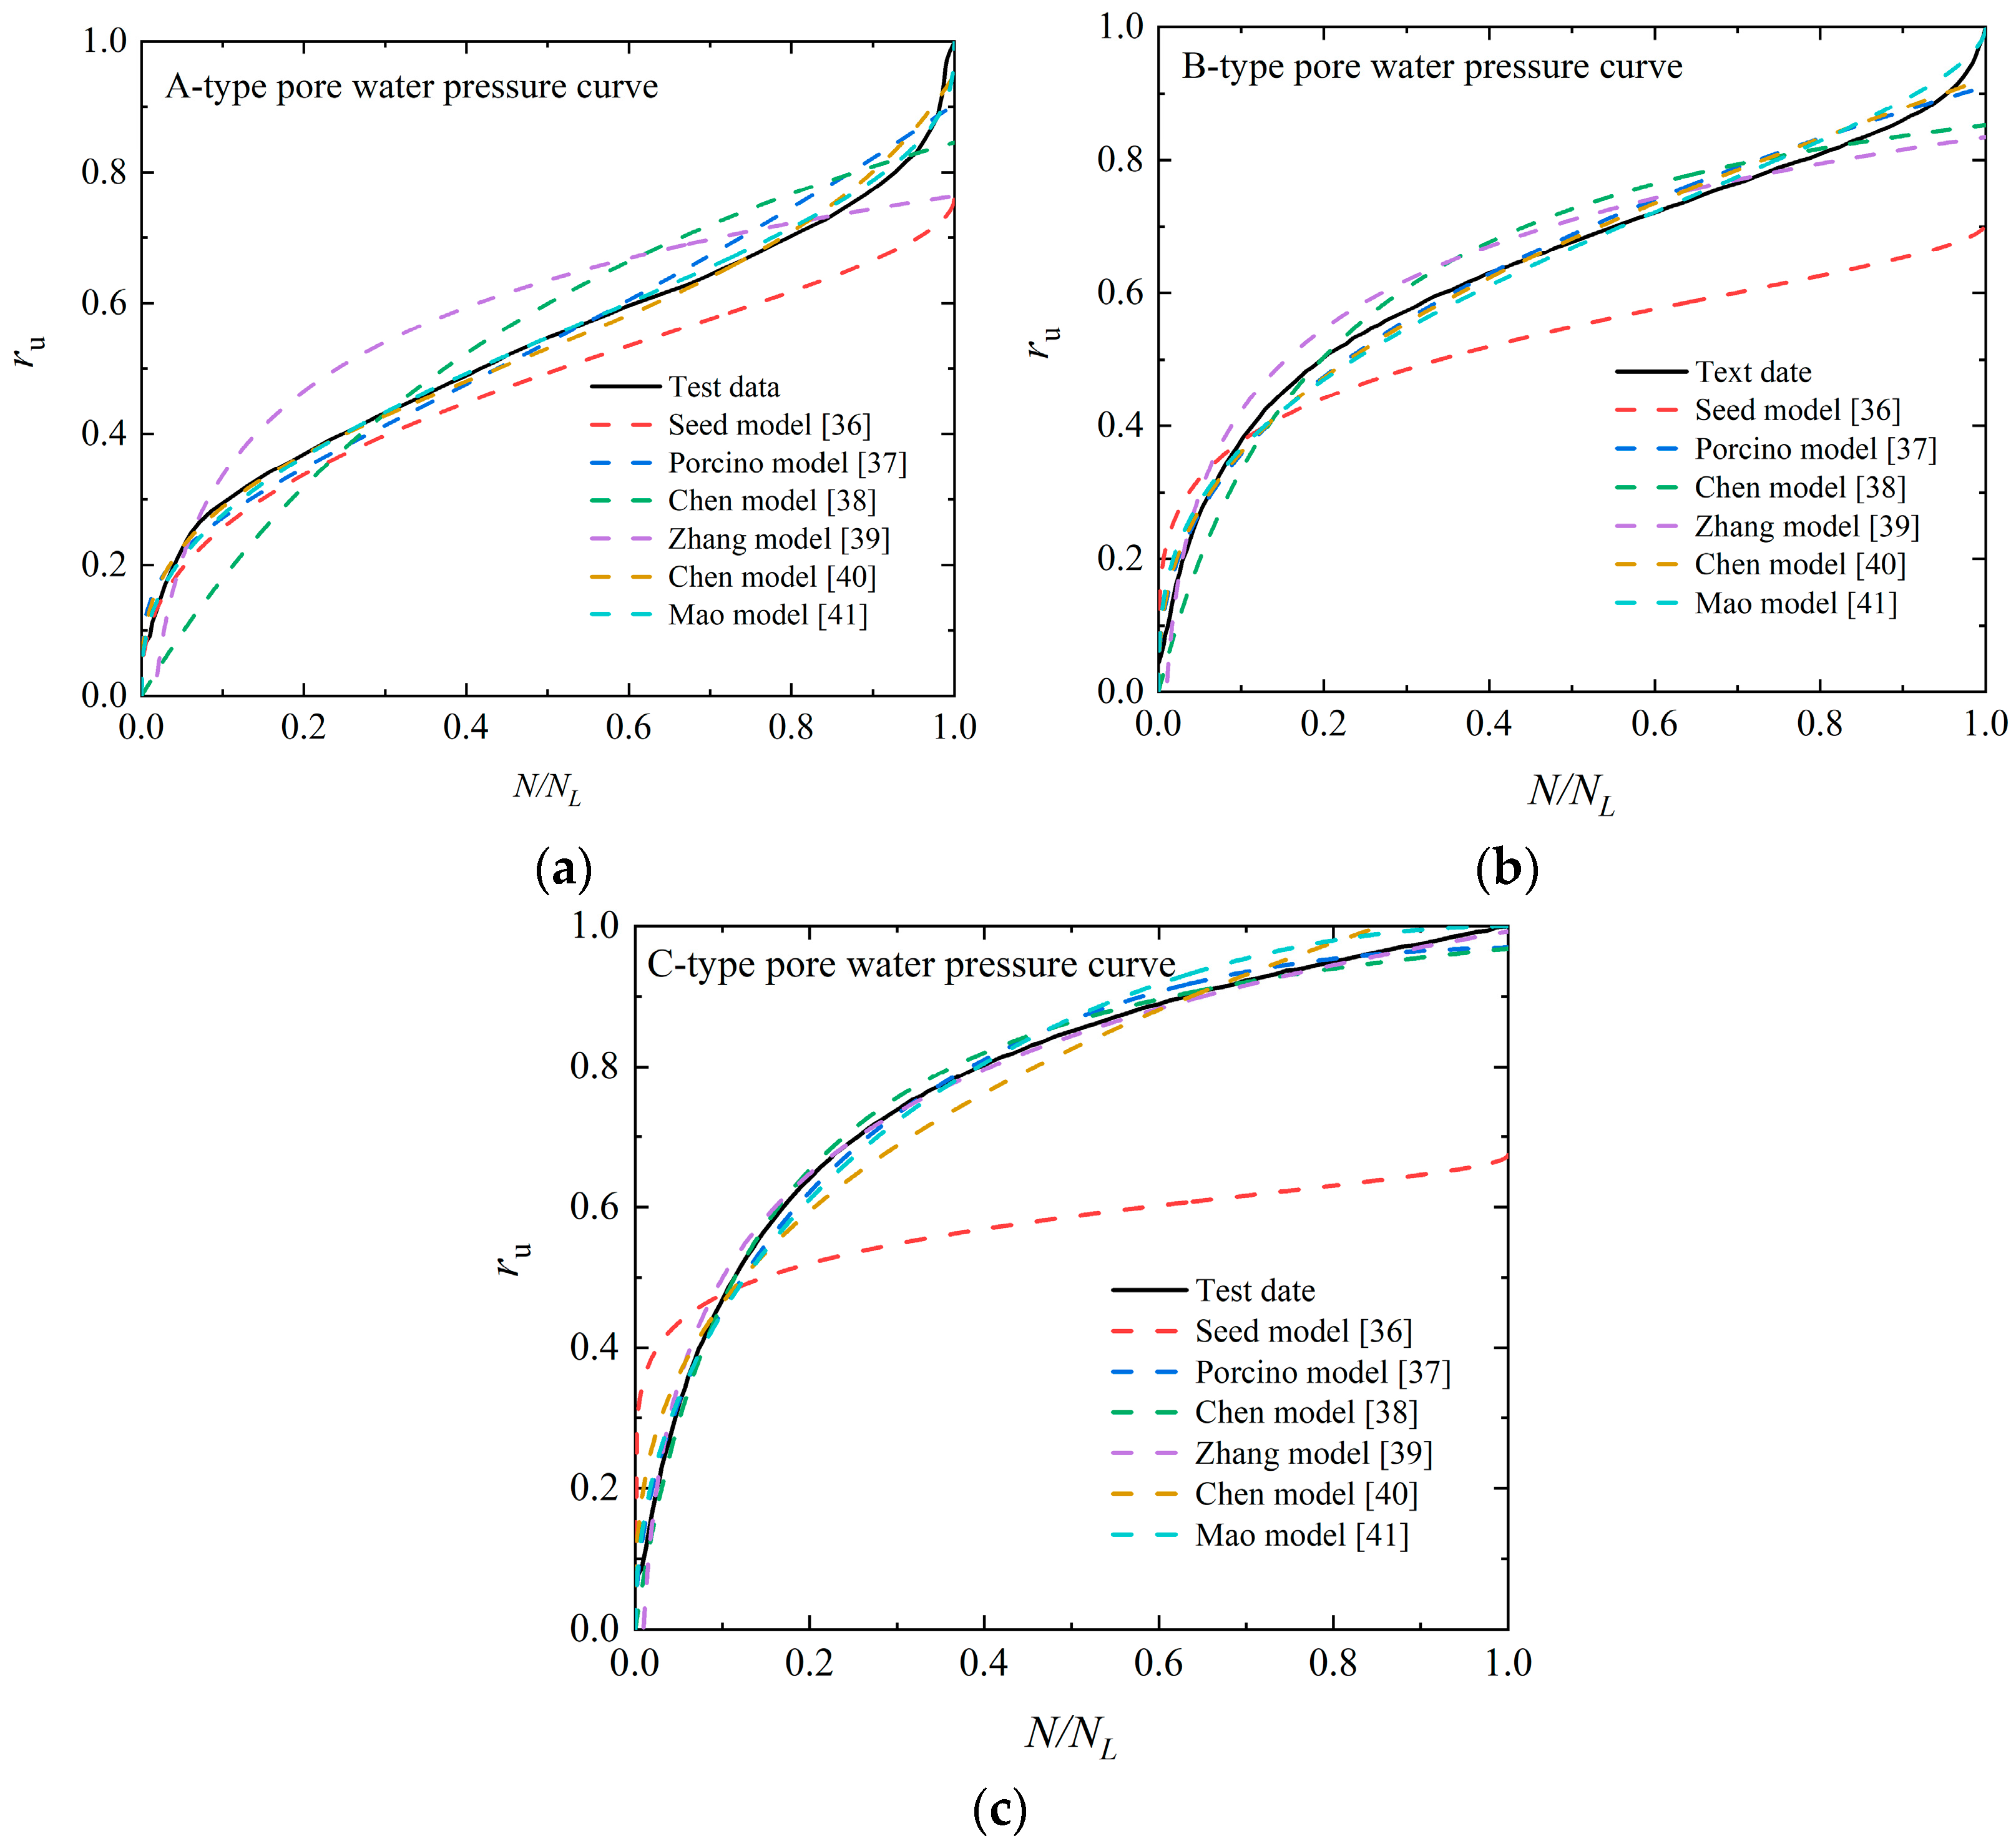
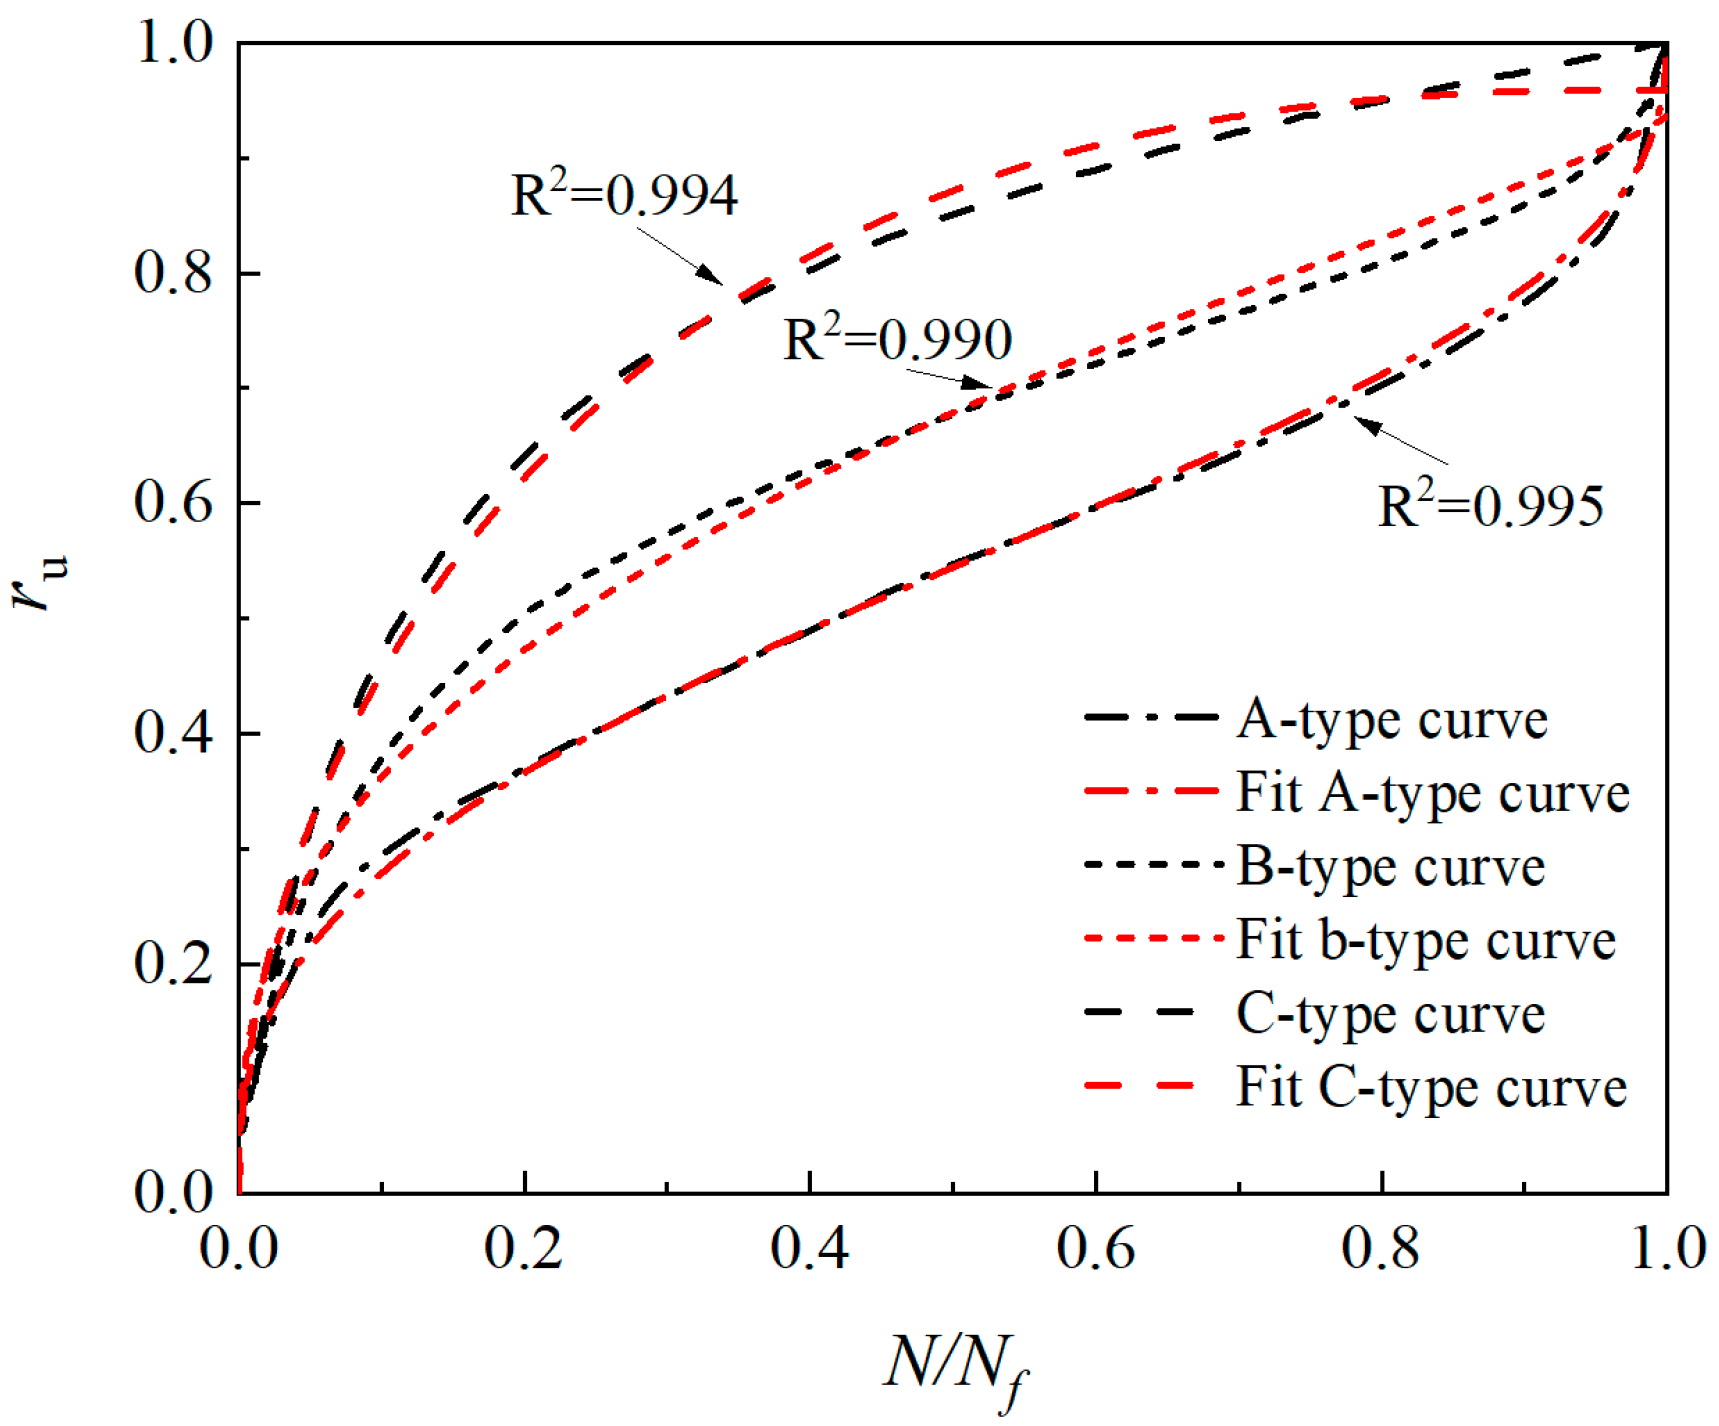
4.2. Establishment and Verification of Pore Water Pressure Model of Solidified Sand by EICP

To further analyze the evolution law of pore water pressure of EICP-solidified sand, Table 3 summarizes the existing prediction models of pore water pressure of sand. The model presented in Table 3 is utilized for the fitting and analysis of the test data, with the corresponding parameter values provided in Table 4. The comparison between the pore water pressure test and prediction outcomes is summarized in Figure 9. Seeing Figure 9, different pore water pressure prediction models have different prediction results for A-type and B-type pore water pressure development models. For the A-type pore water pressure development model, the predictions from the Porcino model, Chen model, and Mao model align well with the experimental results, and the determinability coefficient (R2) is over 0.980, while the prediction results of the Seed model are poor. For the B-type pore water pressure development model, the prediction results of the Porcino model, Chen model, Zhang model, Chen model, and Mao model align well with the experimental results, and the R2 is over 0.971.
Aiming at EICP-solidified sand, to establish a pore water pressure prediction model that can describe the development mode of A-type and B-type pore water pressure simultaneously, a new unified pore water pressure prediction model is established by modifying parameters based on the present study outcomes. Equation (1) is as follows:
r u = u u f = a [ 1 ( 1 N N f ) b ] 1 c
where ru is pore pressure ratio (dimensionless); N/Nf is the ratio of vibration number (dimensionless); and a, b and c are model parameters (dimensionless).
Table 5 lists the pore water pressure model parameters of EICP-solidified sand. The analysis reveals that the power value 1/c has a critical effect on shaping the curve. When the 1/c is small, the power value of the function is big, and the curve presents an S-shape; however, when the 1/c is larger, the power value of the function is smaller, and the curve tends to be hyperbolic. Parameters a and b are associated with the slope and intercept of the curve, respectively. Higher values of a will increase the slope of the curve, whereas higher values of b will increase the intercept of the curve. When the A-type curve transitions to the B-type curve, b and c parameters increase, while a parameters decrease. When transitioning from a B-type curve to a C-type curve, a and b parameters rise, while c parameters decrease. Figure 10 illustrates the predicted outcomes of the newly built pore water pressure model and the experimental results. The test results align well with the predicted results, and the R2 is over 0.990. This shows that the model can greatly describe the development law of the A-type and B-type pore water pressure of EICP-solidified sand simultaneously. It should be pointed out that the applicable conditions of this model are as follows: for the consolidated undrained shear test under cyclic load and loading sine wave, the σ3 is 25~100 kPa, the f is 1~3 Hz, and the ρd of sand is 1.6~1.7 g/cm3; PC is 2~6. The failure criterion for the specimen is defined as the ru reaches 1.

5. Conclusions

The effects of confining pressure (σ3), cementation number (Pc), cyclic stress ratio (CSR), initial dry density (ρd), and vibration frequency (f) on the development of the pore water pressure of EICP-solidified sand were analyzed through a triaxial consolidated undrained shear test under cyclic loading. Based on the dynamic triaxial experiment outcomes, a pore water pressure model was established to describe the development of A-type and B-type pore water pressure in EICP-solidified sand. The conclusions are as follows:
  • The pore pressure changes in three stages with the increase in the vibration number: in the instantaneous increase section, the curve is convex; in the middle gentle section, the curve is nearly linear; and in instantaneous liquefaction section, the curve is concave. As the σ3 rises, the failure vibration number of the specimen decreases. The increase in the pore water pressure accelerates, and the pore water pressure curve shows an increasing trend from slow to steep, indicating that the liquefaction resistance of the solidified specimen is gradually weakened.
  • As the increase in Pc, the pore water pressure curve of EICP-solidified specimens, changes from steep to slow, the increasing rate of pore water pressure decreases gradually, and the vibration number required for failure increases gradually, which indicates that the increase in Pc is helpful to improve the liquefaction resistance of EICP-solidified sand.
  • When the vibration number is the same, the greater the CSR, the higher the ru, and the lower vibration number required for the liquefaction of the specimen, which indicates that the increase in CSR accelerates the liquefaction trend in the specimen.
  • With the increase in the ρd of the specimen, the growth rate of the pore water pressure decreases, and the vibration number required when liquefaction failure is achieved increases accordingly.
  • When the vibration number is constant, the ru decreases with the increase in vibration frequency. When the ru is constant, with the rise in f, the increased rate of pore pressure of the specimen gradually decreases, and the required vibration number gradually increases when liquefaction is achieved.
  • The three-parameter unified pore water pressure prediction model is applied to calculate the test results, and the test results align well with the predicted results, which demonstrates that the model is suited to describe the development law of the A-type and B-type pore water pressure of EICP-solidified sand simultaneously.
  • In the future, the struvite precipitation can be considered to recover the ammonia generated during the EICP mineralization reaction process, which can reduce environmental pollution [47]. The enzyme solution and cementing solution can be sprayed on the foundation of saturated loose sand to solidify the sand and improve foundation resistance to liquefaction.

Author Contributions

Conceptualization, G.L.; Methodology, Y.L.; Writing—original draft, J.L. and X.H.; Validation, Y.Z.; Writing—review and editing, X.H. and S.Y.; Funding acquisition, G.L., S.Y. and Y.Z. All authors have read and agreed to the published version of the manuscript.

Funding

This study was supported by the Natural Science Basic Research Program of Shaanxi Province (2021JM-535), Scientific Research Program Funded by Education Department of Shaanxi Provincial Government (23JS061), Shaanxi Provincial Department of Education Service Local Special Research Program Project (22JE018), Shaanxi Provincial Department of Education 2022 General Special Scientific Research Program Project (22JK0597), and Science and Technology Personnel Service Enterprise Project of Xi’an Science and Technology Bureau (22GXFW0148).

Institutional Review Board Statement

Not applicable.

Informed Consent Statement

Not applicable.

Data Availability Statement

Data are contained within the article.

Conflicts of Interest

Author Yu Li was employed by the company of Guangyuan Natural Gas Co., Ltd. The remaining authors declare that the research was conducted in the absence of any commercial or financial relationships that could be construed as a potential conflict of interest.

References

  1. Krishnan, V.; Tirkolaei, H.K.; Martin, K.; Hamdan, N.; Paassen, L.A.V.; Kavazanjian, E., Jr. Variability in the unconfined compressive strength of EICP-treated “standard” sand. J. Geotech. Geoenviron. Eng. 2021, 147, 06021001. [Google Scholar] [CrossRef]
  2. He, J.; Fang, C.H.; Mao, X.Y.; Qi, Y.S.; Zhou, Y.D.; Kou, H.L.; Xiao, L. Enzyme-induced carbonate precipitation for the protection of earthen dikes and embankments under surface runoff: Laboratory investigations. J. Ocean Univ. China 2022, 21, 306–314. [Google Scholar] [CrossRef]
  3. Liu, K.W.; Jiang, N.J.; Qin, J.D.; Wang, Y.J.; Tang, C.S.; Han, X.L. An experimental study of mitigating coastal sand dune erosion by microbial and enzymatic-induced carbonate precipitation. Acta Geotech. 2021, 16, 467–480. [Google Scholar] [CrossRef]
  4. Cao, G.H.; Ma, L.Q.; Ngo, I.; Osemudiamhen, A.E.; Guo, Z.Z. Experimental investigation on the combination of enzyme-induced calcium carbonate precipitation and organic materials for underground backfilling preparation. Minerals 2024, 14, 153. [Google Scholar] [CrossRef]
  5. Zhang, P.H.; Ma, L.J. Application of foam light soil in road expansion. Sci. J. Technol. Vol. 2021, 3, 2688–8645. [Google Scholar]
  6. Chen, J.F.; Bao, N.; Sun, R. Three-dimensional discrete-element-method analysis of behavior of geogrid-reinforced sand foundations under strip footing. Int. J. Geomech. 2022, 22, 04022134. [Google Scholar] [CrossRef]
  7. Liu, J.; Bai, Y.X.; Song, Z.Z.; Lu, Y.; Qian, W.; Kanungo, D.P. Evaluation of strength properties of sand modified with organic polymers. Polymers 2018, 10, 287. [Google Scholar] [CrossRef] [PubMed]
  8. Cui, M.J.; Lai, H.J.; Hoang, T.; Chu, J. One-phase-low-pH enzyme induced carbonate precipitation (EICP) method for soil improvement. Acta Geotech. 2021, 16, 481–489. [Google Scholar] [CrossRef]
  9. Almajed, A.; Abbas, H.; Arab, M.; Alsabhan, A.; Hamid, W.; Al-Salloum, Y. Enzyme-induced carbonate precipitation (EICP) based methods for ecofriendly stabilization of different types of natural sands. J. Cleaner Prod. 2020, 274, 122627. [Google Scholar] [CrossRef]
  10. Rosa, D.; Verdirame, L.; Bavasso, I.; Bracciale, M.P.; Di-Palma, L. Soil biocementation via enzyme induced carbonate precipitation (EICP) method employing soybeans as a source of cheap enzyme. Chem. Eng. Trans. 2023, 99, 157–162. [Google Scholar]
  11. Sun, X.H.; Miao, L.C.; Wang, H.X.; Yuan, J.H.; Fan, G.C. Enhanced rainfall erosion durability of enzymatically induced carbonate precipitation for dust control. Sci. Total Environ. 2021, 791, 148369. [Google Scholar] [CrossRef] [PubMed]
  12. Ivanov, V.; Chu, J. Applications of microorganisms to geotechnical engineering for bioclogging and biocementation of soil in situ. Rev. Environ. Sci. Bio/Technol. 2008, 7, 139–153. [Google Scholar] [CrossRef]
  13. Bak, H.M.; Kariminia, T.; Shahbodagh, B.; Rowshanzamir, M.A.; Khoshghalb, A. Application of bio-cementation to enhance shear strength parameters of soil-steel interface. Constr. Build. Mater. 2021, 294, 123470. [Google Scholar]
  14. Qabany, A.A.; Soga, K.; Santamarina, J.C. Factors affecting efficiency of microbially induced calcite precipitation. J. Geotech. Geoenviron. Eng. 2012, 138, 992–1001. [Google Scholar] [CrossRef]
  15. Arab, M.G.; Alsodi, R.; Almajed, A.; Yasuhara, H.; Zeiada, W.; Shahin, M.A. State-of-the-art review of enzyme-induced calcite precipitation (EICP) for ground improvement: Applications and prospects. Geosciences 2021, 11, 492. [Google Scholar] [CrossRef]
  16. Almajed, A.; Lateef, M.A.; Moghal, A.A.B.; Lemboye, K. State-of-the-art review of the applicability and challenges of microbial-induced calcite precipitation (MICP) and enzyme-induced calcite precipitation (EICP) techniques for geotechnical and geoenvironmental applications. Crystals 2021, 11, 370. [Google Scholar] [CrossRef]
  17. Muhammed, A.S.; Kassim, K.A.; Ahmad, K.; Zango, M.U.; Chong, C.S.; Makinda, J. Influence of multiple treatment cycles on the strength and microstructure of biocemented sandy soil. Int. J. Environ. Sci. Tech. 2021, 18, 3427–3440. [Google Scholar] [CrossRef]
  18. Zhang, J.W.; Yin, Y.; Shi, W.P.; Bian, H.L.; Shi, L.; Wu, L.Y.; Han, Z.G.; Zheng, J.J.; He, X. Strength and uniformity of EICP-treated sand under multi-factor coupling effects. Biogeotechnics 2023, 1, 100007. [Google Scholar] [CrossRef]
  19. Arab, M.G.; Rohy, H.; Zeiada, W.; Almajed, A.; Omar, M. One-phase EICP biotreatment of sand exposed to various environmental conditions. J. Mater. Civ. Eng. 2021, 33, 04020489. [Google Scholar] [CrossRef]
  20. Li, S.; Huang, M.; Cui, M.J.; Jiang, Q.W.; Xu, K. Thermal conductivity enhancement of backfill material and soil using enzyme-induced carbonate precipitation (EICP). Acta Geotech. 2023, 18, 6143–6158. [Google Scholar] [CrossRef]
  21. Sun, Y.S.; Zhong, X.Y.; Lv, J.G.; Wang, G.H.; Hu, R.L. Experimental study on different improvement schemes of EICP-lignin solidified silt. Materials 2023, 16, 999. [Google Scholar] [CrossRef] [PubMed]
  22. Li, G.; Yan, D.Q.; Liu, J.; Yang, P.D.; Zhang, J.Y. Study on the mechanical properties of crack mortar repaired by enzyme-induced calcium carbonate precipitation (EICP). Materials 2024, 17, 2978. [Google Scholar] [CrossRef] [PubMed]
  23. Thomas, G.; Rangaswamy, K. Dynamic soil properties of nanoparticles and bioenzyme treated soft clay. Soil Dyn. Earthq. Eng. 2020, 137, 106324. [Google Scholar] [CrossRef]
  24. Saif, A.; Cuccurullo, A.; Gallipoli, D.; Perlot, C.; Bruno, A.W. Advances in enzyme induced carbonate precipitation and application to soil improvement: A review. Materials 2022, 15, 950. [Google Scholar] [CrossRef] [PubMed]
  25. Shen, D.Y.; Liu, Z.Y.; Song, Z.C.; Wu, C.Z. Reinforcement mechanism and erosion resistance of loess slope using enzyme induced calcite precipitation technique. Sustainability 2023, 15, 1044. [Google Scholar] [CrossRef]
  26. Zhu, H.B.; Zhang, X.Y.; Cui, J. Enhancing the seismic performance of piles in liquefiable soils by slag powder. Case Stud. Constr. Mater. 2023, 18, e01995. [Google Scholar] [CrossRef]
  27. Li, Y.J.; Li, Y.L.; Guo, Z.; Xu, Q. Durability of MICP-reinforced calcareous sand in marine environments: Laboratory and field experimental study. Biogeotechnics 2023, 1, 100018. [Google Scholar] [CrossRef]
  28. Wang, H.X.; Wang, J.J.; Sun, X.H.; Miao, L.C.; Shi, W.B.; Wu, L.Y.; Yuan, J.H. Erosion resistance of treated dust soils based on the combined enzymatically induced carbonate precipitation and polyacrylic acid. Biogeotechnics 2023, 1, 100050. [Google Scholar] [CrossRef]
  29. Wu, L.Y.; Miao, L.C.; Kawasaki, S.; Wang, H.X. Effects of reaction conditions on EICP-treated desert aeolian sand. KSCE J. Civ. Eng. 2022, 26, 2662–2674. [Google Scholar] [CrossRef]
  30. Cui, M.; Xiong, H.H.; Zheng, J.J.; Cui, M.J.; Lv, S.Y.; Lai, H.J. Experimental study on multiscale engineering properties of EICP combined with xan than gum solidified Sand. J. Mater. Civ. Eng. 2024, 36, 04024108. [Google Scholar] [CrossRef]
  31. Alotaibi, E.; Arab, M.G.; Abdallah, M.; Nassif, N.; Omar, M. Life cycle assessment of biocemented sands using enzyme induced carbonate precipitation (EICP) for soil stabilization applications. Sci. Rep. 2022, 12, 6032. [Google Scholar] [CrossRef] [PubMed]
  32. GB/T 50123-2019; Standard for Geotechnical Testing Method. Construction Ministry of PRC: Beijing, China, 2019.
  33. Singh, M.; Indraratna, B.; Nguyen, T.T. Experimental insights into the stiffness degradation of subgrade soils prone to mud pumping. Transp. Geotech. 2021, 27, 100490. [Google Scholar] [CrossRef]
  34. Indraratna, B.; Nguyen, T.T.; Singh, M.; Rujikiatkamjorn, C.; Carter, J.P.; Ni, J.; Truong, M.H. Cyclic loading response and associated yield criteria for soft railway subgrade–theoretical and experimental perspectives. Comput. Geotech. 2021, 138, 104366. [Google Scholar] [CrossRef]
  35. Cen, W.J.; Gu, G.C.; Min, J.J.; Sui, J. Test of dynamic properties of loess and study on resistance of earthquake impact for earth-rock dam on deep loess foundation. Rock Soil Mech. 2010, 31, 187–192. [Google Scholar]
  36. Seed, H.B.; Martin, P.P.; Lysmer, J. Pore-water pressure changes during soil liquefaction. J. Geotech. Eng. Div. 1976, 102, 323–346. [Google Scholar] [CrossRef]
  37. Porcino, D.; Marcianò, V.; Granata, R. Cyclic liquefaction behaviour of a moderately cemented grouted sand under repeated loading. Soil Dyn. Earthq. Eng. 2015, 79, 36–46. [Google Scholar] [CrossRef]
  38. Chen, G.; Liu, X. Study on dynamic pore water pressure in silty clay in terbedded with fine sand of Nanjing. Chin. J. Geotech. Eng. 2004, 26, 79–82. [Google Scholar]
  39. Zhang, J.M.; Xie, D.Y. A practical algorithm for the growth of vibrating pore water pressure in saturated sand. J. Hydraul. Eng. 1991, 8, 45–51. [Google Scholar]
  40. Chen, G.X.; Xie, J.F.; Han, W.; Zhang, K.X. A simplified effective stress method of soil mass earthquake response analysis. Earthq. Eng. Struct. Dyn. 1995, 52–61. [Google Scholar]
  41. Mao, X.; Fahey, M.; Randolph, M.F. Cyclic loading behaviour of fine-grained calcareous soils: Effect of mean and cyclic stress level. In Proceedings of the ISOPE International Ocean and Polar Engineering Conference, Brest, France, 30 May–4 June 1999. [Google Scholar]
  42. Huang, X.; Cai, X.G.; Yang, P.; Zheng, X.X.; Zhang, S.Q.; Bo, J.S. Study on the dynamic pore water pressure model of centerline tailings sand based on dynamic triaxial tests. Geomech. Geophys. Geo-Energy Geo-Resour. 2023, 9, 79. [Google Scholar] [CrossRef]
  43. Karakan, E.; Sezer, A.; Tanrinian, N. Evaluation of effect of limited pore water pressure development on cyclic behavior of a nonplastic silt. Soils Found. 2019, 59, 1302–1312. [Google Scholar] [CrossRef]
  44. Liu, H.L.; Xiao, P.; Xiao, Y.; Wang, J.P.; Chen, Y.M.; Chu, J. Dynamic behaviors of MICP-treated calcareous sand in cyclic tests. Chin. J. Geo. Eng. 2018, 40, 38–45. [Google Scholar]
  45. Zhang, C.L.; Jiang, G.L.; Su, L.J.; Liu, W.M.; Zhou, G.D. Effect of dry density on the liquefaction behaviour of quaternary silt. J. Mt. Sci. 2018, 15, 1597–1614. [Google Scholar] [CrossRef]
  46. Pan, K.; Yang, Z.X. Effects of initial static shear on cyclic resistance and pore pressure generation of saturated sand. Acta Geotech. 2018, 13, 473–487. [Google Scholar] [CrossRef]
  47. Yu, X.N.; Yang, H.Q.; Wang, H. A cleaner biocementation method of soil via microbially induced struvite precipitation: A experimental and numerical analysis. J. Environ. Manag. 2022, 316, 115280. [Google Scholar] [CrossRef] [PubMed]
Figure 1. Particle grade curve.
Materials 17 04800 g001
Figure 2. Specimen preparation flow chart: (a) specimen mold; (b) inject the sand; (c) sand specimen; (d) enzyme extraction; (e) standing specimen a certain time; (f) test specimens.
Materials 17 04800 g002
Figure 3. Influence of σ3 on pore water pressure of EICP-solidified specimen: (a) CSR = 0.25; (b) CSR = 0.30; (c) CSR = 0.35.
Materials 17 04800 g003
Figure 4. Effect of Pc on pore water pressure of EICP-solidified specimen: (a) CSR = 0.25; (b) CSR = 0.30; (c) CSR = 0.35.
Materials 17 04800 g004
Figure 5. Effect of CSR on pore water pressure of EICP-solidified specimen: (a) Pc = 2; (b) Pc = 4; (c) Pc = 6.
Materials 17 04800 g005
Figure 6. Effect of ρd on pore water pressure of EICP-solidified specimen: (a) CSR = 0.25; (b) CSR = 0.30; (c) CSR = 0.35.
Materials 17 04800 g006
Figure 7. Influence of f on pore water pressure of EICP-solidified specimen: (a) CSR = 0.25; (b) CSR = 0.30; (c) CSR = 0.35.
Materials 17 04800 g007
Figure 8. Development pattern of pore water pressure of EICP-solidified specimen: (a) Pc = 2; (b) Pc = 4; (c) Pc = 6.
Materials 17 04800 g008
Figure 9. Comparison between pore pressure test and model prediction results: (a) Pc = 2; (b) Pc = 4; (c) Pc = 6.
Materials 17 04800 g009
Figure 10. Comparison between prediction and test results of newly built pore water pressure model.
Materials 17 04800 g010
Table 1. Physical property index of standard sand.
Specific
Gravity
Gs
Maximum Dry Density
ρd max (g/cm3)
Minimum Dry Density
ρd min (g/cm3)
Effective Diameter
d10 (mm)
Median Diameter
d30 (mm)
Constrained Diameter
d60 (mm)
Coefficient Uniformity
Cu
Curvature Coefficient
Cc
2.651.731.460.140.500.906.431.98
Table 2. Dynamic triaxial test scheme.
σ3 (kPa)PcCSRρd (g/cm3)f (Hz)
2520.25, 0.30, 0.351.6, 1.71, 3
40.25, 0.30, 0.351.6, 1.71, 3
60.25, 0.30, 0.351.6, 1.71, 3
5020.25, 0.30, 0.351.6, 1.71, 3
40.25, 0.30, 0.351.6, 1.71, 3
60.25, 0.30, 0.351.6, 1.71, 3
10020.25, 0.30, 0.351.6, 1.71, 3
40.25, 0.30, 0.351.6, 1.71, 3
60.25, 0.30, 0.351.6, 1.71, 3
Table 3. Prediction model of pore pressure.
NumberPore Pressure Model FormulaParameterFormula Source
1 u u f = 2 π arcsin ( N N f ) 1 2 θ θ = c1·FC + c2·Dr + c3·CSR + c4
c1, c2, c3, c4—Calculated parameters
Seed et al. [36]
2 u σ vo = a ( N c N f ) b c N c N f a, b, c—Calculated parametersPorcino et al. [37]
3 u u f = N / N f a + b ( N / N f ) a, b—Calculated parametersChen et al. [38]
4 u u f = 1 e β t t f β—Calculated parameters
uf—Boundary pore pressure
tf—Loading time
Zhang et al. [39]
5 u σ 0 = ( 1 m a s ) 2 π arcsin ( N N L ) 1 2 θ αS, m, θ—Calculated parametersChen et al. [40]
6 u u f = [ 1 ( 1 N N f ) m ] 1 θ m, θ—Calculated parametersMao et al. [41]
Table 4. Fitting parameter values of pore pressure model.
Curve TypeSeed ModelPorcino ModelChen Model
βR2abcR2abR2
Type A1.450.8400.370.142.290.980.400.960.900
Type B1.580.6500.710.461.450.9910.510.520.960
Type C1.360.2401.020.220.960.9950.0591.0180.995
Curve TypeZhang ModelChen ModelMao Model
aR2abθR2mθR2
Type A1.610.8401.6311.4883.6940.9920.242.930.994
Type B2.230.9503.0490.8411.8190.9900.900.600.988
Type C6.020.9917.6060.0134.8200.9710.930.210.990
Table 5. Parameters of pore water pressure model of EICP-solidified sand.
Curve TypeModel Parameters
abcR2
Type A1.0470.2772.5520.994
Type B0.9460.7902.7170.990
Type C0.9722.6832.2030.995
Disclaimer/Publisher’s Note: The statements, opinions and data contained in all publications are solely those of the individual author(s) and contributor(s) and not of MDPI and/or the editor(s). MDPI and/or the editor(s) disclaim responsibility for any injury to people or property resulting from any ideas, methods, instructions or products referred to in the content.

