Abstract
Fracture failure in quasi-brittle materials poses a persistent challenge in materials science and engineering. This study presents a thorough investigation of the Boundary Effect Model (BEM), offering a nuanced understanding of the size effect on fracture properties. The conceptual framework, evolutionary process, and applicability scope of BEM are elucidated, highlighting its accuracy and reliability in calculating fracture properties across various quasi-brittle materials. Through the integration of BEM with diverse fracture tests—such as three-point bending, four-point bending, and wedge-splitting—a linear correlation between maximum failure loads and material fracture properties is established. Notably, the study demonstrates that fracture properties, determined by BEM, can be regarded as consistent material constants across specimens of varying sizes, initial notch lengths, geometries, and microstructures. Validation of the BEM’s reliability encompasses the analysis of 140 fracture test results involving concrete, hard rocks, and bamboo scrimber. The synergy of non-linear and linear BEM analyses emerges as a robust approach for accurately predicting the fracture behavior of quasi-brittle materials. This comprehensive exploration sheds light on the potential of the Boundary Effect Model as a valuable tool for predicting and understanding fracture mechanics in diverse materials and scenarios. This research serves as an effective approach to accurately evaluating the fracture properties of quasi-brittle materials, which is of great practical significance for material design, engineering construction, and various industrial applications.
1. Introduction
Quasi-brittle materials, such as concrete, hard rocks, brickwork, stiff clay, etc., not only exhibit brittle behavior but also possess some degree of toughness or ductility. These materials often have low fracture toughness compared to ductile materials but still have some ability to deform and absorb energy before fracturing [1,2,3]. This is due to the presence of unique microstructures such as aggregates, pores, cracks, and voids, which can act as sites for energy dissipation and plastic deformation [4,5].
When loaded, quasi-brittle materials tend to fail by cracking rather than yielding or deforming plastically. Compared with brittle or ductile materials, the fracturing behavior of quasi-brittle materials is more complex and is always influenced by various factors. Firstly, the mode and magnitude of loading will affect the fracture behavior of quasi-brittle materials. Tension, compression, and shear loading can cause different fracture modes and failure mechanisms [6]. Higher loading rates will cause more brittle fractures, while slower loading rates will induce ductile behavior. Secondly, the fracture of quasi-brittle materials has been proven to be directly related to the specimen geometry and size; the presence of pre-existing defects will also weaken the fracture toughness of specimens [7]. Thirdly, environmental conditions, such as temperature, humidity, and chemical exposure, will change the fracture performance of quasi-brittle materials [8,9]. When exposed to high temperatures or aggressive chemicals, the quasi-brittle materials will be degraded and more likely to fracture. Last, the microstructures are another important influencing factor, such as the aggregate size, microcracks, pores, and voids [10,11].
Then, several methods were proposed to study the fracture of quasi-brittle materials, such as experimental methods, theoretical methods, and numerical simulation analysis. Corr et al. [12] applied digital image correlation (DIC) to observe the development of the fracture process zone in full-graded dam concrete. Han et al. [13] used X-ray microscopy to reveal the cracking features underneath the fracture surface. On the basis of these experimental results, different theoretical models were established. Hillerborg et al. [14] considered the stress-transferring crack as a fictitious crack and proposed the fictitious crack model to depict the stress distribution around the crack tip. Bazant [15,16] attributed the size effect to the variation of length and the area of the crack band and established a size effect law to illustrate the fracture behavior of concrete and rock. Hu [17,18] found that the size effect of fracture properties of quasi-brittle materials is mainly caused by the variation of specimen boundary conditions and proposed the Boundary Effect Model to predict the fracture of quasi-brittle materials. Xu et al. [19,20] regarded the quasi-brittle fracture as composed of two states and utilized the initial cracking toughness and the unstable fracture toughness to distinguish the fracture process of quasi-brittle materials. Furthermore, numerical simulation analysis is also adopted to study the fracture of quasi-brittle materials, such as the Particle Flow Code, Abaqus, Three-Dimensional Distinct Element Code, etc., and obtain some meaningful results [21,22,23].
It could be found that fracture is one of the main failure modes of quasi-brittle materials; the precise description and prediction of fracture are critical during the application of quasi-brittle materials. The current research seeks to offer solutions to this pressing issue by providing comprehensive methodologies for analyzing the fracture of quasi-brittle materials. The framework of the whole paper is arranged as follows: Section 2 mainly describes the proposal of the BEM concept; Section 3 mainly illustrates the closed-form solutions for different testing methods; Section 4 presents the application of BEM in various quasi-brittle materials; Section 5 gives the discussion and Section 6 provides the conclusions.
2. The Concept of the Boundary Effect Model
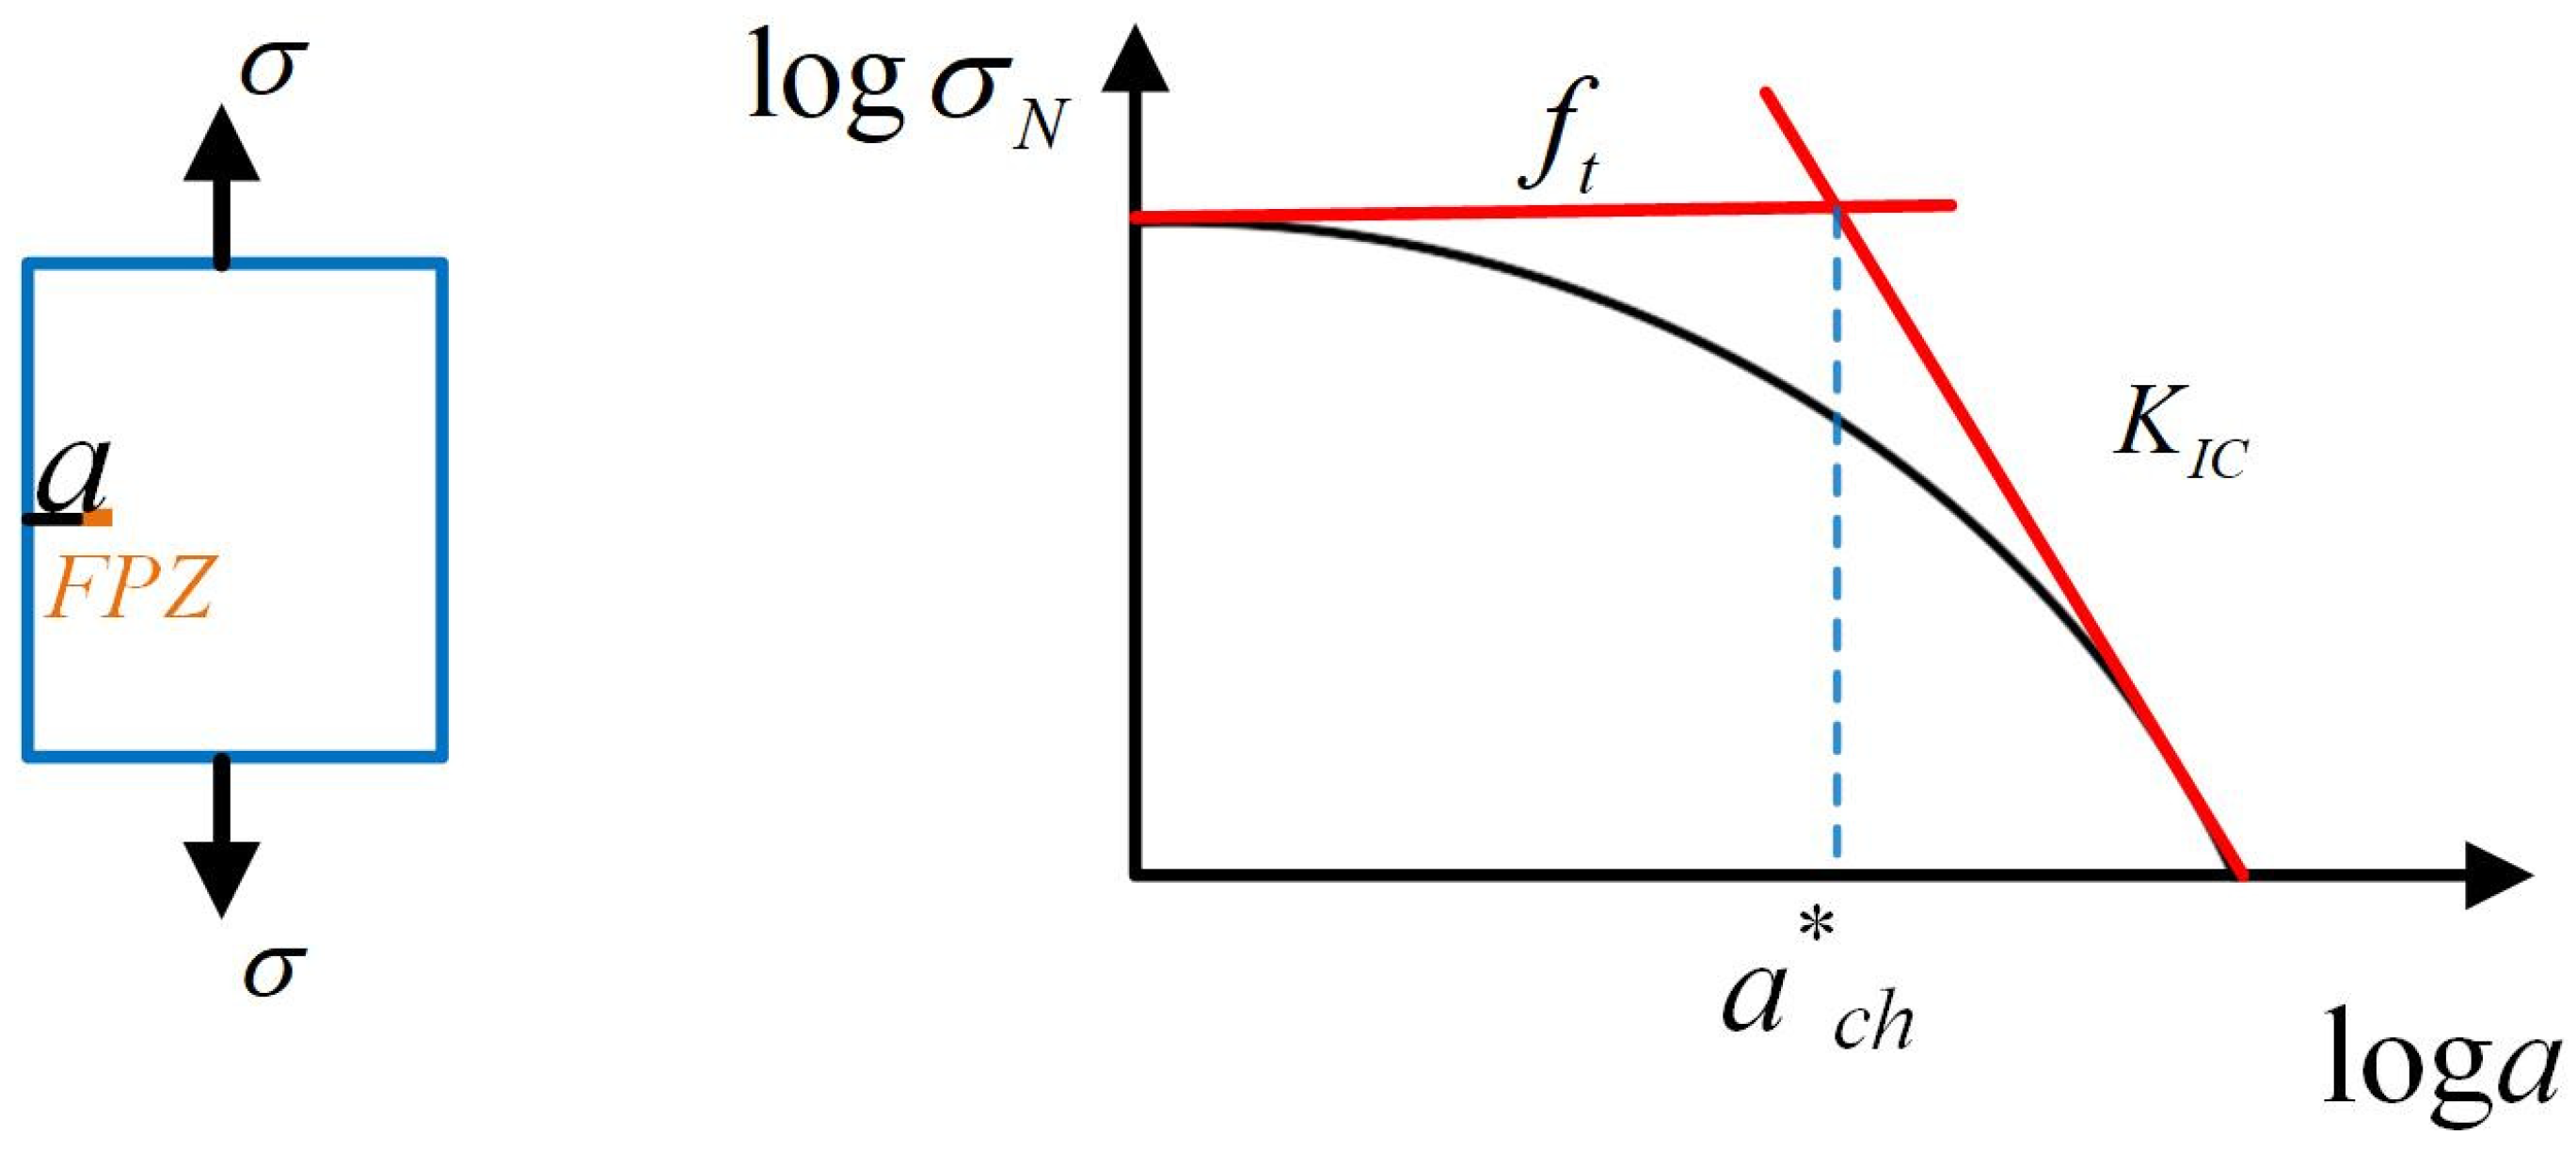
It is widely acknowledged that the fracture properties of quasi-brittle materials, as estimated by the traditional linear elastic fracture theory, are subject to variation with changes in specimen size. Hu [24] thought the above-size effect was similar to the well-studied elastic plastic fracture of metals and attributed such a phenomenon to the effect of cracking close to the free surface. Then, the asymptotic analysis approach was established on the basis of the elastic/plastic fracture transition of a large plate with a small edge crack, as shown in Figure 1 [25]. Here, the asymptotic equation is determined by the yield strength σY criteria (a horizontal line) and fracture toughness KIC criteria (an oblique line).
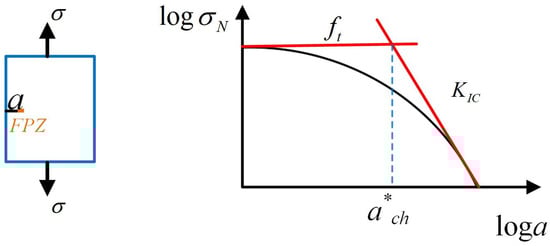
Figure 1.
The asymptotic quasi-brittle fracture curve of a large plate with a short edge crack.
For a large plate with a small edge crack, the asymptotic equation can be described as follows:
where σN is the nominal stress, ft is tensile strength, and a is the initial crack length. It can be clearly observed that, when , the failure of a plate is mainly controlled by the strength criterion, when , the failure is mainly controlled by the fracture toughness criterion. The characteristic crack length is defined by the intersection of the two criteria mentioned above, which is a material constant determined according to Equation (2) [24]. Where Y is the geometry factor, which is always set at 1.12 for infinite plates.
However, finite-sized specimens are more commonly encountered than infinite plates in the real scenario. For the fracture issues in finite-sized specimens, the initial crack length in Equation (1) should be replaced by the equivalent crack length ae, as shown in Equations (3) and (4) [18].
where a0 is the initial crack length of specimens, α is the ratio of a0 to specimen height W, and Y(α) is the geometry factor determined by α and specimen geometry. In that way, the effect of the specimen boundary is carefully considered. The nominal stress (σn) of finite-sized specimens can be illustrated in Equation (5).
Actually, the effect of the specimen boundary on determining the fracture toughness of materials has been reflected in several standards. In American Society for Testing and Materials (ASTM) E399, the specimens for testing fracture toughness are required to meet the conditions in Equation (6) [26].
By referring to Equations (2) and (5), the distance between crack tip and specimen boundary is considerable, the fracture toughness criterion can be applied, and the tested fracture toughness is reliable. In International Union of Laboratories and Experts in Construction Materials, Systems, and Structures (RILEM) TC-50FMC, the initial crack length, specimen size, and specimen thickness are all specified [27]. With the increase in aggregate size, a notable increase is required for the specimen sizes. In this way, the fracture properties of concrete materials can be obtained as constants.
3. The BEM in Different Fracture Tests
There are several methods for testing the fracture behavior of quasi-brittle materials, such as the three-point bending test, the four-point bending test, the wedge-splitting test, etc. In these fracture tests, the initial notch is always introduced into the specimens during specimen preparation. Then, the fracture will occur along the desired path, thereby ensuring the integrity and reliability of the results. Moreover, the length of the initial notch should consider the effect of material microstructure and specimen size.
Before analyzing the stress distribution around the notch tip and introducing BEM, there are a few assumptions that need to be made: (1) During the fracture process of the specimen, the unfractured part remains horizontal under the action of the load, and the strain distribution along the height of the unfractured region is linear. (2) The compressive and tensile stresses in the unfractured region are linearly distributed along the height of the beam. (3) The tensile elastic modulus of quasi-brittle materials is equal to the compressive elastic modulus. (4) The crack bridging stress is constant within the partially developed fracture process zone (fictitious crack) [28].
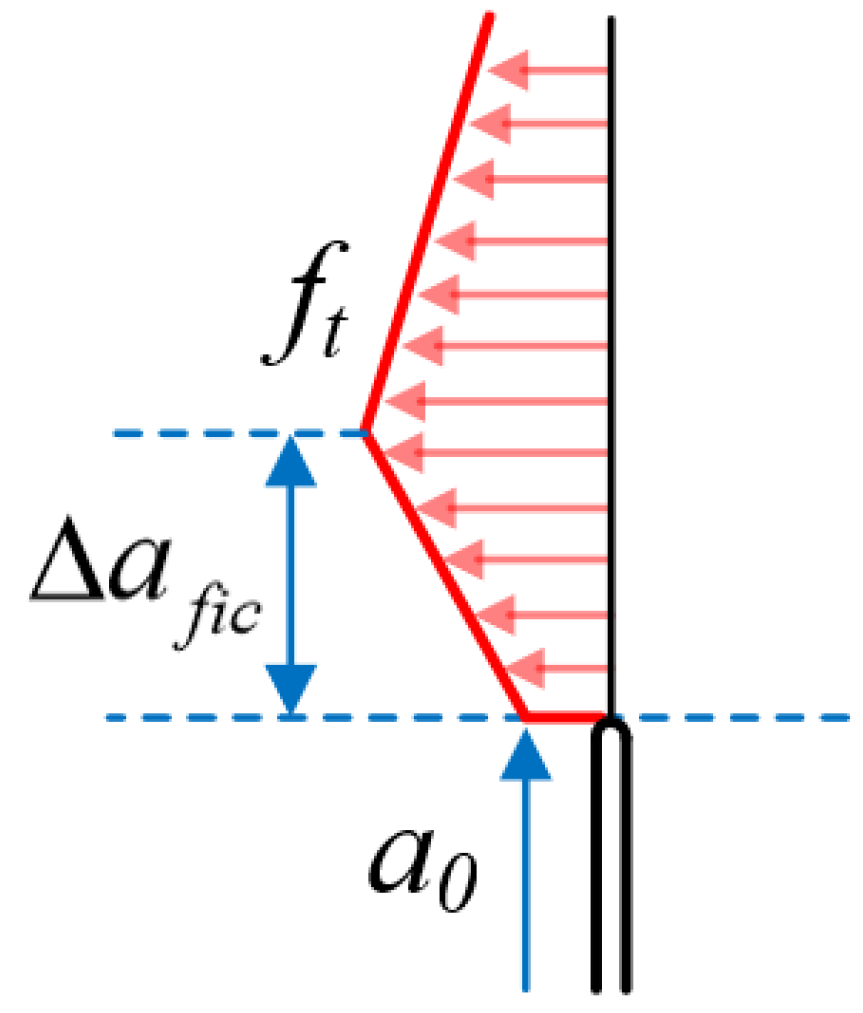
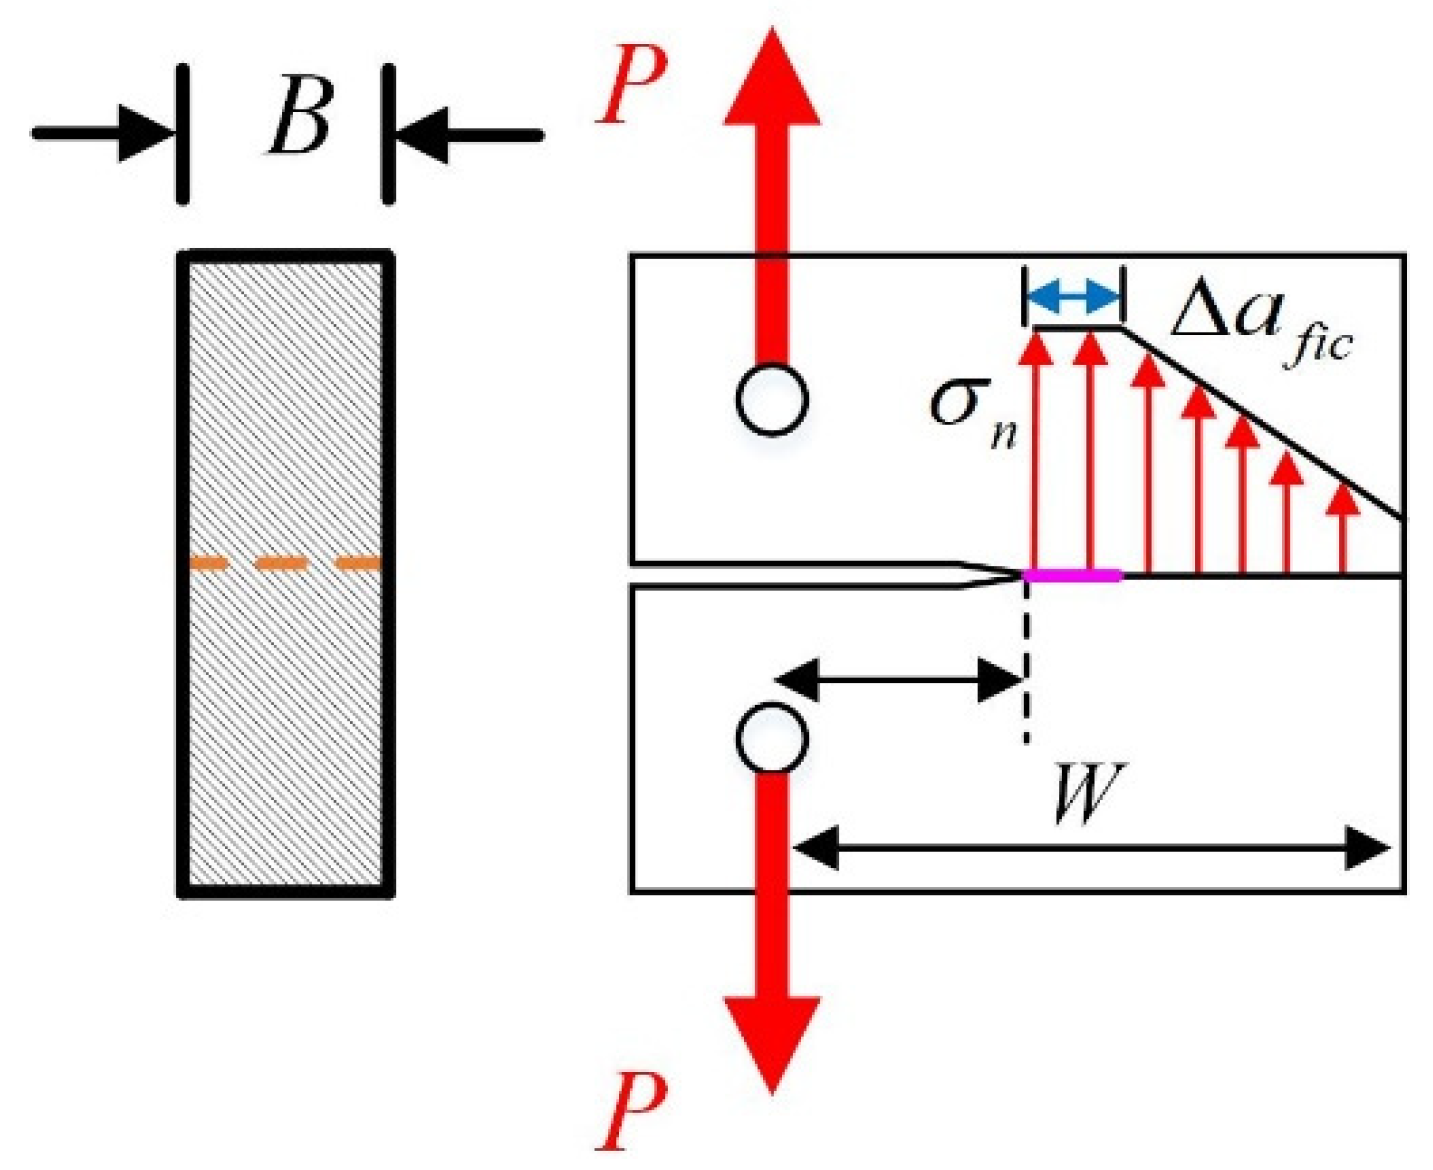
The first three assumptions are commonly used in other fracture models, so this section mainly focuses on the fourth assumption. According to Hillerborg’s fictitious crack model, the stress values gradually decrease from tensile strength to zero along the fictitious crack path, and such a type of fracture process zone is called a fully developed fracture process zone. However, in laboratory tests, the pre-existing crack tips are always large and blunt compared to the real tip of a propagating crack. As shown in Figure 2, the stress at the crack tip is a non-zero value, and the fracture process zone formed at the pre-existing crack tip is not fully developed [29]. The distance from the pre-existing crack tip to the point where the stress equals the material’s tensile strength (the unfractured region) is defined as the fictitious crack length (∆fic).

Figure 2.
The stress distribution around the notch tip.
Considering the physical meaning of the fictitious crack, it can be seen that the fictitious crack length is a physical quantity related to the aggregate particle size and is less than the length of the fully developed fracture process zone [30]. The fictitious crack length can be described as Equation (7):
According to RILEM TC-50FMC, for laboratory-conducted fracture tests, the quasi-brittle specimen size/aggregate size (W/G) is approximately equal to 10, and the unnotched ligament length/aggregate size ((W − a0)/G) is only 5. Moreover, fictitious cracks only occur in the tensile zone of the specimen’s ligament. Therefore, the parameter (β) in Equation (7) could be set between 1 and 2. Since the size of the fictitious crack length and the crack opening displacement of quasi-brittle specimens near failure are both small, the stress value in such an incompletely developed fracture process zone can be regarded as constant.
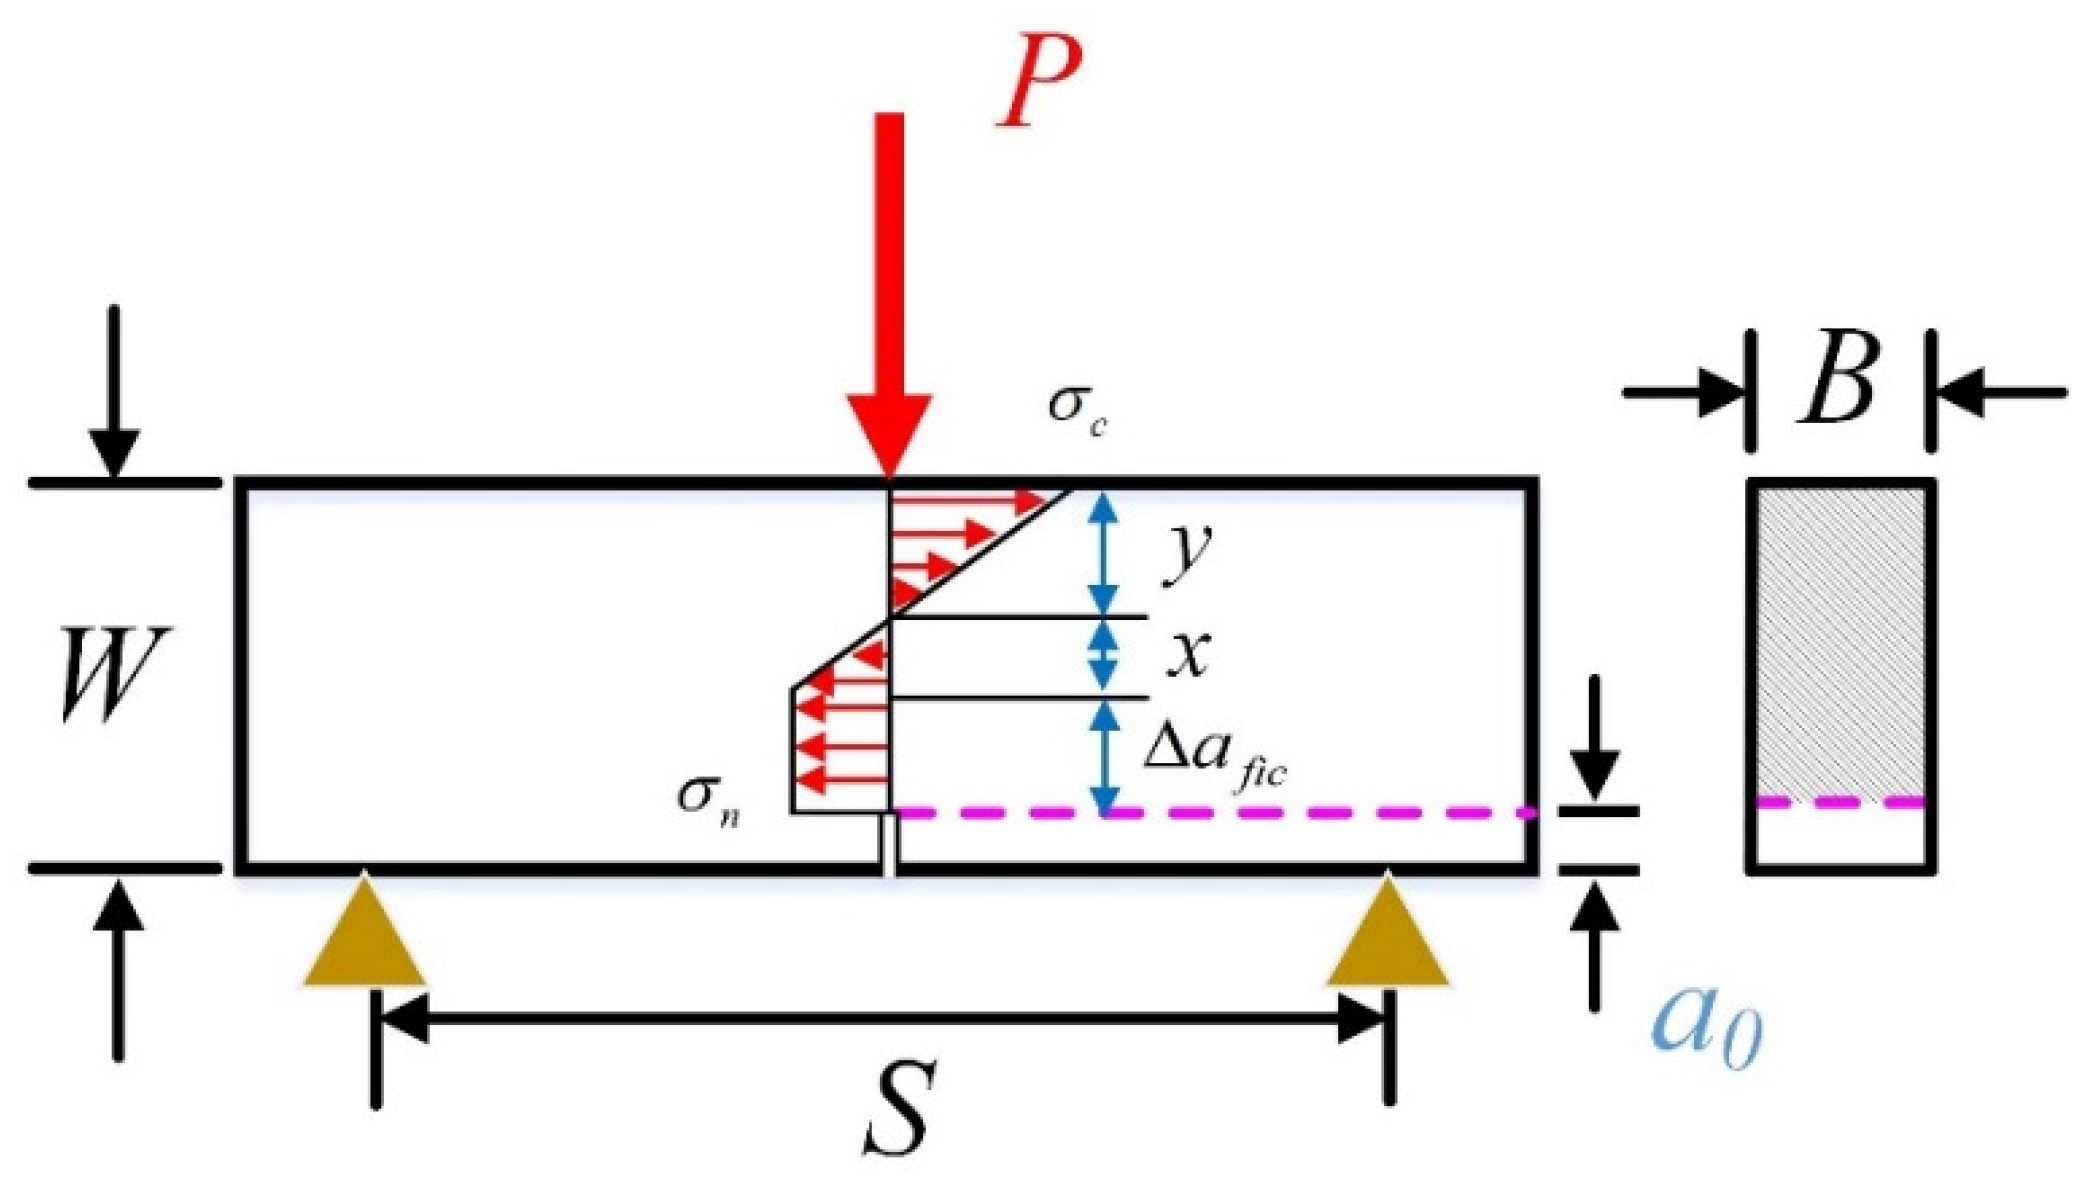
3.1. Three-Point Bending (3-p-b) Tests
As shown in Figure 3, the stress distribution along the un-notched ligament of three-point bending specimens is illustrated on the basis of the above assumptions. It can be found that the ligament is composed of compressive area (y) and tensile area (x + ∆fic). It should be noted that the stress in the fictitious crack area (∆fic) is assumed to be constant, as depicted above. After that, the relation between maximum tensile stress () and peak load (Pmax) can be established with four assumptions: the equilibrium theories of forces and moments [29]. The detailed derivation process is presented in Equations (8)–(14).
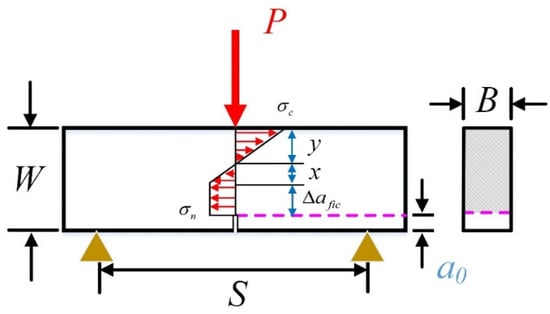
Figure 3.
The stress distribution of three-point bending specimens.
Then, incorporating Equation (12) into Equation (5), the relation between tensile strength and Pmax of the 3-p-b tests is constructed as follows:
For the specimens with different S/W ratios, their geometry factors Y(α) can be obtained with Equations (14)–(16) [31].
3.2. Four-Point Bending (4-p-b) Tests
The 4-p-b tests are also commonly used fracture test methods that have been applied to different quasi-brittle materials, such as concrete, hard rock, etc. [32,33]. On the premise of the above four assumptions, the stress distribution of test specimens is depicted in Figure 4. It can be found that the stress distribution characteristic of 4-p-b specimens is similar to that of 3-p-b specimens in Section 3.1. Compared to the 3-p-b tests, the 4-p-b test is advantageous in providing a pure bending condition for specimens, which is ideal for testing the fracture behavior of quasi-brittle materials under tensile loads. Hence, combining the stress distribution of 4-p-b specimens with BEM, the relation between tensile strength and peak loads is shown in Equation (17).
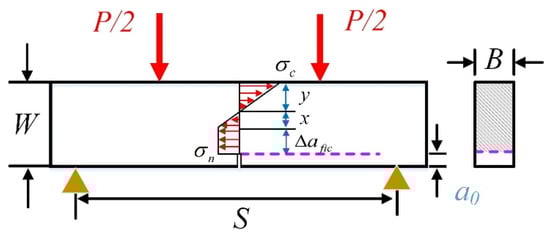
Figure 4.
The stress distribution of four-point bending specimens.
For 4-p-b specimens, the geometry factor Y(α) can be calculated by Equation (18):
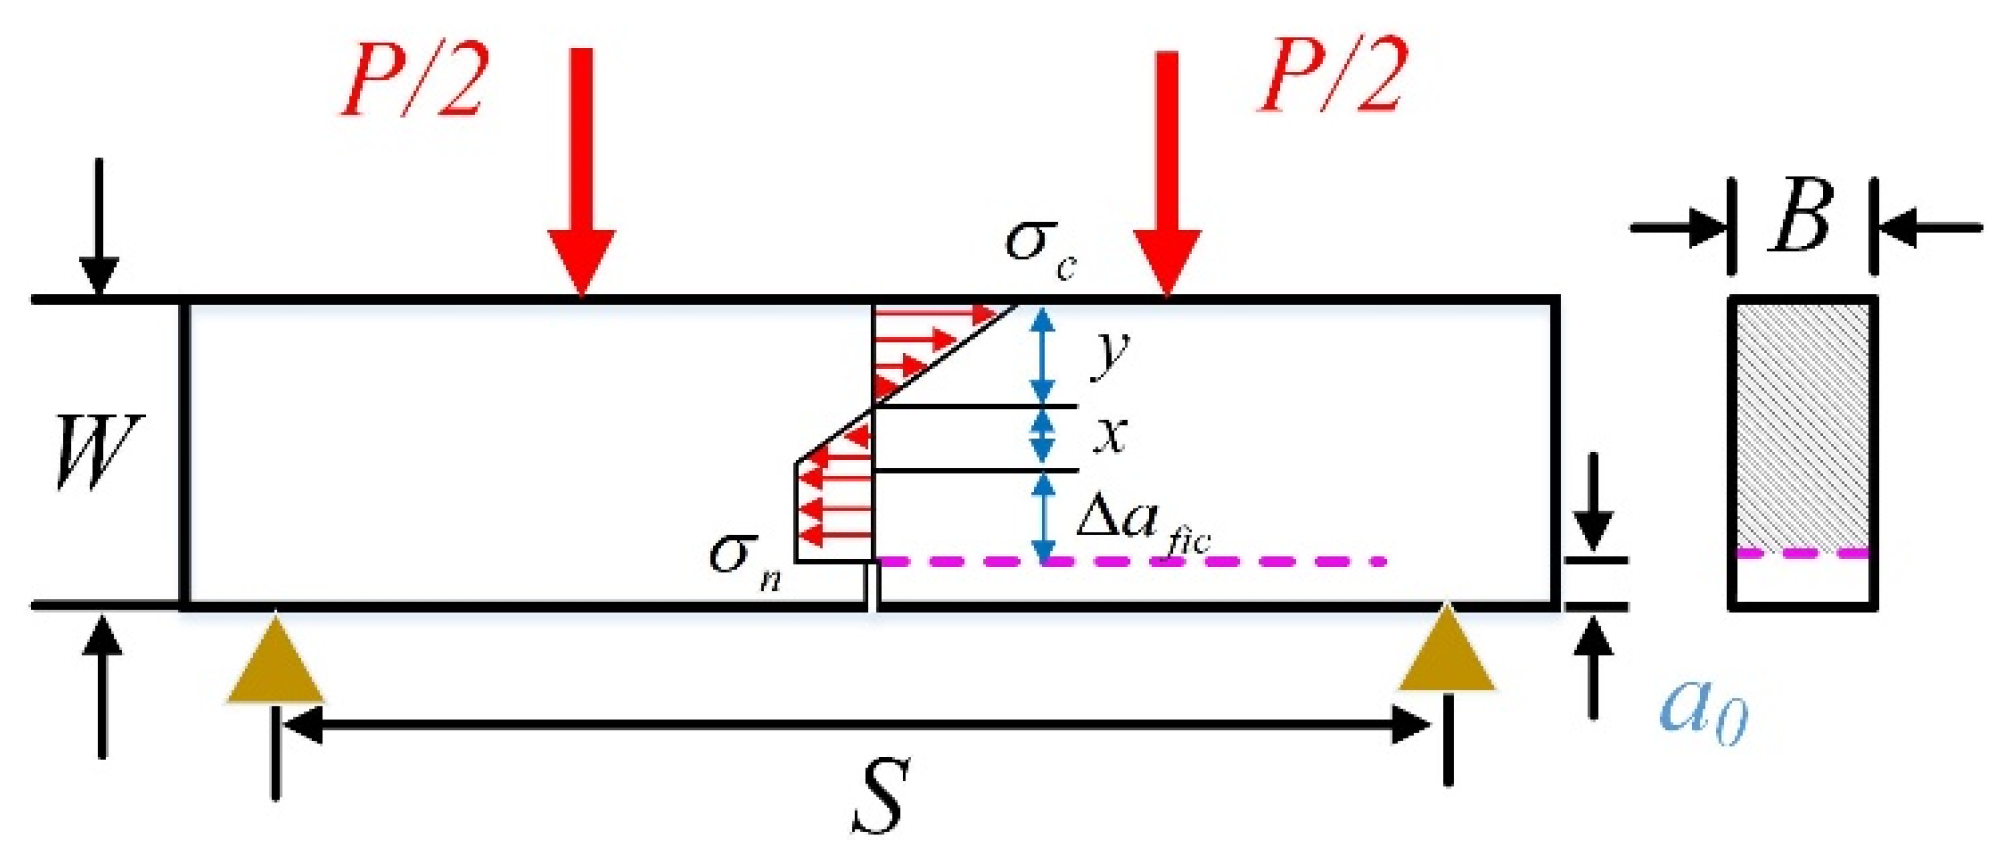
3.3. Wedge-Splitting (WS) Tests
The WS test is a fracture testing method that utilizes wedge-shaped tools to compel a specimen to split along a line that is perpendicular to the direction of the applied force. The biggest advantage of the WS test over the 3-p-b or 4-p-b methods is the absence of the impact of the specimen’s self-weight, especially for these specimens with heavy weight [34]. Moreover, a small vertical load can generate a larger horizontal splitting force by selecting a suitable wedge angle, thereby directly reducing the stiffness requirement for the testing machine. It should be noted that the right boundary of the specimen may suffer tensile stress or compressive stress, which depends on the specimen size and the distance between the loading point and the right boundary. As shown in Figure 5, the relationship between tensile strength and the horizontal component of Pmax−h is established as follows:

Figure 5.
The stress distribution of wedge-splitting specimens.
The geometry factor of wedge-splitting specimens can be calculated as Equation (20):
4. Application in Various Quasi-Brittle Materials
After the relationship between BEM and fracture test methods is established, the fracture properties of quasi-brittle materials can be easily obtained. Nevertheless, there are still some critical issues that need to be resolved.
As is known, the description of fictitious cracks is an essential part of constructing a non-linear fracture model. The length of fictitious cracks (∆fic) is also vital for indicating their effect on fracture test results. As illustrated in Section 3, the fictitious crack length is directly related to the microstructures of materials, and the value of β is approximately estimated between 1 and 2. However, the microstructures of specimens cannot be completely identical, even for one batch of specimens. Moreover, the value of β is always affected by the characteristics of the notch and the microstructure distribution around the notch tip. Hence, for the specimens from the same batch, the microstructures, β values, fictitious crack length, and maximum failure loads may be different, as shown in Figure 6. Here, the average grain (aggregate for concrete materials) Gav is adopted to represent the microstructure of quasi-brittle materials; the value of β is recommended to be 1.5 [35,36,37], and the fictitious crack length can be calculated as Equation (21).
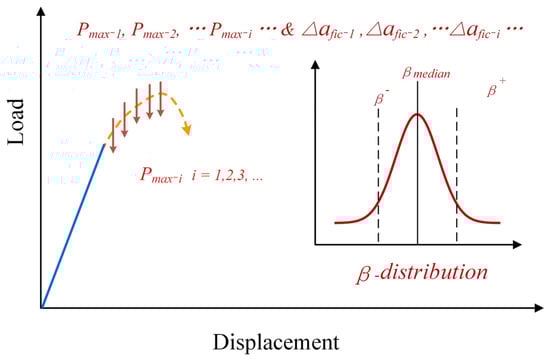
Figure 6.
The variation of peak loads and fictitious crack lengths due to various microstructures [35].
It has been widely acknowledged that the scattered distribution of fracture properties is the nature of quasi-brittle materials; the obtained fracture properties will vary among specimens even for an ideal fracture model and fracture test. Such characteristics always become obstacles in determining the fracture properties of quasi-brittle materials. Actually, we do not need to determine the fracture parameter to a uniform value. On the contrary, distribution analysis can be used to calculate the distribution characteristics, and these characteristics will play vital roles in the fracture prediction of quasi-brittle materials [38,39].
As illustrated in Equation (2), the relationship between tensile strength and fracture toughness is established by the characteristic crack length, which is recommended to be three times the average grain size. Hence, the fracture toughness of quasi-brittle materials can be calculated using Equation (22).
In this way, the influence of specimen geometrical size on fracture test results is considered by equivalent crack length ae and geometry factor Y(α), the effect of fracture process zone is considered by microstructure Gav and β, and the scattered distribution of fracture properties is also incorporated into the model with distribution analysis. Once the maximum failure load of one quasi-brittle specimen is tested with 3-p-b, 4-p-b, or WS tests, the tensile strength can be easily calculated with the above equations, and the fracture toughness can be determined accordingly.
4.1. Concrete Materials
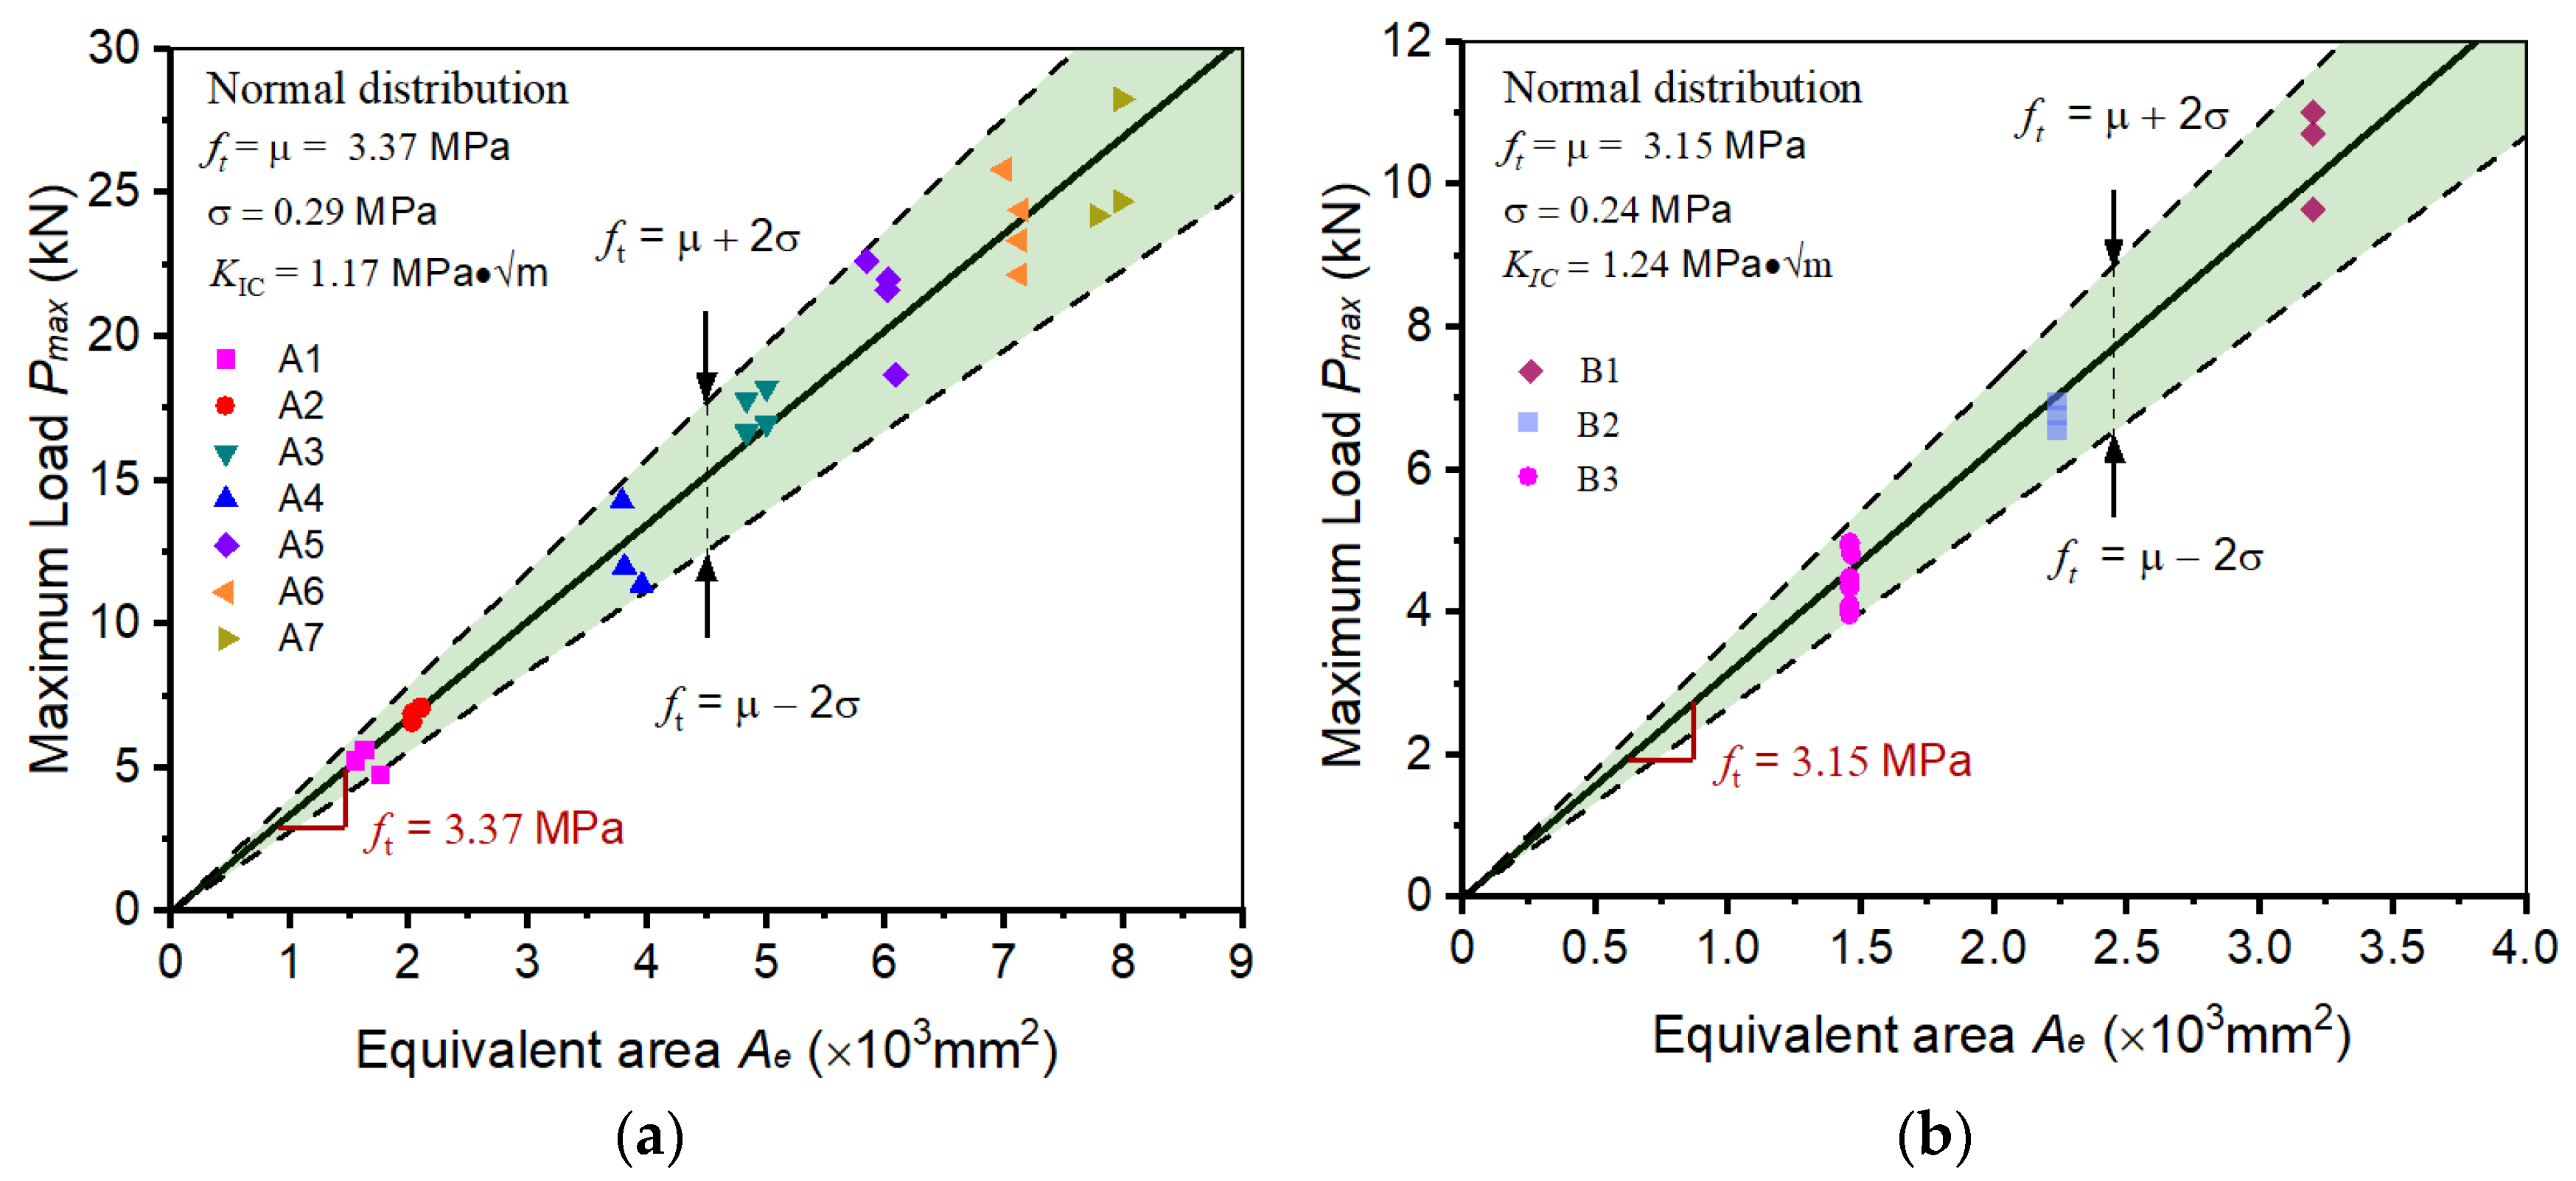
In this section, two batches of concrete fracture test results were collected from published literature [40,41]. In these studies, the wedge-splitting method was adopted to test the fracture performance. As shown in Table 1, the wedge-splitting tests were divided into two groups (Group A and Group B). The details of the tests were summarized, and the height (W, mm), thickness (B, mm), α-ratio, and Pmax (kN) were listed. It could be found that the specimens in Group A were geometrically dissimilar (with the same α-ratios but different sizes), while the specimens in Group B were geometrically similar (with the same sizes but different α-ratios). It should be noted that the average aggregate size in each group is 10 and 13 mm, respectively.

Table 1.
The summarization of concrete fracture test results with the wedge-splitting method [40,41].
Then, applying these parameters to the formulas in Section 3.3, the values of tensile strength and fracture toughness can be easily determined for each specimen. Then, the normal distribution method is used to analyze the characteristics of these values. It can be observed that the distribution of tensile strength in Group A yields a mean value (μa) of 3.37 MPa and a standard deviation (σa) of 0.29 MPa. For the tensile strength values in Group B, the mean value (μb) equals 3.15 MPa, and the standard deviation (σb) equals 0.24 MPa. The standard deviation is only 8.6% and 7.6% of the mean value in Group A and Group B, which is acceptable considering the disordered microstructures of concrete and the inevitable experimental errors. The fracture toughness of concrete in Group A and Group B is calculated at 1.17 MPa·√m and 1.24 MPa·√m, respectively. By incorporating the distribution of tensile strength values into the BEM models for the WS test, the triangle-form fracture prediction method can be established, as shown in Figure 7. In Group A and Group B, most scattered data are distributed in the vicinity of the solid line, which means that the tensile strength determined by BEM and WS tests can be regarded as constants, regardless of the variation of specimen size and initial notch length.
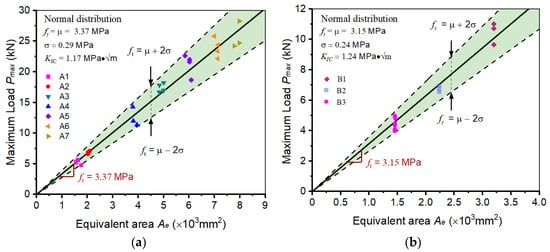
Figure 7.
Determining the fracture properties of concrete WS specimens: (a) Group A and (b) Group B.
4.2. Hard Rocks
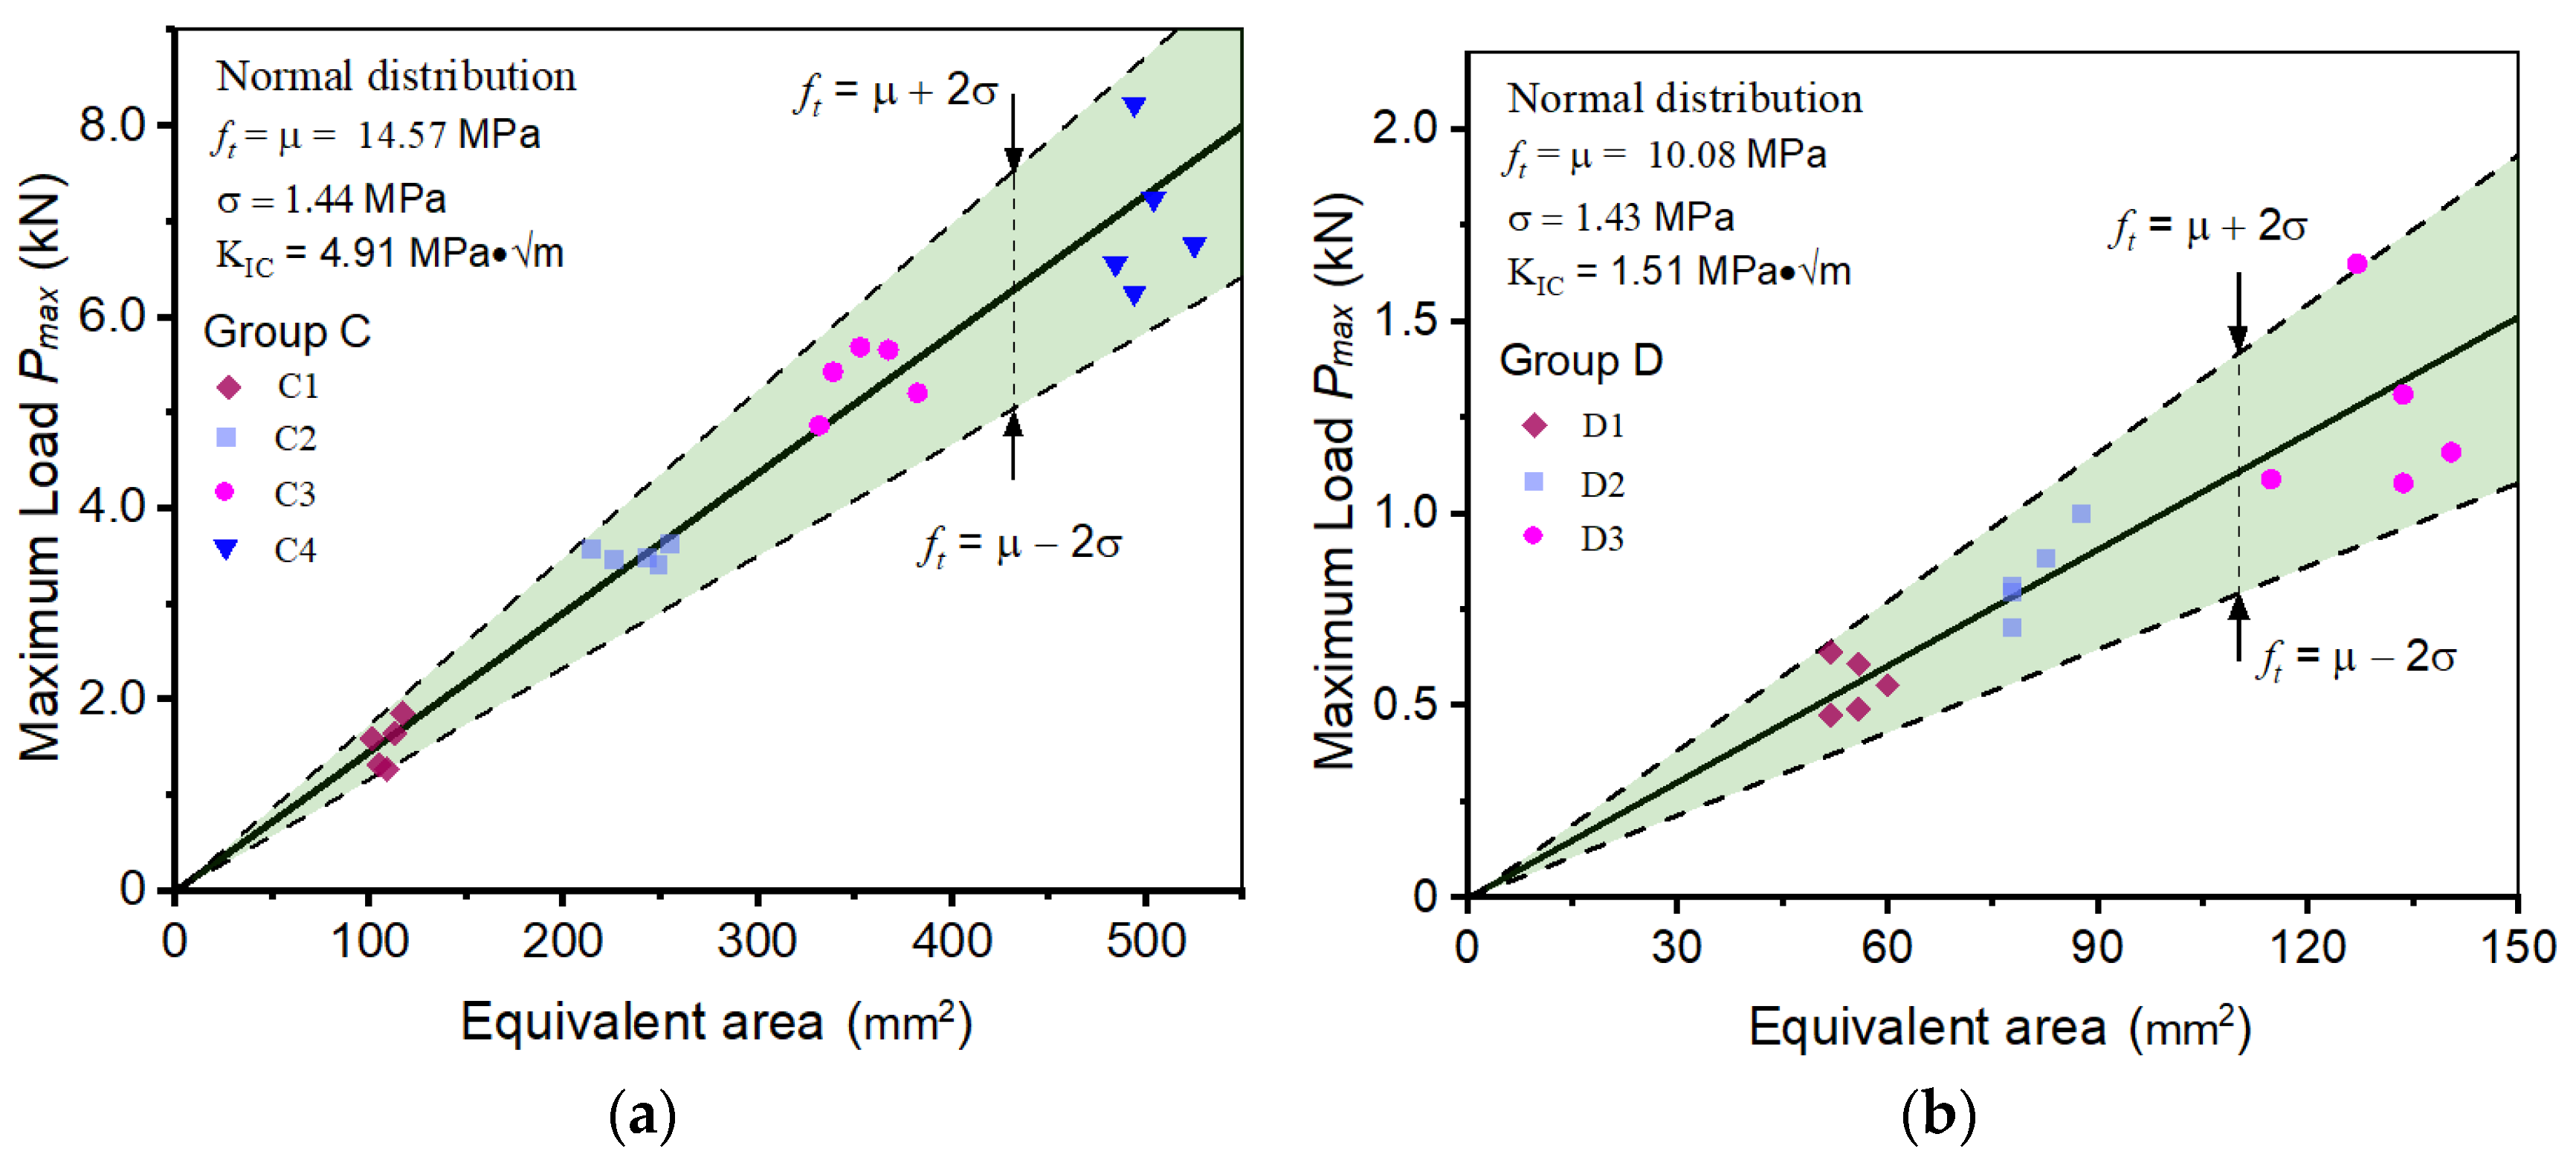
In this section, the BEM is applied to determine the fracture properties of hard rocks with a 4-p-b test. Compared with the concrete-like artificial materials, the hard rocks from nature are typically formed through a geological process that involves the deposition, consolidation, and solidification of minerals and other materials over a long period of time. Consequently, uncertainty and complexity are introduced into its microstructures. Two batches of fracture test results are collected from published literature [42]. They are granite specimens (Group C) with dense structure and volcanic rock specimens (Group D) with porous structure. The details of the fracture test results are summarized in Table 2. It can be found that the specimens have the same size but different notch lengths; the span of all 4-p-b specimens is four times their height. The compressive strengths of granite and volcanic rock are 380 MPa and 48 MPa, respectively, and the porosity of volcanic rock is 0.4, which should be considered when determining the fracture properties.
Table 2.
The summarization of hard rock fracture test results with the 4-p-b method.
Applying the established BEM to analyze the 4-p-b fracture test results in Table 2, the tensile strength of each specimen can be easily calculated, as shown in Figure 8. Then, using normal distribution analysis, analyze the distribution of the determined fracture properties. The tensile strength values in Group C and Group D are in accordance with the normal distribution of μc = 14.57 MPa, σc = 1.44 MPa, μD = 10.08 MPa, and σD = 1.43 MPa, respectively. The standard deviation is 9.9% and 14.2% of the mean values for Group C and Group D, and the tensile strength values appear to be more scattered in Group D. This may be caused by the different microstructures of different rocks; granite always has a high density and uniform crystalline structure, while volcanic rock is filled with pores of varying sizes. Even so, the accuracy of the calculation results is still acceptable. The fracture toughness of granite and volcanic rock is determined as 4.91 MPa·√m and 1.51 MPa·√m, respectively. It has been proven that the BEM and 4-p-b tests are effective in determining the fracture properties of quasi-brittle materials with various microstructures.
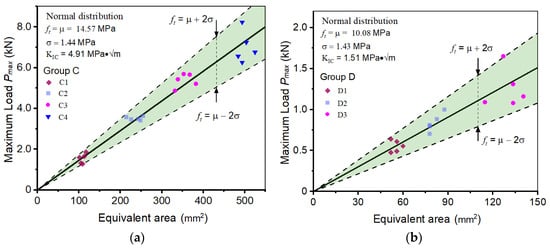
Figure 8.
Determining the fracture properties of hard rock 4-p-b specimens: (a) Group C, (b) Group D.
4.3. Bamboo Scrimber
Bamboo scrimber is a type of unidirectional fiber composite derived from bamboo, prepared by compressing and bonding high-density bamboo strips. It shares a structure and properties akin to wood yet boasts greater hardness and compressive strength, thus serving as an environmentally sustainable alternative. Such material can be utilized for making structural components such as beams, columns, and flooring. Actually, the bamboo scrimber also belonged to the quasi-brittle material, and its fracture properties were tested with 3-p-b methods in the published literature [43]. The fracture test results are collected and summarized in Table 3 and Table 4. The specimen sizes and maximum failure loads are listed. It can be found that the bamboo scrimber specimens are set with different α-ratios and S/W ratios.
Table 3.
The geometrical conditions of bamboo scrimber specimens.
Table 4.
The summarization of bamboo scrimber fracture test results with the 3-p-b method.
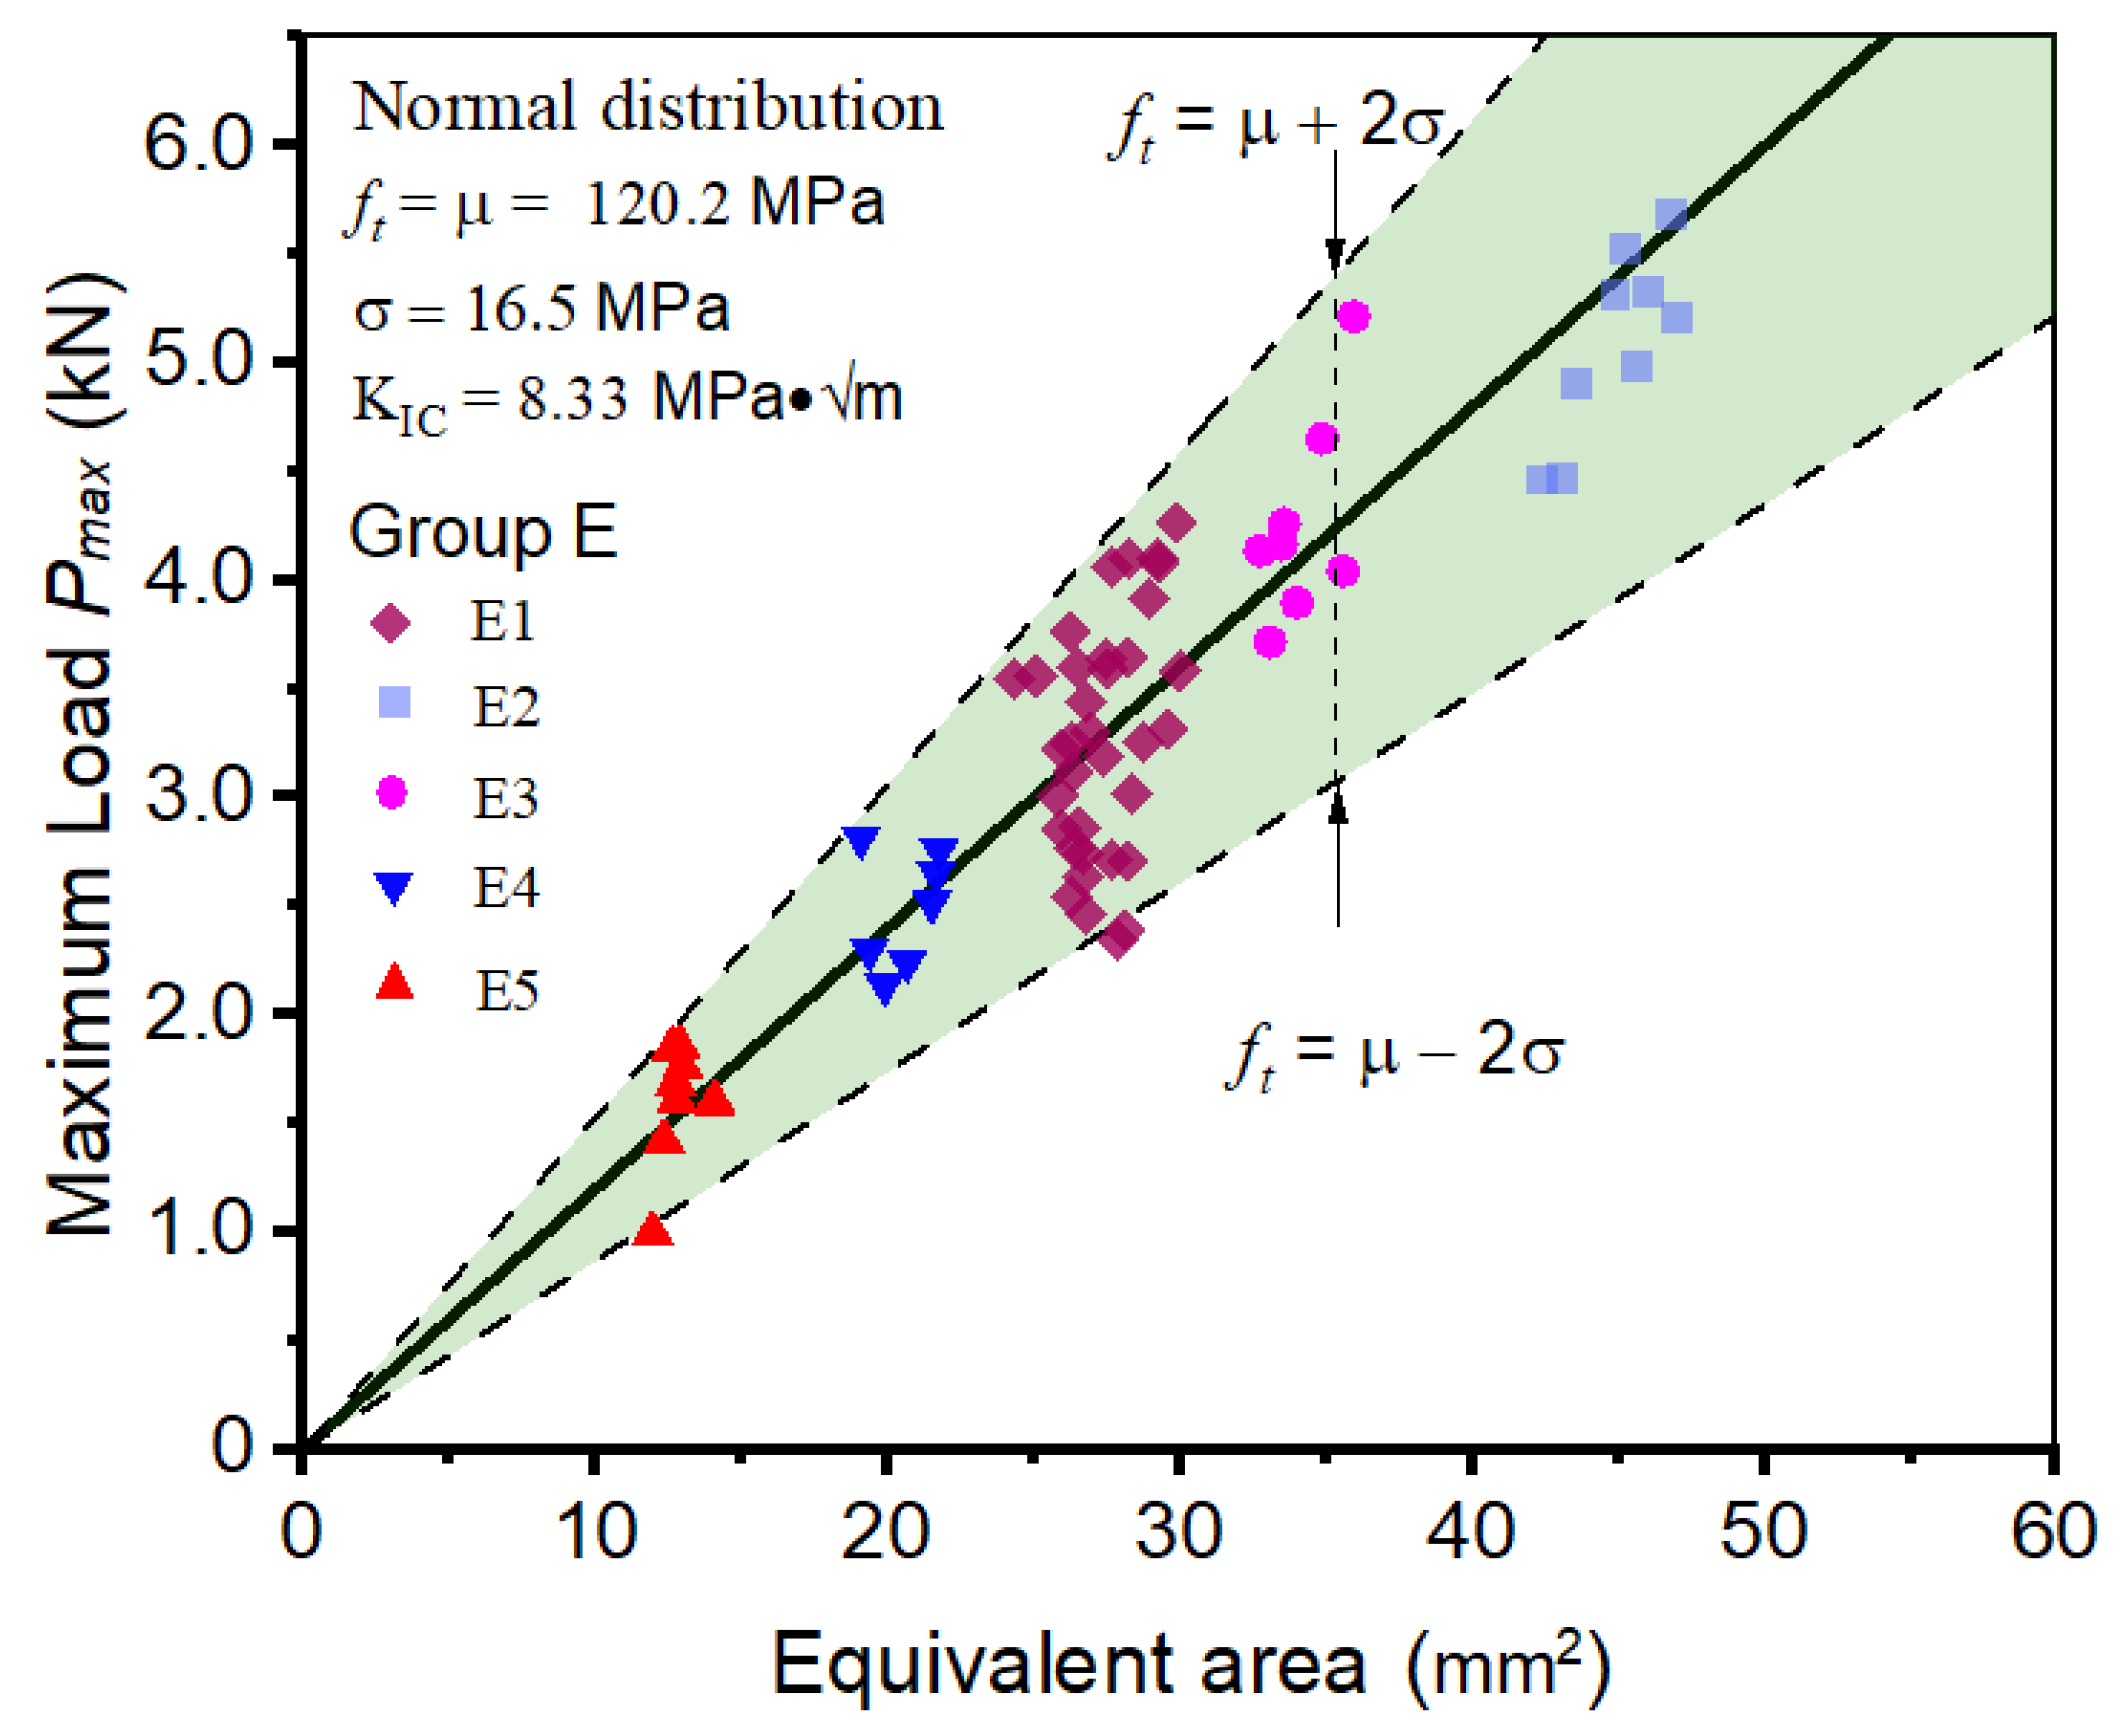
The fracture properties of 67 specimens are calculated by inputting their fracture test results into the BEM model. Subsequently, an analysis of the distribution of tensile strength values revealed a mean value of 120 MPa and a standard deviation of 16.5 MPa; the standard deviation accounted for 13.7% of the mean value. By referring to Equation (22), the fracture toughness of bamboo scrimber is calculated as 8.33 MPa·√m. As illustrated in Figure 9, most data points are closely distributed around the solid line. This implies that the fracture properties acquired via the BEM and 3-p-b tests for bamboo scrimber are indicative and can effectively mirror the fracture characteristics of this material across various geometric conditions.
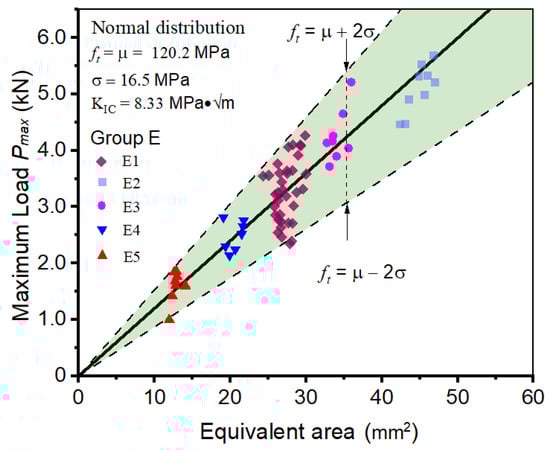
Figure 9.
Determining the fracture properties of bamboo scrimber 3-p-b specimens in Group E.
5. Discussion
As illustrated in Section 4, only three cases were listed in the current study, such as BEM and WS for concrete materials, BEM and 4-p-b for hard rocks, and BEM and 3-p-b for bamboo scrimber. Actually, the Boundary Effect Model has been applied in other scenarios [44,45,46], and a relatively accurate determination of material fracture properties has been witnessed.
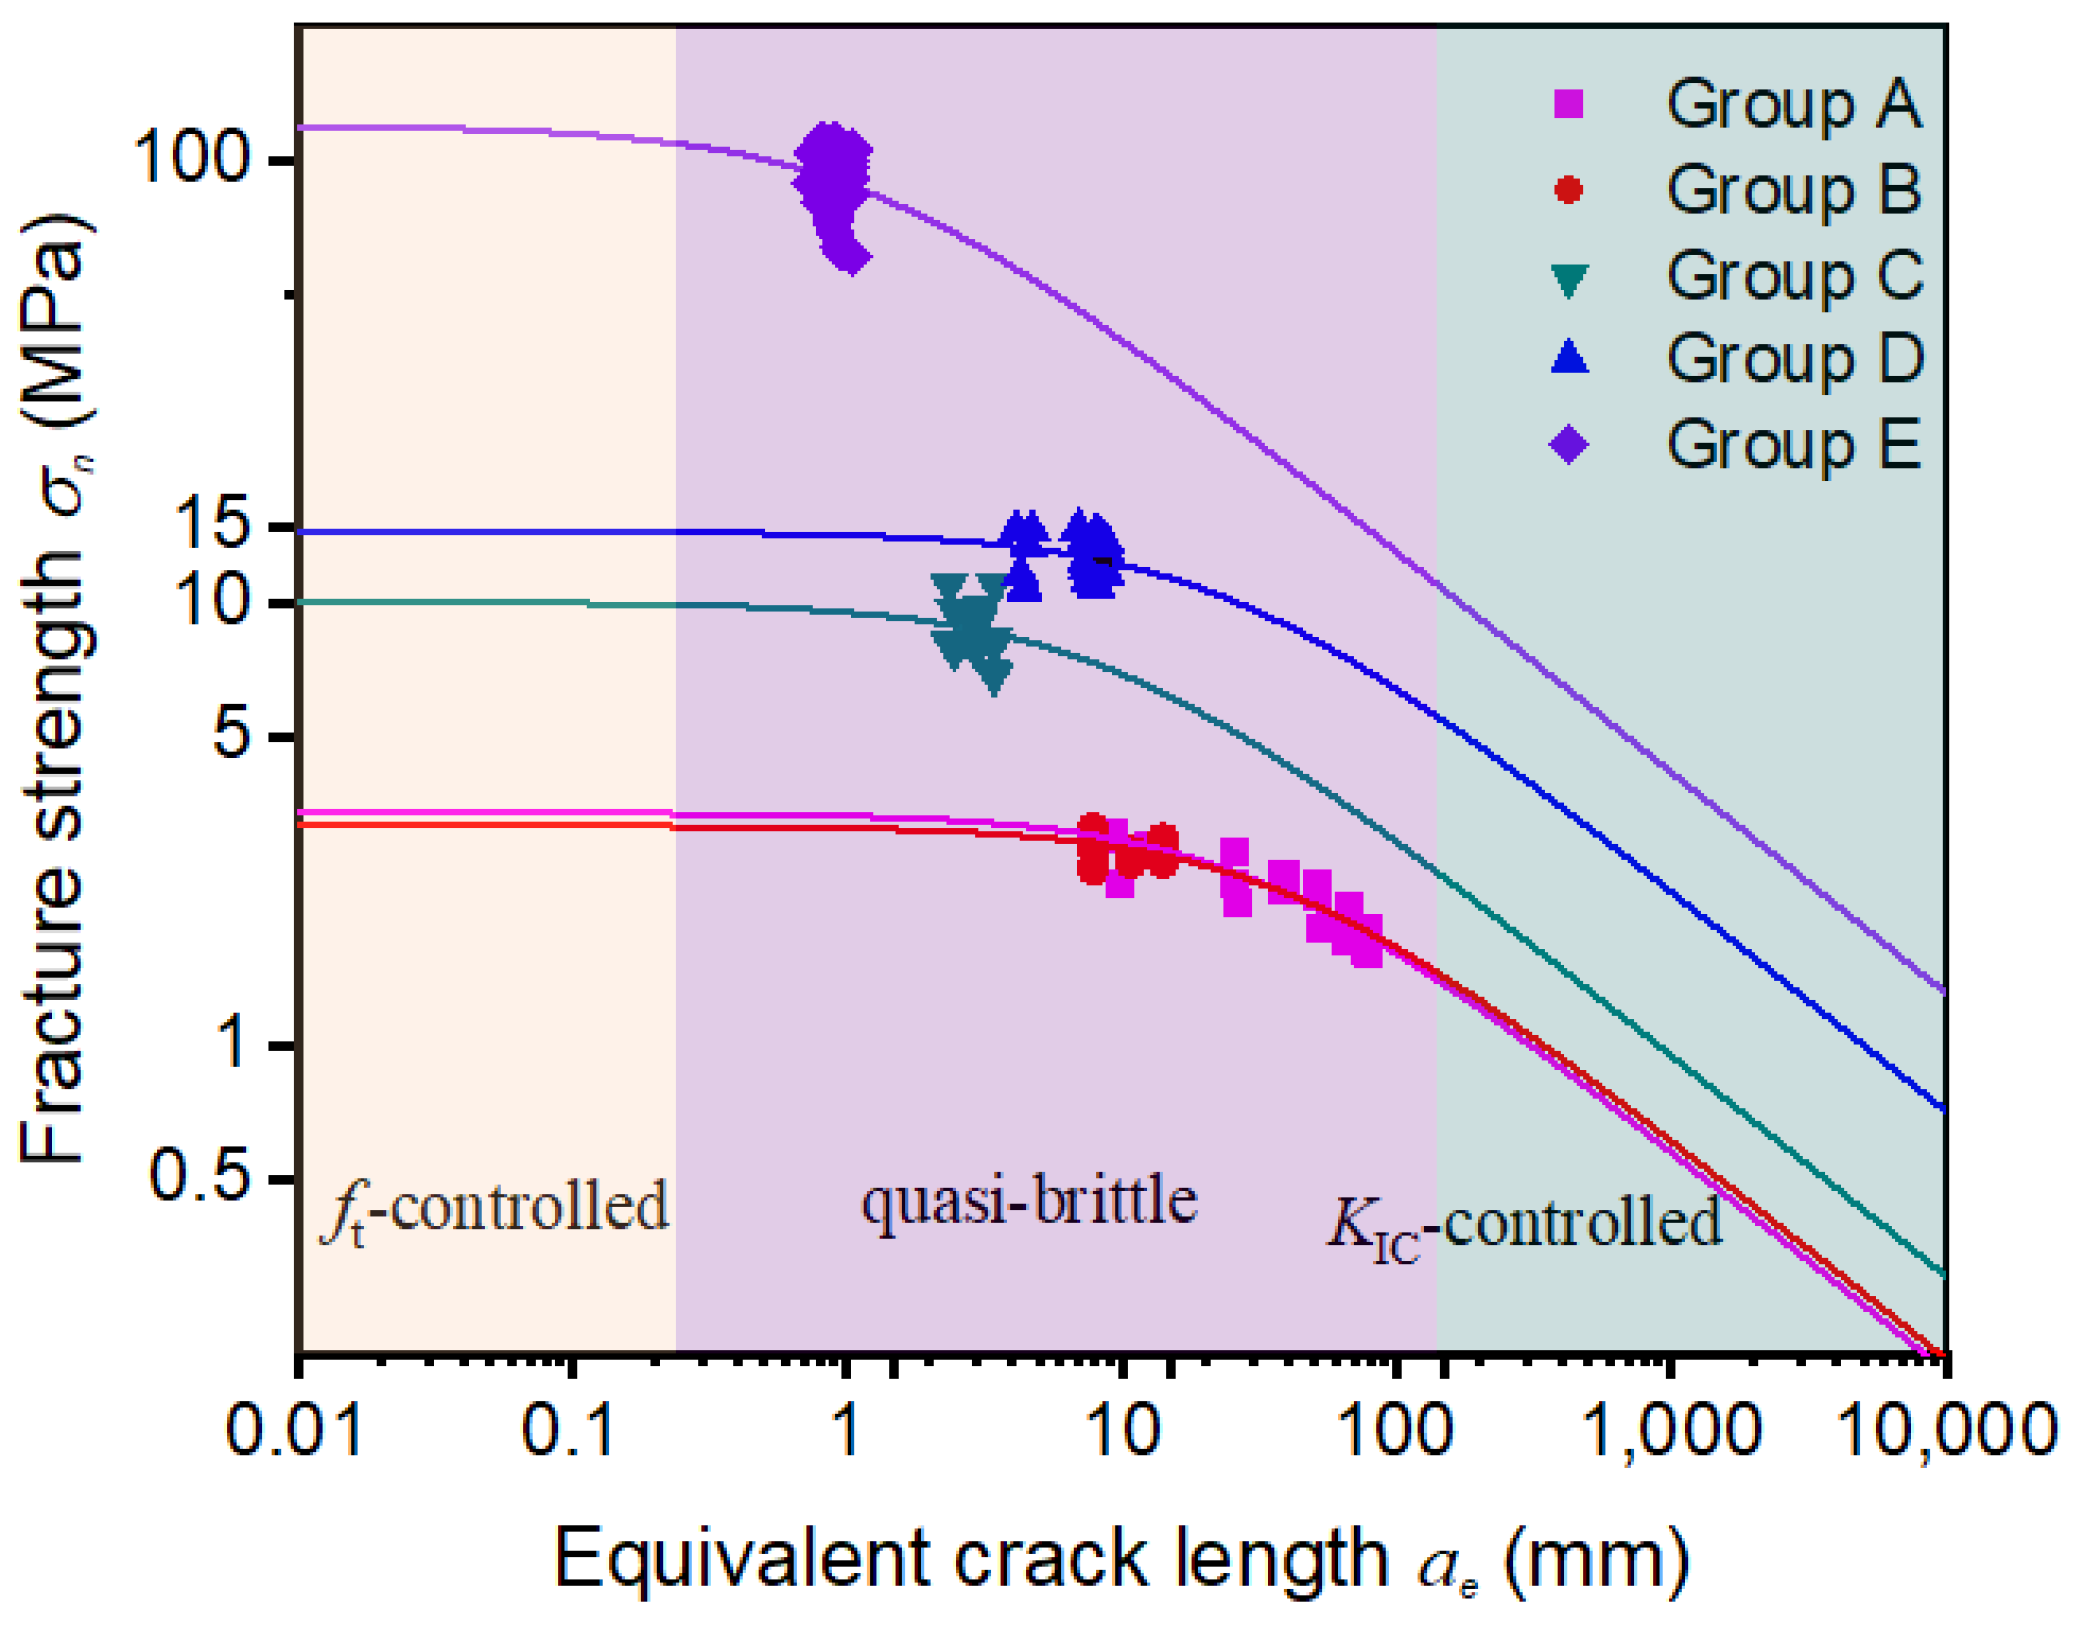
In this section, the non-linear BEM is used to analyze the above 140 fracture test results, including concrete, hard rocks, and bamboo scrimber. As shown in Figure 10, the fracture failure of materials could be divided into three regions: (1) tensile strength (ft) controlled region; (2) quasi-brittle fracture region controlled by both ft and KIC; and (3) fracture toughness (KIC) controlled region [37]. It could be found that all the test scatters concentrate in the quasi-brittle fracture region, despite the huge variation of material types, test methods, and specimen sizes. Hence, only the quasi-brittle fracture model, which considers the effect of microstructure, is suitable for determining the fracture properties of the above materials.
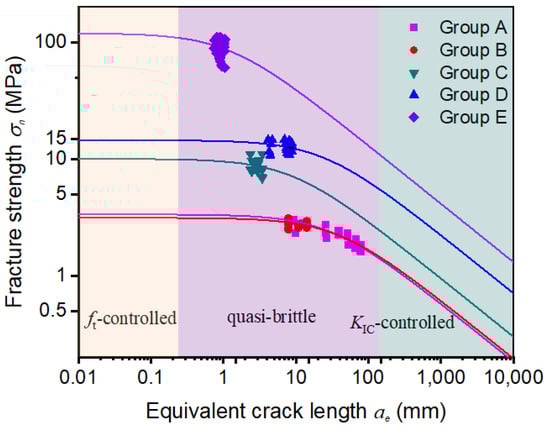
Figure 10.
Using non-linear BEM to analyze the fracture failure types of concrete, hard rock, and bamboo scrimber specimens.
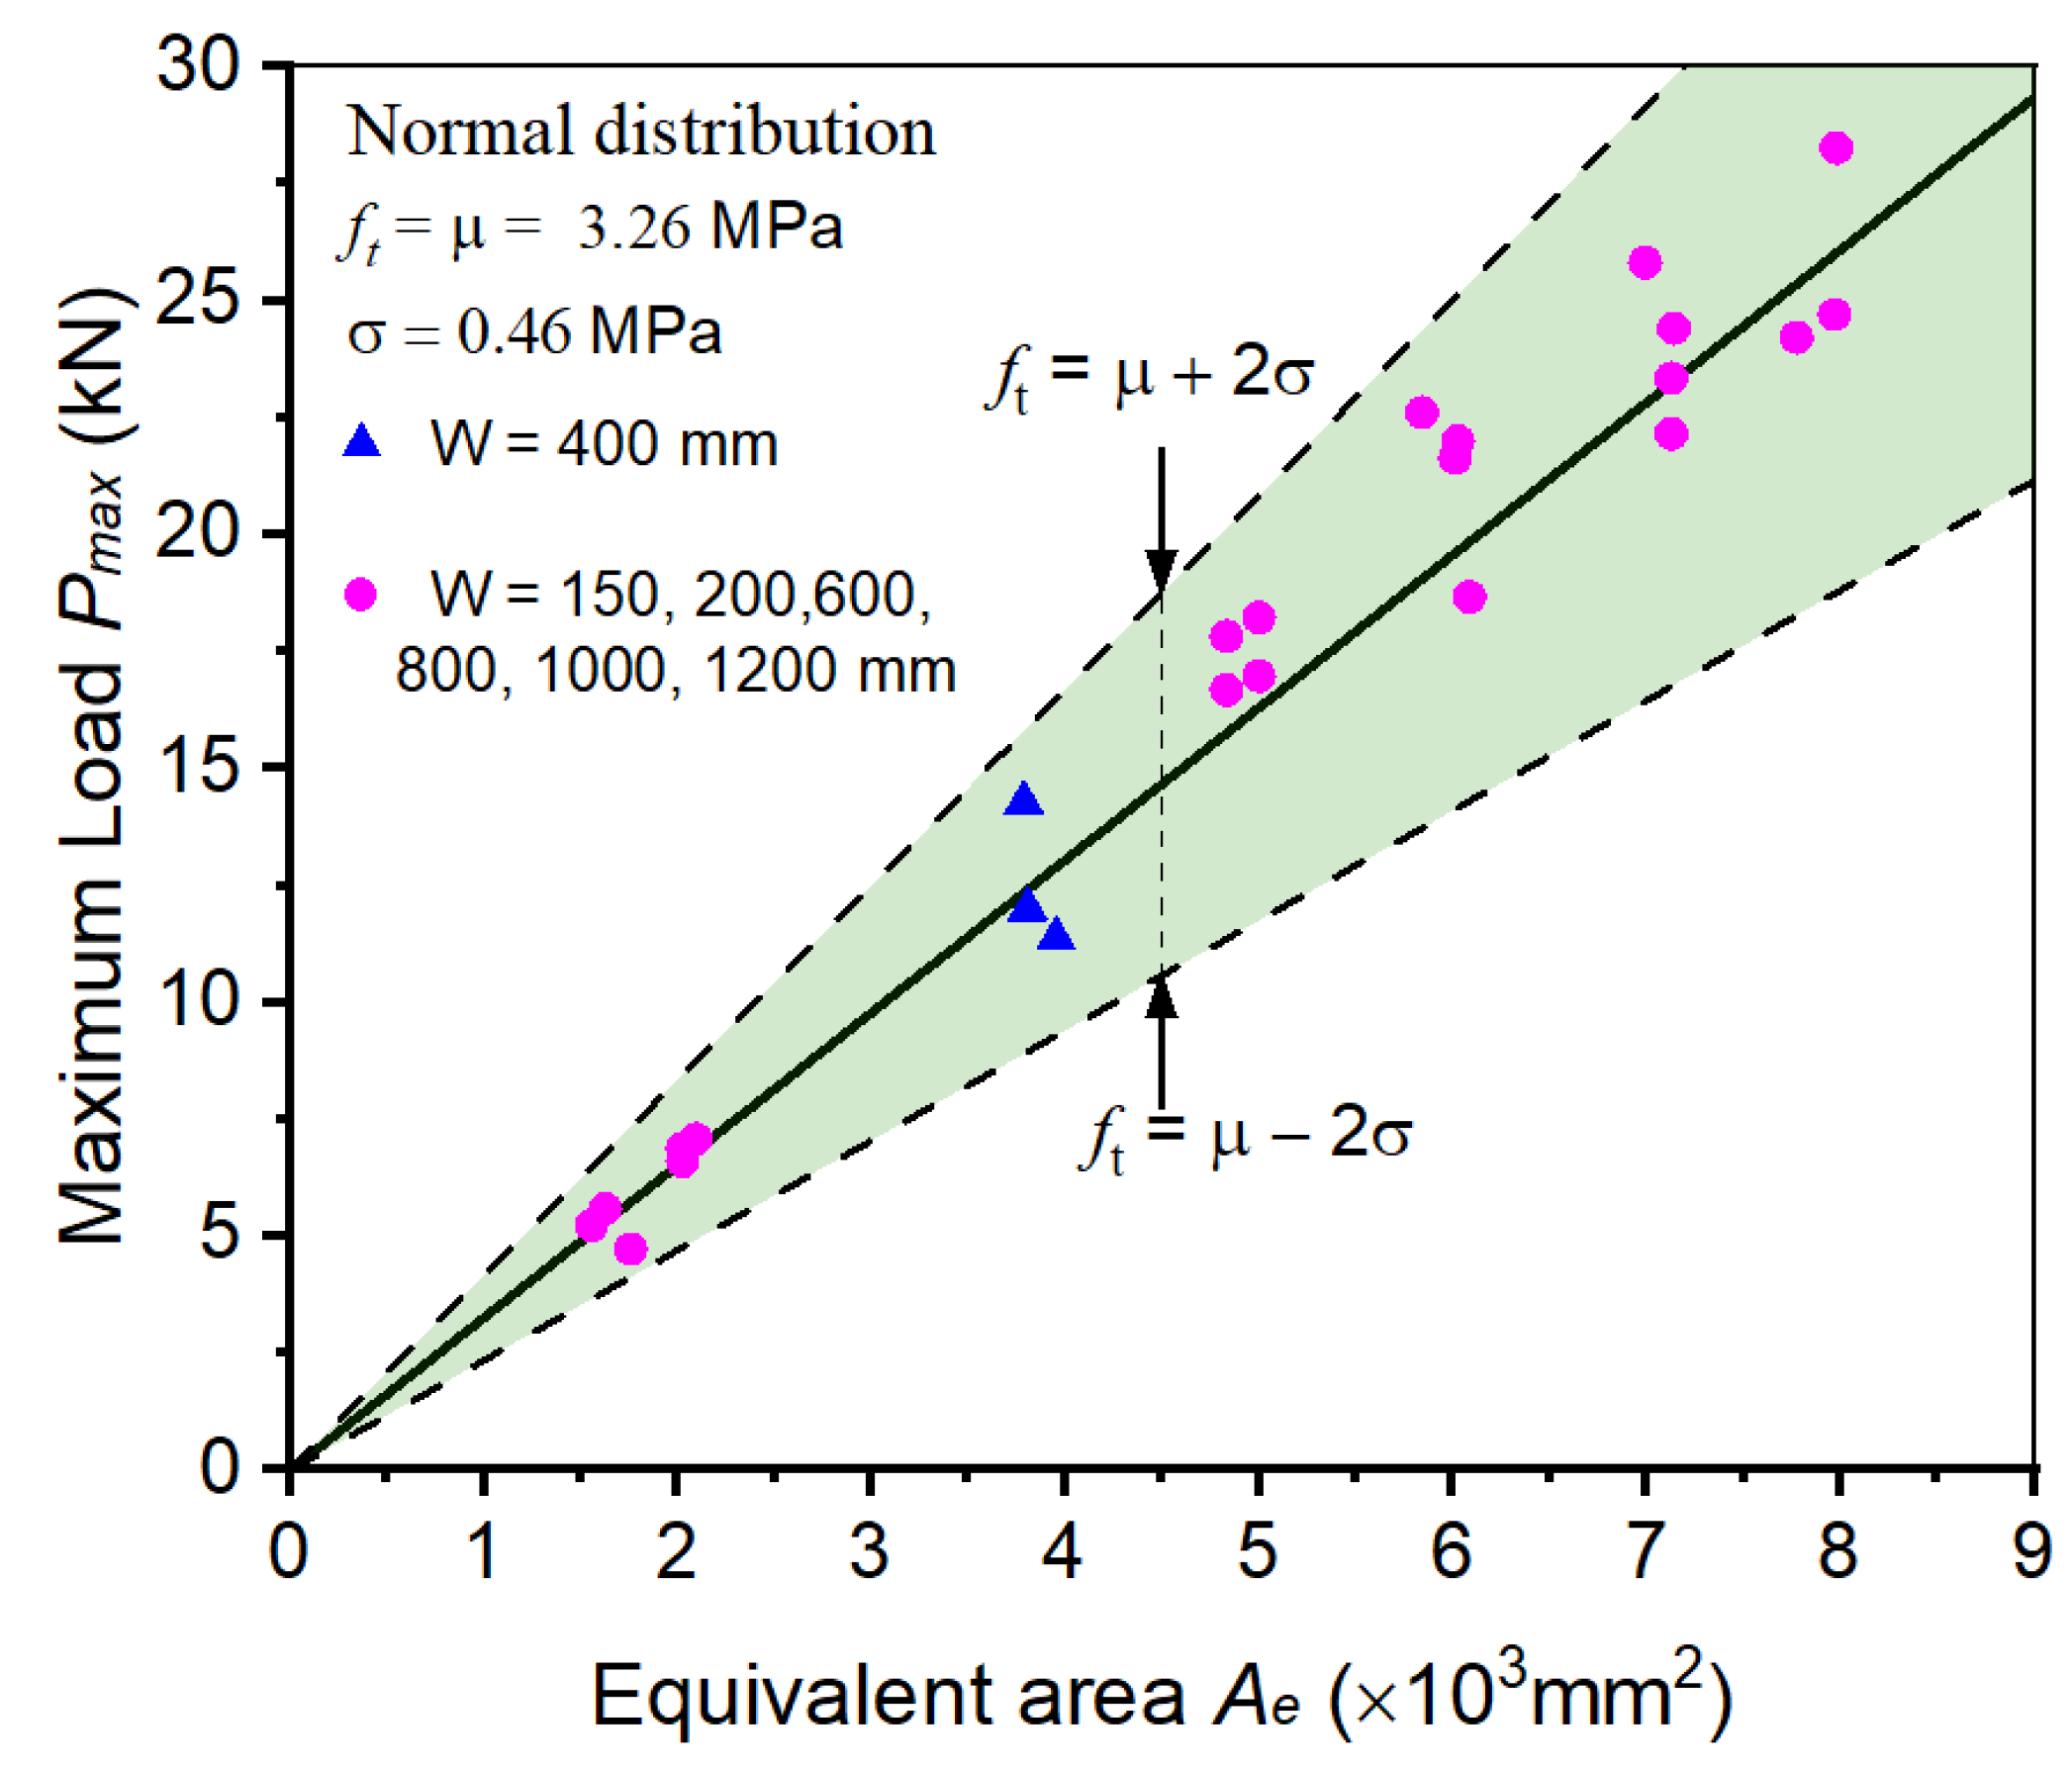
Then, the linear-BEM and three fracture test methods are adopted to predict the fracture load of quasi-brittle materials. As illustrated in Section 4, the fracture properties of quasi-brittle materials can be determined as constants regardless of the specimen sizes, specimen geometries, crack lengths, and material types. Moreover, the scattered distribution of fracture properties is utilized to establish the confidence interval of fracture prediction, which makes the fracture prediction more suitable for practical engineering. Taking the BEM and WS methods as an example, the test results of only three concrete specimens in Group A3 were used to construct the predictive model, and the remaining 35 specimens were utilized to verify the predictive performance of the model. As shown in Figure 11, most data in the other six groups fall in the predictive band; the fracture of concrete specimens in these groups is successfully predicted, regardless of the huge variation in specimen sizes.
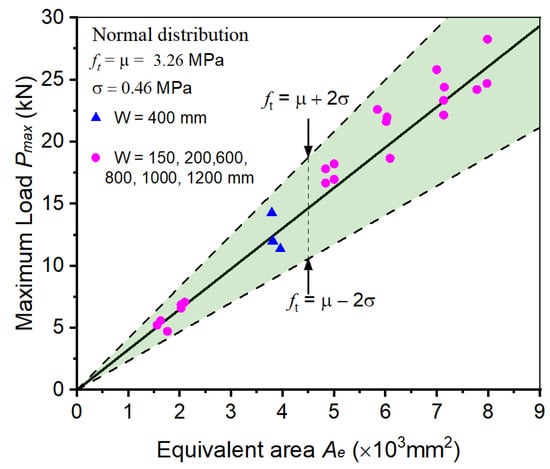
Figure 11.
Applying linear-BEM to predict the fracture of concrete specimens with different sizes.
6. Conclusions
The fracture failure of quasi-brittle materials has attracted widespread attention from researchers, and various methods are proposed to analyze this phenomenon and calculate the fracture properties. In this study, the Boundary Effect Model (BEM) proposed by Hu is illustrated, and the concept, evolutionary process, and applicability scope are described in detail. After that, the BEM is combined with different fracture tests, and the calculating methods of fracture properties are applied to various quasi-brittle materials. The conclusions can be drawn as follows:
- (1)
- The Boundary Effect Model attributes the well-known size effect to the influence of the specimen boundary and the microstructure of materials. Hence, to guarantee the accuracy and applicability of the fracture model, the fictitious crack around the notch tip, the distance between the notch tip and specimen boundaries, and the characteristics of material microstructure are all carefully considered during the construction of the Boundary Effect Model.
- (2)
- On the basis of three-point bending (3-p-b) tests, four-point bending (4-p-b) tests, and wedge-splitting (WS) tests, the linear relationship between the maximum failure loads of the fracture test and material fracture properties is established.
- (3)
- A total of 140 fracture test results for concrete, hard rocks, and bamboo scrimber were adopted to verify the reliability of the proposed methods. It is proven that the BEM-determined fracture properties can be considered material constants, regardless of the effect of specimen sizes, initial notch length, specimen geometries, microstructures, and material types.
- (4)
- By virtue of non-linear BEM analysis, fracture failure is controlled by both the ft and KIC criteria for most laboratory-conducted fracture tests of quasi-brittle materials. Combining the linear BEM and distribution characteristics of fracture properties, the fracture of quasi-brittle specimens can be accurately predicted.
Author Contributions
Conceptualization, X.H.; Validation, J.L.; Investigation, P.L.; Writing—original draft, X.H.; Project administration, P.L. All authors have read and agreed to the published version of the manuscript.
Funding
This research was funded by the Fundamental Research Funds of Southwest University of Science and Technology (Grant No. 23zx7156).
Data Availability Statement
Data are contained within the article.
Conflicts of Interest
Author Peng Li and Jianguo Liu were employed by the company China Railway 17th Bureau Group Co., Ltd. The remaining authors declare that the research was conducted in the absence of any commercial or financial relationships that could be construed as a potential conflict of interest.
References
- Labuz, J.F.; Biolzi, L. Characteristic strength of quasi-brittle materials. Int. J. Solids Struct. 1998, 35, 4191–4203. [Google Scholar] [CrossRef]
- Shah, S.P.; Swartz, S.E.; Ouyang, C. Fracture Mechanics of Concrete: Applications of Fracture Mechanics to Concrete, Rock and Other Quasi-Brittle Materials; John Wiley & Sons: Hoboken, NJ, USA, 1995. [Google Scholar]
- de Borst, R. Fracture in quasi-brittle materials: A review of continuum damage-based approaches. Eng. Fract. Mech. 2002, 69, 95–112. [Google Scholar] [CrossRef]
- Cervera, M.; Pelà, L.; Clemente, R.; Roca, P. A crack-tracking technique for localized damage in quasi-brittle materials. Eng. Fract. Mech. 2010, 77, 2431–2450. [Google Scholar] [CrossRef]
- Iskander, M.; Shrive, N. Fracture of brittle and quasi-brittle materials in compression: A review of the current state of knowledge and a different approach. Theor. Appl. Fract. Mech. 2018, 97, 250–257. [Google Scholar] [CrossRef]
- Barsoum, I.; Faleskog, J. Rupture mechanisms in combined tension and shear—Experiments. Int. J. Solids Struct. 2007, 44, 1768–1786. [Google Scholar] [CrossRef]
- Karihaloo, B.L. Size effect in shallow and deep notched quasi-brittle structures. Fract. Scaling 1999, 95, 379–390. [Google Scholar]
- Nakao, S.; Ando, T.; Shikida, M.; Sato, K. Effect of temperature on fracture toughness in a single-crystal-silicon film and transition in its fracture mode. J. Micromech. Microeng. 2007, 18, 015026. [Google Scholar] [CrossRef]
- Nara, Y.; Morimoto, K.; Hiroyoshi, N.; Yoneda, T.; Kaneko, K.; Benson, P.M. Influence of relative humidity on fracture toughness of rock: Implications for subcritical crack growth. Int. J. Solids Struct. 2012, 49, 2471–2481. [Google Scholar] [CrossRef]
- Carpinteri, A.; Ferro, G. Size effects on tensile fracture properties: A unified explanation based on disorder and fractality of concrete microstructure. Mater. Struct. 1994, 27, 563–571. [Google Scholar] [CrossRef]
- Van Mier, J.G.M.; Van Vliet, M.R.A. Influence of microstructure of concrete on size/scale effects in tensile fracture. Eng. Fract. Mech. 2003, 70, 2281–2306. [Google Scholar] [CrossRef]
- Corr, D.; Accardi, M.; Graham-Brady, L.; Shah, S. Digital image correlation analysis of interfacial debonding properties and fracture behavior in concrete. Eng. Fract. Mech. 2007, 74, 109–121. [Google Scholar] [CrossRef]
- Han, X.; Yuan, B.; Tan, B.; Hu, X.; Chen, S. Repair of subsurface micro-cracks in rock using resin pre-coating technique. Constr. Build. Mater. 2019, 196, 485–491. [Google Scholar] [CrossRef]
- Hillerborg, A.; Modéer, M.; Petersson, P.E. Analysis of crack formation and crack growth in concrete by means of fracture mechanics and finite elements. Cem. Concr. Res. 1976, 6, 773–781. [Google Scholar] [CrossRef]
- Bažant, Z.P. Size effect in blunt fracture: Concrete, rock, metal. J. Eng. Mech. 1984, 110, 518–535. [Google Scholar] [CrossRef]
- Bažant, Z.P.; Yu, Q. Universal size effect law and effect of crack depth on quasi-brittle structure strength. J. Eng. Mech. 2009, 135, 78–84. [Google Scholar] [CrossRef]
- Duan, K.; Hu, X. Specimen boundary induced size effect on quasi-brittle fracture. Strength Fract. Complex. 2004, 2, 47–68. [Google Scholar]
- Duan, K.; Hu, X.; Wittmann, F.H. Scaling of quasi-brittle fracture: Boundary and size effect. Mech. Mater. 2006, 38, 128–141. [Google Scholar] [CrossRef]
- Xu, S.; Reinhardt, H.W. Determination of double-K criterion for crack propagation in quasi-brittle fracture, Part I: Experimental investigation of crack propagation. Int. J. Fract. 1999, 98, 111–149. [Google Scholar] [CrossRef]
- Xu, S.; Reinhardt, H.W. Determination of double-K criterion for crack propagation in quasi-brittle fracture, Part II: Analytical evaluating and practical measuring methods for three-point bending notched beams. Int. J. Fract. 1999, 98, 151–177. [Google Scholar] [CrossRef]
- Kim, H.; Wagoner, M.P.; Buttlar, W.G. Micromechanical fracture modeling of asphalt concrete using a single-edge notched beam test. Mater. Struct. 2009, 42, 677–689. [Google Scholar] [CrossRef]
- Aure, T.W.; Ioannides, A.M. Simulation of crack propagation in concrete beams with cohesive elements in ABAQUS. Transp. Res. Rec. 2010, 2154, 12–21. [Google Scholar] [CrossRef]
- Fukuda, D.; Mohammadnejad, M.; Liu, H.; Zhang, Q.; Zhao, J.; Dehkhoda, S.; Chan, A.; Kodama, J.-I.; Fujii, Y. Development of a 3D hybrid finite-discrete element simulator based on GPGPU-parallelized computation for modelling rock fracturing under quasi-static and dynamic loading conditions. Rock Mech. Rock Eng. 2020, 53, 1079–1112. [Google Scholar] [CrossRef]
- Hu, X.; Wittmann, F. Size effect on toughness induced by crack close to free surface. Eng. Fract. Mech. 2000, 65, 209–221. [Google Scholar] [CrossRef]
- Hu, X.Z. An asymptotic approach to size effect on fracture toughness and fracture energy of composites. Eng. Fract. Mech. 2002, 69, 555–564. [Google Scholar] [CrossRef]
- E 399-90; Standard Test Method for Plane-Strain Fracture Toughness of Metallic Materials. ASTM International: West Conshohocken, PA, USA, 2003.
- Rilemd, R. Determination of the fracture energy of mortar and concrete by means of three-point bend tests on notched beames. Mater. Struct. 1985, 18, 285–290. [Google Scholar]
- Wu, Z.; Yang, S.; Hu, X.; Zheng, J. An analytical model to predict the effective fracture toughness of concrete for three-point bending notched beams. Eng. Fract. Mech. 2006, 73, 2166–2191. [Google Scholar] [CrossRef]
- Wang, Y.; Hu, X. Determination of tensile strength and fracture toughness of granite using notched three-point-bend samples. Rock Mech. Rock Eng. 2017, 50, 17–28. [Google Scholar] [CrossRef]
- Wang, Y.; Hu, X.; Liang, L.; Zhu, W. Determination of tensile strength and fracture toughness of concrete using notched 3-pb specimens. Eng. Fract. Mech. 2016, 160, 67–77. [Google Scholar] [CrossRef]
- Tada, H.; Paris, P.C.; Irwin, G.R. The Stress Analysis of Cracks Handbook; Del Research Corporation: Baton Rouge, LA, USA, 1973; p. 34. [Google Scholar]
- Yin, Y.; Qiao, Y.; Hu, S. Four-point bending tests for the fracture properties of concrete. Eng. Fract. Mech. 2019, 211, 371–381. [Google Scholar] [CrossRef]
- Razavi SM, J.; Aliha MR, M.; Berto, F. Application of an average strain energy density criterion to obtain the mixed mode fracture load of granite rock tested with the cracked asymmetric four-point bend specimens. Theor. Appl. Fract. Mech. 2018, 97, 419–425. [Google Scholar] [CrossRef]
- Guan, J.F.; Hu, X.Z.; Xie, C.P.; Li, Q.B.; Wu, Z.M. Wedge-splitting tests for tensile strength and fracture toughness of concrete. Theor. Appl. Fract. Mech. 2018, 93, 263–275. [Google Scholar] [CrossRef]
- Han, X.; Chen, Y.; Hu, X.; Liu, W.; Li, Q.; Chen, S. Granite strength and toughness from small notched three-point-bend specimens of geometry dissimilarity. Eng. Fract. Mech. 2019, 216, 106482. [Google Scholar] [CrossRef]
- Chen, Y.; Han, X.; Hu, X.; Zhu, W. Statistics-assisted fracture modelling of small un-notched and large notched sandstone specimens with specimen-size/grain-size ratio from 30 to 900. Eng. Fract. Mech. 2020, 235, 107134. [Google Scholar] [CrossRef]
- Hu, X.; Guan, J.; Wang, Y.; Keating, A.; Yang, S. Comparison of boundary and size effect models based on new developments. Eng. Fract. Mech. 2017, 175, 146–167. [Google Scholar] [CrossRef]
- Han, X.; Xiao, Q.; Cui, K.; Hu, X.; Chen, Q.; Li, C.; Qiu, Z. Predicting the fracture behavior of concrete using artificial intelligence approaches and closed-form solution. Theor. Appl. Fract. Mech. 2021, 112, 102892. [Google Scholar] [CrossRef]
- Chen, Y.; Hu, Y.; Hu, X. Quasi-brittle fracture analysis of large and small wedge splitting concrete specimens with size from 150 mm to 2 m and aggregates from 10 to 100 mm. Theor. Appl. Fract. Mech. 2022, 121, 103474. [Google Scholar] [CrossRef]
- Xu, S.; Zhang, X.; Zheng, S. Experimental measurement of double-K fracture parameters of concrete with small-size aggregates. J. Hydraul. Eng. 2006, 5, 543–553. [Google Scholar]
- Xu, S.; Zhao, Y.; Wu, Z. Study on the average fracture energy for crack propagation in concrete. J. Mater. Civ. Eng. 2006, 18, 817–824. [Google Scholar] [CrossRef]
- Han, X.; Xiao, Q.; Cui, K.; Hu, X.; Zhou, Z. Determining the fracture toughness of quasi-brittle materials with notched four-point bending tests. Eng. Fract. Mech. 2023, 284, 109259. [Google Scholar] [CrossRef]
- Liu, W.; Hu, X.; Yuan, B.; Xu, F.; Huang, J. Tensile strength model of bamboo srimber by 3-pb fracture test on the basis of, n.o.n.-L.E.F.M. Compos. Sci. Technol. 2020, 198, 108295. [Google Scholar] [CrossRef]
- Han, X.; Cui, K.; Xiao, Q.; Zhao, W.; Li, C. Determining the fracture properties of pervious concrete specimens with various micro-structures and geometries. Theor. Appl. Fract. Mech. 2022, 117, 103151. [Google Scholar] [CrossRef]
- Liu, W.; Yu, Y.; Hu, X.; Han, X.; Xie, P. Quasi-brittle fracture criterion of bamboo-based fiber composites in transverse direction based on boundary effect model. Compos. Struct. 2019, 220, 347–354. [Google Scholar] [CrossRef]
- Chen, Y.; Hu, X.; Liu, W. Modelling of bone fracture using the fundamental functional unit–Osteon. Theor. Appl. Fract. Mech. 2022, 118, 103216. [Google Scholar] [CrossRef]

Disclaimer/Publisher’s Note: The statements, opinions and data contained in all publications are solely those of the individual author(s) and contributor(s) and not of MDPI and/or the editor(s). MDPI and/or the editor(s) disclaim responsibility for any injury to people or property resulting from any ideas, methods, instructions or products referred to in the content. |
© 2024 by the authors. Licensee MDPI, Basel, Switzerland. This article is an open access article distributed under the terms and conditions of the Creative Commons Attribution (CC BY) license (https://creativecommons.org/licenses/by/4.0/).