
Accuracy of Point Load Index and Brazilian Tensile Strength in Predicting the Uniaxial Compressive Strength of the Rocks: A Comparative Study


Abstract
1. Introduction
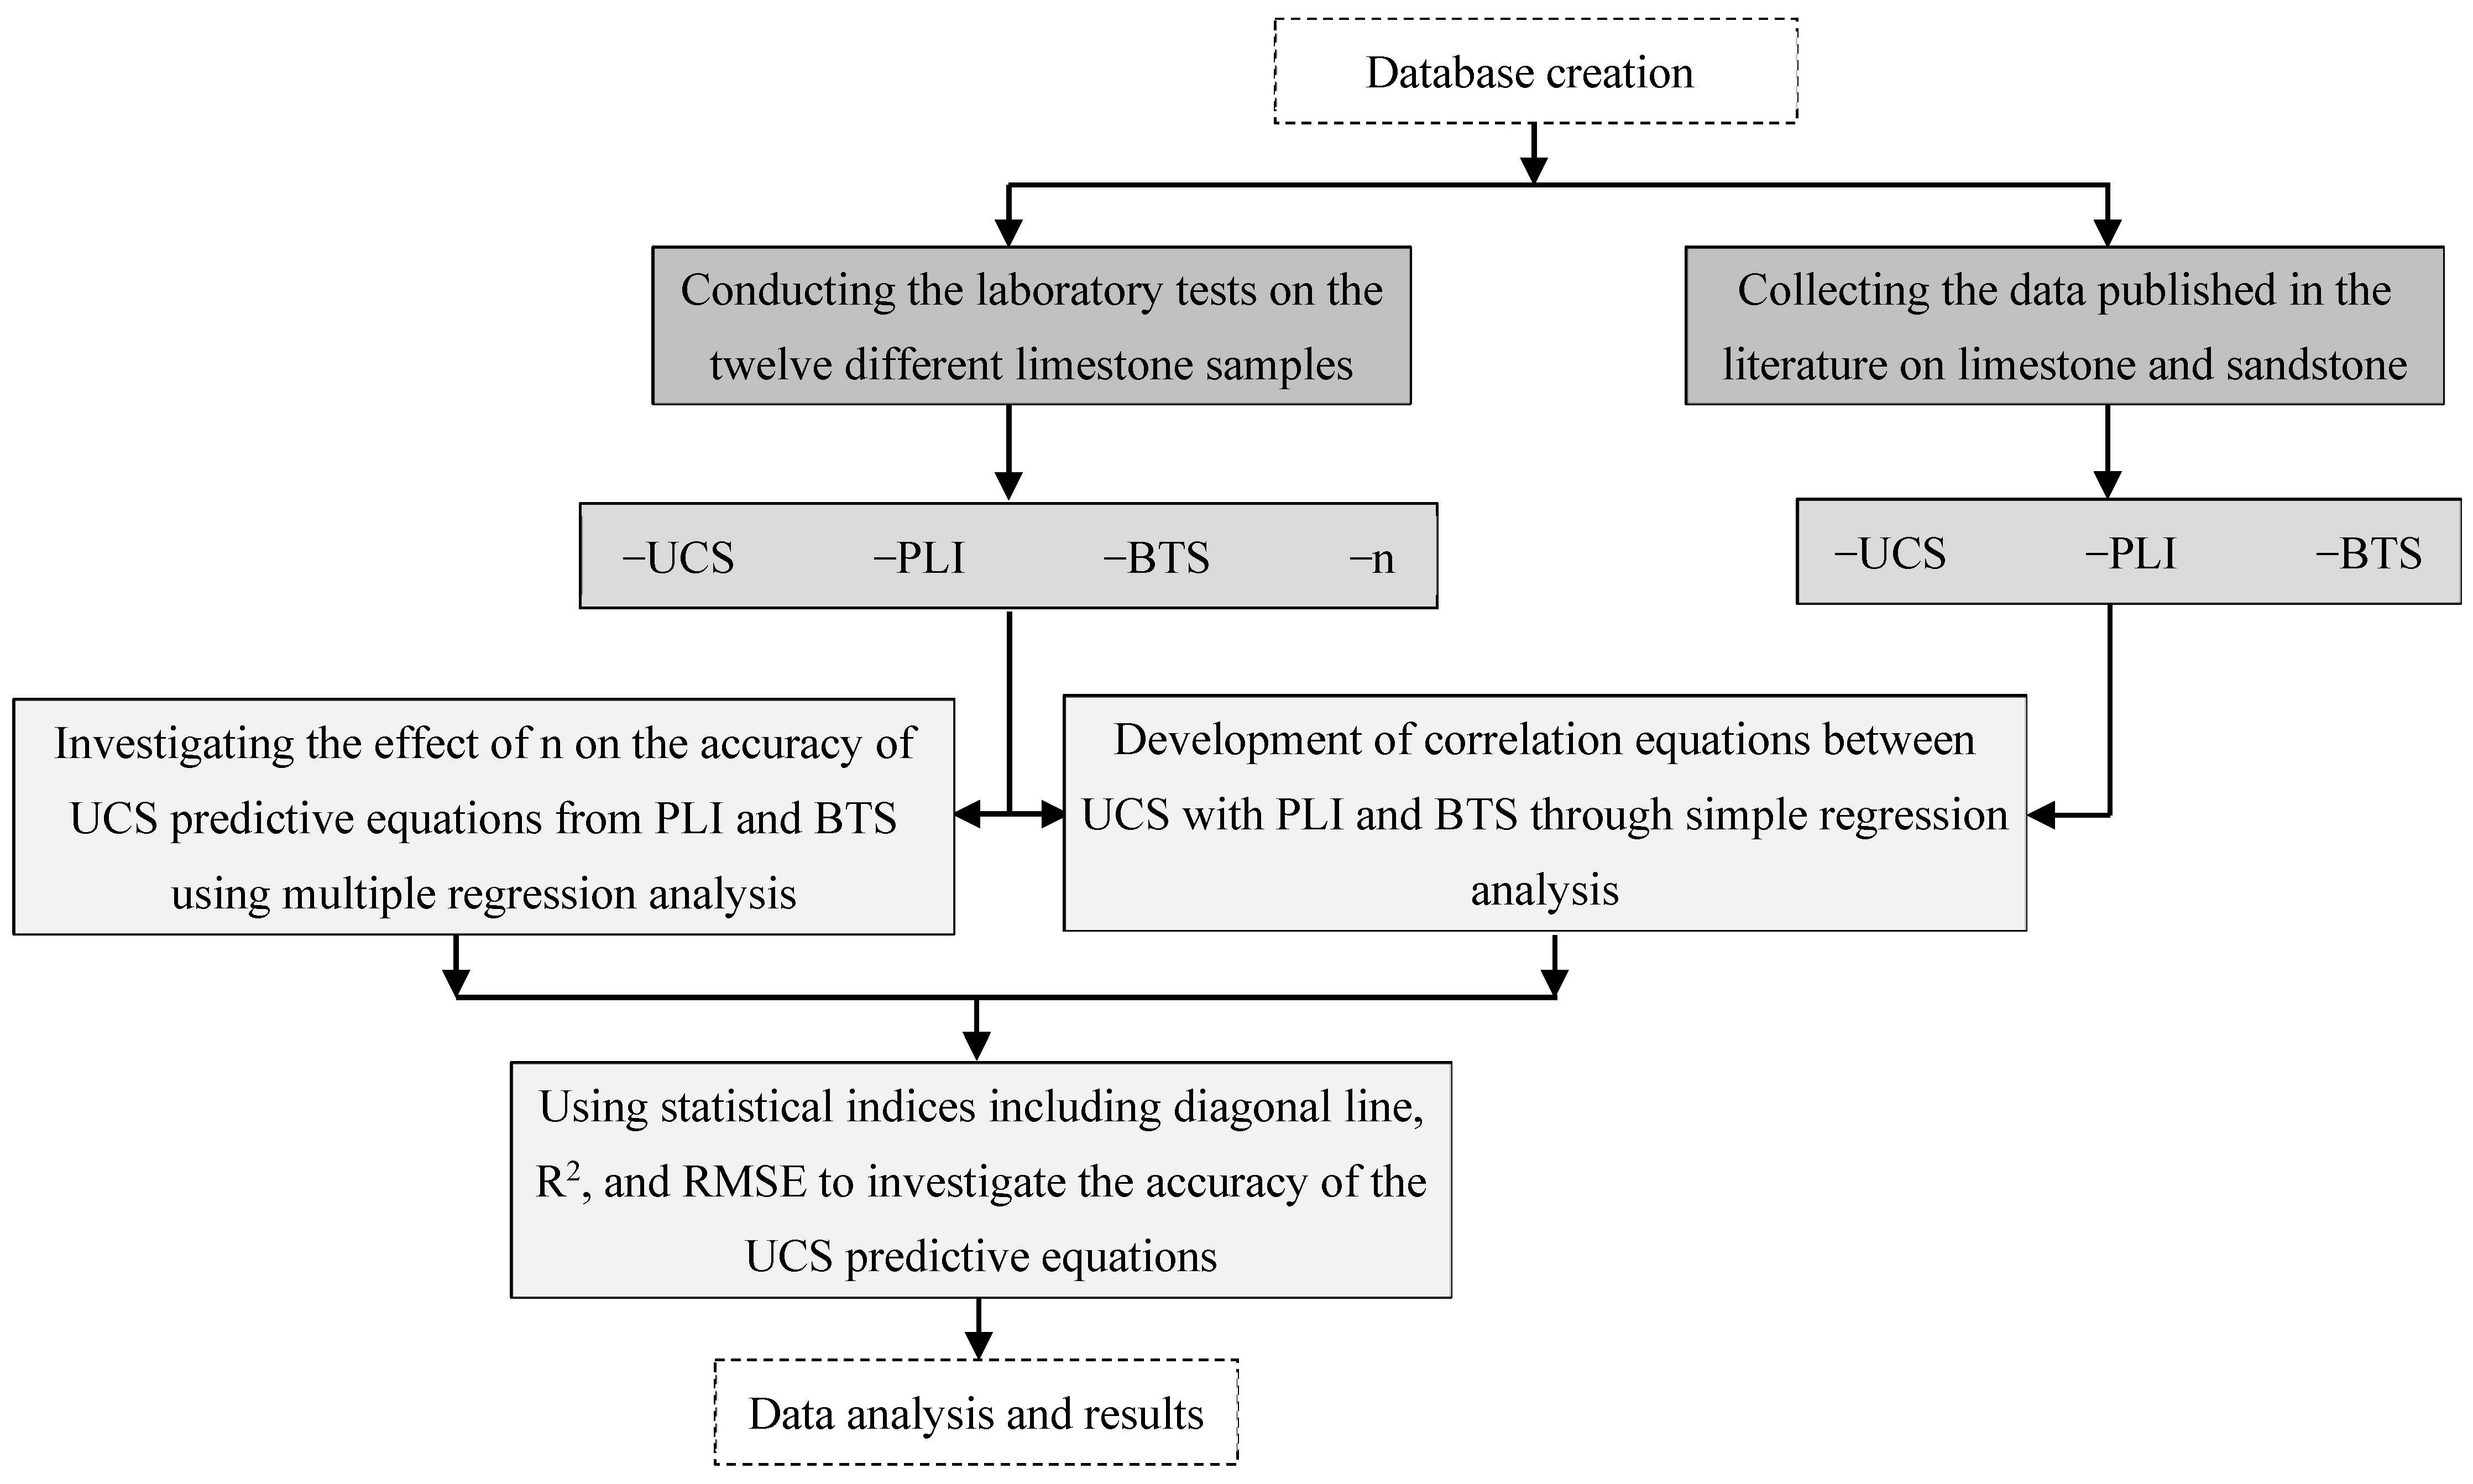
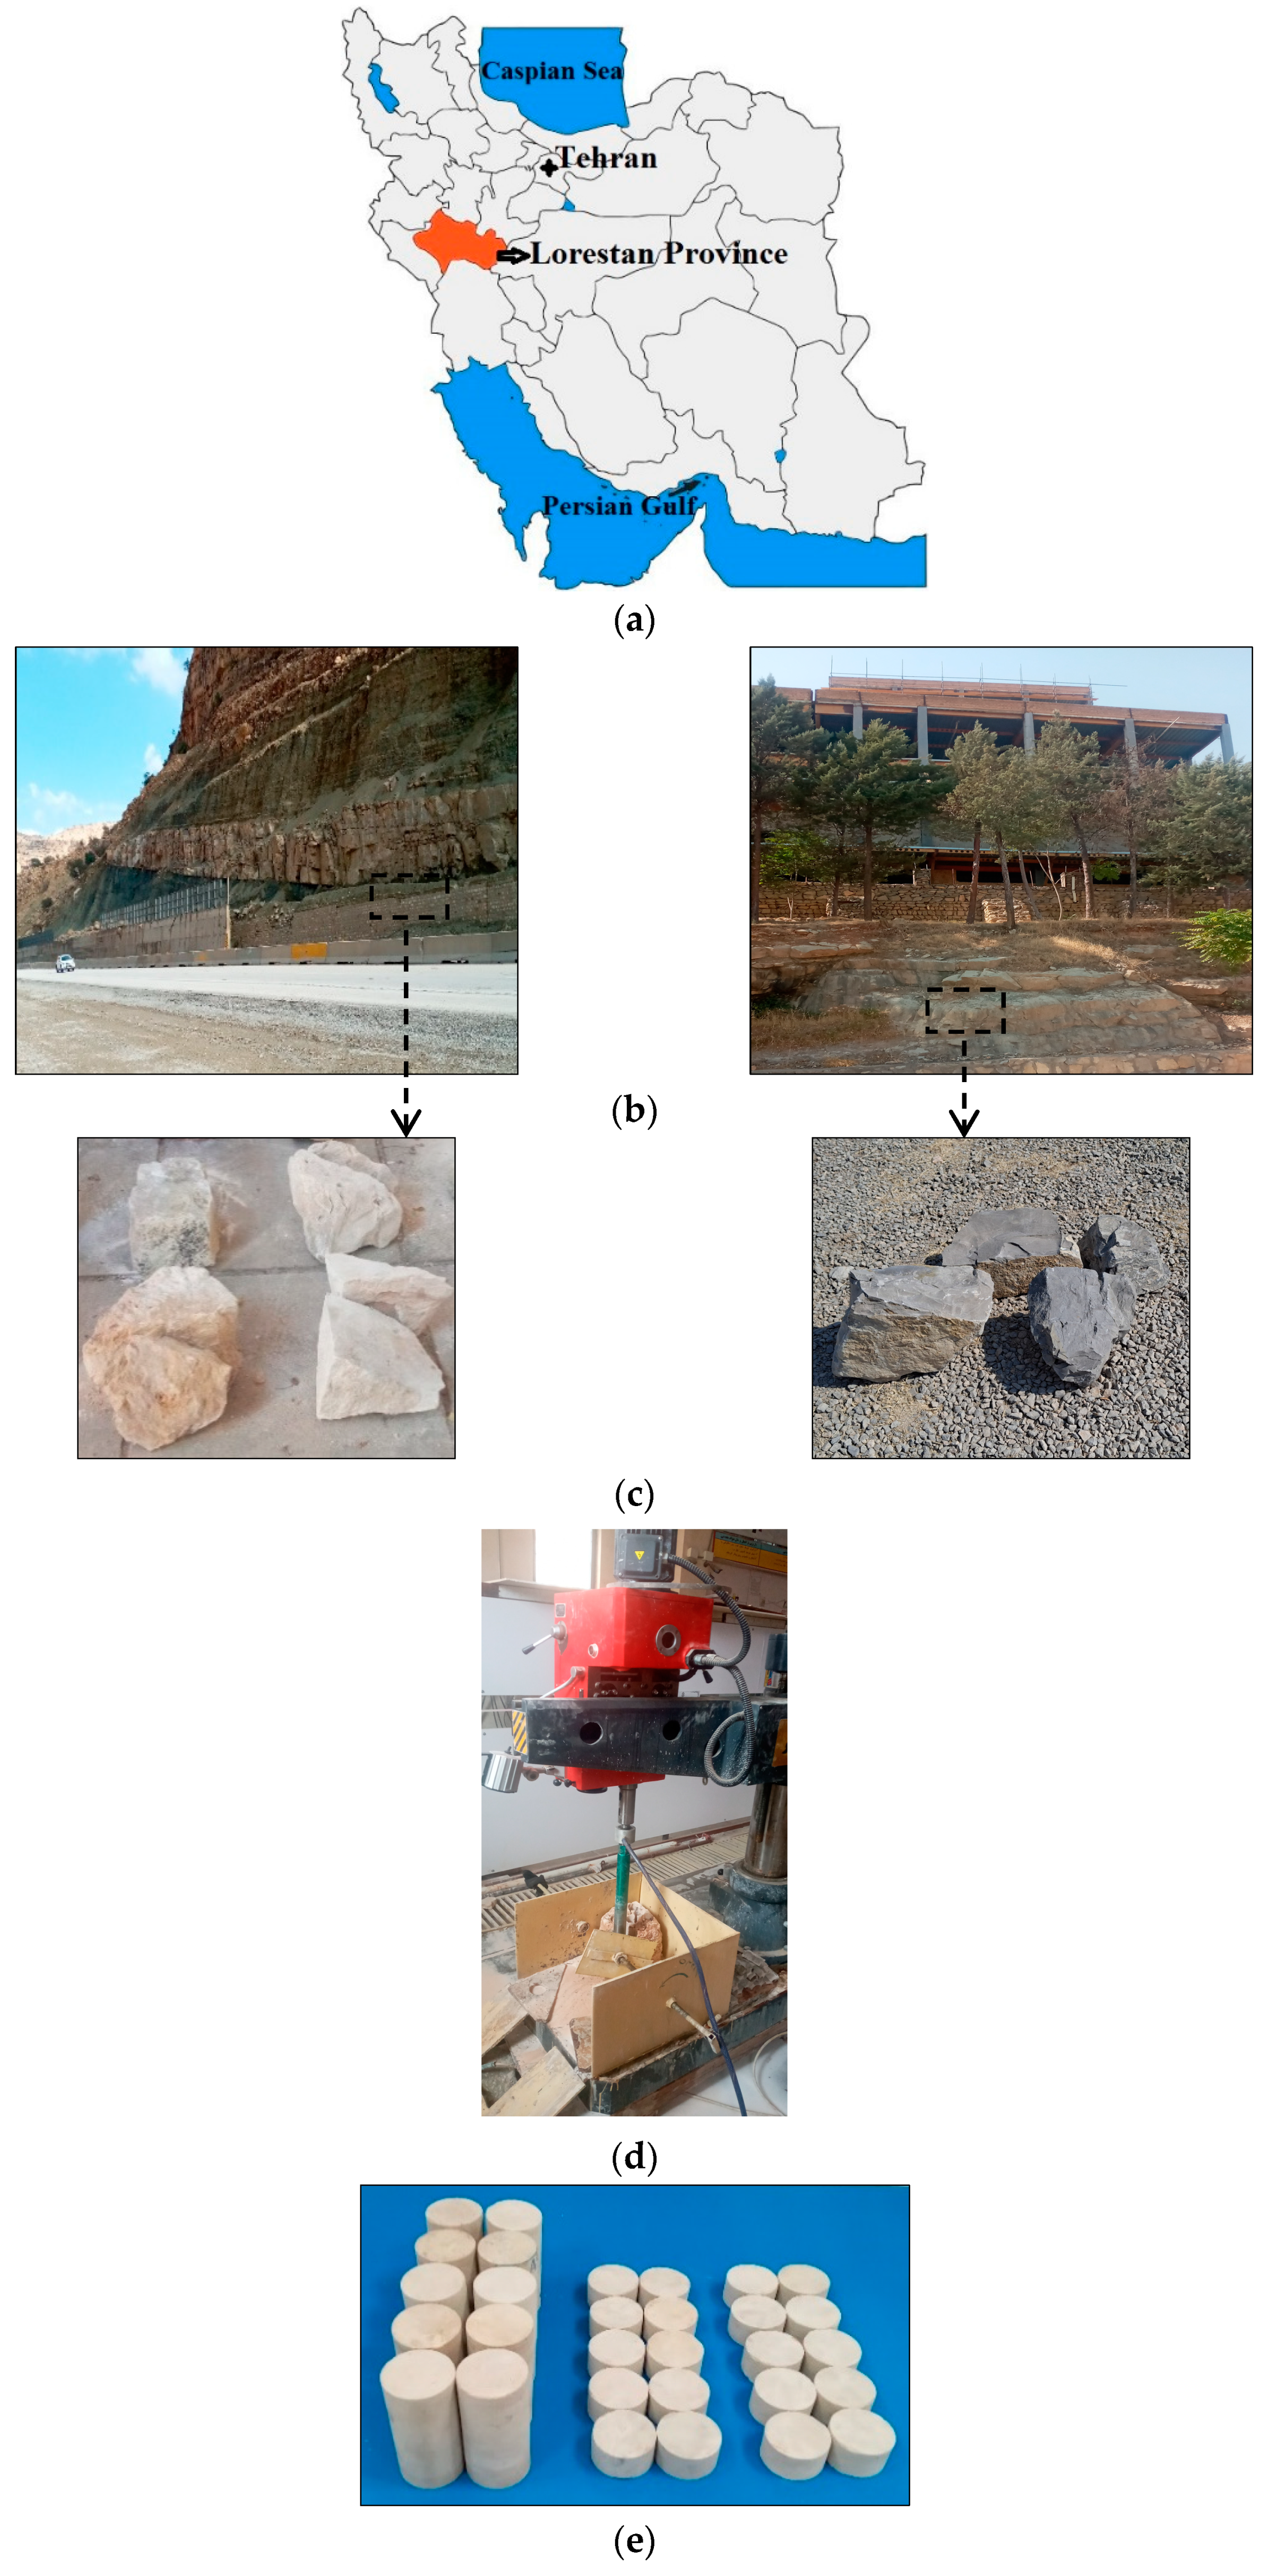
2. Materials and Methods
3. Database
3.1. Data Obtained from the Present Study
3.2. Data Collected from Previous Studies
4. Data Analysis and Results
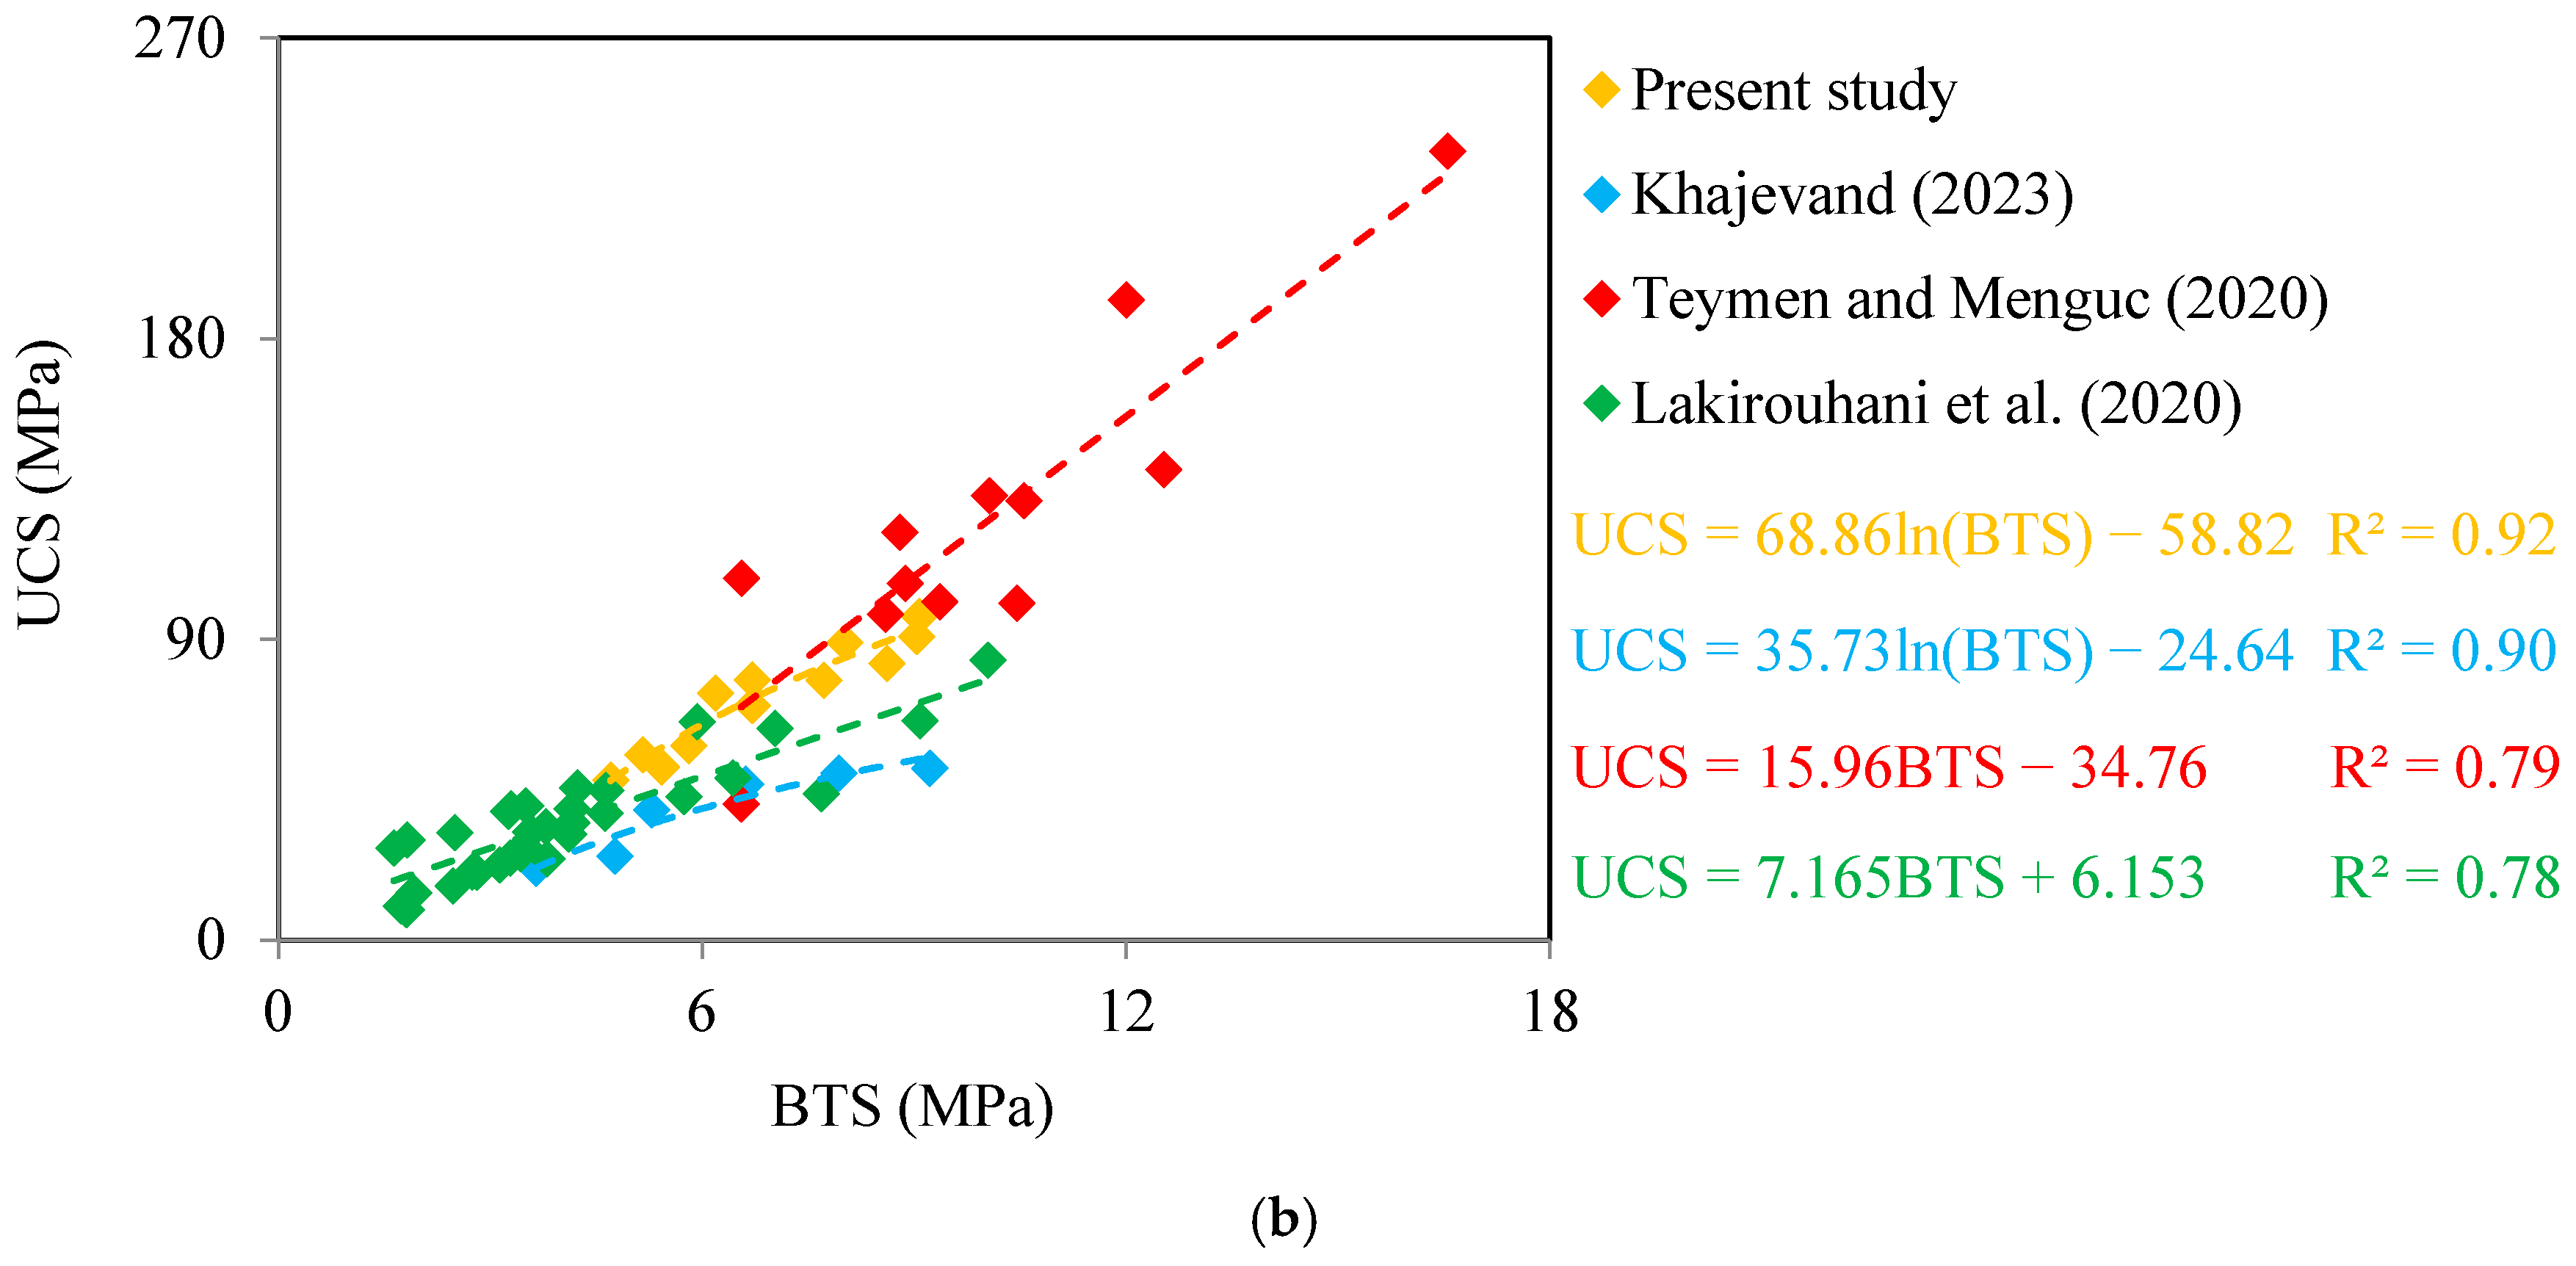
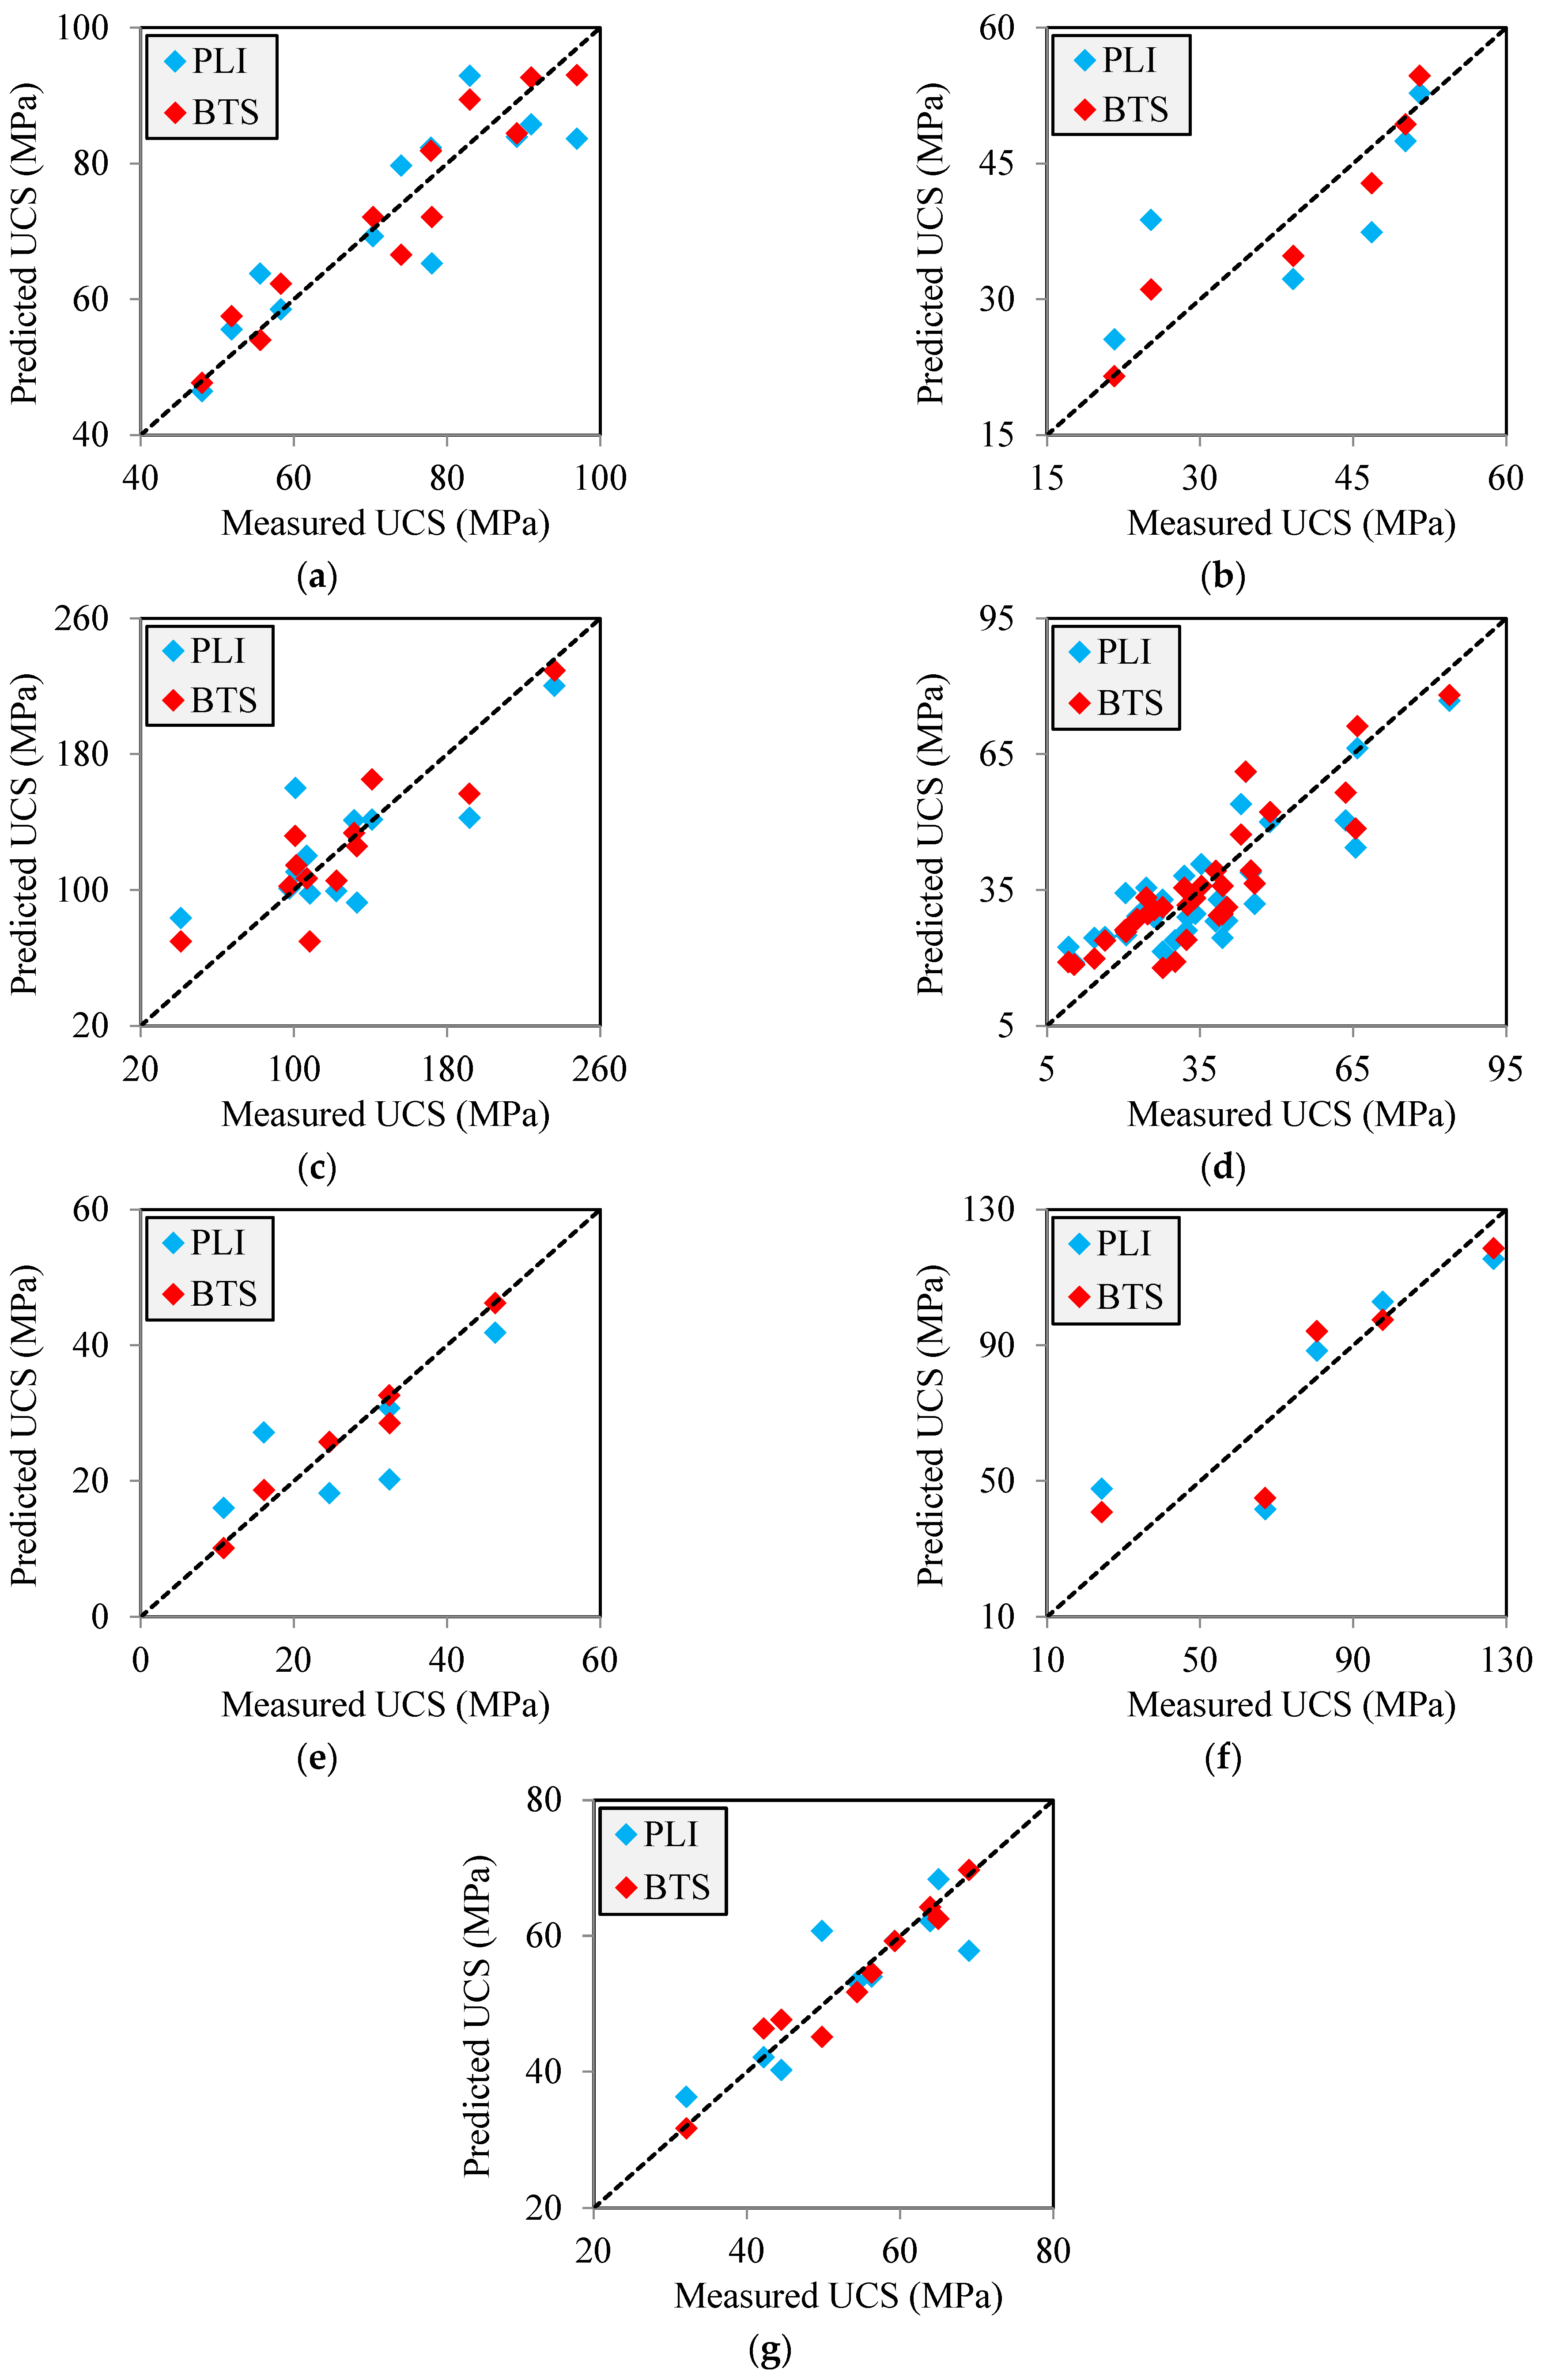
4.1. Comparing the Accuracy of PLI and BTS in Predicting the UCS
4.2. Effect of n on the Accuracy of UCS Predictive Equations
5. Conclusions
- -
- The results of simple regression analyses showed that the BTS provides a more accurate prediction of the rock UCS than the PLI. This was verified by comparing the statistical indices (including diagonal line (y = x), coefficient of determination (R2), and root mean square error (RMSE)) obtained for PLI and BTS-based correlation equations.
- -
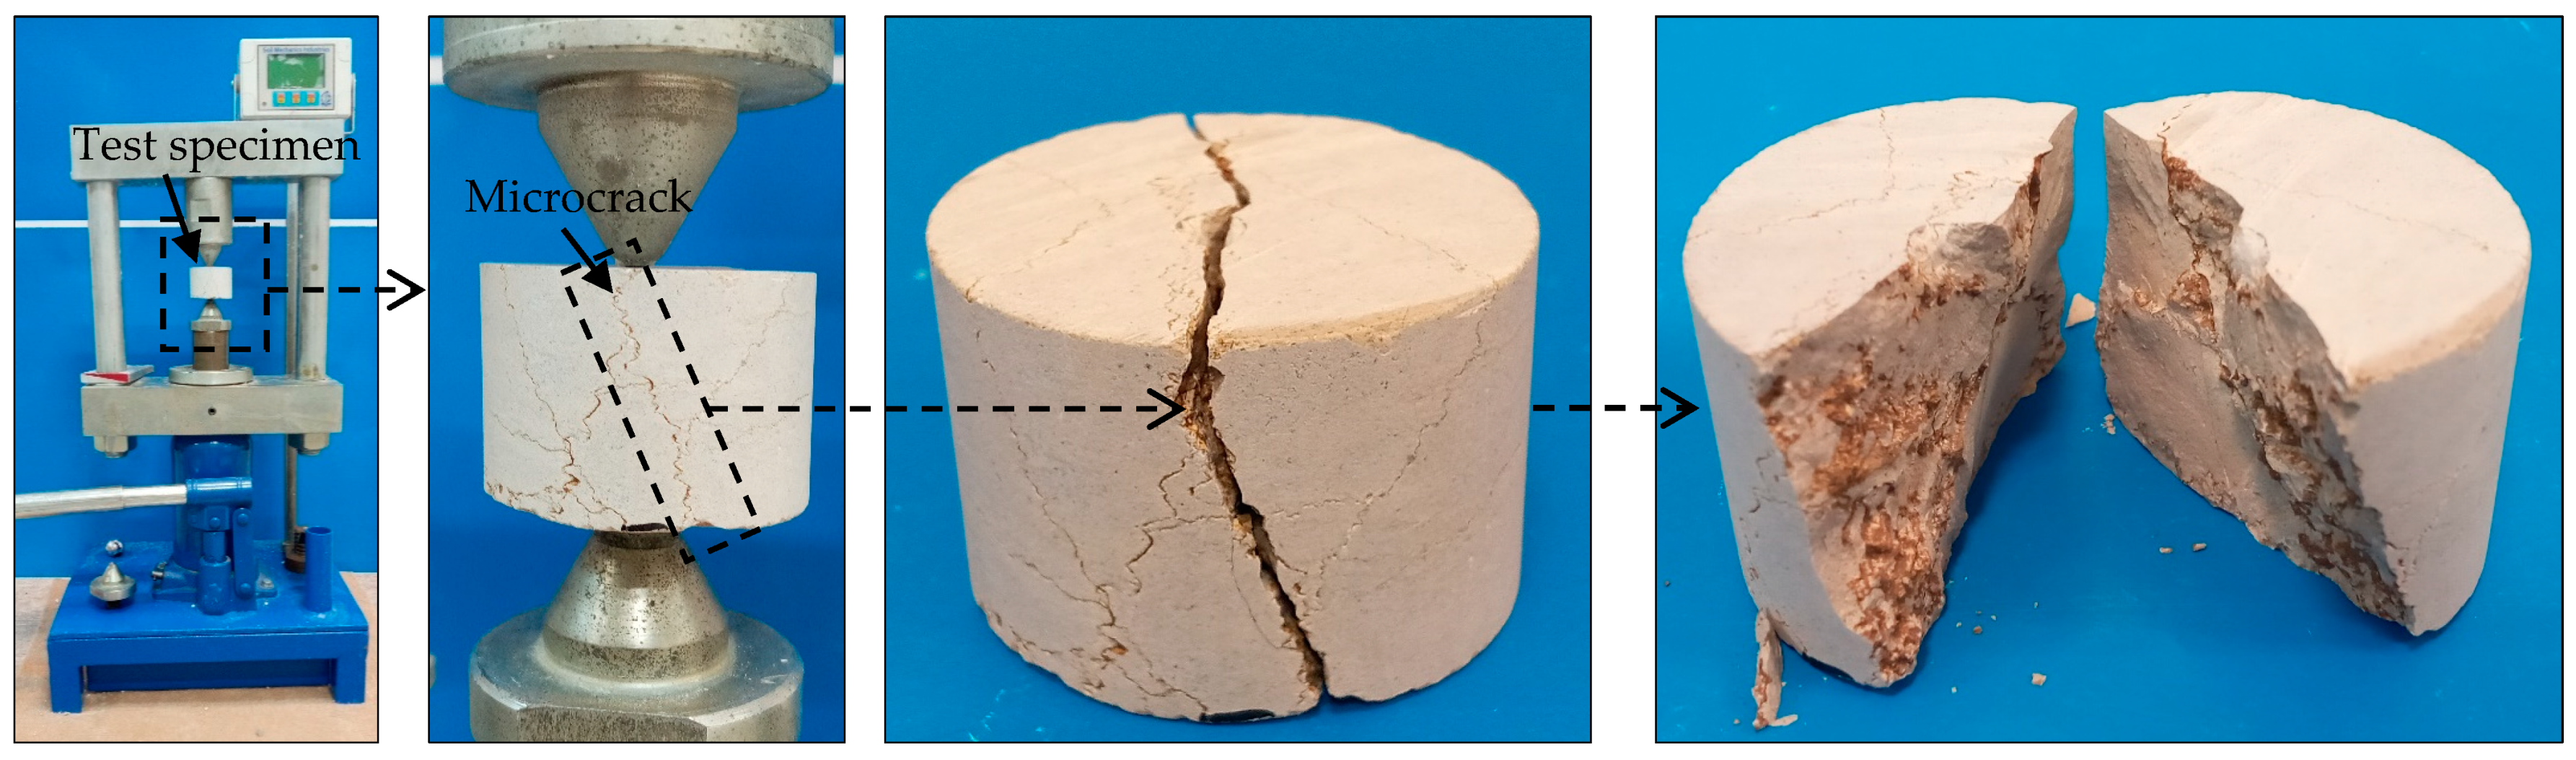
- The lower accuracy of PLI compared to the BTS in the indirect assessment of UCS is due to nature of the PLI device and its loading system on the rock specimen. The results showed that the specimen heterogeneity (caused by the presence of pores or microcracks) strongly affects the accuracy of PLI measurements and thus the performance of the UCS prediction equation.
- -
- Based on the comparison of the diagonal line results and the R2 and RMSE values obtained from the simple and multiple regression analyses, the n has a significant effect on the predictive accuracy of the UCS from the PLI and BTS-based correlation equations.
- -
- Considering the same size of the rock specimen for PLI and BTS tests, it is recommended that BTS measurements be preferred. As a result, a more accurate evaluation of the rock UCS can be obtained in the preliminary stages of the site investigation of a geotechnical project such as a tunnel, concrete dam or rock slope. A more accurate evaluation of the UCS will lead to a more appropriate design of the geotechnical project, thereby increasing its long-term success.
- -
- As an important point, it is necessary for researchers to carry out more studies in the future to investigate the accuracy of PLI and BTS for other types of rock.
Author Contributions
Funding
Institutional Review Board Statement
Informed Consent Statement
Data Availability Statement
Acknowledgments
Conflicts of Interest
References
- Heidari, M.; Khanlari, G.R.; Torabi-Kaveh, M.; Karegarian, S. Predicting the uniaxial compressive and tensile strengths of gypsum rock by point load testing. Rock Mech. Rock Eng. 2012, 45, 265–273. [Google Scholar] [CrossRef]
- Sadeghi, E.; Nikudel, M.R.; Khamehchiyan, M.; Kavussi, A. Estimation of unconfined compressive strength (UCS) of carbonate rocks by index mechanical tests and specimen size properties: Central Alborz Zone of Iran. Rock Mech. Rock Eng. 2022, 55, 125–145. [Google Scholar] [CrossRef]
- Fereidooni, D.; Karimi, Z.; Ghasemi, F. Non-destructive test-based assessment of uniaxial compressive strength and elasticity modulus of intact carbonate rocks using stacking ensemble models. PLoS ONE 2024, 19, e0302944. [Google Scholar] [CrossRef] [PubMed]
- ISRM. Rock characterization, testing and monitoring. In ISRM Suggested Methods; Brown, E.T., Ed.; Pergamon Press: New York, NY, USA, 1981. [Google Scholar]
- ASTM D7012–14; Standard Test Methods for Compressive Strength and Elastic Moduli of Intact Rock Core Specimens under Varying States of Stress and Temperatures. ASTM International: West Conshohocken, PA, USA, 2014.
- Ulusay, R.; Tureli, K.; Ider, M.H. Prediction of engineering properties of a selected litharenite sandstone from its petrographic characteristics using correlation and multivariate statistical techniques. Eng. Geol. 1994, 37, 135–157. [Google Scholar] [CrossRef]
- Khajevand, R. Evaluating the influence of petrographic and textural characteristics on geotechnical properties of some carbonate rock samples by empirical equations. Innov. Infrastruct. Solut. 2021, 6, 113. [Google Scholar] [CrossRef]
- Chen, Z.-L.; Shi, H.-Z.; Xiong, C.; He, W.-H.; Wang, H.-Z.; Wang, B.; Dubinya, N.; Ge, K.-Q. Effects of mineralogical composition on uniaxial compressive strengths of sedimentary rocks. Pet. Sci. 2023, 20, 3062–3073. [Google Scholar] [CrossRef]
- Ajalloeian, R.; Jamshidi, A.; Khorasani, R. Evaluating the effects of mineral grain size and mineralogical composition on the correlated equations between strength and Schmidt hardness of granitic rocks. Geotech. Geol. Eng. 2024, 42, 675–685. [Google Scholar] [CrossRef]
- Jamshidi, A.; Zamanian, H.; Zarei Sahamieh, R. The effect of density and porosity on the correlation between uniaxial compressive strength and P-wave velocity. Rock Mech. Rock Eng. 2018, 51, 1279–1286. [Google Scholar] [CrossRef]
- Verma, R.K.; Singh, R.; Kumar, V.; Singh, T.N.; Umrao, R.K.; Mishra, P.; Sharma, P. Statistical estimation of uniaxial compressive strength in geotechnical projects using regression analysis: A comparative study. Int. J. Geomech. 2024, 24, 05024009. [Google Scholar] [CrossRef]
- Rajabzadeh, M.A.; Moosavinasab, Z.; Rakhshandehroo, G. Effects of rock classes and porosity on the relation between uniaxial compressive strength and some rock properties for carbonate rocks. Rock Mech. Rock Eng. 2012, 45, 113–122. [Google Scholar] [CrossRef]
- Valido, J.; Caceres, J.M.; Sousa, L. Mechanical properties of ignimbrites of Tenerife Island employed as building stone and their correlation with some physical properties. J. Build. Eng. 2024, 82, 108222. [Google Scholar] [CrossRef]
- Cobanoglu, I.; Celik, S.B. Estimation of uniaxial compressive strength from point load strength, Schmidt hardness and P-wave velocity. Bull. Eng. Geol. Environ. 2008, 67, 491–498. [Google Scholar] [CrossRef]
- Akbay, D. Investigating the accuracy of specimen shape for point load index test in predicting the uniaxial compressive strength for rocks using regression analysis and machine learning. Min. Metall. Explor. 2023, 40, 2107–2115. [Google Scholar]
- Karaman, K.; Cihangir, F.; Ercikdi, B.; Kesimal, A.; Demirel, S. Utilization of the Brazilian test for estimating the uniaxial compressive strength and shear strength parameters. J. South. Afr. Inst. Min. Metall. 2015, 115, 185–192. [Google Scholar] [CrossRef]
- Iyare, U.C.; Blake, O.O.; Ramsook, R. Estimating the uniaxial compressive strength of argillites using Brazilian tensile strength, ultrasonic wave velocities, and elastic properties. Rock Mech. Rock Eng. 2021, 54, 2067–2078. [Google Scholar] [CrossRef]
- Khajevand, R. Estimating geotechnical properties of sedimentary rocks based on physical parameters and ultrasonic P-Wave velocity using statistical methods and soft computing approaches. Iran. J. Sci. Technol. Trans. Civ. Eng. 2023, 47, 3785–3809. [Google Scholar] [CrossRef]
- Teymen, A. Statistical models for estimating the uniaxial compressive strength and elastic modulus of rocks from different hardness test methods. Heliyon 2021, 7, e06891. [Google Scholar] [CrossRef]
- Ahmed, W.; Ahmad, N.; Janjuhah, H.T.; Islam, I.; Sajid, M.; Kontakiotis, G. The evaluation of non-destructive tests for the strength and physical properties of granite, marble, and sandstone: A case study from North Pakistan. Quaternary 2023, 6, 4. [Google Scholar] [CrossRef]
- Jalali, S.H.; Heidari, M.; Zarrinshoja, M.; Mohseni, N. Predicting of uniaxial compressive strength of some igneous and metamorphic rocks by block punch index and cylindrical punch index test. Int. J. Rock Mech. Min. Sci. 2019, 119, 72–80. [Google Scholar] [CrossRef]
- Aladejare, A.E. Evaluation of empirical estimation of uniaxial compressive strength of rock using measurements from index and physical tests. J. Rock Mech. Geotech. 2020, 12, 256–268. [Google Scholar] [CrossRef]
- Koncagul, E.; Santi, P. Predicting the unconfined compressive strength of the Breathitt shale using slake durability, Shore hardness and rock structural properties. Int. J. Rock Mech. Min. Sci. 1999, 36, 139–153. [Google Scholar] [CrossRef]
- Kahraman, S.; Fener, M.; Gunaydin, O. Estimating the uniaxial compressive strength of pyroclastic rocks from the slake durability index. Bull. Eng. Geol. Environ. 2017, 76, 1107–1115. [Google Scholar] [CrossRef]
- Singh, V.K.; Singh, D.P. Correlation between point load index and compressive strength for quartzite rocks. Geotech. Geol. Eng. 1993, 11, 269–272. [Google Scholar] [CrossRef]
- Tugrul, A.; Zarif, I.H. Correlation of mineralogical and textural characteristics with engineering properties of selected granitic rocks from Turkey. Eng. Geol. 1999, 51, 303–317. [Google Scholar] [CrossRef]
- Lashkaripour, G.R. Predicting mechanical properties of mudrock from index parameters. Bull. Eng. Geol. Environ. 2002, 61, 73–77. [Google Scholar] [CrossRef]
- Tsiambaos, G.; Sabatakakis, N. Considerations on strength of intact sedimentary rocks. Eng. Geol. 2004, 72, 261–273. [Google Scholar] [CrossRef]
- Zorlu, K.; Ulusay, R.; Ocakoglu, F.; Gokceoglu, C.; Sonmez, H. Predicting intact rock properties of selected sandstones using petrographic thin-section data. Int. J. Rock Mech. Min. Sci. 2004, 41, 93–98. [Google Scholar] [CrossRef]
- Fener, M.; Kahraman, S.; Bilgil, A.; Gunaydin, O. A comparative evaluation of indirect methods to estimate the compressive strength of rocks. Rock Mech. Rock Eng. 2005, 38, 329–343. [Google Scholar] [CrossRef]
- Kahraman, S.; Gunaydin, O.; Fener, M. The effect of porosity on the relation between uniaxial compressive strength and point load index. Int. J. Rock Mech. Min. Sci. 2005, 42, 584–589. [Google Scholar] [CrossRef]
- Basu, A.; Aydin, A. Predicting uniaxial compressive strength by point load test: Significance of cone penetration. Rock Mech. Rock Eng. 2006, 39, 483–490. [Google Scholar] [CrossRef]
- Yilmaz, I.; Yuksek, G. Prediction of the strength and elasticity modulus of gypsum using multiple regression, ANN, and ANFIS models. Int. J. Rock. Mech. Min. Sci. 2009, 46, 803–810. [Google Scholar] [CrossRef]
- Mishra, D.A.; Basu, A. Use of the block punch test to predict the compressive and tensile strengths of rocks. Int. J. Rock Mech. Min. Sci. 2012, 51, 119–127. [Google Scholar] [CrossRef]
- Singh, T.N.; Kainthola, A.; Venkatesh, A. Correlation between point load index and uniaxial compressive strength for different rock types. Rock Mech. Rock Eng. 2012, 45, 259–264. [Google Scholar] [CrossRef]
- Palassi, M.; Emami, V. A new nail penetration test for estimation of rock strength. Int. J. Rock Mech. Min. Sci. 2014, 66, 124–127. [Google Scholar] [CrossRef]
- Azimian, A.; Ajalloeian, R. Empirical correlation of physical and mechanical properties of marly rocks with P wave velocity. Arab. J. Geosci. 2015, 8, 2069–2079. [Google Scholar] [CrossRef]
- Yin, J.H.; Wong, R.H.C.; Chau, K.T.; Lai, D.T.W.; Zhao, G.-S. Point load strength index of granitic irregular lumps: Size correction and correlation with uniaxial compressive strength. Tunn. Undergr. Space Technol. 2017, 70, 388–399. [Google Scholar] [CrossRef]
- Sadeghiamirshahidi, M.; Vitton, S.J. Mechanical properties of Michigan Basin’s gypsum before and after saturation. J. Rock Mech. Geotech. Eng. 2019, 11, 739–748. [Google Scholar]
- Rabat, A.; Cano, M.; Tomas, R.; Tamayo, A.E.; Alejano, L.R. Evaluation of strength and deformability of soft sedimentary rocks in dry and saturated conditions through needle penetration and point load tests: A comparative study. Rock Mech. Rock Eng. 2020, 53, 2707–2726. [Google Scholar] [CrossRef]
- Jamshidi, A. A comparative study of point load index test procedures in predicting the uniaxial compressive strength of sandstones. Rock Mech. Rock Eng. 2022, 55, 4507–4516. [Google Scholar] [CrossRef]
- Kong, F.; Xue, Y.; Shang, J.; Zhu, C.; Han, M.; Qu, Z.; Wang, B.; Yang, K. Predicting uniaxial compressive strength of building stone based on index tests: Correlations, validity, reliability, and unification. Constr. Build. Mater. 2024, 438, 137227. [Google Scholar] [CrossRef]
- Bell, F.G.; Lindsay, P. The petrographic and geomechanical properties of some sandstones from the newspaper member of the natal group near Durban, South Africa. Eng. Geol. 1999, 53, 57–81. [Google Scholar] [CrossRef]
- Gokceoglu, C.; Zorlu, K. A fuzzy model to predict the uniaxial compressive strength and the modulus of elasticity of a problematic rock. Eng. Appl. Artif. Intell. 2004, 17, 61–72. [Google Scholar] [CrossRef]
- Altindag, R.; Guney, A. Predicting the relationships between brittleness and mechanical properties (UCS, TS and SH) of rocks. Sci. Res. Essays. 2010, 5, 2107–2118. [Google Scholar]
- Farah, R. Correlations between Index Properties and Unconfined Compressive Strength of Weathered Ocala Limestone. Master’s Thesis, UNF College of Computing, Engineering and Construction, Jacksonville, FL, USA, 2011. [Google Scholar]
- Tahir, M.; Mohammad, N.; Din, F. Strength parameters and their inter-relationship for limestone of Cherat and Kohat areas of Khyber Pakhtunkhwa. J. Himal. Earth Sci. 2011, 44, 45–51. [Google Scholar]
- Kahraman, S.; Fener, M.; Kozman, E. Predicting the compressive and tensile strength of rocks from indentation hardness index. J. South. Afr. Inst. Min. Metall. 2012, 112, 331–339. [Google Scholar]
- Basu, A.; Mishra, D.A.; Roychowdhury, K. Rock failure modes under uniaxial compression, Brazilian, and point load tests. Bull. Eng. Geol. Environ. 2013, 72, 457–475. [Google Scholar] [CrossRef]
- Yesiloglu-Gultekin, N.; Gokceoglu, C.; Sezer, E.A. Prediction of uniaxial compressive strength of granitic rocks by various nonlinear tools and comparison of their performances. Int. J. Rock Mech. Min. Sci. 2013, 62, 13–122. [Google Scholar] [CrossRef]
- Kallu, R.; Roghanchi, P. Correlations between direct and indirect strength test methods. Int. J. Min. Sci. Technol. 2015, 25, 355–360. [Google Scholar] [CrossRef]
- Fereidooni, D. Determination of the geotechnical characteristics of hornfelsic rocks with a particular emphasis on the correlation between physical and mechanical properties. Rock Mech. Rock Eng. 2016, 49, 2595–2608. [Google Scholar] [CrossRef]
- Ribeiro, P.; Oliveira, M.; Nelson, P. Correlation between uniaxial compressive strength and Brazilian tensile strength using different rock types. In Proceedings of the XVIII Brazilian Conference on Soil Mechanics and Geotechnical Engineering, Belo Horizonte, Brazil, 19–22 October 2016. [Google Scholar]
- Masoumi, H.; Horne, J.; Timms, W. Establishing empirical relationships for the effects of water content on the mechanical behavior of Gosford sandstone. Rock Mech. Rock Eng. 2017, 50, 2235–2242. [Google Scholar] [CrossRef]
- Aliyu, M.M.; Shang, J.; Murphy, W.; Lawrence, J.A.; Collier, R.; Kong, F.; Zhao, Z. Assessing the uniaxial compressive strength of extremely hard cryptocrystalline flint. Int. J. Rock Mech. Min. Sci. 2019, 113, 310–321. [Google Scholar] [CrossRef]
- Teymen, A.; Menguc, E.C. Comparative evaluation of different statistical tools for the prediction of uniaxial compressive of rocks. Int. J. Min. Sci. Technol. 2020, 30, 785–797. [Google Scholar] [CrossRef]
- Arman, H. Correlation of uniaxial compressive strength with indirect tensile strength (Brazilian) and 2nd cycle of slake durability index for evaporitic rocks. Geotech. Geol. Eng. 2021, 39, 1583–1590. [Google Scholar] [CrossRef]
- Khajevand, R. Prediction of the uniaxial compressive strength of rocks by soft computing approaches. Geotech. Geol. Eng. 2023, 41, 3549–3574. [Google Scholar] [CrossRef]
- Jamshidi, A.; Abdi, Y.; Sarikhani, R. Prediction of brittleness indices of sandstones using a novel physico-mechanical parameter. Geotech. Geol. Eng. 2020, 38, 4651–4659. [Google Scholar] [CrossRef]
- Lakirouhani, A.; Asemi, F.; Zohdi, A.; Medzvieckas, J.; Kliukas, R. Physical parameters, tensile and compressive strength of dolomite rock samples: Influence of grain size. J. Civ. Eng. Manag. 2020, 26, 789–799. [Google Scholar] [CrossRef]
- Liu, Q.; Zhao, Y.; Zhang, X. Case study: Using the point load test to estimate rock strength of tunnels constructed by a tunnel boring machine. Bull. Eng. Geol. Environ. 2019, 78, 1727–1734. [Google Scholar] [CrossRef]
- Garrido, M.E.; Petnga, F.B.; Martínez-Ibanez, V.; JSeron, J.B.; Hidalgo-Signes, C.; Tomas, R. Predicting the uniaxial compressive strength of a limestone exposed to high temperatures by point load and leeb rebound hardness testing. Rock Mech. Rock Eng. 2022, 55, 1–17. [Google Scholar] [CrossRef]
- Ali, H.F.H. Utilizing several multivariable mathematical and M5P-tree models to predict uniaxial compressive strength of rocks. Multiscale Multidiscip. Model. Exp. Des. 2024, 7, 1737–1753. [Google Scholar] [CrossRef]
- Akin, M.; Ozsan, A. Evaluation of the long-term durability of yellow travertine using accelerated weathering tests. Bull. Eng. Geol. Environ. 2011, 70, 101–114. [Google Scholar] [CrossRef]
- Zalooli, A.; Khamehchiyan, M.; Nikudel, M.R. The quantification of total and effective porosities in travertines using PIA and saturation-buoyancy methods and the implication for strength and durability. Bull. Eng. Geol. Environ. 2018, 77, 1739–1751. [Google Scholar] [CrossRef]
- Mishra, D.A.; Basu, A. Estimation of uniaxial compressive strength of rock materials by index tests using regression analysis and fuzzy inference system. Eng. Geol. 2013, 160, 54–68. [Google Scholar] [CrossRef]
- Azimian, A. Application of statistical methods for predicting uniaxial compressive strength of limestone rocks using nondestructive tests. Acta Geotech. 2017, 12, 321–333. [Google Scholar] [CrossRef]
- Farhadian, A.; Ghasemi, E.; Hoseinie, S.H.; Bagherpour, R. Prediction of rock abrasivity index (RAI) and uniaxial compressive strength (UCS) of granite building stones using nondestructive tests. Geotech. Geol. Eng. 2022, 40, 3343–3356. [Google Scholar] [CrossRef]
- Kamani, M.; Ajalloeian, R. Evaluation of engineering properties of some carbonate rocks trough corrected texture coefficient. Geotech. Geol. Eng. 2019, 37, 599–614. [Google Scholar] [CrossRef]
- Diamantis, K.; Fereidooni, D.; Khajevand, R.; Migiros, G. Effect of textural characteristics on engineering properties of some sedimentary rocks. J. Cent. South Univ. 2021, 28, 926–938. [Google Scholar] [CrossRef]


| Reference | Rock Type | Predictive Equation | R2 |
|---|---|---|---|
| Ulusay et al. [6] | Sandstone | UCS = 19PLI + 12.7 | 0.81 |
| Akbay [15] | Limestone, Marble | UCS = 13.71PLI + 5.51 | 0.71 |
| Singh and Singh [25] | Quartzite | UCS = 23.37PLI | 0.96 |
| Tugrul and Zarif [26] | Granitic rocks | UCS = 15.25PLI | 0.96 |
| Lashkaripour [27] | Mudrock | UCS = 21.4PLI | 0.85 |
| Tsiambaos and Sabatakakis [28] | Different rock types | UCS = 7.3PLI1.71 | 0.82 |
| Zorlu et al. [29] | Sandstone | UCS = 10.3PLI + 28.1 | 0.76 |
| Fener et al. [30] | Different rock types | UCS = 9.08PLI + 39.3 | 0.72 |
| Kahraman et al. [31] | Different rock types | UCS = 10.9PLI + 27.4 | 0.61 |
| Basu and Aydin [32] | Granite | UCS = 21PLI | 0.93 |
| Yilmaz and Yuksek [33] | Gypsum | UCS = 10.5PLI − 3.97 | 0.57 |
| Mishra and Basu [34] | Sandstone | UCS = 13.0PLI − 5.19 | 0.84 |
| Singh et al. [35] | Limestone | UCS = 22.3PLI | 0.68 |
| Palassi and Emami [36] | Travertine, Marble | UCS = 20.1PLI − 17.1 | 0.80 |
| Azimian and Ajalloeian [37] | Marl | UCS = 56.94 ln(PLI) − 1.66 | 0.93 |
| Yin et al. [38] | Granitic rocks | UCS = 22.27PLI | 0.82 |
| Sadeghiamirshahidi and Vitton [39] | Gypsum | UCS = 6.58PLI | 0.91 |
| Rabat et al. [40] | Siltstone | UCS = 14.26PLI | 0.98 |
| Jamshidi [41] | Sandstone | UCS = 4.94PLI + 33.03 | 0.85 |
| Kong et al. [42] | Different rock types | UCS = 16.19PLI | 0.90 |
| Reference | Rock Type | Predictive Equation | R2 |
|---|---|---|---|
| Sadeghi et al. [2] | Carbonate rocks | UCS = 7.26BTS | 0.95 |
| Karman et al. [16] | Different rock types | UCS = 4.87BTS + 24.30 | 0.90 |
| Iyare et al. [17] | Argillite | UCS = 5.31BTS1.06 | 0.87 |
| Tugrul and Zarif [26] | Granite, Granodiorite | UCS = 6.67BTS + 0.73 | 0.92 |
| Bell and Lindsay [43] | Sandstone | UCS = 6.71BTS + 36.0 | 0.61 |
| Gokceoglu and Zorlu [44] | Graywacke | UCS = 6.8BTS + 13.5 | 0.65 |
| Altindag and Guney [45] | Limestone, Granite, Marble | UCS = 2.38BTS1.073 | 0.79 |
| Farah [46] | Sedimentary rocks | UCS = 7.86BTS − 447.63 | 0.92 |
| Tahir et al. [47] | Sedimentary rocks | UCS = 7.53BTS | 0.45 |
| Kahraman et al. [48] | Different rock types | UCS = 10.61BTS | 0.54 |
| Basu et al. [49] | Sandstone | UCS = 10.53BTS − 10.23 | 0.83 |
| Yesiloglu-Gultekin et al. [50] | Granite, Granodiorite | UCS = 7.22BTS + 40.08 | 0.61 |
| Kallu and Roghanchi [51] | Igneous rocks | UCS = 6.75BTS1.08 | 0.80 |
| Fereidooni [52] | Hornfels schist | UCS = 10.03BTS + 55.19 | 0.92 |
| Ribeiro et al. [53] | Sedimentary rocks | UCS = 13.70BTS | 0.67 |
| Masoumi et al. [54] | Sandstone | UCS = 9.29BTS + 3.91 | 0.68 |
| Aliyu et al. [55] | Flint | UCS = 10.4BTS + 18.2 | 0.63 |
| Teymen and Menguc [56] | Andesite, Limestone, Marble | UCS = 7.73BTS1.197 | 0.90 |
| Arman [57] | Gypsum | UCS = 4.233BTS + 13.64 | 0.53 |
| Khajevand [58] | Limestone | UCS = 40.09ln(BTS) − 36.14 | 0.94 |
| Test | Specimen Shape | Specimen Size | Specimen Status | Specimen Number | Source | ||
|---|---|---|---|---|---|---|---|
| Diameter (mm) | Length (mm) | D to L | |||||
| UCS | Cylindrical core | 44 | 88 | 2.0 | Dry | 5 | ISRM [4] |
| PLI | Cylindrical core | 44 | 30 | ~1.5 | Dry | 5 | ISRM [4] |
| BTS | Cylindrical core | 44 | 30 | ~1.5 | Dry | 5 | ISRM [4] |
| n | Cylindrical core | 44 | 30 | ~1.5 | Dry | 5 | ISRM [4] |
| Sample Code | UCS (MPa) | PLI (MPa) | BTS (MPa) | n (%) |
|---|---|---|---|---|
| Limestone 1 | 78.04 (3.72) 1 | 4.59 (0.39) | 6.70 (0.29) | 3.05 (0.20) |
| Limestone 2 | 51.90 (3.24) | 3.75 (0.38) | 5.42 (0.25) | 7.41 (0.17) |
| Limestone 3 | 74.00 (2.71) | 5.63 (0.36) | 6.18 (0.20) | 5.01 (0.19) |
| Limestone 4 | 58.33 (4.35) | 4.02 (0.43) | 5.81 (0.31) | 6.71 (0.24) |
| Limestone 5 | 77.90 (2.50) | 5.80 (0.37) | 7.72 (0.22) | 2.24 (0.18) |
| Limestone 6 | 48.00 (3.48) | 2.82 (0.38) | 4.70 (0.26) | 9.12 (0.21) |
| Limestone 7 | 89.12 (4.70) | 5.90 (0.45) | 8.01 (0.34) | 1.78 (0.23) |
| Limestone 8 | 55.60 (5.11) | 4.47 (0.48) | 5.15 (0.35) | 7.94 (0.19) |
| Limestone 9 | 91.00 (3.81) | 6.01 (0.41) | 9.03 (0.32) | 1.30 (0.25) |
| Limestone 10 | 96.97 (2.98) | 5.88 (0.37) | 9.07 (0.24) | 1.47 (0.13) |
| Limestone 11 | 70.35 (3.77) | 4.90 (0.39) | 6.70 (0.26) | 3.30 (0.24) |
| Limestone 12 | 82.96 (4.02) | 6.43 (0.40) | 8.61 (0.29) | 2.07 (0.17) |
| Rock Type | UCS (MPa) | PLI (MPa) | BTS (MPa) |
|---|---|---|---|
| Limestone | 50.13 | 10.32 | 50.13 |
| Limestone | 25.19 | 8.20 | 25.19 |
| Limestone | 51.51 | 11.86 | 51.51 |
| Limestone | 39.12 | 6.90 | 39.12 |
| Limestone | 21.60 | 5.79 | 21.60 |
| Limestone | 46.82 | 7.91 | 46.82 |
| Sandstone | 46.29 | 8.85 | 6.67 |
| Sandstone | 32.46 | 6.54 | 5.38 |
| Sandstone | 16.09 | 5.80 | 3.81 |
| Sandstone | 32.51 | 4.36 | 4.95 |
| Sandstone | 24.65 | 3.94 | 4.65 |
| Sandstone | 10.82 | 3.49 | 2.61 |
| Rock Type | UCS (MPa) | PLI (MPa) | BTS (MPa) |
|---|---|---|---|
| Limestone | 140.92 | 5.89 | 12.53 |
| Limestone | 236.19 | 9.69 | 16.55 |
| Limestone | 191.74 | 5.94 | 12.00 |
| Limestone | 97.62 | 3.93 | 8.59 |
| Limestone | 40.89 | 3.09 | 6.55 |
| Limestone | 108.40 | 3.79 | 6.55 |
| Limestone | 133.00 | 3.53 | 10.06 |
| Limestone | 100.80 | 6.79 | 10.45 |
| Limestone | 101.35 | 4.40 | 9.36 |
| Limestone | 131.58 | 5.87 | 10.55 |
| Limestone | 122.20 | 3.86 | 8.79 |
| Limestone | 106.75 | 4.86 | 8.87 |
| Sandstone | 97.64 | 5.84 | 8.56 |
| Sandstone | 24.29 | 2.81 | 3.98 |
| Sandstone | 80.48 | 5.05 | 8.29 |
| Sandstone | 66.98 | 2.48 | 4.32 |
| Sandstone | 126.60 | 6.54 | 10.27 |
| Rock Type | UCS (MPa) | PLI (MPa) | BTS (MPa) |
|---|---|---|---|
| Sandstone | 54.4 | 4.0 | 6.3 |
| Sandstone | 65.0 | 6.1 | 7.0 |
| Sandstone | 63.9 | 5.2 | 7.1 |
| Sandstone | 42.2 | 2.7 | 5.9 |
| Sandstone | 56.3 | 4.1 | 6.5 |
| Sandstone | 44.5 | 2.5 | 6.0 |
| Sandstone | 69.0 | 4.6 | 7.4 |
| Sandstone | 49.8 | 5.0 | 5.8 |
| Sandstone | 32.1 | 2.1 | 4.5 |
| Sandstone | 59.3 | 4.8 | 6.8 |
| Rock Type | UCS (MPa) | PLI (MPa) | BTS (MPa) |
|---|---|---|---|
| Limestone | 31.84 | 3.15 | 31.84 |
| Limestone | 27.62 | 2.57 | 27.62 |
| Limestone | 24.69 | 2.41 | 24.69 |
| Limestone | 22.65 | 2.17 | 22.65 |
| Limestone | 20.37 | 2.73 | 20.37 |
| Limestone | 16.38 | 1.67 | 16.38 |
| Limestone | 24.47 | 2.86 | 24.47 |
| Limestone | 25.97 | 2.15 | 25.97 |
| Limestone | 20.48 | 1.71 | 20.48 |
| Limestone | 14.26 | 1.65 | 14.26 |
| Limestone | 9.18 | 1.43 | 9.18 |
| Limestone | 10.30 | 1.05 | 10.30 |
| Limestone | 43.93 | 5.66 | 43.93 |
| Limestone | 32.31 | 1.83 | 32.31 |
| Limestone | 39.37 | 2.91 | 39.37 |
| Limestone | 30.10 | 1.59 | 30.10 |
| Limestone | 34.01 | 2.23 | 34.01 |
| Limestone | 32.52 | 2.15 | 32.52 |
| Limestone | 35.22 | 3.43 | 35.22 |
| Limestone | 27.67 | 1.32 | 27.67 |
| Limestone | 43.00 | 4.88 | 43.00 |
| Limestone | 44.93 | 3.23 | 44.93 |
| Limestone | 63.51 | 4.49 | 63.51 |
| Limestone | 48.70 | 4.45 | 48.70 |
| Limestone | 45.66 | 2.47 | 45.66 |
| Limestone | 39.38 | 1.65 | 39.38 |
| Limestone | 40.31 | 2.06 | 40.31 |
| Limestone | 38.65 | 2.57 | 38.65 |
| Limestone | 38.06 | 2.05 | 38.06 |
| Limestone | 83.81 | 7.38 | 83.81 |
| Limestone | 65.82 | 6.23 | 65.82 |
| Limestone | 65.45 | 3.83 | 65.45 |
| Equation No. | Equation Type | R2 | RMSE (MPa) | F Value | F Sig. | |
|---|---|---|---|---|---|---|
| Computed | Tabulated | |||||
| (5) | UCS = 27.08e0.193PLI | 0.82 | 7.25 | - | - | 0.000 |
| (6) | UCS = 77.53 + 2.91PLI − 4.50n | 0.92 | 4.28 | 54.96 | 4.26 | 0.000 |
| (7) | UCS = 68.86ln(BTS) − 58.82 | 0.92 | 4.49 | - | - | 0.000 |
| (8) | UCS = 54.96 + 4.54BTS − 3.17n | 0.94 | 3.96 | 64.84 | 4.26 | 0.000 |
Disclaimer/Publisher’s Note: The statements, opinions and data contained in all publications are solely those of the individual author(s) and contributor(s) and not of MDPI and/or the editor(s). MDPI and/or the editor(s) disclaim responsibility for any injury to people or property resulting from any ideas, methods, instructions or products referred to in the content. |
© 2024 by the authors. Licensee MDPI, Basel, Switzerland. This article is an open access article distributed under the terms and conditions of the Creative Commons Attribution (CC BY) license (https://creativecommons.org/licenses/by/4.0/).
Share and Cite
Jamshidi, A.; Sousa, L. Accuracy of Point Load Index and Brazilian Tensile Strength in Predicting the Uniaxial Compressive Strength of the Rocks: A Comparative Study. Materials 2024, 17, 5081. https://doi.org/10.3390/ma17205081
Jamshidi A, Sousa L. Accuracy of Point Load Index and Brazilian Tensile Strength in Predicting the Uniaxial Compressive Strength of the Rocks: A Comparative Study. Materials. 2024; 17(20):5081. https://doi.org/10.3390/ma17205081
Chicago/Turabian StyleJamshidi, Amin, and Luís Sousa. 2024. "Accuracy of Point Load Index and Brazilian Tensile Strength in Predicting the Uniaxial Compressive Strength of the Rocks: A Comparative Study" Materials 17, no. 20: 5081. https://doi.org/10.3390/ma17205081
APA StyleJamshidi, A., & Sousa, L. (2024). Accuracy of Point Load Index and Brazilian Tensile Strength in Predicting the Uniaxial Compressive Strength of the Rocks: A Comparative Study. Materials, 17(20), 5081. https://doi.org/10.3390/ma17205081