Article

Electrochemical Impedance Spectroscopy Study of Ceria- and Zirconia-Based Solid Electrolytes for Application Purposes in Fuel Cells and Gas Sensors

by
Małgorzata Dziubaniuk
*,
Robert Piech
and
Beata Paczosa-Bator
*
AGH University of Krakow, Faculty of Material Science and Ceramics, Department of Analytical Chemistry and Biochemistry, Al. Mickiewicza 30, 30-059 Krakow, Poland
*
Authors to whom correspondence should be addressed.
Materials 2024, 17(21), 5224; https://doi.org/10.3390/ma17215224
Submission received: 24 September 2024 / Revised: 23 October 2024 / Accepted: 24 October 2024 / Published: 26 October 2024
(This article belongs to the Section Smart Materials)

Abstract

:
In this study, the structural and electrochemical properties of commercial powders of the nominal compositions Ce0.8Gd0.2O1.9, Sc0.1Ce0.01Zr0.89O1.95, and Sc0.09Yb0.01Zr0.9O1.95 were investigated. The materials are prospective candidates to be used in electrochemical devices, i.e., gas sensors and fuel cells. Based on a comparison of the EIS spectra in different atmospheres (synthetic air, 3000 ppm NH3 in argon, 10% H2 in argon), the reactions on the three-phase boundaries were proposed, as well as the conduction mechanisms of the electrolytes were described. The Ce0.8Gd0.2O1.9 material is a mixed ionic–electronic conductor, which makes it suitable for anode material in fuel cells. Moreover, it exhibits an apparent and reversible response for ammonia, indicating the possibility of usage as an NH3 gas-sensing element. In zirconia-based materials, electrical conduction is realized by oxygen ion carriers. Among them, the most promising from an applicative point of view seems to be Sc0.09Yb0.01Zr0.9O1.95, showing a high, reversible reaction with hydrogen.

Graphical Abstract

1. Introduction

1.1. The Aim of the Research

Solid electrolytes are of great interest due to their practical uses as ionic conductive components in high-temperature electrochemical devices. Examples of devices containing elements based on solid electrolytes of fluorite structure are solid oxide fuel cells (SOFCs).
So far, many ceramics based on zirconia and ceria, differing in methods and conditions of preparation as well as doping, have been tested for their electrical properties in a wide range of temperatures in an atmosphere with controlled composition. Much less common are reports on electrochemical properties, which are based on measurements of changes in electrical properties under the influence of a changing atmosphere. The results analysis provides a basis for developing hypotheses about the reactions occurring in the material, as well as to determine the optimal operating conditions as elements of electrochemical devices.
The aim of this study was to compare the structural and electrochemical properties of three sintered electrolyte materials based on ceria and zirconia available commercially, paying special attention to their potential applications in novel electrochemical devices. For the first time, using the method of electrochemical impedance spectroscopy (EIS) based on electrical response and its reversibility, hypothetical models of processes occurring in sintered specimens with gaseous ammonia and hydrogen at elevated temperatures were proposed.

1.2. Literature Review

One of the first ceramic materials that was used as an electrolyte in SOFC was yttria-stabilized zirconia (YSZ). Zirconia (ZrO2) crystallizes in the monoclinic system in normal conditions. In such a state, the material exhibits poor mechanical stability and low electrical conductivity. At temperatures above 1150 °C, ZrO2 undergoes a phase transition to a tetragonal crystallographic system, and above 2370 °C, to a cubic phase [1]. The transition to cubic or tetragonal phase leads to significant modification of zirconia-applicative properties. Firstly, the material is extremely durable and chemically resistant. Secondly, it shows ionic electrical conductivity realized by oxygen ion carriers [2,3]. However, operating devices constructed with elements based on ZrO2 at extremely elevated temperatures would not be possible.
The solution to this problem is a suitable modification of the material by decreasing the phase transition temperature. In consequence, the high-temperature crystallographic phase of the compound is stable at lower temperatures. The most popular method to achieve this aim is the addition of a precisely adjusted amount of divalent or trivalent metal atoms. The following compounds have been reported as ZrO2 dopants: Al2O3 [4,5,6], CaO [7,8], MgO [9,10], Y2O3 [11,12], Sc2O3 [13], Yb2O3 [14], Si3N4 [15,16,17], AlN [18,19], and CuO [20]. Such modification has a direct effect on the considerable rise of the specific electrical conductivity. This phenomenon is explained by additional oxygen vacancies creation. The Zr4+ ions are partially substituted by ions of lower valence, and the oxygen vacancies are formed to preserve the charge neutrality of the system. The mentioned processes can be described by the formulas written for doping with divalent and trivalent cations descendant from oxide dopant, respectively:
MeO ZrO 2 Me Zr + V O + O O x ,
Me 2 O 3 ZrO 2 2 Me Zr + V O + 3 O O x ,
Doping with tetravalent ions from MnO2 or SiO2 is also possible and improves the mechanical stability of the materials [21,22,23,24,25].
Zirconia-based ceramics found several practical uses. Its mechanical and chemical properties make it valuable as a prosthetic material for medicine or constructive material for industry. Moreover, high ionic electrical conductivity and temperature shock tolerance of the stabilized ZrO2 make it suitable for application in oxygen sensors [26,27,28,29,30], solid oxide fuel cells [31,32,33,34], ceramic components, and as catalyst or catalyst promoters in the synthesis of alcohols by hydrogenation of CO [35,36,37,38].
Scandia-stabilized zirconia is a solid electrolyte with potential application in intermediate-temperature solid oxide fuel cells (IT-SOFC) [39,40]. The main drawback of this solid electrolyte is the complex nature of phase composition according to the phase diagram [41,42]. The highest value of ionic conductivity was obtained for the addition of 9 mol% Sc2O3 [43] along with a high rate of thermal degradation, due to the formation of the tetragonal structure in the cubic matrix. The solution to this problem lies in additional material doping of small amounts of ceria (1 mol%), resulting in the stabilization of the material cubic structure. A number of studies in the ternary or even quadrupole system have been carried out so far. The most prospective of them are as follow: Zr-Ce-In [44], Zr-Zn-Ce [45], Ce-Zr-Sm [46], Zr-Cu-Co [47], Mo-Ce-Zr, W-Ce-Zr [48], Y-Zr-Ce [49,50], Cu-Zr-Ti [51], Ce-Zr-Yb [52], Sc-Ce-Zr [53,54,55], Ni-Sc-Zr [56], Sc-Zr-Yb [57], and Sc-Ce-Y-Zr [58].
The operating temperatures of fuel cells containing electrolytes based on zirconia are in the range of 900–1000 °C. Although the electrochemical processes occurring in the devices run with satisfactory efficiency, the need to use such high temperatures makes it unprofitable to generate electricity. One of the problems is the rapid degradation of cell components in extreme working conditions. Therefore, research on alternative electrolytes has been of constant interest. Among the many tested oxide ceramics with fluorite structure, the highest conductivity is shown by bismuth oxide, bismuth oxide doped with yttrium, and ceria doped with gadolinium in the amount of 20% at. For example, at 1000 °C, the reported Ce0.8Gd0.2O1.9 conductivity is Ω∙cm−1, which is one order of magnitude higher than that of YSZ electrolyte [59,60].
One of the CeO2 disadvantages is the tendency of cerium ion reduction, which results in an increase in the electronic conductivity component. Moreover, the material shows poor mechanical properties in the working conditions of large differences in oxygen chemical potentials. From the thermodynamic point of view, it appears that the introduction of Re2O3 admixture counteracts the reduction of Ce4+ ions to the Ce3+ form. Additionally, by introducing ions in the + III oxidation state to the cationic sub-network, oxygen vacancies are generated, contributing to conductivity improvement.
During sintering of CeO2, ceramic elements usually contaminate with silica (SiO2) originating from the quartz elements of the furnace proceeds, which is practically unavoidable. It results in increased resistance of grain boundaries regions. The contamination may also result in the segregation of impurities at the electrode–electrolyte connection. Both phenomena cause an undesirable decrease in the conductivity of the system. The addition of Gd3+ ions to the CeO2 network primarily affects grain boundary electrical properties [61,62]. In the case of samples containing small amounts of SiO2, higher conductivity of grain boundaries was obtained for the composition Ce0.8Gd0.2O2-δ (CGO20) compared to Ce0.9Gd0.1O2−δ (CGO10). On the other hand, CGO10 is characterized by a higher stability in reducing atmospheres compared to CGO20 at temperatures below 730 °C. The improvement of CGO20 stability under such conditions can be obtained by codoping with small amounts of praseodymium [63].
The influence of the type of admixture on the ceria sinterability can be predicted based on the so-called “Vegard’s Slope” [64]:
X = ( 0.0220 r i + 0.00015 z i ) ,
where ri is the difference between the ionic radii of the dopant metal and Ce4+ for the coordination number equal to 8, and zi is the charge difference between the introduced ion and Ce4+ ions. The maximum amount of modifier ions that can be incorporated in network positions is inversely proportional to the X-factor [65,66,67,68,69,70].
In order to determine the possibility of using ceramics as a component of a fuel cell, it is necessary to describe its electrochemical properties. One of the parameters important from the applicative point of view is material conductivity. Literature reports on the electrical conductivity of ceria-based materials vary significantly due to the significant impact of preparation conditions on the final properties of sintered specimens [66,67,68,69,70,71,72,73,74]. An exemplary comparison of results for four cerium oxide-based materials at temperatures 500, 600, and 700 °C is shown in Table 1 [75]. At 500 °C, the CGO10 material has the highest conductivity value, while the yttrium-dotted sample shows the highest conductivity at temperatures of 600 °C and 700 °C.
The aim of this study was to compare the structural and electrochemical properties of three sintered electrolyte materials available commercially, paying special attention to their potential applications in novel electrochemical devices.

2. Materials and Methods

2.1. Materials Used

The investigations were conducted on commercially available powders provided by Terio [76]. The declared compositions of the investigated materials are Ce0.8Gd0.2O1.9 (labeled as GDC), Sc0.1Ce0.01Zr0.89O1.91 (labeled as ScCeSZ), and Sc0.09Yb0.01Zr0.9O1.95 (labeled as ScYbSZ).
The silver paste used for EIS measurements was provided by Pelco (Fresno, CA, USA).

2.2. Samples Preparation

The powders were uniaxially pressed into pellets of 5 mm diameter and 0.2 g weight under 300 MPa and sintered according to the program recommended by the producer in an ambient atmosphere. In case of ScCeSZ and ScYbSZ, the sintering steps were as follows: heating from 20 °C to 300 °C for 4 h, holding at 300 °C for 1 h, heating from 300 °C to 500 °C for 2 h, heating from 1500 °C to 1660 °C for 3 h 15 min, holding at 1660 °C for 1 h, cooling from 1660 °C to 1100 °C for 2 h 30 min, and cooling from 1100 °C to 20 °C for 8 h 20 min. In the case of 20GDC, the sintering steps were as follows: heating from 20 °C to 300 °C for 3 h 20 min, holding at 300 °C for 2 h, heating from 300 °C to 1500 °C for 15 h, holding at 1500 °C for 2 h, and cooling from 1500 °C to 20 °C for 6 h. The noticeable shrinkage of specimens during the sintering process is exhibited in Figure 1.
The pellets were prepared for electrochemical impedance spectroscopy (EIS) measurements by covering both sides with Ag paste firing at 700 °C for 5 min.

2.3. Characterisation of Sintered Discs

The sintered specimens’ densities were measured by the Archimedes method.
Sintered pellets were examined by the X-ray diffraction (XRD) method. The measurements were performed in air at room temperature using CuKα radiation (Philips X’Pert) within the 2Θ range of 10–90° with a scan ratio of 0.008°/s.
The surface morphology of sintered materials was observed using an ultrahigh-resolution scanning electron microscope (SEM) with field emission (FEG-Schottky emitter; Nova Nano-SEM 200, FEI Europe BV, Eindhoven, The Netherlands) cooperating with energy-dispersive spectroscopy and an X-ray analyzer (EDAX EDS, Mahwah, NJ, USA).

2.4. Electrochemical Property Examination by Electrochemical Impedance Spectroscopy (EIS)

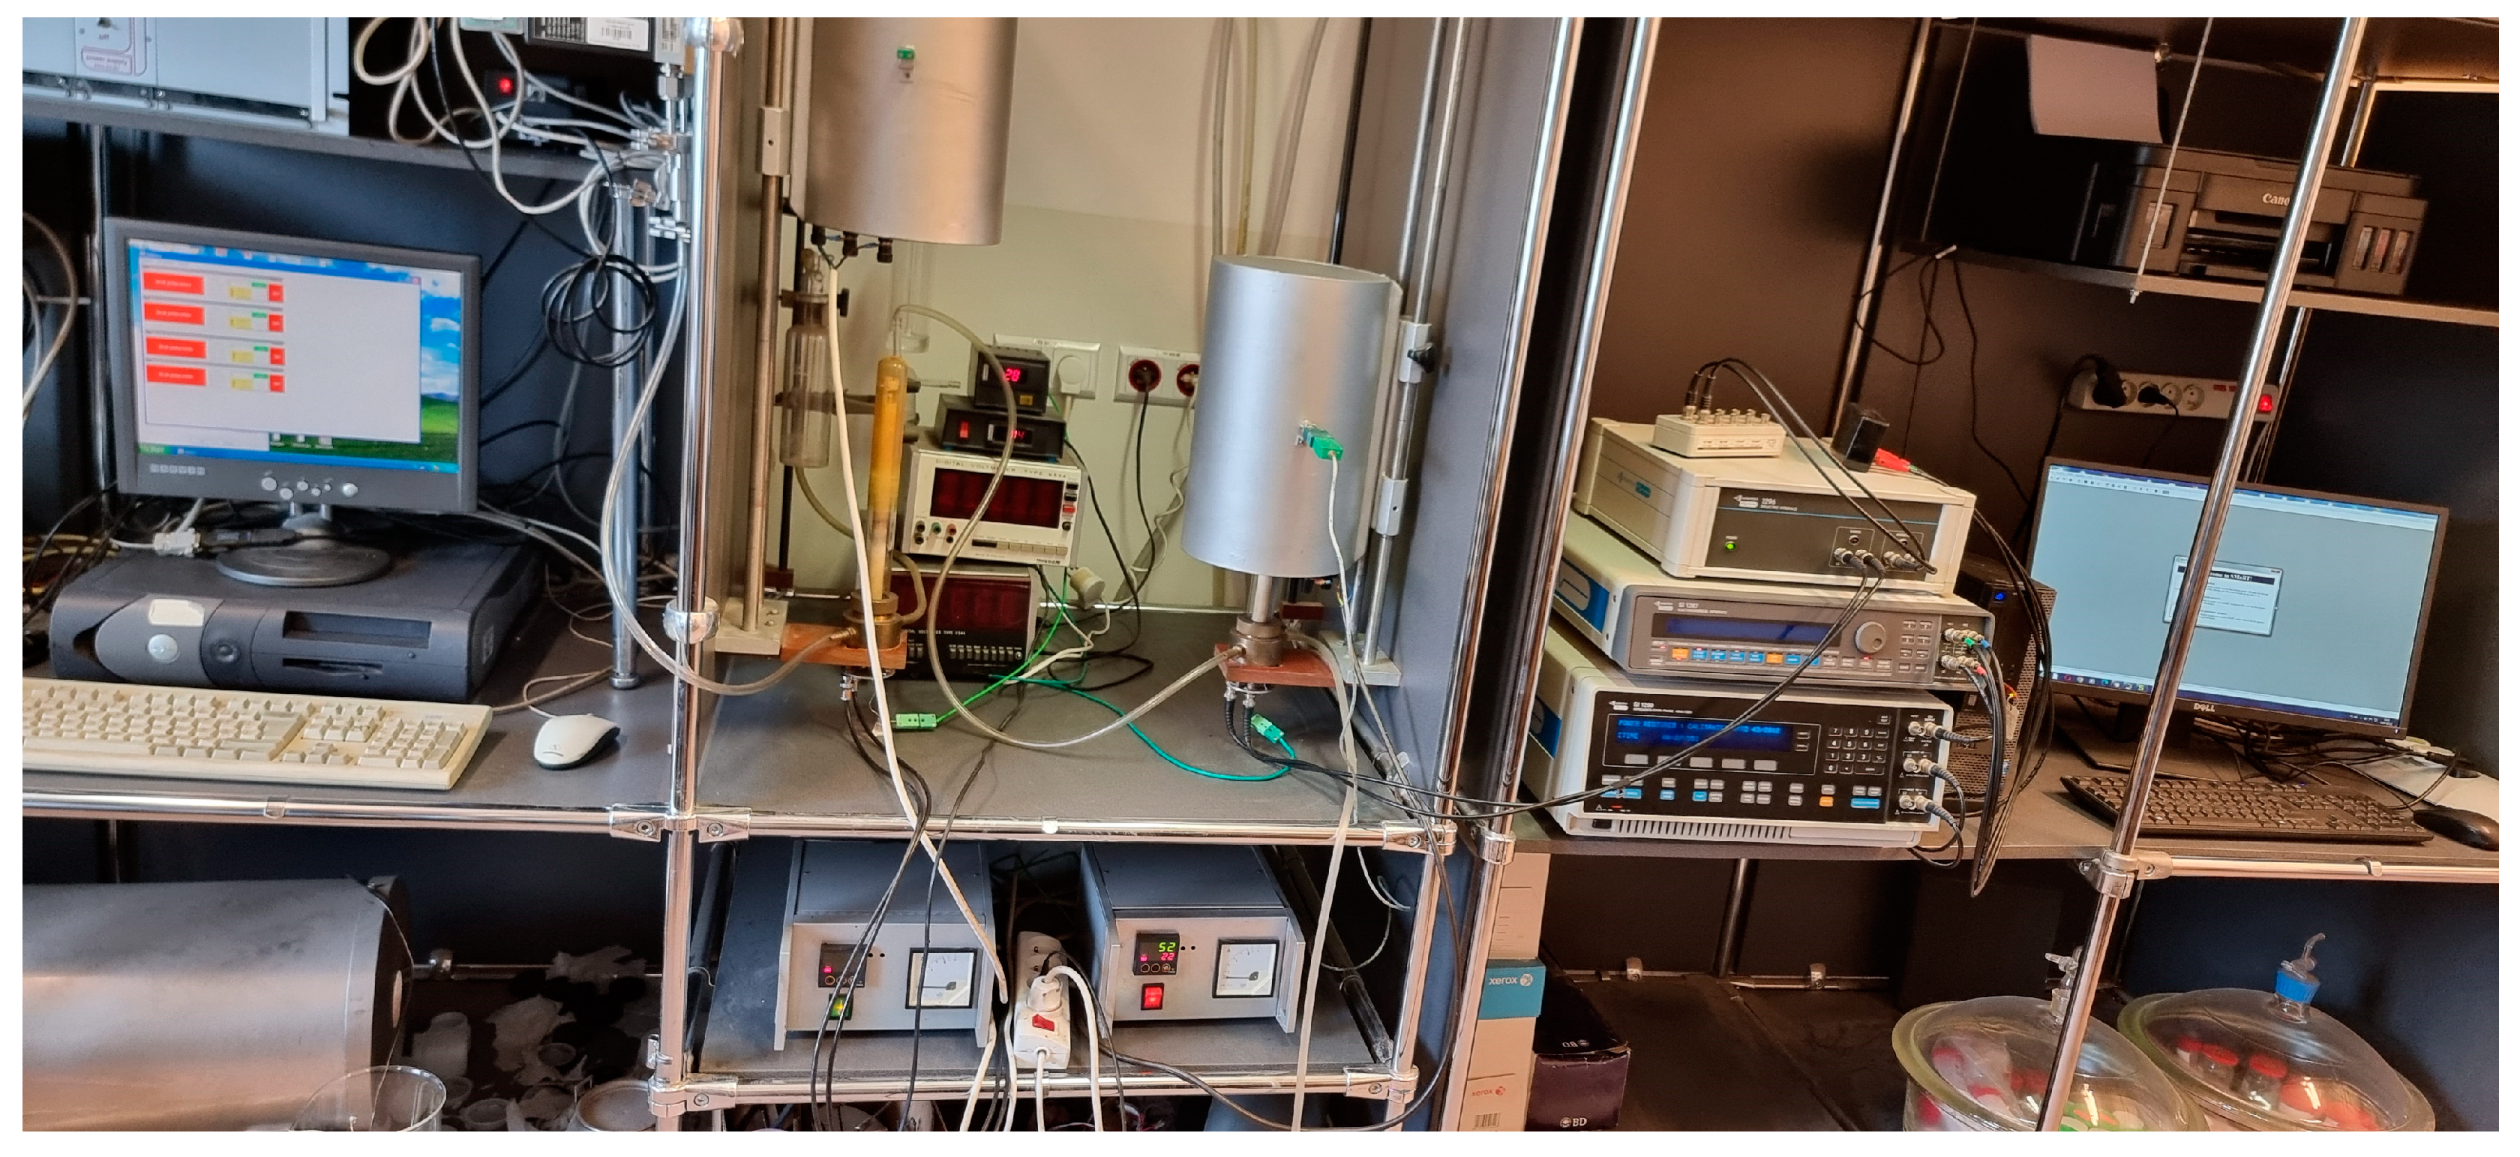
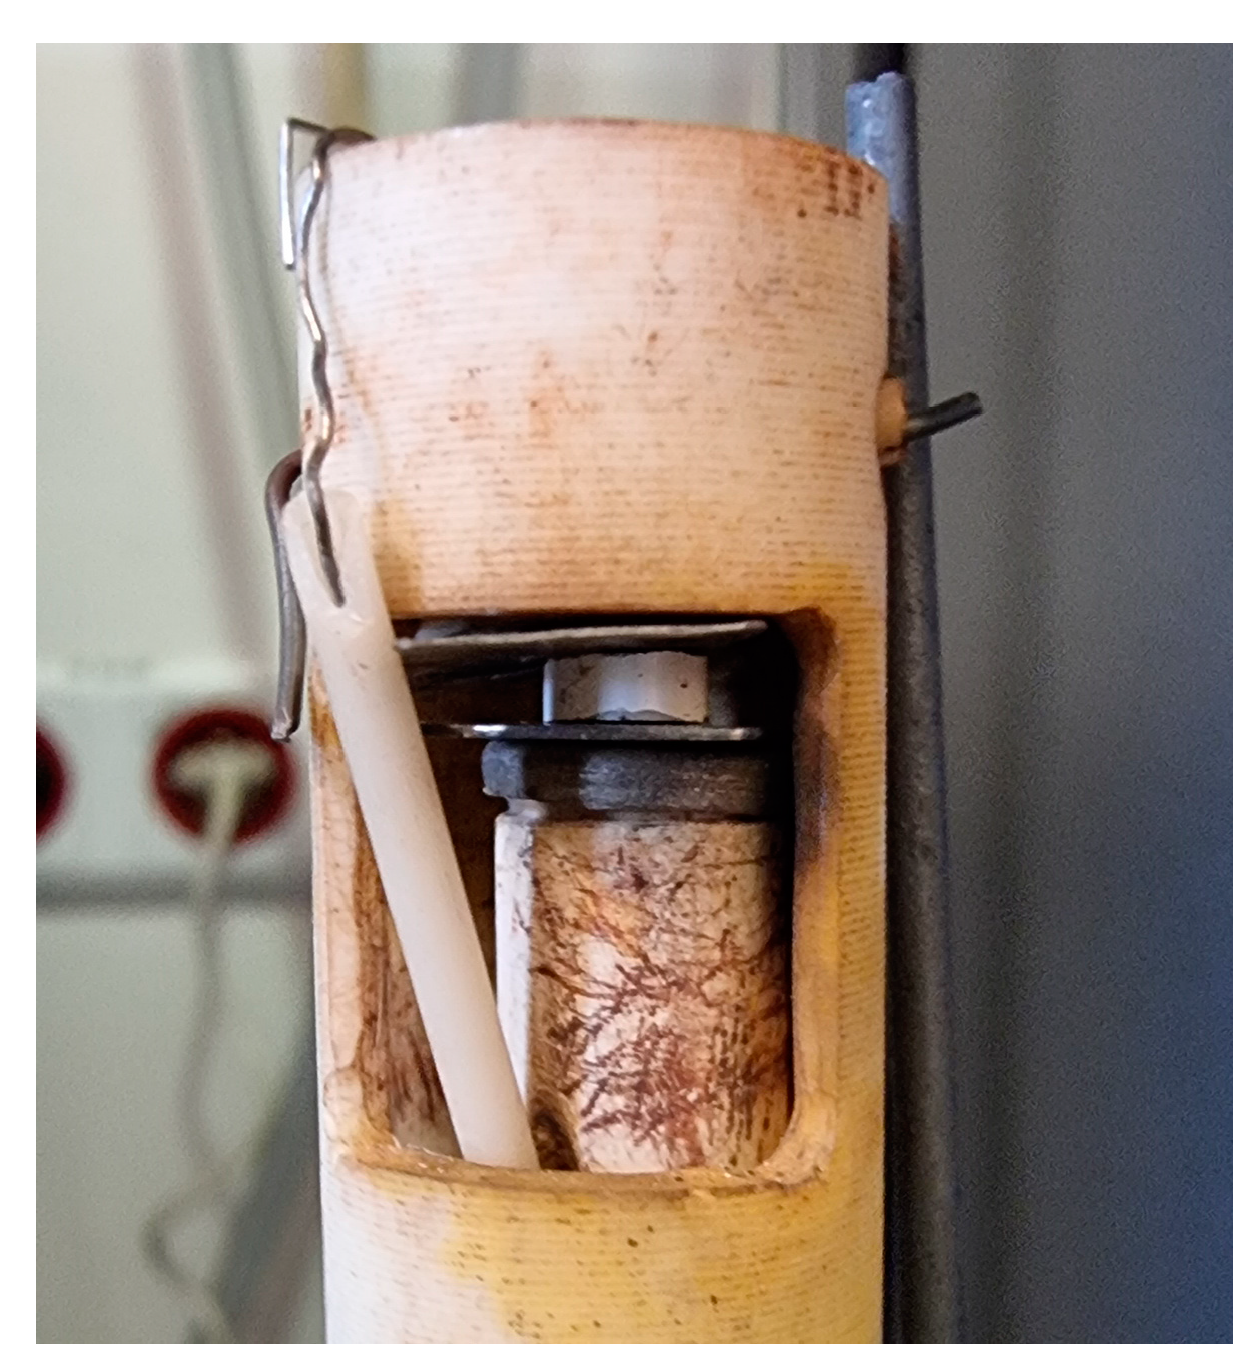
The EIS measurements were performed in controlled atmospheres using a frequency analyzer (Solartron model FRA 1260, Bognor Regis, UK) coupled with a Dielectric Interface (model 1296) in a temperature range of 200–600 °C. The experimental set is presented in Figure 2 and the specimen holder in Figure 3. The frequency range was 0.1 Hz–32 MHz, and the amplitude of the sinusoidal voltage signal was 20 mV. The measurements were performed in the following atmospheres: synthetic air (series no 1, 3, and 5), 3000 ppm NH3 in argon (series no 2), and 10% H2 in argon (series no 4). Series no 3 and 5 in the synthetic air were conducted in order to determine the reversibility of the material impedance response in H2- and NH3-rich atmospheres. The values of the resistances were derived using Zview software (version 2.2, Scribner Associates, Inc., Southern Pines, NC, USA).

3. Results

3.1. Morphological Features of the Sintered Samples

GDC, ScYbSZ, and ScCeSZ densities measured by the Archimedes method were, respectively, 7.13 g/cm3 (~92% of theoretical density), 5.84 g/cm3 (~91% of theoretical density), and 5.99 g/cm3 (~95% of theoretical density).
Spectra from XRD are presented in Figure 4. The GDC and ScYbSZ are single-phase and crystalize in the cubic system, while the ScCeSZ specimen is composed mainly of the ZrO2 phase with CeO2 traces. The positions and intensities of the detected peaks are consistent with reference spectra [77,78].
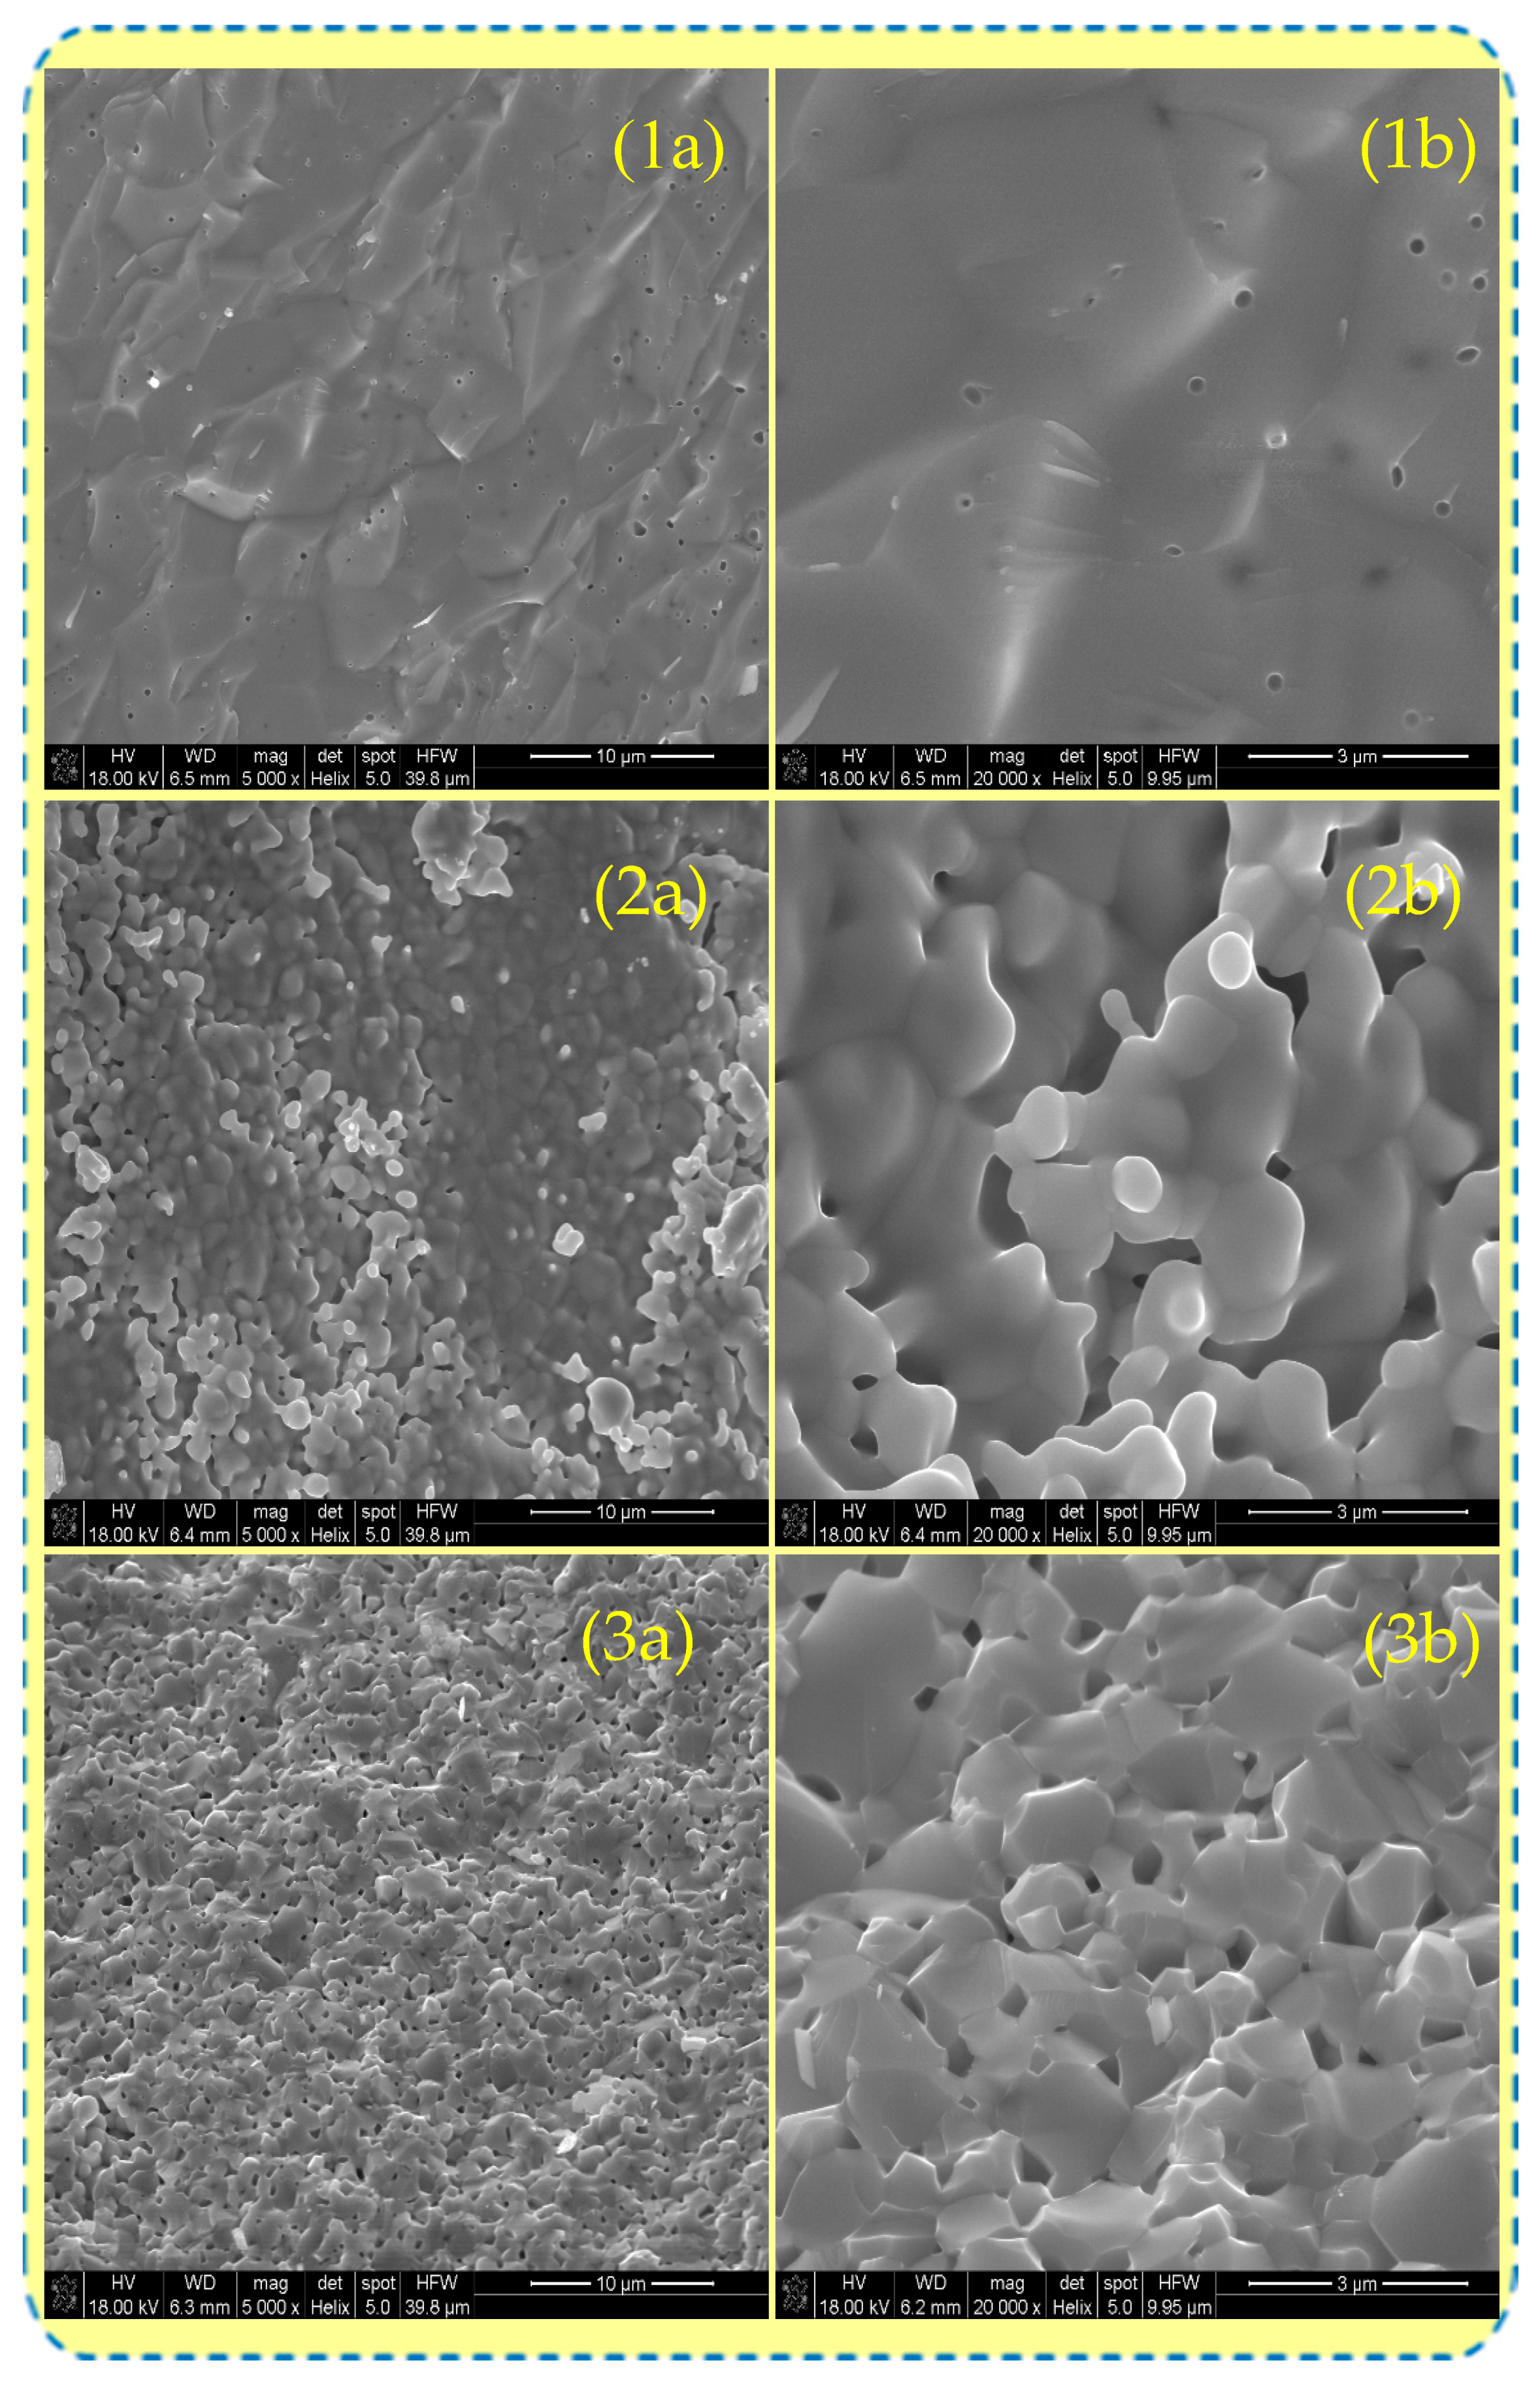
The exemplary images of the specimens’ microstructure studied by the SEM technique are presented in Figure 5. The GDC surface is smooth almost without cracks. In this case, a few round small randomly situated pores are revealed. The images indicate high gas tightness and density of the material. ScCeSZ and ScYbSZ ceramics are composed of partly grown, melted grains characterized by ovoid edges and sizes from the range of 1–3 μm. Between grains, small pores are visible. The specific area of ScCeSZ and ScYbSZ is significantly higher than in the case of GDC.
Based on XRD spectra, the lattice parameters were calculated. The measurement of elemental compositions was performed by an EDS analyzer. The calculated data from EDS and XRD are presented in Table 2. The lattice parameter of GDC is notably higher than for ScCeSZ and ScYbSZ, which remains in accordance with theoretical predictions. The elemental analysis shows a significant deficiency in oxygen in every specimen; however, it may be due to the fact that the measurement uncertainty tends to be higher for lighter elements. Surprisingly, specimen ScCeSZ contains measurable amounts of yttrium which was not declared in the nominal composition of the material. Moreover, the amounts of scandium and cerium are much higher than those from the theoretical calculations. In the case of ScYbSZ, the determined amount of ytterbium considerably exceeds the expected value.

3.2. Electrochemical Properties of the Sintered Samples

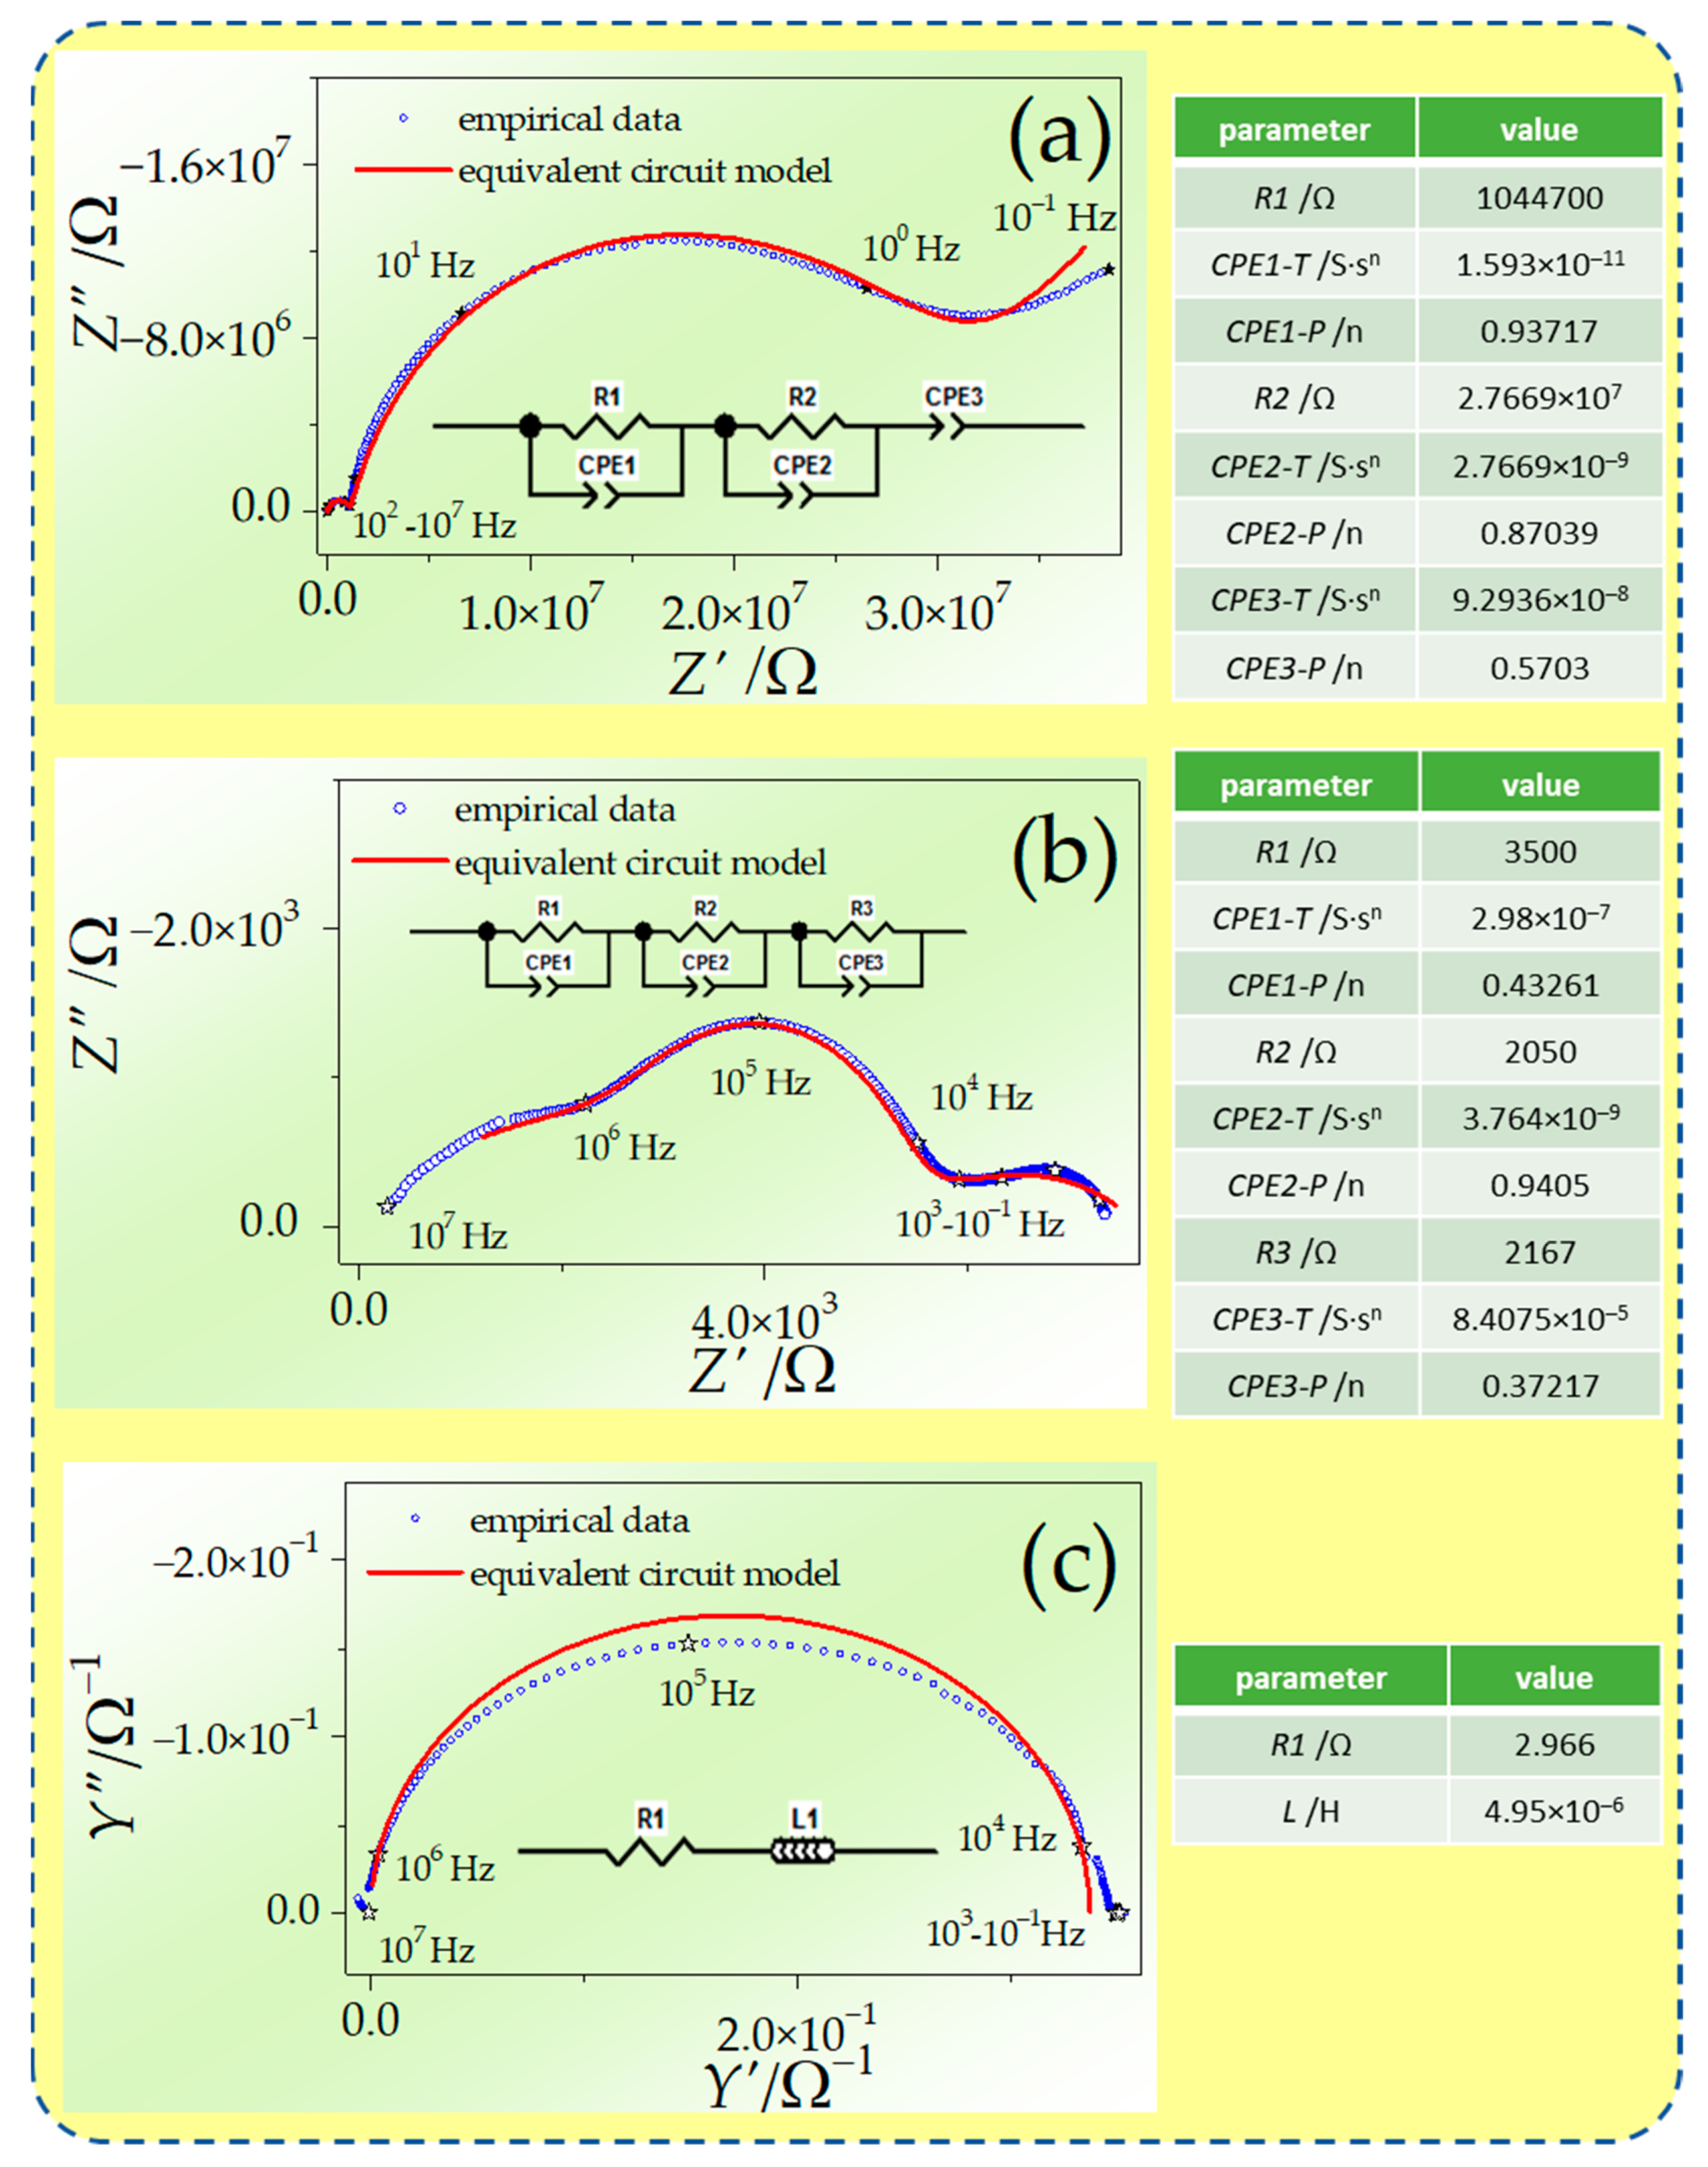
The electrochemical properties were investigated by EIS spectra analysis realized by dedicated software. The exemplary evolution of Nyquist spectra with temperature for GDC obtained during the 4th series in the H2-rich atmosphere is presented in Figure 6. The figure contains the results of experimental data analysis by fitting equivalent circuits method. At a temperature of 200 °C, the spectrum is comprised of two separated semicircles in high and medium frequencies and a short fragment arc in low frequencies. The investigated material can be classified as polycrystalline ceramic. In such cases, the highest-frequency part of the spectrum corresponds with bulk properties, and the medium-frequency fragment is attributed to grain boundary behavior. The shape of the spectra indicates that the grain boundary regions are notably more resistive than bulk regions. At 500 °C, the metallic electrode becomes reversible to hydrogen. Such behavior is deduced from the semicircle shape of the spectrum fragment in low frequencies. At 600 °C, the conductivity of the specimen becomes as high as in metallic conductors. Thus, the semicircle shape is visible in the admittance plane and equivalent circuit, simulating the behavior of the specimen containing the inductor.
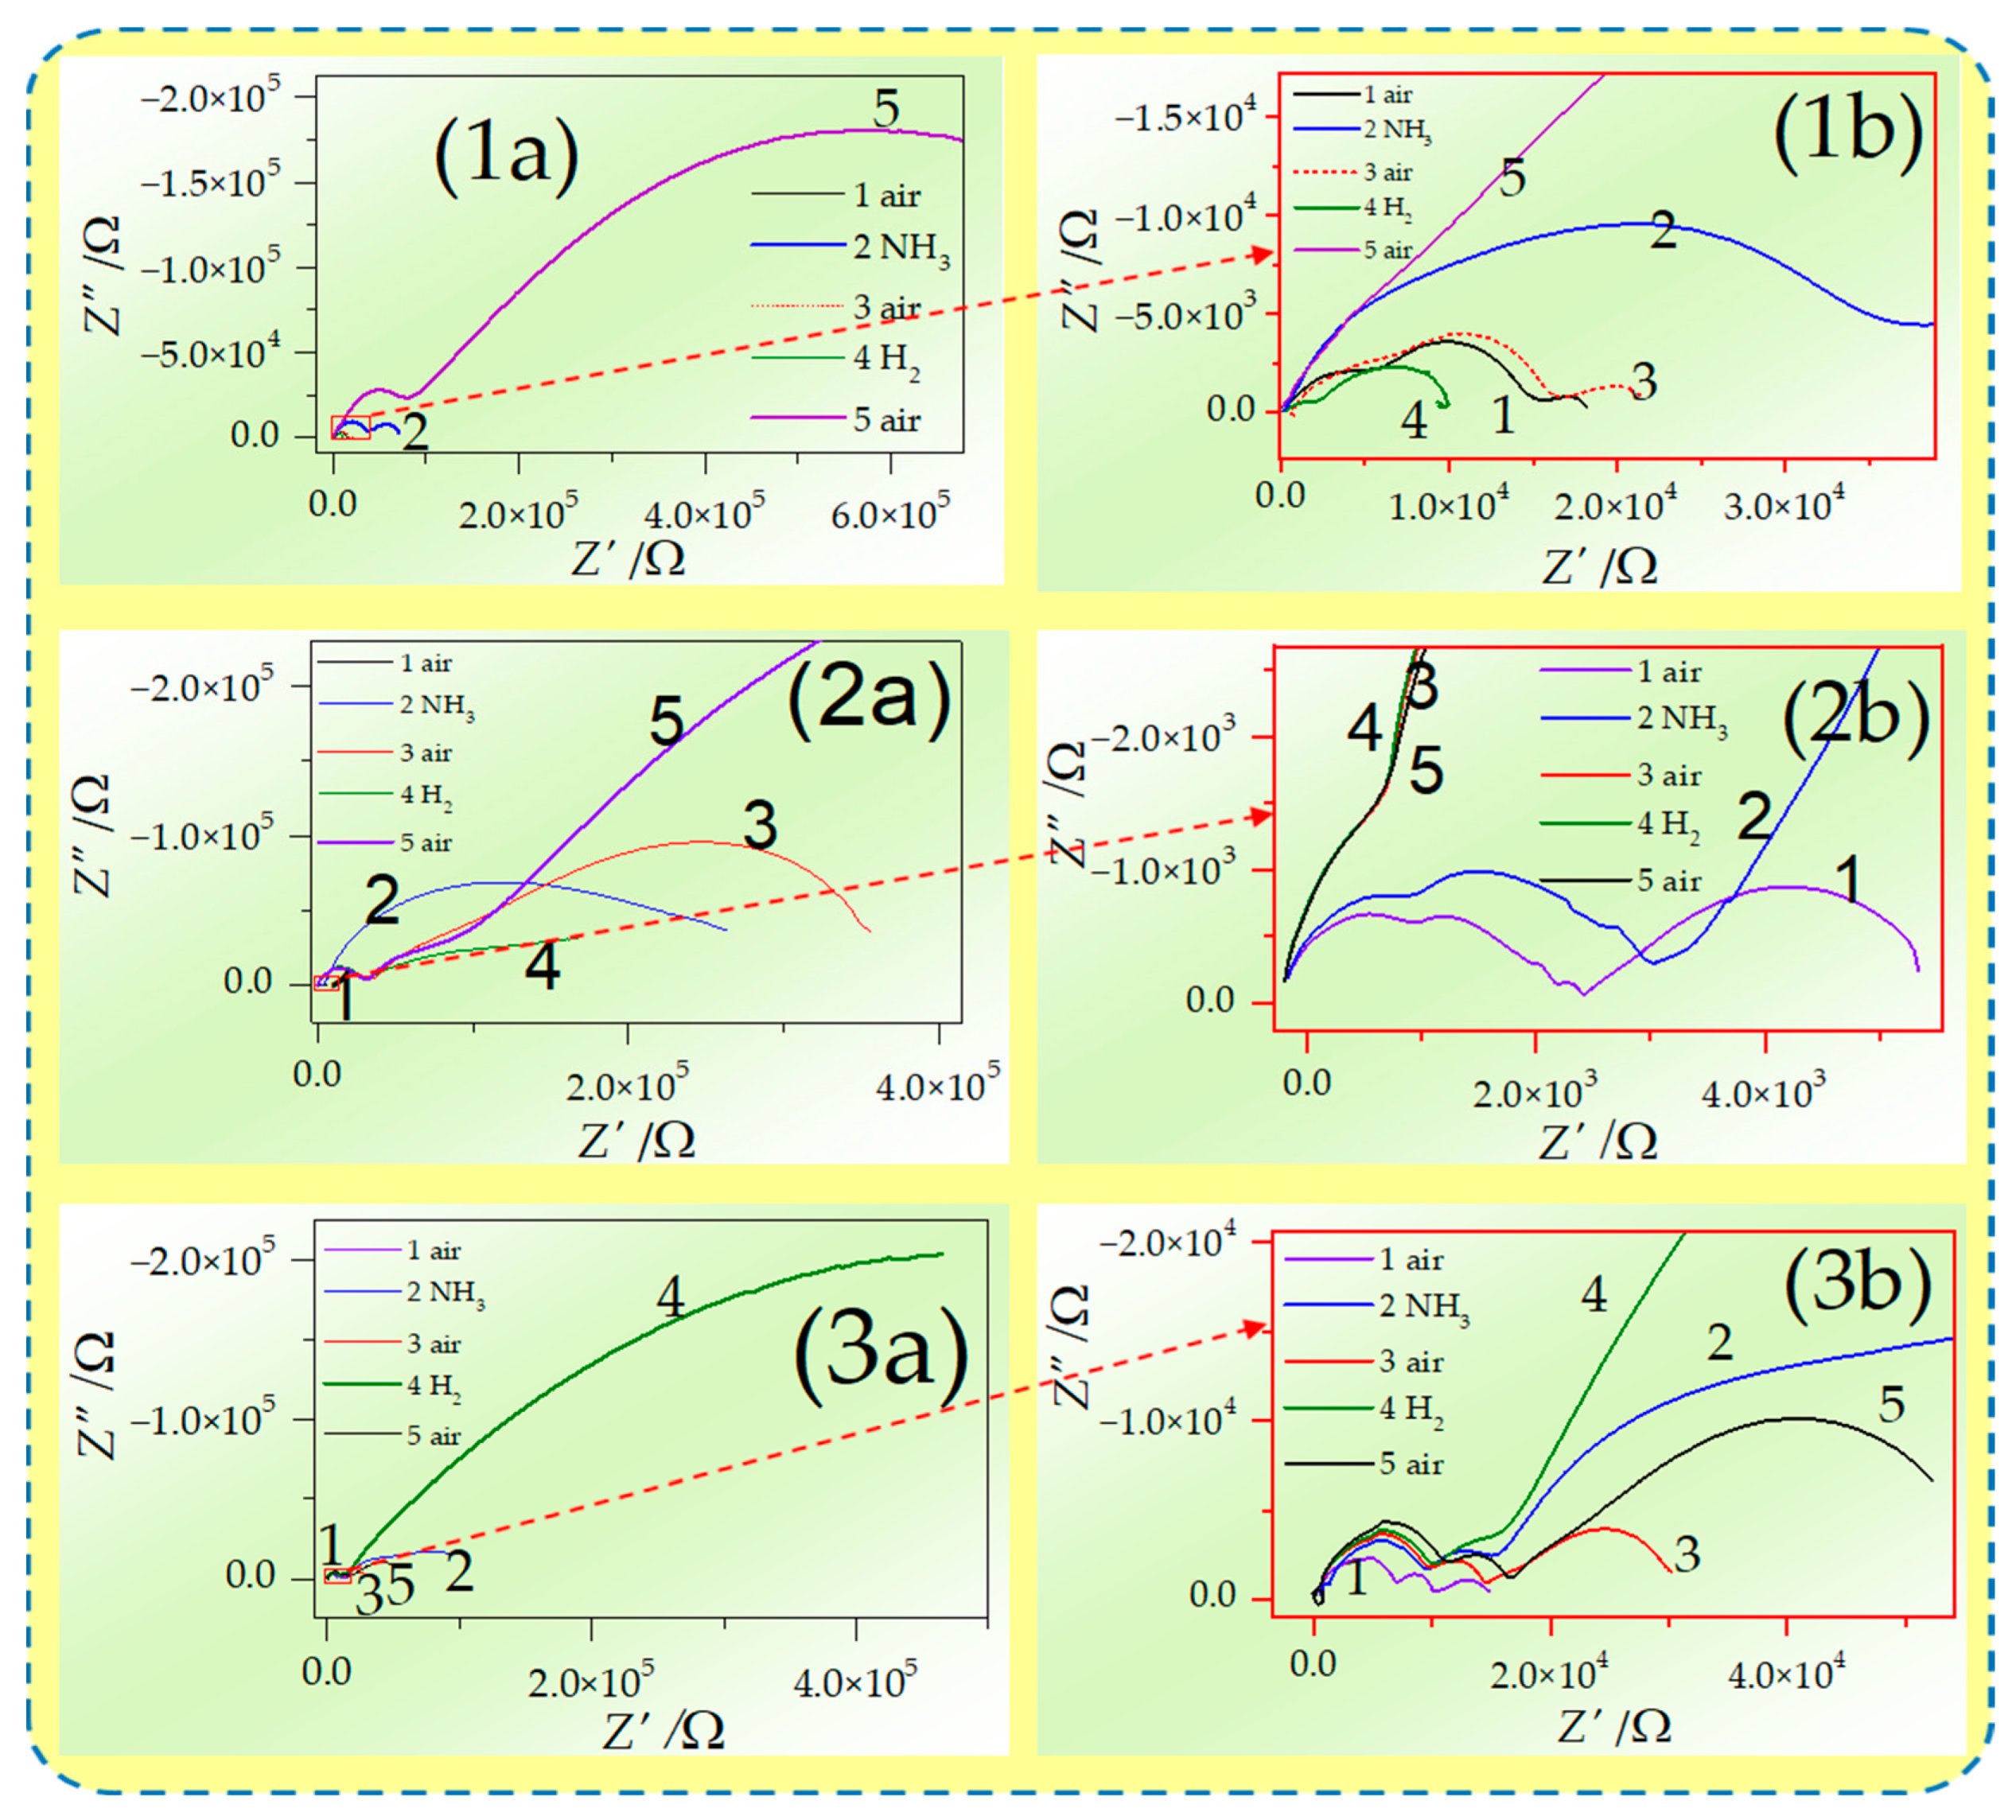
The exemplary sets of data obtained at 450 °C in different atmospheres for specimens in the Nyquist plane are presented in Figure 7.
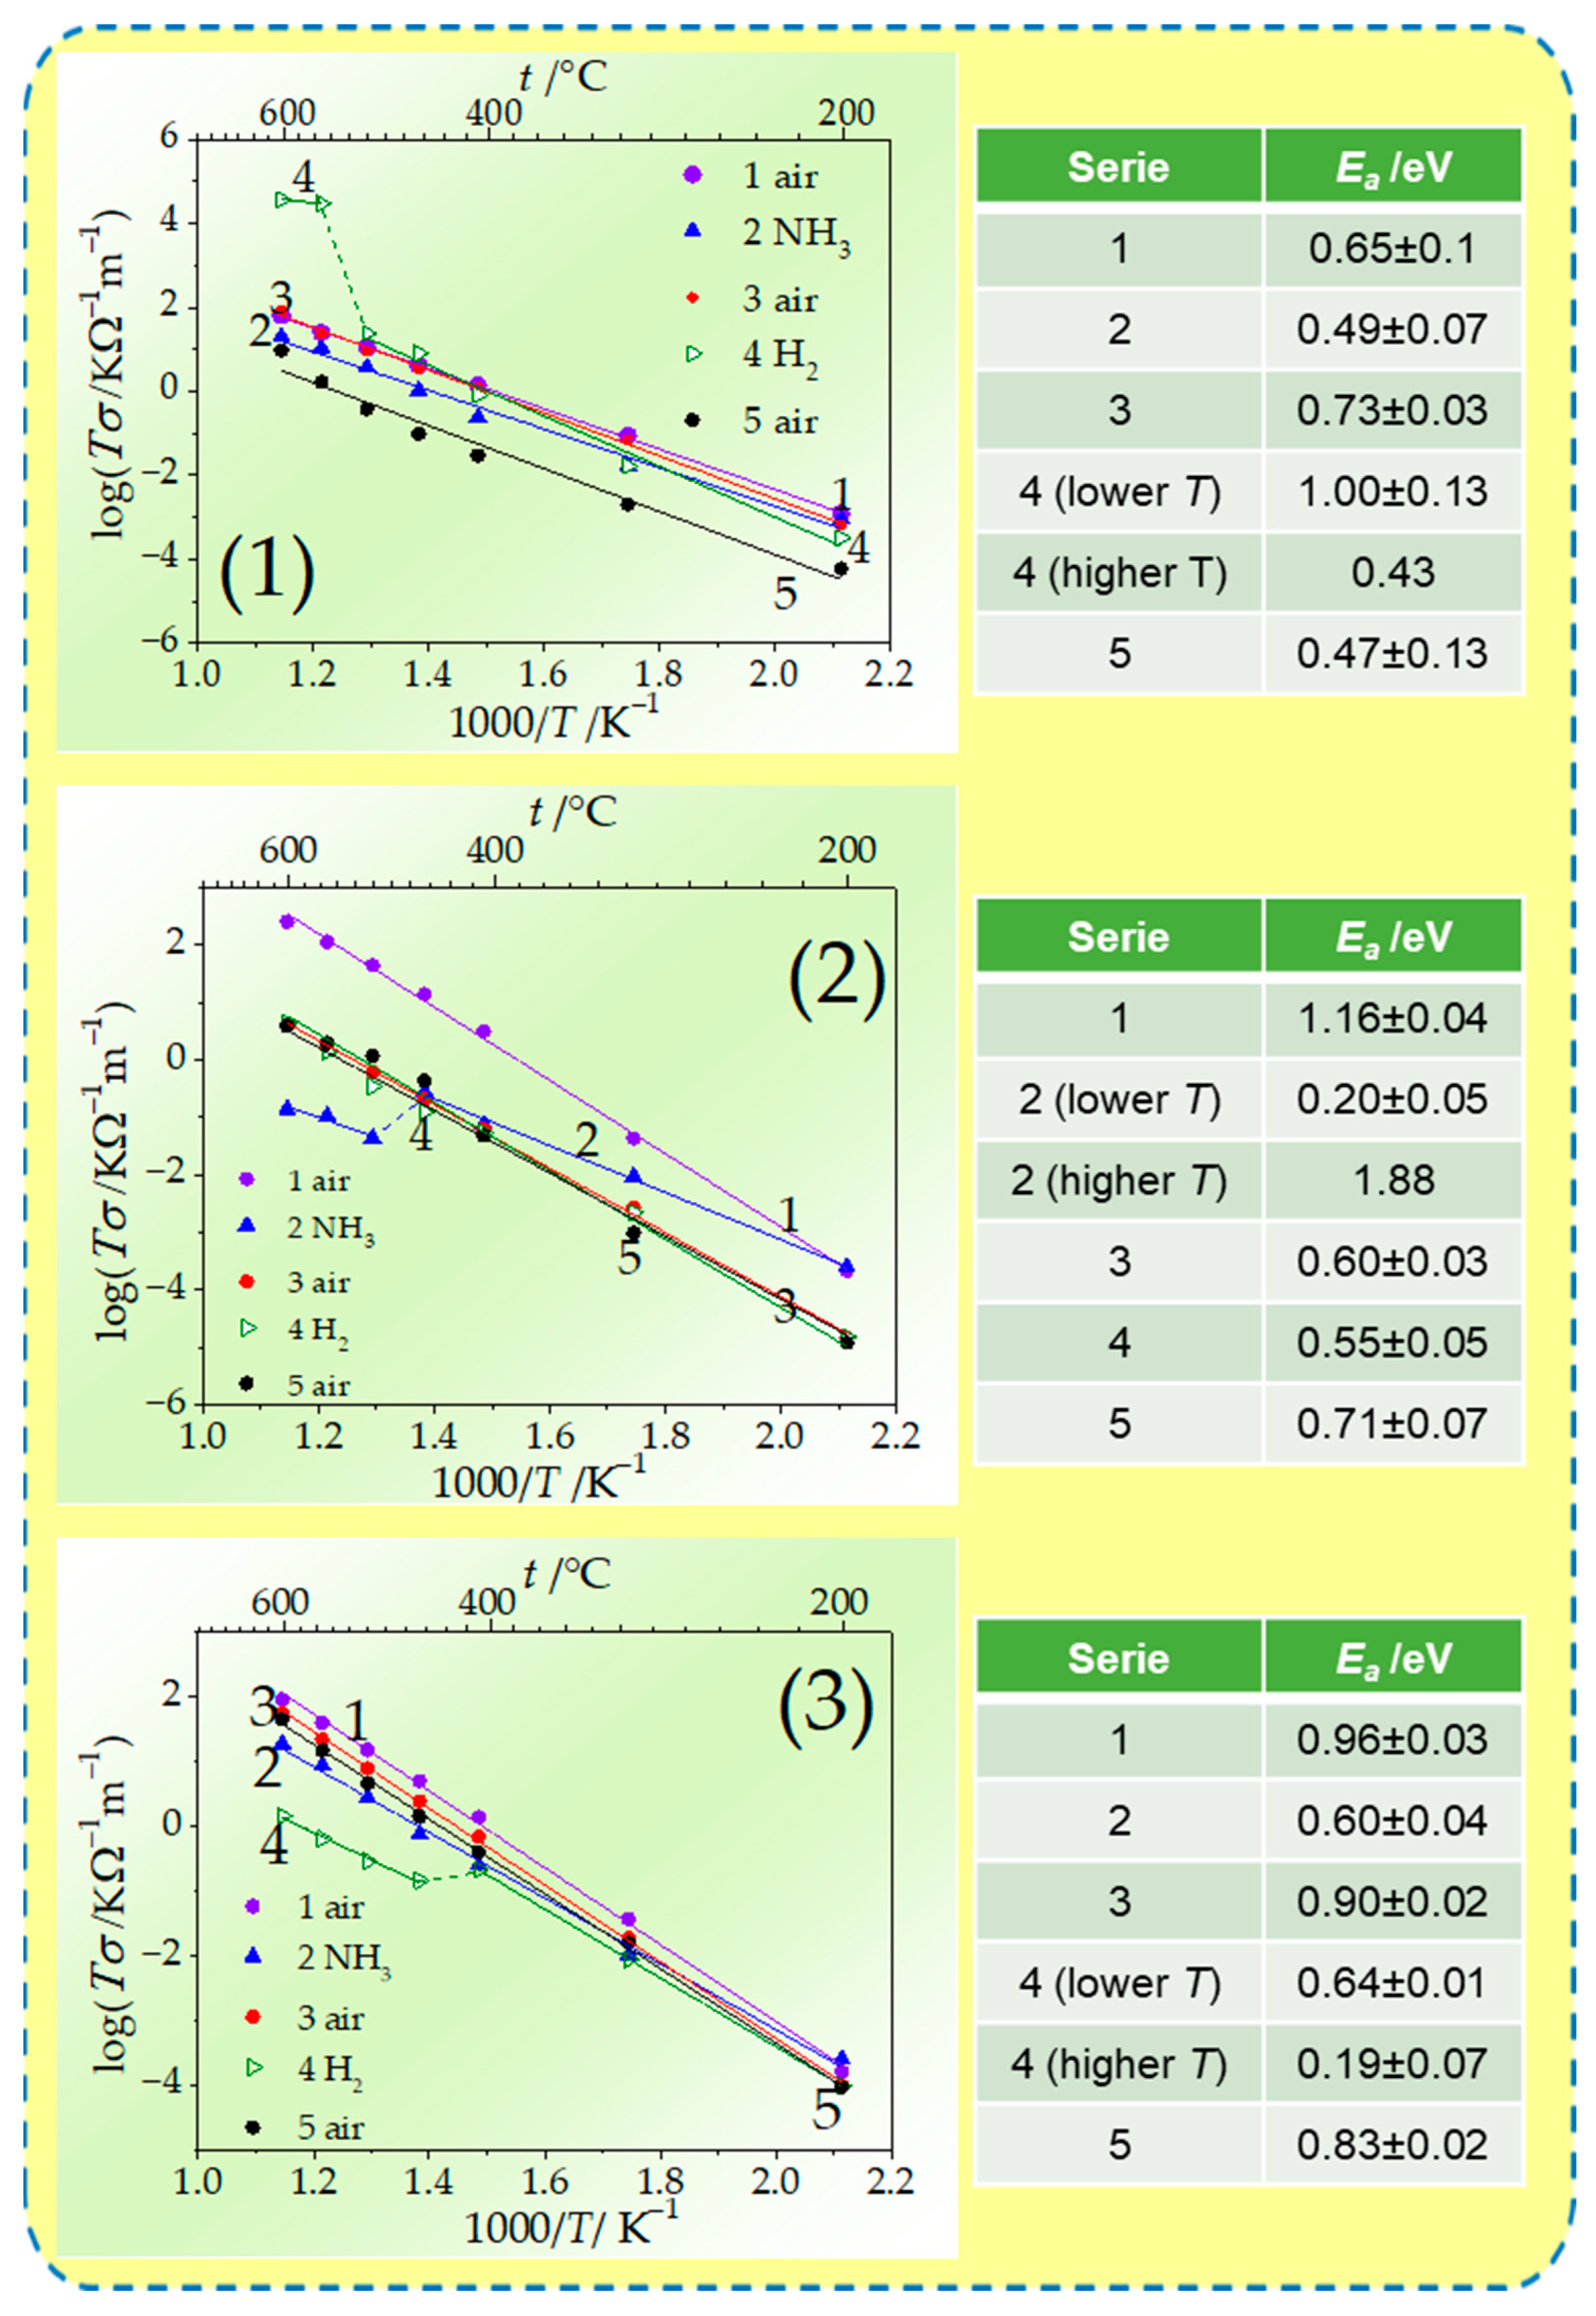
The specific conductivities were calculated using values of specimens’ resistance obtained by analysis of the spectra taking into account the pellet geometry. The collation of specific conductivity values obtained during the 1st series in the air, which can be considered as reference measurements of electrical conductivity before further modification of the materials, is presented in Table 3. The results are presented in Figure 8 as experimental points in Arrhenius coordinates along with lines derived from linear regression fitting. At 200 °C and 300 °C, the specimen GDC shows the highest electrical conductivity. The determined conductivities are somehow lower compared with literature data at particular temperatures, presented in Table 1. The discrepancy may arise from different sintering conditions or different initial microstructure of the materials [74]. At 400 °C, the conductivities for all the investigated samples are comparable. The best-conducting properties at higher temperatures are demonstrated by the ScCeSZ specimen, which is consistent with the literature reports [79].
The noticeable kink in the slope in the Arrhenius plots at around 550 °C for GDC and ScCeSZ and 450 °C for ScYbSZ is denoted. It indicated an order–disorder transition of oxygen vacancies, which was previously observed in doped ceria specimens [80]. However, to confirm this explanation, more sophisticated measurements by use of a high-temperature X-ray diffraction (HT-XRD) and Raman and dielectrics spectroscopy techniques in a controlled atmosphere are required.
Additionally, based on slopes of fitted Arrhenius plots, the activation energy values for total specific conductivities were determined and presented in Figure 8. The values of 0.5 eV indicate the extrinsic character of the conductivity, while values of 1 eV indicate the intrinsic character of the conductivity.

4. Discussion

In a typical solid oxide electrolyte, conductivity is proportional to the relative concentration of oxygen ions, which are charge carriers in the cryllographic lattice. The conductivity is described by the equation
σ = q c μ ,
where
q—valency of mobile ions,
c—relative concentration of mobile ions to the number of possible positions in the lattice,
and μ—mobility of the ions.
In the atmosphere rich in oxygen, the reversible oxidation and reduction occur on a three-phase boundary (gas–metallic electrode–solid electrolyte) [81]:
O 2 + 4 e 2 O 2 .
The above reaction is the basis for the operation of semiconductor oxygen sensors. A relationship between the oxygen partial pressure P O and the electrical conductivity σ of an oxide sensor can be represented by [82]
σ = P O m A exp ( E A k T ) ,
where σ is the electronic conductivity, A is a constant, EA is the activation energy for conduction, and m is a parameter determined by both the type of the carrier (n or p) and the defects (e.g., oxygen vacancy) in the semiconductor. The additional ionic carriers appear in the lattice, increasing measured conductivity. The opposite effect of decreasing conductivity is observed in neural or reduced atmospheres due to the reversibility of the reaction (5). Taking into account what was stated above, the behavior of ScYbSZ shows the predictable and reversible response of the typical oxygen conductor to changes in oxygen partial pressure in the atmosphere.
In the case of GDC in an NH3-rich atmosphere, the reversible decrease in conductivity is measured, while in an H2-containing atmosphere, the conductivity drop is observed followed by its further decrease during the 5th series in synthetic air in a temperature range of 200–500 °C. The deterioration of conducting properties of the oxide electrolytes is predictable in the conditions of atmospheres lacking in oxygen, as it was demonstrated during the 2nd series. The results obtained in an atmosphere containing hydrogen exhibit that protons and/or free electrons could also realize the conduction in the material.
According to the reactions on the three-phase boundary, the hydrogen–metal ceramic introduces permanent modifications in the material. Such an effect could be explained by a reaction in which valence electrons are created, accompanied by the oxygen vacancies recombination. A postulated reaction involving H2 can be written [83,84]:
H 2 + 2 O 2 + V O n 2 ( OH ) + n e .
H 2 + O 2 H 2 O + 2 e .
H 2 + O o x H 2 O + V O + 2 e .
In the case of reaction (8), the response of the material would be reversible, while in the case of reaction (9), new vacancies are created, which would manifest itself in an increase in conductivity under the influence of subsequent exposure to an oxidizing atmosphere. The improved conductivity in hydrogen can be explained by the risen concentration of valence electrons and subsequent decreased conductivity in the 5th series arising from the recombination of oxygen vacancies according to Equation (7).
Another possible explanation of GDC behavior at temperatures 550–600 °C is the occurrence of reaction (9) followed by a hydration process:
H 2 O + V 0 O 0 x + 2 H i .
A coupling effect between a proton, oxygen ion, and oxygen vacancy leads to a synergistic transport effect: the migration of O−2 in the bulk of GDC particles in an opposite direction to promote proton migration on the GDC particle surface [85]. The change in the conduction mechanism is evidenced by a sharp rise in conductivity manifested by a change in the impedance spectrum shape visible in the admittance plane in Figure 6c above 550 °C in anH2-containing atmosphere.
In the literature, sensors are described in which, during exposure to ammonia gas, the response is a reversible increase in conductivity caused by an increase in the concentration of valence electrons in the material in accordance with the reaction [86,87]
NH 3 + 2 O O 2 0.5 N 2 O + 1.5 H 2 O + 4 e .
The conductivity in both the 3rd and 5th series for the ScCeSZ specimen decreases, which can be explained by taking into account that the material is the oxygen ionic conductor. The comparison of spectra in both reduced atmospheres indicates that reactions run much more effectively with H2 than with NH3. The succeeding drop of conductivity in the following 4th and 5th series in the synthetic air can be elucidated by reactions resulting in oxygen vacancies recombination:
2 NH 3 + 3 V 0 + 6 O O x 6 ( O H ) O + N 2 ,
H 2 + V 0 + 2 O O x 2 O H O
The presented results indicate that the investigated materials’ electrical properties are consistent with Arrhenius law in the synthetic air, in NH3 for GDC, and in H2 for ScCeSZ. In the atmosphere containing H2 for GDC and ScYbSZ, the shift in the plot is denoted. The result can be explained by a rapid change in the effectiveness of the reactions (7) and (12) above the temperatures 400 °C and 550 °C for ScYbSZ and GDC, respectively.

5. Conclusions

From the commercial zirconia- and ceria-based powders dedicated as solid electrolytes for SOFC, the dense sintered bodies were prepared. The materials were examined by SEM, XRD, and EDS techniques. Material based on ceria is characterized by a different microstructure than zirconia-based ceramics. In the first case, the dense, flat surface without characteristic grains was revealed, while the zirconia ceramics shows typical polycrystalline structure comprised of round, partly separated grains. In samples based on zirconia, some disagreements between the declared and experimental elemental composition were observed.
According to EIS studies conducted in oxidizing and reducing atmospheres, the zirconia samples are oxygen ionic conductors, whereas mixed-ionic electronic conduction is shown in ceria. Thus, GDC would be the most appropriate to be used as an anode element in SOFC devices working at temperatures above 500 °C. In such conditions, the effectiveness of hydrogen oxidation significantly increases. Moreover, GDC exhibits significant and reversible electrochemical response to NH3 in the whole investigated temperature range. Therefore, it may be prospective as material for working elements of ammonia gas sensors.
The utmost electrochemical response was recorded in the case of ScCeSZ material for exposition on NH3 above 400 °C. However, the reaction was only partially reversible, which limits its usability as an ammonia sensor element without further modification.
On the other hand, ScYbSZ shows the highest stability of electrical properties in reducing atmospheres below 400 °C, as well as a noticeable reversible response for H2 above 400 °C. On this account, it may be an interesting candidate for the working phase of an H2 sensor or solid electrolyte for IT-SOFC devices.
In summary, the presented studies are crucial for the evaluation of the potential usage of investigated materials as well as for determining their optimal working conditions, i.e., temperature and atmosphere composition. Nevertheless, further research on preparation and ceramic composition effects on the observed electromechanical properties is required.

Author Contributions

Conceptualization, M.D.; methodology, M.D.; software, M.D.; validation, M.D. and B.P.-B.; formal analysis, M.D.; investigation, M.D.; resources, B.P.-B. and R.P.; data curation, M.D.; writing—original draft preparation, M.D.; writing—review and editing, M.D. and B.P.-B.; visualization, M.D.; supervision, B.P.-B.; project administration, R.P. and B.P.-B.; funding acquisition, M.D., B.P.-B. and R.P. All authors have read and agreed to the published version of the manuscript.

Funding

This research was funded by the subsidy of the Ministry of Education and Science for the AGH University of Science and Technology in Kraków (Project No 16.16.160.557).

Institutional Review Board Statement

Not applicable.

Informed Consent Statement

Not applicable.

Data Availability Statement

The original contributions presented in the study are included in the article, further inquiries can be directed to the corresponding authors.

Conflicts of Interest

The authors declare no conflicts of interest. The funders had no role in the design of the study; in the collection, analyses, or interpretation of data; in the writing of the manuscript; or in the decision to publish the results.

Abbreviations

List of Abbreviations (In Order of Appearance)
YSZyttria-stabilized zirconia
CGO10Ce0.9Gd0.1O2−δ
CGO20Ce0.8Gd0.2O2−δ
GDCCe0.8Gd0.2O1.9
ScCeSZSc0.1Ce0.01Zr0.89O1.91
ScYbSZSc0.09Yb0.01Zr0.9O1.95
XRDX-ray diffraction spectroscopy
EDSenergy-dispersive X-ray spectroscopy
EISelectrochemical impedance spectroscopy
SOFCsolid oxide fuel cell
List of Symbols (In Order of Appearance)
Zr4+zirconium cation
MeOmetal in the second oxidation state oxide
Me Zr zirconia in the fourth oxidation state ion sitting on metal in the second oxidation state lattice site with double positive charge
V 0 double positively charged oxygen vacancy
O 0 x an oxygen ion sitting on lattice site with neutral charge
Me 2 O 3 metal in the third oxidation state oxide
Re 2 O 3 a rare earth oxide
Ce4+ceria cation in the fourth oxidation state
Ce3+ceria cation in the third oxidation state
δoxygen deficiency in metal-doped oxide ceramic
XVegard’s Slope
ridifference between the ionic radii of the dopant metal and Ce4+ for the coordination number equal to 8
zicharge difference between the introduced ion and Ce4+ ions
σspecific conductivity
2Θangle between incident beam and the crystallographic reflection plane in XRD
Alattice constant
R1, R2, R3resistor elements
CPE1, CPE2, CPE3constant phase elements
L1inductance element
R1, R2, R3resistance parameters of resistors
CPE1-T, CPE2-T, CPE3-Ttime parameter in constant phase elements
CPE1-P, CPE2-T, CPE3-Tphase parameter in constant phase element
Linductance element parameter
Zreal impedance component
Zimaginary impedance component
Yreal admittance component
Yimaginary admittance component
Tabsolute temperature
ttemperature in degrees Celsius
qvalency of mobile ions
crelative concentration of mobile ions to the number of possible positions in the lattice
μmobility of the ions
e electron
V 0 n n-time negatively charged oxygen vacancy
O2−oxygen anion
Aa constant in Arrhenius law
EAthe activation energy for conduction
kBoltzman’s constant
P O oxygen partial pressure
ma parameter determined by both the type of the carrier (n or p) and the defects (e.g., oxygen vacancy) in the semiconductor
( OH ) hydroxide ion
nnumbers of electrons
H i proton in interstitial site
( OH ) O hydroxide ion sitting on oxygen lattice site with positive charge
List of Chemical Formulas (In Order of Appearance)
Ce0.8Gd0.2O1.9assumed composition of commercial material (specimen GDC)
Sc0.1Ce0.01Zr0.89O1.95assumed composition of commercial material (specimen ScCeSZ)
Sc0.09Yb0.01Zr0.9O1.95assumed composition of commercial material (specimen ScYbSZ)
Ce(Re)O2−δrare earth doped ceria
NH3gaseous ammonia
H2gaseous hydrogen
ZrO2zirconia
COcarbon monoxide
SiO2silica
MnO2manganese oxide
Al2O3aluminum oxide
CaOcalcium oxide
MgOmagnesium oxide
Y2O3ytrria
Sc2O3scandia
Yb2O3ytterbium oxide
Si3N4a silicon nitride
AlNaluminum nitride
CuOcopper (II) oxide
c-ZrO2cubic zirconia
N2Onitrous oxide
H2Owater

References

  1. Song, X.; Ding, Y.; Zhang, J.; Jiang, C.; Liu, Z.; Lin, C.; Zheng, W.; Zeng, Y. Thermophysical and Mechanical Properties of Cubic, Tetragonal and Monoclinic ZrO2. J. Mater. Res. Technol. 2023, 23, 648–655. [Google Scholar] [CrossRef]
  2. Guan, S.H.; Liu, Z.P. Theoretical Aspects on Doped-Zirconia for Solid Oxide Fuel Cells: From Structure to Conductivity. Chin. J. Chem. Phys. 2021, 34, 125–136. [Google Scholar] [CrossRef]
  3. Liu, T.; Zhang, X.; Wang, X.; Yu, J.; Li, L. A Review of Zirconia-Based Solid Electrolytes. Ionics 2016, 22, 2249–2262. [Google Scholar] [CrossRef]
  4. Coutinho, M.M.; De Paula Nascimento, A.C.; Amarante, J.E.V.; Dos Santos, C.; De Almeida Ferreira, J.L.; Da Silva, C.R.M. Four-Point Bending Fatigue Behavior of Al2O3-ZrO2Ceramic Biocomposites Using CeO2 as Dopant. Mater. Res. 2022, 25, e20220199. [Google Scholar] [CrossRef]
  5. Dresvyannikov, A.F.; Petrova, E.V.; Kashfrazyeva, L.I. Electrochemical Synthesis of Precursors of Al2O3-ZrO2 Ceramic Stabilized with Cerium Oxide and Magnesium Aluminate. Inorganics 2022, 10, 57. [Google Scholar] [CrossRef]
  6. Inserra, B.; Coppola, B.; Montanaro, L.; Tulliani, J.M.; Palmero, P. Preparation and Characterization of Ce-ZrO2/Al2O3 Composites by DLP-Based Stereolithography. J. Eur. Ceram. Soc. 2023, 43, 2907–2916. [Google Scholar] [CrossRef]
  7. Kwon, S.Y.; Jung, I.H. Thermodynamic Assessment of the Al2O3–ZrO2, CaO–Al2O3–ZrO2, and Al2O3–SiO2–ZrO2 Systems. Ceram. Int. 2022, 48, 5413–5427. [Google Scholar] [CrossRef]
  8. Liu, S.; Song, Z.; Wang, J.; Han, B.; Sun, Y. In Situ Self-Assembly Preparation and Characterization of CaO–ZrO2 Nanopowders under Vacuum. Vacuum 2023, 213, 112089. [Google Scholar] [CrossRef]
  9. Asencios, Y.J.O.; Yigit, N.; Wicht, T.; Stöger-Pollach, M.; Lucrédio, A.F.; Marcos, F.C.F.; Assaf, E.M.; Rupprechter, G. Partial Oxidation of Bio-Methane over Nickel Supported on MgO–ZrO2 Solid Solutions. Top. Catal. 2023, 66, 1539–1552. [Google Scholar] [CrossRef]
  10. Lu, N.; He, G.; Yang, Z.; Yang, X.; Li, Y.; Li, J. Fabrication and Reaction Mechanism of MgO-Stabilized ZrO2 Powders by Combustion Synthesis. Ceram. Int. 2022, 48, 7261–7264. [Google Scholar] [CrossRef]
  11. Li, F.; Yang, H.; Zhang, J.; Gu, C.; Huo, J.; Jiang, L.; Wang, X.; Zhao, D. OH-PLIF Investigation of Y2O3-ZrO2 Coating Improving Flame Stability in a Narrow Channel. Chem. Eng. J. 2021, 405, 126708. [Google Scholar] [CrossRef]
  12. Cao, W.; Zhou, J.; Ren, C.; Omran, M.; Gao, L.; Tang, J.; Zhang, F.; Chen, G. Research on the Drying Kinetics for the Microwave Drying of Y2O3–ZrO2 Ceramic Powder. J. Mater. Res. Technol. 2023, 26, 4563–4580. [Google Scholar] [CrossRef]
  13. Komissarenko, D.A.; Sokolov, P.S.; Evstigneeva, A.D.; Slyusar, I.V.; Nartov, A.S.; Volkov, P.A.; Lyskov, N.V.; Evdokimov, P.V.; Putlayev, V.I.; Dosovitsky, A.E. DLP 3D Printing of Scandia-Stabilized Zirconia Ceramics. J. Eur. Ceram. Soc. 2021, 41, 684–690. [Google Scholar] [CrossRef]
  14. Mosiałek, M.; Hanif, M.B.; Šalkus, T.; Kežionis, A.; Kazakevičius, E.; Orliukas, A.F.; Socha, R.P.; Łasocha, W.; Dziubaniuk, M.; Wyrwa, J.; et al. Synthesis of Yb and Sc Stabilized Zirconia Electrolyte (Yb0.12Sc0.08Zr0.8O2−δ) for Intermediate Temperature SOFCs: Microstructural and Electrical Properties. Ceram. Int. 2023, 49, 15276–15283. [Google Scholar] [CrossRef]
  15. Luo, C.; Li, N.; Deng, T. Enhancement of Si3N4 Ceramics via Evolution of Grain Interface between ZrO2 and Si3N4 under Pressureless Sintering. J. Am. Ceram. Soc. 2023, 106, 7043–7056. [Google Scholar] [CrossRef]
  16. Parveen, A.; Chauhan, N.R.; Suhaib, M. Influence of Compaction Pressure and Si3N4/ZrO2 Reinforcement on the Properties of Aluminium Hybrid Composites. Adv. Mater. Process. Technol. 2022, 8, 2905–2917. [Google Scholar] [CrossRef]
  17. Traipanya, K.; Wasanapiarnpong, T.; Mongkolkachit, C. Fabrication and Characterizations of High Density Si3N4 - ZrO2 Ceramics. J. Met. Mater. Miner. 2023, 33, 1621. [Google Scholar] [CrossRef]
  18. Mu, T.; Xu, W.; Ling, J.; Dong, T.; Qin, Z.; Zhou, Y. Microstructure and Properties of ZrO2-AlN Composite Ceramics by Microwave Sintering. Wuji Cailiao Xuebao/J. Inorg. Mater. 2021, 36, 1231–1236. [Google Scholar] [CrossRef]
  19. Zang, X.; Lu, Y. Preparation and Dielectric Properties at High Frequency of AlN-Based Composited Ceramic. J. Mater. Sci. Mater. Electron. 2020, 31, 2826–2832. [Google Scholar] [CrossRef]
  20. Xing, Y.Z.; Men, Y.N.; Feng, X.; Geng, J.H.; Zou, Z.R.; Chen, F.H. Evolutions in the Microstructure and Ionic Conductivity of CuO-Doped Yttria-Stabilized Zirconia. J. Solid. State Chem. 2022, 315, 123497. [Google Scholar] [CrossRef]
  21. Farid, M.A.; Ijaz, S.; Ashiq, M.N.; Ehsan, M.F.; Gul, F.; Batool, S.R.; Athar, M.; ul Hassan, S. Synthesis of Mesoporous Zirconium Manganese Mixed Metal Oxide Nanowires for Photocatalytic Reduction of CO2. J. Mater. Res. 2022, 37, 522–532. [Google Scholar] [CrossRef]
  22. Anandan, K.; Rajendran, V. Size and Magnetic Effect of Manganese (Mn) Doped Zirconia (Zro2) Nanoparticles. Int. J. Innov. Technol. Explor. Eng. 2020, 9, 257–260. [Google Scholar] [CrossRef]
  23. Gao, L.; Guan, R.; Zhang, S.; Zhi, H.; Jin, C.; Jin, L.; Wei, Y.; Wang, J. As-Sintered Manganese-Stabilized Zirconia Ceramics with Excellent Electrical Conductivity. Crystals 2022, 12, 620. [Google Scholar] [CrossRef]
  24. Chang, C.H.; Lin, C.Y.; Chang, C.H.; Liu, F.H.; Huang, Y.T.; Liao, Y.S. Enhanced Biomedical Applicability of ZrO2–SiO2 Ceramic Composites in 3D Printed Bone Scaffolds. Sci. Rep. 2022, 12, 6845. [Google Scholar] [CrossRef] [PubMed]
  25. Akbarpour, S.; Khoshandam, B.; Maroufi, S. The Synthesis and Crystal Phase Evolution of SiO2-Stabilized Zirconia Nanocomposites at Low Temperatures for the Production of Zircon. J. Mater. Eng. Perform. 2023, 32, 6214–6225. [Google Scholar] [CrossRef]
  26. Zheng, X.; Hong, X.; Qiao, X.; Yang, Y.; Jiao, S. Highly Sensitive NO2 Sensor Based on Mesoporous ZrO2–WO3 Nanotubes Composite. Mater. Res. Bull. 2023, 167, 112394. [Google Scholar] [CrossRef]
  27. Pal, N.; Dutta, G.; Kharashi, K.; Murray, E.P. Investigation of an Impedimetric LaSrMnO3-Au/Y2O3-ZrO2-Al2O3 Composite NOx Sensor. Materials 2022, 15, 1165. [Google Scholar] [CrossRef]
  28. Pandiyan, R.; Vinothkumar, V.; Chen, T.W.; Chen, S.M.; Abinaya, M.; Rwei, S.P.; Hsu, H.Y.; Huang, C.W.; Yu, M.C. Synthesis of Ag@ZrO2 Nanoparticles: A Sensitive Electrochemical Sensor for Determination of Antibiotic Drug Tinidazole. Int. J. Electrochem. Sci. 2022, 17, 220414. [Google Scholar] [CrossRef]
  29. Feng, G.; Che, Y.; Wang, S.; Wang, S.; Hu, J.; Xiao, J.; Song, C.; Jiang, L. Sensitivity Enhancement of In2O3/ZrO2 Composite Based Acetone Gas Sensor: A Promising Collaborative Approach of ZrO2 as the Heterojunction and Dopant for in-Situ Grown Octahedron-like Particles. Sens. Actuators B Chem. 2022, 367, 132087. [Google Scholar] [CrossRef]
  30. Ferlazzo, A.; Espro, C.; Iannazzo, D.; Moulaee, K.; Neri, G. A Novel Yttria-Doped ZrO2 Based Conductometric Sensor for Hydrogen Leak Monitoring. Int. J. Hydrogen Energy 2022, 47, 9819–9828. [Google Scholar] [CrossRef]
  31. Dudek, M. Composite Oxide Electrolytes for Electrochemical Devices. Adv. Mater. Sci. 2008, 8, 15–30. [Google Scholar] [CrossRef]
  32. Escudero, M.J.; Valero, C.; Cauqui, M.Á.; Goma, D.; Yeste, M.P. Ni-Ce-ZrO2 System as Anode Material for Direct Internal Reforming Biogas Solid Oxide Fuel Cells. Fuel 2022, 322, 124247. [Google Scholar] [CrossRef]
  33. Li, S.; Guo, R.; Li, J.; Chen, Y.; Liu, W. Synthesis of NiO-ZrO2 Powders for Solid Oxide Fuel Cells. Ceram. Int. 2003, 29, 883–886. [Google Scholar] [CrossRef]
  34. Maiti, T.K.; Majhi, J.; Maiti, S.K.; Singh, J.; Dixit, P.; Rohilla, T.; Ghosh, S.; Bhushan, S.; Chattopadhyay, S. Zirconia- and Ceria-Based Electrolytes for Fuel Cell Applications: Critical Advancements toward Sustainable and Clean Energy Production. Environ. Sci. Pollut. Res. 2022, 29, 64489–64512. [Google Scholar] [CrossRef]
  35. Li, Z.; Men, Y.; Liu, S.; Wang, J.; Qin, K.; Tian, D.; Shi, T.; Zhang, L.; An, W. Boosting CO2 Hydrogenation Efficiency for Methanol Synthesis over Pd/In2O3/ZrO2 Catalysts by Crystalline Phase Effect. Appl. Surf. Sci. 2022, 603, 154420. [Google Scholar] [CrossRef]
  36. Mu, S.; Liu, K.; Li, H.; Zhao, Z.; Lyu, X.; Jiao, Y.; Li, X.; Gao, X.; Fan, X. Microwave-Assisted Synthesis of Highly Dispersed ZrO2 on CNTs as an Efficient Catalyst for Producing 5-Hydroxymethylfurfural (5-HMF). Fuel Process. Technol. 2022, 233, 107292. [Google Scholar] [CrossRef]
  37. Xu, Y.; Wang, M.; Xie, Z.; Tian, D.; Sheng, G.; Tang, X.; Li, H.; Wu, Y.; Song, C.; Gao, X.; et al. Insights into the Interfacial Structure of Cu/ZrO2 Catalysts for Methanol Synthesis from CO2 Hydrogenation: Effects of Cu-Supported Nano-ZrO2 Inverse Interface. Chem. Eng. J. 2023, 470, 144006. [Google Scholar] [CrossRef]
  38. Ge, Y.; Zou, T.; Martín, A.J.; Pérez-Ramírez, J. ZrO2-Promoted Cu-Co, Cu-Fe and Co-Fe Catalysts for Higher Alcohol Synthesis. ACS Catal. 2023, 13, 9946–9959. [Google Scholar] [CrossRef]
  39. Sasaki, K.; Natsukoshi, K.; Yamada, K.; Ikegawa, K.; Yasutake, M.; Tachikawa, Y.; Lyth, S.M.; Matsuda, J.; Yildiz, B.; Tuller, H.L. Reversible Solid Oxide Cells: Selection of Fuel Electrode Materials for Improved Performance and Durability. ECS Trans. 2023, 111, 1901. [Google Scholar] [CrossRef]
  40. Yusupandi, F.; Devianto, H.; Widiatmoko, P.; Nurdin, I.; Yoon, S.P.; Lim, T.H.; Arif, A.F. Performance Evaluation of An Electrolyte-Supported Intermediate-Temperature Solid Oxide Fuel Cell (IT-SOFC) with Low-Cost Materials. Int. J. Renew. Energy Dev. 2022, 11, 1037–1042. [Google Scholar] [CrossRef]
  41. Svitlyk, V.; Weiss, S.; Hennig, C. Stability of Doped Zirconia under Extreme Conditions: Toward Long-Term and Secure Storage of Radioactive Waste. J. Am. Ceram. Soc. 2022, 105, 7831–7839. [Google Scholar] [CrossRef]
  42. Abdala, P.M.; Craievich, A.F.; Fantini, M.C.A.; Temperini, M.L.A.; Lamas, D.G. Metastable Phase Diagram of Nanocrystalline ZrO2-Sc2O3 Solid Solutions. J. Phys. Chem. C 2009, 113, 18661–18666. [Google Scholar] [CrossRef]
  43. Arachi, Y.; Sakai, H.; Yamamoto, O.; Takeda, Y.; Imanishai, N. Electrical Conductivity of the ZrO2-Ln2O3 (Ln = Lanthanides) System. Solid. State Ion. 1999, 121, 133–139. [Google Scholar] [CrossRef]
  44. Salomone, F.; Sartoretti, E.; Ballauri, S.; Castellino, M.; Novara, C.; Giorgis, F.; Pirone, R.; Bensaid, S. CO2 Hydrogenation to Methanol over Zr- and Ce-Doped Indium Oxide. Catal. Today 2023, 423, 114023. [Google Scholar] [CrossRef]
  45. Nan, Y.; Mao, Y.; Zha, F.; Yang, Z.; Ma, S.; Tian, H. ZrO2–ZnO–CeO2 Integrated with Nano-Sized SAPO-34 Zeolite for CO2 Hydrogenation to Light Olefins. React. Kinet. Mech. Catal. 2022, 135, 2959–2972. [Google Scholar] [CrossRef]
  46. Suarez Anzorena, R.; Muñoz, F.F.; Toscani, L.M.; Bonelli, P.; Cukierman, A.L.; Larrondo, S.A. Ce–Zr-Sm Ternary Oxides Synthesized via a Template Free Urea-Hydrothermal Method. Ceram. Int. 2022, 48, 25714–25722. [Google Scholar] [CrossRef]
  47. Fazl, F.; Gholivand, M.B. High Performance Electrochemical Method for Simultaneous Determination Dopamine, Serotonin, and Tryptophan by ZrO2–CuO Co-Doped CeO2 Modified Carbon Paste Electrode. Talanta 2022, 239, 122982. [Google Scholar] [CrossRef]
  48. Arfaoui, J.; Ghorbel, A.; Petitto, C.; Delahay, G. New MoO3-CeO2-ZrO2 and WO3-CeO2-ZrO2 Nanostructured Mesoporous Aerogel Catalysts for the NH3-SCR of NO from Diesel Engine Exhaust. J. Ind. Eng. Chem. 2021, 95, 182–189. [Google Scholar] [CrossRef]
  49. Kurapova, O.Y.; Shugurov, S.M.; Vasil’eva, E.A.; Savelev, D.A.; Konakov, V.G.; Lopatin, S.I. Thermal Prehistory, Structure and High-Temperature Thermodynamic Properties of Y2O3-CeO2 and Y2O3-ZrO2-CeO2 Solid Solutions. Ceram. Int. 2021, 47, 11072–11079. [Google Scholar] [CrossRef]
  50. Kurapova, O.Y.; Glukharev, A.G.; Glumov, O.V.; Konakov, V.G. The Effect of the Sintering Parameters on the Structure and Oxygen Ion Conductivity of Y2O3–ZrO2–CeO2 Ceramics. Open Ceram. 2021, 5, 100086. [Google Scholar] [CrossRef]
  51. Mileva, A.; Tsoncheva, T.; Issa, G.; Dimitrov, M.; Kovacheva, D.; Henych, J. Nanosized CuO-CeO2 -TiO2 and CuO-ZrO2-TiO2 Composites as Catalysts for Methanol Decomposition: Effect of Modification Procedure. J. Chem. Technol. Metall. 2021, 56, 782–790. [Google Scholar]
  52. Kornienko, O.A.; Andrievskaya, O.R.; Barshchevskaya, H.K. Phase Relations in the System Ternary Based on Ceria, Zirconia and Ytterbia at 1500 °C. J. Chem. Technol. 2021, 28, 142–152. [Google Scholar] [CrossRef]
  53. Demchenko, I.N.; Nikiforow, K.; Chernyshova, M.; Melikhov, Y.; Syryanyy, Y.; Korsunska, N.; Khomenkova, L.; Brodnikovskyi, Y.; Brodnikovskyi, D. X-Ray Photoelectron Spectroscopy Analysis of Scandia-Ceria-Stabilized Zirconia Composites with Different Transport Properties. Materials 2023, 16, 5504. [Google Scholar] [CrossRef] [PubMed]
  54. Yuze, I.L.; Ng, C.K.; Poon, K.L.; Ting, C.H.; Ramesh, S.; Chuah, Y.D.; Tan, C.Y.; Sara Lee, K.Y.; Sutharsini, U. Effects of Sintering on the Properties of Ceria Co-Doped Scandia Stabilised Zirconia. In Proceedings of the AIP Conference Proceedings; AIP Press: New York, NY, USA, 2023; Volume 2643. [Google Scholar]
  55. Arifin, N.A.; Afifi, A.A.; Samreen, A.; Hafriz, R.S.R.M.; Muchtar, A. Characteristic and Challenges of Scandia Stabilized Zirconia as Solid Oxide Fuel Cell MaterialIn Depth Review. Solid. State Ion. 2023, 399, 116302. [Google Scholar] [CrossRef]
  56. Agarkov, D.; Borik, M.; Komarov, B.; Korableva, G.; Kulebyakin, A.; Kuritsyna, I.; Lomonova, E.; Milovich, F.; Myzina, V.; Tabachkova, N. Long-Term Conductivity Stability of Electrolytic Membranes of Scandia Stabilized Zirconia Co-Doped with Ytterbia. Membranes 2023, 13, 586. [Google Scholar] [CrossRef]
  57. Taniguchi, S.; Miyara, K.; Kawabata, T.; Uryu, C.; Inoue, Y.; Chou, J.-T.; Sasaki, K. Stability of Nickel/Scandia-Doped-Stabilized-Zirconia Composite Anode Under High Fuel Utilization Conditions. ECS Trans. 2021, 103, 1879–1883. [Google Scholar] [CrossRef]
  58. Aflaki, M.; Davar, F.; Loghman Estarki, M.R.; Wang, R.; Guo, L. Sc3+:Ce4+:Y3+ Doped Zirconia Nanopowders (ScCeYSZ): Synthesis, Thermal Phase Stability and Hot Corrosion Behavior of Spark Plasma Sintered Body. Arab. J. Chem. 2023, 16, 105160. [Google Scholar] [CrossRef]
  59. Kishimoto, A.; Umemura, T.; Kondo, S.; Teranishi, T. Ceria-Based Solid Electrolyte Exhibits Superior Mechanical and Electric Properties Compared to Zirconia-Based Solid Electrolyte. Ceram. Int. 2022, 48, 21824–21831. [Google Scholar] [CrossRef]
  60. Momin, N.; Manjanna, J.; Aruna, S.T.; Senthil Kumar, S.; Anjaneya, K.C. Effect of 20 mol % Gadolinium Doping on Oxide Ion Conductivity of Ceria as Electrolyte for Intermediate Temperature Solid Oxide Fuel Cells. Ceram. Int. 2022, 48, 35867–35873. [Google Scholar] [CrossRef]
  61. Acharya, S.A.; Gaikwad, V.M. Understanding of Dynamics of Electrical Processes in Nanostructured Gd-Doped Ceria. Ferroelectrics 2022, 588, 164–179. [Google Scholar] [CrossRef]
  62. Kemp, D.; Tarancón, A.; De Souza, R.A. Recipes for Superior Ionic Conductivities in Thin-Film Ceria-Based Electrolytes. Phys. Chem. Chem. Phys. 2022, 24, 12926–12936. [Google Scholar] [CrossRef] [PubMed]
  63. Araujo, A.J.M.; Loureiro, F.J.A.; Holz, L.I.V.; Grilo, J.P.F.; Macedo, D.A.; Paskocimas, C.A.; Fagg, D.P. Composite of Ca-Cobaltite with Pr-Doped Ceria as Oxygen Electrode for Solid Oxide Electrochemical Cells. ECS Meet. Abstr. 2021, MA2021-03, 129. [Google Scholar] [CrossRef]
  64. Nicholas, J.D.; De Jonghe, L.C. Prediction and evaluation of sintering aids for Cerium Gadolinium Oxide. Solid State Ionics 2007, 178, 1187–1194. [Google Scholar] [CrossRef]
  65. Ramesh, S. Electrical Properties of a Nanosynthesized PGDC Electrolyte Material. J. Nano-Electron. Phys. 2022, 14, 02017. [Google Scholar] [CrossRef]
  66. Durgesh, R.; Pal, K. Mohan Kant Comprehensive Analysis of Ce1−xSmxO2−δ Solid Electrolytes: Structural, Microstructural, and Electrochemical Characterization for Intermediate Temperature Solid Oxide Fuel Cells. ECS J. Solid. State Sci. Technol. 2023, 12, 083012. [Google Scholar]
  67. Gager, E.; Nino, J.C. Processing, Phase Stability, and Conductivity of Multication-Doped Ceria. Inorganics 2023, 11, 299. [Google Scholar] [CrossRef]
  68. Madhual, S.; Kumar, P.P. Insights on Oxide Ion Transport in Yttria-Doped Ceria from Molecular Dynamics Simulations. J. Mater. Sci. 2023, 58, 4499–4512. [Google Scholar] [CrossRef]
  69. Artini, C.; Viviani, M.; Presto, S.; Massardo, S.; Carnasciali, M.M.; Gigli, L.; Pani, M. Correlations between Structure, Microstructure and Ionic Conductivity in (Gd,Sm)-Doped Ceria. Phys. Chem. Chem. Phys. 2022, 24, 23622–23633. [Google Scholar] [CrossRef]
  70. Ajith Kumar, S.; Kuppusami, P.; Amirthapandian, S.; Fu, Y.P. Effect of Sm Co-Doping on Structural, Mechanical and Electrical Properties of Gd Doped Ceria Solid Electrolytes for Intermediate Temperature Solid Oxide Fuel Cells. Int. J. Hydrogen Energy 2020, 45, 29690–29704. [Google Scholar] [CrossRef]
  71. Bocardo-Roldán, C.; Díaz-Guillén, J.A.; Díaz-Guillén, J.C.; Fuentes, A.F.; Padmadas, P.K. The Electrical Properties of Zr Doped Ce0.6Y0.4O2−δ Solid Electrolytes for Solid Oxide Fuel Cell Applications. ECS Trans. 2023, 110, 215–223. [Google Scholar] [CrossRef]
  72. Kaur, T.; Singh, K.; Kolte, J. Effect of Intrinsic and Extrinsic Oxygen Vacancies on the Conductivity of Gd-Doped CeO2 Synthesized by a Sonochemical Route. J. Phys. Chem. C 2022, 126, 18018–18028. [Google Scholar] [CrossRef]
  73. Vinchhi, P.; Patel, R.; Mukhopadhyay, I.; Ray, A.; Pati, R. Effect of Doping Concentration on Grain Boundary Conductivity of Samaria Doped Ceria Composites. J. Electrochem. Soc. 2021, 168, 124515. [Google Scholar] [CrossRef]
  74. Anirban, S.K.; Dutta, A. Revisiting Ionic Conductivity of Rare Earth Doped Ceria: Dependency on different factors. Int. J. Hydrogen Energy 2020, 45, 25139. [Google Scholar] [CrossRef]
  75. Steele, B.C.H. Appraisal of Ce1−yGdyO2−y/2 Electrolytes for IT-SOFC Operation at 500 °C. Solid. State Ion. 2000, 129, 95–110. [Google Scholar] [CrossRef]
  76. Terio Corporation. Available online: http://www.terio.cn/product (accessed on 13 October 2024).
  77. Cubic Zirconia. Available online: https://rruff.info/tmp_rruff/Cubiczirconia__R110112-9__Powder__Xray_Data_XY_RAW__10945.rruff (accessed on 13 October 2024).
  78. Cerianite. Available online: https://rruff.info/repository/sample_child_record_powder/by_minerals/CerianiteCe__R050379-9__Powder__Xray_Data_XY_Processed__2482.txt (accessed on 13 October 2024).
  79. Kežionis, A.; Šalkus, T.; Dudek, M.; Madej, D.; Mosiałek, M.; Napruszewska, B.D.; Łasocha, W.; Hanif, M.B.; Motola, M. Investigation of Alumina- and Scandia-Doped Zirconia Electrolyte for Solid Oxide Fuel Cell Applications: Insights from Broadband Impedance Spectroscopy and Distribution of Relaxation Times Analysis. J. Power Sources 2024, 591, 233846. [Google Scholar] [CrossRef]
  80. Shirbhate, S.; Gaikwad, V.; Acharya, S. Oxygen vacancies disordering and oxy-ion diffusion mechanism in doped ceria electrolytes under IT-SOFC operating conditions. J. Solid. State Electrochem. 2022, 26, 133–148. [Google Scholar] [CrossRef]
  81. Ramamoorthy, R.; Dutta, P.K.; Akbar, S.A. Oxygen sensors: Materials, methods, designs and applications. J. Mater. Sci. 2003, 38, 4271. [Google Scholar] [CrossRef]
  82. Alberti, G.; Casciola, M.; Chieli, S.; Palombari, R. Use of solid state protonic conductors for oxygen potentiometric sensor at room temperature. Solid. State Ion. 1991, 46, 183. [Google Scholar] [CrossRef]
  83. Xie, L.; Li, Z.; Sun, L.; Dong, B.; Fatima, Q.; Wang, Z.; Yao, Z.; Haidry, A.A. Sol-Gel Synthesis of TiO2 with p-Type Response to Hydrogen Gas at Elevated Temperature. Front. Mater. 2019, 6, 96. [Google Scholar] [CrossRef]
  84. Ciftyurek, E.; Li, Z.; Schierbaum, K. Adsorbed Oxygen Ions and Oxygen Vacancies: Their Concentration and Distribution in Metal Oxide Chemical Sensors and Influencing Role in Sensitivity and Sensing Mechanisms. Sensors 2023, 23, 29. [Google Scholar] [CrossRef]
  85. Yu, Y.; Shah, M.A.K.Y.; Wang, H.; Cheng, X.; Guo, L.; Huang, J.; Lund, P.; Zhu, B. Synergistic Proton and Oxygen Ion Transport in Fluorite Oxide-Ion Conductor. Energy Mater. Adv. 2024, 5, 81. [Google Scholar] [CrossRef]
  86. Kwak, D.; Lei, Y.; Maric, R. Ammonia Gas Sensors: A Comprehensive Review. Talanta 2019, 204, 713–730. [Google Scholar] [CrossRef] [PubMed]
  87. Gorbova, E.; Tzorbatzoglou, F.; Molochas, C.; Chloros, D.; Demin, A.; Tsiakaras, P. Fundamentals and Principles of Solid-State Electrochemical Sensors for High Temperature Gas Detection. Catalysts 2022, 12, 1. [Google Scholar] [CrossRef]
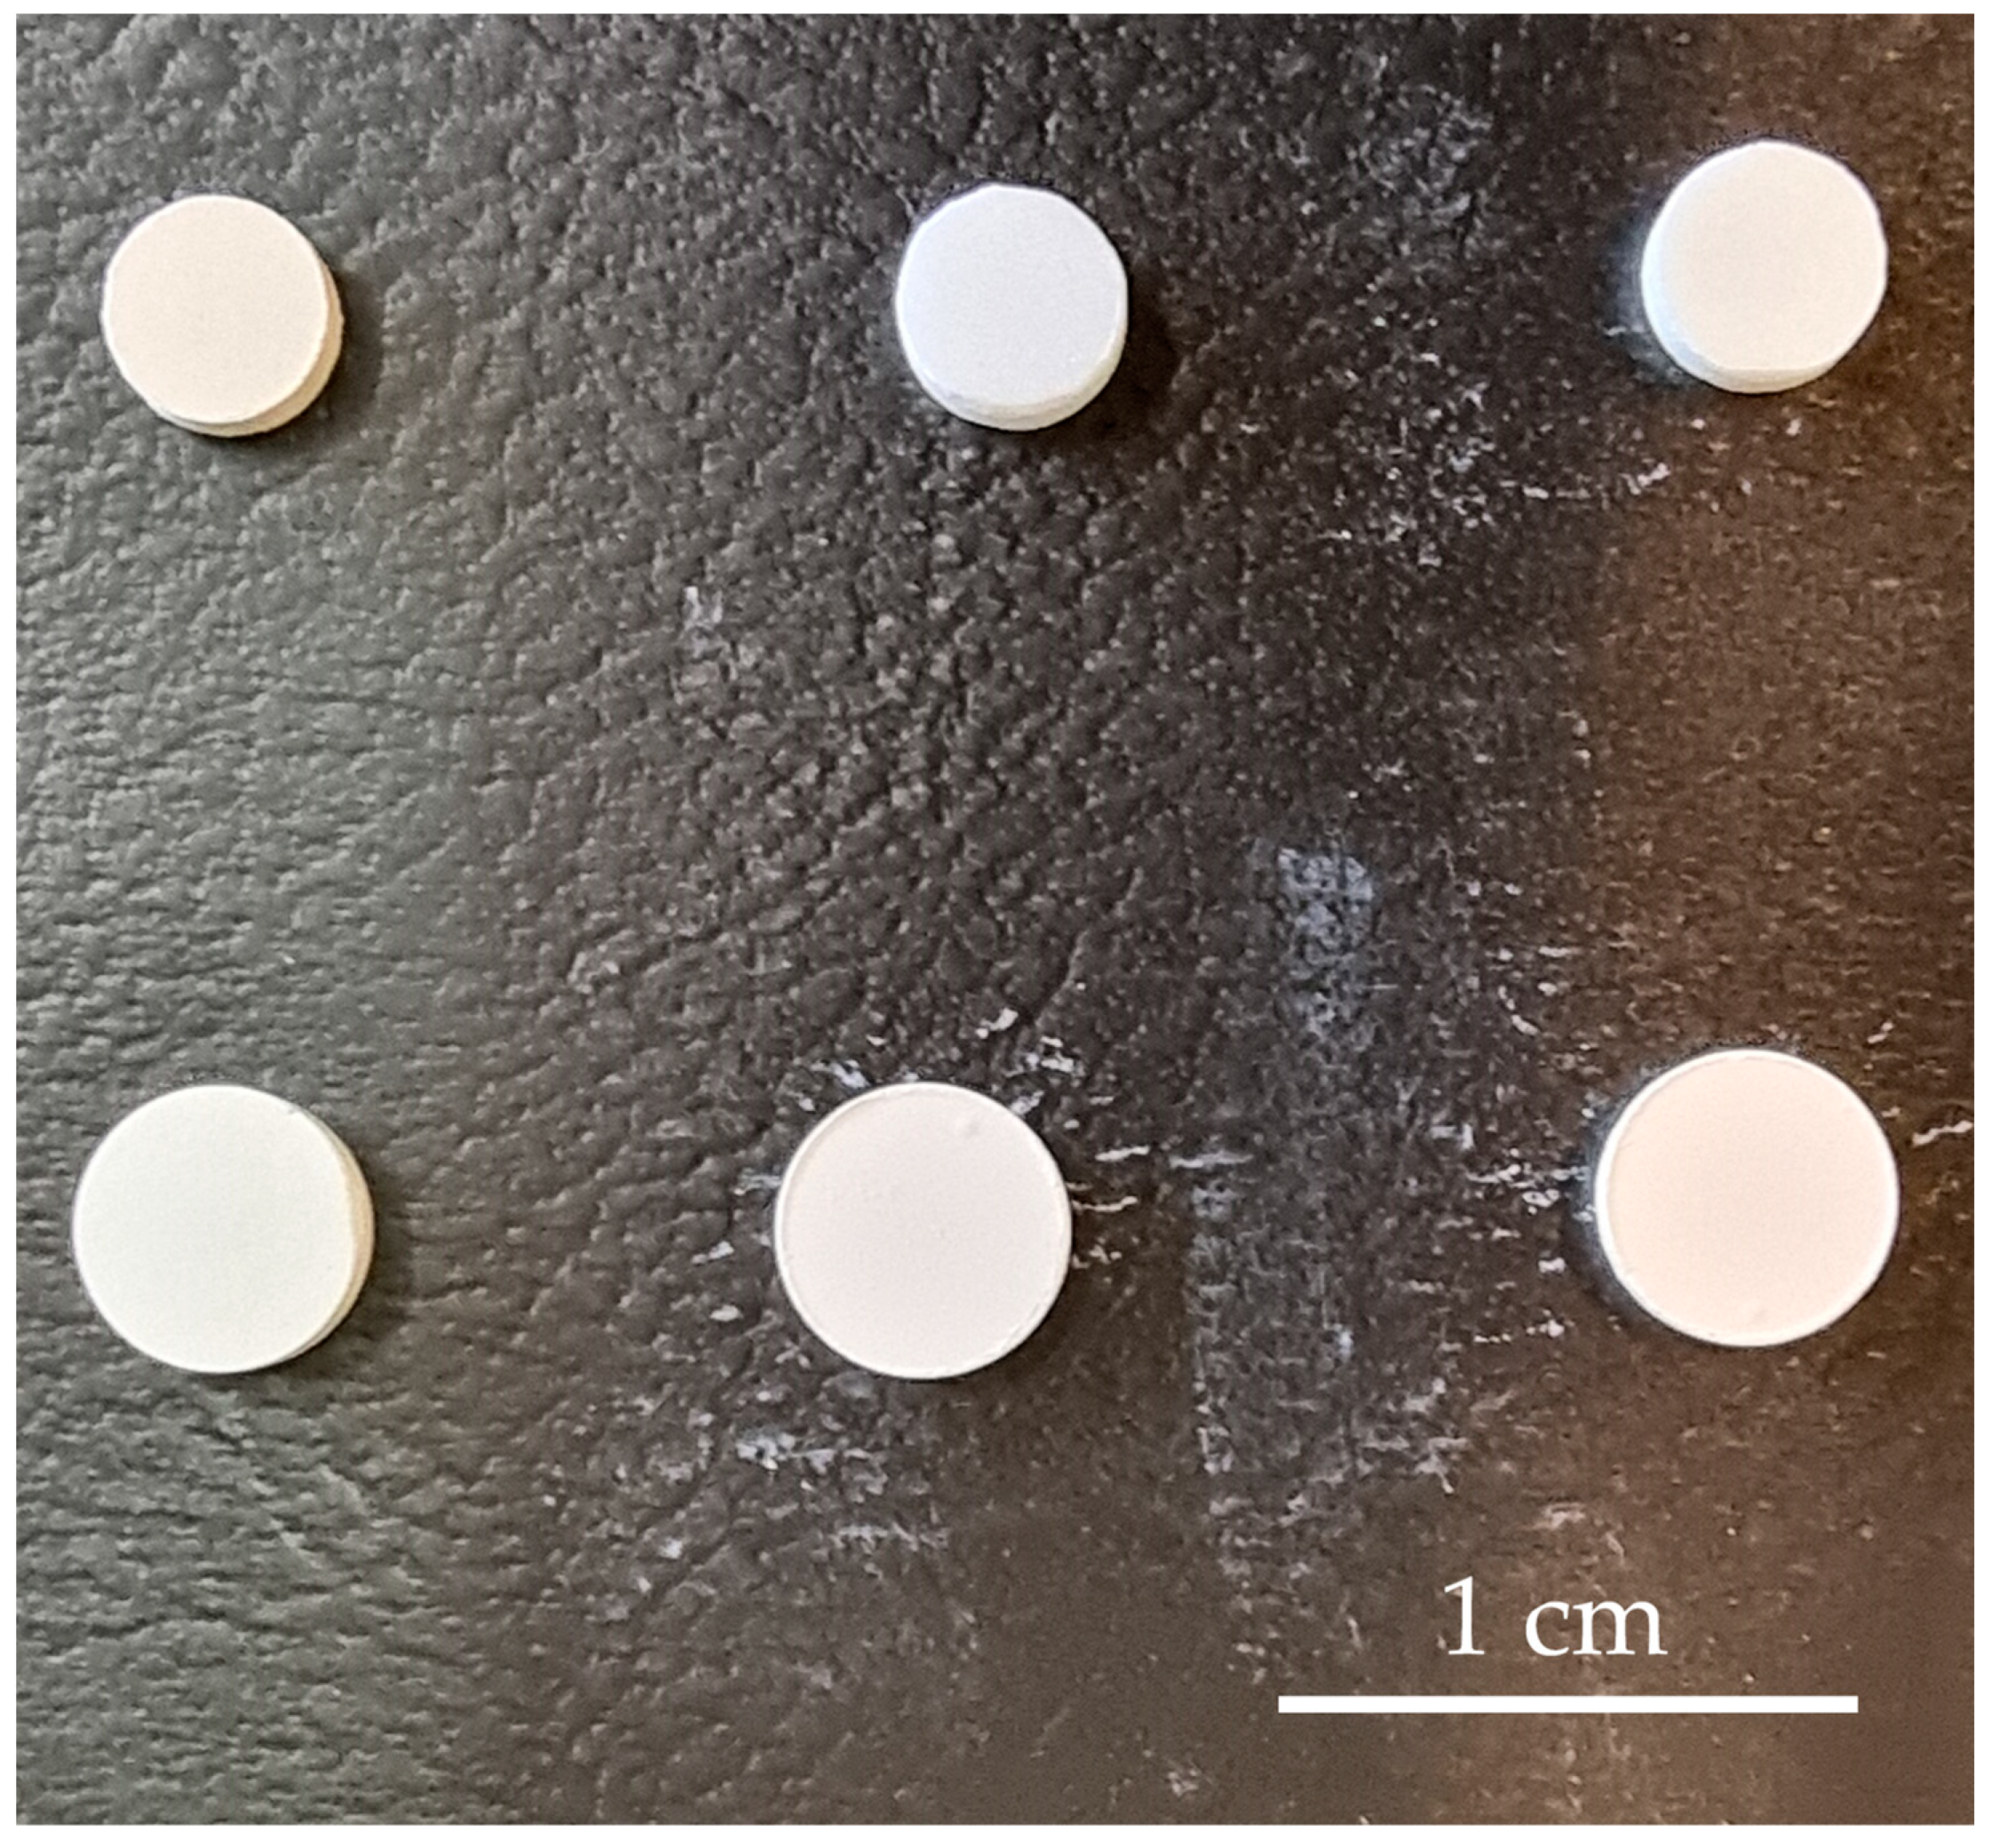
Figure 1. The comparison of green bodies (bottom row) with sintered specimens (upper row) in order: GDC, ScCeSZ, and ScYbSZ.
Materials 17 05224 g001
Figure 2. Experimental set for EIS measurements.
Materials 17 05224 g002
Figure 3. The specimen holder for EIS measurements.
Materials 17 05224 g003
Figure 4. The XRD patterns with labeled peaks characteristic for cubic phase recorded for sintered samples (a) GDC, (b) ScCeSZ, (c) ScYbSZ.
Materials 17 05224 g004
Figure 5. Surface morphology of sintered samples presented on SEM images at different magnifications for (1a,1b) GDC, (2a,2b) ScCeSZ, and (3a,3b) ScYbSZ.
Materials 17 05224 g005
Figure 6. Evolution of EIS spectrum of GDC in H2-containing atmosphere with rising temperature; red line obtained using presented equivalent circuits for parameters values collated in tables at temperatures (a) 200 °C, (b) 500 °C, and (c) 550 °C.
Materials 17 05224 g006
Figure 7. Changes in electrical properties caused by exposition on ammonia- and hydrogen-containing atmospheres presented as Nyquist spectra from EIS at 450 °C for (1) GDC, (2) ScCeSZ, and (3) ScYbSZ; column (b) contains magnified high-frequency bottom-right corner region of spectra from (a) column.
Materials 17 05224 g007
Figure 8. Summary of electrochemical response and reversibility of the probes for exposition on ammonia- and hydrogen-containing atmospheres presented in Arrhenius plots with calculated energy of activation values for (1) GDC, (2) ScCeSZ, and (3) ScYbSZ.
Materials 17 05224 g008
Table 1. Specific conductivity values of Ce(Re)O2−δ materials according to the literature [75].
Compositionσ−1 m−1 500 °Cσ−1 m−1 600 °Cσ−1 m−1 700 °C
Ce0.9Gd0.1O2−δ9.5 × 10−12.53 × 1005.44 × 101
Ce0.9Sm0.1O2−δ3.3 × 1009.0 × 10−12.00 × 100
Ce0.9Y0.1O2−δ8.7 × 10−13.44 × 1001.015 × 101
Ce0.8Gd0.2O2−δ5.3 × 10−11.8 × 1004.700 × 100
Table 2. Experimental phase compositions with crystallographic data obtained from XRD analysis collated with elemental composition from EDAX EDS analysis compared with theoretical values.
Specimen LabelAssumed
Composition
Composition by XRD with Lattice ConstantElementExperimental Content/%wtTheoretical Content/%wt
GDCCe0.8Gd0.2O1.9CeO2 100%
a = 0.54547 nm
O12.9417.49
Ce67.3864.42
Gd19.6718.09
ScCeSZSc0.1Ce0.01Zr0.89O1.95c-ZrO2 96.3%
a = 0.51254 nm
CeO2 3.7%
O13.626.38
Y1.510.00
Zr72.0468.64
Sc9.693.80
Ce3.161.18
ScYbSZSc0.09Yb0.01Zr0.9O1.95c-ZrO2 100%
a = 0.50906 nm
O17.0526.20
Zr57.9068.95
Sc2.833.40
Yb22.211.45
Table 3. Increase in specific conductivities obtained in 1 series in air with risen temperatures from EIS spectra analysis and geometry of the samples.
Temperature/°C/°CSpecimen Conduction/Ω−1 m−1
GDCScCeSZScYbSZ
2002.55 × 10−64.57 × 10−73.48 × 10−7
3001.51 × 10−47.44 × 10−56.42 × 10−5
4002.04 × 10−34.67 × 10−32.07 × 10−3
4505.61 × 10−31.91 × 10−26.88 × 10−3
5001.38 × 10−25.64 × 10−21.97 × 10−2
5503.01 × 10−21.37 × 10−14.74 × 10−2
6007.32 × 10−22.90 × 10−11.04 × 10−1
Disclaimer/Publisher’s Note: The statements, opinions and data contained in all publications are solely those of the individual author(s) and contributor(s) and not of MDPI and/or the editor(s). MDPI and/or the editor(s) disclaim responsibility for any injury to people or property resulting from any ideas, methods, instructions or products referred to in the content.