Article

Preparation and Performance Study of High-Strength and Corrosion-Resistant Cement-Based Materials Applied in Coastal Acid Rain Areas

1
College of Civil and Transportation Engineering, Shenzhen University, Shenzhen 518060, China
2
Key Laboratory of Ministry of Education for Tropical Marine Biological Resources Utilization and Protection, College of Fisheries and Life Science, Hainan Tropical Ocean University, Sanya 572022, China
3
School of Civil Engineering and Architecture, Hainan University, Haikou 570228, China
*
Author to whom correspondence should be addressed.
Materials 2024, 17(3), 752; https://doi.org/10.3390/ma17030752
Submission received: 26 December 2023 / Revised: 23 January 2024 / Accepted: 30 January 2024 / Published: 4 February 2024
(This article belongs to the Section Construction and Building Materials)

Abstract

:
Investigations regarding the preparation and durability of cement-based materials applied in specific coastal acid rain environments are scarce, particularly those involving the addition of four auxiliary cementitious materials (ACMs) to cement for modification. To improve the durability of concrete structures in coastal acid rain areas, a systematic study was conducted regarding the preparation of high-strength and corrosion-resistant cement-based materials using ACM systems composed of fly ash (FA), granulated blast furnace slag (GBFS), silica fume (SF), and desulfurization gypsum (DG) instead of partial cement. Through an orthogonal experimental design, the effect of the water–binder ratio, cementitious ratio, and replacement cement ratio on the compressive strength, corrosion resistance coefficient, and chloride ion permeability coefficient of the materials were analyzed and the mix proportions of the materials were evaluated and optimized using the comprehensive scoring method. The results show that implementing a FA:GBFS:SF:DG ratio of 2:6:1:1 to replace 60% of cement allows the consumption of calcium hydroxide crystals generated through cement hydration, promotes the formation of ettringite, optimizes the pore structures of cementitious materials, and improves the compressive strength, acid corrosion resistance, and chloride ion permeability of the materials. This study provides a reference for selecting concrete materials for buildings in coastal acid rain environments.

1. Introduction

The deterioration in the durability of concrete structures in coastal environments is primarily attributed to the corrosion and strength degradation of steel bars in concrete caused by chloride ion penetration [1]. Under certain climatic conditions, such as in concrete structures in the central and eastern regions of China, as well as in the Pearl River Delta region of China, which are all located in coastal and acid rain areas, concrete structures are subject not only to the infiltration of chloride in coastal and atmospheric environments [2,3] but also to the erosion of H+, sulfate, and nitrate in acid rain [4]. Therefore, the durability and service lives of buildings in coastal acid rain areas are threatened by acid corrosion and chloride erosion [5]. Many scholars [6,7,8,9,10,11] have investigated the effect of single environments, such as chloride or acidic environments, on the durability of cement-based materials; however, methods to improve the performance of cement-based materials through various auxiliary cementitious materials (ACMs) in complex coastal acid rain environments are rarely investigated.
Research has shown that when an ACM, such as fly ash (FA) [12,13,14], granulated blast furnace slag (GBFS) [12], or silica fume (SF) [15], is added to cement, the slow pozzolanic effect reduces the strength of cement-based materials during the early hydration period, although their strength improves in the later hydration period. The proportion of cement replaced by mineral admixtures in the above studies was mostly 5–20%. This was because the incorporation of a large amount of GBFS would not only lead to a significant decrease in the compressive strength of the cementitious material system but also lead to an increase in the microstructure porosity of the system [16,17,18]. The high content of FA would lead to the deterioration of the fracture toughness of the cementitious material system, forming a brittle material [19]. The addition of two or three ACMs to cement imposes a better effect as compared with their sole addition. Additionally, compared with the sole addition of FA or SF, the addition of FA and SF composite cementitious materials to cement can improve the compressive strength, chloride ion penetration resistance, and acid corrosion resistance of cement-based materials [20,21,22,23]. Compared with adding GBFS alone, adding desulfurization gypsum (DG) and GBFS composite cementitious materials to cement can improve the chloride ion penetration resistance of cement-based materials [24,25]. Meanwhile, compared with single or double addition, adding FA, GBFS, and SF composite cementitious materials to cement has been reported to increase the compressive strength of cement-based materials [26]. Therefore, the addition of three or fewer ACMs has been investigated to improve the strength and durability of cement-based materials. However, studies regarding methods to improve the performance of cement-based materials by adding four or more ACMs to cement, particularly when applied in coastal acid rain areas, are rarely performed. This is because the corrosion of acidic substances and chloride ion penetration in these particular areas affect the durability and service lives of concrete structures, which must be considered deliberately [5].
In this study, a FA–GBFS–SF–DG ACM system was incorporated into cement via an orthogonal experimental design to investigate the effect of the water–binder ratio, cementitious ratio, and replacement cement ratio on the compressive strength, acid medium erosion resistance, and chloride ion penetration resistance of cement-based materials. An appropriate mix proportion of a cement-based material with good durability and high strength was selected, thus providing a reference for selecting concrete materials for buildings in coastal acid rain environments.

2. Materials and Methods
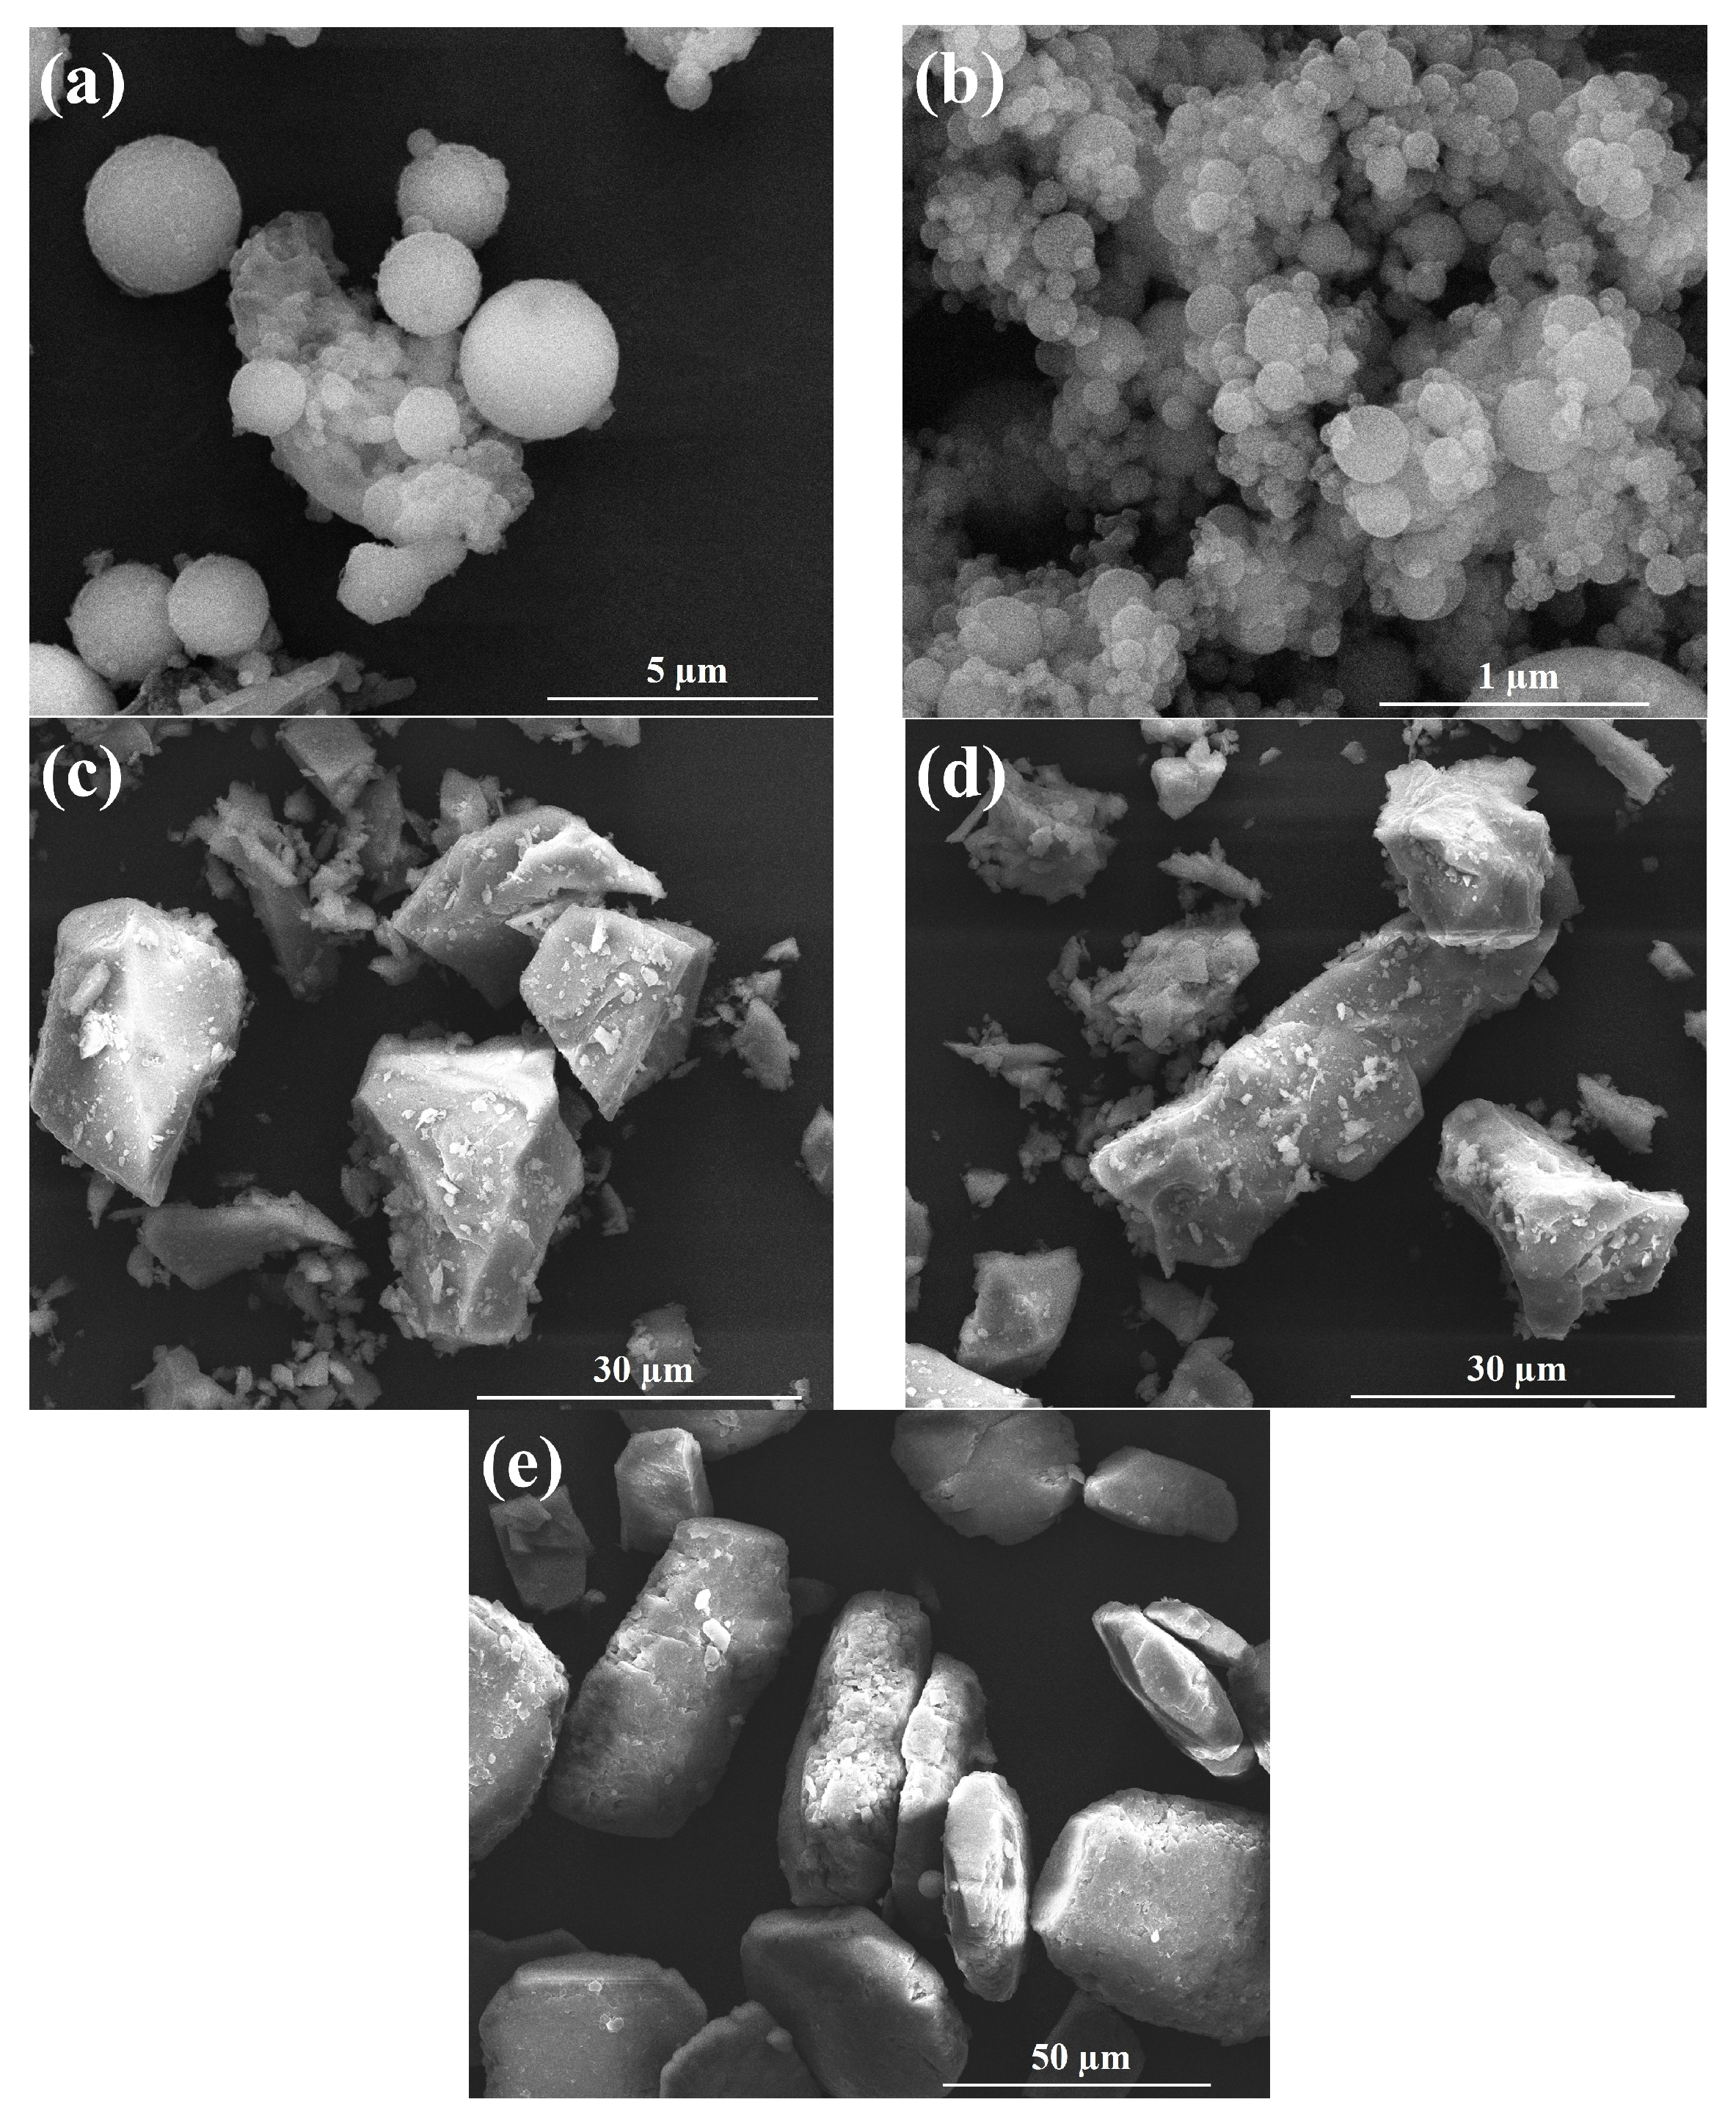
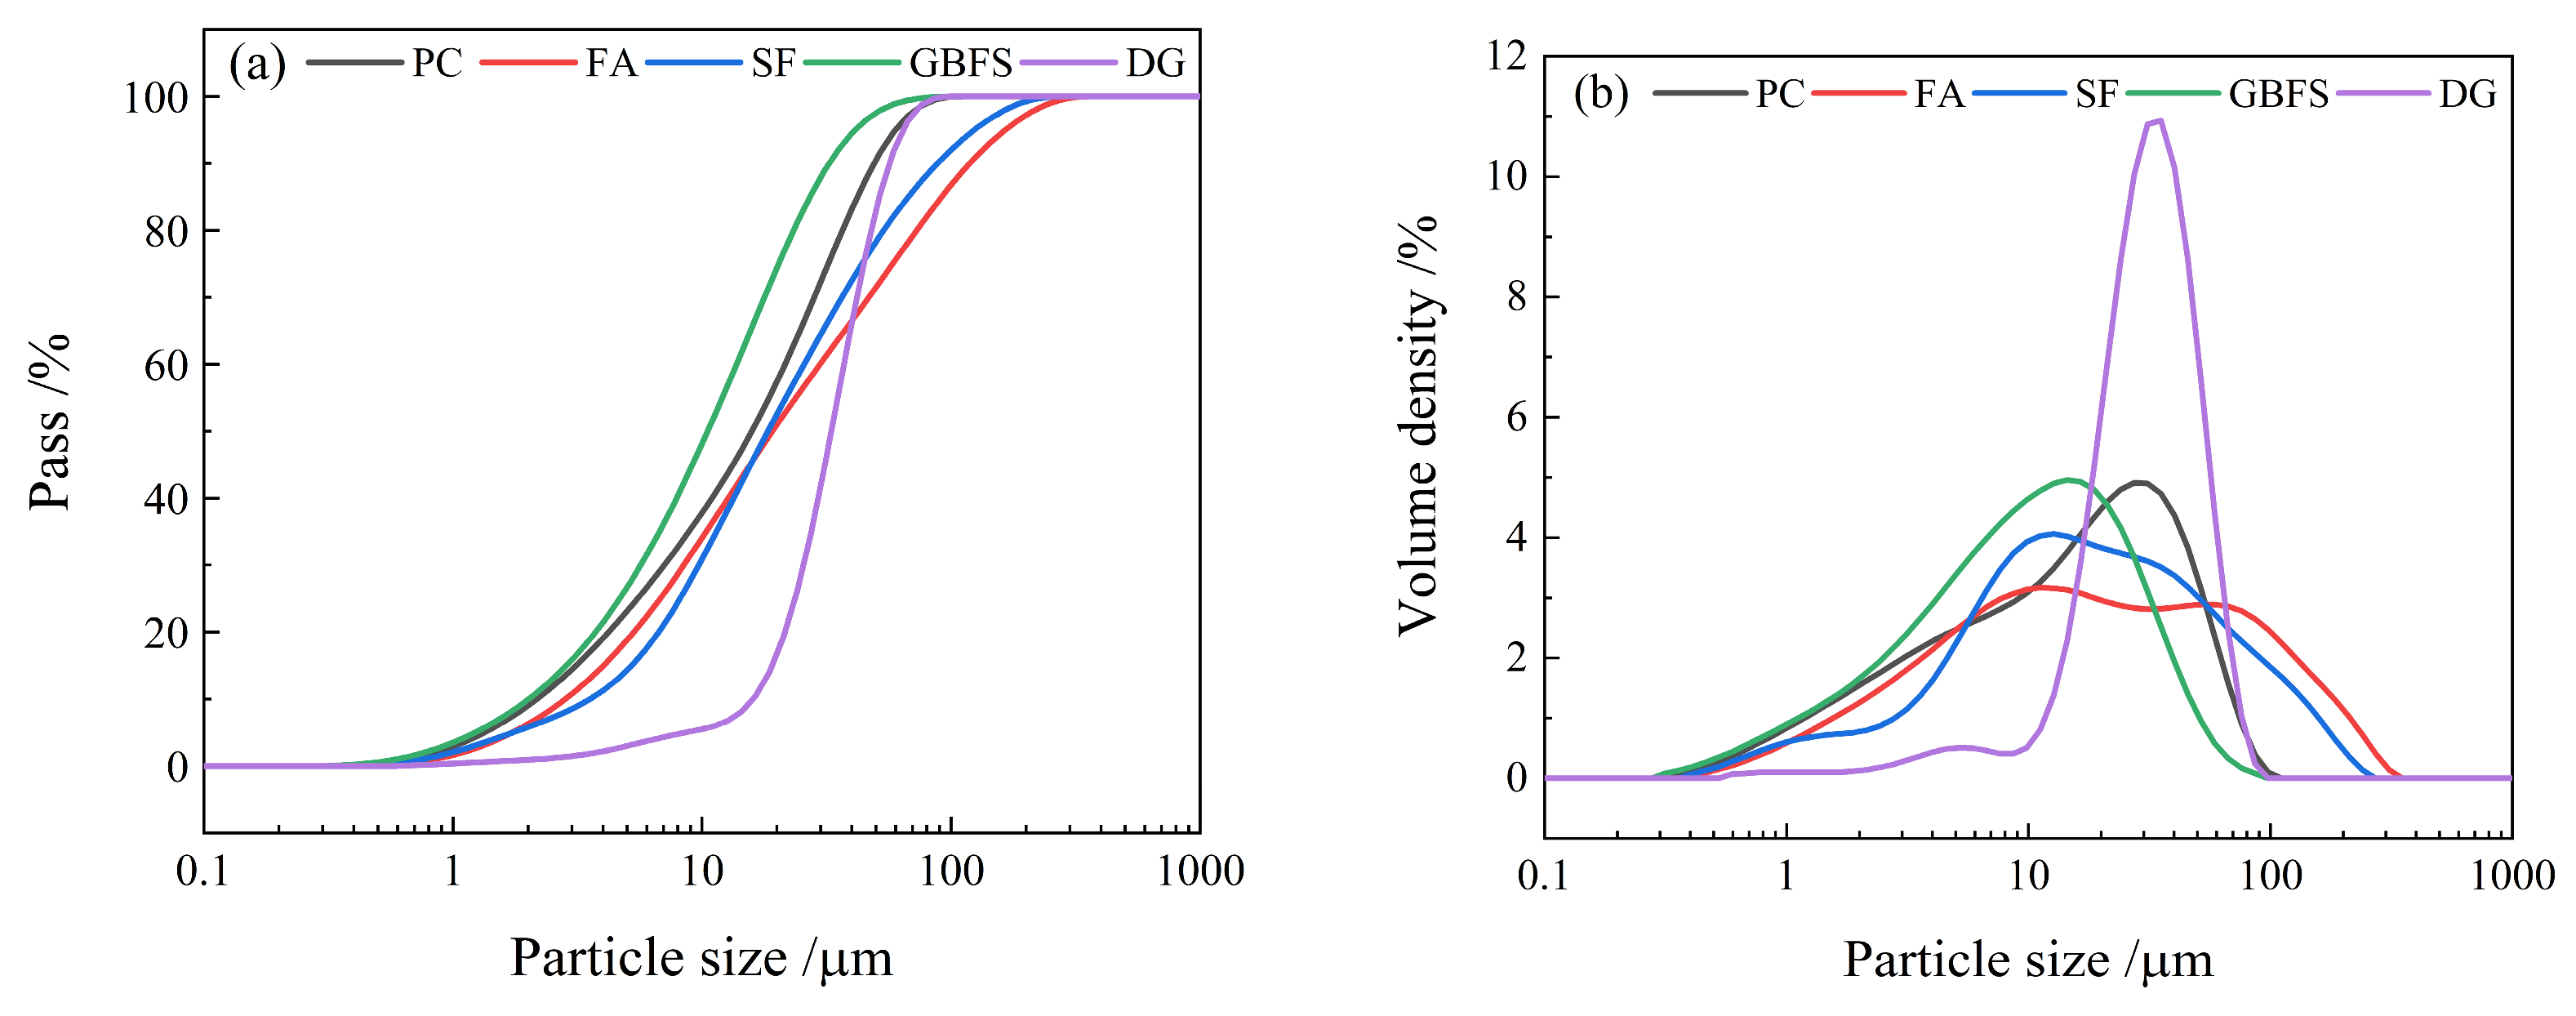
2.1. Raw Materials

In this study, FA, GBFS, SFSF and DG were selected to replace part of ordinary cement to form a composite cementitious material system. The reason why FA, GBFS, SF and DG were selected as ACMs was that FA [27,28], GBFS [28], and SF [29] affect the hydration and microstructures of cementitious materials through their filling effect and pozzolanic reaction, thus effectively improving the performance of composite cementitious materials. The addition of DG [30] helps increase the number of ettringite (AFt) crystals and promote the development of strength.
P·II 52.5 grade cement was purchased from China Huarun Cement Holdings Co., Ltd. (Shenzhen, China); FA, GBFS, and DG were purchased from China Baowu Environmental Science Shanxi Resource Recycling Co., Ltd. (Shanghai, China); and SF was purchased from China Aiken Silicone Co., Ltd. (Shanghai, China). The chemical compositions, microstructures, and particle size distributions of the raw materials were measured using a ZSX Primus II X-ray fluorescence spectrometer (Lixue, Beijing, China), a scanning electron microscope (GeminiSEM300-71-11, ZEISS, Oberkochen, Germany), and a laser particle analyzer (Mastersizer 3000, Malvern, UK), respectively. The results are shown in Table 1 and Figure 1 and Figure 2. The FA selected comprised spherical silicon aluminum oxide particles with an average particle size of 19.2 µm [31]. The SF with an average particle size of 18.4 µm comprised clusters formed by the interconnection of fine spheres of silica [32]. The main chemical components of the GBFS with an average particle size of 10.5 µm were calcium oxide, silicon dioxide, and aluminum oxide, and its morphology was mainly irregular with sharp edges and corners, which was due to different grinding technologies used [33]. The DG comprised non-uniform-sized calcium sulfate rod-shaped particles with an average particle size of 33.1 µm [34]. Tap water was used as the test water, and Chinese International Organization for Standardization (ISO) standard sand was used.

2.2. Methods

2.2.1. Mix Proportion Optimization Design

To investigate the effects of different factors on the mechanical properties and durability of the mortars, orthogonal experiments were conducted based on three influencing factors: A (water–binder ratio), B (cementitious ratio) (mass ratio of FA, GBFS, SF, and DG), and C (replacement cement ratio). The experimental parameters and their values are listed in Table 2.
Based on the factors and levels presented in Table 2, an orthogonal experimental design table was constructed using the IBM SPSS Statistics 19 software, as shown in Table 3; the mortar mix proportions obtained from Table 3 are listed in Table 4. The effects of different factors on the compressive strength and durability of the mortars were investigated by controlling the cement–sand ratio to 1:3. The mortars were prepared and cured according to the GB/T 17671-2021 Chinese standard [35].

2.2.2. Mix Proportion Optimization Design

The compressive strength values of the mortars after 28 and 90 days of curing were determined in accordance with the GB/T 17671-2021 Chinese standard [35].

2.2.3. Durability Test

  • Acid corrosion resistance test
Most of the acid rain in China is of the sulfuric acid type (rainwater with a pH value of less than 5.6). To conduct accelerated corrosion tests, sulfuric acid and nitric acid solutions (with a molar ratio of 9:1) were mixed to form an acidic corrosion solution with pH = 1. Subsequently, the 28-day specimens were immersed in an acidic corrosion solution at room temperature (approximately 25 °C), and a compressive strength test was performed on those specimens when the surface of the specimens peeled off (approximately 90 days). To compare the corrosion resistance of the specimens immersed in the acidic corrosive solution, the corrosion resistance coefficient was evaluated based on the GB/T 50082-2009 Chinese standard [36], and the calculation is shown in Equation (1) [36]. Because the pH value of the solution changed with the immersion time, it was replaced with a fresh acidic corrosion solution when the pH value of the corrosion solution increased to approximately 5 after two weeks of immersion.
K f = f c f c 0 × 100 %
Here, Kf is the corrosion resistance coefficient (%), fc is the compressive strength of the specimen immersed in an acidic corrosion solution (0.1 MPa), and fc0 is the compressive strength of the specimen immersed in clean water (0.1 MPa).
2.
Chloride ion permeability coefficient test
The chloride ion permeability coefficient was measured using the Nernst–Einstein Lab (NEL) method based on ion diffusion and electromigration [37]. Specimens measuring 100 mm × 100 mm × 50 mm were prepared based on the mix proportion listed in Table 4. After 28 days of standard curing, the specimens were placed in a vacuum water-retaining device and vacuum salt-retained for 24 h with a 4 mol/L NaCl solution. The chloride ion permeability coefficient was measured using a chloride diffusion coefficient tester (NELD-CCM550, NELD, Beijing, China) at 1–10 V, and the results were recorded after 15 min. The solution in the instrument contained 4 mol/L NaCl solution.

2.2.4. X-ray Diffraction (XRD) Analysis

The cement paste cured for 28 days was ground, and alcohol was added to it during the grinding process to reduce the effect of carbon dioxide and moisture in air on the sample. The ground sample was dried at 45 °C and then sieved through a 0.15 mm sieve for analysis via X-ray diffraction (D8 Advance, Bruker, Leipzig, Germany). The instrument was operated at a voltage and current of 40 kV and 40 mA, respectively, and scanned in intervals of 0.02° in the 2θ range of 5–70°.

2.2.5. Microscopic Morphology Observation

After the cement paste was cured for 28 days, the sample was crushed and soaked in alcohol and then baked at 45 °C for 5 days. Subsequently, it was fixed onto the loading platform with a conductive adhesive for gold spraying treatment. The microstructures of the samples were observed using a scanning electron microscope (SEM, GeminiSEM300-71-11, ZEISS, Germany) at a voltage of 3 kV.

2.2.6. Pore Structure Test

The 28 days hardened cement paste was crushed, sieved to obtain particles with a size of 1–5 mm, soaked in alcohol for 5 d, dried at 45 °C, and stored under vacuum. The dried samples were tested using a mercury porosimeter (AutoPore V9600, Micromeritics, Norcross, GA, USA) in the pressure range of 0–60,000 psi.

2.2.7. Statistical Analysis

The corrosion resistance coefficient and chloride ion permeability coefficient of the sample after 28 d of curing, as well as the compressive strength of the sample after 90 days of curing, were assessed via statistical analysis. When 60% of cement is replaced by ACMs, the pozzolanic effect of these materials in samples cured for 28 days will be misjudged; therefore, the compressive strength of the samples cured for 90 days (post hydration) was selected for analysis.
1
Range analysis
The ranges (R values) of the three influencing factors (A, B, and C) were calculated based on the experimental results (compressive strength, chloride ion permeability coefficient, and corrosion resistance coefficient). Rj represents the range of factors in the jth column, which is the difference between the maximum and minimum indicator values at each level under the jth column factor; Kji represents the sum of the experimental results for the corresponding jth factor at the ith level; and kji is the average value of Kji [38].
2
Variance analysis
The IBM SPSS statistical 22 software was used to perform variance analysis on the factors (independent variables) and their experimental results (dependent variables). Based on the R value in the range analysis, the factor with the least effect on the results was selected as the blank control. The independent variables were factors A, B, and C. The dependent variables included the 90 days compressive strength, corrosion resistance coefficient, and chloride ion permeability coefficient. By calculating the p value from variance analysis, one can determine whether a significant difference exists between two variables (see [39,40]). The effect of a factor is significant when 0.01 < p < 0.05 whereas it is extremely to be significant when p ≤ 0.01 [41].
3.
Comprehensive scoring evaluation
Comprehensive scoring evaluation is established in the context of complex data by assigning corresponding weights to multiple indicators and transforming them into a comprehensive indicator (CI) for the overall evaluation of a certain feature. The CI is calculated as shown in Equation (2) [42].
C I = d 1 d 2 d k 1 k
Here, k is the number of indicators and di is the standard value.
Individual data from different indicator results typically cannot be compared directly; in fact, they require conversion into data of the same specification and scale before comparison can be performed. This transformation typically involves assigning weight coefficients and standardized values to indicator data, i.e., performing 0–1 standardization calculation on the indicator data to obtain a variable pertaining to the ‘standardized value’, which is represented by di. This can be calculated as shown in Equations (3) and (4) [43].
The higher the values of the indicator data calculated below are, the better the results are.
d i = Y i Y m i n Y m a x Y m i n
Meanwhile, the lower the values of the indicator data calculated below are, the better the results are.
d i = Y m a x Y i Y m a x Y m i n
Here, Ymax and Ymin are the maximum and minimum values for each indicator, respectively.

3. Results and Analysis

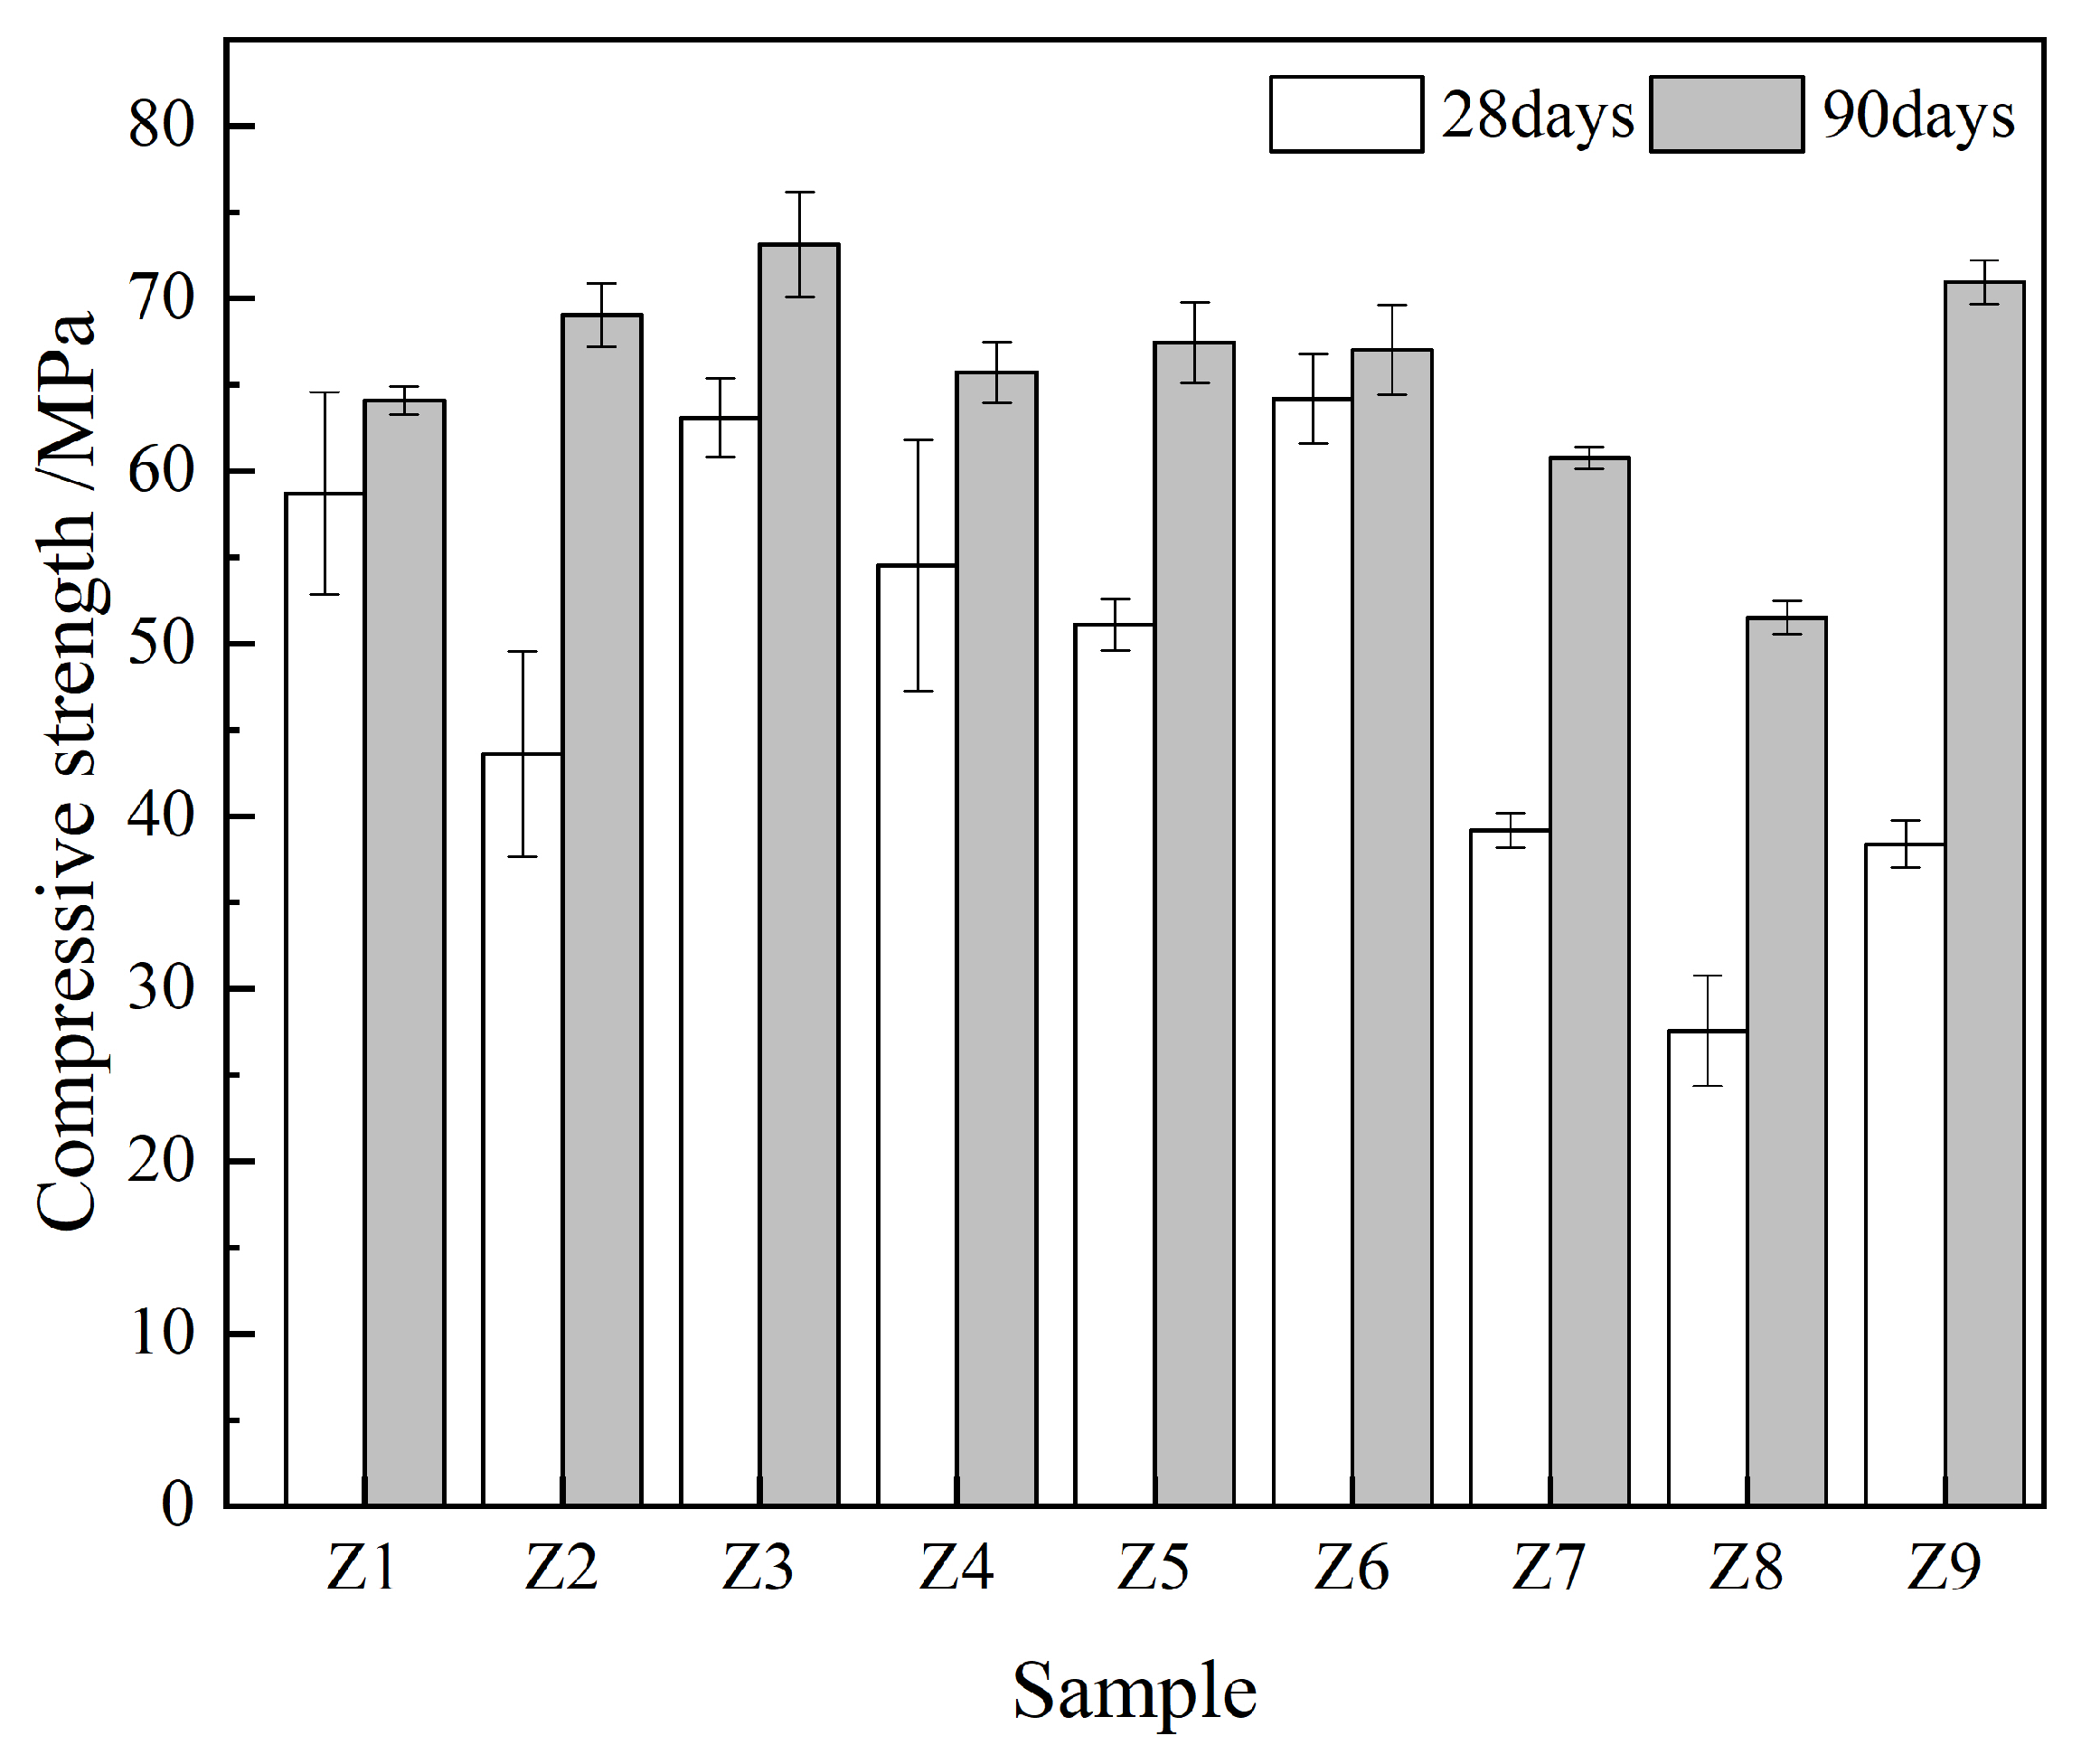
3.1. Compressive Strength

Figure 3 shows the compressive strength of the samples. Compared with the 28 days samples, the 90 days samples demonstrated a higher compressive strength, thus indicating that an increase in age is conducive to the development of cement hydration and thus improves the compressive strength [44]. Under 90 days of curing, the compressive strength of sample Z3 was the highest, i.e., 73.1 MPa, followed by 70.9 MPa in sample Z9, which were 9.1% and 5.8% higher than that of the control sample (Z6), respectively. This indicates that the addition of an appropriate amount of the FA–GBFS–SF–DG ACM system to cement can improve the compressive strength, which is mainly due to the filling effect of ACMs and the pozzolanic effect of calcium hydroxide (CH) generated during cement hydration to form a dense hydrated calcium silicate (C-S-H) gel [45].

3.2. Durability

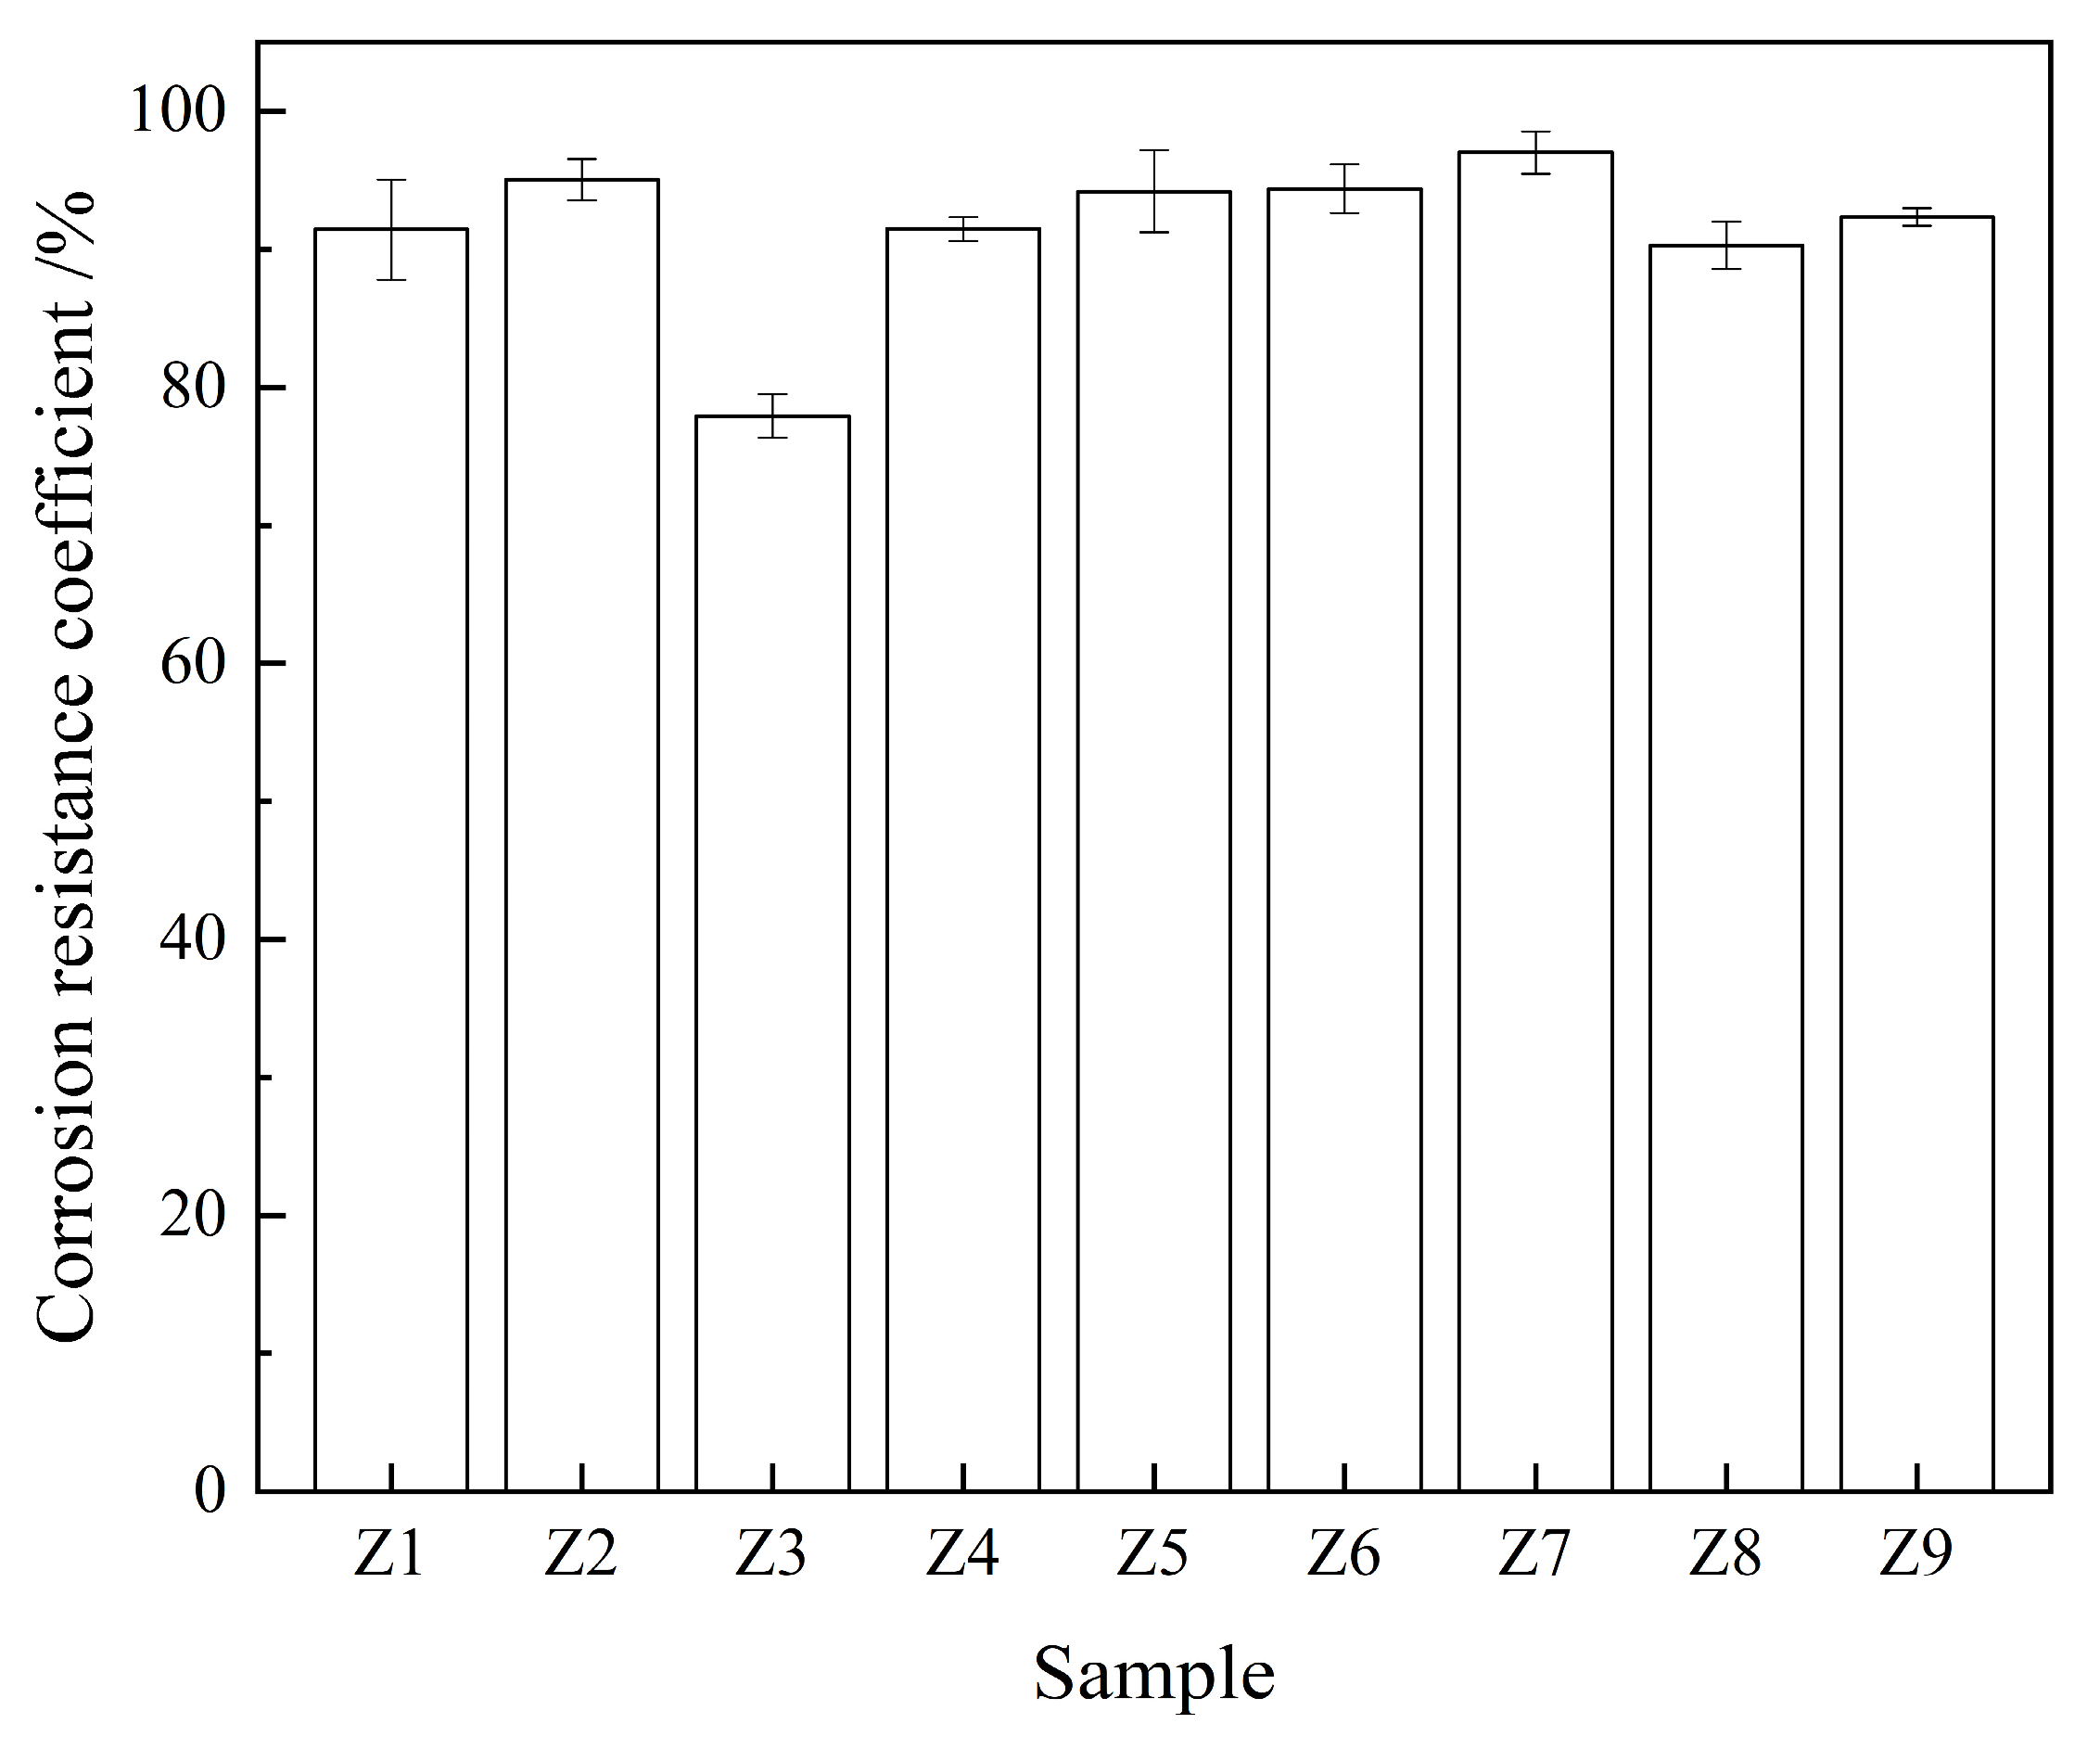
3.2.1. Acid Corrosion Resistance

Figure 4 shows the corrosion resistance coefficients of the samples. Among the samples, sample Z7 indicated the highest corrosion resistance coefficient, i.e., 97%, which was 6% higher than that of the control sample (Z1). This indicates that the addition of a reasonable FA–GBFS–SF–DG ACM system to cement can effectively improve the acid corrosion resistance of cementitious materials, which is attributed to the lower CH content in the sample compared with that in the control sample. The ACM replaces some of the cement to reduce the amount of CH generated via cement hydration; meanwhile, the CH crystals are consumed by the pozzolanic effect, which reduces the chemical reaction between the CH crystals and acid substances in cement-based materials [46,47].

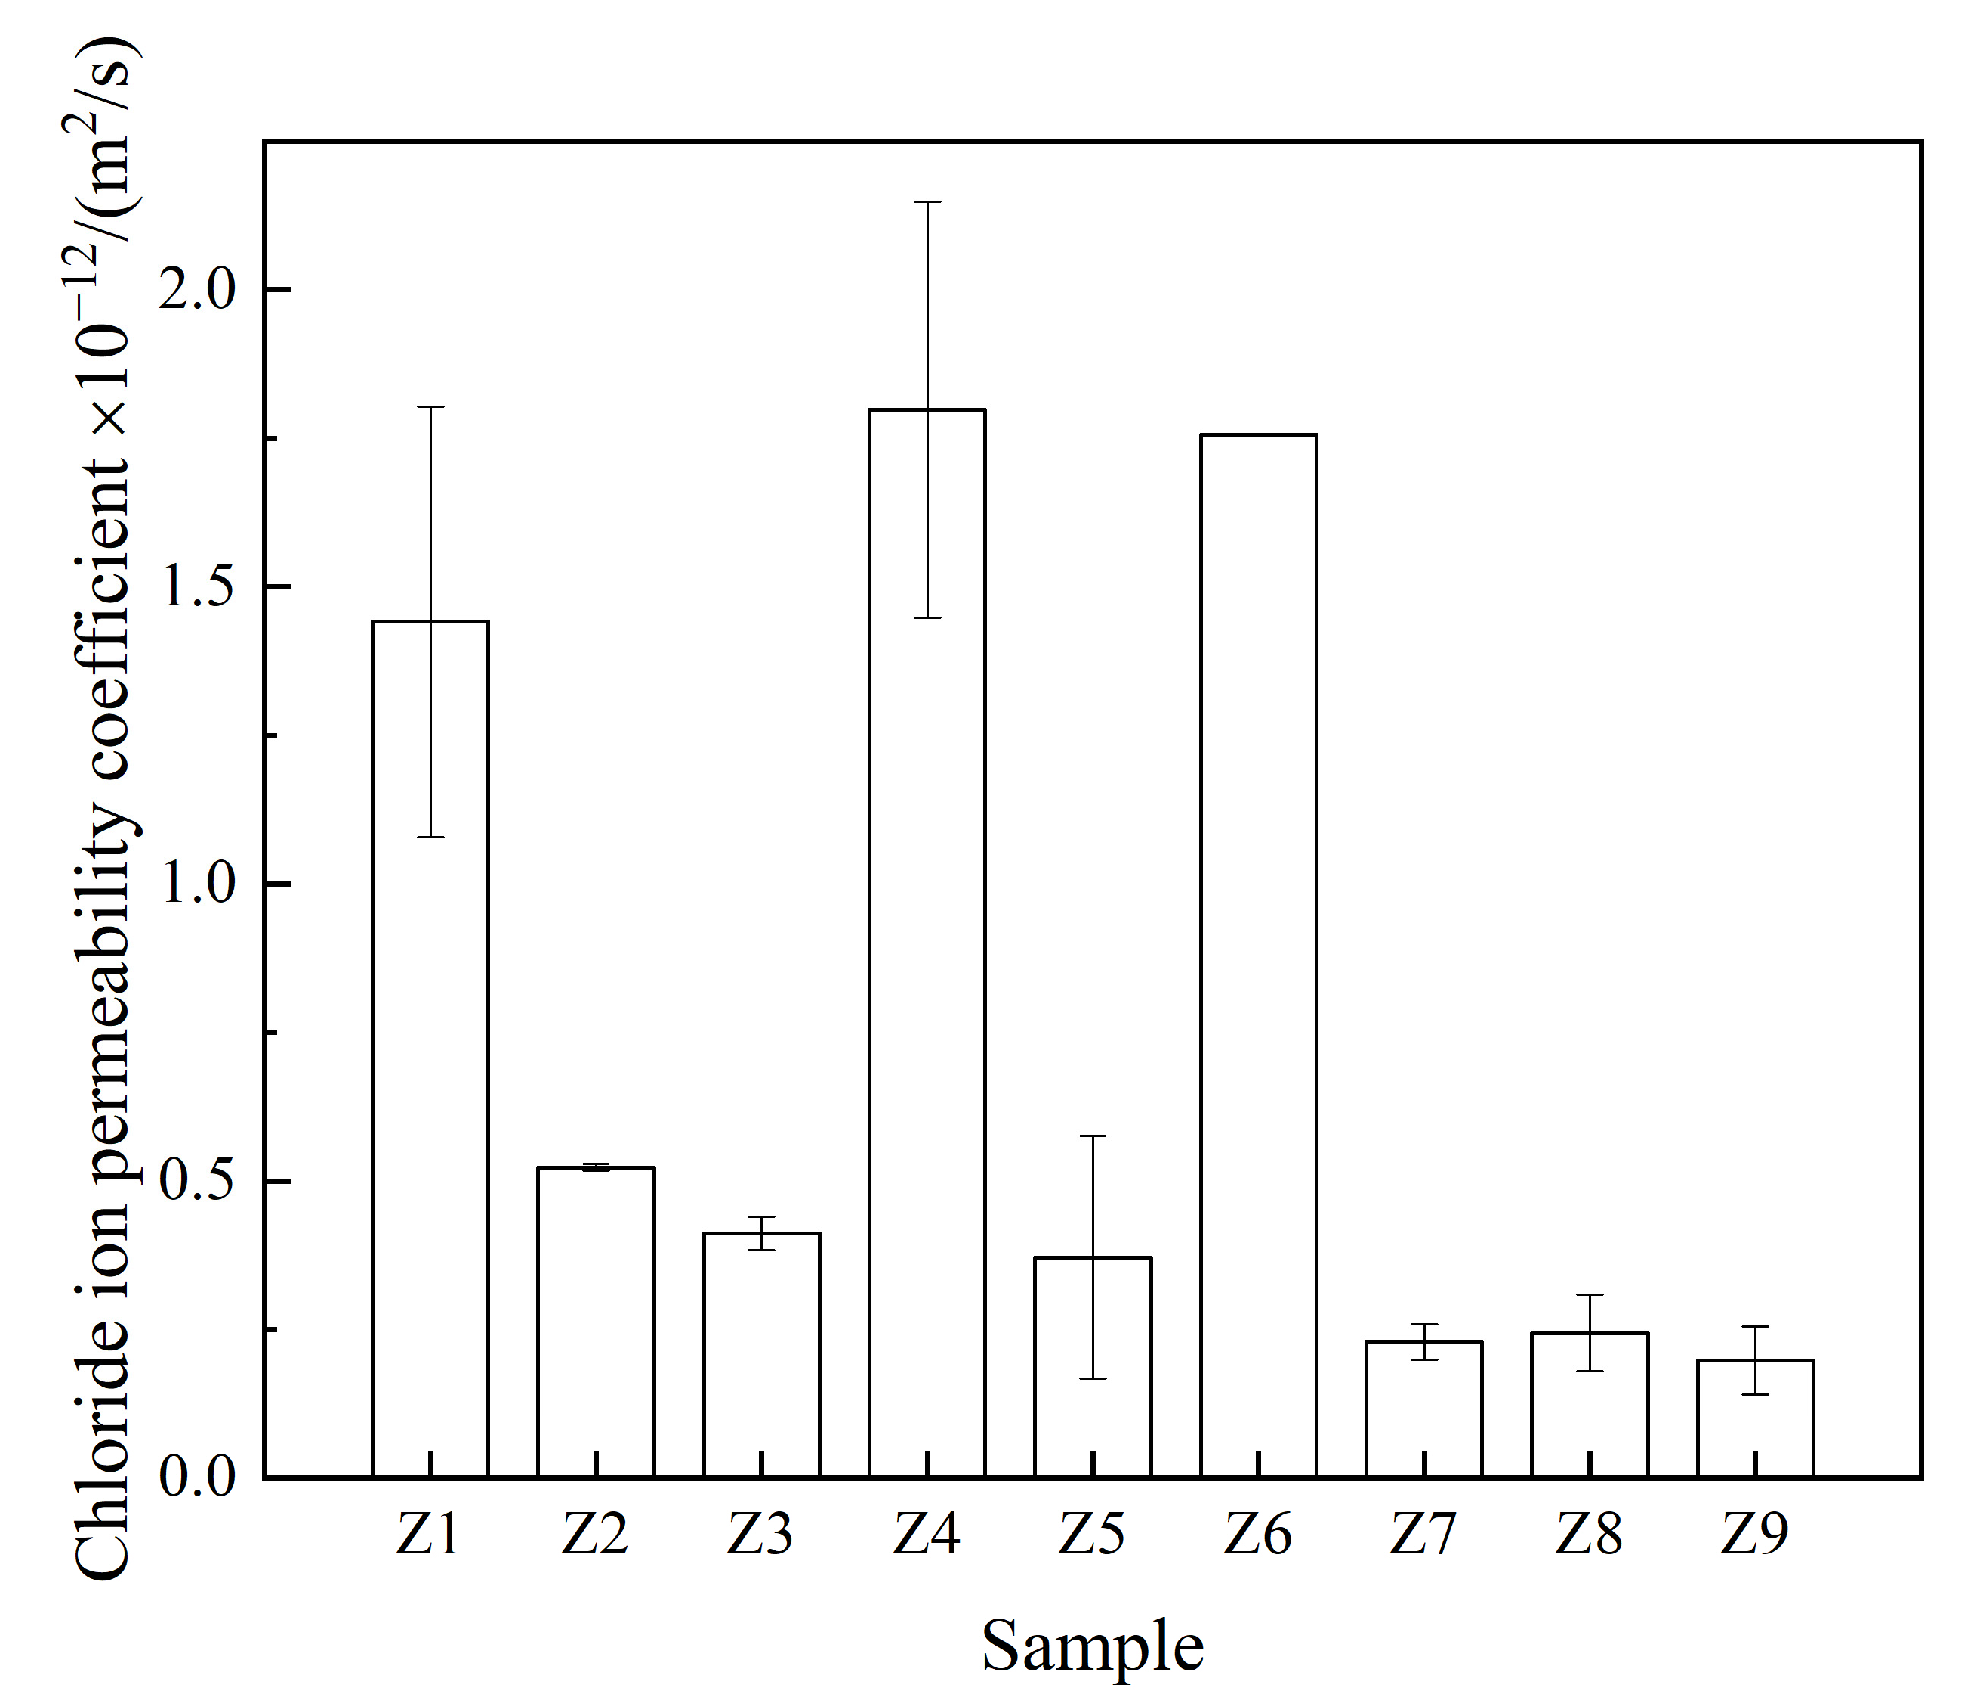
3.2.2. Resistance to Chloride Ion Penetration
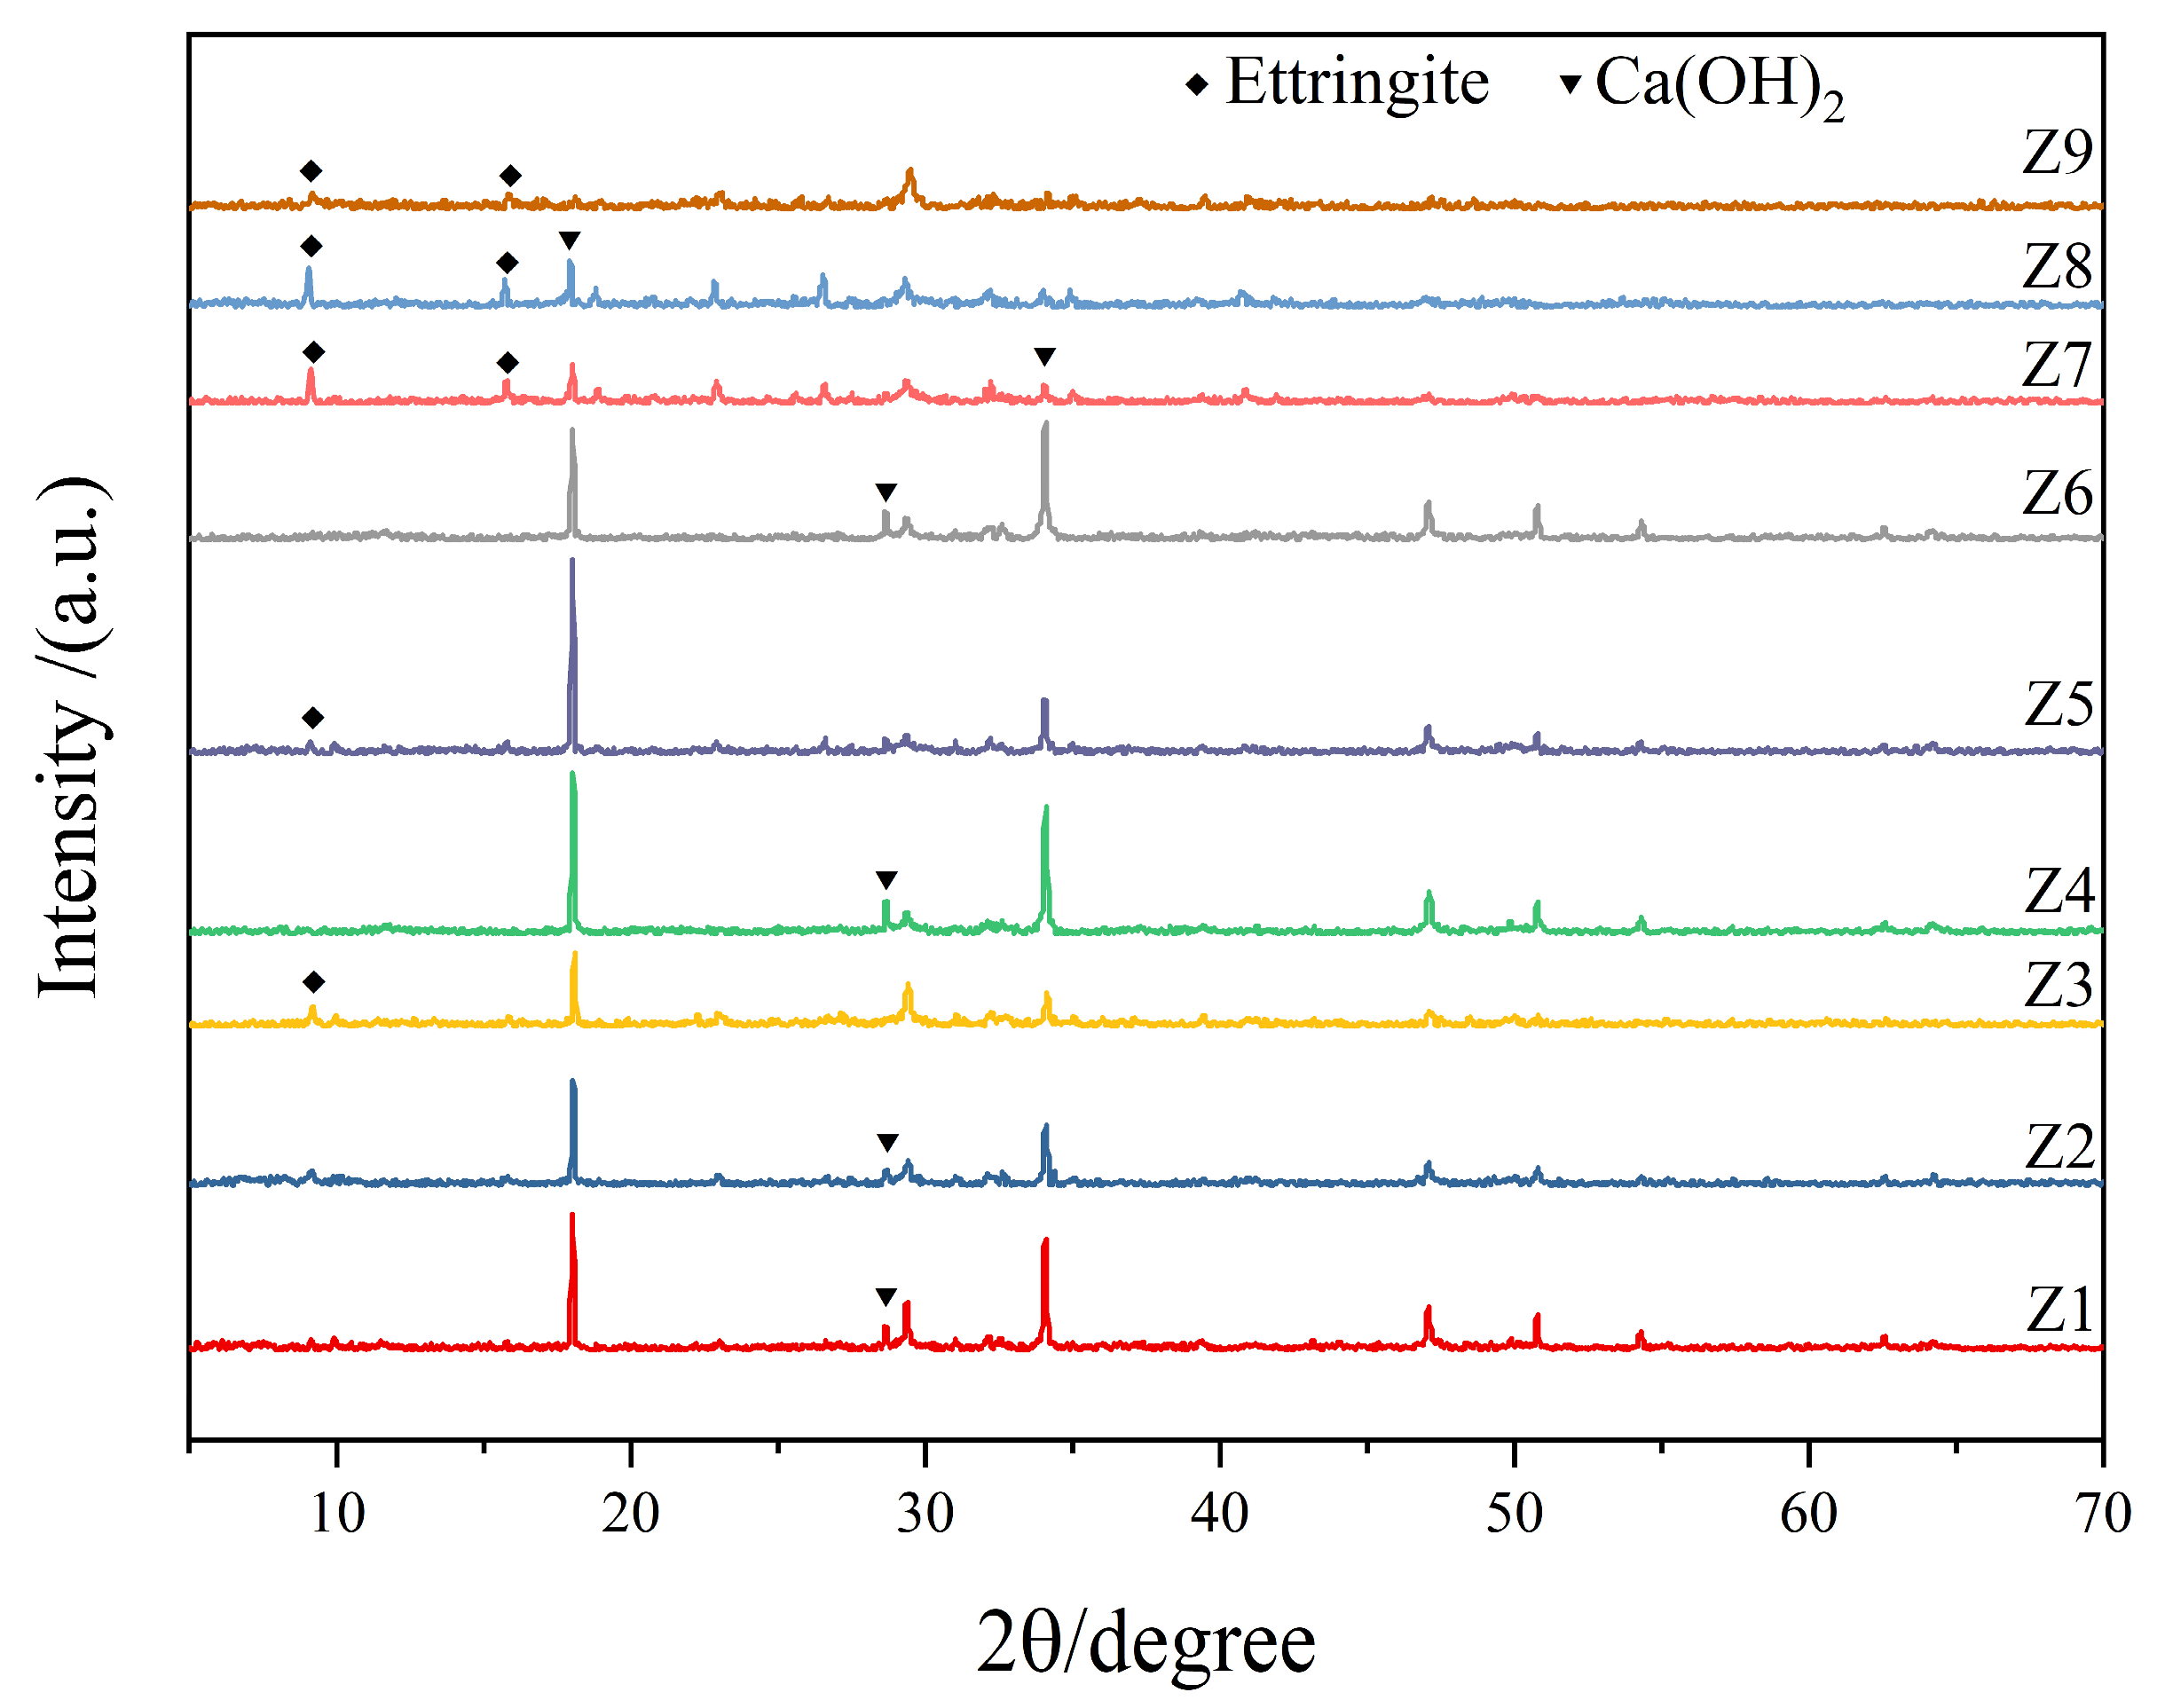
Figure 5 shows the chloride ion permeability coefficients of the 28 days samples. Among the samples, sample Z9 exhibited the best chloride ion permeability resistance, and its chloride ion permeability coefficient was 2.0 × 10⁻¹³ m2/s, which was 89% lower than that of the control sample (Z6), thus indicating that the addition of the FA–GBFS–SF–DG ACM system in cement can significantly improve the chloride ion permeability resistance of the sample, which may be attributed to the microaggregate effect and pozzolanic effect of the ACM system to promote the compactness of its cement-based material structures [48].

3.3. XRD

Figure 6 shows the XRD pattern of the 28 days cement paste. As shown, compared with the case of the reference sample (Z1), the peak value of the CH crystal (observed at 18.1°, 29.4°, and 34.1°) in sample Z7 was lower and the peak of the ettringite (AFt) crystal (9.1° and 15.8°) was higher. Compared with the case of the control sample (Z6), the peak value of CH crystals in the Z3 and Z9 samples decreased whereas the peak value of the AFt crystals increased, thus indicating that the addition of the FA–GBFS–SF–DG ACM systems in cement can significantly reduce the content of CH crystal and increase the AFt crystal content in cement pastes [49].

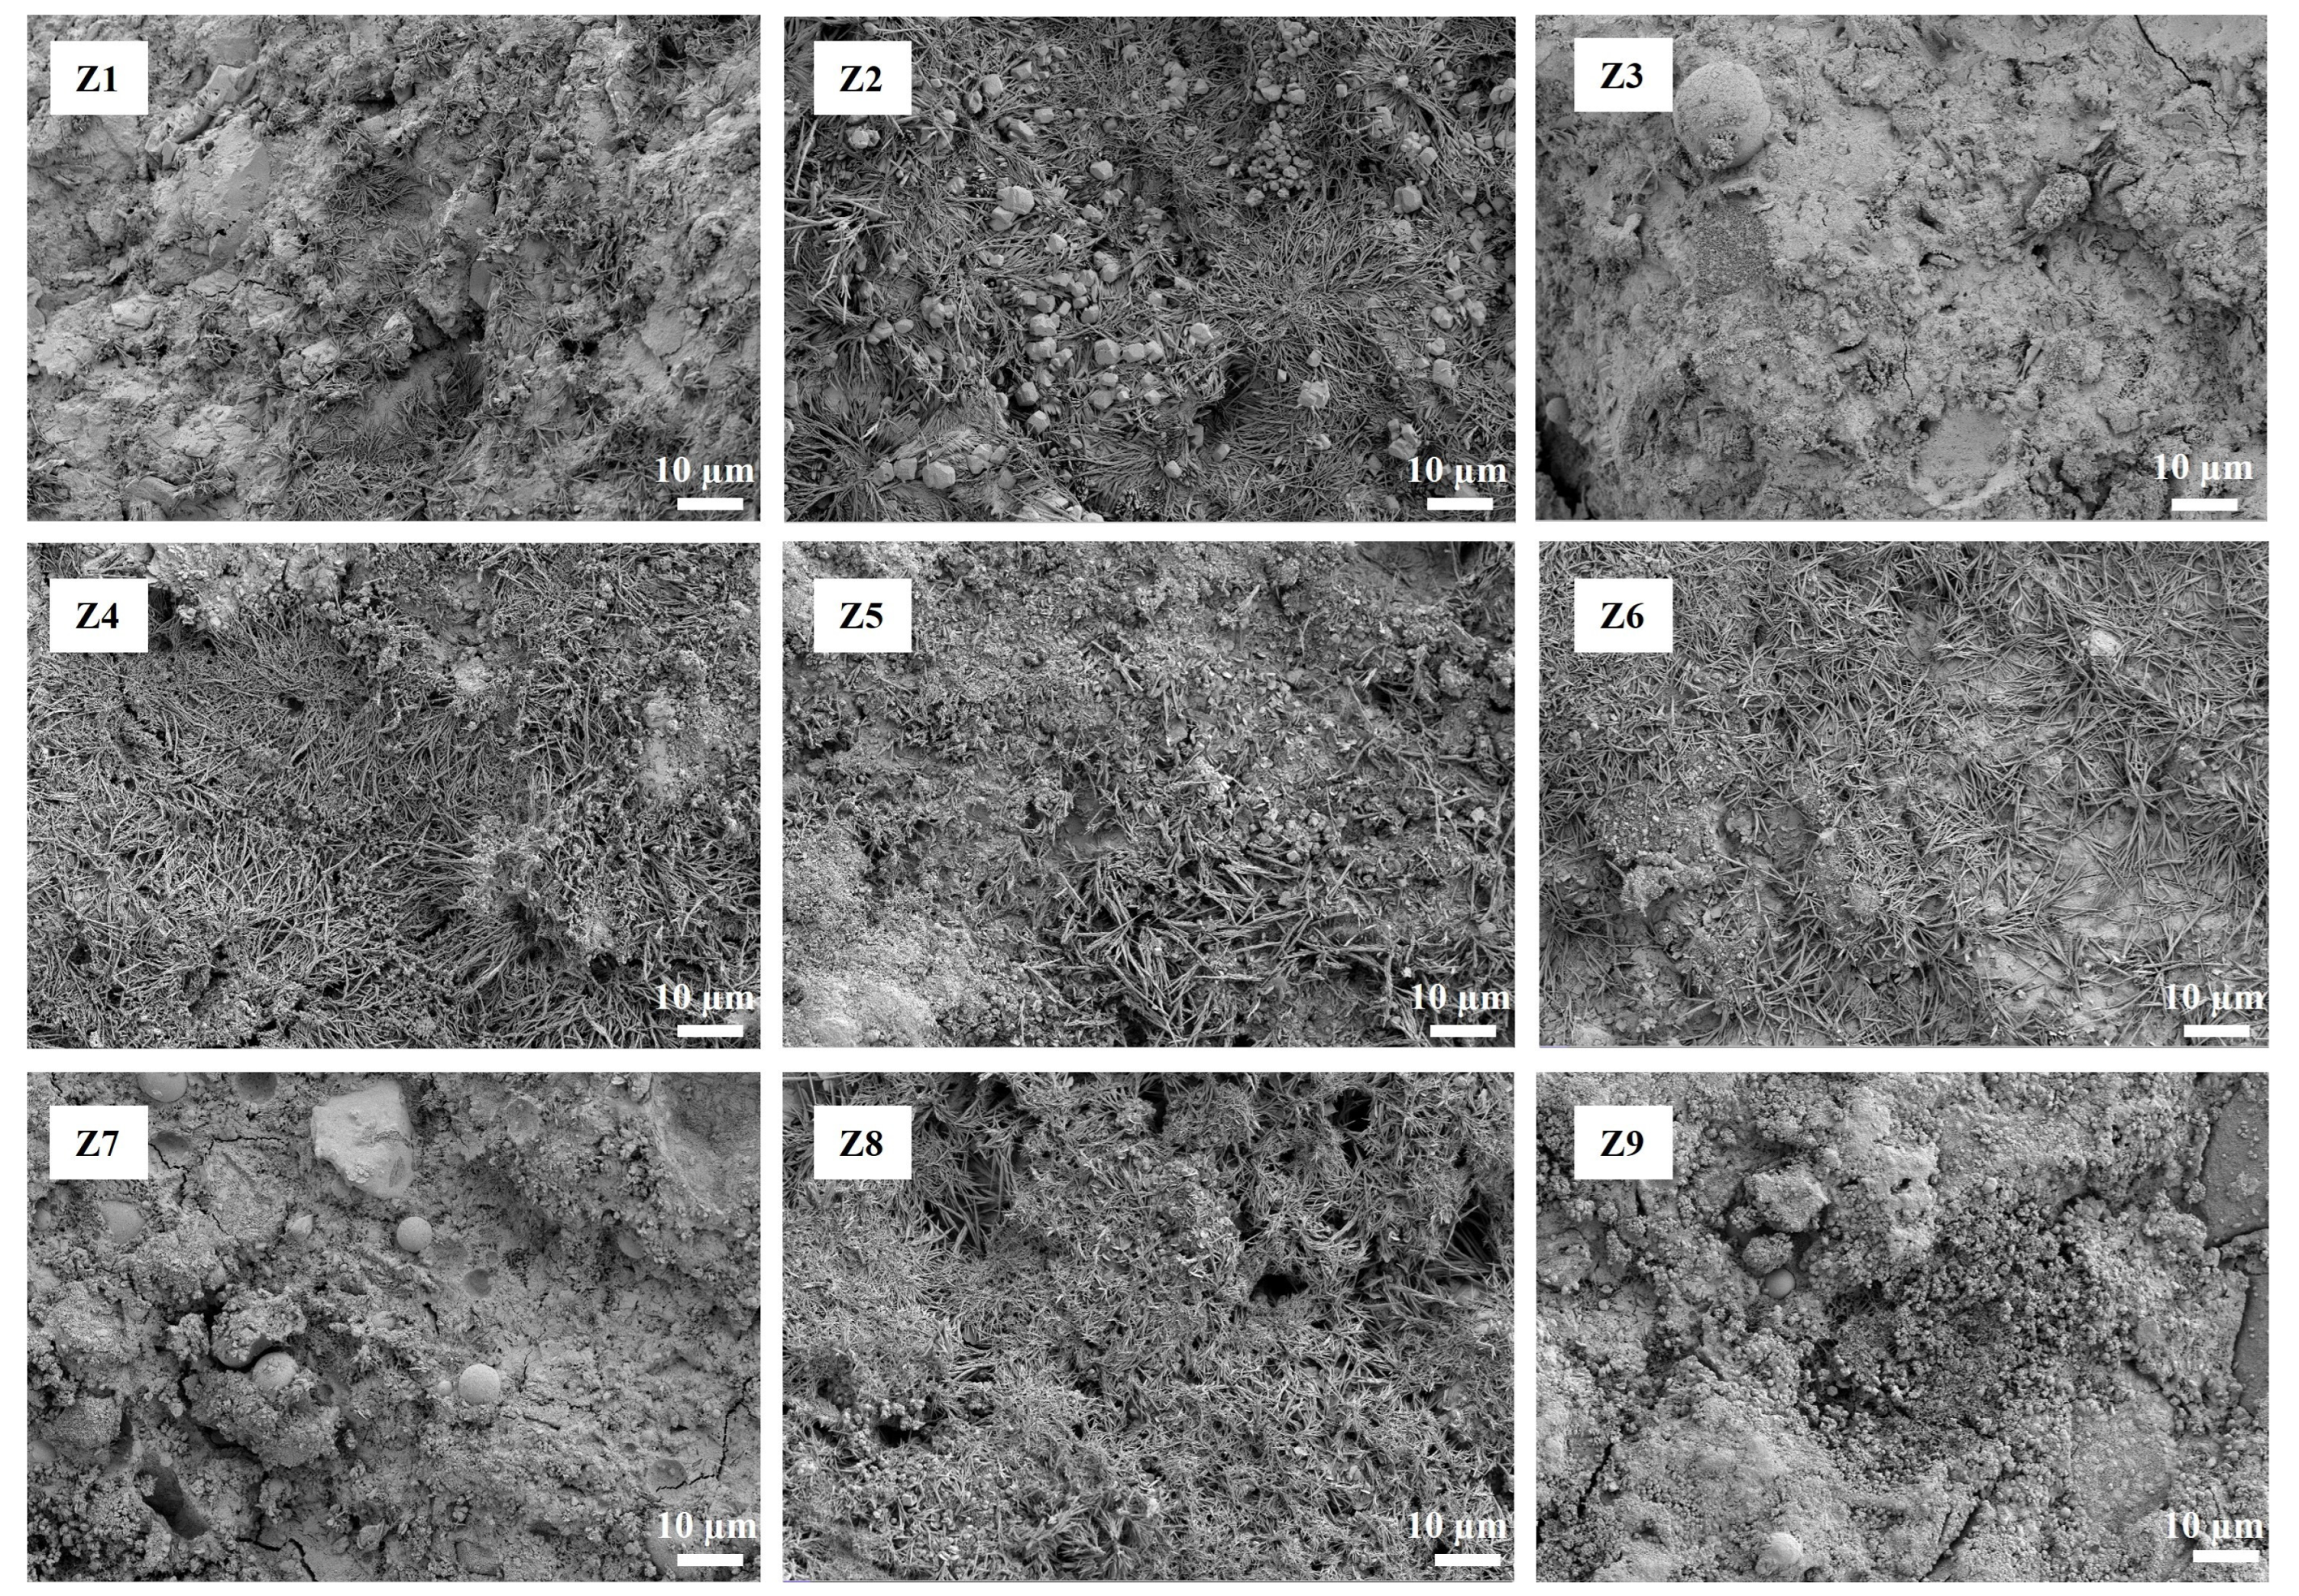
3.4. Microscopic Morphology Observation
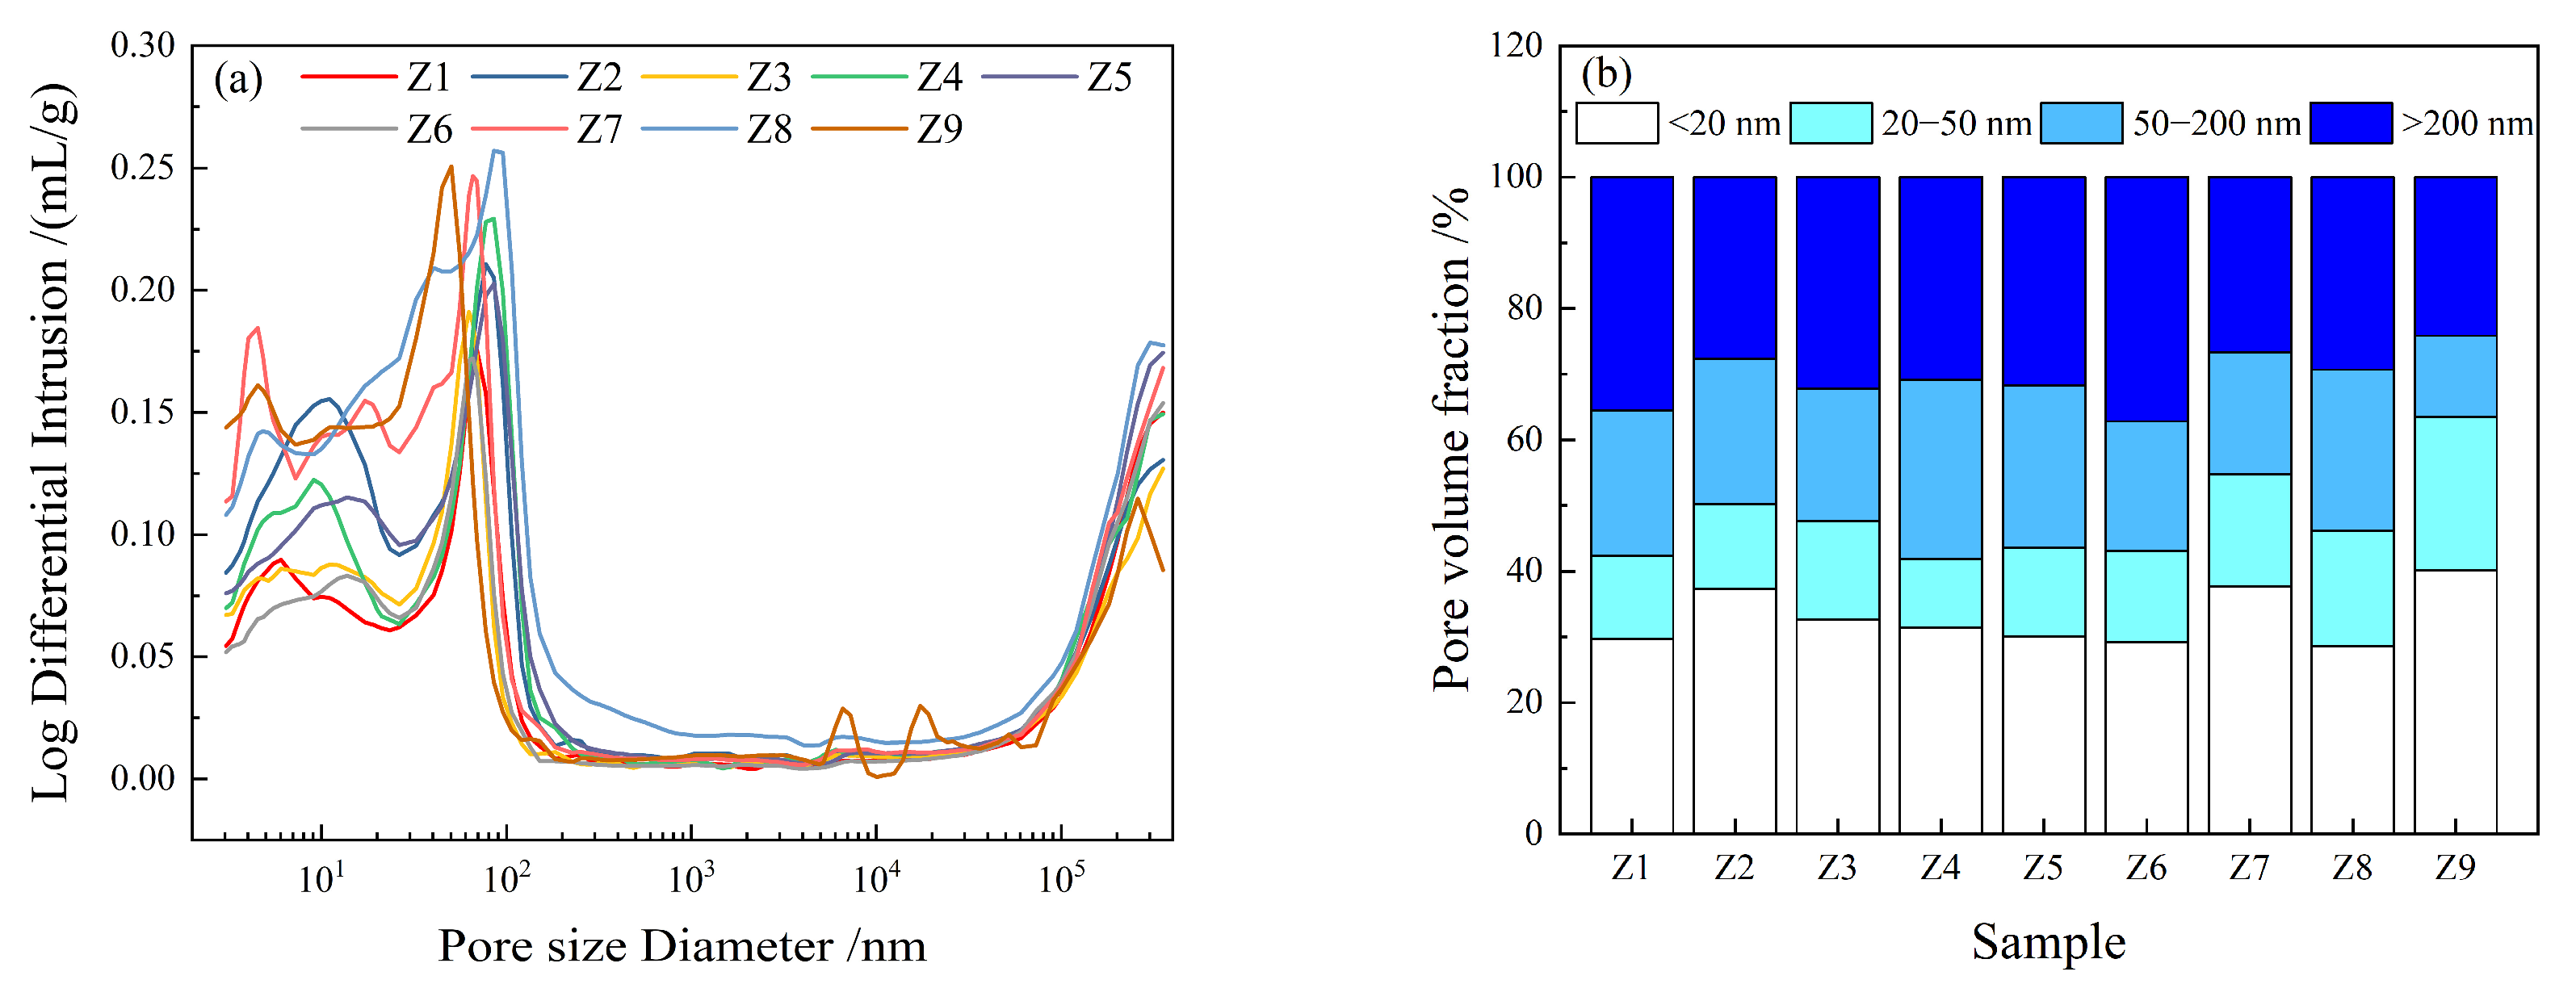
Figure 7 shows the scanning electron microscopy (SEM) images of the 28 days cement paste. Unhydrated FA and SF spherical particles were observed in the Z3, Z7, and Z9 samples, but not in the control samples (Z6 and Z1), thus indicating that the raw materials had not been fully hydrated and that their pozzolanic effect had not been fully exerted in the cement paste after curing for 28 days [50].

3.5. Pore Structure

Figure 8 shows the pore size distribution and pore volume fractions of the samples after 28 days of curing. As shown in Figure 8a, the pore peak values of the Z3 and Z9 samples were 62.55 and 50.39 nm, respectively whereas the pore peak value of the control sample (Z6) was 65.65 nm; the pore peak value of Z7 sample was 64.23 nm whereas that of the control sample (Z1) was 68.06 nm. This indicates that the addition of the FA–GBFS–SF–DG ACM systems to the cement can refine the pore structures of the samples. In addition, the pore peak value of sample Z9 was the lowest, followed by that of sample Z7. According to Wu [51], pore sizes in cement paste can be classified into four categories: harmless pores (<20 nm), less harmful pores (20–50 nm), harmful pores (50–200 nm), and more harmful pores (>200 nm). As shown in Figure 8b, the volume fractions of harmless and less harmful pores in the Z9 sample were the highest among the samples, followed by those of the Z7 sample, thus indicating that the pore structure of sample Z9 was the densest among the samples, followed by that of sample Z7.

3.6. Statistical Analysis

3.6.1. Range Analysis

The results of the range analysis results are presented in Table 5. As shown, factor C (replacement cement ratio) had a prominent effect on the compressive strength and chloride ion permeability coefficient of the samples whereas factor A (water–binder ratio) had a significant effect on the corrosion resistance coefficient of the material compared with the other two factors (B and C); meanwhile, factor B (cementitious ratio) had a less prominent effect on the performance of the samples. The effects of these factors on the indicator results can be elucidated from the mean kji values listed in Table 5. As the replacement cement ratio increased, the chloride ion penetration resistance of the samples increased, and their compressive strength first increased and then decreased; meanwhile, as the water–binder ratio increased, the corrosion resistance coefficient of the samples first increased and then decreased, and their compressive strength decreased.

3.6.2. Variance Analysis

To verify the significance of the factors affecting the performance based on the range analysis results (Table 5), a variance analysis was conducted on the performance results, which are shown in Table 6. As shown, the p values of the corresponding factors, i.e., the compressive strength and corrosion resistance coefficient, exceeded 0.05, thus indicating that the effect of these factors was not significant. Therefore, based on the range analysis (Table 5), although factors C and A affected the compressive strength and corrosion resistance coefficient, respectively, the effects were insignificant, and the p value of the effect of factor C on the chloride ion permeability coefficient was less than 0.01, thus indicating that factor C had a significant effect on the chloride ion permeability coefficient. This is consistent with the effect of factor C based on the range analysis (Table 5), thus indicating that the replacement cement ratio significantly affects the resistance to chloride ion penetration.

3.6.3. Comprehensive Scoring Evaluation

Table 7 presents the CI values of the samples. As shown, among the samples, sample Z9 indicated the highest OD value, followed by sample Z2. This indicates that compared with various other ACMs, when a FA:GBFS:SF:DG ratio of 2:6:1:1 was implemented, the FA–GBFS–SF–DG system effectively improved the compressive strength, chloride ion permeability, and acid corrosion resistance of the cement-based materials by replacing 30% or 60% cement.

4. Discussion

Our results indicate that the addition of a reasonable proportion of the FA–GBFS–SF–DG ACM system to cement can improve the compressive strength (Figure 3), acid corrosion resistance (Figure 4), and resistance to chloride ion penetration (Figure 5) of cementitious materials. Sample Z3 indicated the highest compressive strength (Figure 3) whereas sample Z7 indicated the highest acid corrosion resistance (Figure 4), thus demonstrating that samples Z3 and Z7 offer strong advantages in a single performance. However, environments in coastal acid rain areas containing various corrosive media such as chloride ions and acidic substances may severely degrade the service lives of cement-based materials. By contrast, the Z9 sample indicated the lowest chloride ion permeability coefficient, densest pore structure, and highest CI value, along with both high strength and corrosion resistance, thus demonstrating it potential applications in coastal acid rain areas.
The high compressive strength and good durability of the Z9 sample are related to its low water–binder ratio. A lower water–binder ratio will increase the adhesion and compactness between the slurry and the aggregate, reduce the porosity (Figure 8), and form a denser microstructure [52,53]. Therefore, the decrease in the water–binder ratio is one of the reasons for improving the properties of cementitious materials. In addition to the influence of a low water–binder ratio, the superior performance of sample Z9 was attributed to the microaggregate and pozzolanic effects of the FA–GBFS–SF–DG ACM system in the cement, as shown in Figure 9. As shown in the figure, gaps were present between the cement particles in ordinary mortar, and a reasonable FA–GBFS–SF–DG system can exert a microaggregate effect in mortar mixed with various ACMs. When a FA:GBFS:SF:DG = 2:6:1:1 ratio was implemented to replace 60% of cement, the FA, GBFS, SF, and DG in cement evenly occupied the voids between cement particles, improved the compactness of its cement-based material, and refined its pore structures [54]. Therefore, the volume fraction of harmless and less harmful pores in the 28 days Z9 sample was higher than those of the other samples, and its pore structures was more dense, which could effectively reduce the permeability of chloride ions into the concrete and improve its compressive strength and durability [55].
The main products of cement hydration in ordinary mortar are CH crystals, C-S-H gel, hydrated calcium aluminates (C-A-S-H), and tetracalcium aluminate [56]. However, the FA, GBFS, and SF added to the cement contained significant amounts of active SiO2 and Al2O3. These active ingredients can react with the CH crystals generated by cement hydration in the presence of water, thus consuming CH crystals in the Z9 sample (Figure 6) and generating C-S-H and C-A-S-H gels [57,58]. This not only increases the compressive strength of the samples but also improves their acid corrosion resistance [59,60]. Meanwhile, DG can be used as an activator of FA and GBFS to enhance their pozzolanic effects [61]; however, it can react both with alumina in FA and GBFS as well as with C-A-S-H crystals in cement pastes to promote the formation of AFt crystals (Figure 6) [62]. The hydration products of C-S-H and C-A-S-H gels can increase the physical adsorption capacity of chloride ions [63]. In addition to physical adsorption, because FA and GBFS contain large amounts of highly active Al2O3, a large number of Al ions lead to the formation of calcium aluminate monosulfate (AFm) by tricalcium aluminate, and AFm forms Friedel’s salt with chloride, which increases the chemical adsorption capacity of chloride ions in cementitious materials [64,65,66]. The pozzolanic reaction of FA and GBFS not only promotes the formation of C-S-H and C-A-S-H gels to increase the physical adsorption of chloride ions but also promotes the formation of Friedel’s salt to increase the chemical adsorption of chloride ions. Therefore, compared with other samples, the Z9 sample has a lower chloride ion permeability coefficient (Figure 5).
Although the compressive strength of the Z9 sample after 28 days of curing was lower than that of the control sample (Z6), its 90 days compressive strength exceeded 70 MPa, which was 5% higher than that of the control sample (Z6) (Figure 3). This was because some ACMs in the samples had not been fully hydrated after curing for 28 days and the pozzolanic effect had not yet been fully realized [50]. Therefore, spherical particles of FA and SF were observed in the Z9 sample after curing for 28 days (Figure 7).
It can be seen from the above analysis that the Z9 sample has excellent durability and high compressive strength. However, in the practical engineering application of cementitious materials, the cost and carbon emissions of materials should also be considered. In terms of cost, the annual average price of each raw material per ton is listed in Table 8, and the data come from www.mysteel.com (accessed on 17 January 2024) in China. From Table 8, it can be seen that for the Z9 sample, the cost per ton of cementitious material is 515 RMB. When the cement replacement rate is 60%, the cost per ton of its cementitious material is 329–349 RMB, decreased by 32–36%. In terms of carbon emissions, carbon dioxide emissions are mainly related to cement production. Adding auxiliary cementitious materials to cement can reduce the amount of cement used, which is an effective measure to reduce carbon dioxide emissions [67]. According to statistics, the global cement production in 2020 was 4.1 × 10¹² kg [68], expected to reach approximately 6.0 × 1012 kg by 2050 [69]. Since its production emits 0.5–0.7 kg CO2 per kg of cement [70], it is expected to emit 3.0–4.2 × 10¹² kg of CO2 by 2050. The application of Z9 samples with ACMs replacing 60% cement will reduce CO2 emissions by 60%, which is of positive significance for achieving the low-carbon emission reduction target by 2050. Therefore, considering the material properties, economic benefits, and environmental benefits comprehensively, the development of Z9 samples will provide important technical references for the selection of concrete structural materials in coastal acid rain areas.
The research results indicate that using a FA:GBFS:SF:DG ratio of 2:6:1:1 instead of 60% cement can improve the compressive strength, acid corrosion resistance, and chloride ion permeability of the materials. However, this study was conducted on mortar with aggregate particles smaller than 4.75 mm, and further research is needed on concrete with aggregate particles larger than 4.75 mm.

5. Conclusions

In this study, the effects of adding a FA–GBFS–SF–DG system to cement on the compressive strength, corrosion resistance coefficient, and chloride ion permeability coefficient of cement-based materials were investigated. The mix ratio of the cement-based materials was optimized via an orthogonal experiment and a comprehensive scoring method. The conclusions obtained were as follows:
(1)
The addition of the FA–GBFS–SF–DG cementitious system to cement can increase the compressive strength of the cementitious material by up to 9.1% and the acid corrosion resistance coefficient by 6%, and the chloride ion permeability coefficient is reduced by 89% compared to ordinary cement materials.
(2)
The addition of the FA–GBFS–SF–DG cementitious system to cement consumed CH crystals produced via cement hydration, promoted the formation of AFt, and optimized the pore structure of the cementitious materials.
(3)
Compared with the water–binder and cementitious material ratios, the cement replacement ratio significantly reduced the chloride ion permeability coefficient of the cementitious materials.
(4)
When a FA:GBFS:SF:DG ratio of 2:6:1:1 was implemented to replace 60% of cement, the compressive strength, acid corrosion resistance, and resistance to chloride ion permeability improved. This ratio is expected to benefit concrete structures in coastal acid rain environments.

Author Contributions

Conceptualization, J.W.; Methodology, J.W., Q.F. and L.L.; Investigation, S.Z., Y.H. and Z.W.; Resources, J.W.; Data curation, S.Z.; Writing—original draft, S.Z.; Writing—review & editing, Q.F.; Supervision, Q.F. and L.L. All authors have read and agreed to the published version of the manuscript.

Funding

Authors greatly acknowledge the financial support from the Key R&D project in Hainan Province (Grant No. ZDYF2022SHFZ322).

Data Availability Statement

The original contributions presented in the study are included in the article, further inquiries can be directed to the corresponding authors.

Conflicts of Interest

The authors declare no conflict of interest.

References

  1. James, A.; Bazarchi, E.; Chiniforush, A.A.; Aghdam, P.P.; Hosseini, M.R.; Akbarnezhad, A.; Martek, I.; Ghodoosi, F. Rebar corrosion detection, protection, and rehabilitation of reinforced concrete structures in coastal environments: A review. Constr. Build. Mater. 2019, 224, 1026–1039. [Google Scholar] [CrossRef]
  2. Liu, J.; Ou, G.F.; Qiu, Q.W.; Xing, F.; Tang, K.F.; Zeng, J.X. Atmospheric chloride deposition in field concrete at coastal region. Constr. Build. Mater. 2018, 190, 1015–1022. [Google Scholar] [CrossRef]
  3. Zhang, W.M.; Ba, H.J. Accelerated Life Test of Concrete in Chloride Environment. J. Mater. Civ. Eng. 2011, 23, 330–334. [Google Scholar] [CrossRef]
  4. Xie, S.D.; Qi, L.; Zhou, D. Investigation of the effects of acid rain on the deterioration of cement concrete using accelerated tests established in laboratory. Atmos. Environ. 2004, 38, 4457–4466. [Google Scholar] [CrossRef]
  5. Du, J.M.; Tang, Z.Y.; Li, G.; Yang, H.; Li, L.L. Key inhibitory mechanism of external chloride ions on concrete sulfate attack. Constr. Build. Mater. 2019, 225, 611–619. [Google Scholar] [CrossRef]
  6. Jin, Z.Q.; Zhao, X.; Zhao, T.J.; Li, J.Q. Chloride ions transportation behavior and binding capacity of concrete exposed to different marine corrosion zones. Constr. Build. Mater. 2018, 177, 170–183. [Google Scholar]
  7. Muralidharan, S.; Vedalakshmi, R.; Saraswathi, V.; Joseph, J.; Palaniswamy, N. Studies on the aspects of chloride ion determination in different types of concrete under macro-cell corrosion conditions. Build. Environ. 2005, 40, 1275–1281. [Google Scholar] [CrossRef]
  8. Masuda, Y.; Wu, F.R.; Nakamura, S.; Sato, S. Penetration behavior of chloride ions into concrete in coastal areas. In Environmental Ecology and Technology of Concrete; Feng, N.Q., Peng, G.F., Eds.; Trans Tech Publications Ltd.: Wollerau, Switzerland, 2006; pp. 584–590. Available online: https://www.google.com/search?q=Penetration+Behavior+of+Chloride+Ions+into+Concrete+in+Coastal+Areas+%7C+Scientific.Net&rlz=1C1CHBF_enRS855RS855&oq=Penetration+Behavior+of+Chloride+Ions+into+Concrete+in+Coastal+Areas+%7C+Scientific.Net&gs_lcrp=EgZjaHJvbWUqBggAEEUYOzIGCAAQRRg70gEHNTAyajBqOagCALACAA&sourceid=chrome&ie=UTF-8 (accessed on 18 March 2023).
  9. Fan, Y.; Hu, Z.; Zhang, Y.; Liu, J. Deterioration of compressive property of concrete under simulated acid rain environment. Constr. Build. Mater. 2010, 24, 1975–1983. [Google Scholar] [CrossRef]
  10. Zhou, C.L.; Zhu, Z.M.; Zhu, A.J.; Zhou, L.; Fan, Y.; Lang, L. Deterioration of mode II fracture toughness, compressive strength and elastic modulus of concrete under the environment of acid rain and cyclic wetting-drying. Constr. Build. Mater. 2019, 228, 116809. [Google Scholar] [CrossRef]
  11. Fan, Y.F.; Luan, H.Y. Pore structure in concrete exposed to acid deposit. Constr. Build. Mater. 2013, 49, 407–416. [Google Scholar] [CrossRef]
  12. Liu, Z.; Takasu, K.; Koyamada, H.; Suyama, H. A study on engineering properties and environmental impact of sustainable concrete with fly ash or GGBS. Constr. Build. Mater. 2022, 316, 125776. [Google Scholar] [CrossRef]
  13. Behl, V.; Singh, V.; Dahiya, V.; Kumar, A. Characterization of physico-chemical and functional properties of fly ash concrete mix. Mater. Today Proc. 2022, 50, 941–945. [Google Scholar] [CrossRef]
  14. Karumanchi, M.; Bellum, R.R.; Chennupati, M.; Kunchala, V.; Regulagunta, M. Influence on mechanical properties of concrete of cement replacement with fly ash and river sand replacement with foundry sand. Mater. Today Proc. 2022, 65, 3547–3551. [Google Scholar] [CrossRef]
  15. Kumar, B.G.; Muthu, M.; Chajec, A.; Sadowski, Ł.; Govindaraj, V. The effect of silica fume on the washout resistance of environmentally friendly underwater concrete with a high-volume of siliceous fly ash. Constr. Build. Mater. 2022, 327, 127058. [Google Scholar] [CrossRef]
  16. Huseien, G.F.; Khamehchi, M.; Kubba, Z.; Benjeddou, O.; Mahmoodi, M.J. Freeze-thaw cycle and abrasion resistance of alkali-activated FA and POFA-based mortars: Role of high volume GBFS incorporation. Heliyon 2023, 9, e17672. [Google Scholar] [CrossRef]
  17. Huseien, G.F.; Sam, A.R.M.; Shah, K.W.; Mirza, J.; Tahir, M.M. Evaluation of alkali-activated mortars containing high volume waste ceramic powder and fly ash replacing GBFS. Constr. Build. Mater. 2019, 210, 78–92. [Google Scholar] [CrossRef]
  18. Kaplan, G.; Bayraktar, O.Y.; Li, Z.; Bodur, B.; Yılmazoglu, M.U.; Alcan, B.A. Improving the eco-efficiency of fiber reinforced composite by ultra-low cement content/high FA-GBFS addition for structural applications: Minimization of cost, CO2 emissions and embodied energy. J. Build. Eng. 2023, 76, 107280. [Google Scholar] [CrossRef]
  19. Zhao, J.; Song, K.; Wang, Z.; Wu, D. Effect of Nano-SiO2/Steel Fiber on the Mechanical Properties and Sulfate Resistance of High-Volume Fly Ash Cement Materials. Constr. Build. Mater. 2023, 409, 133737. [Google Scholar] [CrossRef]
  20. Padavala, A.B.; Potharaju, M.; Kode, V.R. Mechanical properties of ternary blended mix concrete of fly ash and silica fume. Mater. Today Proc. 2021, 43, 2198–2202. [Google Scholar] [CrossRef]
  21. Li, Y.; Kwan, A. Ternary blending of cement with fly ash microsphere and condensed silica fume to improve the performance of mortar. Cem. Concr. Compos. 2014, 49, 26–35. [Google Scholar] [CrossRef]
  22. Anwar, M.; Emarah, D.A. Pore structure of concrete containing ternary cementitious blends. Results Mater. 2019, 1, 100019. [Google Scholar] [CrossRef]
  23. Anwar, M.; Emarah, D.A. Resistance of concrete containing ternary cementitious blends to chloride attack and carbonation. J. Mater. Res. Technol. 2020, 9, 3198–3207. [Google Scholar] [CrossRef]
  24. Jiang, L.; Li, C.; Wang, C.; Xu, N.; Chu, H. Utilization of flue gas desulfurization gypsum as an activation agent for high-volume slag concrete. J. Clean. Prod. 2018, 205, 589–598. [Google Scholar] [CrossRef]
  25. Nochaiya, T.; Suriwong, T.; Julphunthong, P. Acidic corrosion-abrasion resistance of concrete containing fly ash and silica fume for use as concrete floors in pig farm. Case Stud. Constr. Mater. 2022, 16, e01010. [Google Scholar] [CrossRef]
  26. Dong, C.R.; Zhang, Q.Y.; Chen, C.; Jiang, T.X.; Guo, Z.G.; Liu, Y.; Lin, S.L. Fresh and hardened properties of recycled plastic fiber reinforced self-compacting concrete made with recycled concrete aggregate and fly ash, slag, silica fume. J. Build. Eng. 2022, 62, 105384. [Google Scholar] [CrossRef]
  27. Yan, J.; Zhu, Z.; Liu, R.; Chen, M.; Shao, C.; Zhang, C.; Li, X. A multi-perspective study on the influence of physical and chemical properties of 5 types of fly ash on the performance of high-volume blended fly ash cementitious slurry. Constr. Build. Mater. 2024, 411, 134301. [Google Scholar] [CrossRef]
  28. Lu, S.; Liu, J.; Peng, C.; Zhang, J.; Sun, H. Multi-objective Optimization of Mix Proportions for Mass Concrete with Enhanced Resistance to Cracking and Reduced Temperature Rise. Case Stud. Constr. Mater. 2023, 20, e02810. [Google Scholar] [CrossRef]
  29. Zheng, Q.; Li, C.; Song, F.; He, B.; Li, W.; Jiang, Z. Autogenous self-healing of ultra-high-performance fiber-reinforced concrete with varying silica fume dosages: Secondary hydration and structural regeneration. Cem. Concr. Compos. 2023, 137, 104905. [Google Scholar] [CrossRef]
  30. Baran, E.; Hynowski, M.; Kotwica, L.; Rogowski, J. Effect of Portland Cement on the Selected Properties of Flue Gas Desulfurization Gypsum-Based Plasters. Materials 2023, 16, 5058. [Google Scholar] [CrossRef] [PubMed]
  31. Kutchko, B.G.; Kim, A.G. Fly ash characterization by SEM-EDS. Fuel 2006, 85, 2537–2544. [Google Scholar] [CrossRef]
  32. Diamond, S.; Sahu, S. Thaulow, Reaction products of densifted silica fume agglomerates in concrete. Cem. Concr. Res. 2004, 34, 1625–1632. [Google Scholar] [CrossRef]
  33. Wan, H.W.; Shui, Z.H.; Lin, Z.S. Analysis of geometric characteristics of GGBS particles and their influences on cement properties. Cem. Concr. Res. 2004, 34, 133–137. [Google Scholar] [CrossRef]
  34. Yang, B.J.; Dong, Y.Z.; Wang, B.N.; Yang, M.M.; Yang, C.J. A mild alcohol-salt route to synthesize alpha-hemihydrate gypsum microrods from flue gas desulfurization gypsum in large scale. Mater. Res. Express 2019, 6, 045507. [Google Scholar] [CrossRef]
  35. GB/T 17671-2021; Test Method for Strength of Hydraulic Cement Mortar. National Standard of the P.R. China: Beijing, China, 2021. (In Chinese)
  36. GB/T 50082-2009; Standard for Test Methods of Long-Term Performance and Durability of Ordinary Concrete. National Standard of the P.R. China: Beijing, China, 2009. (In Chinese)
  37. Lu, X.Y. Application of the Nernst-Einstein equation to concrete. Cem. Concr. Res. 1997, 27, 293–302. [Google Scholar] [CrossRef]
  38. Cong, M.L.; Zhang, S.S.; Sun, D.D.; Zhou, K.P. Optimization of Preparation of Foamed Concrete Based on Orthogonal Experiment and Range Analysis. Front. Mater. 2021, 8, 778173. [Google Scholar] [CrossRef]
  39. Fu, Q.; Xu, W.; Bu, M.; Guo, B.; Niu, D. Orthogonal experimental study on hybrid-fiber high-durability concrete for marine environment. J. Mater. Res. Technol. 2021, 13, 1790–1804. [Google Scholar] [CrossRef]
  40. Sun, Z.; Yang, S.; Hang, M.; Wang, J.; Yang, T. Optimization design of ultrahigh-performance concrete based on interaction analysis of multiple factors. Case Stud. Constr. Mater. 2022, 16, e00858. [Google Scholar] [CrossRef]
  41. Casella, G.; Berger, R.L. Statistical Inference; Duxbury Press: Belmont, CA, USA, 2001. [Google Scholar]
  42. Li, X.; Wang, Z.; Zhang, M.; Liu, R.; Wang, Z.; Zhang, C.; Yan, J.; Liu, Y.; Zhang, Z.; Wu, W. Properties of the cement containing hybrid micro-fibers and polymer latex using the orthogonal test: A comparative study of freshwater and seawater curing conditions. Constr. Build. Mater. 2024, 411, 134661. [Google Scholar] [CrossRef]
  43. Huang, Y.; Xiao, H.B.; Zhang, L.; Guo, D.Q.; Chen, S.H.Z.; Qiu, X.Y.; Hou, X.J. The effect of superfine tea powder addition on the acrylamide content of innovative Xinjiang nang products (tea nang). Food Addit. Contam. Part A-Chem. Anal. Control. Expo. Risk Assess. 2020, 37, 1–18. [Google Scholar] [CrossRef]
  44. Zhang, T.S.; Yu, Q.J.; Wei, J.X.; Gao, P.; Chen, P.X.; Hu, J. Micro-structural development of gap-graded blended cement pastes containing a high amount of supplementary cementitious materials. Cem. Concr. Compos. 2012, 34, 1024–1032. [Google Scholar] [CrossRef]
  45. Jiang, D.B.; Li, X.G.; Lv, Y.; Zhou, M.K.; He, C.H.; Jiang, W.G.; Liu, Z.L.; Li, C.J. Utilization of limestone powder and fly ash in blended cement: Rheology, strength and hydration characteristics. Constr. Build. Mater. 2020, 232, 117228. [Google Scholar] [CrossRef]
  46. Rao, K.J.; Keerthi, K.; Vasam, S. Acid resistance of quaternary blended recycled aggregate concrete. Case Stud. Constr. Mater. 2018, 8, 423–433. [Google Scholar] [CrossRef]
  47. Aydin, S.; Yazici, H.; Yigiter, H.; Baradan, B. Sulfuric acid resistance of high-volume fly ash concrete. Build. Environ. 2007, 42, 717–721. [Google Scholar] [CrossRef]
  48. Bjegovic, D.; Stirmer, N.; Serdar, M. Durability properties of concrete with blended cements. Mater. Corros.-Werkst. Korros. 2012, 63, 1087–1096. [Google Scholar] [CrossRef]
  49. Yang, R.H.; He, T.S. Influence of liquid accelerators combined with mineral admixtures on early hydration of cement pastes. Constr. Build. Mater. 2021, 295, 123659. [Google Scholar] [CrossRef]
  50. Tangpagasit, J.; Cheerarot, R.; Jaturapitakkul, C.; Kiattikomol, K. Packing effect and pozzolanic reaction of fly ash in mortar. Cem. Concr. Res. 2005, 35, 1145–1151. [Google Scholar] [CrossRef]
  51. Wu, Z.W. An approach to the recent trends of concrete science and technology. J. Chin. Ceram. Soc. 1979, 7, 262–270. (In Chinese) [Google Scholar]
  52. Elsharief, A.; Cohen, M.D.; Olek, J. Influence of aggregate size, water cement ratio and age on the microstructure of the interfacial transition zone. Cem. Concr. Res. 2003, 33, 1837–1849. [Google Scholar] [CrossRef]
  53. Piasta, W.; Zarzycki, B. The effect of cement paste volume and w/c ratio on shrinkage strain, water absorption and compressive strength of high performance concrete. Constr. Build. Mater. 2017, 140, 395–402. [Google Scholar] [CrossRef]
  54. Yu, Z.Q.; Ni, C.X.; Tang, M.L.; Shen, X.D. Relationship between water permeability and pore structure of Portland cement paste blended with fly ash. Constr. Build. Mater. 2018, 175, 458–466. [Google Scholar] [CrossRef]
  55. Li, Y.; Bao, J.L.; Guo, Y.L. The relationship between autogenous shrinkage and pore structure of cement paste with mineral admixtures. Constr. Build. Mater. 2010, 24, 1855–1860. [Google Scholar] [CrossRef]
  56. Richardson, I.G. The nature of the hydration products in hardened cement pastes. Cem. Concr. Compos. 2000, 22, 97–113. [Google Scholar] [CrossRef]
  57. Zeng, Q.; Li, K.; Fen-chong, T.; Dangla, P. Determination of cement hydration and pozzolanic reaction extents for fly-ash cement pastes. Constr. Build. Mater. 2012, 27, 560–569. [Google Scholar] [CrossRef]
  58. Li, S. Microstructure and composition characterisation of three 20-year-old GGBS-OPC blended pastes. Constr. Build. Mater. 2016, 123, 226–234. [Google Scholar] [CrossRef]
  59. Teng, S.; Lim, T.Y.D.; Divsholi, B.S. Durability and Mechanical Properties of High Strength Concrete Incorporating Ultra Fine Ground Granulated Blast-Furnace Slag. Constr. Build. Mater. 2013, 40, 875–881. [Google Scholar] [CrossRef]
  60. Wu, L.P.; Huang, G.P.; Liu, W.V. Performance evaluation of nano-silica and silica fume on enhancing acid resistance of cement-based composites for underground structures. J. Cent. South Univ. 2020, 27, 3821–3838. [Google Scholar] [CrossRef]
  61. Wansom, S.; Chintasongkro, P.; Srijampan, W. Water resistant blended cements containing flue-gas desulfurization gypsum, Portland cement and fly ash for structural applications. Cem. Concr. Compos. 2019, 103, 134–148. [Google Scholar] [CrossRef]
  62. Duan, S.; Liao, H.; Cheng, F.; Song, H.; Yang, H. Investigation into the synergistic effects in hydrated gelling systems containing fly ash, desulfurization gypsum and steel slag. Constr. Build. Mater. 2018, 187, 1113–1120. [Google Scholar] [CrossRef]
  63. Ma, B.; Liu, X.; Tan, H.; Zhang, T.; Mei, J.; Qi, H.; Jiang, W.; Zou, F. Utilization of pretreated fly ash to enhance the chloride binding capacity of cement-based material. Constr. Build. Mater. 2018, 175, 726–734. [Google Scholar] [CrossRef]
  64. Qiao, C.; Suraneni, P.; Ying, T.N.W.; Choudhary, A.; Weiss, J. Chloride binding of cement pastes with fly ash exposed to CaCl2 solutions at 5 and 23 °C. Cem. Concr. Compos. 2019, 97, 43–53. [Google Scholar] [CrossRef]
  65. Zhang, T.; Tian, W.; Guo, Y.; Bogush, A.; Khayrulina, E.; Wei, J.; Yu, Q. The volumetric stability, chloride binding capacity and stability of the Portland cement-GBFS pastes: An approach from the viewpoint of hydration products. Constr. Build. Mater. 2019, 205, 357–367. [Google Scholar] [CrossRef]
  66. Ming, X.; Li, Y.; Liu, Q.; Wang, M.; Cai, Y.; Chen, B.; Li, Z. Chloride binding behaviors and early age hydration of tricalcium aluminate in chloride-containing solutions. Cem. Concr. Compos. 2023, 137, 104928. [Google Scholar] [CrossRef]
  67. Orozco, C.; Babel, S.; Tangtermsirikul, S.; Sugiyama, T. Comparison of environmental impacts of fly ash and slag as cement replacement materials for mass concrete and the impact of transportation. Sustain. Mater. Technol. 2024, 39, e00796. [Google Scholar] [CrossRef]
  68. Nie, S.; Zhou, J.; Yang, F.; Lan, M.; Li, J.; Zhang, Z.; Chen, Z.; Xu, M.; Li, H.; Sanjayan, J.G. Analysis of theoretical carbon dioxide emissions from cement production: Methodology and application. J. Clean. Prod. 2022, 334, 130270. [Google Scholar] [CrossRef]
  69. Scrivener, K.L.; John, V.M.; Gartner, E.M. Eco-efficient cements: Potential economically viable solutions for a low-CO2 cement-based materials industry. Cem. Concr. Res. 2018, 114, 2–26. [Google Scholar] [CrossRef]
  70. Wojtacha-Rychter, K.; Kucharski, P.; Smolinski, A. Conventional and Alternative Sources of Thermal Energy in the Production of Cement-An Impact on CO2 Emission. Energies 2021, 14, 1539. [Google Scholar] [CrossRef]
Figure 1. Micromorphology of raw materials: (a) fly ash (FA); (b) silica ash (SF); (c) granulated blast furnace slag (GBFS); (d) cement; (e) desulfurization gypsum (DG).
Materials 17 00752 g001
Figure 2. Cumulative distribution (a) of raw material particles; interval distribution (b) of raw material particles.
Materials 17 00752 g002
Figure 3. Compressive strength of the samples.
Materials 17 00752 g003
Figure 4. Corrosion resistance coefficient of the samples.
Materials 17 00752 g004
Figure 5. Chloride ion permeability coefficient of the 28 days samples.
Materials 17 00752 g005
Figure 6. XRD pattern of the 28 days cement pastes.
Materials 17 00752 g006
Figure 7. SEM images of the 28 days cement pastes.
Materials 17 00752 g007
Figure 8. Pore size distribution (a) of the samples; pore volume fraction (b) of the samples.
Materials 17 00752 g008
Figure 9. Schematic diagram of filling and pozzolanic effects of FA-GBFS-FA-DG ACM system in cement.
Materials 17 00752 g009
Table 1. Chemical composition of raw materials used in current study.
MaterialsCaOSiO2Fe2O3Al2O3SO3K2OTiO2MgON
Cement72.015.33.563.452.930.790.190.550.76
FA11.241.84.0136.61.600.761.280.720.52
GBFS48.628.00.4814.21.980.280.744.910.00
SF1.4496.60.140.490.090.390.000.180.26
DG47.42.480.521.3847.50.120.080.220.00
Note: FA—fly ash; GBFS—granulated blast furnace slag; SF—silica fume; DG—desulfurization gypsum.
Table 2. Factors and levels of orthogonal experimental design.
LevelsExperimental Factors
A (Water–Binder Ratio)B (Cementitious Ratio)C (Replacement Cement
Ratio)
10.554:4:1:10%
20.456:2:1:130%
30.502:6:1:160%
Table 3. Orthogonal experiment design.
Mix NO.Factors
ABC
Z13 (0.50)2(6:2:1:1)1 (0.0%)
Z21 (0.55)22 (30%)
Z32 (0.45)1(4:4:1:1)2
Z4111
Z533(2:6:1:1)2
Z6231
Z7313 (60%)
Z8133
Z9223
Table 4. Mix proportions of mortars.
Mix NO.Quality (g)
GBFSFASFDGCementSandWater
Z100004501350225.0
Z2812713.513.53151350247.5
Z3545413.513.53151350202.5
Z400004501350247.5
Z5278113.513.53151350225.0
Z600004501350202.5
Z710810827271801350225.0
Z85416227271801350247.5
Z91625427271801350202.5
Table 5. Range analysis results.
Indicator ValueCompressive Strength/MPaCorrosion Resistance Coefficient/%Chloride Ion Permeability Coefficient
/(m2/s)
ABCABCABC
Kj11862001972772662772.57 × 10−122.44 × 10−124.99 × 10⁻¹²
Kj21902042102642792682.37 × 10−122.16 × 10−121.40 × 10⁻¹²
Kj31921861832842802802.14 × 10−122.47 × 10−120.67 × 10⁻¹²
kj162.066.565.692.488.892.30.86 × 10−120.81 × 10−121.67 × 10⁻¹²
kj263.468.069.888.193.089.40.79 × 10−120.72 × 10−120.47 × 10⁻¹²
kj364.162.061.194.593.393.40.71 × 10−120.82 × 10−120.22 × 10⁻¹²
R2.106.008.706.404.504.000.15 × 10−120.10 × 10−121.45 × 10⁻¹²
Ranking of impactC > B > AA > B > CC > A > B
Table 6. Variance Analysis results.
Dependent Variable Independent Variable (Factor)Type III Sum of SquaresDf (Free
Degree)
F Valuep Value
Compressive strength/MPaB59.420.790.51
C11521.530.32
Error1504
R2 = 0.54 (Adjust R2 = 0.08)
Corrosion resistance coefficient/%A63.320.8690.49
B36.820.5060.64
Error1454
R2 = 0.41 (Adjust R2 = 0.19)
Chloride ion permeability coefficient/(m2/s)A0.03 × 10−1221.010.44
C3.57 × 10−1221280.00
Error0.06 × 10−124
R2 = 0.99 (Adjust R2 = 0.97)
Table 7. CI values of the samples.
Mix NO.Compressive Strength/MPaCorrosion Resistance Coefficient/%Chloride Ion Permeability Coefficient/(m2/s)CI Values
Z164.191.41.44 × 10−120.45
Z269.095.10.52 × 10−120.83
Z373.178.00.42 × 10−120.00
Z465.791.51.80 × 10−120.00
Z567.495.10.48 × 10−120.82
Z667.094.01.76 × 10−120.25
Z760.897.00.23 × 10−120.75
Z851.590.70.24 × 10−120.00
Z970.992.40.20 × 10−120.87
Table 8. The average annual price of each raw material.
MaterialsCementFAGBFSSFDG
Price per ton/RMB515130.2212.580046.3
Disclaimer/Publisher’s Note: The statements, opinions and data contained in all publications are solely those of the individual author(s) and contributor(s) and not of MDPI and/or the editor(s). MDPI and/or the editor(s) disclaim responsibility for any injury to people or property resulting from any ideas, methods, instructions or products referred to in the content.

