

Investigating Hydrogen in Zirconium Alloys by Means of Neutron Imaging


Abstract
:1. Introduction
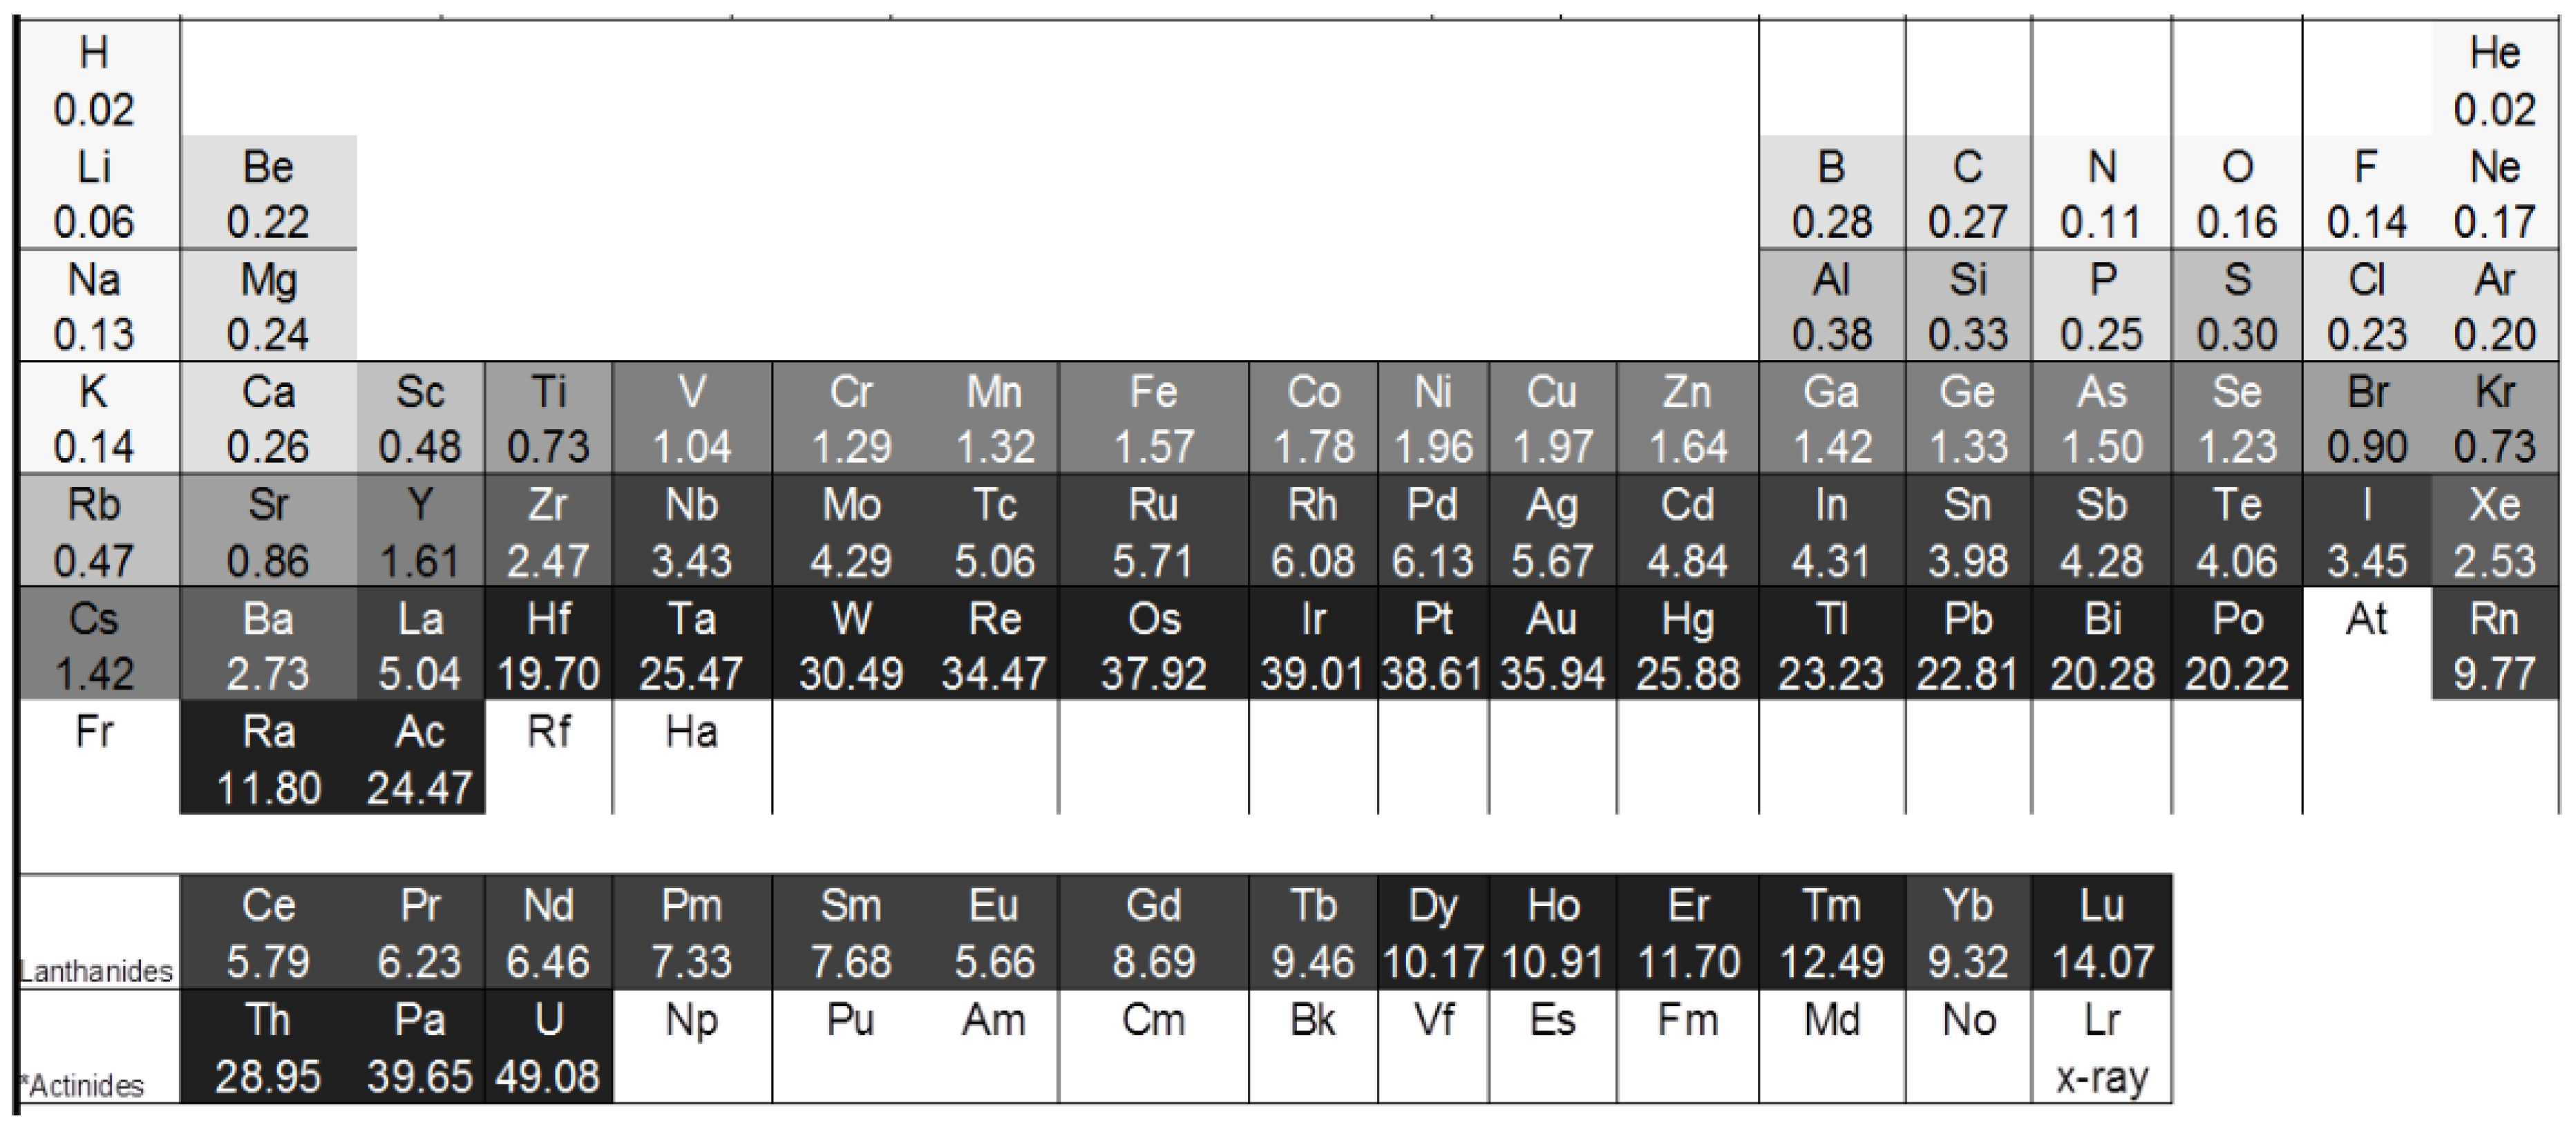
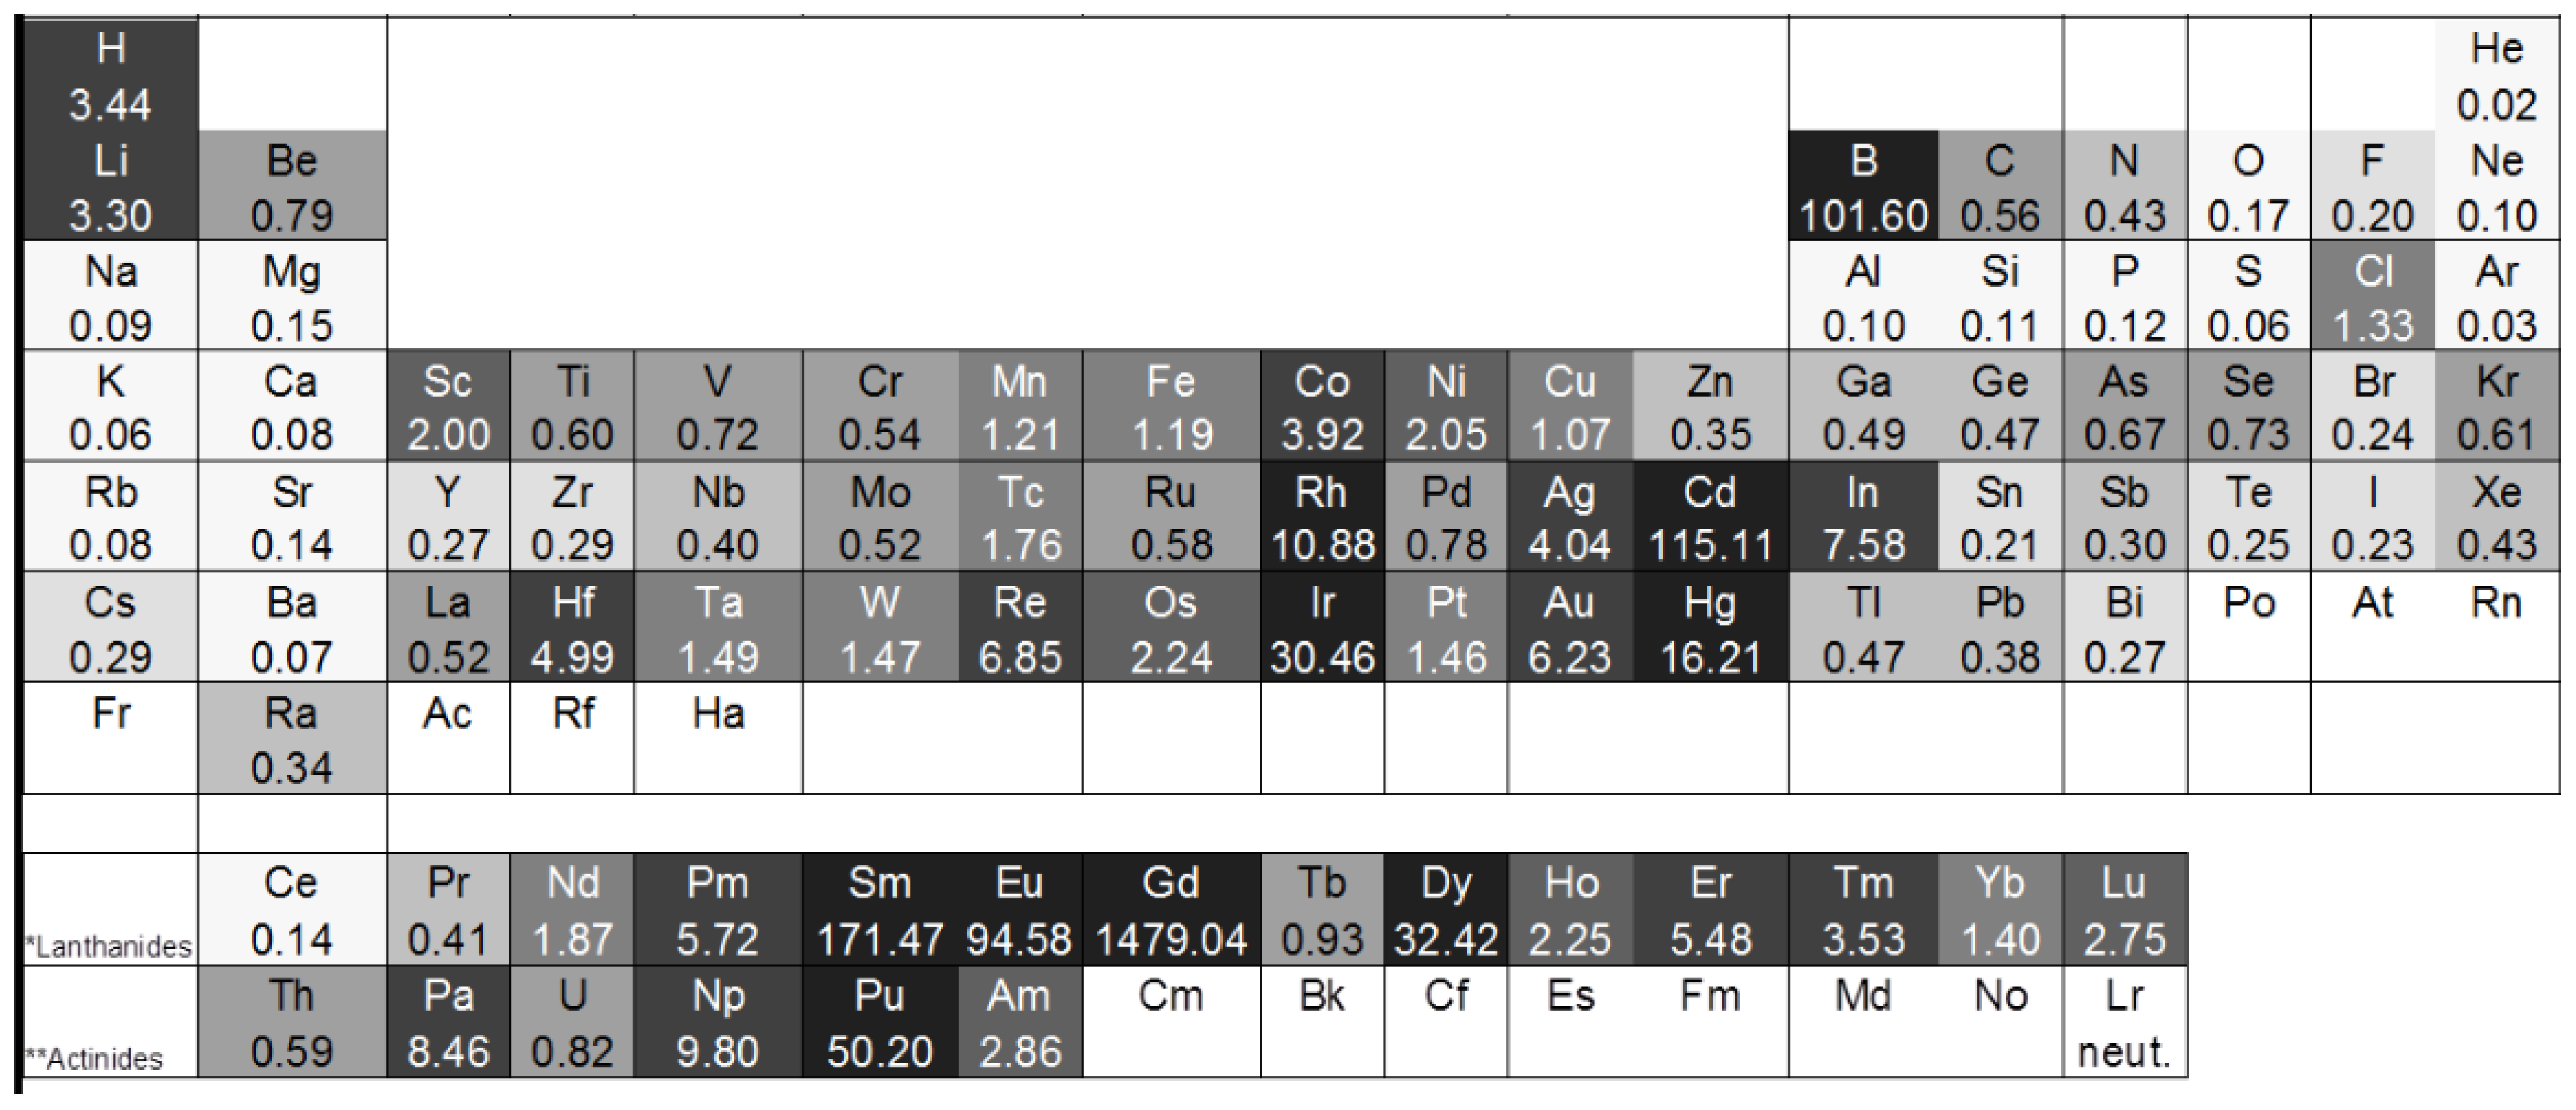
2. Theory
3. Neutron Tomography
4. Facilities
4.1. NEXT at ILL (High Flux Reactor) in Grenoble
4.2. ANTARES at FRM-2 in Garching
4.3. Neutron Imaging Instruments at SINQ, PSI in Villigen
4.4. IMAT at ISIS in the STFC Rutherford Appleton Laboratory at the Harwell Campus Didcot
5. Examples for Neutron Experiments
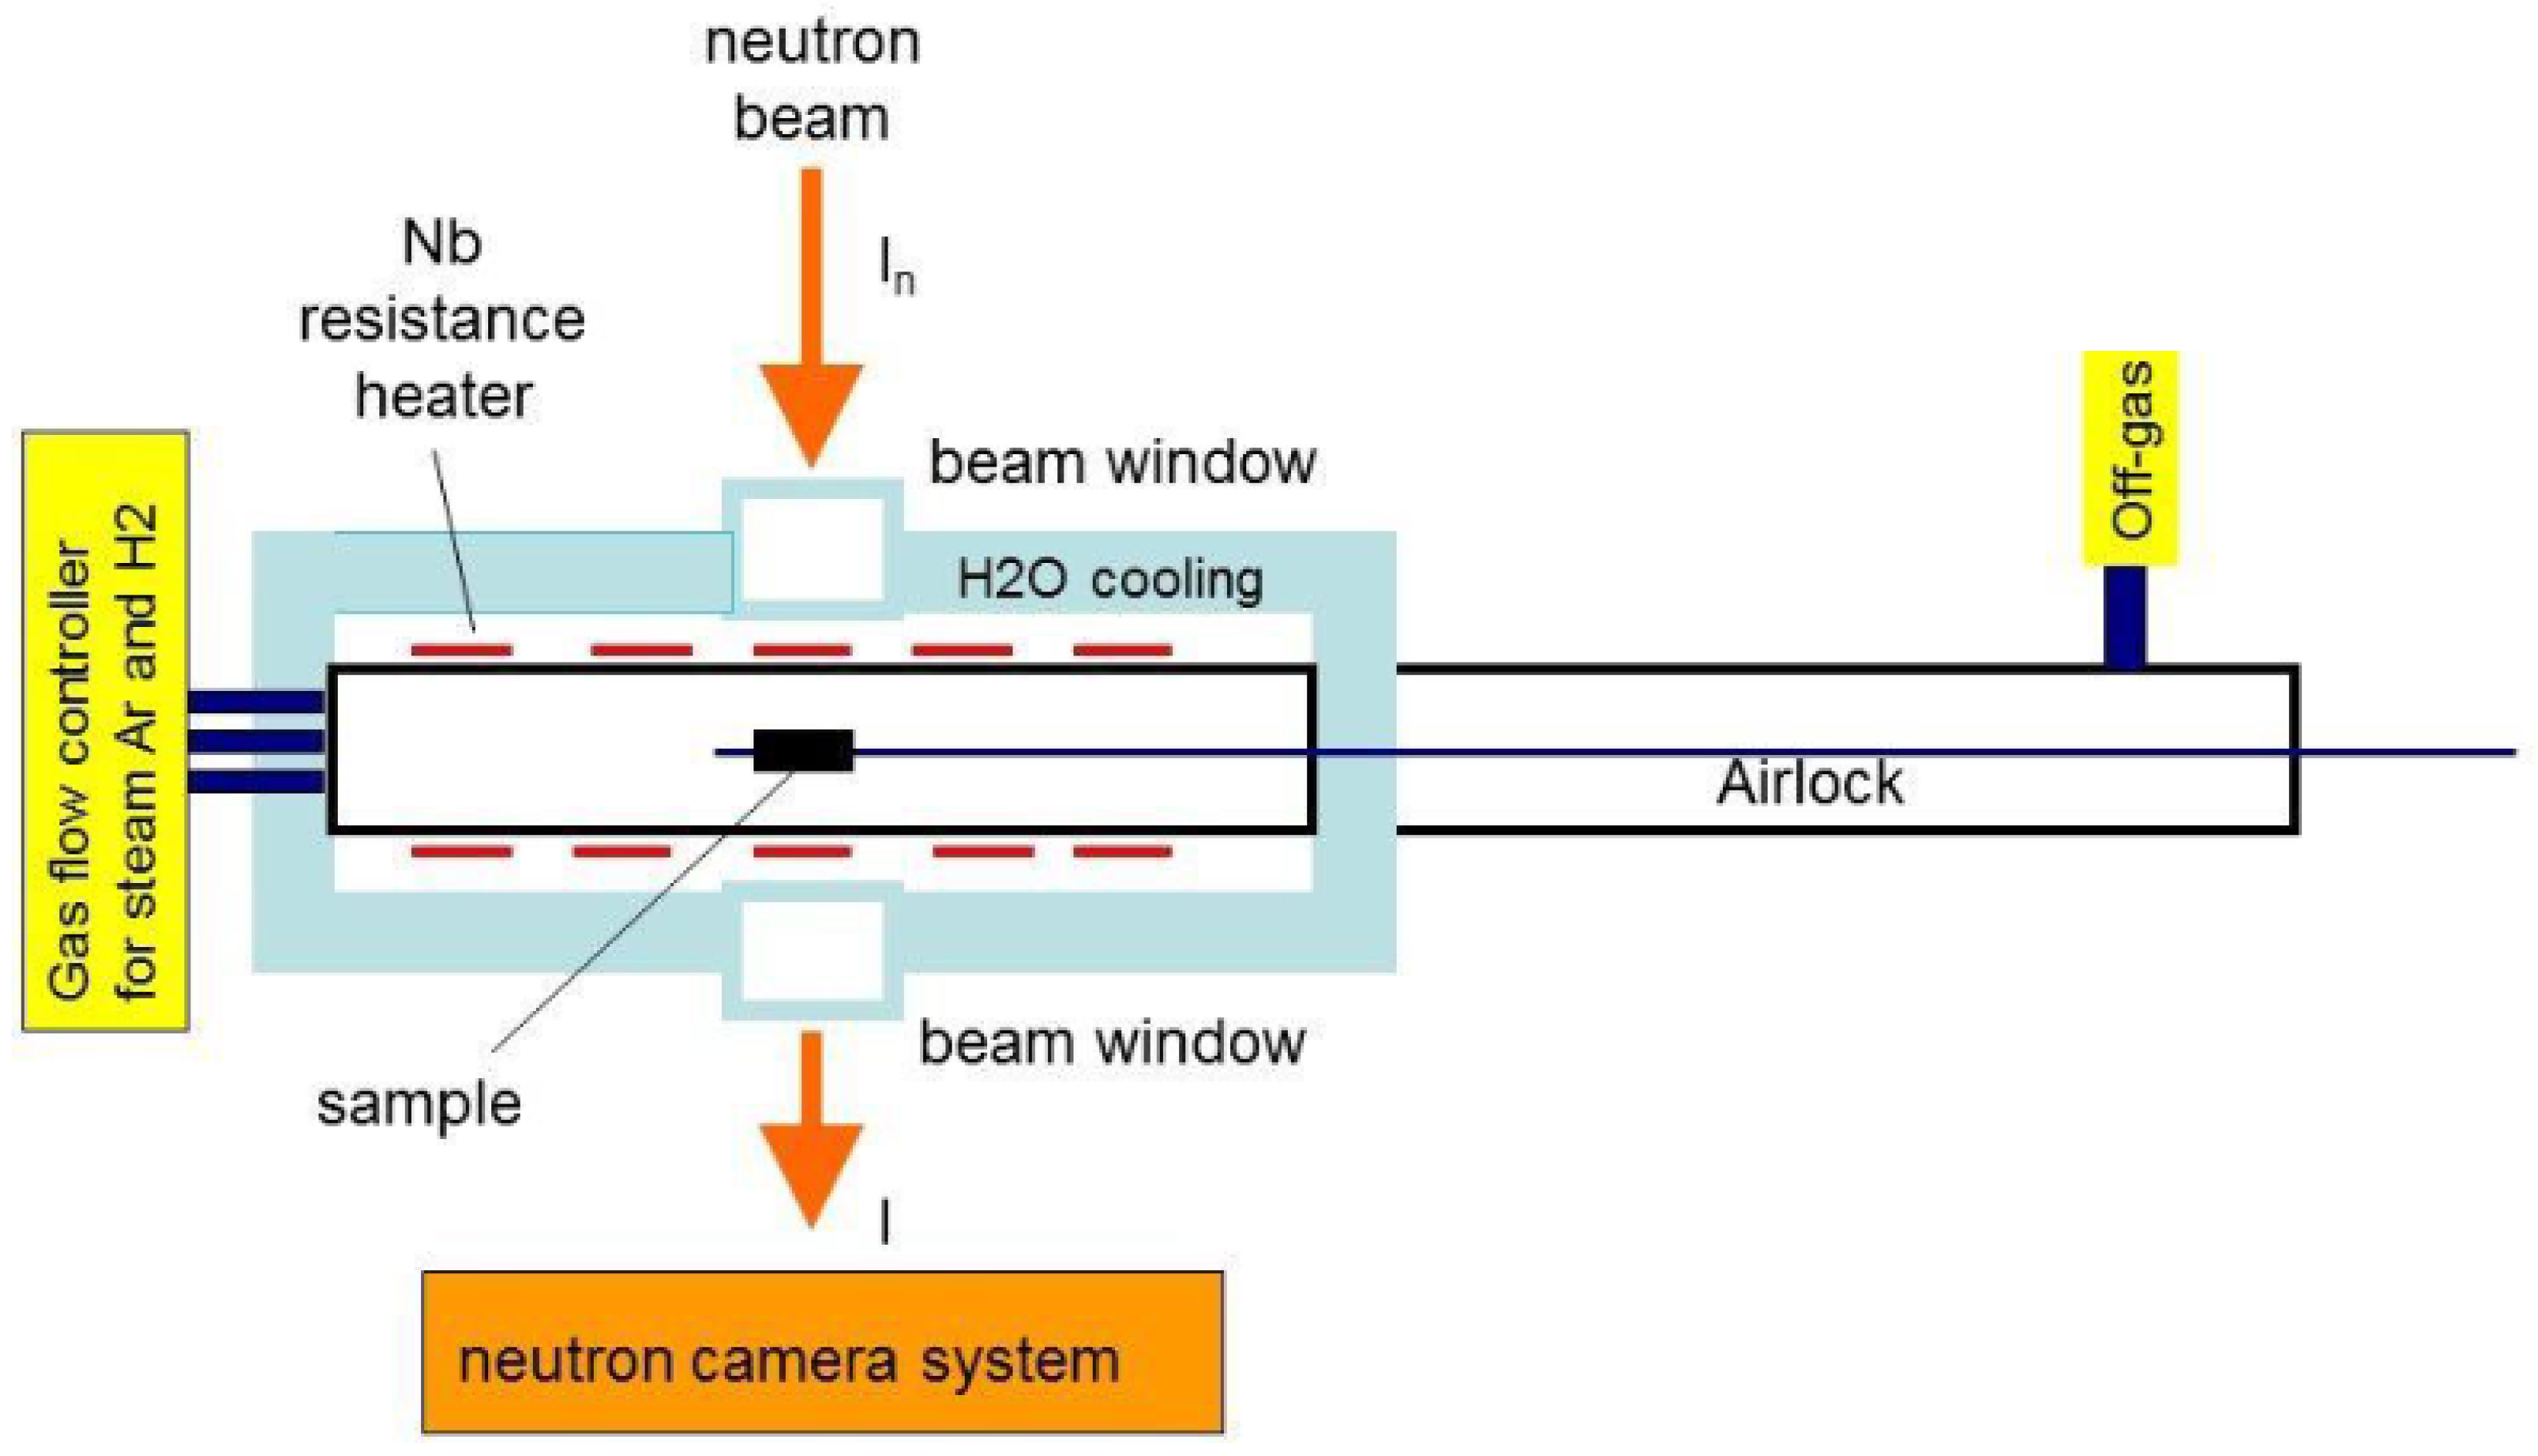
5.1. Hydrogen Diffusion Studies
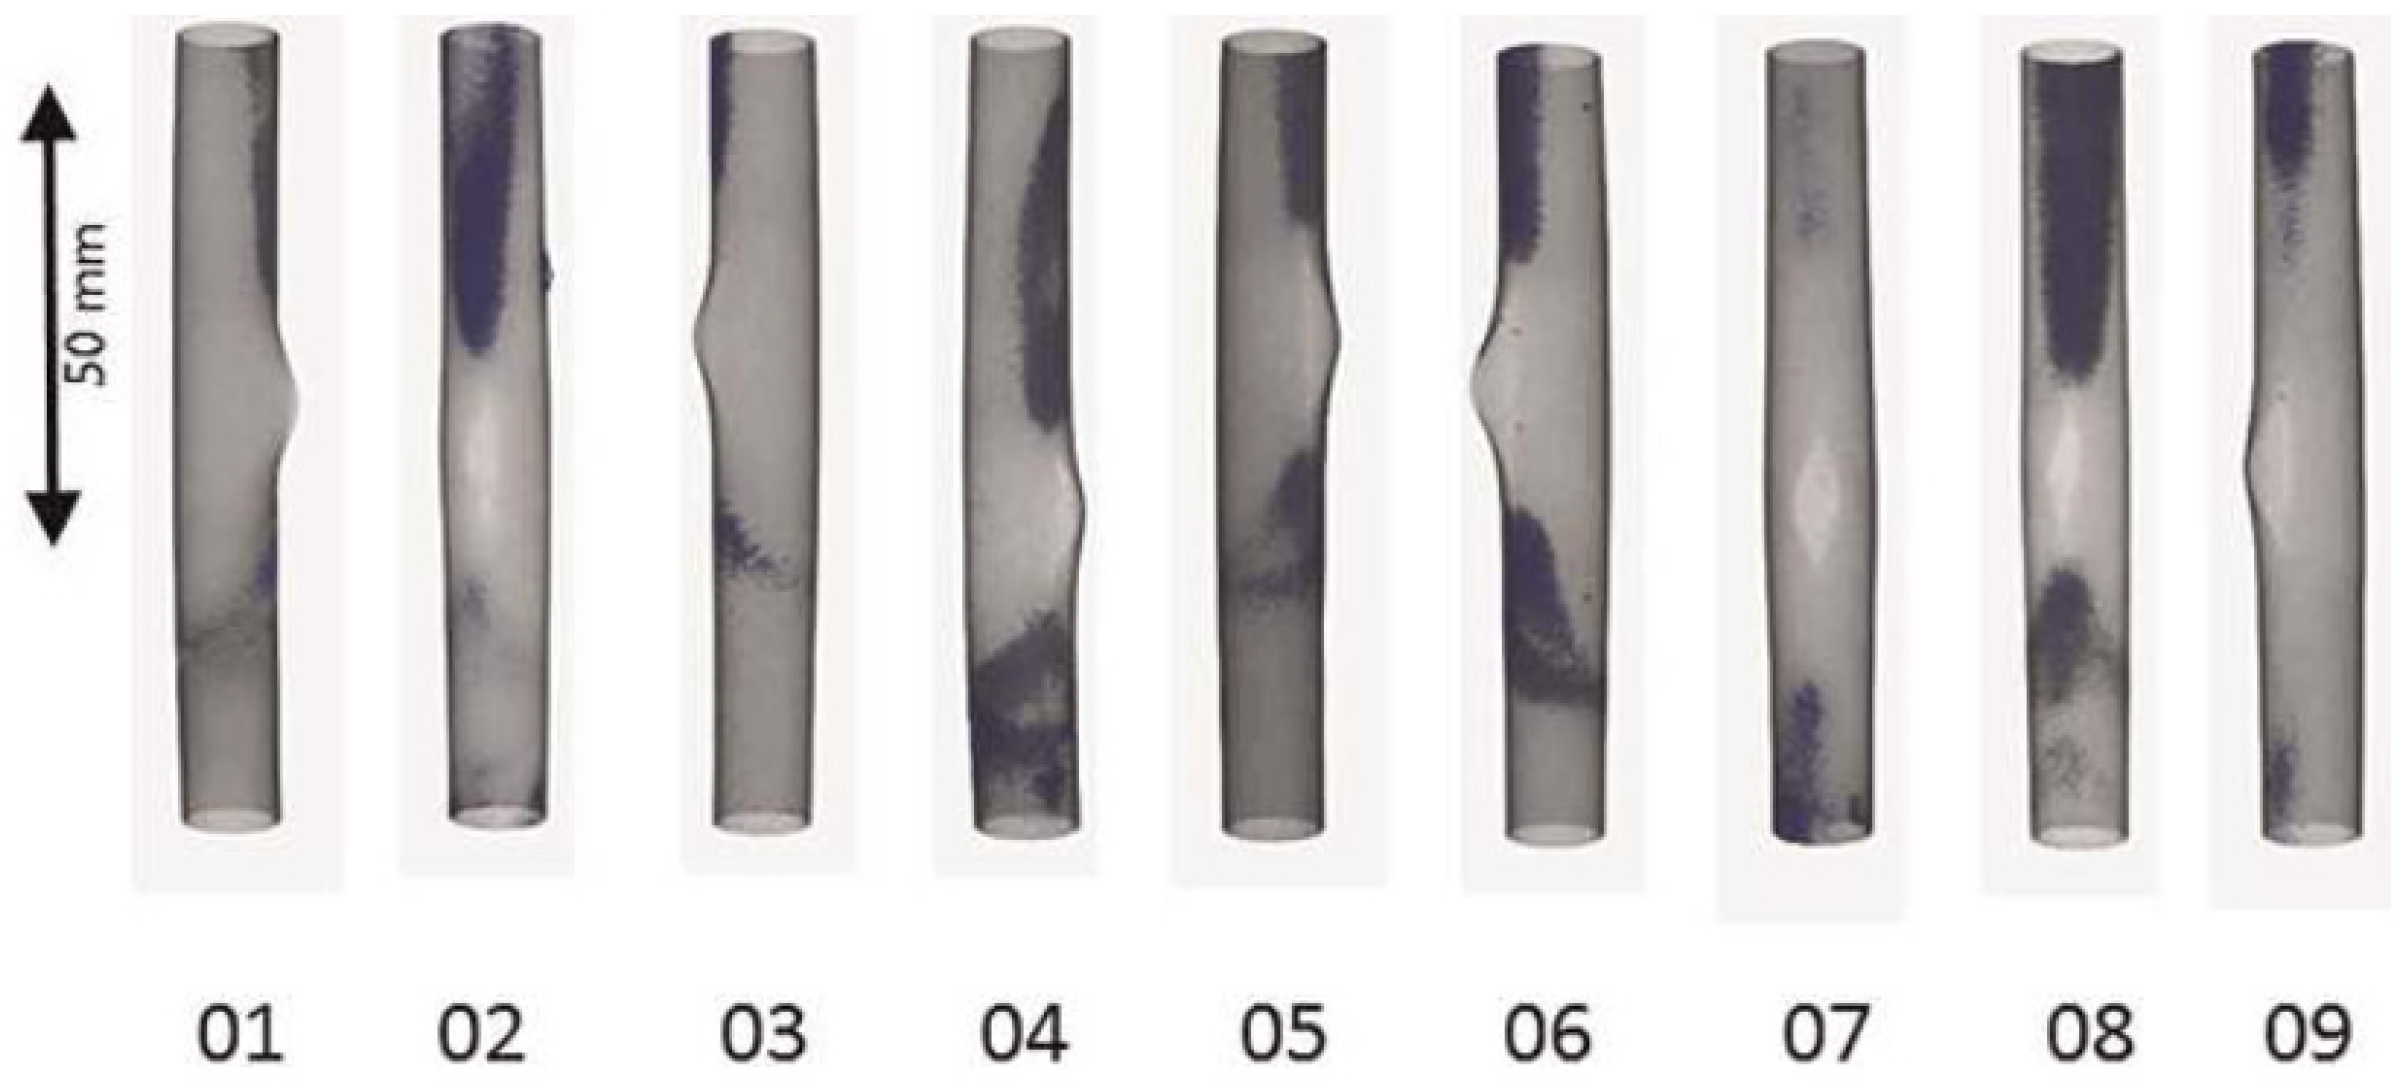
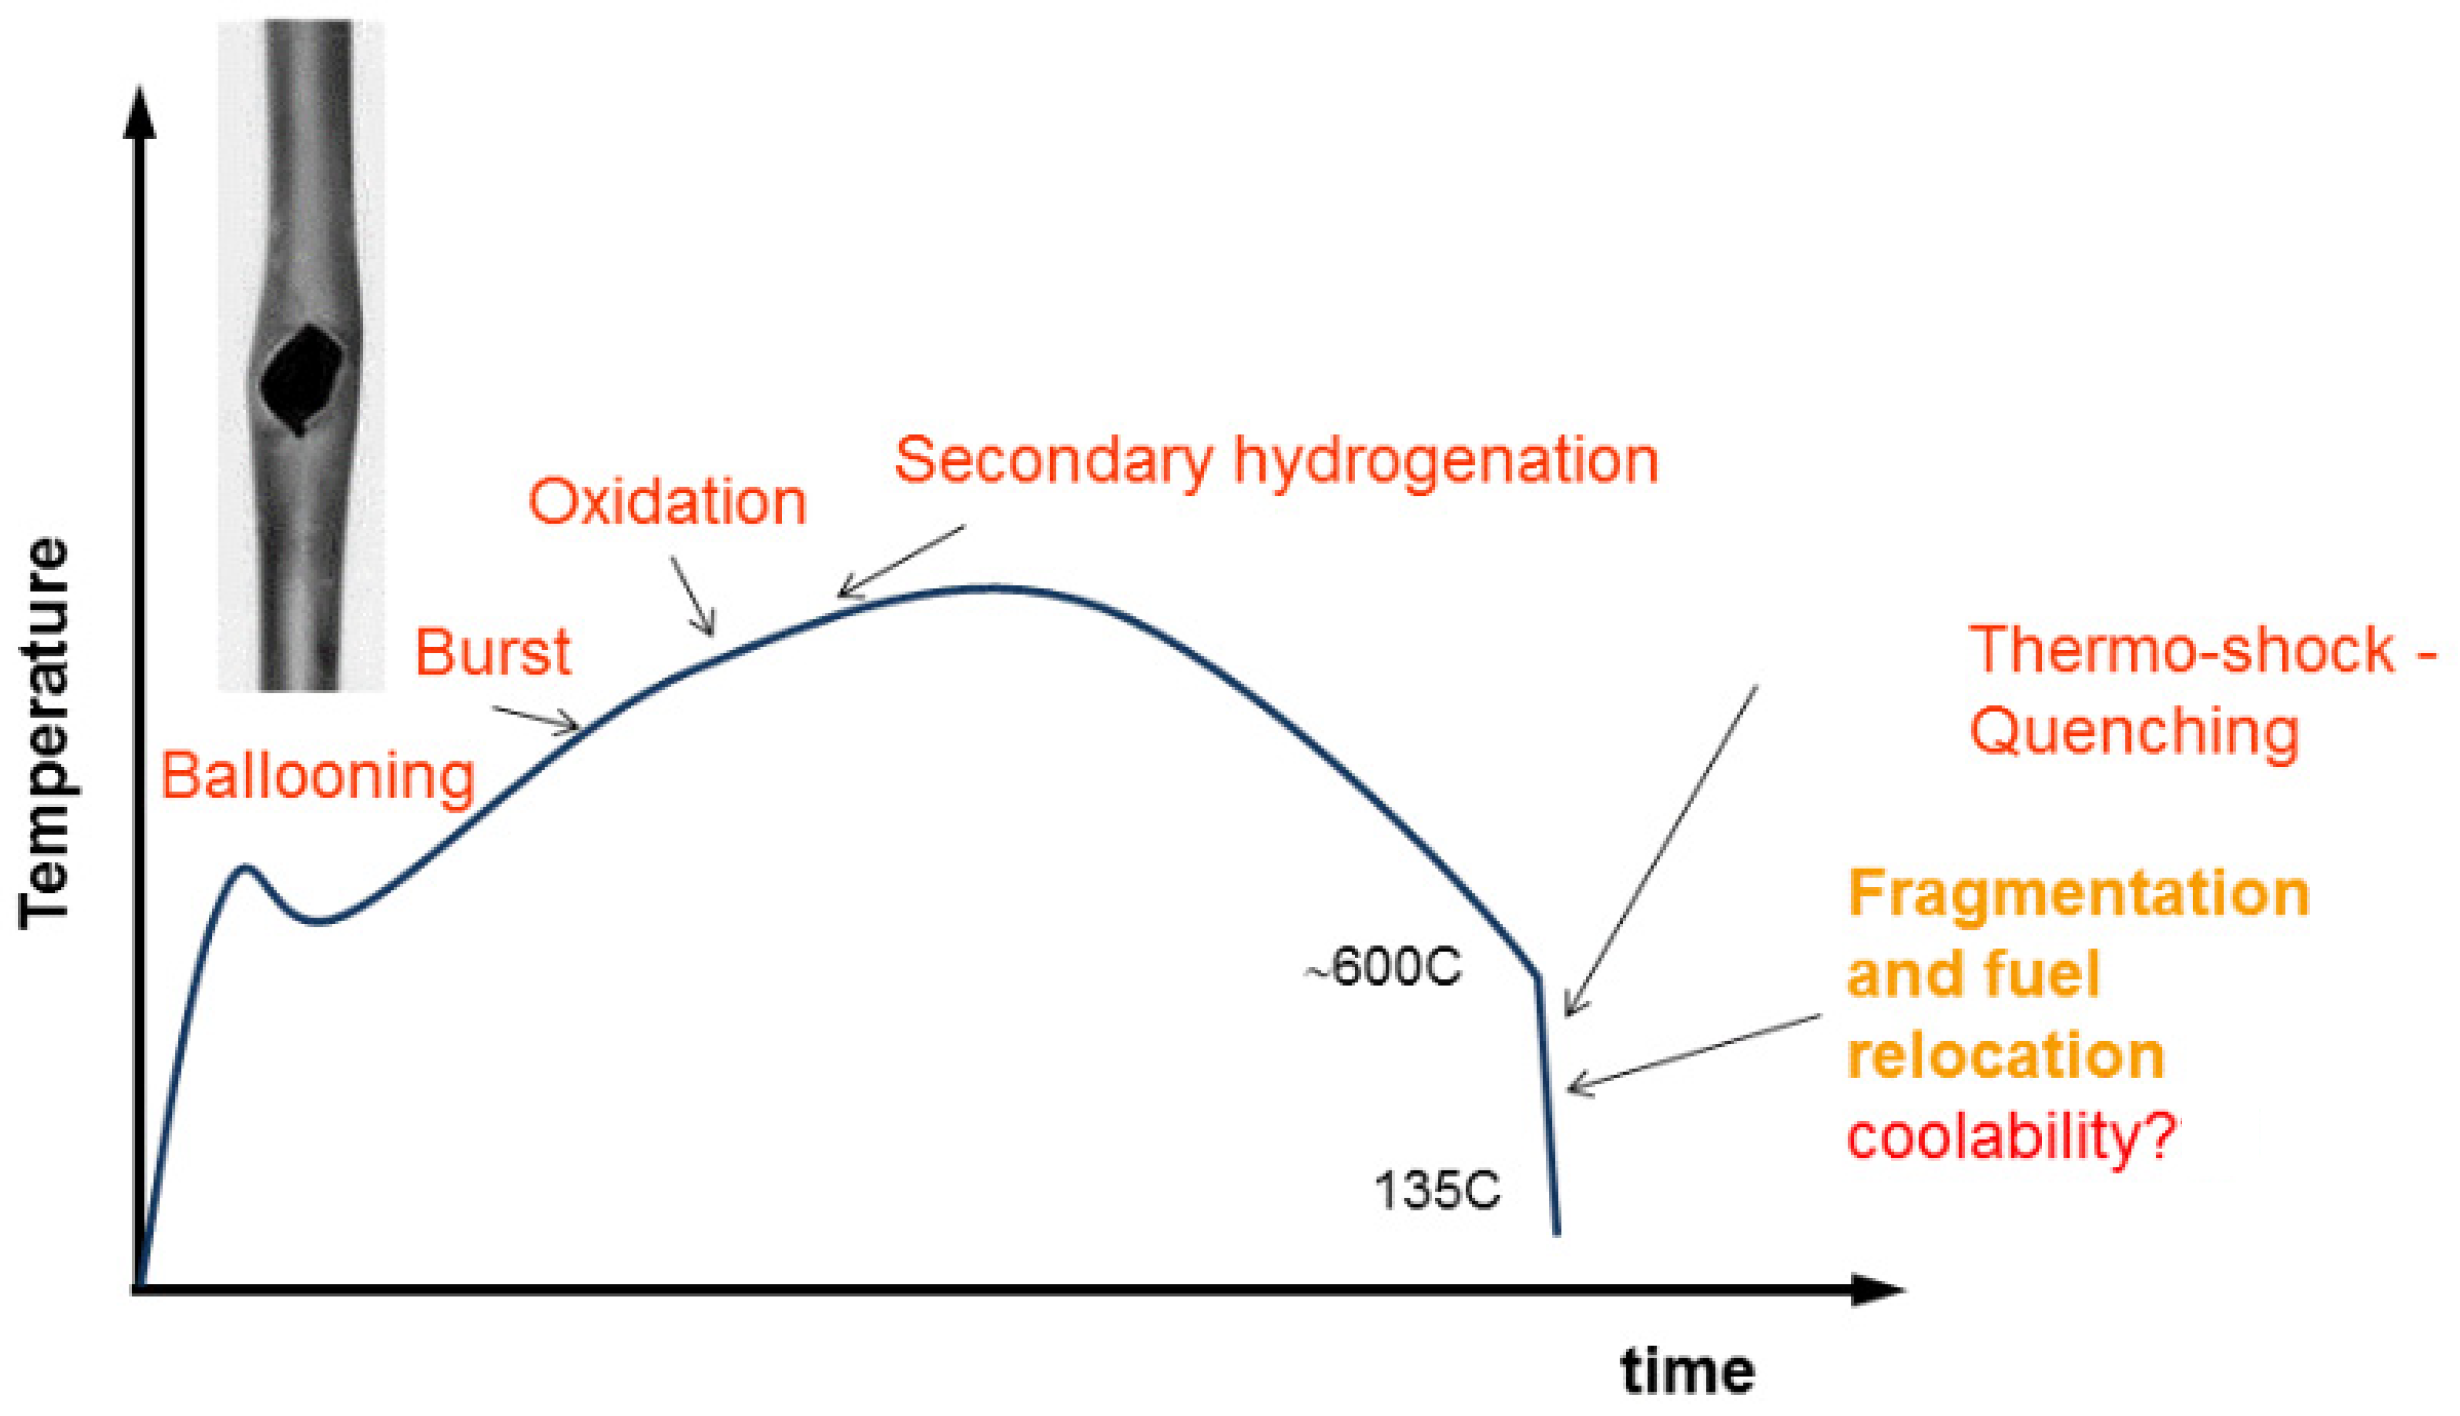
5.2. Analysis of the Hydrogen Distribution in Cladding Tubes after Simulated Basis Loss of Coolant Accidents
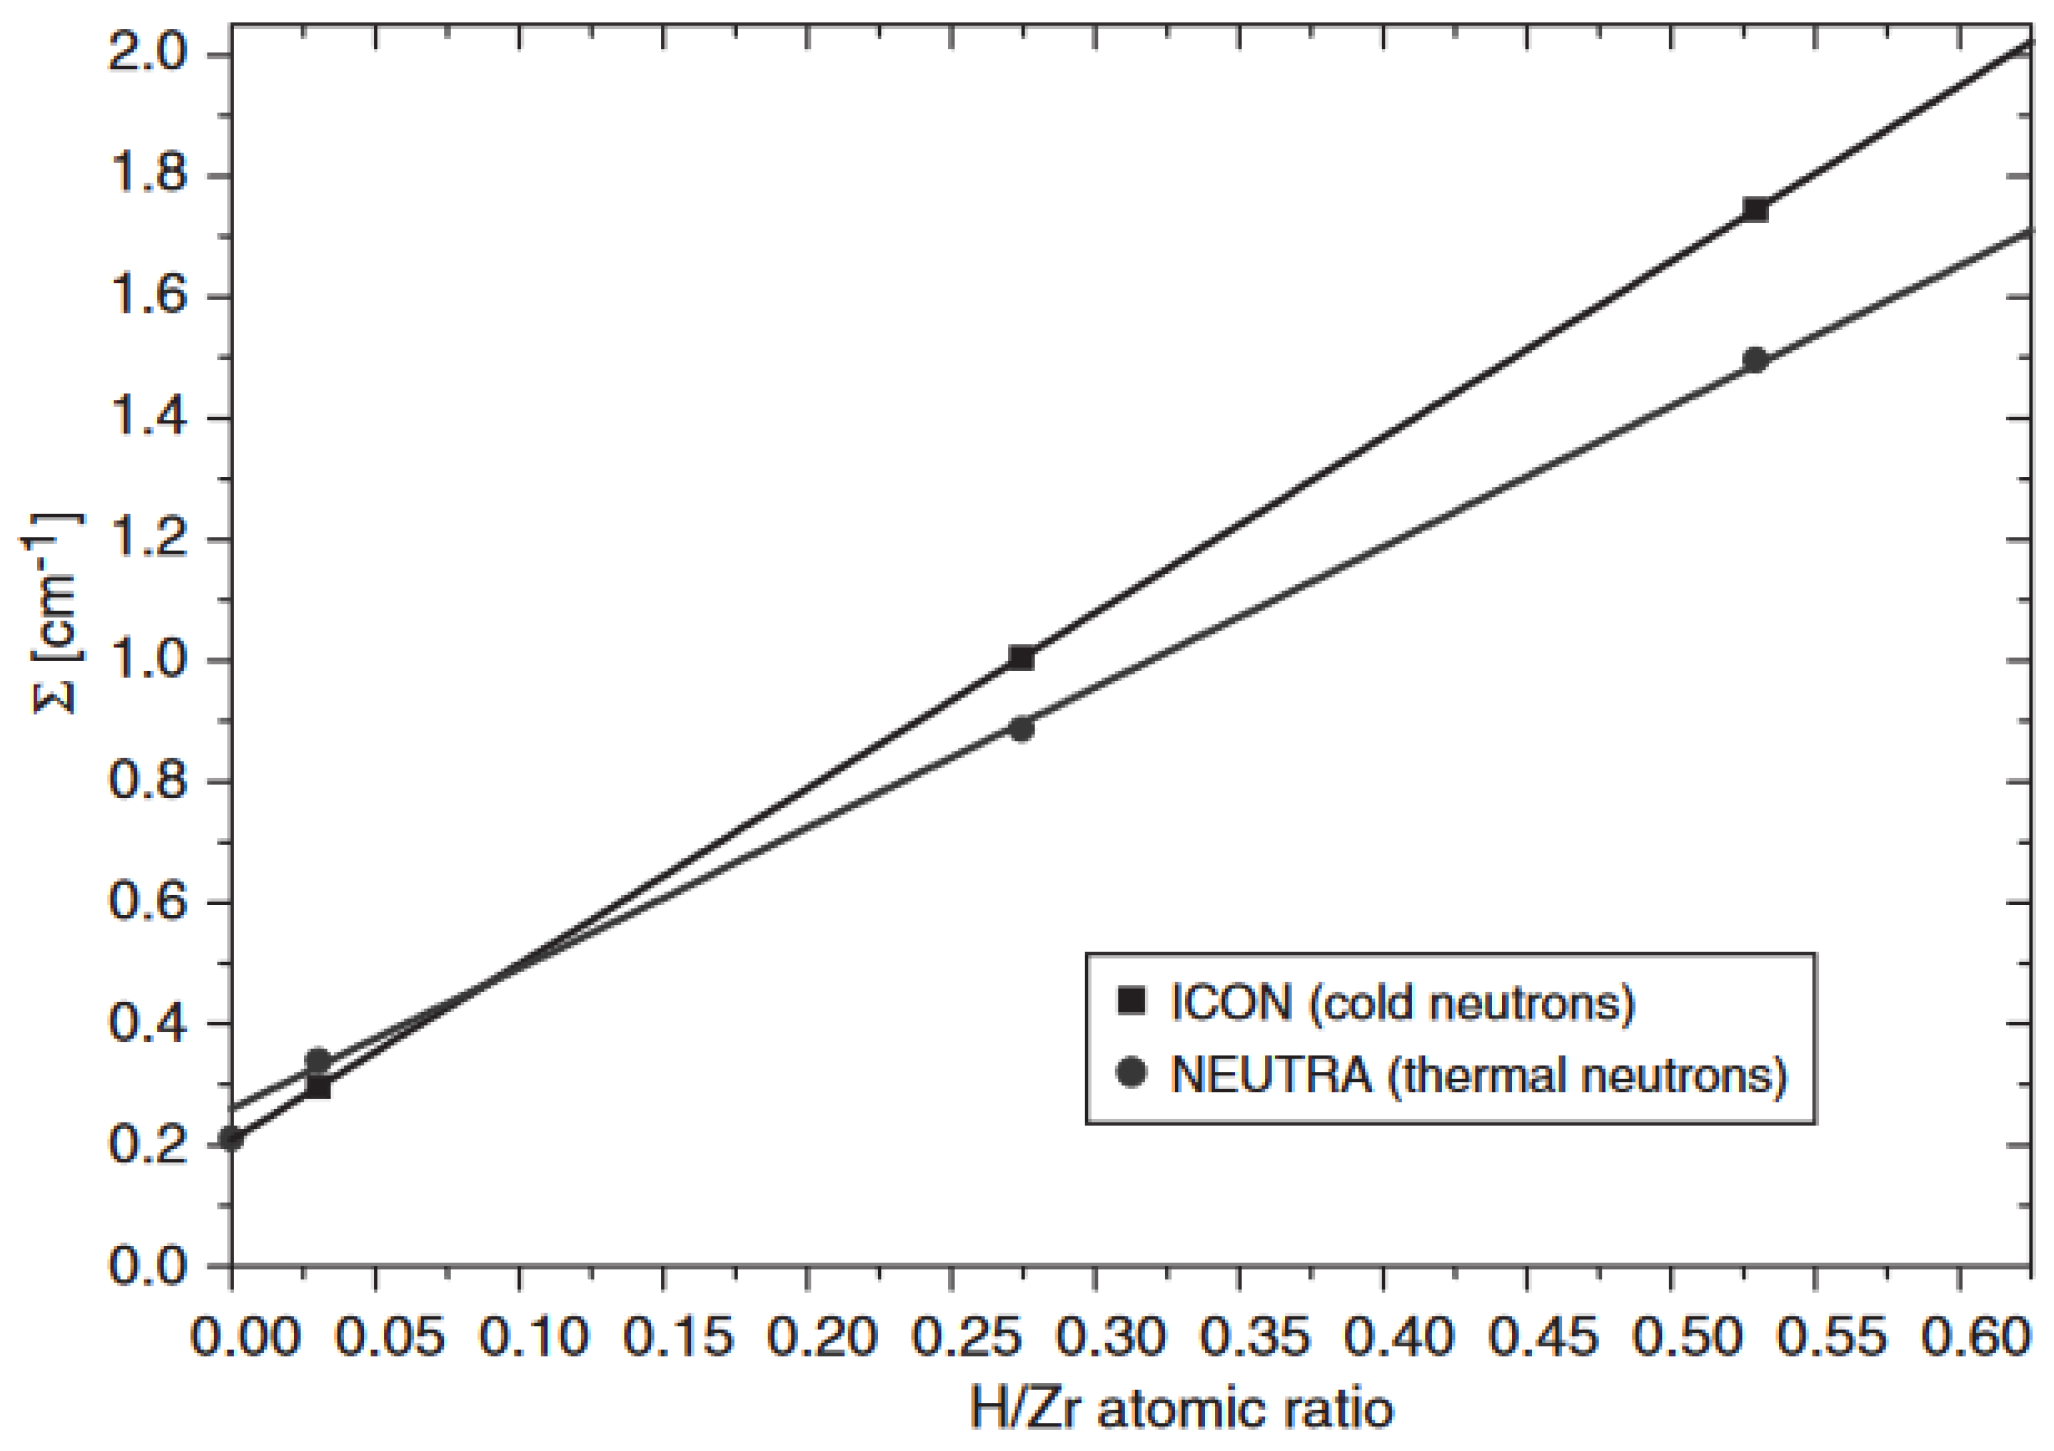
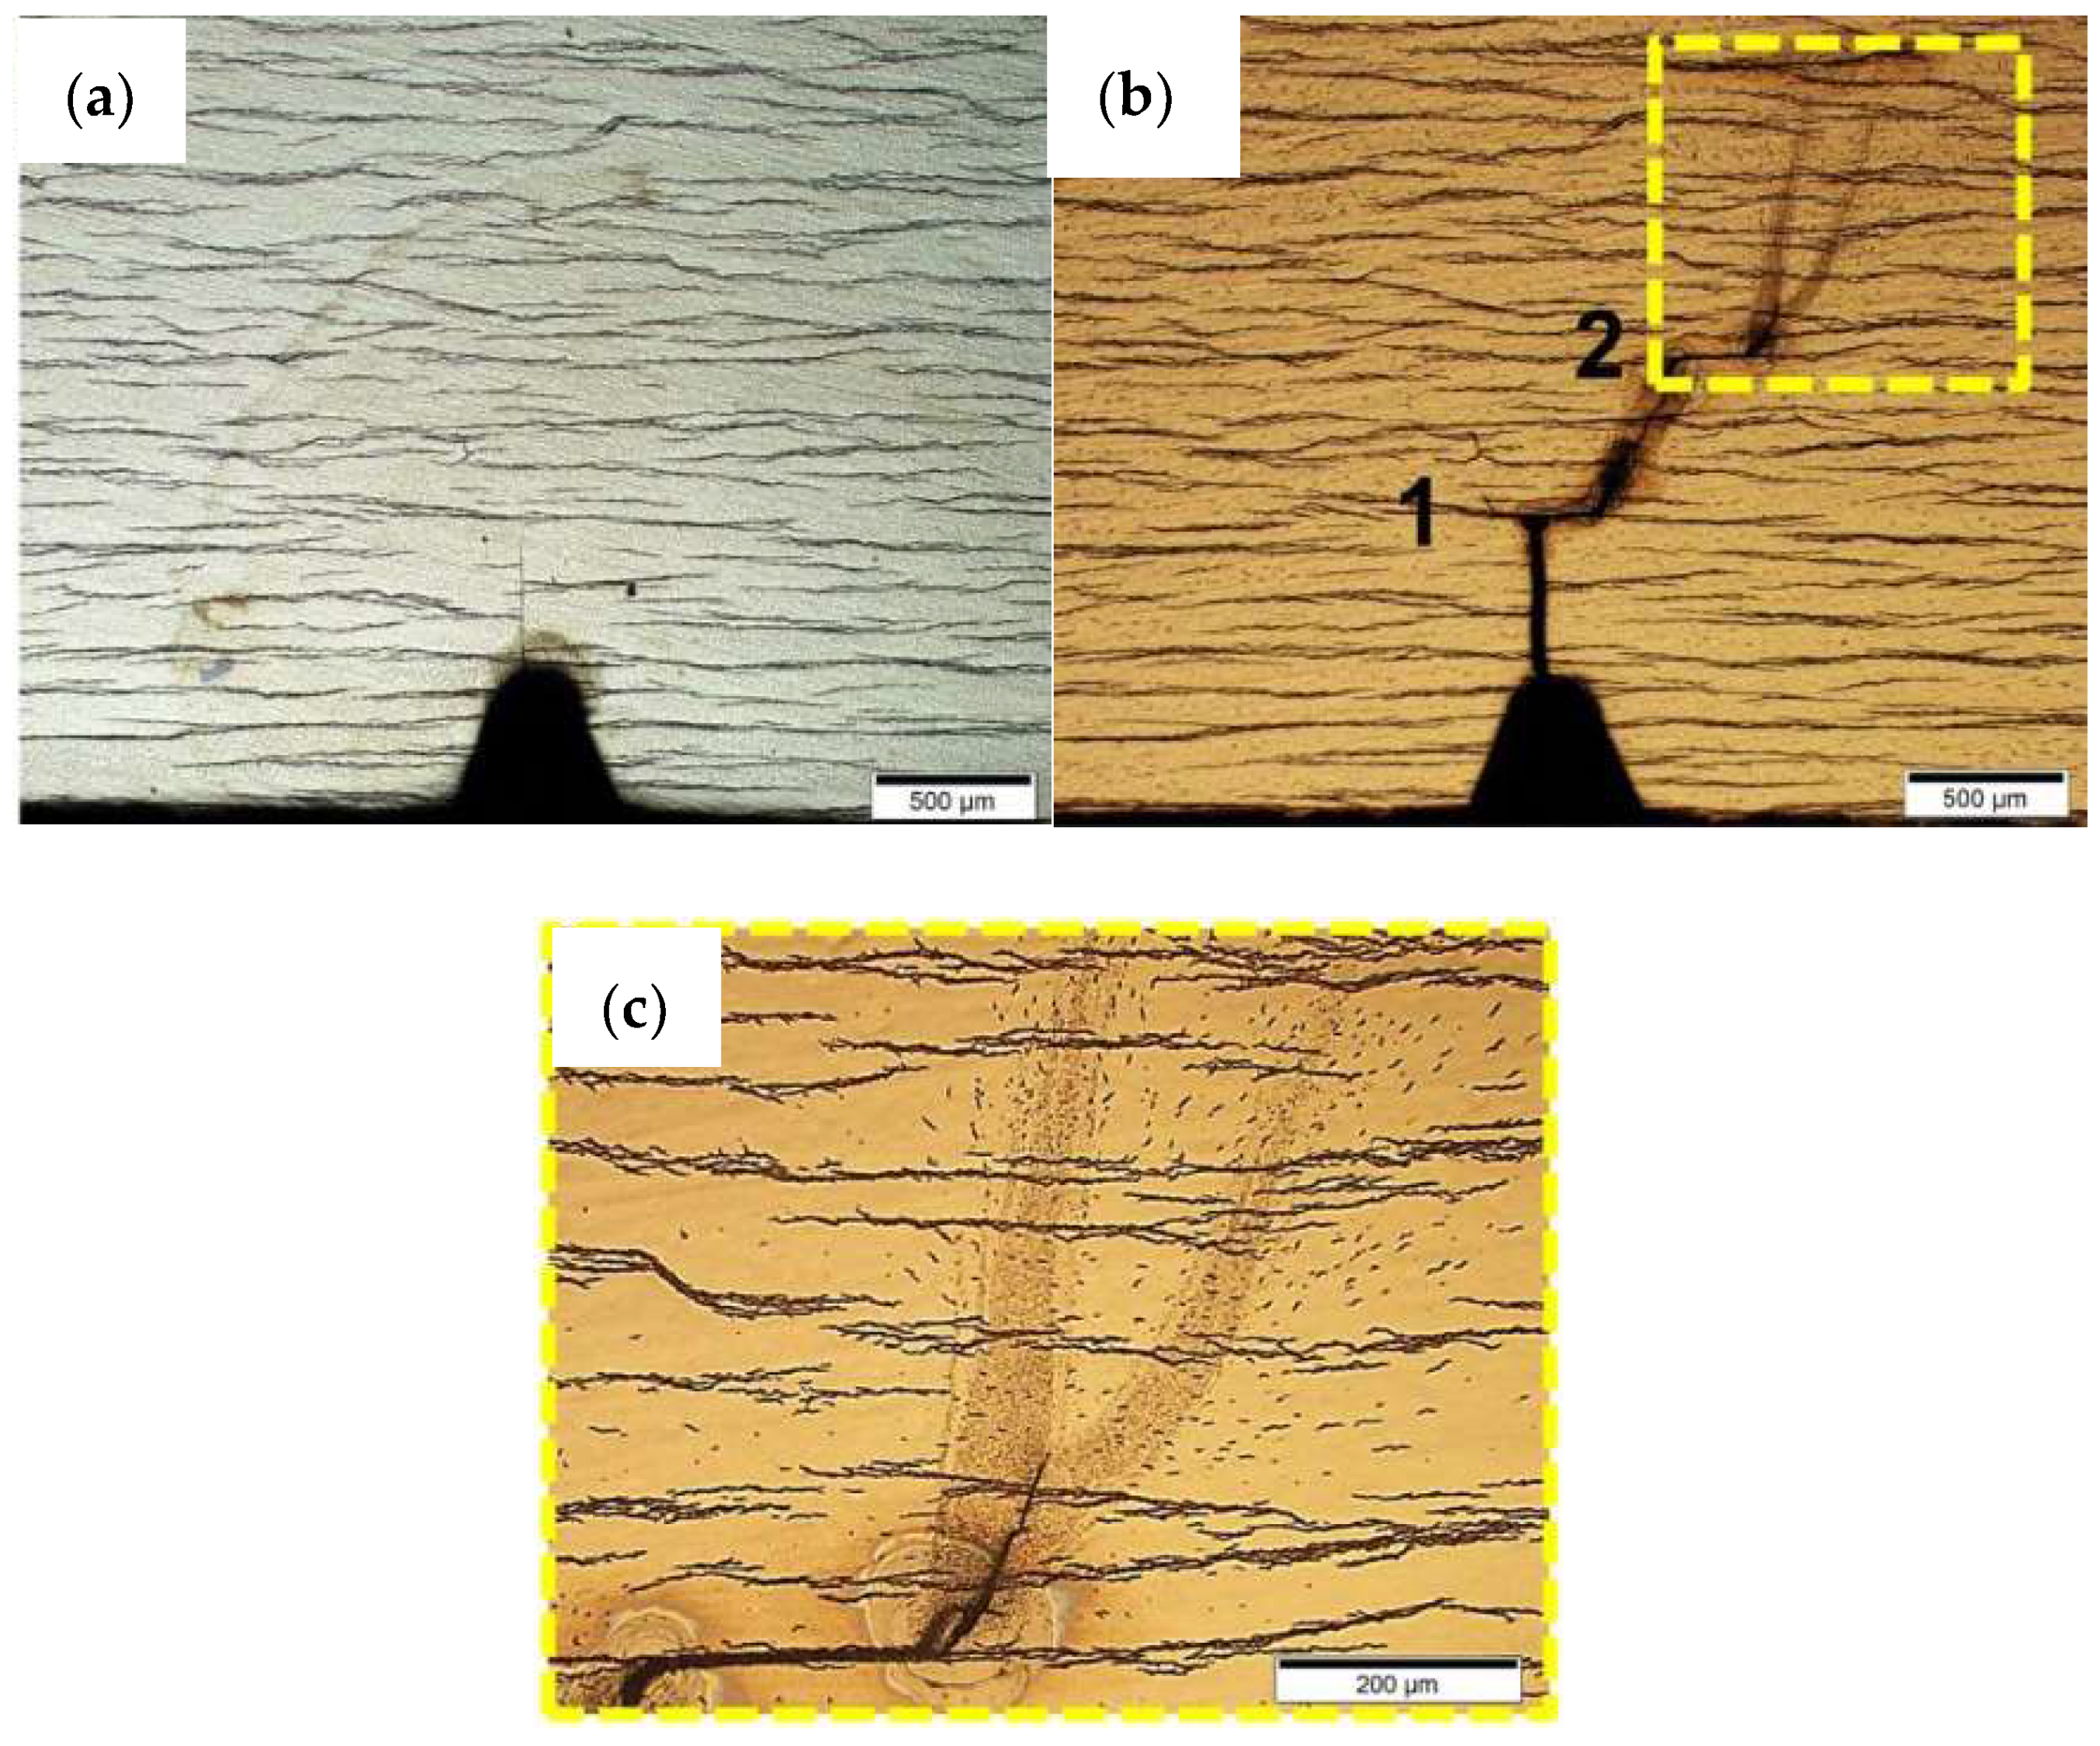
5.3. Hydrogen Diffusion in Zirconium Alloys
- -
- The fabrication history;
- -
- The material’s texture;
- -
- The stress state in the cladding tube connected to the higher hoop stress generated by the fission products of the pellets.
6. Conclusions
Author Contributions
Funding
Institutional Review Board Statement
Informed Consent Statement
Data Availability Statement
Conflicts of Interest
References
- Gröschel, F.; Schleuniger, P.; Hermann, A.; Lehmann, E. Neutron radiography of irradiated fuel rod segments at the SINQ: Loading, transfer and irradiation concept. Nucl. Instrum. Methods Phys. Res. Sect. A Accel. Spectrometers Detect. Assoc. Equip. 1999, 424, 215–220. [Google Scholar] [CrossRef]
- Yasuda, R.; Matsubayashi, M.; Nakata, M.; Harada, K. Application of neutron radiography for estimating concentration and distribution of hydrogen in Zircaloy cladding tubes. J. Nucl. Mater. 2002, 302, 156–164. [Google Scholar] [CrossRef]
- Lehmann, E.; Vontobel, P.; Hermann, A. Non-destructive analysis of nuclear fuel by means of thermal and cold neutrons. Nucl. Instrum. Methods Phys. Res. Sect. A Accel. Spectrometers Detect. Assoc. Equip. 2003, 515, 745–759. [Google Scholar] [CrossRef]
- Grosse, M.; Lehmann, E.; Vontobel, P.; Steinbrueck, M. Quantitative determination of absorbed hydrogen in oxidised zircaloy by means of neutron radiography. Nucl. Instrum. Methods Phys. Res. Sect. A Accel. Spectrometers Detect. Assoc. Equip. 2006, 566, 739–745. [Google Scholar] [CrossRef]
- Grosse, M.; van den Berg, M.; Goulet, C.; Lehmann, E.; Schillinger, B. In-situ neutron radiography investigations of hydrogen diffusion and absorption in zirconium alloys. Nucl. Instrum. Meth. Phys. Res. Sect. A Accel. Spectrometers Detect. Assoc. Equip. 2011, 651, 253–257. [Google Scholar] [CrossRef]
- Grünzweig, C.; Mannes, D.; Kaestner, A.; Schmid, F.; Vontobel, P.; Hovind, J.; Hartmann, S.; Peetermans, S.; Lehmann, E. Progress in industrial applications using modern neutron imaging techniques. Phys. Proc. 2013, 43, 231–242. [Google Scholar] [CrossRef]
- Wang, Z.; Garbe, U.; Li, H.; Harrison, R.P.; Kaestner, A.; Lehmann, E. Observations on the Zirconium Hydride Precipitation and Distribution in Zircaloy-4. Metall. Mater. Trans. B 2014, 45, 532–539. [Google Scholar] [CrossRef]
- Smith, T.; Bilheux, T.; Ray, H.; Bilheux, J.C.; Yan, Y. High Resolution Neutron Radiography and Tomography of Hydrided Zircaloy-4 Cladding Materials. Phys. Proc. 2015, 69, 478–482. [Google Scholar] [CrossRef]
- Tremsin, A.S.; Morgano, M.; Panzner, T.; Lehmann, E.; Filgers, U.; Vallerga, J.V.; McPhate, J.B.; Siegmund, O.H.W.; Feller, W.B. High resolution neutron imaging capabilities at BOA beamline at Paul Scherrer Institut. Nucl. Instrum. Methods Phys. Res. Sect. A Accel. Spectrometers Detect. Assoc. Equip. 2015, 784, 486–493. [Google Scholar] [CrossRef]
- Duarte, L.I.; Fagnoli, F.; Zubler, R.; Gong, W.; Trtik, P. Bertsch, Effect of the inner liner on the hydrogen distribution of zircaloy-2 nuclear fuel claddings. J. Nucl. Mater. 2021, 557, 153284. [Google Scholar] [CrossRef]
- Brachet, J.-C.; Hamon, D.; Le Saux, M.; Vandenberghe, V.; Toffolon-Masclet, C.; Rouesne, E.; Urvoy, S.; Béchade, J.-L.; Raepsaet, C.; Lacour, J.-L.; et al. Study of secondary hydriding at high temperature in zirconium based nuclear fuel cladding tubes by coupling information from neutron radiography/tomography, electron probe micro analysis, micro elastic recoil detection analysis and laser induced breakdown spectroscopy microprobe. J. Nucl. Mater. 2017, 488, 267–286. [Google Scholar] [CrossRef]
- Makowska, M.G.; Theil Kuhn, L.; Cleemann, N.; Lauridsen, E.M.; Bilheux, H.Z.; Molaison, J.J.; Santodonato, L.J.; Tremsin, A.S.; Grosse, M.; Morgano, M.; et al. Flexible sample environment for high resolution neutron imaging at high temperatures in controlled atmosphere. Rev. Sci. Instrum. 2015, 86, 125109. [Google Scholar] [CrossRef] [PubMed]
- Buitrago, N.L.; Santisteban, J.R.; Tartaglione, A.; Marin, J.; Barrow, L.; Daymond, M.R.; Schulz, M.; Grosse, M.; Tremsin, A.; Lehmann, E.; et al. Determination of very low concentrations of hydrogen in zirconium alloys by neutron imaging. J. Nucl. Mater. 2018, 503, 98–109. [Google Scholar] [CrossRef]
- Colldeweih, A.W.; Fagnoni, F.; Trtik, P.; Zubler, R.; Pouchon, M.A.; Bertsch, J. Delayed hydride cracking in Zircaloy-2 with and without liner at various temperatures investigated by high-resolution neutron radiography. J. Nucl. Mater. 2022, 561, 153549. [Google Scholar] [CrossRef]
- Soria, S.R.; Gomez, A.; Grosse, M.; Schulz, M.; Santisteban, J.R.; Vizcaino, P. Development of in-situ Delayed Hydride Cracking tests using neutron imaging to study the H redistribution in Zr-2.5%Nb. J. Phys. Conf. Ser. 2023, 2605, 012036. [Google Scholar] [CrossRef]
- Grosse, M.; Kardjilov, N. Which Resolution can be Achieved in Practice in Neutron Imaging Experiments?—A General View and Application on the Zr—ZrH2 and ZrO2—ZrN Systems. Phys. Procedia 2017, 88, 266–274. [Google Scholar] [CrossRef]
- Grosse, M.; Schillinger, B.; Trtik, P.; Kardjilov, N.; Steinbrueck, M. Investigation of the 3D hydrogen distribution in zirconium alloys by means of neutron tomography: Paper presented at the Symposium “Tomographic and Radiographic Imaging with Synchrotron X-rays and Neutrons” of the MSE 2018, 26–28 September 2018, Darmstadt, Germany. Int. J. Mater. Res. 2020, 111, 40–46. [Google Scholar]
- Bacon, G.E. Neutron Diffraction—Monographs on the Physics and Chemistry of Materials; Clarendon Press: Oxford, UK, 1953. [Google Scholar]
- Grünauer, F. Design, Optimization, and Implementation of the New Neutron Radiography Facility at FRM-II. Ph.D. Thesis, Faculty of Physics, Technischen Universität München, Munich, Germany, 2005. [Google Scholar]
- Schillinger, B. Design and Simulation of Neutron optical Devices Plus Flight Tube for Neutron Radiography. In Proceedings of the 7th World Conference on Neutron Radiography, Roma, Italy, 15–20 September 2002. [Google Scholar]
- Kak, A.C.; Slaney, M. Principles of Computerized Tomographic Imaging; IEEE Press: New York, NY, USA, 1988. [Google Scholar]
- Tengattini, N.; Lenoir, E.; Andò, B.; Giroud, D.; Atkins, J.; Beaucour, G. Viggiani, NeXT-Grenoble, the Neutron and X-ray tomograph in Grenoble. Nucl. Instrum. Methods Phys. Res. Sect. A Accel. Spectrometers Detect. Assoc. Equip. 2020, 968, 163939. [Google Scholar] [CrossRef]
- Schulz, M.; Schillinger, M. ANTARES: Cold neutron radiography and tomography facility. J. Large Scale Res. Facil. 2015, 1, A17. [Google Scholar] [CrossRef]
- Lehmann, E.; Vontobel, P.; Wiezel, L. Properties of the radiography facility NEUTRA at SINQ and its potential for us as European reference facility. Nondestruct. Test. Eval. 2001, 16, 191–202. [Google Scholar] [CrossRef]
- Kaestner, A.P.; Hartmann, S.; Kühne, G.; Frei, G.; Grünzweig, C.; Josic, L.; Schmid, F.; Lehmann, E.H. The ICON beamline—A facility for cold neutron imaging at SINQ. Nucl. Instrum. Methods Phys. Res. Sect. A Accel. Spectrometers Detect. Assoc. Equip. 2011, 659, 387–393. [Google Scholar] [CrossRef]
- Stuhr, U.; Grosse, M.; Wagner, W. The TOF-strain scanner POLDI with multiple frame overlap—Concept and performance. Mater. Sci. Eng. A 2006, 437, 134–138. [Google Scholar] [CrossRef]
- Trtik, P.; Lehmann, E.H. Progress in High-resolution Neutron Imaging at the Paul Scherrer Institut—The Neutron Microscope Project. J. Phys. Conf. Ser. 2016, 746, 012004. [Google Scholar] [CrossRef]
- Morgano, M.; Peetermans, S.; Lehmann, E.H.; Panzner, T.; Filges, U. Neutron imaging options at the BOA beamline at Paul Scherrer Institut. Nucl. Instrum. Methods Phys. Res. Sect. A Accel. Spectrometers Detect. Assoc. Equip. 2014, 754, 46–56. [Google Scholar] [CrossRef]
- Minniti, T.; Watanabe, K.; Burca, C.; Pooley, D.E.; Kockelmann, W. Characterization of the new neutron imaging and materials science facility IMAT. Nucl. Instrum. Methods Phys. Res. Sect. A Accel. Spectrometers Detect. Assoc. Equip. 2018, 888, 184–195. [Google Scholar] [CrossRef]
- Shinohara, T.; Kai, T.; Oikawa, K.; Nakatani, T.; Segawa, M.; Hiroi, K.; Su, Y.; Ooi, M.; Harada, M.; Iikura, H.; et al. The energy-resolved neutron imaging system. RADEN Rev. Sci. Instrum. 2020, 91, 043302. [Google Scholar] [CrossRef] [PubMed]
- Garbe, U.; Randall, T.; Hughes, C. The new neutron radiography/tomography/imaging station DINGO at OPAL. Nucl. Instrum. Methods Phys. Res. Sect. A Accel. Spectrometers Detect. Assoc. Equip. 2011, 651, 42–46. [Google Scholar] [CrossRef]
- Hussey, D.S.; Jacobson, D.L.; Arif, M.; Huffman, P.R.; Williams, R.E.; Cook, J.C. New neutron imaging facility at the NIST. Nucl. Instrum. Methods Phys. Res. Sect. A Accel. Spectrometers Detect. Assoc. Equip. 2005, 542, 9–15. [Google Scholar] [CrossRef]
- Tremsin, A.S.; Vogel, S.C.; Mocko, M.; Bourke, M.A.M.; Yuan, V.; Nelson, R.O.; Brown, D.W.; Feller, W.B. Energy resolved neutron radiography at LANSCE pulsed neutron facility. Neutron News 2013, 24, 28–32. [Google Scholar] [CrossRef]
- Santodonato, L.; Bilheux, H.; Bailey, B.; Bilheux, J.; Nguyen, P.; Tremsin, A.; Selby, D.; Walker, L. The CG-1D neutron imaging beamline at the Oak Ridge National Laboratory High Flux Isotope Reactor. Phys. Proc. 2015, 69, 104–108. [Google Scholar] [CrossRef]
- Bilheux, H.Z.; Bilheux, J.C.; Hanks, R.A.; Byrd, A.; Jones, A.; Skorpenske, H.; Donnelly, M.E.; Mangus, R.; Conner, D.; Lessard, T.L.; et al. The VENUS imaging beamline at the Spallation Neutron Source: Layout, expected performance and status of the construction project. J. Phys. Conf. Ser. 2023, 2605, 012004. [Google Scholar] [CrossRef]
- Stuckert, J.; Große, M.; Rössger, C.; Klimenkov, M.; Steinbrück, M.; Walter, M. QUENCH-LOCA program at KIT on secondary hydriding and results of the commissioning bundle test QUENCH-L0. Nucl. Eng. Des. 2013, 255, 185–201. [Google Scholar] [CrossRef]
- Kashkarov, E.; Sidelev, D.; Pushilina, N.; Yang, J.; Tang, C.; Steinbrueck, M. Influence of coating parameters on oxidation behavior of Cr-coated zirconium alloy for accident tolerant fuel claddings. Corros. Sci. 2022, 203, 11059. [Google Scholar] [CrossRef]
- Grosse, M.; Roessger, C.; Stuckert, J.; Steinbrueck, M.; Kaestner, A.; Kardjilov, N.; Schillinger, B. Neutron Imaging Investiga-tions of the Secondary Hydriding of Nuclear Fuel Cladding Alloys during Loss of Coolant Accidents. Phys. Procedia 2015, 2015, 436–444. [Google Scholar] [CrossRef]
- Kardjilov, N.; Manke, I.; Hilger, A.; Arlt, T.; Bradbury, R.; Markötter, H.; Woracek, R.; Strobl, M.; Treimer, W.; Banhart, J. The Neutron Imaging Instrument CONRAD—Post-Operational Review. J. Imaging 2021, 7, 11. [Google Scholar] [CrossRef] [PubMed]
- Chu, H.C.; Wu, S.K.; Kuo, R.C. Hydride reorientation in Zircaloy-4 cladding. J. Nucl. Mater. 2008, 373, 319–327. [Google Scholar] [CrossRef]
- Kim, J.-S.; Kim, Y.-J.; Kook, D.-H.; Kim, Y.-S. A study on hydride reorientation of Zircaloy-4 cladding tube under stress. J. Nucl. Mater. 2015, 456, 246–252. [Google Scholar] [CrossRef]
- Lee, Y.; Woo, D.; Jo, C.; Lee, C.; Low, W.C.; Son, D. Structural integrity of hydrided Zircaloy and its implications for safety extended dry storage. In Proceedings of the QUENCH Workshop, Karlsruhe, Germany, 5–7 December 2023. [Google Scholar] [CrossRef]
- Zhang, Y.; Jiang, C.; Bai, X. Anisotropic hydrogen diffusion in α-Zr and Zircaloy predicted by accelerated kinetic Monte Carlo simulations. Nat. Sci. Rep. 2017, 7, 41033. [Google Scholar] [CrossRef] [PubMed]
- Beyer, K.; Kannengiesser, T.; Griesche, A.; Schillinger, B. Neutron radiography study of hydrogen desorption in technical iron. J. Mater. Sci. 2011, 46, 5171. [Google Scholar] [CrossRef]
- Beyer, K.; Kannengiesser, T.; Griesche, A.; Schillinger, B. Study of hydrogen effusion in austenitic stainless steel by time-resolved in-situ measurements using neutron radiography. Nucl. Instrum. Methods Phys. Res. Sect. A Accel. Spectrometers Detect. Assoc. Equip. 2011, 651, 211–215. [Google Scholar] [CrossRef]
- Grosse, M.; Schillinger, B.; Kaestner, A. In Situ Neutron Radiography Investigations of Hydrogen Related Processes in Zirconium Alloys. Appl. Sci. 2021, 11, 5775. [Google Scholar] [CrossRef]


| Element | σa (10−24 m2) | σc (10−24 m2) | σi (10−24 m2) | σtotal (10−24 m2) |
|---|---|---|---|---|
| H | 0.333 | 1.757 | 80.26 | 82.02 |
| O | 0.00019 | 4.232 | 0.0008 | 4.233 |
| Zr | 0.185 | 6.44 | 0.02 | 6.645 |
| Beamline | Place | Flux (n/cm2/s) | L/D |
|---|---|---|---|
| NEXT | Grenoble, FR | 3 × 10⁸ | 333 |
| ANTARES | Garching, DE | 6.4 × 10⁷ | 500 |
| NEUTRA | Villigen, CH | 6 × 10⁶ | 350 |
| ICON | Villigen, CH | 1.5 × 10⁷ | 343 |
| BOA | Villigen, CH | 2.7 × 10⁷ | 400 |
| IMAT | Oxfordshire, UK | 1.4 × 10⁷ | 500 |
Disclaimer/Publisher’s Note: The statements, opinions and data contained in all publications are solely those of the individual author(s) and contributor(s) and not of MDPI and/or the editor(s). MDPI and/or the editor(s) disclaim responsibility for any injury to people or property resulting from any ideas, methods, instructions or products referred to in the content. |
© 2024 by the authors. Licensee MDPI, Basel, Switzerland. This article is an open access article distributed under the terms and conditions of the Creative Commons Attribution (CC BY) license (https://creativecommons.org/licenses/by/4.0/).
Share and Cite
Weick, S.; Grosse, M. Investigating Hydrogen in Zirconium Alloys by Means of Neutron Imaging. Materials 2024, 17, 781. https://doi.org/10.3390/ma17040781
Weick S, Grosse M. Investigating Hydrogen in Zirconium Alloys by Means of Neutron Imaging. Materials. 2024; 17(4):781. https://doi.org/10.3390/ma17040781
Chicago/Turabian StyleWeick, Sarah, and Mirco Grosse. 2024. "Investigating Hydrogen in Zirconium Alloys by Means of Neutron Imaging" Materials 17, no. 4: 781. https://doi.org/10.3390/ma17040781
APA StyleWeick, S., & Grosse, M. (2024). Investigating Hydrogen in Zirconium Alloys by Means of Neutron Imaging. Materials, 17(4), 781. https://doi.org/10.3390/ma17040781