Abstract
The fight against climate change has delineated new objectives, among which one of the most crucial is the replacement of high-energy-intensity materials in the construction sector with more sustainable and thermally efficient alternatives to reduce indirect emissions. Consequently, the thermal properties of materials assume fundamental importance. In this regard, the large-scale use of earth represents a promising option, not only due to its widespread availability but especially for its minimal embodied energy. However, to enhance its durability, it is necessary to stabilize the mixtures of raw materials. This study analyzes experimental systems based on earth stabilized with bio-based polymers to evaluate their thermal properties and how these vary depending on the selected mix-design. The experimental measurements showed thermal properties comparable to conventional materials. As expected, thermal conductivity increases when porosity decreases. The minimum value is equal to 0.216 W/m·K vs. a porosity of 43.5%, while the maximum is 0.507 W/m·K vs. a porosity of 33.2%. However, the data obtained for individual systems may vary depending on the topological characteristics, which were analyzed through a model for granular materials. The modeling suggests correlations between microstructures and thermal behaviour, which can be useful to develop tools for the mix-design procedure.
1. Introduction
Since 2015, the goals of the 2030 agenda have permeated everyday life, calling on each of us to play our part in countering catastrophic climate change in favour of sustainable development. The entire world is called upon to be accountable for this change and, in this regard, the construction sector must take a leading role due to its high CO2 emissions and energy consumption.
From 2015 to 2021, direct emissions from construction operations increased by an average of nearly 1% annually [1]. In 2022, there was a change in trend with a decrease in them. However, for the same year (2022), indirect emissions from the production of electricity and heat used in buildings increased by about 1.4%. Consequently, direct CO2 emissions from buildings decreased to 3 Gt in 2022, while indirect CO2 emissions increased to nearly 6.8 Gt [1].
This is directly due to modern lifestyles and the indoor environmental comfort required.
In addition, it should be considered that the materials used in building construction (concrete, steel, aluminium, glass, and brick) contribute to approximately 9% of the total energy-related CO2 emissions [2,3]. It is estimated that the use of raw materials will double by 2060. Therefore, it is evident that the efforts made so far are not sufficient to achieve decarbonization by 2050 [1].
Among building materials, the most impactful is Portland cement, which is responsible for about 7% of the world’s and 4% of the EU’s CO2 emissions [4].
In particular, during its production, the calcination process plays a key role in terms of environmental pollution by generating approximately 50–60% of CO2 during the thermal decomposition reaction of limestone [5,6]. Additionally, the combustion of fossil fuels for oven operation contributes to about 40% of carbon dioxide emissions [7], with an additional 10% of CO2 attributed to indirect emissions related to energy consumption during cement and raw material grinding.
According to the EU climate policy, the cement industry is required to reduce its CO2 emissions by about 30% by 2030, with the goal of achieving zero emissions by 2050 [8].
As EU plants are already operating at near-optimal efficiency, the industry seems to be directing its attention toward storage and utilization technologies for carbon capture. Meanwhile, breakthroughs in alternative materials are still being explored as part of efforts to further reduce emissions [4].
In this context, the transition to sustainable building practices is crucial. This path can be pursued both through the use of sustainable materials, ensuring low emissions during their production and service life, and through the use of thermally efficient materials, allowing for high indoor environmental comfort without necessarily resorting to large amounts of energy for heating and cooling.
Many efforts are being made to obtain sustainable binders, such as those based on sulfoaluminate cements or geopolymers [9,10,11,12].
Despite some of these materials being developed as early as the 1940s and 1950s, certain characteristics make their widespread adoption difficult. Currently, the literature on these materials is expanding significantly, but many aspects still require further investigation and improvement. In the case of sulfoaluminate cements, the disadvantages are represented by their overly short setting time [13], low PH values [14], expansion phenomena [15], and high cost [16]. On the other hand, for geopolymers, the drawbacks could be their large shrinkage, high brittleness [17], and mechanical properties, which decrease as a function of time [12,18]. Additionally, the limited familiarity among designers with these types of materials, and their often higher cost compared to Portland cement, restrict their use [11].
Reducing the use of these materials represents an important step forward towards greater sustainability in the construction sector. From this perspective, earth-based materials offer a viable alternative for various applications, such as residential architecture or internal finishing works (plasters) [19,20,21,22,23].
This material, used since ancient times, represents an energy-efficient resource with almost zero embodied energy—less than 0.5 MJ/kg (7.8 MJ/kg for Portland cement) [24,25,26,27,28]. This significant disparity underscores the potential of earthen construction to mitigate the overall environmental footprint of buildings.
Although earth-based systems cannot be considered as insulating materials, their thermal conductivity, which varies from 0.17 to 1.10 W/m·K (as a function of density and mineralogical composition), is similar to other materials commonly used in the construction field, like lime (about from 0.3 to 0.8 W/m·K), cement (about from 0.4 to 1.4 W/m·K), and ceramic bricks (about from 0.4 to 1.5 W/m·K) [29,30,31,32,33,34].
In addition, earthen construction demonstrates thermal efficiency and high thermal comfort standards, especially in climates that have significant temperature variations between day and night [35,36]. Thermal behaviour, due to the high thermal inertia, can also be exploited in cold environments by providing a mass wall within an insulating envelope so that it can store and retain heat within the building and release it slowly during colder hours [36,37,38,39,40]. This aspect could bring many benefits in trying to decrease indirect emissions from the construction sector.
Despite earth-based materials having reduced design flexibility and low mechanical strength (structure vulnerability, earthquakes), they are still compatible with residential architecture applications, especially when paired with other materials. However, an aspect not to be underestimated, from a Materials Science point of view, includes the high variability and heterogeneity of the material, as well as its pronounced sensitivity to water, which can modify its performance, thereby compromising its durability [41,42,43,44]. Moisture can severely impact the mechanical and thermal performance. Research indicates that the presence of moisture can lead to a reduction in compressive strength and an increase in thermal conductivity [45,46]. These factors can have adverse effects on the efficiency and durability of earthen buildings, potentially compromising their sustainability benefits. To address this, researchers have consistently sought to enhance the material’s performance through stabilization methods.
Since ancient times, in many countries around the world, there has been a tendency to use stabilizers of animal and plant origin, dictated by local availability and building traditions [47,48,49,50,51,52]. Today, this stabilization is often obtained by using lime, cements, bitumen, and synthetic polymers [21,48,53,54,55,56,57,58]; however, this tends to undermine the improvements in sustainability offered by earthen materials.
For example, the addition of Portland cement enhances mechanical performance. However, the Global Warming Potential (GWP) associated with unstabilized earth is approximately 23 g. In contrast, for the same quantity of earth stabilized with 5–10% of Portland cement, the GWP reaches about 64–106 g, respectively (for comparison, regular concrete has a GPW of about 130 g) [48].
Regarding synthetic polymers, research has largely stemmed from soil stabilization in the fields of civil engineering and geotechnics. However, as is often the case in earthen construction, this knowledge has also been applied to the realm of earth construction. Due to factors such as cost, chain length, and the possibility of the process not reinitiating once completed, preference has mostly been given to resins obtained through polycondensation. Various types include resorcinol–formaldehyde resins, phenolic resins, furan resins, polyacrylates, and polyurethanes [56,57,58,59,60]. Nevertheless, urea–formaldehyde resins have been the most commonly utilized due to their lower cost [58,59]. One of the drawbacks of this stabilization method is the gradual development of brittleness in the material over time, attributed to resin aging, the recognized toxicity of these compounds, and their fossil-based nature [58,60,61].
Therefore, the necessity for an environmentally friendly, sustainable, and effective approach to enhance earth properties remains a continual challenge for researchers and manufacturers. The utilization of biopolymers can offer an effective solution to improve earth materials’ properties and durability. Indeed, this material class offers a solid basis for conducting further research and fostering the practical application of such materials [62,63,64,65,66].
It is possible to distinguish two macro-categories within the class of biopolymers. These can be natural polymers, occurring naturally, or bio-based polymers, synthesized artificially from renewable natural resources [67].
The incorporation of natural polymers for stabilizing earth has long been a practice embedded in construction traditions. The extensive research conducted over the past two decades has consistently demonstrated the capacity of these materials to enhance the mechanical properties, permeability, and water resistance of earth [66,68,69,70,71,72,73,74].
However, their durability over time could be affected not only by environmental agents but also by their biological vulnerability due to their biodegradable nature (e.g., durability concerning parasite attack and the growth of molds and fungi) [70,75,76]. Additionally, the extreme variety of methodologies used in the production of natural polymers, the variability in testing procedures, and the limited availability of some of them still make it difficult to systematically characterize them to provide stable, standardized, and readily available products for the construction sector [70].
A compromise between synthetic polymers and natural polymers is represented by bio-based polymers. This particular class of biopolymers is synthesized from renewable resources and, in the construction materials sector, they find particular applications in paints and coatings, serving as binders and film-formers [77,78,79,80,81,82,83,84]. However, they have been underexplored in terms of enhancing the performance of earthen materials.
The combination of granular materials constituting the earth and stabilizers represents a delicate step. The resulting properties of the final product, especially the thermal conductivity, are influenced by quantitative and phenomenological factors. In this context, various modeling procedures exist in the literature to enhance our understanding of the thermal behaviour of the resulting materials [85,86,87,88].
However, it is crucial to assess the reliability of these models for the specific material at hand. In this sense, fractal geometry offers some versatile alternatives that seem particularly suitable for replicating the structures of the materials studied in this work [89,90].
2. Materials and Methods
The materials used for experimentation were clay (CY) and sand (SD). The CY came from a quarry in Lozzolo, Vercelli (Italy). The SD, on the other hand, came from the Abbazia di Fossanova quarry, Latina (Italy). The two materials were characterized mineralogically, by using a Rigaku® MiniFlex II diffractometer, and granumetrically by wet granulometry according to UNI EN ISO 17892–4:2017 [91].
The two bio-based polymers used in the study were identified as S-BAR and D-UAR. S-BAR is a short oil alkyd emulsion with a bio-based index >95% [77,84] and D-UAR is a urethane–alkyd dispersion with a bio-based index >43% [80]. Some properties of the two bio-based polymers are shown in Table 1.

Table 1.
S-BAR and D-UAR bio-based polymer properties.
CY and SD were dry-mixed in a weight percentage composition of 36% and 64%. The proportion used was chosen based on preliminary tests (Appendix A). After the completion of the dry mixing of CY and SD, the slurries were prepared.
Samples were created using the dry mixture of SD and CY, organized into three groups and six sample types. Group 1 involved mixing CY and SD with distilled water, added at 30% (R-30) and 40% (R-40) by weight. Groups 2 and 3, on the other hand, were made using S-BAR and D-UAR in the mixture. The amounts of S-BAR and D-UAR were determined through preliminary tests to assess the consistency of the material (Appendix A). The S series (group 2) was formulated with 5% by weight of S-BAR, and the D series (group 3) with 20% by weight of D-UAR. For both groups, the water content required to obtain a liquid phase (bio-based polymer and water) of 30% and 40% was then added.
The mixtures were placed in molds with dimensions of 105 × 105 × 20 mm. A total of 9 samples were prepared for every mix-design. After 4 days, the molds were removed and the samples were dried under laboratory conditions (23 °C ± 2 °C) for 4 weeks.
Porosimetric measurements, for obtaining open porosity values, were conducted on samples of approximately 1.5 cm2 using a Micromeritics® Autopore IV 9500 Porosimeter with Mercury Intrusion Porosimetry (MIP), operating up to 2200 bars with an equilibration time of 10 s. The measurement was repeated three times on each sample.
Thermal conductivity tests were performed according to ISO 8301 [92] using TAURUS TCA 300 equipment and elaborated using software Lambda basic v.1.13.14.0 version.
For each sample, the test was repeated three times by changing the temperature of the cold plate (−5, 0, +5 °C) and the hot plate (15, 20, 25 °C), but keeping the temperature difference between the plates constant (20 °C). The force of the hydraulic piston pushing the hot plate onto the upper face of the sample was equal to 272 N.
3. Traditional and Fractal Modeling Approach
The models used in this study represent a reference point in the specialized literature for calculating thermal conductivity (k) and effective thermal conductivity (keff; keff = k/ks) in porous materials. These models utilize values of relative density () or pore fraction (ε) along with the conductivity of the solid and the fluid phases (ks and kf, respectively). In particular, the considered models are as follows:
- Parallel and series models [85].
- Hashin and Shtrikman bounds—Maxwell–Eucken (ME: ME1, ME2) [86].
- The Effective Medium Theory (EMT) equation, reported in Carson et al. [87].
In addition to these, a model based on fractal geometry, proposed by Ma et al., was selected for studying thermal conductivity in granular porous materials [89,93]. Starting from the assumption that porous materials exhibit fractal characteristics and recursive structures [90], the analytical procedure proposed by Ma et al. utilizes the Sierpinski carpet and its different compositions, such as the geometrical base unit and the scheme for the thermo-electrical analogy technique (Figure 1) [88,89].
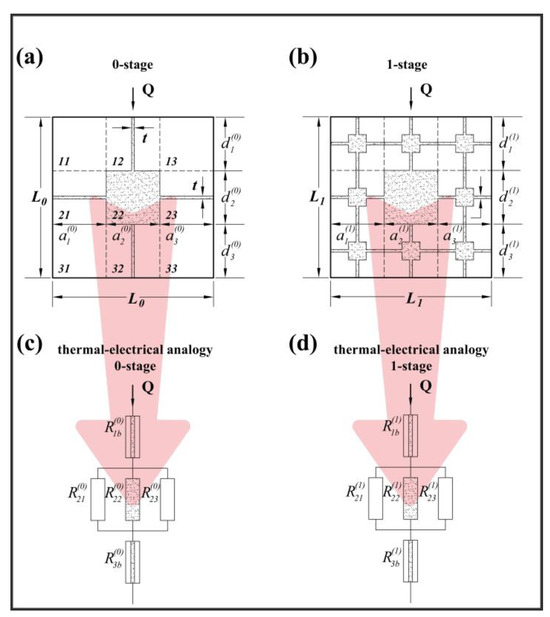
Figure 1.
Fractal model scheme and equivalent thermal–electrical pattern for predicting k. (a) thermal conductivity model for 0-stage and (b) for 1-stage; (c) thermal-electrical analogy for a 0-stage and (d) 1-stage. As reported in Ma et al. and Cappai et al. [88,89], Q is the heat flow rate; L is the length scale, or side length of the Sierpinski carpet; a and d are sub-square lengths; t is the barrier thickness; and R is the resistance into the thermal electrical analogy pattern.
The material’s structure is constituted by two distinct parts: the first is composed of non-touching dispersed particles distributed in random way, while the second is marked by a series of touching particles which are arranged symmetrically and are characterized by thermal resistance.
Analytical expressions for this model are represented by the following:
where k+(n)e,sc is the dimensionless effective thermal conductivity for an n-stage carpet; t+ is dimensionless width of barrier, defined by t+ = t/Ls (Figure 1); ke+ is the dimensionless effective thermal conductivity; A is the total area of representative cross section and Ant is the equivalent area of a cross section with the same porosity as the non-touching particles (m2); and β is the ratio of the thermal conductivity of the solid and thermal conductivity of the matrix. In this study, the value of t is fixed to 0.001, as in reference [89].
All terms considered in the analytical formula have a physical meaning. Indeed, the thermal conductivity is expressed as a function of the ε, the Ant/A, the ratio between the thermal conductivity of the solid phase, and the thermal conductivity of the matrix [89].
4. Results and Discussion
The mineralogical composition of CY, obtained by XRD, consists of 42% minerals belonging to the illitic–kaolinitic group, 38% quartz, 6% potassium feldspar, and 5% sodium feldspar. SD, on the other hand, is composed of 94% quartz.
According to the Wentworth class [94] and the granulometric analysis, the mixture made from CY + SD consists of 65.7% sand (divided in coarse, 0.023%; medium, 2.45%; fine, 52.39%; and very fine, 10.82%) and 34.3% silt and clay.
The values of the average density and average porosity of samples are presented in Table 2. Systems stabilized with bio-based polymers have similar values of density with respect to the as-received samples. Mercury intrusion tests exhibit a large open porosity, which is between 33.4% (D-30) and 43.1% (R-40). The variations are related to the mix design; in particular, when the quantity of the water decreases, the porosity is lower, and when the quantity of the bio-based polymers increases, the porosity decreases.
Table 2.
The average density, the average porosity, and the average thermal conductivity of the systems and relative standard deviations.
Thermal conductivity (kexp) values were measured for the considered specimens (Table 2). This property is influenced by different aspects related to the characteristics of materials, such as the thermal conductivity of solid phases, the porosity, and the consequent thermal conductivity of liquid or gas content, as well as the phenomenological and topological features of their structures (particle shapes, system tortuosity, etc.), mix-design (granulometry, water, and bio-based polymer quantities), and/or fabrication methods (sample compaction, materials application, drying conditions, temperature variations, etc.).
As expected, for the same system, the thermal conductivity increases when the porosity decreases (Figure 2). This is more evident for series R and S than series D. Indeed, the minimum value of kexp recorded for R is equal to 0.216 W/m·K vs. a porosity of 43.5%, while the maximum of kexp is 0.311 W/m·K vs. a porosity of 38.5%; in the same way, for S, the minimum is 0.248 W/m·K vs. a porosity of 42.5%, while the maximum of kexp is 0.507 W/m·K vs. a porosity of 33.2%; and, for D, the minimum is 0.290 W/m·K vs. a porosity of 37.5%, while the maximum of kexp is 0.386 W/m·K vs. a porosity of 31.6%.
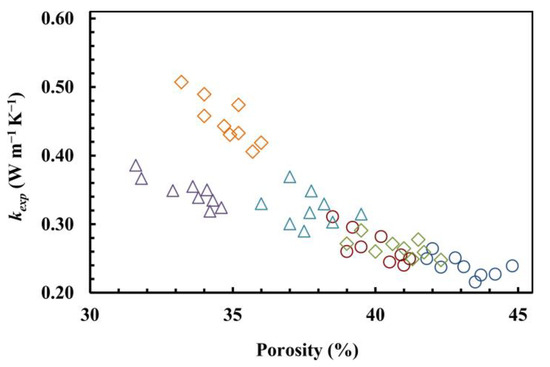
Figure 2.
The thermal conductivity (kexp) as a function of porosity for R-30 (○), R-40 (○), S-30 (◊), S-40 (◊), D-30 (△), and D-40 (△) systems.
In order to better understand the thermal behaviour of the studied materials, traditional models and their relative analytical formulas (Equations (1)–(5)) were applied. The results are reported in Figure 3, in which keff (keff = kmod/ks; keff = kexp/ks) is expressed as a function of porosity percentage. ks is obtained as a weighted arithmetic mean by considering the thermal conductivity of the different materials that comprise the mix-design: 6.35 W/m·K, 6.21 W/m·K, and 5.86 W/m·K for R, S, and D, respectively. In parallel, the ME2 and EMT models predict values far from the experimental data. Although series and, in particular, ME1 models seem to be capable of replicating the experimental trends, the enlargements in Figure 3 show remarkable differences, especially for series S. This is probably due to the fact that these models are proposed for materials which have different structures and features.
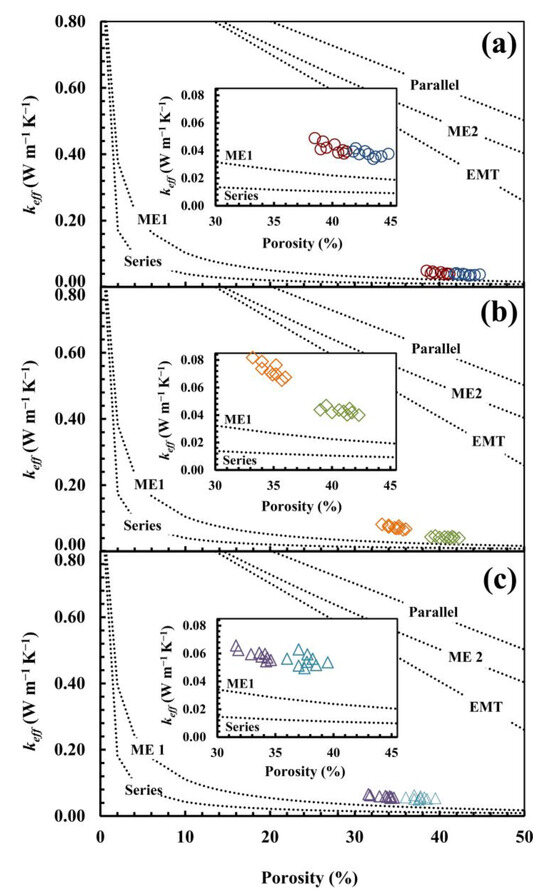
Figure 3.
Comparison between experimental effective thermal conductivity (keff = kexp/ks)—R-30 (○), R-40 (○), S-30 (◊), S-40 (◊), D-30 (△), and D-40 (△)—and model predictions (keff = kmod/ks) using Parallel Equation (1), Series Equation (2), Maxwell–Eucken Equations (3) and (4), and EMT Equation (5). The calculation was performed for three different values of ks: 6.35 (a), 6.21 (b), and 5.86 W/m·K (c). ks was determined as a weighted arithmetic mean by considering the mineralogical composition thermal conductivity.
For these reasons, a fractal model was proposed by Ma et al. (Equations (6) and (7)), which is formalized for granular materials such as those studied in this work. A parametric elaboration is reported in Figure 4, which was constructed considering ks = 6.35 W/m·K. By varying the Ant/A values, it is possible to obtain different curves, which highlights the great versatility of this model and its capabilities in giving relevant information on the material structure. Indeed, for the same porosity, the thermal conductivity has different values if referred to diverse Ant/A values. When the Ant/A decreases, the thermal conductivity increases. This trend is due to the topological organization of the structure. When the Ant/A decreases, the contact points between particles increases and the thermal resistance decreases. This could be related to the pore size distribution, in which, for the same porosity, a higher presence of smaller pores increases the non-touching area and consequently decreases the thermal conductivity [89].
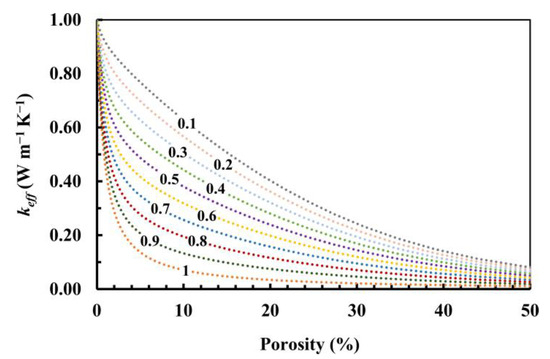
Figure 4.
Parametric calculations of effective thermal conductivity vs. porosity considering ks = 6.35 W/m·K and varying Ant/A from 0.1 to 1.
Figure 5a–c shows the calculations carried out by using the Ma et al. model in order to fit the experimental data of R (ks = 6.35 W/m · K), S (ks = 6.21 W/m·K), and D (ks = 5.86 W/m·K), respectively.
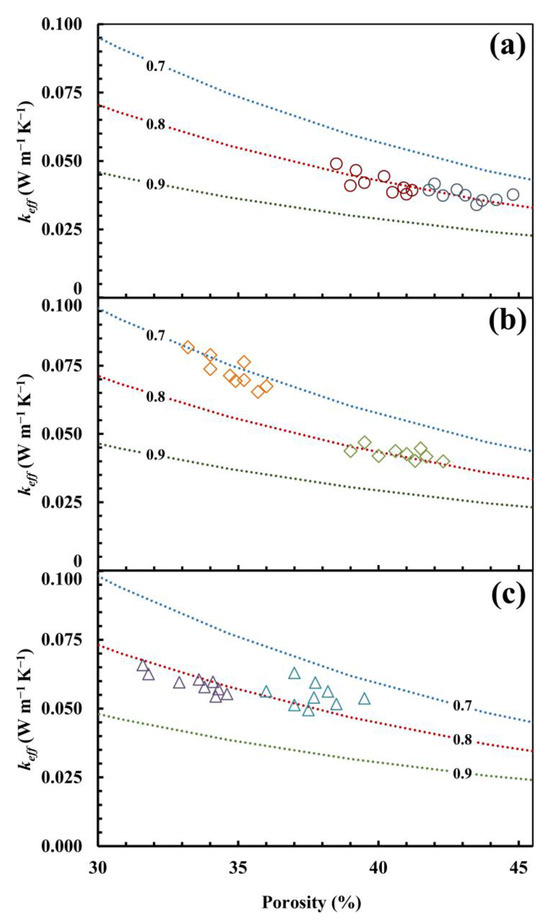
Figure 5.
Comparison between experimental effective thermal conductivity (keff = kexp/ks)—R-30 (○), R-40 (○), S-30 (◊), S-40 (◊), D-30 (△), D-40 (△)—and model predictions (keff = kmod/ks) using Ma et al. The calculation was performed for three different values of ks 6.35 (a), 6.21 (b), and 5.86 W/m·K (c) and for the three different values of Ant/A reported in each panel: 0.7; 0.8; and 0.9. ks is determined as a weighted arithmetic mean by considering the mineralogical composition thermal conductivity.
It can clearly be noted that this model is able to fit the experimental data. For series R (R30, R40) and D (D30, D40), the best fit is obtained by using Ant/A = 0.8. However, the porosity range is quite different between the two systems. The presence of a large quantity of bio-based polymer influences the morphology of structure and generates a less porous system (D). Series S presents a difference between the average porosity of S30 and S40, respectively, equal to 35% and 41%. The relevant consideration in comparing S30 to S40 is an increase in the thermal conductivity values (S30 has a greater thermal conductivity than S40), which can be reproduced by using a different Ant/A (S30: Ant/A = 0.7 and S40: Ant/A = 0.8). This is due to the different quantity of water (water content: S30 25%, S40 35%) which, during the drying process, allows the particles to move closer, creating touching points. This condition is more conductive than the one that occurs in system D (particularly when comparing D30 to S30, systems with similar porosity), in which the greater quantity of bio-based polymer (20%) can reduce Ant/A.
Overall, the good agreement between the experimental data and modeling calculations indicates that the analytical model considered in this work is capable of suitably accounting for the thermal behaviour of earth-based materials, thus confirming the importance of considering the microstructure morphology of specimens, which can play a crucial role in heat conduction.
5. Conclusions
In this work, earth-based materials were characterized to assess their thermal behaviour in comparison to non-stabilized systems (as-received). Six different mix-designs were prepared: R30, R40 (with water contents of 30% and 40%, respectively), S30, S40 (containing a bio-based short oil alkyd emulsion at 5% and water contents of 25% and 35%, respectively), D30, and D40 (incorporating a bio-based urethane–alkyd dispersion at 20% and water contents of 10% and 20%, respectively).
The experimental measurements determined the mineralogical and granulometric composition of the raw materials constituting the earth used, as well as the density, porosity, and thermal conductivity of the fabricated systems after the mixing and drying phases.
As expected, an inverse relationship between the porosity and thermal conductivity was found. This phenomenon is more pronounced in the R and S series than in the D series, highlighting the influence of porosity on thermal transfer within these materials.
The general thermal behaviour was also investigated using traditional thermal models (series, parallel, Hashin and Shtrikman bounds, and EMT) and the subsequent fractal model by Ma et al. While traditional models appear incapable of reproducing the experimental data, the fractal model, elaborated for granular materials, shows remarkable versatility. Indeed, the model’s predictions closely align with the experimental data, allowing for the interpretation of results as a function of the microstructure. This approach poses a challenge for the construction of tools capable of suggesting mix-design solutions that lead to the preparation of samples with specific thermal behaviour. Moreover, further refinement could aid in understanding the relationships between the topology and morphology of microstructures and their macroscopic properties.
Author Contributions
Conceptualization, G.P., L.P. and M.C.; methodology, G.P., M.C., R.R., D.L., G.M. and R.S.; validation, G.P., L.P. and M.C.; formal analysis, G.P., L.P. and M.C.; investigation, M.C., R.R., D.L., G.M. and R.S.; resources, G.P. and L.P.; data curation, G.P. and M.C.; writing—original draft preparation, G.P. and M.C.; writing—review and editing, G.P., L.P. and M.C.; visualization, R.R., D.L., G.M. and R.S.; supervision, G.P. and L.P.; project administration, G.P.; funding acquisition, G.P. and L.P. All authors have read and agreed to the published version of the manuscript.
Funding
This research was funded by GreenPlaster4Earth. FSE/REACT-EU, MUR, PON.
Institutional Review Board Statement
Not applicable.
Informed Consent Statement
Not applicable.
Data Availability Statement
Data are contained within the article.
Acknowledgments
We gratefully acknowledge the University of Cagliari and Matteo Brioni s.r.l.
Conflicts of Interest
The authors declare no conflicts of interest.
Appendix A
The preliminary tests were designed to select mix-designs. Specifically, we sought the homogeneity of the sample in terms of surface uniformity, thus in the absence of cracking phenomena at the end of the drying process conducted in laboratory conditions. The studied mixes consist of CY and SD variables with a constant amount of distilled water for each series, set at 30% and 40%. The variation in the amount of water used relates to the minimum quantity necessary for the mixture to reach a consistency suitable for manual placement in the mold and the minimum amount of liquid phase usable for the mixture to be poured into the mold.
In particular, samples were made with the following quantities: 52% CY, 48% SD; 48% CY, 52% SD; 44% CY, 56% SD; 40% CY, 60% SD; and 36% CY, 64% SD. Only the last mixture showed no cracking and was therefore chosen as the starting mix-design for creating the samples.
The liquid phase in the mix-design was also kept constant (30 and 40%, respectively) as a result of introducing bio-sourced polymer to stabilize the material. The quantity of polymer was also chosen by seeking the sample’s homogeneity in terms of surface uniformity, thus in the absence of cracking phenomena following drying in laboratory conditions. S-BAR was tested at 3%, 5%, and 7%; D-UAR was tested at 3%, 5%, 7%, 15%, 20%, and 25%. From the visual analysis of the surfaces, it was determined that quantities above 5% of S-BAR and 20% of D-UAR caused surface cracking.
References
- United Nations Environment Programme. 2022 Global Status for Buildings an Construction; United Nations Environment Programme: Nairobi, Kenya, 2022; ISBN 978-92-807-3984-8. [Google Scholar]
- Chen, T.Y.; Burnett, J.; Chau, C.K. Analysis of Embodied Energy Use in the Residential Building of Hong Kong. Energy 2001, 26, 323–340. [Google Scholar] [CrossRef]
- Dimoudi, A.; Tompa, C. Energy and Environmental Indicators Related to Construction of Office Buildings. Resour. Conserv. Recycl. 2008, 53, 86–95. [Google Scholar] [CrossRef]
- Marmier, A. Decarbonisation Options for the Cement Industry; IGEM: Derby, UK, 2023; ISBN 978-92-76-61599-6. Available online: https://www.h2knowledgecentre.com/content/researchpaper4629 (accessed on 12 February 2024).
- Mokhtar, A.; Nasooti, M. A Decision Support Tool for Cement Industry to Select Energy Efficiency Measures. Energy Strateg. Rev. 2020, 28, 100458. [Google Scholar] [CrossRef]
- Wojtacha-Rychter, K.; Kucharski, P.; Smolinski, A. Conventional and Alternative Sources of Thermal Energy in the Production of Cement—An Impact on CO2 Emission. Energies 2021, 14, 1539. [Google Scholar] [CrossRef]
- Habert, G. Assessing the Environmental Impact of Conventional and ‘Green’ Cement Production. In Eco-Efficient Construction and Building Materials; Pacheco-Torgal, F., Cabeza, L.F., Labrincha, J., De Magalhães, A., Eds.; Elsevier: Amsterdam, The Netherlands, 2014; pp. 199–238. ISBN 978-0-85709-767-5. [Google Scholar]
- CEMBUREAU. Cementing the European Green Deal: Reaching Climate Neutrality along the Cement and Concrete Value Chain by 2050; The European Cement Association: Brussels, Belgium, 2020; pp. 1–38. Available online: https://cembureau.eu/media/kuxd32gi/cembureau-2050-roadmap_final-version_web.pdf (accessed on 12 February 2024).
- Coppola, L.; Bellezze, T.; Belli, A.; Bignozzi, M.C.; Bolzoni, F.; Brenna, A.; Cabrini, M.; Candamano, S.; Cappai, M.; Caputo, D.; et al. Binders Alternative to Portland Cement and Waste Management for Sustainable Construction—Part 2. J. Appl. Biomater. Funct. Mater. 2018, 16, 207–221. [Google Scholar] [CrossRef]
- Coppola, L.; Bellezze, T.; Belli, A.; Bignozzi, M.C.; Bolzoni, F.; Brenna, A.; Cabrini, M.; Candamano, S.; Cappai, M.; Caputo, D.; et al. Binders Alternative to Portland Cement and Waste Management for Sustainable Construction—Part 1. J. Appl. Biomater. Funct. Mater. 2018, 16, 186–202. [Google Scholar] [CrossRef]
- Liu, Y.; Xu, Y.; Geng, C. Sulfoaluminate Cement: An Alternative to Portland Cement. Adv. Mater. Res. 2012, 368, 478–484. [Google Scholar] [CrossRef]
- Tao, Y.; Rahul, A.V.; Mohan, M.K.; De Schutter, G.; Van Tittelboom, K. Recent Progress and Technical Challenges in Using Calcium Sulfoaluminate (CSA) Cement. Cem. Concr. Compos. 2023, 137, 104908. [Google Scholar] [CrossRef]
- Coppola, L.; Coffetti, D.; Crotti, E. Use of Tartaric Acid for the Production of Sustainable Portland-Free CSA-Based Mortars. Constr. Build. Mater. 2018, 171, 243–249. [Google Scholar] [CrossRef]
- Janotka, I.; Krajči, L.; Ray, A.; Mojumdar, S.C. The Hydration Phase and Pore Structure Formation in the Blends of Sulfoaluminate-Belite Cement with Portland Cement. Cem. Concr. Res. 2003, 33, 489–497. [Google Scholar] [CrossRef]
- Chen, I.A.; Hargis, C.W.; Juenger, M.C.G. Understanding Expansion in Calcium Sulfoaluminate-Belite Cements. Cem. Concr. Res. 2012, 42, 51–60. [Google Scholar] [CrossRef]
- Aranda, M.A.G.; De la Torre, A.G. Sulfoaluminate Cement. In Eco-Efficient Concrete; Pacheco-Torgal, F., Jalali, S., Labrincha, J., John, V.M., Eds.; Elsevier: Amsterdam, The Netherlands, 2013; pp. 488–522. ISBN 978-0-85709-424-7. [Google Scholar]
- Qin, L.; Yan, J.; Zhou, M.; Liu, H.; Wang, A.; Zhang, W.; Duan, P.; Zhang, Z. Mechanical Properties and Durability of Fiber Reinforced Geopolymer Composites: A Review on Recent Progress. Eng. Rep. 2023, 5, e12708. [Google Scholar] [CrossRef]
- Amran, M.; Al-Fakih, A.; Chu, S.H.; Fediuk, R.; Haruna, S.; Azevedo, A.; Vatin, N. Long-Term Durability Properties of Geopolymer Concrete: An In-Depth Review. Case Stud. Constr. Mater. 2021, 15, e00661. [Google Scholar] [CrossRef]
- Anger, R.; Fontaine, L. Batir en Terre, Du Grain de Sable à L’architecture; Belin: Paris, France, 2009. [Google Scholar]
- Schroeder, H. Sustainable Building with Earth; Springer: Berlin/Heidelberg, Germany, 2015; ISBN 978-3-319-19491-2. [Google Scholar]
- Hugo, H.; Guillard, H. Earth Construction: A Comprehensive Guide; Practical Action Publishing: Rugy, UK, 1994; ISBN 978-1-853-39193-4. [Google Scholar]
- UNESCO World Heritage, Inventory of Earthen Architecture; CRATerre-ENSAG: Paris, France, 2012; ISBN 978-2-906-90170-4.
- Costa, C.; Cerqueira, Â.; Rocha, F.; Velosa, A. The Sustainability of Adobe Construction: Past to Future. Int. J. Archit. Herit. 2019, 13, 639–647. [Google Scholar] [CrossRef]
- Alcorn, A. Embodied Energy and CO2 Coefficients for Nz Building Materials; Centre for Building Performance Research, Victoria University of Wellington: Wellington, New Zealand, 2003; ISBN 0-475-11099-4. [Google Scholar]
- Victoria University. Embodied Energy Coefficients. 2017. Available online: https://www.wgtn.ac.nz/architecture/centres/cbpr/resources/pdfs/ee-coefficients.pdf (accessed on 12 February 2024).
- Asdrubali, F.; Grazieschi, G.; Roncone, M.; Thiebat, F.; Carbonaro, C. Sustainability of Building Materials: Embodied Energy and Embodied Carbon of Masonry. Energies 2023, 16, 1846. [Google Scholar] [CrossRef]
- Ben-Alon, L.; Loftness, V.; Harries, K.A.; Cochran, H.E. Life Cycle Assessment (LCA) of Natural vs. Conventional Building Assemblies. Renew. Sustain. Energy Rev. 2021, 144, 110951. [Google Scholar] [CrossRef]
- Cabeza, L.F.; Barreneche, C.; Miró, L.; Morera, J.M.; Bartolí, E.; Inés Fernández, A. Low Carbon and Low Embodied Energy Materials in Buildings: A Review. Renew. Sustain. Energy Rev. 2013, 23, 536–542. [Google Scholar] [CrossRef]
- Röhlen, U.; Ziegert, C. Earth Building Practice Planning-Design-Building; Bauwerk-Beuth Verlag: Berlin, Germany, 2011. [Google Scholar]
- Petcu, C.; Dobrescu, C.F.; Dragomir, C.S.; Ciobanu, A.A.; Lăzărescu, A.V.; Hegyi, A. Thermophysical Characteristics of Clay for Efficient Rammed Earth Wall Construction. Materials 2023, 16, 6015. [Google Scholar] [CrossRef]
- Al-Radhi, Y.; Roy, K.; Liang, H.; Ghosh, K.; Clifton, G.C.; Lim, J.B.P. Thermal Performance of Different Construction Materials Used in New Zealand Dwellings Comparatively to International Practice—A Systematic Literature Review. J. Build. Eng. 2023, 72, 106346. [Google Scholar] [CrossRef]
- Stefanidou, M.; Assael, M.; Antoniadis, K.; Matziaroglou, G. Thermal Conductivity of Building Materials Employed in the Preservation of Traditional Structures. Int. J. Thermophys. 2010, 31, 844–851. [Google Scholar] [CrossRef]
- Wolterbeek, T.K.T.; Hangx, S.J.T. The Thermal Properties of Set Portland Cements—A Literature Review in the Context of CO2 Injection Well Integrity. Int. J. Greenh. Gas Control 2023, 126, 103909. [Google Scholar] [CrossRef]
- Kubiś, M.; Pietrak, K.; Cieślikiewicz, Ł.; Furmański, P.; Wasik, M.; Seredyński, M.; Wiśniewski, T.S.; Łapka, P. On the Anisotropy of Thermal Conductivity in Ceramic Bricks. J. Build. Eng. 2020, 31, 101418. [Google Scholar] [CrossRef]
- Costa-Carrapiço, I.; González, J.N.; Raslan, R.; Sánchez-Guevara, C.; Redondas, M.M.D. Understanding Thermal Comfort in Vernacular Dwellings in Alentejo, Portugal: A Mixed-Methods Adaptive Comfort Approach. Build. Environ. 2022, 217, 109084. [Google Scholar] [CrossRef]
- Ben-Alon, L.; Rempel, A.R. Thermal Comfort and Passive Survivability in Earthen Buildings. Build. Environ. 2023, 238, 110339. [Google Scholar] [CrossRef]
- Racusin, J.D.; McArleton, A. The Natural Building Companion: A Comprehensive Guide to Integrative Design and Construction; Chelsea Green Publishing: Chelsea, VT, USA, 2012. [Google Scholar]
- Ben-Alon, L.; Loftness, V.; Harries, K.A.; Cochran, H.E. Integrating Earthen Building Materials and Methods into Mainstream Construction Using Environmental Performance Assessment and Building Policy. IOP Conf. Ser. Earth Environ. Sci. 2019, 323, 012139. [Google Scholar] [CrossRef]
- Rempel, A.R.; Rempel, A.W. Intrinsic Evaporative Cooling by Hygroscopic Earth Materials. Geosciences 2016, 6, 38. [Google Scholar] [CrossRef]
- Tushar, Q.; Zhang, G.; Bhuiyan, M.A.; Navaratnam, S.; Giustozzi, F.; Hou, L. Retrofit of Building Façade Using Precast Sandwich Panel: An Integrated Thermal and Environmental Assessment on BIM-Based LCA. Buildings 2022, 12, 2098. [Google Scholar] [CrossRef]
- Beckett, C.T.S.; Jaquin, P.A.; Morel, J.C. Weathering the Storm: A Framework to Assess the Resistance of Earthen Structures to Water Damage. Constr. Build. Mater. 2020, 242, 118098. [Google Scholar] [CrossRef]
- Boukhattem, L.; Boumhaout, M.; Hamdi, H.; Benhamou, B.; Ait Nouh, F. Moisture Content Influence on the Thermal Conductivity of Insulating Building Materials Made from Date Palm Fibers Mesh. Constr. Build. Mater. 2017, 148, 811–823. [Google Scholar] [CrossRef]
- Cappai, M.; Delogu, F.; Pozzi-Escot, D.; Pacheco Neyra, G.; Meloni, P.; Pia, G. Degradation Phenomena of Templo Pintado Painted Plasters. Constr. Build. Mater. 2023, 392, 131839. [Google Scholar] [CrossRef]
- Cappai, M.; Casnedi, L.; Carcangiu, G.; Delogu, F.; Pozzi-escot, D.; Pacheco, G.; Pia, G.; Meloni, P. Weathering of Earth-Painted Surfaces: Environmental Monitoring and Artificial Aging. Constr. Build. Mater. 2022, 344, 128193. [Google Scholar] [CrossRef]
- Wiehle, P.; Simon, S.; Baier, J.; Dennin, L. Influence of Relative Humidity on the Strength and Stiffness of Unstabilised Earth Blocks and Earth Masonry Mortar. Constr. Build. Mater. 2022, 342, 128026. [Google Scholar] [CrossRef]
- Jiang, M.; Jiang, B.; Lu, R.; Chun, L.; Xu, H.; Yi, G. Thermal and Humidity Performance Test of Rammed-Earth Dwellings in Northwest Sichuan during Summer and Winter. Materials 2023, 16, 6283. [Google Scholar] [CrossRef] [PubMed]
- Vissac, A.; Bourgès, A.; Gandreau, D.; Anger, R.; Fontaine, L. Argiles & Biopolymères; CRAterre Éditions: Villefontaine, France, 2017; ISBN 978-2-906901-88-9. [Google Scholar]
- Van Damme, H.; Houben, H. Should Raw Earth Be Improved? An Environmental Assessment; CRAterre: Lyon, France, 2016; pp. 180–182. [Google Scholar]
- Nakamatsu, J.; Kim, S.; Ayarza, J.; Ramírez, E.; Elgegren, M.; Aguilar, R. Eco-Friendly Modification of Earthen Construction with Carrageenan: Water Durability and Mechanical Assessment. Constr. Build. Mater. 2017, 139, 193–202. [Google Scholar] [CrossRef]
- Alhaik, G.; Ferreira, M.; Dubois, V.; Wirquin, E.; Tilloy, S.; Monflier, E.; Aouad, G. Enhance the Rheological and Mechanical Properties of Clayey Materials by Adding Starches. Constr. Build. Mater. 2017, 139, 602–610. [Google Scholar] [CrossRef]
- Kulkarni, V.; Butte, K.; Rathod, S. Natural Polymers—A Comprehensive Review. Int. J. Res. Pharm. Biomed. Sci. 2012, 3, 1597–1613. [Google Scholar]
- Shoukat, R.; Cappai, M.; Pia, G.; Pilia, L. An Updated Review: Opuntia Ficus Indica (OFI) Chemistry and Its Diverse Applications. Appl. Sci. 2023, 13, 7724. [Google Scholar] [CrossRef]
- Walker, P.; Stace, T. Properties of Some Cement Stabilised Compressed Earth Blocks and Mortars. Mater. Struct. Constr. 1997, 30, 545–551. [Google Scholar] [CrossRef]
- Latifi, N.; Horpibulsuk, S.; Meehan, C.L.; Abd Majid, M.Z.; Tahir, M.M.; Mohamad, E.T. Improvement of Problematic Soils with Biopolymer—An Environmentally Friendly Soil Stabilizer. J. Mater. Civ. Eng. 2017, 29, 04016204. [Google Scholar] [CrossRef]
- Kariyawasam, K.K.G.K.D.; Jayasinghe, C. Cement Stabilized Rammed Earth as a Sustainable Construction Material. Constr. Build. Mater. 2016, 105, 519–527. [Google Scholar] [CrossRef]
- Sohaib, N.; Faiz, M.S.; Sana, G. Use of Acrylic Polymer for Stabilization of Clayey Soil. Int. J. Sci. Eng. Res. 2018, 9, 433–438. [Google Scholar]
- Park, S.S.; Lee, J.S.; Yoon, K.B.; Woo, S.W.; Lee, D.E. Application of an Acrylic Polymer and Epoxy Emulsion to Red Clay and Sand. Polymers 2021, 13, 3410. [Google Scholar] [CrossRef]
- Hall, M.R.; Lindsay, R.; Krayenhoff, M. Modern Earth Buildings; Elsevier: Amsterdam, The Netherlands, 2012; ISBN 978-0-85709-026-3. [Google Scholar]
- Lahalih, S.M.; Ahmed, N. Effect of New Soil Stabilizers on the Compressive Strength of Dune Sand. Constr. Build. Mater. 1998, 12, 321–328. [Google Scholar] [CrossRef]
- Levačić, E.; Mladen, B. Soil Stabilization by Means of “LENDUR EH” Ureaformaldehyde Resin. Min. Geol. Pet. Eng. Bull. 1990, 2, 137–143. [Google Scholar]
- Striani, R.; Cappai, M.; Casnedi, L.; Esposito, C.C.; Pia, G. Coating’s Influence on Wind Erosion of Porous Stones Used in the Cultural Heritage of Southern Italy: Surface Characterisation and Resistance. Case Stud. Constr. Mater. 2022, 17, e01501. [Google Scholar] [CrossRef]
- Soldo, A.; Miletić, M.; Auad, M.L. Biopolymers as a Sustainable Solution for the Enhancement of Soil Mechanical Properties. Sci. Rep. 2020, 10, 267. [Google Scholar] [CrossRef] [PubMed]
- Soldo, A.; Miletic, M. Durability against Wetting-Drying Cycles of Sustainable Biopolymer-Treated Soil. Polymers 2022, 14, 4247. [Google Scholar] [CrossRef] [PubMed]
- Guihéneuf, S.; Rangeard, D.; Perrot, A. Addition of Bio Based Reinforcement to Improve Workability, Mechanical Properties and Water Resistance of Earth-Based Materials. Acad. J. Civ. Eng. 2019, 37, 184–192. [Google Scholar]
- Tourtelot, J.; Bourgès, A.; Keita, E. Influence of Biopolymers on the Mechanical Behavior of Earth-Based Building Materials. Recent Prog. Mater. 2021, 3, 1–16. [Google Scholar] [CrossRef]
- Ilman, B.; Balkis, A.P. Sustainable Biopolymer Stabilized Earthen: Utilization of Chitosan Biopolymer on Mechanical, Durability, and Microstructural Properties. J. Build. Eng. 2023, 76, 107220. [Google Scholar] [CrossRef]
- Caillol, S. Special Issue “Natural Polymers and Biopolymers II. ” Molecules 2021, 26, 112. [Google Scholar] [CrossRef] [PubMed]
- Chang, I.; Im, J.; Prasidhi, A.K.; Cho, G.C. Effects of Xanthan Gum Biopolymer on Soil Strengthening. Constr. Build. Mater. 2015, 74, 65–72. [Google Scholar] [CrossRef]
- Guihéneuf, S.; Rangeard, D.; Perrot, A.; Cusin, T.; Collet, F.; Prétot, S. Effect of Bio-Stabilizers on Capillary Absorption and Water Vapour Transfer into Raw Earth. Mater. Struct. Constr. 2020, 53, 138. [Google Scholar] [CrossRef]
- Losini, A.E.; Grillet, A.C.; Bellotto, M.; Woloszyn, M.; Dotelli, G. Natural Additives and Biopolymers for Raw Earth Construction Stabilization—A Review. Constr. Build. Mater. 2021, 304, 124507. [Google Scholar] [CrossRef]
- Muguda, S.; Booth, S.J.; Hughes, P.N.; Augarde, C.E.; Perlot, C.; Bruno, A.W.; Gallipoli, D. Preliminary Study on Use of Biopolymers in Earthen Construction. In Proceedings of the 7th International Conference on Unsaturated Soils, Beijing, China, 3–5 August 2018. [Google Scholar]
- Muguda, S.; Lucas, G.; Hughes, P.N.; Augarde, C.E.; Perlot, C.; Bruno, A.W.; Gallipoli, D. Durability and Hygroscopic Behaviour of Biopolymer Stabilised Earthen Construction Materials. Constr. Build. Mater. 2020, 259, 119725. [Google Scholar] [CrossRef]
- Muguda, S.; Hughes, P.N.; Augarde, C.E.; Perlot, C.; Walter, B.A.; Gallipoli, D. Cross-Linking of Biopolymers for Stabilizing Earthen Construction Materials. Build. Res. Inf. 2022, 50, 502–514. [Google Scholar] [CrossRef]
- Chang, I.; Jeon, M.; Cho, G.C. Application of Microbial Biopolymers as an Alternative Construction Binder for Earth Buildings in Underdeveloped Countries. Int. J. Polym. Sci. 2015, 2015, 326745. [Google Scholar] [CrossRef]
- Santos, T.; Nunes, L.; Faria, P. Production of Eco-Efficient Earth-Based Plasters: Influence of Composition on Physical Performance and Bio-Susceptibility. J. Clean. Prod. 2017, 167, 55–67. [Google Scholar] [CrossRef]
- Giroudon, M.; Laborel-Préneron, A.; Aubert, J.E.; Magniont, C. Comparison of Barley and Lavender Straws as Bioaggregates in Earth Bricks. Constr. Build. Mater. 2019, 202, 254–265. [Google Scholar] [CrossRef]
- Karak, N. Biopolymers for Paints and Surface Coatings; Elsevier: Amsterdam, The Netherlands, 2016; ISBN 9780081002148. [Google Scholar]
- Noordover, B.A.J.; Heise, A.; Malanowksi, P.; Senatore, D.; Mak, M.; Molhoek, L.; Duchateau, R.; Koning, C.E.; van Benthem, R.A.T.M. Biobased Step-Growth Polymers in Powder Coating Applications. Prog. Org. Coat. 2009, 65, 187–196. [Google Scholar] [CrossRef]
- Ren, X.; Meng, L.; Soucek, M. Environmentally Friendly Coatings. Biobased Environ. Benign Coat. 2016, 4, 183–223. [Google Scholar] [CrossRef]
- Noreen, A.; Zia, K.M.; Zuber, M.; Tabasum, S.; Zahoor, A.F. Bio-Based Polyurethane: An Efficient and Environment Friendly Coating Systems: A Review. Prog. Org. Coat. 2016, 91, 25–32. [Google Scholar] [CrossRef]
- Peres, R.S.; Ferreira, C.A.; Alemán, C.; Armelin, E. Development of Novel Biobased Epoxy Films with Aliphatic and Aromatic Amine Hardeners for the Partial Replacement of Bisphenol a in Primer Coatings. Biobased Environ. Benign Coat. 2016, 4, 121–148. [Google Scholar] [CrossRef]
- Moreno, M.; Lampard, C.; Williams, N.; Lago, E.; Emmett, S.; Goikoetxea, M.; Barandiaran, M.J. Eco-Paints from Bio-Based Fatty Acid Derivative Latexes. Prog. Org. Coat. 2015, 81, 101–106. [Google Scholar] [CrossRef]
- Sandak, A.; Sandak, J.; Brzezicki, M.; Kutnar, A. Bio-Based Building Skin; Springer: Berlin/Heidelberg, Germany, 2019; ISBN 978-981-13-3746-8. [Google Scholar]
- Dizman, C.; Cerrahoğlu, K.E. Alkyd Resins Produced from Bio-Based Resources for More Sustainable and Environmentally Friendly Coating Applications. Turk. J. Chem. 2023, 47, 1–23. [Google Scholar] [CrossRef] [PubMed]
- Gong, L.; Wang, Y.; Cheng, X.; Zhang, R.; Zhang, H. Thermal Conductivity of Highly Porous Mullite Materials. Int. J. Heat Mass Transf. 2013, 67, 253–259. [Google Scholar] [CrossRef]
- Hashin, Z.; Shtrikman, S. A Variational Approach to the Theory of the Effective Magnetic Permeability of Multiphase Materials. J. Appl. Phys. 1962, 33, 3125. [Google Scholar] [CrossRef]
- Carson, J.K.; Lovatt, S.J.; Tanner, D.J.; Cleland, A.C. Thermal Conductivity Bounds for Isotropic, Porous Materials. Int. J. Heat Mass Transf. 2005, 48, 2150–2158. [Google Scholar] [CrossRef]
- Cappai, M.; Pia, G. Thermal Conductivity of Porous Building Materials: An Exploration of New Challenges in Fractal Modeling Solutions. RILEM Tech. Lett. 2023, 8, 79–93. [Google Scholar] [CrossRef]
- Ma, Y.; Yu, B.; Zhang, D.; Zou, M. A Self-Similarity Model for Effective Thermal Conductivity of Porous Media. J. Phys. D Appl. Phys. 2003, 36, 2157–2164. [Google Scholar] [CrossRef]
- Atzeni, C.; Pia, G.; Sanna, U.; Spanu, N. A Fractal Model of the Porous Microstructure of Earth-Based Materials. Constr. Build. Mater. 2008, 22, 1607–1613. [Google Scholar] [CrossRef]
- UNI EN ISO 17892-4:2017; Geotechnical Investigation and Testing—Laboratory Testing of Soil—Part 4: Determination of particle size distribution. ISO: Geneva, Switzerland, 2018.
- ISO 8301:1991; Thermal Insulation—Determination of Steady-State Thermal Resistance and Related Properties—Heat Flow Meter Apparatus. ISO: Geneva, Switzerland, 1991.
- Hsu, C.T.; Cheng, P.; Wong, K.W. A Lumped-Parameter Model for Stagnant Thermal Conductivity of Spatially Periodic Porous Media. J. Heat Transf. 1995, 117, 264–269. [Google Scholar] [CrossRef]
- Reeves, G.M.; Sims, I.; Cripps, J.C. (Eds.) Clay Materials Used in Construction; Geological Society: London, UK, 2006; ISBN 1-86239-184-X. [Google Scholar]
Disclaimer/Publisher’s Note: The statements, opinions and data contained in all publications are solely those of the individual author(s) and contributor(s) and not of MDPI and/or the editor(s). MDPI and/or the editor(s) disclaim responsibility for any injury to people or property resulting from any ideas, methods, instructions or products referred to in the content. |
© 2024 by the authors. Licensee MDPI, Basel, Switzerland. This article is an open access article distributed under the terms and conditions of the Creative Commons Attribution (CC BY) license (https://creativecommons.org/licenses/by/4.0/).