
Effect of Macro Fibers on the Permeability and Crack Surface Topography of Layered Fiber Reinforced Concrete

 , ,
, ,
Abstract
1. Introduction
2. Experiment
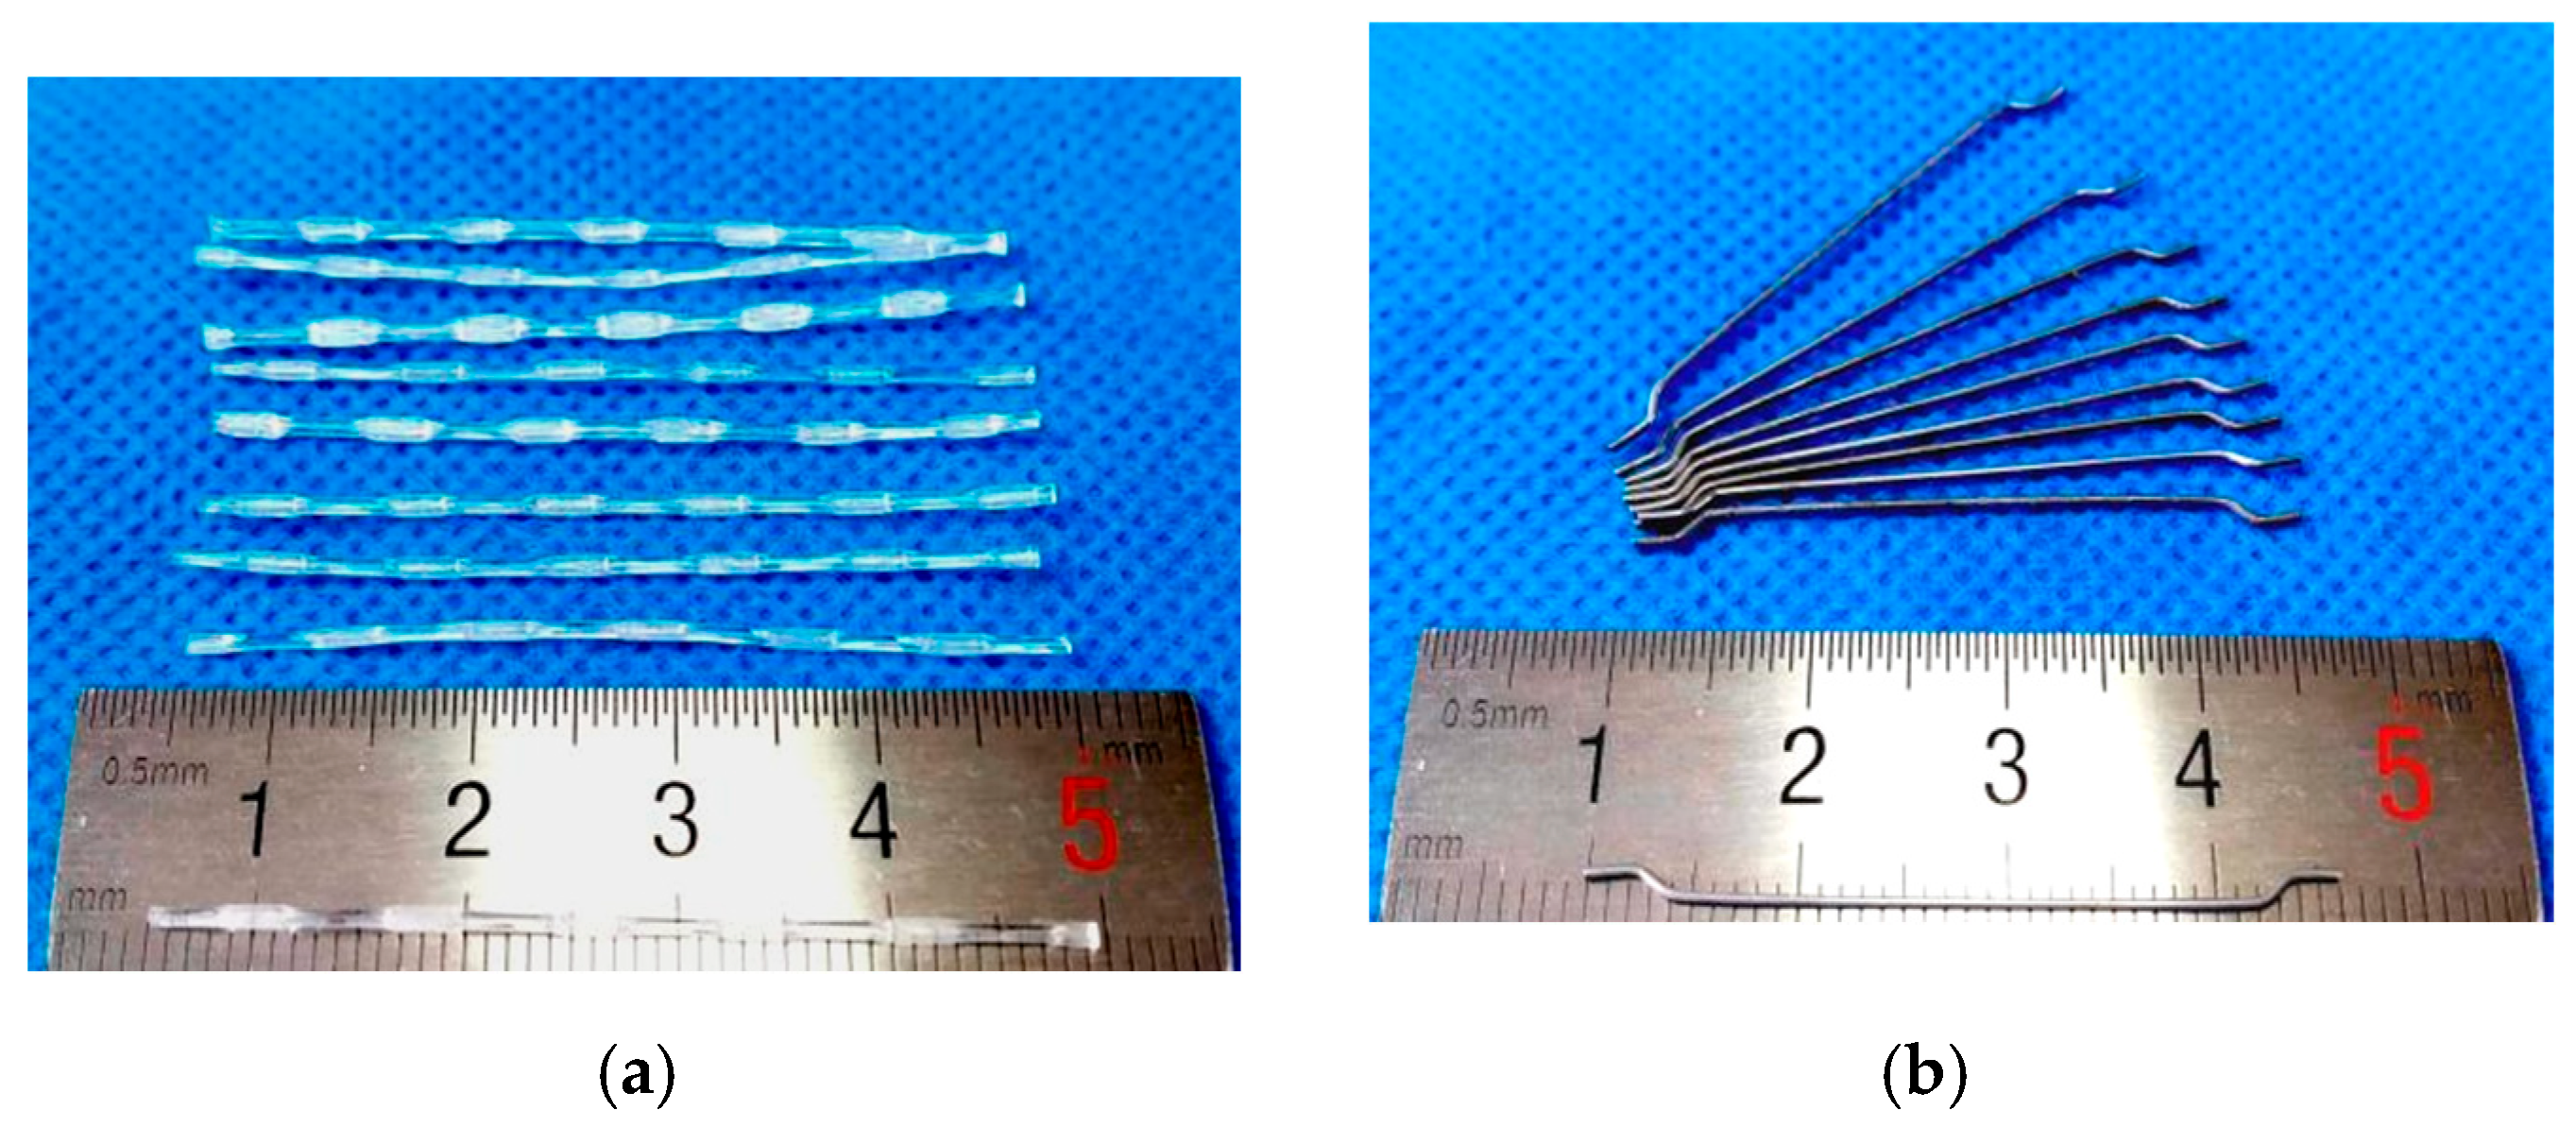
2.1. Materials
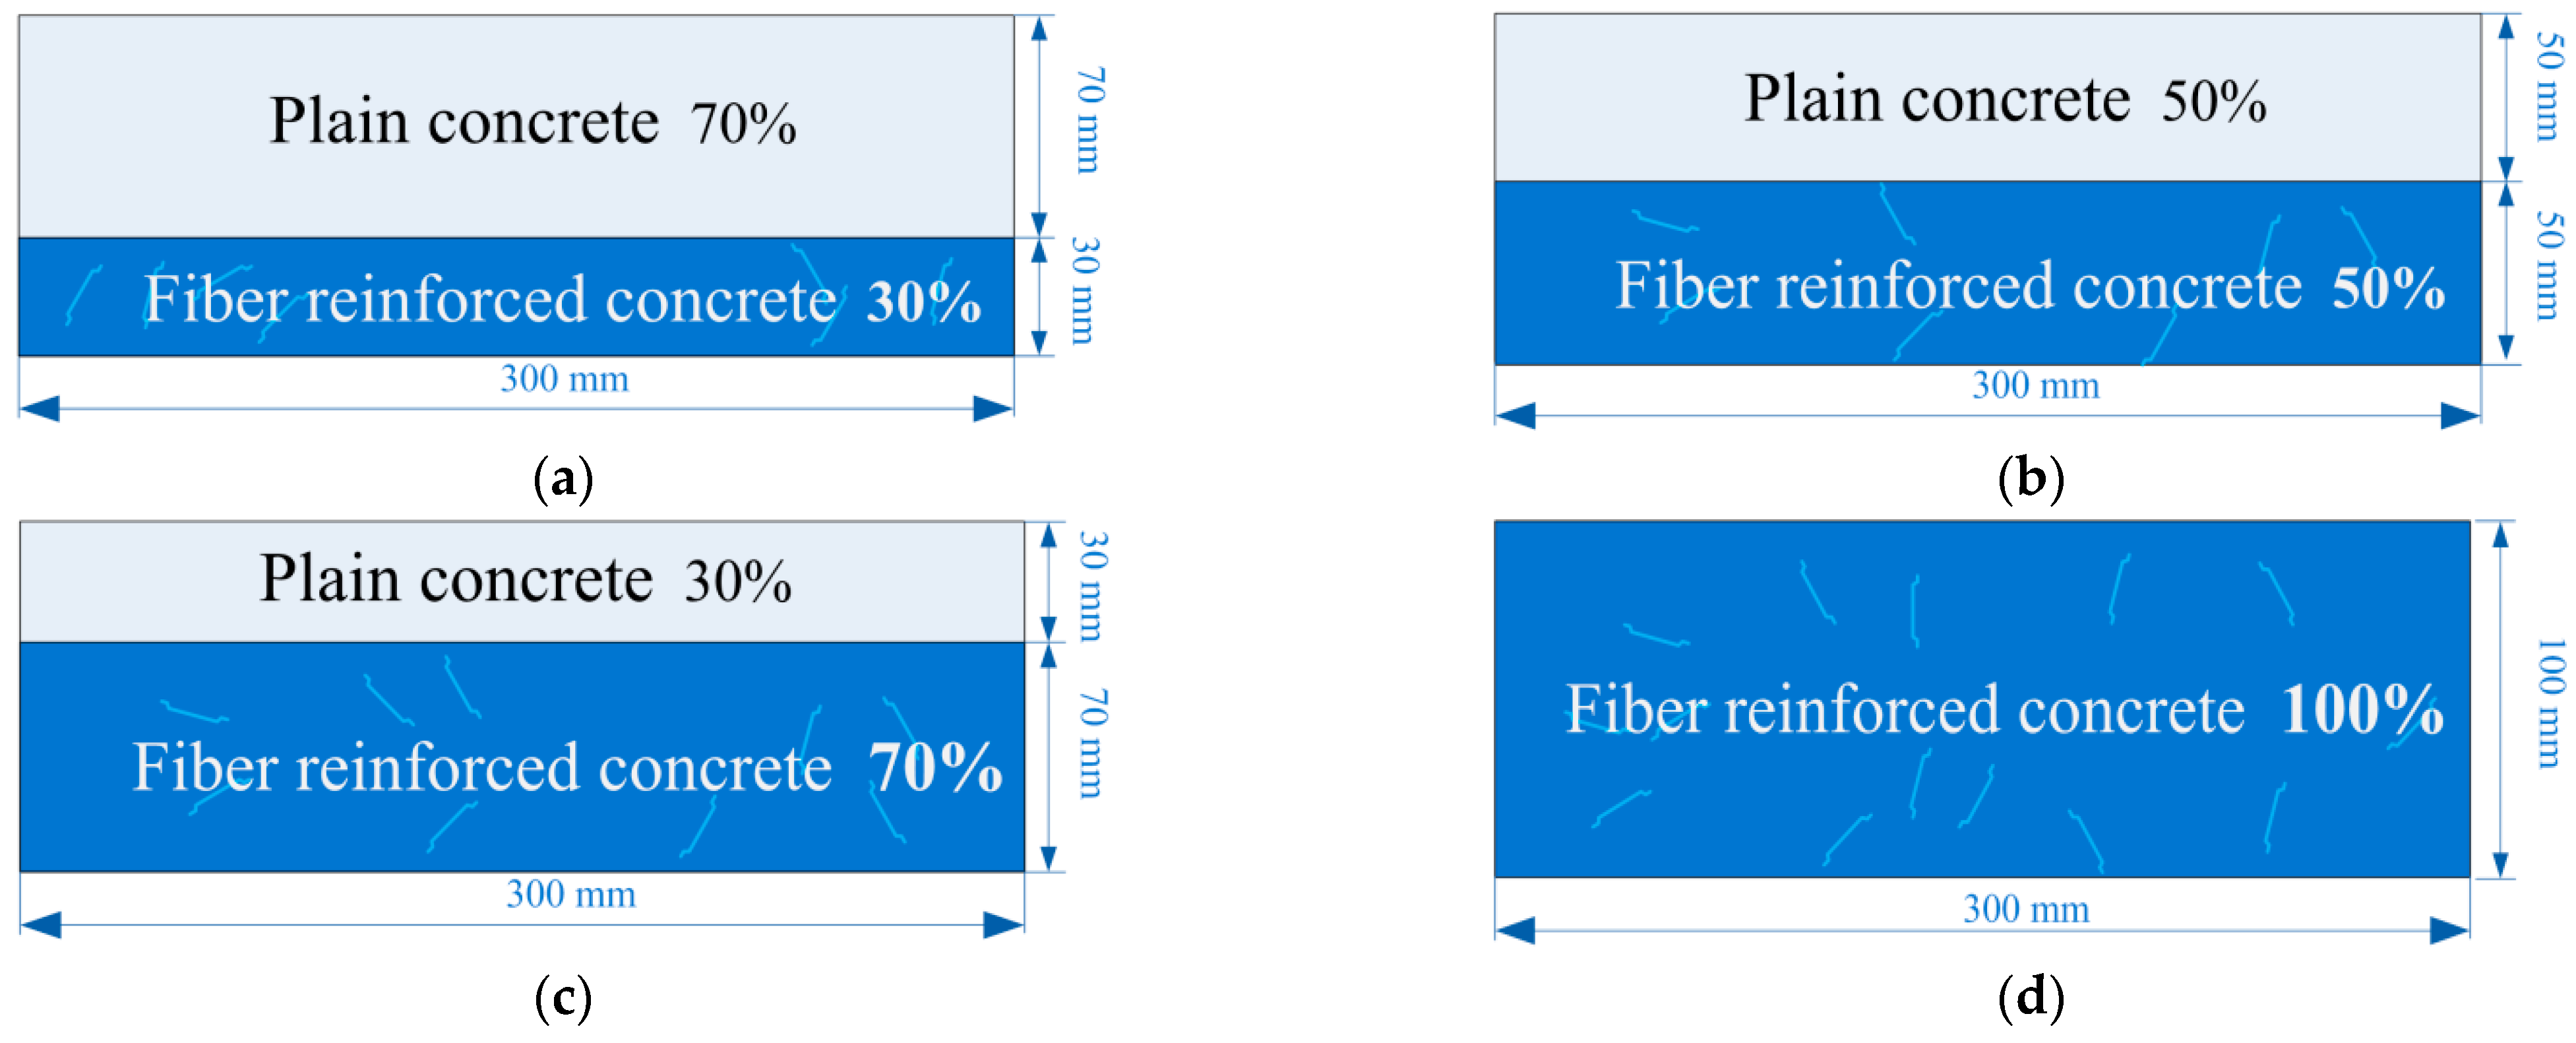
2.2. Specimens
2.3. Permeability Test
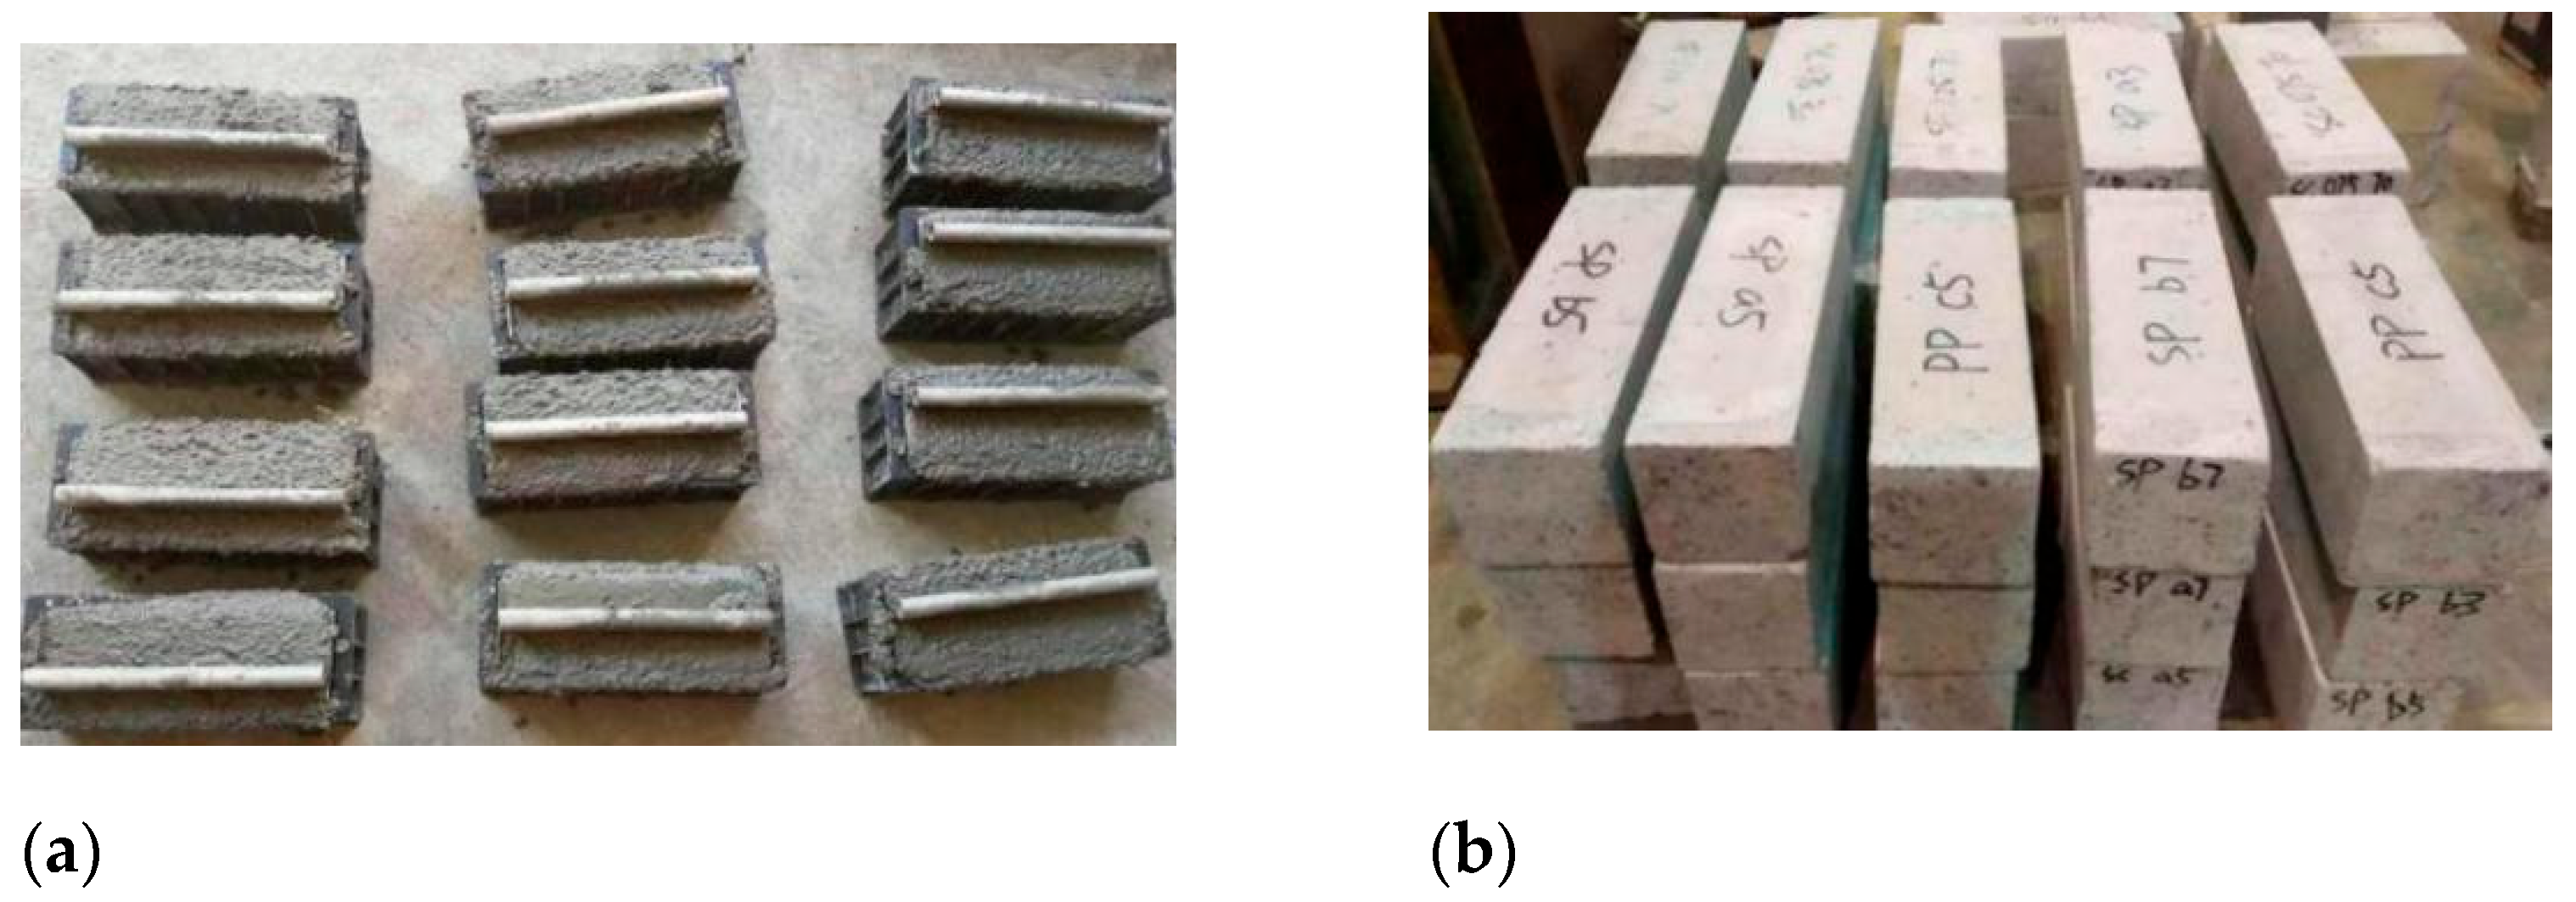
- Each surface of the specimen was ground to ensure parallelism with its opposite face. Epoxy resin was used to adhere the steel plates to the top and bottom of the specimens. Then, the specimens with steel plates were cured at room temperature of 20 °C for 7 days to ensure the epoxy resin was cured.
- The vacuum-saturated concrete instrument was used to remove the air from the specimens. The waterproof tape was applied to the side surfaces of the specimens to prevent water leakage.
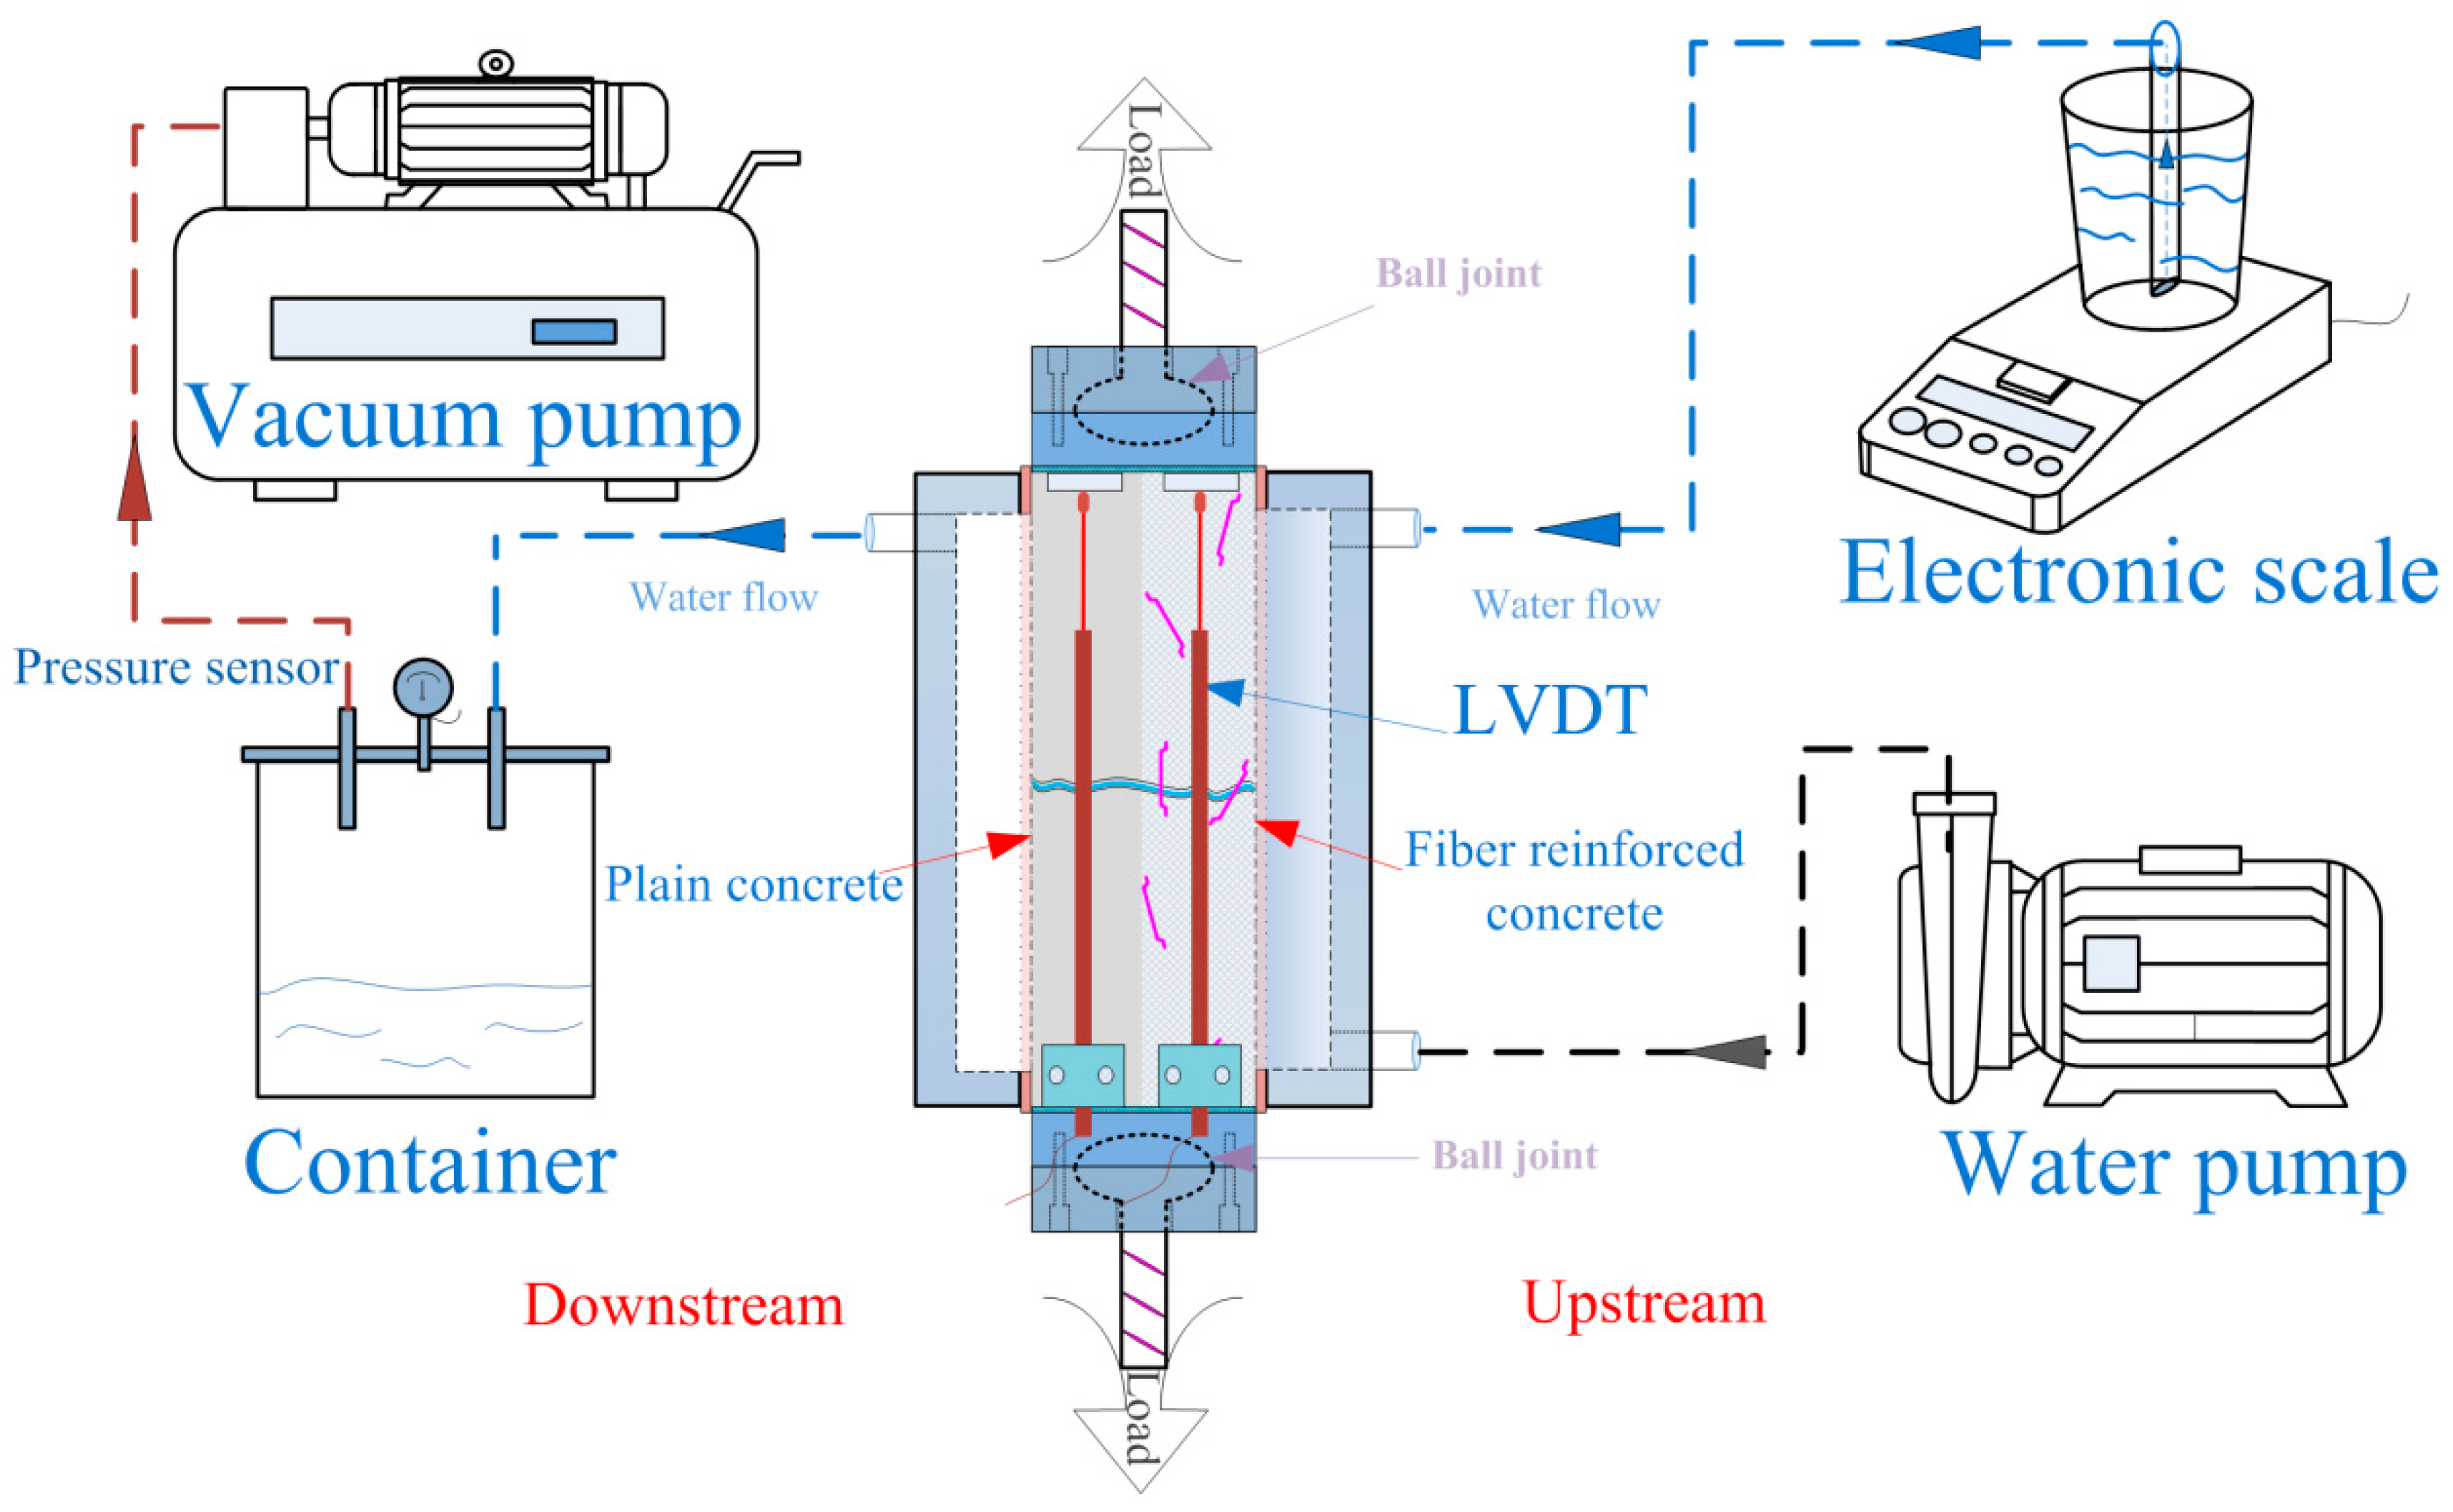
- Two bolt clamps were used to fix the water vessels. Rubber rings were employed between the water vessel and the specimens to ensure air tightness. The connection of each instrument is shown in Figure 5.
- In the experiment, the upstream water vessel was filled with water using a water pump. An upstream rubber tube was inserted into a beaker with water, and an electronic scale measured the mass of water.
- The vacuum pump maintained an absolute pressure of 10.8 kPa downstream. The upstream was connected to the atmosphere through the beaker, with a pressure difference (Δp = pu−pd) of 90 kPa between the upstream and the downstream.
- In the permeability test, the pressure difference made water break through the specimen. The flow rate and the permeability of the specimen were calculated based on the water reduction rate in the beaker.
2.4. Crack Permeability Parameter
2.5. Parameters of Uniaxial Tensile Properties
2.6. Collection of Crack Surface Topography
3. Results and Discussion
3.1. Uniaxial Tensile Load-Deflection Curve
- (i)
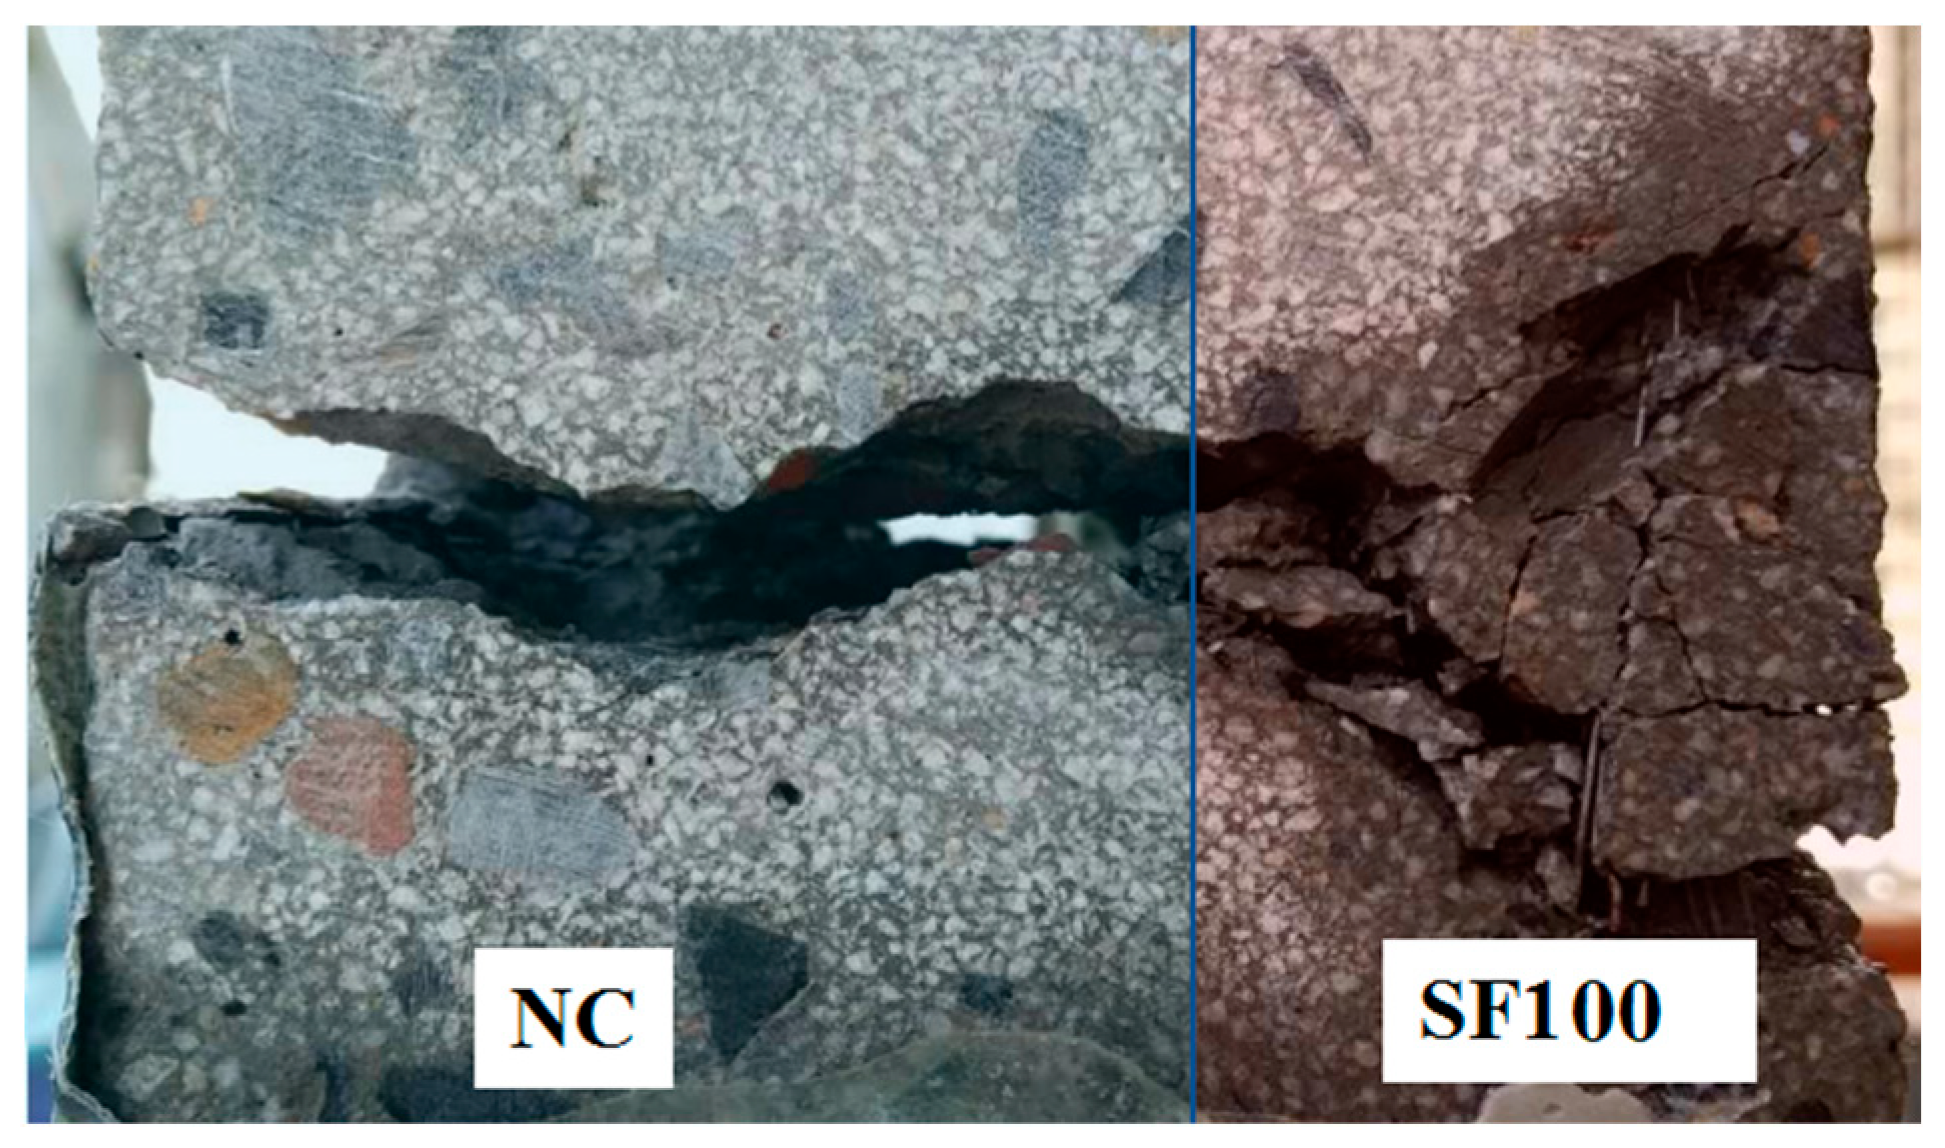
- NC exhibits a rapid decrease in uniaxial tensile load-bearing capacity and brittle failure after the peak load. However, the FRC shows a higher level of toughness than the NC.
- (ii)
- For FRC, when the initial cracks form, each group of layered FRC specimens shows a significant reduction in load-bearing capacity, and the reduction in load-bearing capacity decreases with the increasing layering ratios of layered FRC specimens. This can be attributed to that specimens with a high layering ratio have a higher proportion of FRC material and more fibers bridging cracks than those with a low layering ratio, which shows a beneficial effect on the residual strength of concrete.
- (iii)
- Figure 8a–d shows the load-deflection curves of SF100, PP11.4, SF80PP2.3, and SF20PP9.1 specimens at different layering ratios (100%, 70%, 50%, and 30%), respectively. It can be seen that the fiber type has a significant effect on the residual load-bearing capacity after the peak load of the specimen. When the layering ratio of FRC is the same, the load bearing capacity follows the order: SF100 > SF80PP2.3 > SF20PP9.1 > PP11.4. The load bearing capacity of SF100 specimens is higher than that of the other specimens. As the steel fiber content decreases, the residual load-bearing capacity of each group of specimens gradually decreases. This can be attributed to that the bond behavior between steel fibers, which have a high elastic modulus and end hooks, and concrete is significantly higher than that of polypropylene fibers with a low elastic modulus and straight ends. Some studies [35,36] have found similar results.
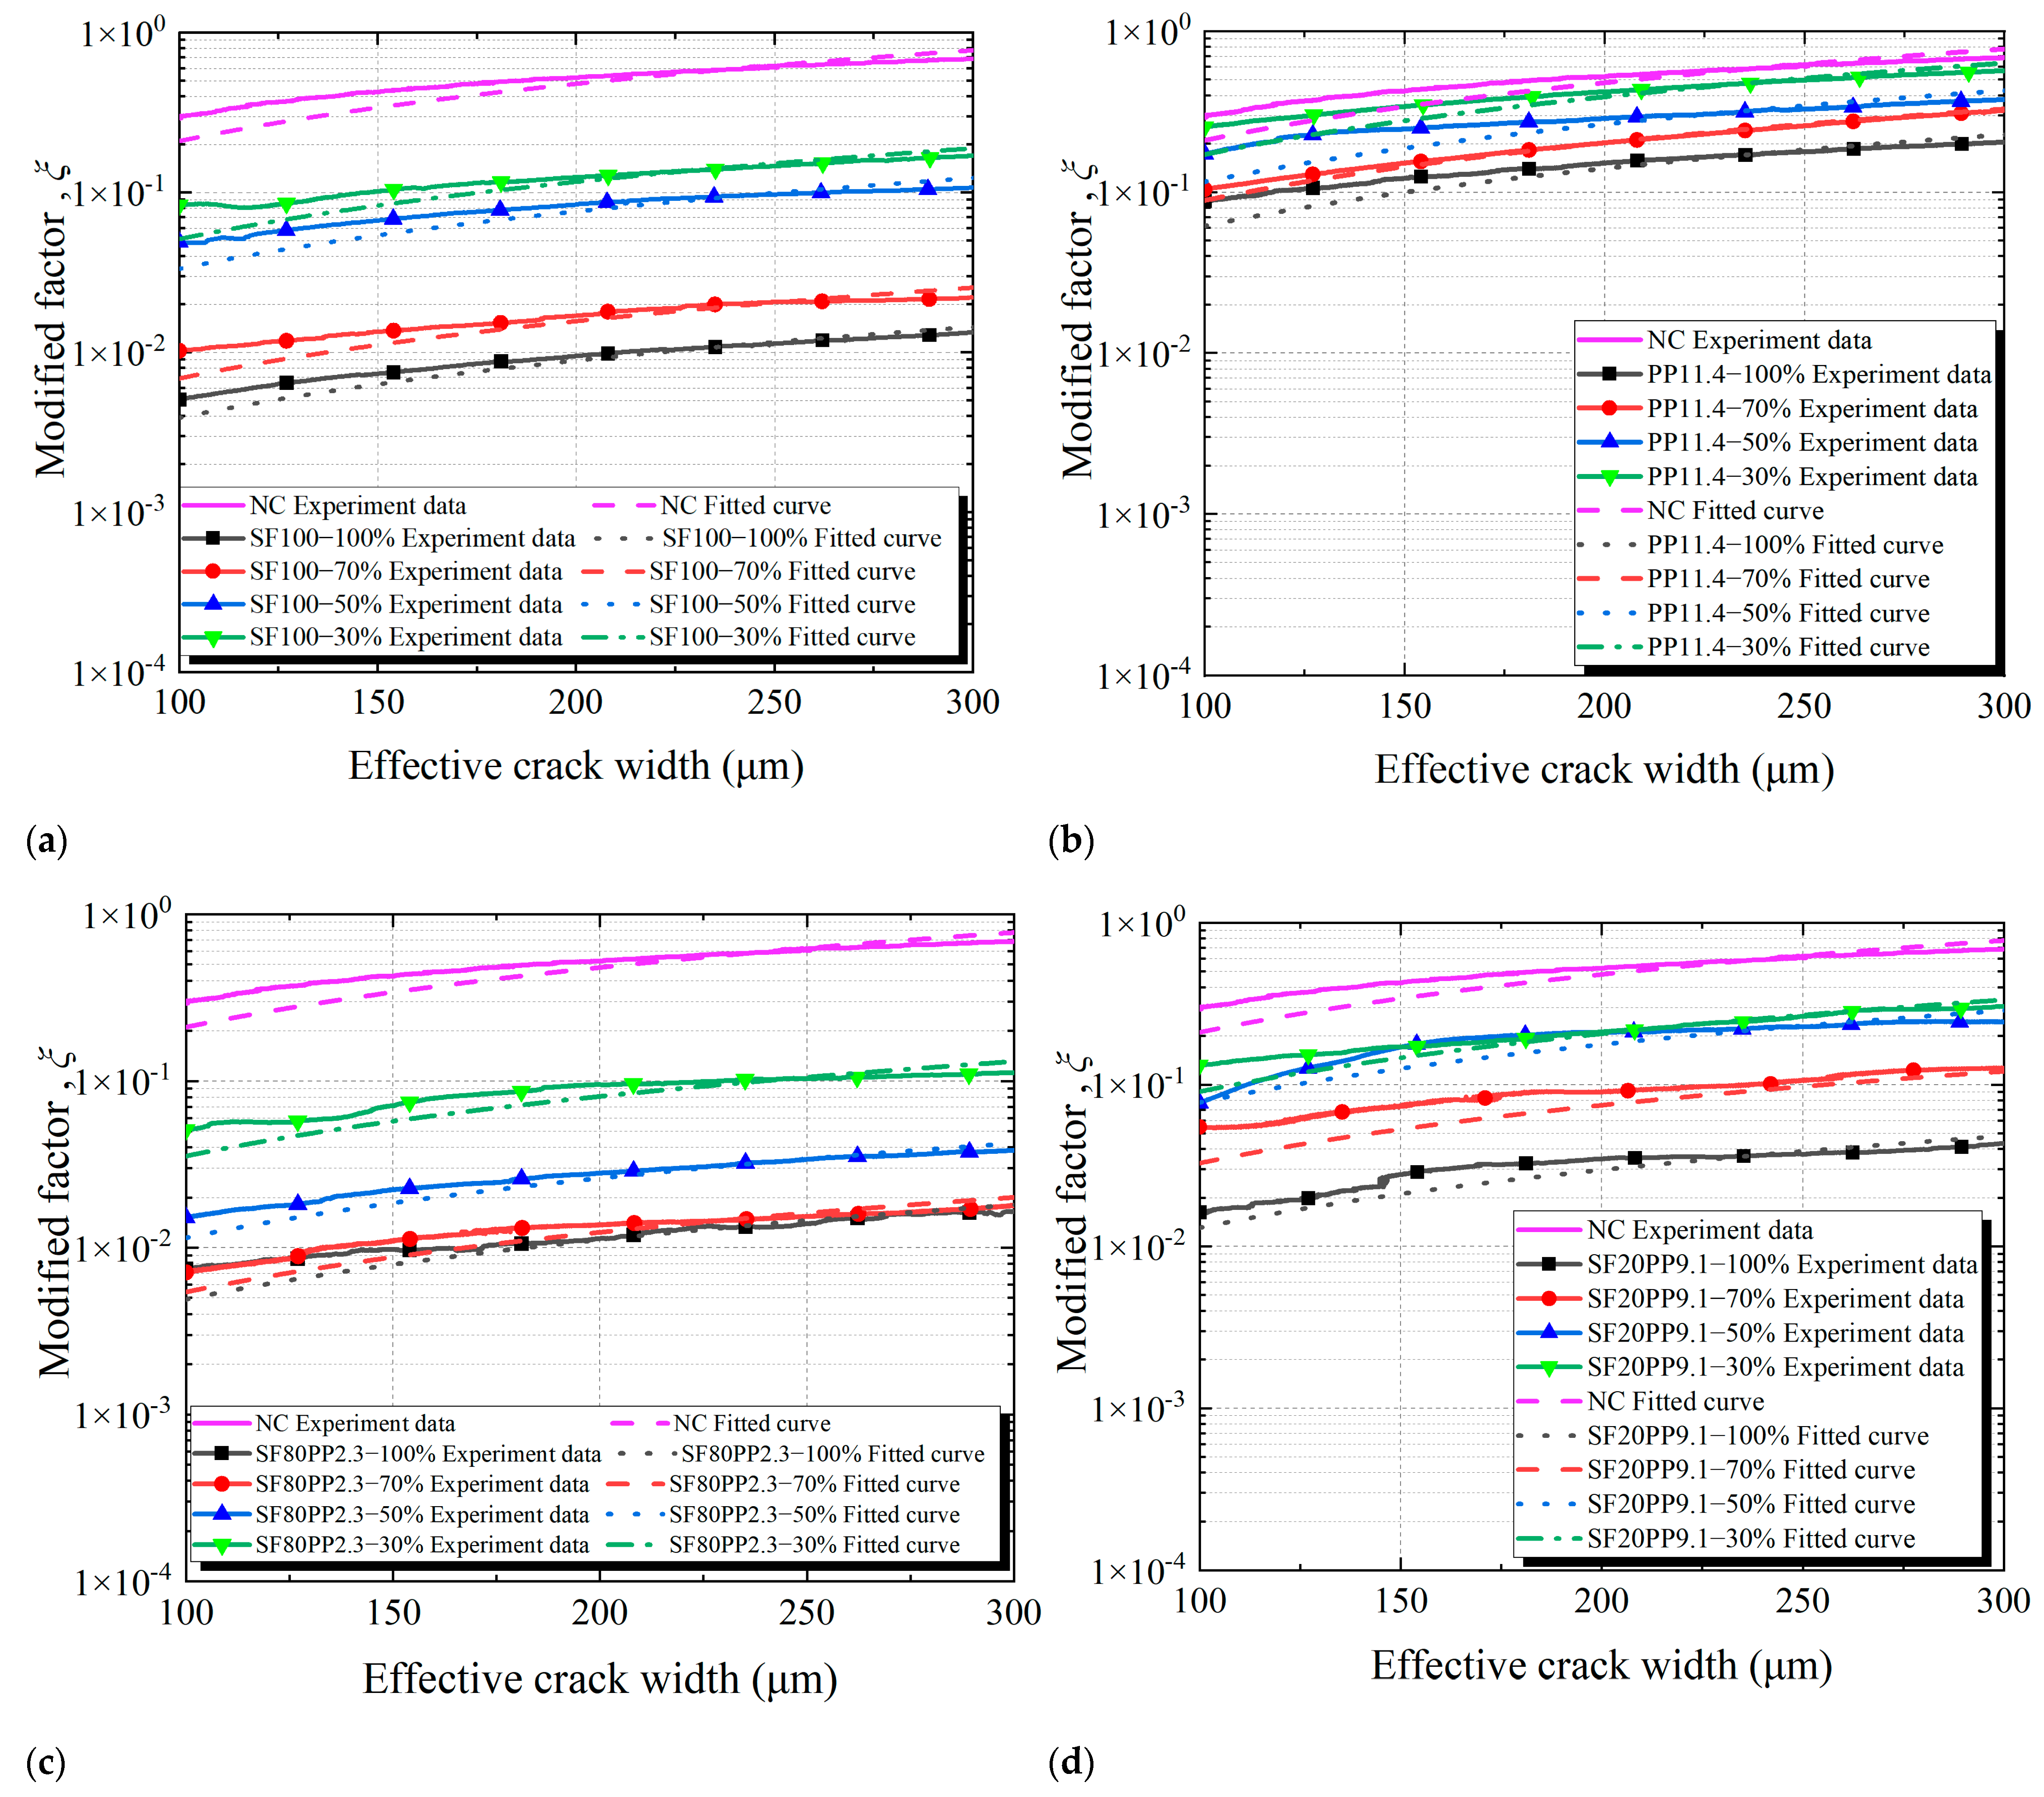
3.2. Crack Permeability of Layered FRC Specimens
- i.
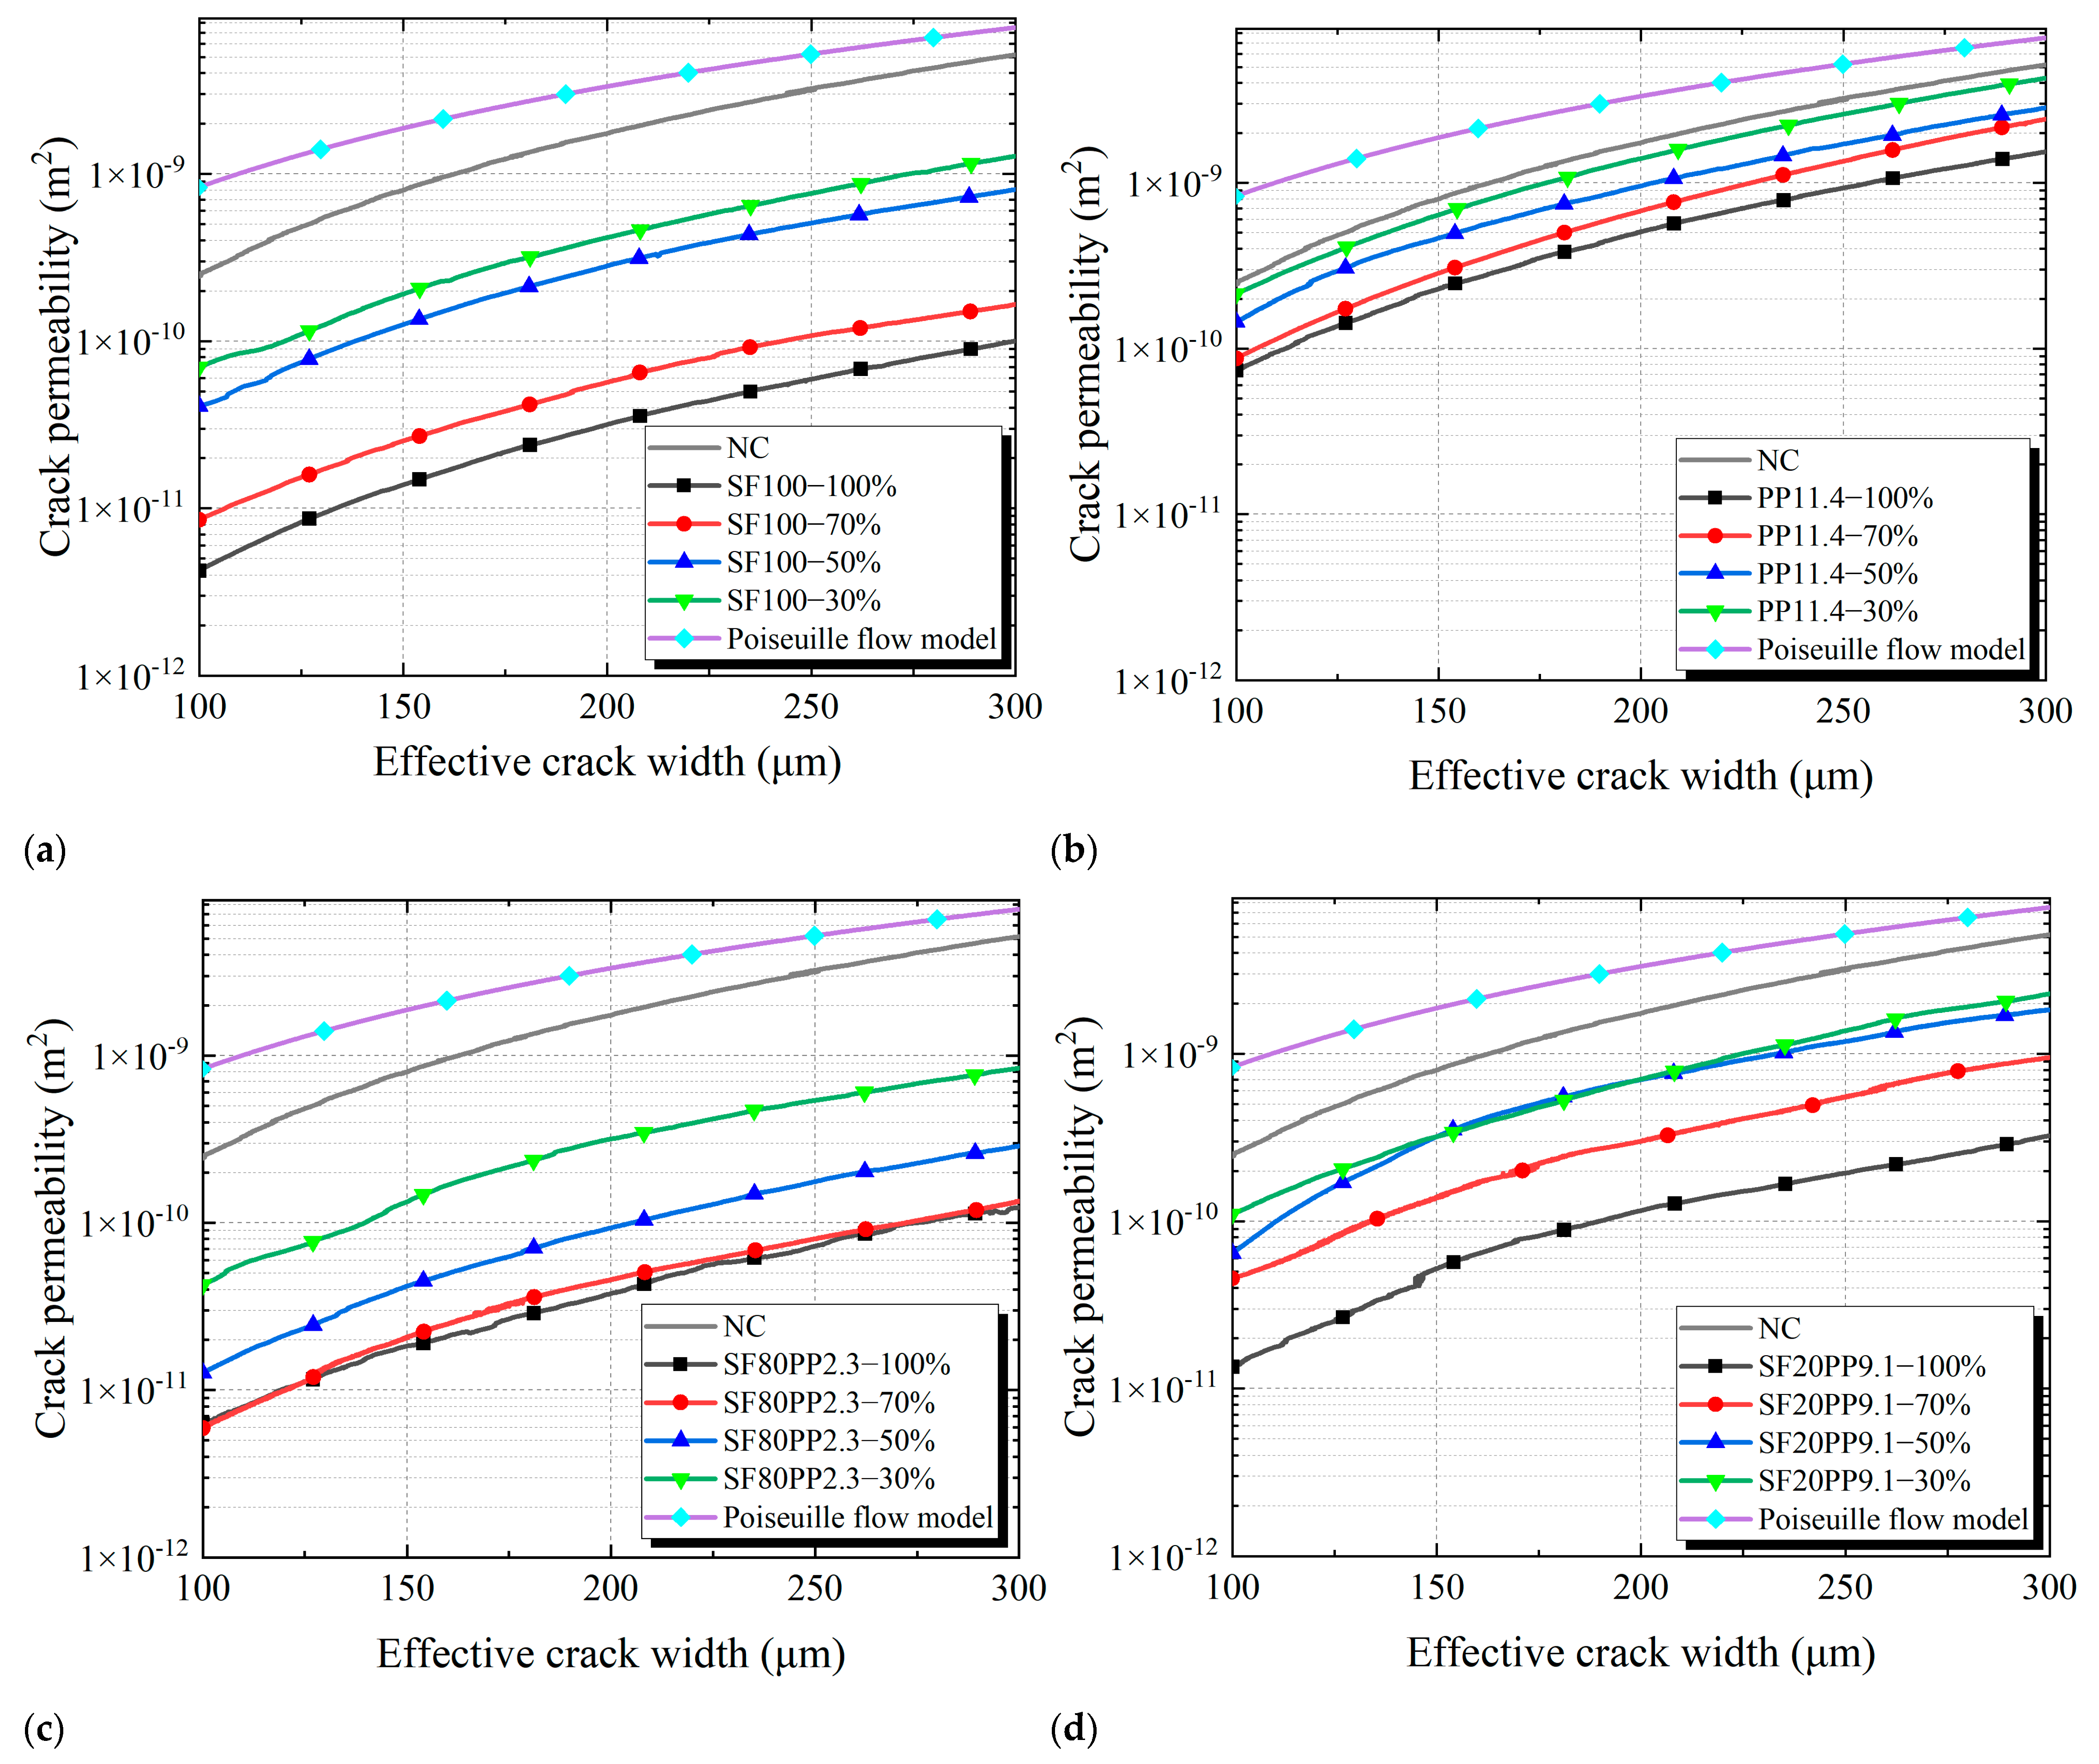
- With the increase in crack width, the crack permeability of all layered FRC specimens increases.
- ii.
- For mono-FRC with the same layering ratio, the SF100 specimen exhibits lower crack permeability than the PP11.4 specimen.
- iii.
- For hybrid FRC, the crack permeability of the SF20PP9.1 specimen is higher than that of the SF100 specimen and lower than that of the PP11.4 specimen. It indicates that the SF20PP9.1 specimen with hybrid fibers does not exhibit superior crack impermeability performance compared to mono-FRC. However, when the crack width is the same, the crack permeability of the SF80PP2.3 specimen is lower than that of the SF100 and PP11.4 specimens with the same layering ratio. It demonstrates that the SF80PP2.3 specimen with hybrid fibers exhibits greater crack impermeability performance compared to mono-FRC (SF100 and PP11.4) with the same volume of fibers. The SF80PP2.3 specimen demonstrates a positive synergistic effect of hybrid fibers on crack impermeability.
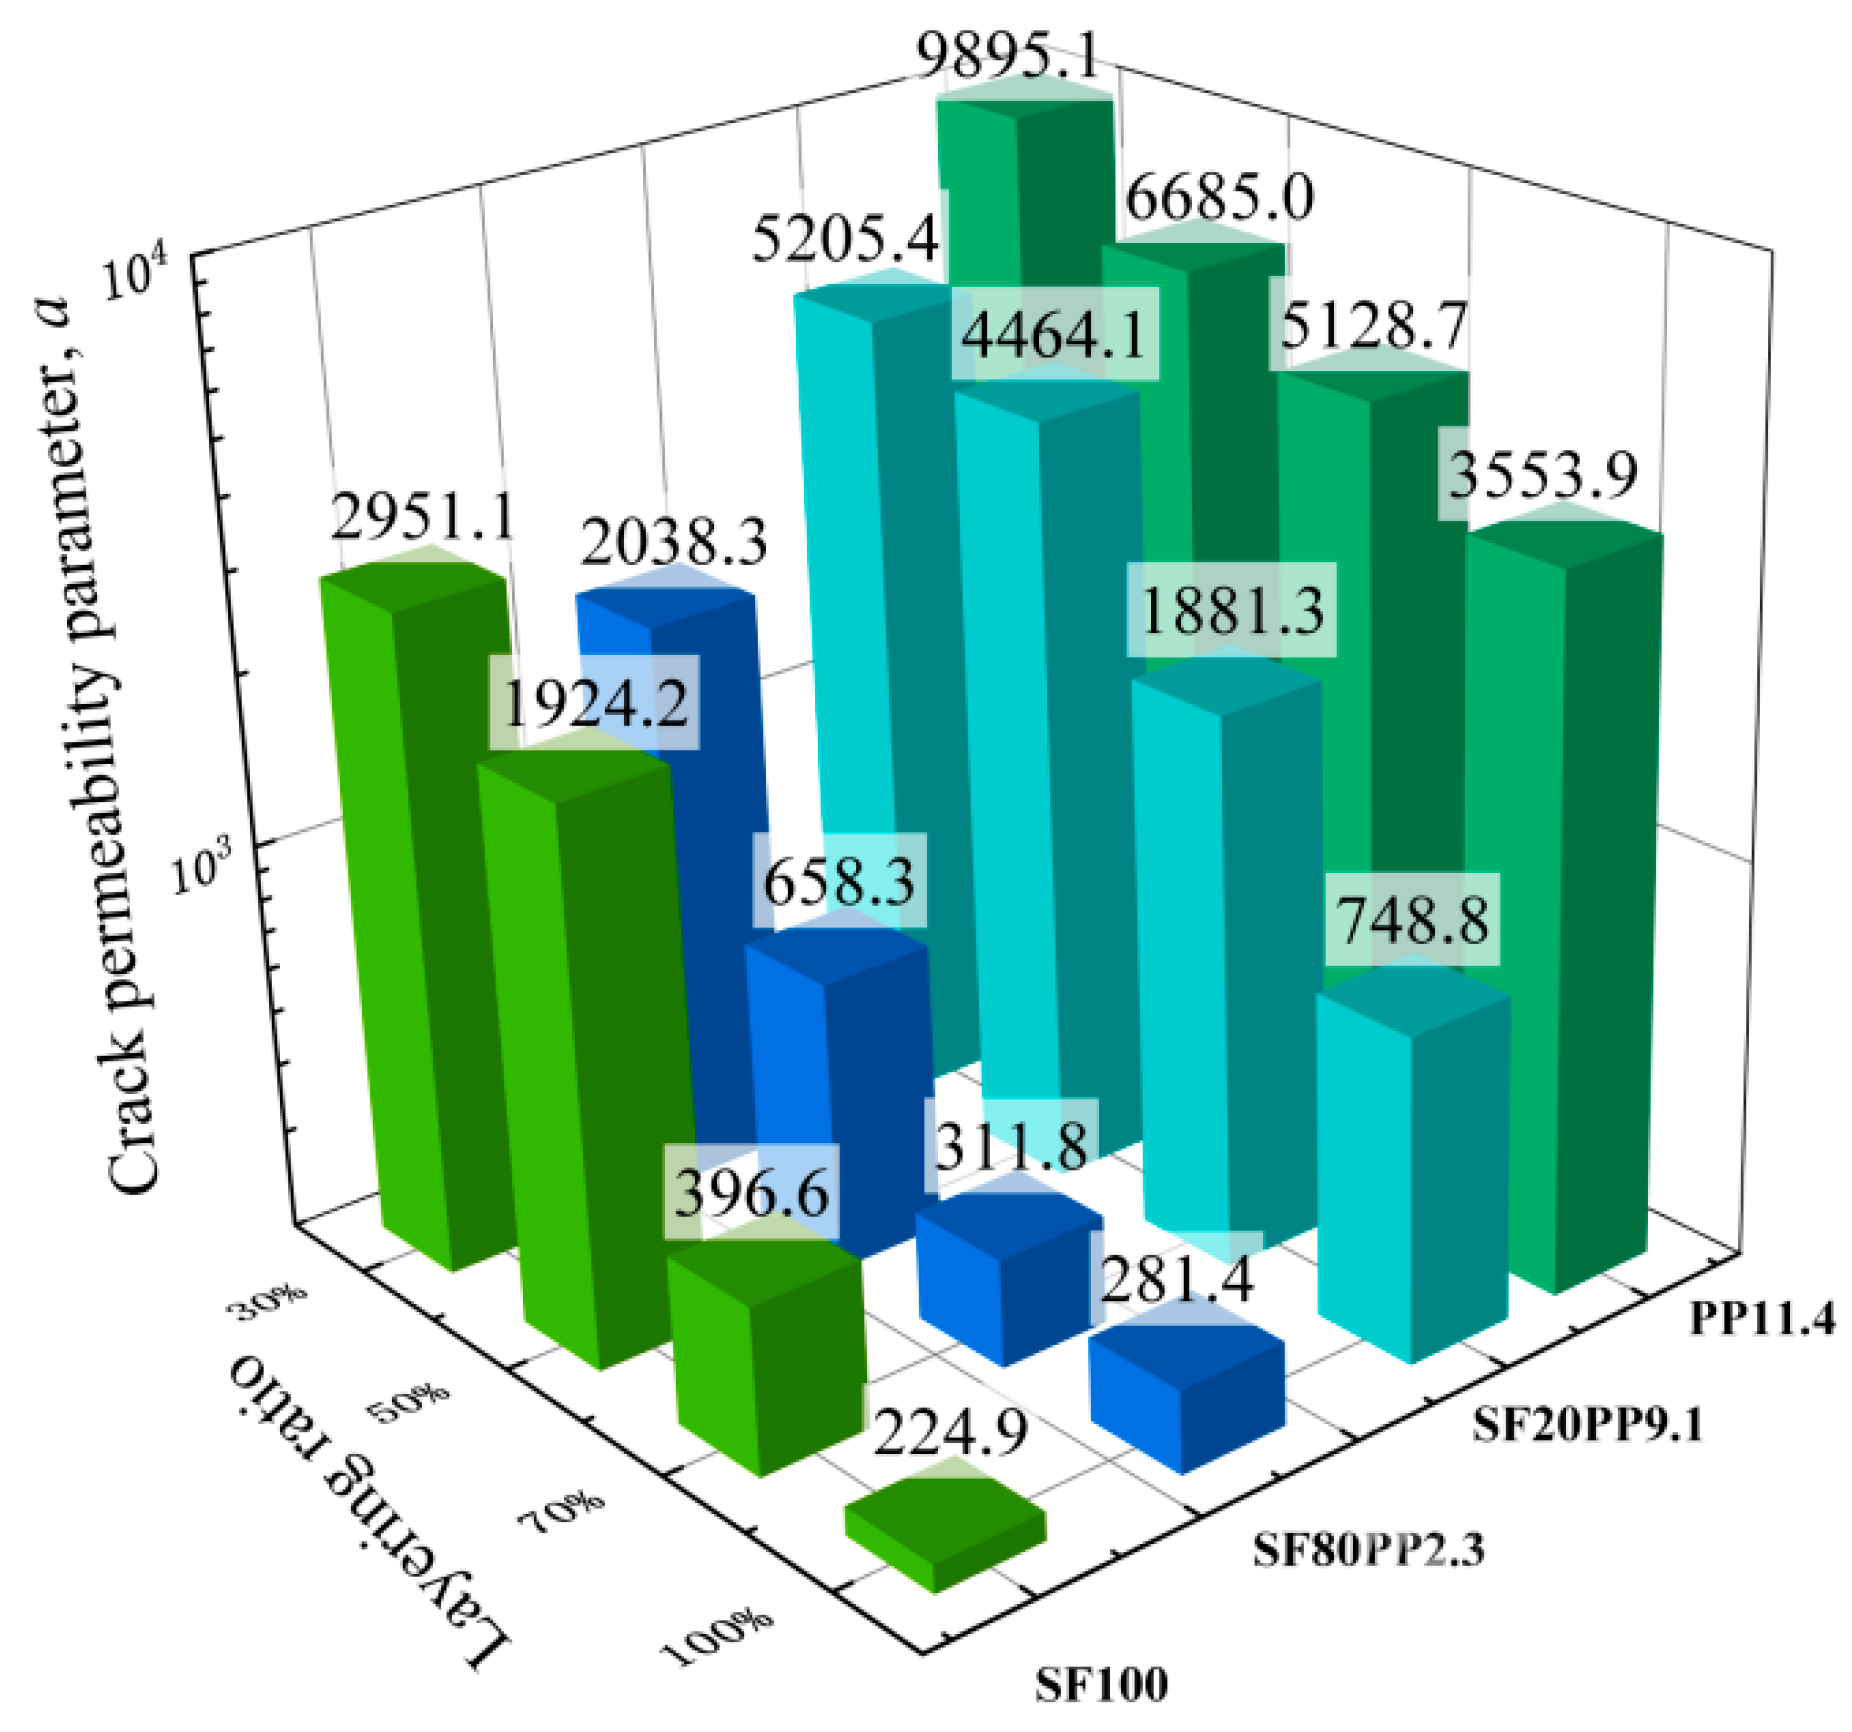
- i.
- For unlayered FRC specimens (the layering ratio is 100%), the crack permeability parameter α follows the order: SF100-100% < SF80PP2.3-100% < SF20PP9.1-100% < PP11.4-100%. The crack permeability parameter α value of SF100-100% is the smallest, and this indicates that the crack impermeability of SF100-100% is the best. Compared to SF100-100%, the crack permeability parameter α of PP11.4-100%, SF20PP9.1-100%, and SF80PP2.3-100% increased by about 1480.2%, 232.9%, and 25.1%, respectively. This reveals that for specimens with the same fiber volume, an increase in the proportion of steel fiber in macro fibers enhances crack impermeability.
- ii.
- When the layering ratio of layered FRC specimens is 70%, the crack permeability parameter α follows the order: SF80PP2.3-70% < SF100-70% < SF20PP9.1-70% < PP11.4-70%. The crack impermeability of SF80PP2.3-70% is the best. Compared to SF80PP2.3-70%, the crack permeability parameter α of SF100-70%, SF20PP9.1-70%, and PP11.4-70% increased by about 27.2%, 503.4%, and 1544.9%, respectively.
- iii.
- When the layering ratio of layered FRC specimens is 50%, the crack permeability parameter α follows the order: SF80PP2.3-50% < SF100-50% < SF20PP9.1-50% < PP11.4-50%. The crack impermeability of SF80PP2.3-50% is the best. Compared to SF80PP2.3-50%, the crack permeability parameter α for SF100-50%, SF20PP9.1-50%, and PP11.4-50% increased by about 192.3%, 578.1%, and 915.5%, respectively. The difference in the crack permeability parameter α between SF80PP2.3-50% and SF100-50% becomes obvious.
- iv.
- When the layering ratio of layered FRC specimens is 30%, the crack permeability parameter α follows the order: SF80PP2.3-30% < SF100-30% < SF20PP9.1-30% < PP11.4-30%. Among these layered FRC specimens, the crack impermeability of SF80PP2.3-30% is the best. Compared to SF80PP2.3-30%, the crack permeability parameter α of SF100-30%, SF20PP9.1-30%, and PP11.4-30% increased 44.8%, 155.4%, and 385.5%, respectively. Compared to layered FRC specimens with a 50% layering ratio, the gap in the crack permeability parameter α between SF80PP2.3-30% and other samples with a 30% layering ratio becomes small.
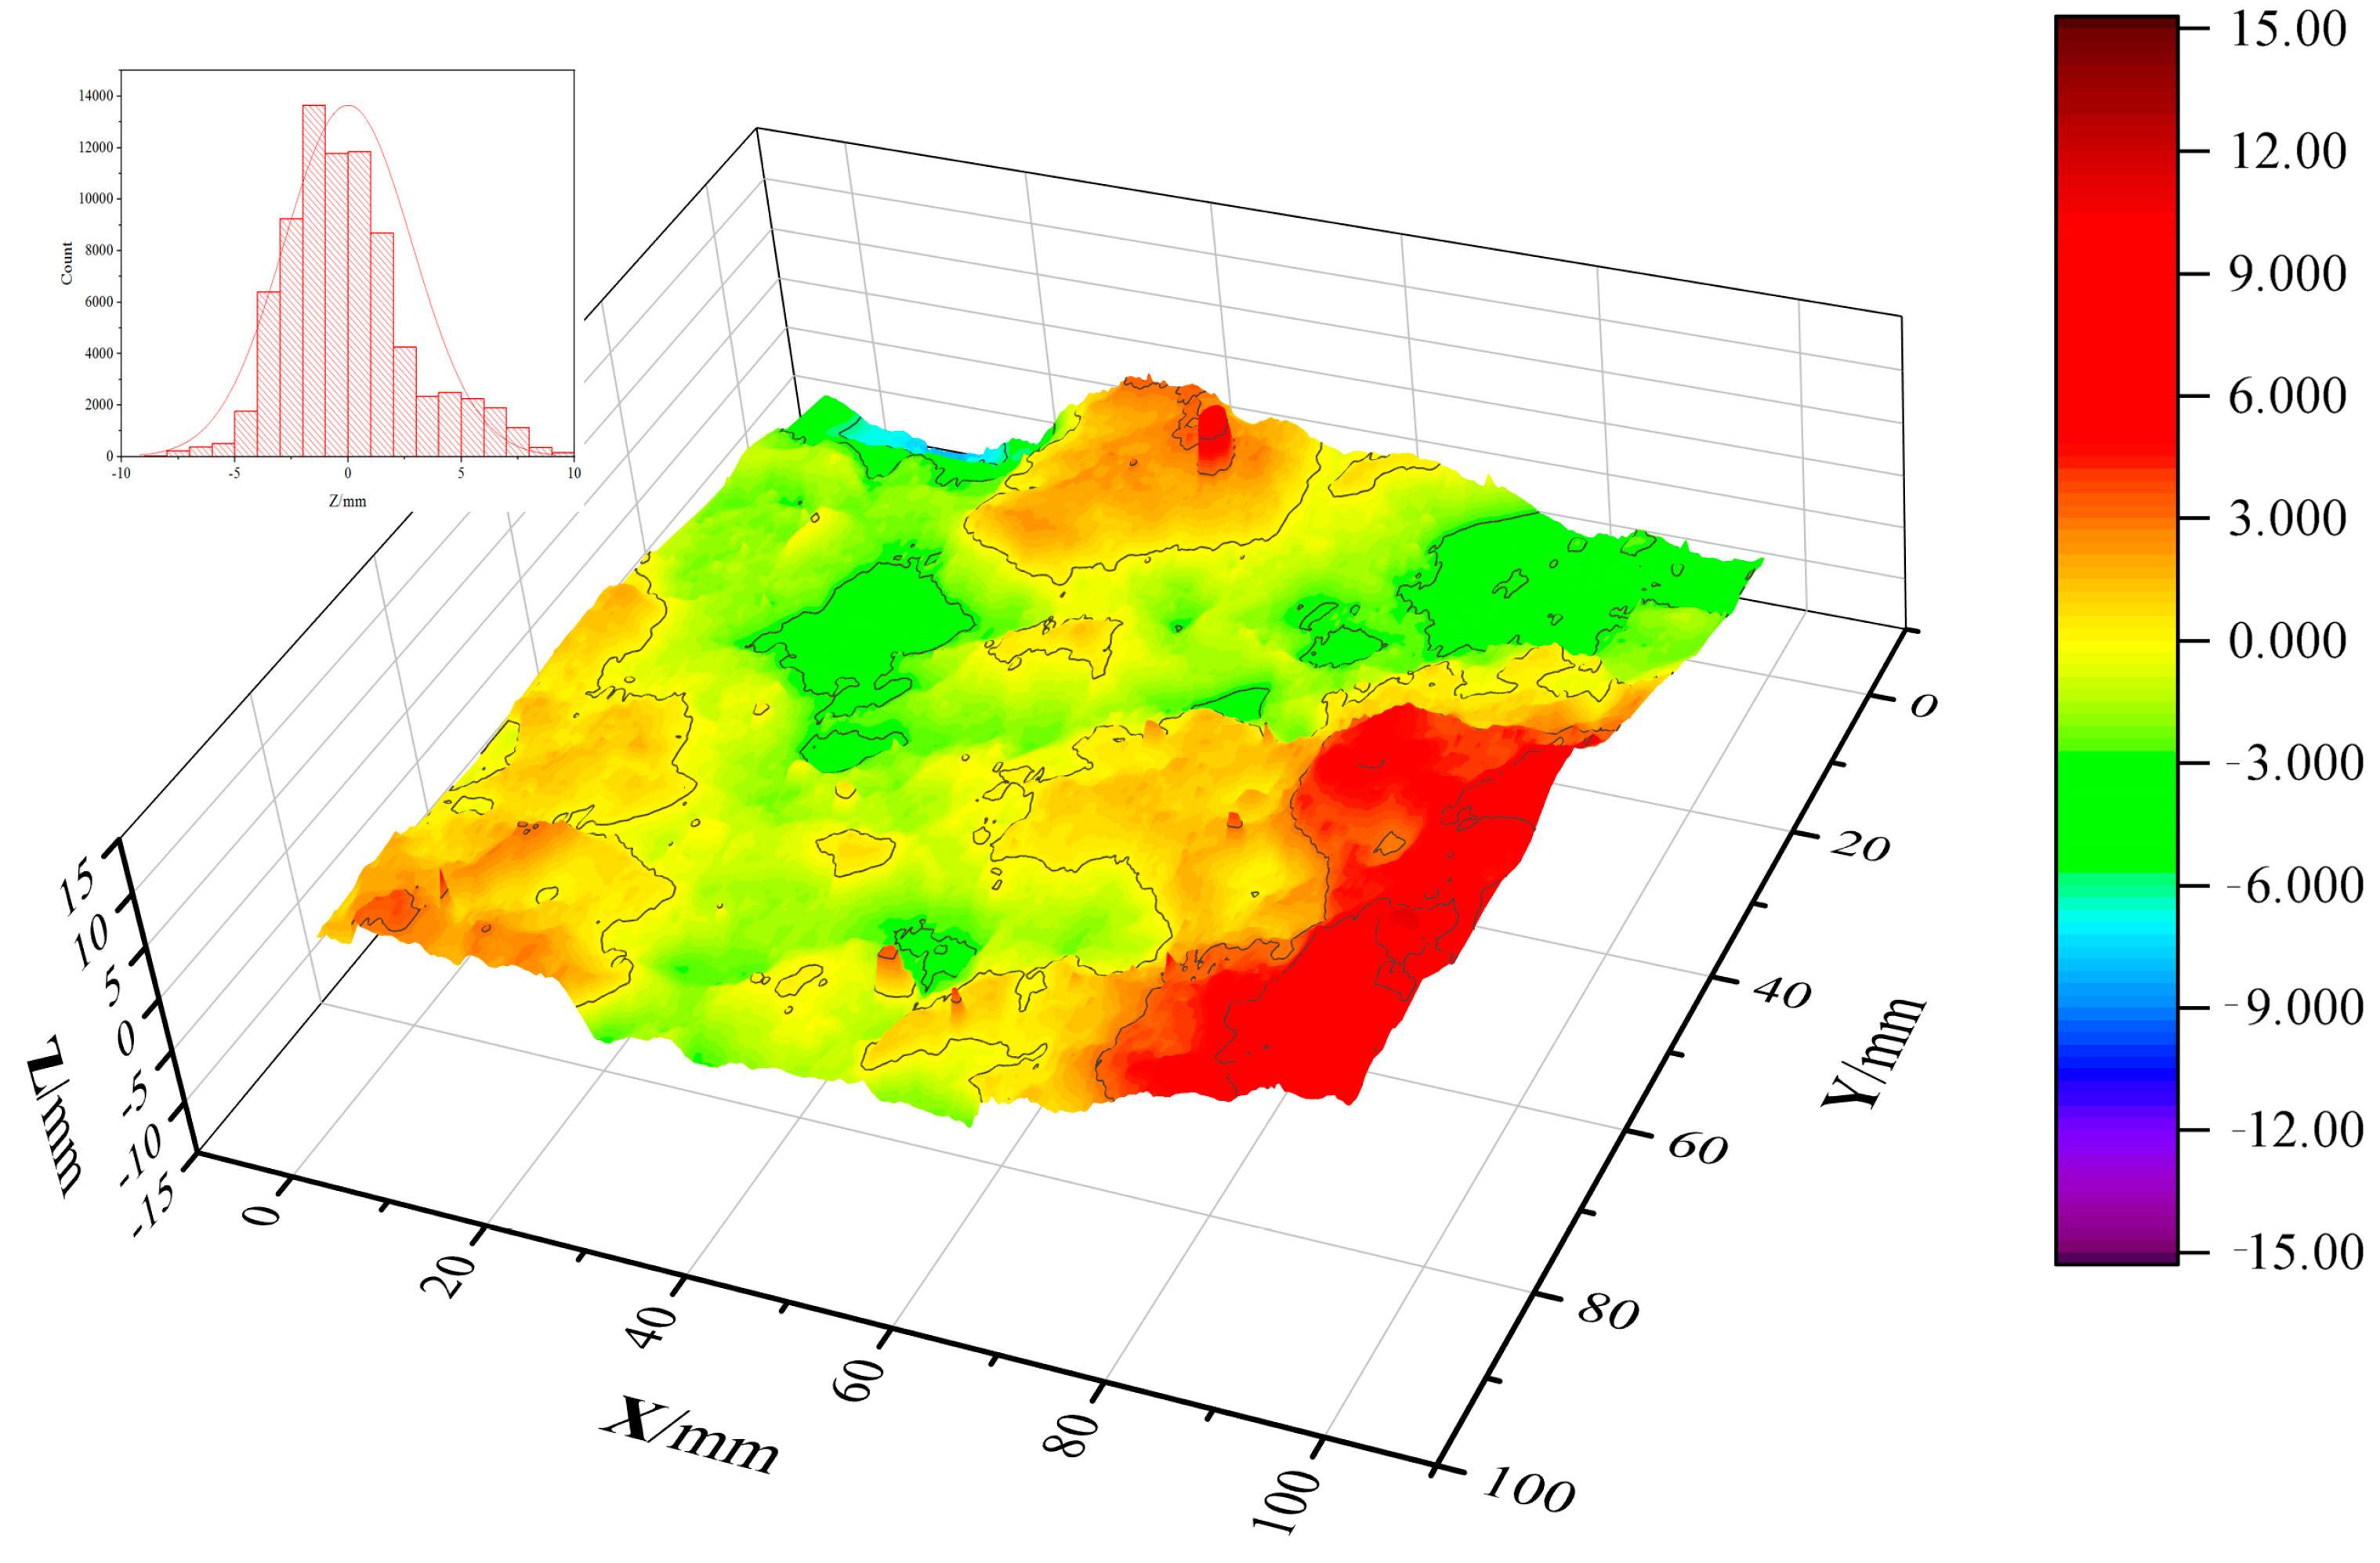
3.3. Crack Surface Roughness
- i.
- Compared to the layered FRC specimens, the crack surface roughness parameter Rn of the NC specimen is the lowest. This correlates with its highest crack permeability parameter α and the lowest crack impermeability among all specimens.
- ii.
- For unlayered FRC specimens with the same volume content of fiber, the higher the proportion of steel fiber in macro fibers, the higher the Rn of the entire crack surface. It means that the crack with a high Rn is rough. For example, the Rn values of the entire crack surfaces of NC, SF100, PP11.4, SF80PP2.3, and SF20PP9.1 specimens are 1.232, 2.108, 1.796, 2.016, and 1.902, respectively. The SF100 specimen has the highest Rn value of the entire crack surface. Compared to NC specimens, the Rn of SF100, PP11.4, SF80PP2.3, and SF20PP9.1 specimens increased by about 71.1%, 45.8%, 63.6%, and 54.4%, respectively.
- i.
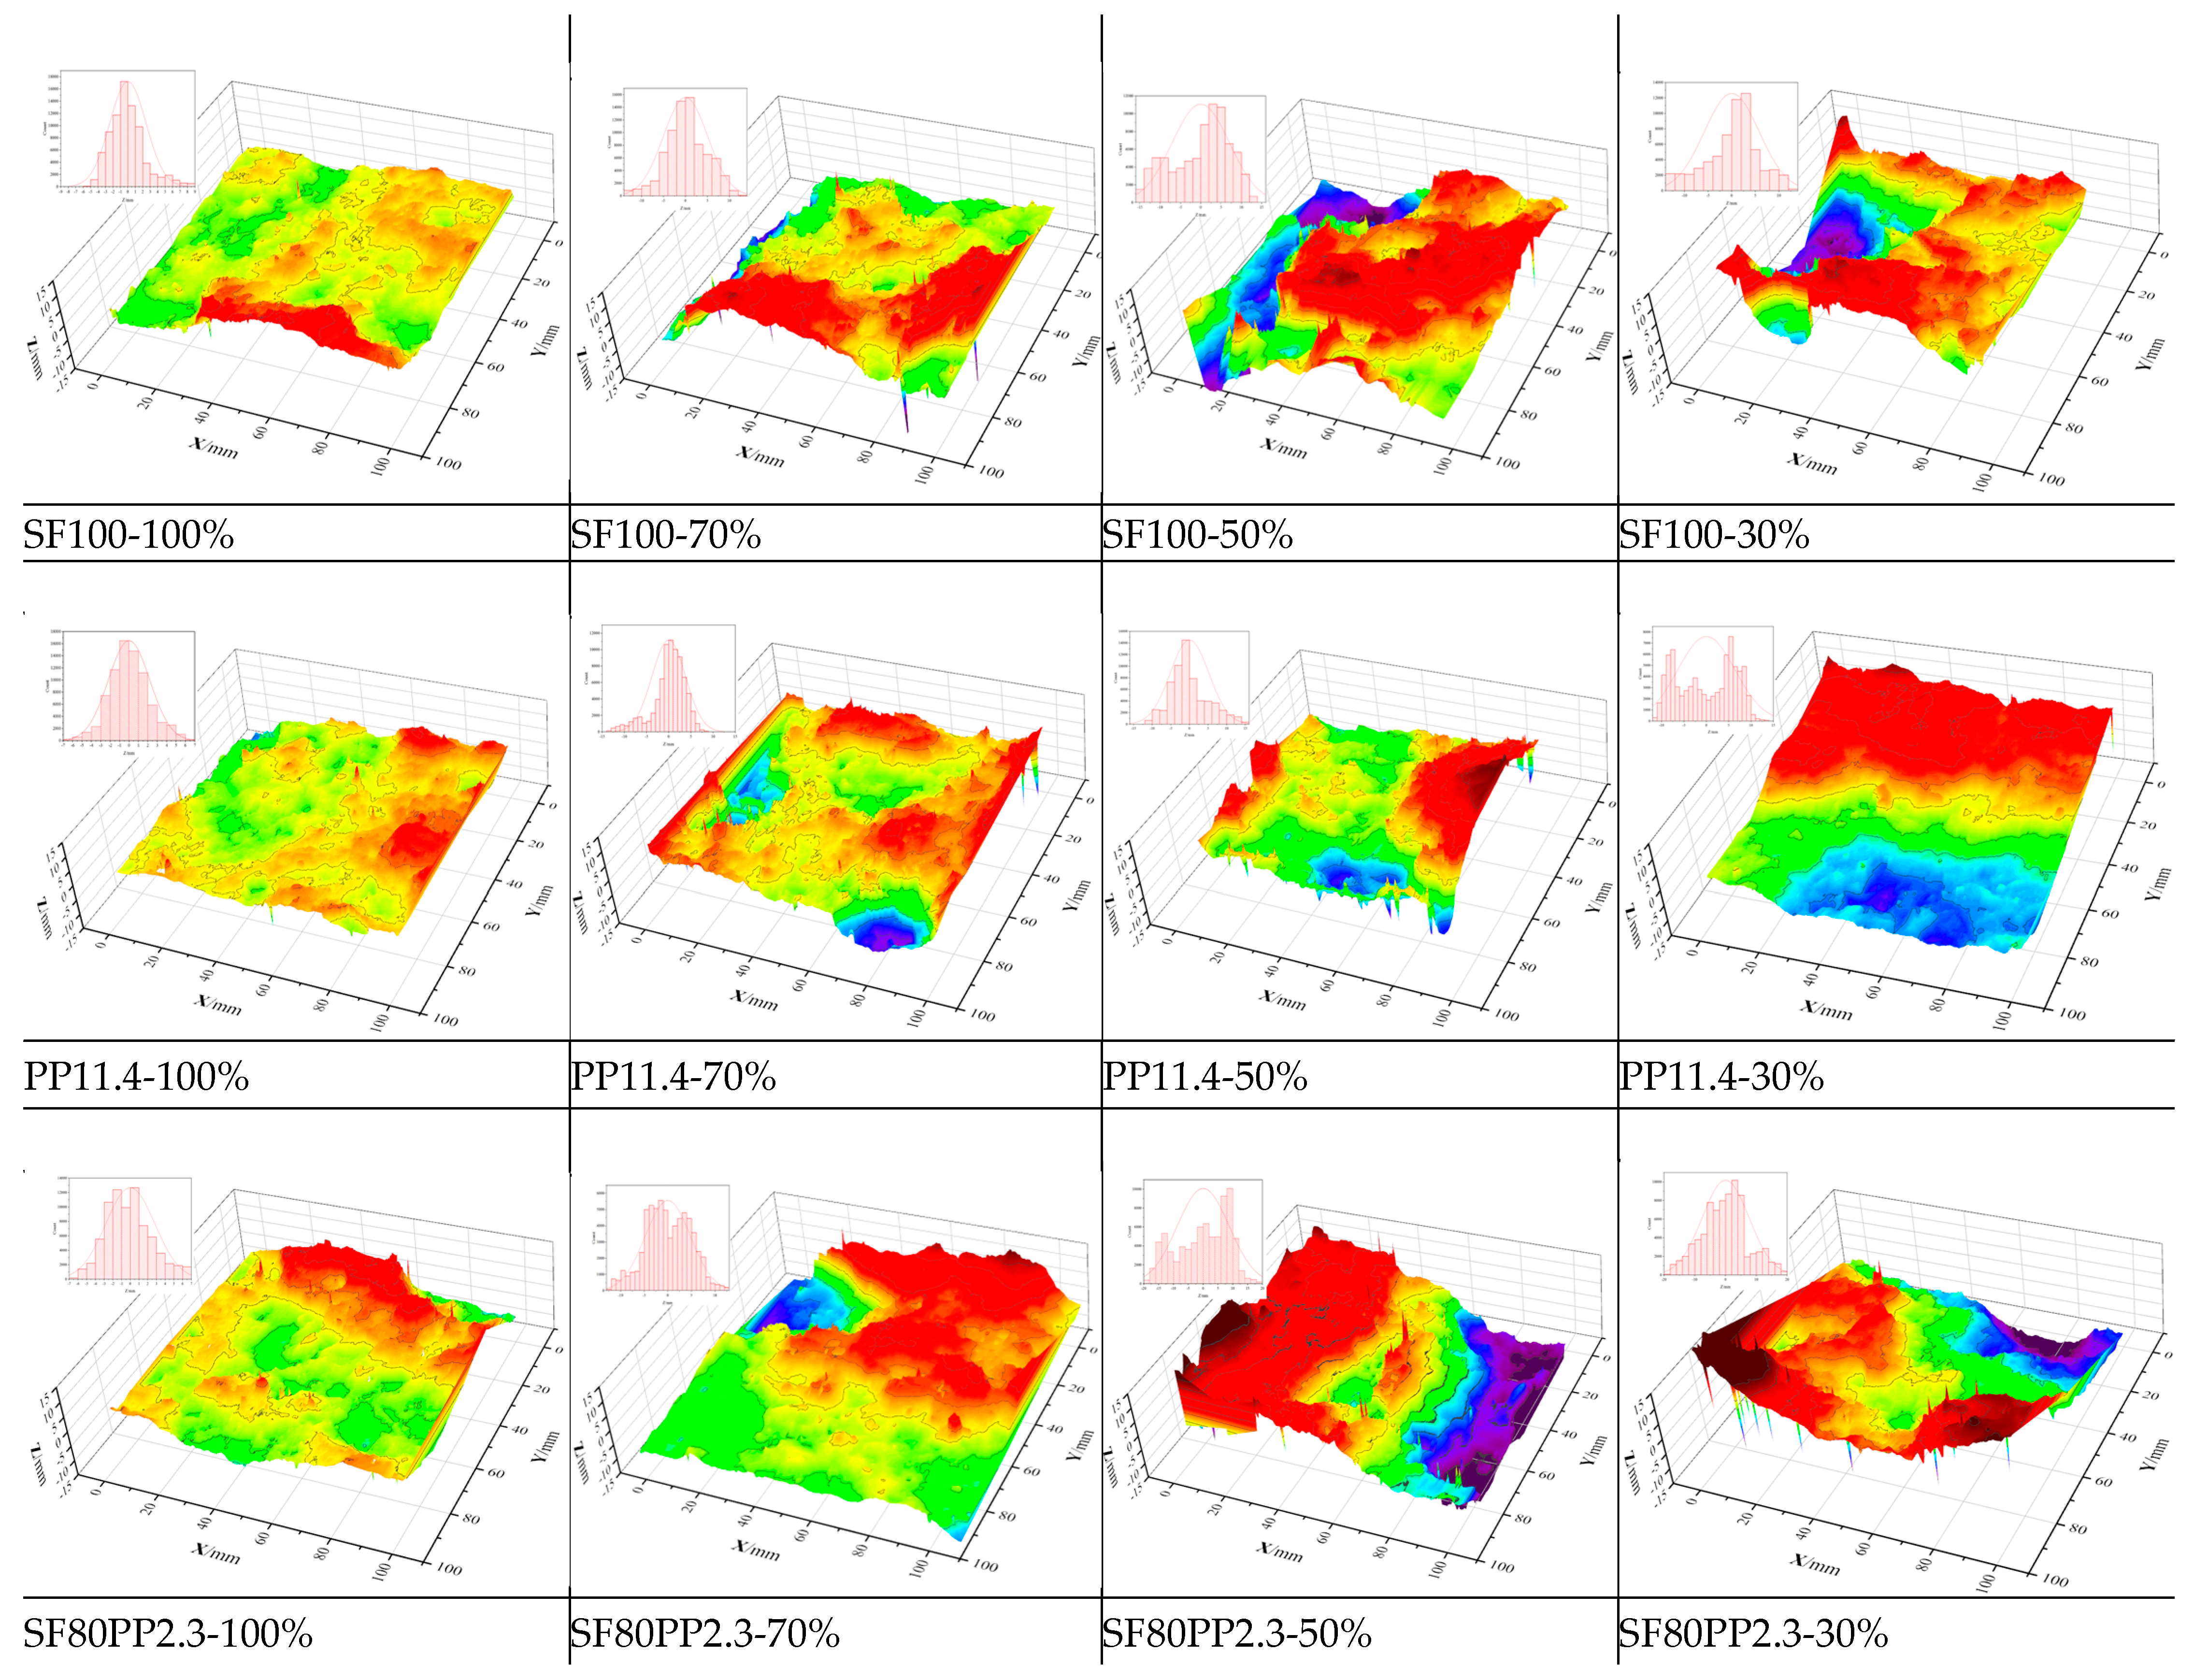
- Compared to unlayered FRC specimens, the FRC layer in layered FRC specimens shows a rough crack surface. For instance, compared to the unlayered FRC specimens with the same fiber type and fiber content, when the layering ratio of layered FRC specimens is 70%, the crack surface Rn of SF100-70%, PP11.4-70%, SF80PP2.3-70%, and SF20PP9.1-70% increased 1.4%, 0.6%, 2.8%, and -0.4% (decreased by 0.4%), respectively. When the layering ratio of layered FRC specimens is 30%, the crack surface Rn of the FRC layers of SF100-30%, PP11.4-30%, SF80PP2.3-30%, and SF20PP9.1-30% increased by 2.9%, 3.7%, 5.8%, and 1.6%, respectively. When the layering ratio of layered FRC specimens decreases from 70% to 30%, the crack surface Rn of the FRC layer of layered FRC specimens increases. The increment in crack surface Rn of the FRC layer is related to the close arrangement of the two-dimensional randomly distributed fibers in the FRC layer. The thicker the FRC layer of layered FRC specimens is, the closer the distribution of fiber in the FRC layer is to the two-dimensional distribution. It leads to many fibers in the FRC layer being distributed along the direction of stress on the specimen. Many fibers can bridge the cracked surfaces and increase the roughness of the crack surface in the FRC layer of the layered concrete.
- ii.
- Among the layered FRC specimens, the SF80PP2.3 specimen with the different layering ratios shows the most significant increment in crack surface Rn of the FRC layer compared to that of unlayered FRC specimens. This explains the phenomenon described in Section 3.2: “that the SF80PP2.3 specimen with hybrid fibers has the higher crack impermeability compared to other FRC specimens”. Due to the specific proportions of hybrid fibers and the different elastic moduli of steel fibers and polypropylene fibers in the SF80PP2.3 specimen, it may cause a rougher crack surface than other FRC specimens [37]. Consequently, this contributes to its pronounced impermeability performance.
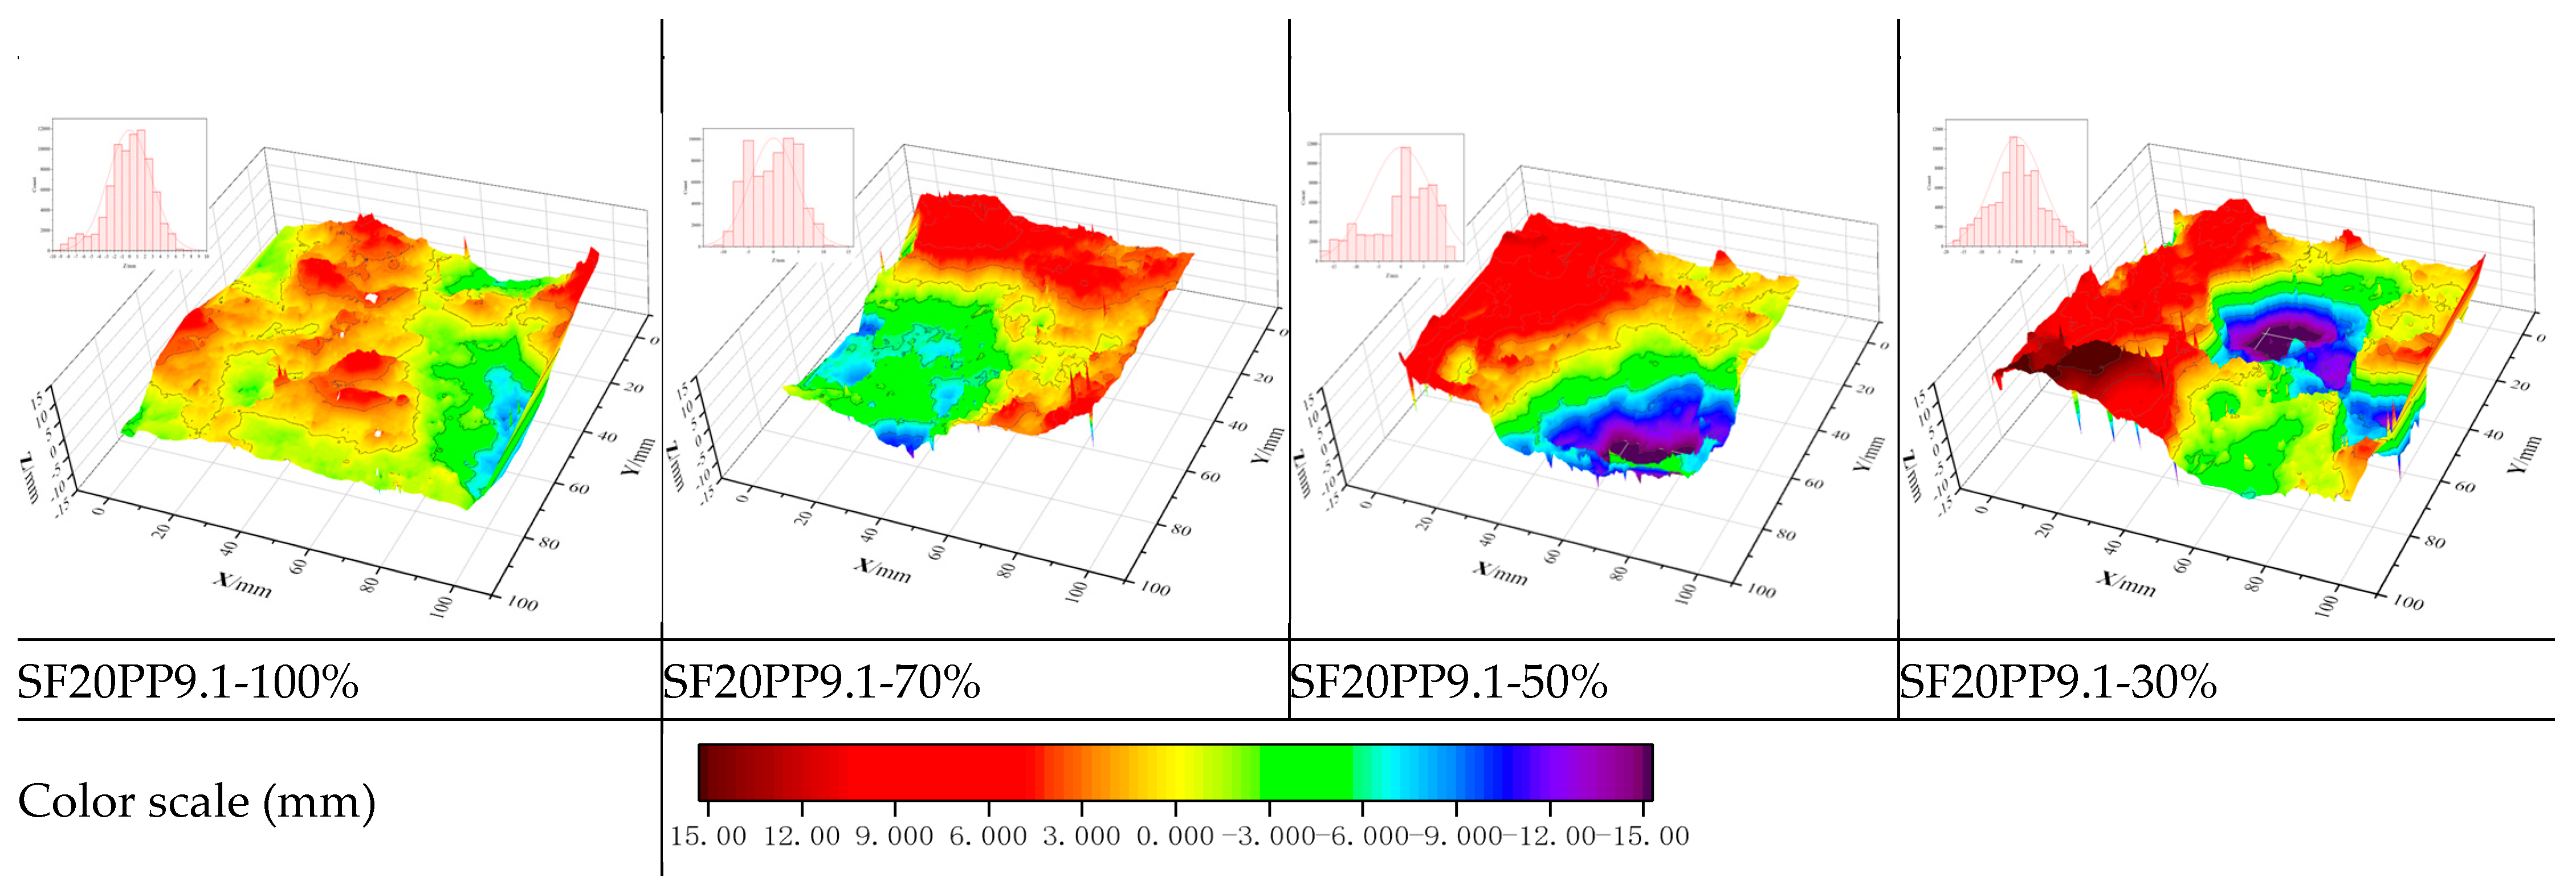
3.4. Crack Topography of the Layered FRC Specimen
4. Conclusions
- Under uniaxial tensile load, when the fiber volume content of FRC is equal, the tensile toughness of FRC is determined by the steel fiber proportion in macro fibers. The higher the proportion of steel fiber in macro fibers, the greater the average bearing capacity of FRC. The order of average bearing capacities for layered FRC specimens with the same layering ratio is: SF100 > SF80PP2.3 > SF20PP9.1 > PP11.4.
- For layered FRC specimens, the crack permeability is much lower than that of the NC specimen. The SF80PP2.3 specimen demonstrates significantly good crack impermeability compared to mono FRC specimens (SF100 specimen and PP11.4 specimen). A significant positive synergistic effect on crack impermeability can be achieved by the combination of steel fiber and polypropylene fiber in the SF80PP2.3 specimen.
- With the decreasing layering ratio, the crack surface Rn of layered FRC specimens gradually decreases. The crack surface Rn of the NC layer of layered FRC specimens (from 1.234 to 1.669) is all higher than that of the NC specimen (1.232), and it increases with the increase in both the layering ratio and the steel fiber proportion in macro fibers in the layered FRC specimens.
- The crack surfaces in the FRC layer of layered FRC specimens (Rn from 1.806 to 2.170) are rougher than the crack surfaces in unlayered FRC specimens (Rn from 1.796 to 2.108). With the decreasing layering ratio, the roughness of crack surfaces in the FRC layer of layered FRC specimens increases.
Author Contributions
Funding
Institutional Review Board Statement
Informed Consent Statement
Data Availability Statement
Conflicts of Interest
References
- Singla, A.; Šavija, B.; Sluys, L.J.; Rodríguez, C.R. Modelling of capillary water absorption in sound and cracked concrete using a dual-lattice approach: Computational aspects. Constr. Build. Mater. 2022, 320, 125826. [Google Scholar] [CrossRef]
- Mengel, L.; Krauss, H.-W.; Lowke, D. Water transport through cracks in plain and reinforced concrete—Influencing factors and open questions. Constr. Build. Mater. 2020, 254, 118990. [Google Scholar] [CrossRef]
- Kapicová, A.; Bílý, P.; Fládr, J.; Šeps, K.; Chylík, R.; Trtík, T. Development of sound-absorbing pervious concrete for interior applications. J. Build. Eng. 2024, 85, 108697. [Google Scholar] [CrossRef]
- Zeng, W.; Zhao, X.; Zou, B.; Chen, C. Topographical characterization and permeability correlation of steel fiber reinforced concrete surface under freeze-thaw cycles and NaCl solution immersion. J. Build. Eng. 2023, 80, 108042. [Google Scholar] [CrossRef]
- Lee, J.; Babadagli, T. Effect of roughness on fluid flow and solute transport in a single fracture: A review of recent developments, current trends, and future research. J. Nat. Gas Sci. Eng. 2021, 91, 103971. [Google Scholar] [CrossRef]
- Lee, S.C.; Cho, J.Y.; Vecchio, F.J. Tension-stiffening model for steel fiber-reinforced concrete containing conventional rein-forcement. Aci Struct. J. 2013, 110, 639–648. [Google Scholar]
- Weerheijm, J.; Reinhardt, H. Device for testing concrete under impact tensile loading and lateral compression. Nucl. Eng. Des. 1991, 126, 395–401. [Google Scholar] [CrossRef]
- Jackowski, M.; Małek, M. A multi-site study of a new cement composite brick with partial cement substitutes and waste materials. Case Stud. Constr. Mater. 2023, 18, e01992. [Google Scholar] [CrossRef]
- Spiegel, L.; Limbrunner, G.F. Reinforced Concrete Design, 5th ed; Prentice-Hall: Upper Saddle River, NJ, USA, 2003. [Google Scholar]
- Structural Concrete Textbook on Behaviour, Design and Performance, Second Edition Volume 2: Basis of Design; Fib Bulletin 52; Document Competence Center Siegmar Kastl e.K: Ostfildern, Germany, 2010.
- Nilson, A.H.; Darwin, D.; Dolan, C. Design of Concrete Structures; McGraw Hill: New York, NY, USA, 2010. [Google Scholar]
- Fib. Fib Model Code for Concrete Structures 2010; Wiley-VCH Verlag Gmbh & Co. KGaA: Hoboken, NJ, USA, 2013. [Google Scholar]
- Rastiello, G.; Boulay, C.; Pont, S.D.; Tailhan, J.; Rossi, P. Real-time water permeability evolution of a localized crack in concrete under loading. Cem. Concr. Res. 2014, 56, 20–28. [Google Scholar] [CrossRef]
- Akhavan, A.; Shafaatian, S.-M.-H.; Rajabipour, F. Quantifying the effects of crack width, tortuosity, and roughness on water permeability of cracked mortars. Cem. Concr. Res. 2012, 42, 313–320. [Google Scholar] [CrossRef]
- Hosseinzadeh, H.; Salehi, A.M.; Mehraein, M.; Asadollahfardi, G. The effects of steel, polypropylene, and high-performance macro polypropylene fibers on mechanical properties and durability of high-strength concrete. Constr. Build. Mater. 2023, 386, 131589. [Google Scholar] [CrossRef]
- Ding, Y.; Li, D.; Zhang, Y. Quantitative analysis of macro steel fiber influence on crack geometry and water permeability of concrete. Compos. Struct. 2018, 187, 325–335. [Google Scholar] [CrossRef]
- Zeng, W.; Wang, W.; Pan, J.; Liu, G. Effect of steel fiber on the permeability of freeze-thaw damaged concrete under splitting tensile and compressive loads. J. Build. Eng. 2023, 80, 108086. [Google Scholar] [CrossRef]
- Lauch, K.-S.; Desmettre, C.; Charron, J.-P. New water permeability set-up and factors affecting concrete self-healing. Constr. Build. Mater. 2021, 294, 123595. [Google Scholar] [CrossRef]
- JGJ/T 283-2012; Technical Specification for Application of Self-Compacting Concrete. China Construction Industry Press: Beijing, China, 2012.
- Kalifa, P.; Menneteau, F.-D.; Quenard, D. Spalling and pore pressure in HPC at high temperatures. Cem. Concr. Res. 2000, 30, 1915–1927. [Google Scholar] [CrossRef]
- Ahmed, S.; Hussain, A.; Hussain, Z.; Pu, Z.; Ostrowski, K.A.; Walczak, R. Effect of Carbon Black and Hybrid Steel-Polypropylene Fiber on the Mechanical and Self-Sensing Characteristics of Concrete Considering Different Coarse Aggregates’ Sizes. Materials 2021, 14, 7455. [Google Scholar] [CrossRef] [PubMed]
- Elmoaty, A.E.M.A.; Morsy, A.M.; Harraz, A.B. Effect of Fiber Type and Volume Fraction on Fiber Reinforced Concrete and Engineered Cementitious Composite Mechanical Properties. Buildings 2022, 12, 2108. [Google Scholar] [CrossRef]
- Aslani, F.; Hamidi, F.; Valizadeh, A.; Dang, A.T.-N. High-performance fibre-reinforced heavyweight self-compacting concrete: Analysis of fresh and mechanical properties. Constr. Build. Mater. 2020, 232, 117230. [Google Scholar] [CrossRef]
- Nahhab, A.H.; Ketab, A.K. Influence of content and maximum size of light expanded clay aggregate on the fresh, strength, and durability properties of self-compacting lightweight concrete reinforced with micro steel fibers. Constr. Build. Mater. 2020, 233, 117922. [Google Scholar] [CrossRef]
- Lawler, J.S.; Zampini, D.; Shah, S.P. Permeability of Cracked Hybrid Fiber-Reinforced Mortar under Load. ACI Mater. J. 2002, 99, 379–385. [Google Scholar]
- Wagner, C.; Villmann, B.; Slowik, V.; Mechtcherine, V. Water permeability of cracked strain-hardening cement-based composites. Cem. Concr. Compos. 2017, 82, 234–241. [Google Scholar] [CrossRef]
- Ficker, T.; Martišek, D. Digital fracture surfaces and their roughness analysis: Applications to cement-based materials. Cem. Concr. Res. 2012, 42, 827–833. [Google Scholar] [CrossRef]
- Yi, S.-T.; Hyun, T.-Y.; Kim, J.-K. The effects of hydraulic pressure and crack width on water permeability of penetration crack-induced concrete. Constr. Build. Mater. 2011, 25, 2576–2583. [Google Scholar] [CrossRef]
- Picandet, V.; Khelidj, A.; Bellegou, H. Crack effects on gas and water permeability of concretes. Cem. Concr. Res. 2009, 39, 537–547. [Google Scholar] [CrossRef]
- CECS13-2009; Standard Test Methods for Fiber Reinforced Concrete. China Construction Industry Press: Beijing, China, 2009.
- Erdem, S.; Blankson, M.A. Fractal–fracture analysis and characterization of impact-fractured surfaces in different types of con-crete using digital image analysis and 3D nanomap laser profilometery. Constr. Build. Mater. 2013, 40, 70–76. [Google Scholar] [CrossRef]
- Xin, Y.; Hsia, K.J.; Lange, D.A. Quantitative Characterization of the Fracture Surface of Si Single Crystals by Confocal Microscopy. J. Am. Ceram. Soc. 2010, 78, 3201–3208. [Google Scholar] [CrossRef]
- Ficker, T.; Martišek, D.; Jennings, H.M. Roughness of fracture surfaces and compressive strength of hydrated cement pastes. Cem. Concr. Res. 2010, 40, 947–955. [Google Scholar] [CrossRef]
- Apedo, K.; Montgomery, P.; Serres, N.; Fond, C.; Feugeas, F. Geometrical roughness analysis of cement paste surfaces using coherence scanning interferometry and confocal microscopy. Mater. Charact. 2016, 118, 212–224. [Google Scholar] [CrossRef]
- Esmaeili, J.; Andalibi, K.; Gencel, O.; Maleki, F.K.; Maleki, V.A. Pull-out and bond-slip performance of steel fibers with various ends shapes embedded in polymer-modified concrete. Constr. Build. Mater. 2021, 271, 121531. [Google Scholar] [CrossRef]
- Wang, Y.; Aslani, F.; Valizadeh, A. An investigation into the mechanical behaviour of fibre-reinforced geopolymer concrete incorporating NiTi shape memory alloy, steel and polypropylene fibres. Constr. Build. Mater. 2020, 259, 119765. [Google Scholar] [CrossRef]
- Sadowska-Buraczewska, B.; Szafraniec, M.; Barnat-Hunek, D.; Łagód, G. Flexural Behavior of Composite Concrete Slabs Made with Steel and Polypropylene Fibers Reinforced Concrete in the Compression Zone. Materials 2020, 13, 3616. [Google Scholar] [CrossRef] [PubMed]
- Al-Ameeri, A.S.; Rafiq, M.I.; Tsioulou, O. Combined impact of carbonation and crack width on the Chloride Penetration and Corrosion Resistance of Concrete Structures. Cem. Concr. Compos. 2020, 115, 103819. [Google Scholar] [CrossRef]


| Cement (kg/m3) | Fly Ash (kg/m3) | Fine Aggregate (kg/m3) | Coarse Aggregate (kg/m3) | Water (kg/m3) | Superplasticizer (kg/m3) |
|---|---|---|---|---|---|
| 390 | 155 | 822 | 848 | 272.5 | 8.0 |
| Fiber Type | Density (kg/m3) | Length (mm) | Diameter (mm) | Tensile Strength (MPa) | Elastic Modulus (GPa) | Number per Kilogram (piece/kg) | Number per Cubic Meter (piece/m3) |
|---|---|---|---|---|---|---|---|
| Polypropylene fiber | 910 | 45 | 0.75 | 490 | 3.9 | 5.76 × 10⁴ | 5.24 × 10⁷ |
| Steel fiber | 7800 | 35 | 0.55 | 1150 | 200 | 1.45 × 10⁴ | 1.13 × 10⁸ |
| Mixture ID | Steel Fiber | Polypropylene Fiber | Slump (mm) | Air Content (%) |
|---|---|---|---|---|
| SF100 | 100 kg/m3 (1.25 vol.%) | -- | 110 | 4.1 |
| PP11.4 | -- | 11.4 kg/m3 (1.25 vol.%) | 156 | 3.0 |
| SF80PP2.3 | 80 kg/m3 (1.0 vol.%) | 2.3 kg/m3 (0.25 vol.%) | 128 | 4.0 |
| SF20PP9.1 | 20 kg/m3 (0.25 vol.%) | 9.1 kg/m3 (1.0 vol.%) | 140 | 3.1 |
| Sample | FP | P0.16 | F0.16 | P0.33 | F0.33 |
|---|---|---|---|---|---|
| (kN) | (kN) | (kN) | (kN) | (kN) | |
| NC | 34.9 | -- | -- | -- | -- |
| SF100-100% | 39.6 | 35.1 | 31.8 | 32.2 | 33.0 |
| SF100-70% | 34.3 | 31.7 | 28.8 | 30.1 | 29.9 |
| SF100-50% | 38.5 | 22.3 | 23.6 | 25.3 | 23.6 |
| SF100-30% | 37.0 | 11.3 | 13.2 | 12.3 | 12.7 |
| PP11.4-100% | 24.6 | 19.7 | 19.6 | 15.1 | 18.3 |
| PP11.4-70% | 28.5 | 15.0 | 15.6 | 14.4 | 15.0 |
| PP11.4-50% | 31.2 | 7.3 | 9 | 8.0 | 8.4 |
| PP11.4-30% | 29.1 | 1.2 | 2.4 | 1.2 | 2.5 |
| SF80PP2.3-100% | 36.5 | 30.4 | 26.4 | 31.3 | 29.0 |
| SF80PP2.3-70% | 29.5 | 25.8 | 23.6 | 23.8 | 24.0 |
| SF80PP2.3-50% | 31.8 | 22.1 | 21 | 18.6 | 20.5 |
| SF80PP2.3-30% | 37.4 | 12.5 | 13.8 | 8.7 | 11.9 |
| SF20PP9.1-100% | 32.9 | 27.5 | 25.6 | 22.1 | 24.6 |
| SF20PP9.1-70% | 28.0 | 24.6 | 23.8 | 15.7 | 21.2 |
| SF20PP9.1-50% | 32.1 | 17.1 | 16.2 | 16.7 | 16.7 |
| SF20PP9.1-30% | 32.5 | 4.6 | 6.8 | 5.0 | 5.8 |
| Sample | Decrease Rate | ||||
|---|---|---|---|---|---|
| FP | P0.16 | F0.16 | P0.33 | F0.33 | |
| SF100-100% | -- | -- | -- | -- | -- |
| SF100-70% | 13.4% | 9.7% | 9.4% | 6.5% | 9.4% |
| SF100-50% | −12.2% | 29.7% | 18.1% | 15.9% | 21.1% |
| SF100-30% | 3.9% | 49.3% | 44.1% | 51.4% | 46.2% |
| PP11.4-100% | -- | -- | -- | -- | -- |
| PP11.4-70% | −15.9% | 23.9% | 20.4% | 4.6% | 18.0% |
| PP11.4-50% | −9.5% | 51.3% | 42.3% | 44.4% | 44.0% |
| PP11.4-30% | 6.7% | 83.6% | 73.3% | 85.0% | 70.2% |
| SF80PP2.3-100% | -- | -- | -- | -- | -- |
| SF80PP2.3-70% | 19.2% | 15.1% | 10.6% | 24.0% | 17.2% |
| SF80PP2.3-50% | −7.8% | 14.3% | 11.0% | 21.8% | 14.6% |
| SF80PP2.3-30% | −17.6% | 43.4% | 34.3% | 53.2% | 42.0% |
| SF20PP9.1-100% | -- | -- | -- | -- | -- |
| SF20PP9.1-70% | 14.9% | 10.5% | 7.0% | 29.0% | 13.8% |
| SF20PP9.1-50% | −14.6% | 30.5% | 31.9% | −6.4% | 21.2% |
| SF20PP9.1-30% | −1.2% | 73.1% | 58.0% | 70.1% | 65.3% |
| Sample | Crack Permeability (m2) | ||
|---|---|---|---|
| κc-100 | κc-200 | κc-300 | |
| NC | 2.52 × 10⁻¹⁰ | 1.75 × 10⁻⁹ | 5.15 × 10⁻⁹ |
| SF100-100% | 4.24 × 10⁻¹² | 3.17 × 10⁻¹¹ | 1.00 × 10⁻¹⁰ |
| SF100-70% | 8.58 × 10⁻¹² | 5.68 × 10⁻¹¹ | 1.66 × 10⁻¹⁰ |
| SF100-50% | 4.08 × 10⁻¹¹ | 2.82 × 10⁻¹⁰ | 8.07 × 10⁻¹⁰ |
| SF100-30% | 6.96 × 10⁻¹¹ | 4.16 × 10⁻¹⁰ | 1.28 × 10⁻⁹ |
| PP11.4-100% | 7.40 × 10⁻¹¹ | 5.05 × 10⁻¹⁰ | 1.54 × 10⁻⁹ |
| PP11.4-70% | 8.71 × 10⁻¹¹ | 6.78 × 10⁻¹⁰ | 2.43 × 10⁻⁹ |
| PP11.4-50% | 1.45 × 10⁻¹⁰ | 9.58 × 10⁻¹⁰ | 2.84 × 10⁻⁹ |
| PP11.4-30% | 2.13 × 10⁻¹⁰ | 1.40 × 10⁻⁹ | 4.28 × 10⁻⁹ |
| SF80PP2.3-100% | 6.24 × 10⁻¹² | 3.78 × 10⁻¹¹ | 1.23 × 10⁻¹⁰ |
| SF80PP2.3-70% | 5.91 × 10⁻¹² | 4.57 × 10⁻¹¹ | 1.34 × 10⁻¹⁰ |
| SF80PP2.3-50% | 1.26 × 10⁻¹¹ | 9.32 × 10⁻¹¹ | 2.87 × 10⁻¹⁰ |
| SF80PP2.3-30% | 4.25 × 10⁻¹¹ | 3.17 × 10⁻¹⁰ | 8.41 × 10⁻¹⁰ |
| SF20PP9.1-100% | 1.35 × 10⁻¹¹ | 1.16 × 10⁻¹⁰ | 3.24 × 10⁻¹⁰ |
| SF20PP9.1-70% | 4.55 × 10⁻¹¹ | 3.00 × 10⁻¹⁰ | 9.50 × 10⁻¹⁰ |
| SF20PP9.1-50% | 6.42 × 10⁻¹¹ | 7.01 × 10⁻¹⁰ | 1.83 × 10⁻⁹ |
| SF20PP9.1-30% | 1.10 × 10⁻¹⁰ | 7.07 × 10⁻¹⁰ | 2.28 × 10⁻⁹ |
| Layering Ratio | Crack Permeability Parameter ɑ | ||||
|---|---|---|---|---|---|
| NC | SF100 | PP11.4 | SF80PP2.3 | SF20PP9.1 | |
| 100% | 12,108.3 | 224.9 | 3553.9 | 281.4 | 748.8 |
| 70% | -- | 396.6 | 5128.7 | 311.8 | 1881.3 |
| 50% | -- | 1924.2 | 6685.0 | 658.3 | 4464.1 |
| 30% | -- | 2951.1 | 9895.1 | 2038.3 | 5205.4 |
| Sample | Roughness Parameter of Crack Surface, Rn | ||
|---|---|---|---|
| Rn of NC Layer | Rn of FRC Layer | Rn of Entire Crack Surface | |
| NC | 1.232 | -- | 1.232 |
| SF100-100% | -- | 2.108 | 2.108 |
| SF100-70% | 1.614 | 2.137 | 1.980 |
| SF100-50% | 1.424 | 2.136 | 1.780 |
| SF100-30% | 1.304 | 2.170 | 1.564 |
| PP11.4-100% | -- | 1.796 | 1.796 |
| PP11.4-70% | 1.311 | 1.806 | 1.658 |
| PP11.4-50% | 1.234 | 1.826 | 1.530 |
| PP11.4-30% | 1.242 | 1.862 | 1.428 |
| SF80PP2.3-100% | -- | 2.016 | 2.016 |
| SF80PP2.3-70% | 1.669 | 2.072 | 1.951 |
| SF80PP2.3-50% | 1.535 | 2.062 | 1.799 |
| SF80PP2.3-30% | 1.354 | 2.132 | 1.587 |
| SF20PP9.1-100% | -- | 1.902 | 1.902 |
| SF20PP9.1-70% | 1.461 | 1.895 | 1.765 |
| SF20PP9.1-50% | 1.335 | 1.902 | 1.619 |
| SF20PP9.1-30% | 1.246 | 1.932 | 1.452 |
| Layering Ratio | SF100 | PP11.4 | SF80PP2.3 | SF20PP9.1 |
|---|---|---|---|---|
| 100% | -- | -- | -- | -- |
| 70% | 6.1% | 7.7% | 3.2% | 7.2% |
| 50% | 15.6% | 14.8% | 10.8% | 14.9% |
| 30% | 25.8% | 20.5% | 21.3% | 23.7% |
| Layering Ratio | SF100 | PP11.4 | SF80PP2.3 | SF20PP9.1 |
|---|---|---|---|---|
| 70% | 31.0% | 6.4% | 35.5% | 18.6% |
| 50% | 15.6% | 0.2% | 24.6% | 8.4% |
| 30% | 5.8% | 0.8% | 9.9% | 1.1% |
| Layering Ratio | SF100 | PP11.4 | SF80PP2.3 | SF20PP9.1 |
|---|---|---|---|---|
| 70% | 1.4% | 0.6% | 2.8% | −0.4% |
| 50% | 1.3% | 1.7% | 2.3% | 0.0% |
| 30% | 2.9% | 3.7% | 5.8% | 1.6% |
| Number of Cracks | Width of Single Crack (mm) | Permeability of One Crack (m2) | Permeability of All Cracks (m2) | Percentage Reduction of the Crack Permeability Compared to One Crack of 0.2 mm Width |
|---|---|---|---|---|
| 1 | 0.2 | 3.33 × 10⁻⁹ | 3.33 × 10⁻⁹ | 0 |
| 2 | 0.1 | 8.33 × 10⁻¹⁰ | 1.67 × 10⁻⁹ | 75.0% |
| 3 | 0.067 | 3.74 × 10⁻¹⁰ | 1.12 × 10⁻⁹ | 88.8% |
| 4 | 0.050 | 2.08 × 10⁻¹⁰ | 8.33 × 10⁻¹⁰ | 93.8% |
| 5 | 0.040 | 1.33 × 10⁻¹⁰ | 6.67 × 10⁻¹⁰ | 96.0% |
Disclaimer/Publisher’s Note: The statements, opinions and data contained in all publications are solely those of the individual author(s) and contributor(s) and not of MDPI and/or the editor(s). MDPI and/or the editor(s) disclaim responsibility for any injury to people or property resulting from any ideas, methods, instructions or products referred to in the content. |
© 2024 by the authors. Licensee MDPI, Basel, Switzerland. This article is an open access article distributed under the terms and conditions of the Creative Commons Attribution (CC BY) license (https://creativecommons.org/licenses/by/4.0/).
Share and Cite
Zeng, W.; Wang, W.; Wang, Q.; Li, M.; Zhang, L.; Tong, Y. Effect of Macro Fibers on the Permeability and Crack Surface Topography of Layered Fiber Reinforced Concrete. Materials 2024, 17, 1733. https://doi.org/10.3390/ma17081733
Zeng W, Wang W, Wang Q, Li M, Zhang L, Tong Y. Effect of Macro Fibers on the Permeability and Crack Surface Topography of Layered Fiber Reinforced Concrete. Materials. 2024; 17(8):1733. https://doi.org/10.3390/ma17081733
Chicago/Turabian StyleZeng, Wei, Weiqi Wang, Qiannan Wang, Mengya Li, Lining Zhang, and Yunyun Tong. 2024. "Effect of Macro Fibers on the Permeability and Crack Surface Topography of Layered Fiber Reinforced Concrete" Materials 17, no. 8: 1733. https://doi.org/10.3390/ma17081733
APA StyleZeng, W., Wang, W., Wang, Q., Li, M., Zhang, L., & Tong, Y. (2024). Effect of Macro Fibers on the Permeability and Crack Surface Topography of Layered Fiber Reinforced Concrete. Materials, 17(8), 1733. https://doi.org/10.3390/ma17081733